Embed Size (px)
Citation preview

Sabine Homann Kee-Tui, Julio Onofre Rainde, Andre van Rooyen, Michael Hauser, Shepard Siziba,
Daniel Rodriguez, Feliciano Mazuze
RUFORUM 4th Biennial Conference 19-24 July 2014,
Maputo
Towards resilient and profitable family farming systems in Central Mozambique
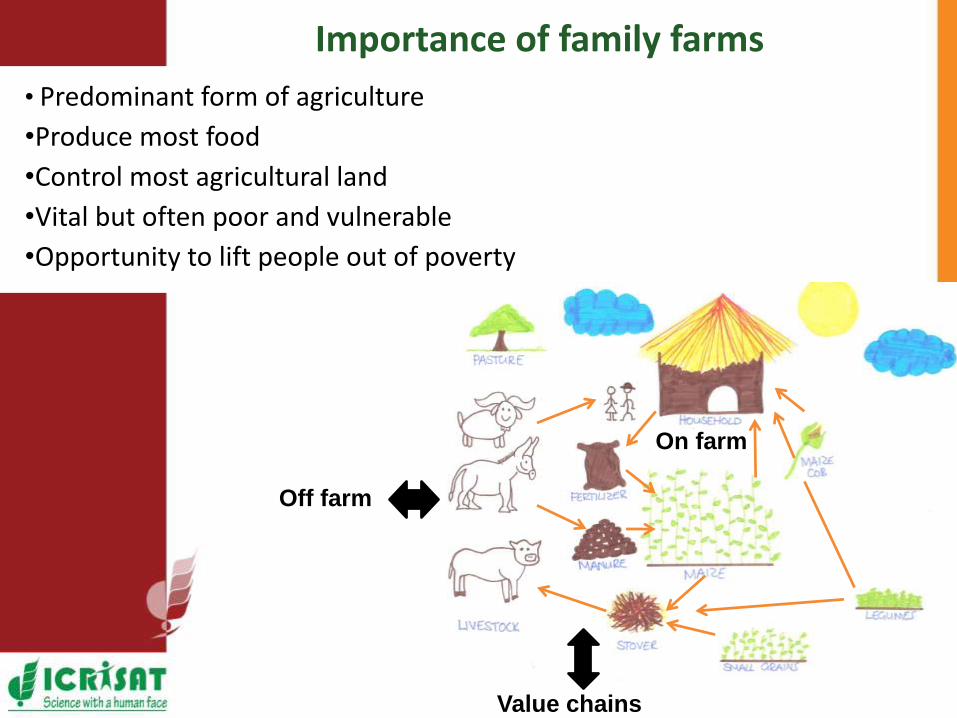
• Predominant form of agriculture
•Produce most food
•Control most agricultural land
•Vital but often poor and vulnerable
•Opportunity to lift people out of poverty
Importance of family farms
Value chains
On farm
Off farm

Family farms as complex systems (Ostrom, 2009)
• Dynamic, adaptive, non-linear
• Social, economic, technical, ecological… dimensions
• External factors can cause change, and change can happen from within
Resilience as ability of a ‘socio-ecological systems’ to adapt (Folke et al 2004 )
• Reduce vulnerability to shocks and recover from shocks
• React to change and make use of opportunities
• Proactively create options and opportunities
Profitability for immediate livelihood benefits (Orr and Mausch, 2014)
• = surplus over costs
• Cash income, with markets as drivers for economic and social change
Win - win: resilience and profitability
Cup and ball model
Van Rooyen, 2013
Basic hypotheses
Research and development programs will be more effective in supporting transformative change through the use of approaches that
(i) promote resilience and profitability within a particular farming context, and
(ii) better understand the types of family farms, their aspirations and resource limitations.

Research methods
Participatory community visioning
Visualize current and desirable states of
agricultural systems
Iterative process of solutions & adjustments
Par
tici
pat
ory
Target and test preferable options
Define barriers and options

Research methods
Male
Tree Diagram for 228 Cases
Ward`s method
Euclidean distances
52
4.0
00
00
0
47
3.0
00
00
0
58
7.0
00
00
0
69
4.0
00
00
0
46
7.0
00
00
0
37
0.0
00
00
0
50
7.0
00
00
0
49
7.0
00
00
0
61
7.0
00
00
0
36
5.0
00
00
0
66
0.0
00
00
0
67
9.0
00
00
0
35
8.0
00
00
0
55
1.0
00
00
0
42
0.0
00
00
0
0
10
20
30
40
50
60
70
Lin
ka
ge
Dis
tan
ce
Age
Distance to the market
Land
Maize production
#Shoats
PCA to identify
redundant variables
Clustering of
households
Description of
functional typologies
Data clean up and
selection of variablesD
eskto
p
Expert
knowledgeMultivariate
statistics
Expert
knowledge
Participatory community visioning
Visualizing current and desirable states of
agricultural systems
Iterative process of solutions & adjustments
Par
tici
pat
ory
Household survey
Targeting and testing preferable
options
Defining barriers and options

(Source: CIMMYT)
Marara district
High potential for market
oriented livestock
production
Manica district
High potential for crop
livestock integration and
intensification
Farming systems in Central Mozambique
Marara district
Manica district

Site 1. High risk environment in Marara, Tete

Community visions and market opportunities
Market oriented livestock production
Vulnerable state
Resilient and profitable state
→ Weak social capital (internal/external)
→ Lack of land ownership
→ Lack of knowledge on crop livestock technologies
IP
Barriers + solutions

Household types(n=189)
Resource poor
Share of population (%) 12
Female HHH (%)Age of HHH (yrs)Education (yrs)Information indexOff-farm income (%)
88
54
0.5
10
35
Herd size (TLU)Cultivated land(ha)Herd offtake (ct, go,%)
1.91.41
CL integrationDiversified productionCash income (U$S/yr)
++
94
How feasible is it for farmers in Marara to step up?

Household types(n=189)
Resource poor Stepping up
Share of population (%) 12 41
Female HHH (%)Age of HHH (yrs)Education (yrs)Information indexOff-farm income (%)
88
54
0.5
10
35
8
35
5.4
14
66
Herd size (TLU)Cultivated land(ha)Herd offtake (ct, go,%)
1.91.41
1.22.3
10 /12
CL integrationDiversified productionCash income (U$S/yr)
++
94
++
338
How feasible is it for farmers in Marara to step up?

Household types(n=189)
Resource poor Stepping up Intensifying CL
Share of population (%) 12 41 47
Female HHH (%)Age of HHH (yrs)Education (yrs)Information indexOff-farm income (%)
88
54
0.5
10
35
8
35
5.4
14
66
12
56
3.1
17
44
Herd size (TLU)Cultivated land(ha)Herd offtake (ct, go,%)
1.91.41
1.22.3
10 /12
8.23.3
9 /16
CL integrationDiversified productionCash income (U$S/yr)
++
94
++
338
++++
475
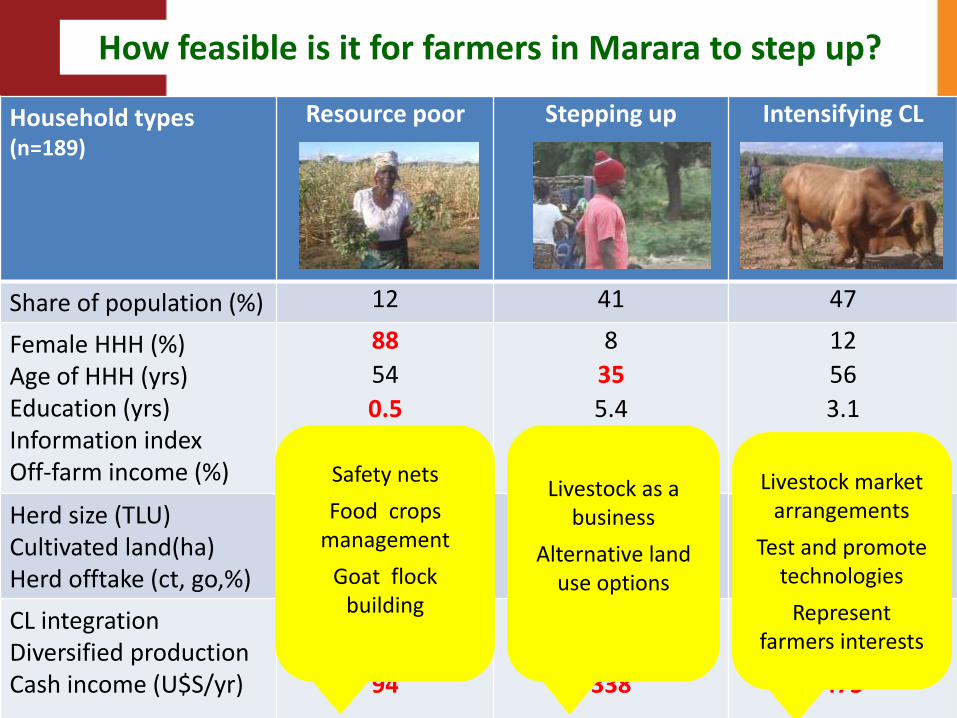
How feasible is it for farmers in Marara to step up?
Household types(n=189)
Resource poor Stepping up Intensifying CL
Share of population (%) 12 41 47
Female HHH (%)Age of HHH (yrs)Education (yrs)Information indexOff-farm income (%)
88
54
0.5
10
35
8
35
5.4
14
66
12
56
3.1
17
44
Herd size (TLU)Cultivated land(ha)Herd offtake (ct, go,%)
1.91.41
1.22.3
10 /12
8.23.3
9 /16
CL integrationDiversified productionCash income (U$S/yr)
++
94
++
338
++++
475
How feasible is it for farmers in Marara to step up?
Safety nets
Food crops management
Goat flock building
Livestock as a business
Alternative land use options
Livestock market arrangements
Test and promote technologies
Represent farmers interests

Site 2. High agricultural potential in Manica, Manica
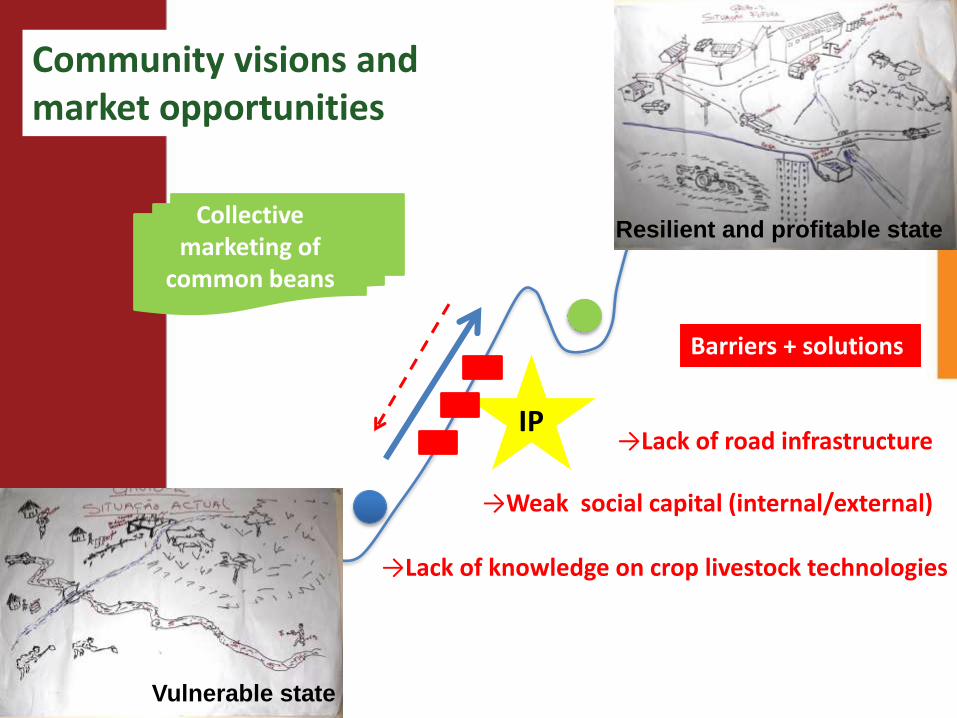
Community visions and market opportunities
Collective marketing of
common beans
Vulnerable state
Resilient and profitable state
→Lack of road infrastructureIP
→Weak social capital (internal/external)
→Lack of knowledge on crop livestock technologies
Barriers + solutions

How feasible is it for farmers in Manica to step up?Household types (n=193)
Resource poor
Share population (%) 35
Age of HHH (yrs)
Education (yrs)
Information index
Off-farm income (%)
38
5
9
37
Herd size (TLU)
Cultivated land (ha)
Herd offtake (ct, go, %)
Sales of beans (%)
0.3
2.2
0, 13
17
Diversified production
CL integration
Cash income (U$S/yr)
+
+
288
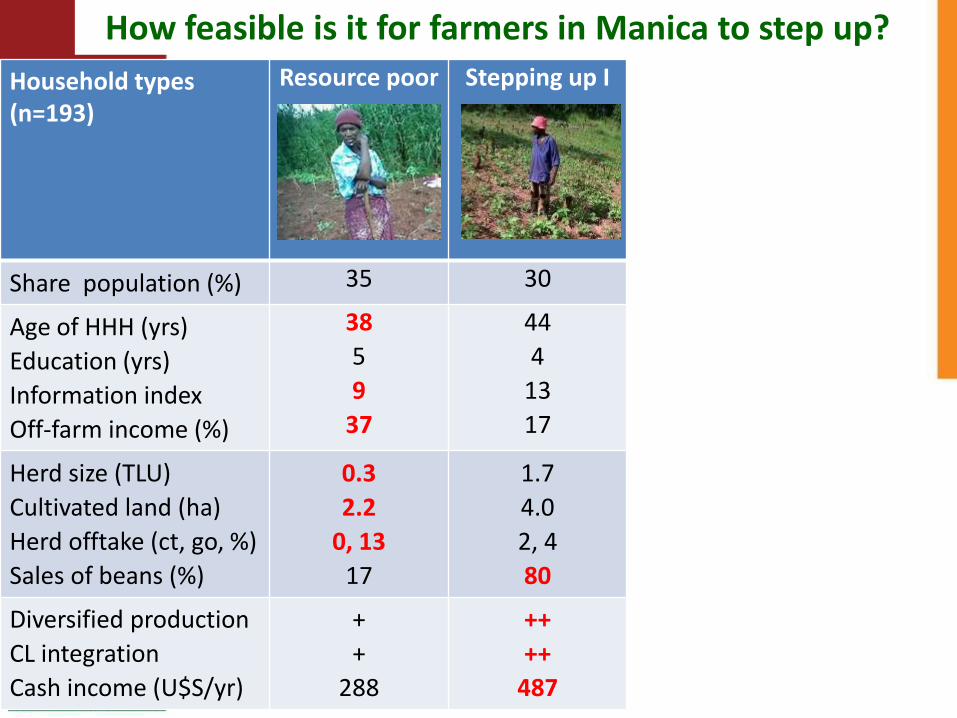
How feasible is it for farmers in Manica to step up?
Household types (n=193)
Resource poor Stepping up I
Share population (%) 35 30
Age of HHH (yrs)
Education (yrs)
Information index
Off-farm income (%)
38
5
9
37
44
4
13
17
Herd size (TLU)
Cultivated land (ha)
Herd offtake (ct, go, %)
Sales of beans (%)
0.3
2.2
0, 13
17
1.7
4.0
2, 4
80
Diversified production
CL integration
Cash income (U$S/yr)
+
+
288
++
++
487

How feasible is it for farmers in Manica to step up?
Household types (n=193)
Resource poor Stepping up I Stepping up II
Share population (%) 35 30 25
Age of HHH (yrs)
Education (yrs)
Information index
Off-farm income (%)
38
5
9
37
44
4
13
17
54
4
27
22
Herd size (TLU)
Cultivated land (ha)
Herd offtake (ct, go, %)
Sales of beans (%)
0.3
2.2
0, 13
17
1.7
4.0
2, 4
80
3.3
4.0
2, 7
31
Diversified production
CL integration
Cash income (U$S/yr)
+
+
288
++
++
487
++
++
477
How feasible is it for farmers in Manica to step up?
Household types (n=193)
Resource poor Stepping up I Stepping up II Intensif. CL
Share population (%) 35 30 25 10
Age of HHH (yrs)
Education (yrs)
Information index
Off-farm income (%)
38
5
9
37
44
4
13
17
54
4
27
22
51
6
39
8
Herd size (TLU)
Cultivated land (ha)
Herd offtake (ct, go, %)
Sales of beans (%)
0.3
2.2
0, 13
17
1.7
4.0
2, 4
80
3.3
4.0
2, 7
31
7.0
6.4
17, 1
73
Diversified production
CL integration
Cash income (U$S/yr)
+
+
288
++
++
487
++
++
477
+++
+++
1279
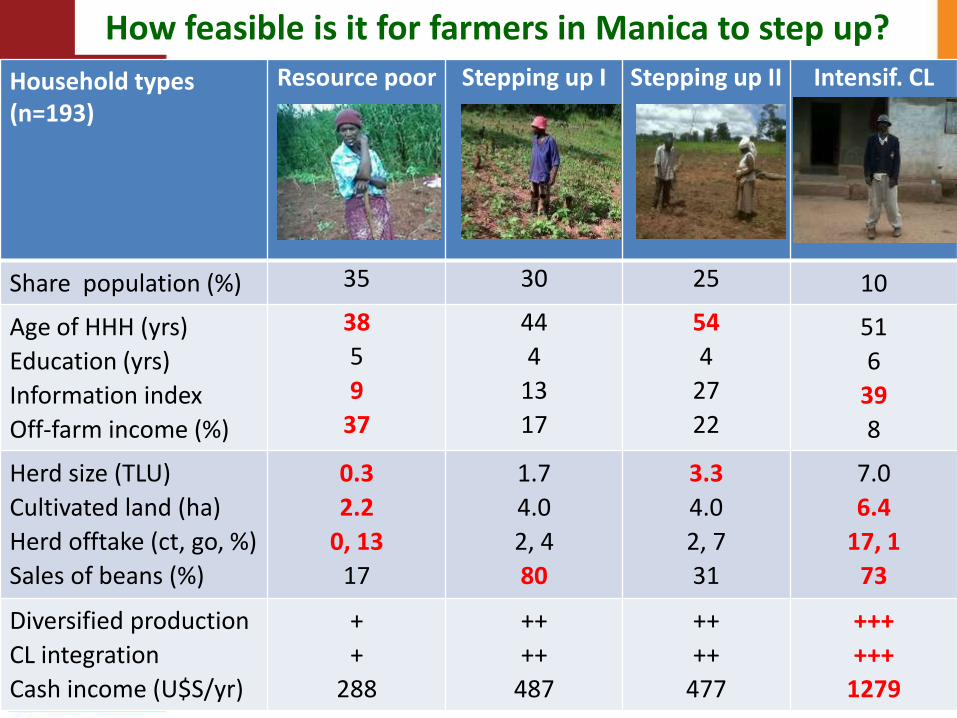
Partnerships with private
sector
Cattle as a business
Production + marketing
support for common
beans
Common beans as a
business
Cattle herd building
CL integration
Learn about common
beans

Stepping back
• Use practical experience and better understanding on
supporting complex systems to inform conceptual thinking.
• Combining resilience and profitability forces us to think about
long term and short term solutions - harness local opportunities.
• Working at on- and off-farm scales, e.g. through an IP, helps us
to create conditions under which on-farm solutions can work
– incl. infrastructure, (re-) organization, behavior change.
• Engaging in the process we must (re-) define interventions,
tailored to farmers particular circumstances and capacities.

“We farmers are now engaged in a common
vision. We have a voice to express our needs,
to partners who bring knowledge to us”.
Thank you for your attention!