Embed Size (px)
Citation preview
Ministry of Land, Infrastructure, Transport and Tourism
Experiences and Strategy of Infrastructure Development in Japan
February 29, 2016
Toshio OKAZUMI
Director of International Cooperation and Infrastructure Engineering,
Overseas Projects Division, Policy Bureau,
Ministry of Land, Infrastructure, Transport and Tourism- JAPAN

Ministry of Land, Infrastructure, Transport and Tourism
Contents
1
1. Quality Infrastructure – its high quality effect as
a stock of social assets –
2. Japanese Destiny and Present Problems we are
facing
3. Our Challenges and Strategy
Ministry of Land, Infrastructure, Transport and Tourism
2
1. Quality Infrastructure – its high quality effect as
a stock of social assets –
Ministry of Land, Infrastructure, Transport and Tourism
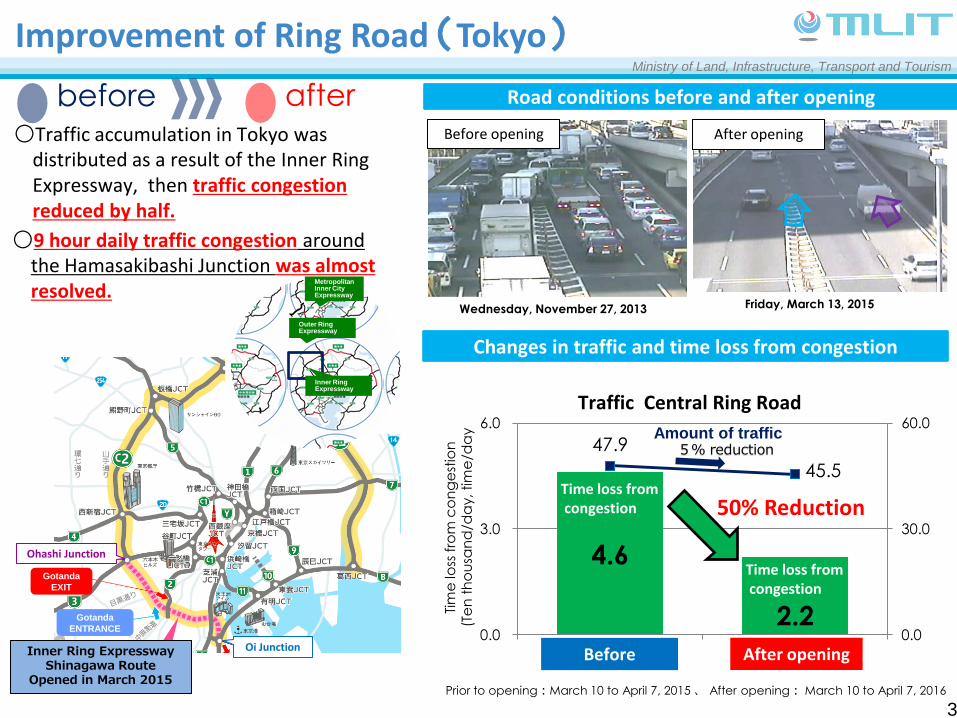
Improvement of Ring Road (Tokyo)
Wednesday, November 27, 2013 Friday, March 13, 2015
After opening Before opening
Road conditions before and after opening
Inner Ring Expressway Shinagawa Route
Opened in March 2015
Changes in traffic and time loss from congestion
4.6
2.2
47.9
45.5
0.0
30.0
60.0
0.0
3.0
6.0
開通前 開通後
Traffic Central Ring Road
Time loss from congestion
Amount of traffic
Time loss from congestion
Prior to opening:March 10 to April 7, 2015 、 After opening: March 10 to April 7, 2016
Before opening
After opening
5% reduction
50% Reduction
Shinagawa Route,
○9 hour daily traffic congestion around the Hamasakibashi Junction was almost resolved.
before after ○Traffic accumulation in Tokyo was
distributed as a result of the Inner Ring Expressway, then traffic congestion reduced by half.
Tim
e lo
ss f
rom
co
ng
est
ion
(T
en
th
ou
san
d/d
ay, tim
e/d
ay
Metropolitan Inner City Expressway
Outer Ring Expressway
Ohashi Junction
Gotanda
EXIT
Gotanda
ENTRANCE
Oi Junction
Inner Ring Expressway
3

Ministry of Land, Infrastructure, Transport and Tourism
0
10
20
30
H14 H15 H16 H17 H18 H19 H20 H21 H22 H23 H24 H25
産業指定地内の企業立地の件数件
首都圏外郭放水路
部分通水
首都圏外郭放水路
完全通水30
20
10
0
件数(件)
H14 H16 H18 H20 H22 H24
企業立地件数※2
2002 2004 2006 2008 2010 2012
Nu
mb
er
of
Bu
sin
ess
Lo
cati
on
s
○ Reduction of inundated buildings from flood by the effect of the Metropolitan Outer Underground Channel
→Approximately 7,000 buildings (from 1975 to 1984) →Approximately 50 buildings (from 2005 to 2014)
○Kasukabe City could be designated as an “Industrial Designated Area” in 2003, thanks to this Underground Channel.
○28 businesses (warehouses, shopping centers) were newly located in this area thanks to the Channel
Metropolitan Outer Underground Channel (Saitama)
首都圏外郭放水路
春日部市
before
after
Newly located businesses(warehouses, shopping centers)
Industrial Designated Area
Kasukabe City
Route16
Route 16
Channel 18
Outer
Discharge
Channel
S
haft
Channel 18 Nakagawa
Nakagawa
Sh
aft
Kasukabe City
New Business in the Industrial Designated
Partial functioned
Channel Complete
4

Ministry of Land, Infrastructure, Transport and Tourism
Use of Sewage Heat in Makuhari (Chiba Prefecture)
before after
Heat Pump
(Heat Source Equipment)
Air Temperature
0℃ Use as
a heater
When using outside air
as a heat source
Heater
47℃
+47℃ Amount of Energy
Consumption
Release
-5℃ Room Temperature
40℃
High Power
Heat Pump
(Heat Source Equipment)
Use as
a Heater
When using sewage
as a heat source
Sewage
20℃ Heater
47℃
+27℃ Amount of Energy
Consumption
Release
15℃ Room Temperature
40℃
Low Power
(58,000m3/日)
Kaihinmakuhari Station
Makuhari Shintoshin
Makuhari Shintoshin
Hanamikawa Terminal
Treatment Plant
Water intake for thermal usage
Discharged as is
Hanamikawa Terminal
Treatment Plant
Kaihinmakuhari Station
○In Makuhari Shintoshin Area of Chiba Prefecture, sewage water discharged from the treatment plant is introduced to the area’s cooling and heating. It is used as a cooler, heater, and hot water supply at 14 buildings.
○Use of sewage heat reduces CO2 as well as lowers economic costs by approximately 100 million yen annually
Use of Sewage Heat
1 2
8 8
11 14
0
5
10
15
0
20
40
60
80
100
H2 H7 H12 H17 H22 H27
下水熱利用量
下水熱利用箇所数
Se
wa
ge
He
at
Use
(Ca
lcu
late
d b
y e
ve
ry
10
,00
0 h
ou
seh
old
s)
1990 1995 2000 2005 2010 2015
Amount of used sewage
Number of sewage use locations
5

Ministry of Land, Infrastructure, Transport and Tourism
6
2. Japanese Destiny and Present Problems we are
facing
Ministry of Land, Infrastructure, Transport and Tourism
7
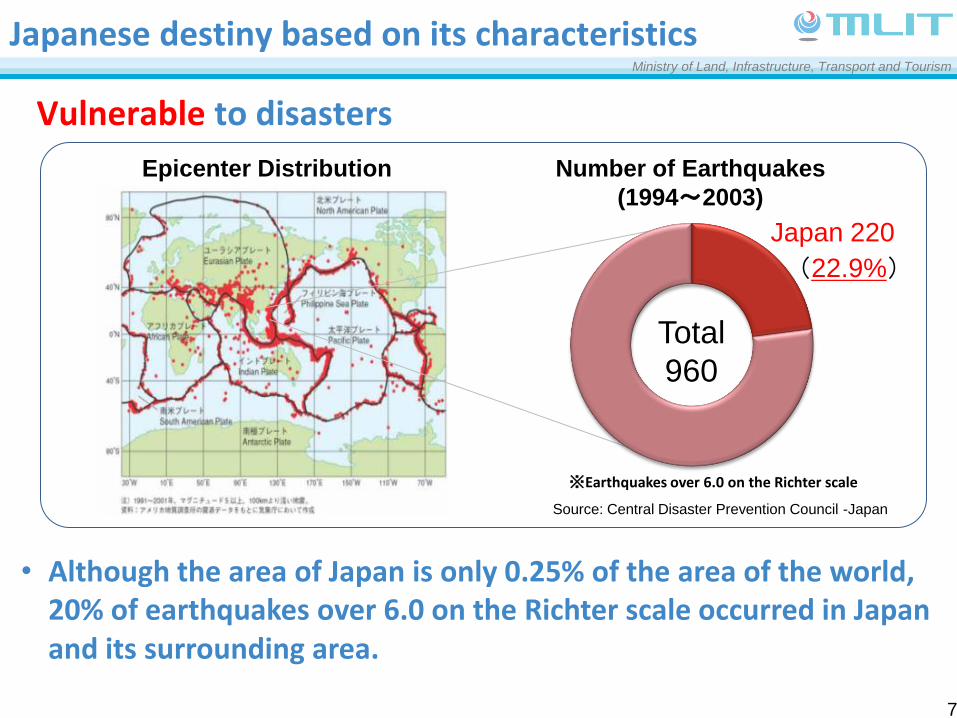
Japanese destiny based on its characteristics
• Although the area of Japan is only 0.25% of the area of the world, 20% of earthquakes over 6.0 on the Richter scale occurred in Japan and its surrounding area.
Vulnerable to disasters
Japan 220
Number of Earthquakes
(1994~2003)
Total
960
Source: Central Disaster Prevention Council -Japan
(22.9%)
Epicenter Distribution
※Earthquakes over 6.0 on the Richter scale

Ministry of Land, Infrastructure, Transport and Tourism
8
【Tokyo】
【Paris】
【New York】
【London】
Japanese destiny based on its characteristics
8
Vulnerable to disasters
• The elevation of cities in Japan is lower than the flood water level of rivers. • There are many steep rivers in Japan compared with rivers in foreign
countries.
River flood water surface elevation in London, Paris and New York
River flood water surface elevations in Tokyo
River slopes in Japan and foreign countries Source: MLIT
Rhine
Rivers in Japan
Seine
Loire
Colorado
Mekong
Distance (km)
Elev
atio
n
(m)
出典:「水害の世紀―日本列島で何が起こっているのか」森野美徳 監修

Country area
(10,000㎢)
Habitable land area
(10,000㎢)
Ratio
(%)
Japan 37.86 10.35 27.3
U.K. 24.38 20.63 84.6
France 54.79 39.72 72.5
Germany 35.67 23.79 66.7
Japan
U.K.
Germany
France
Habitable land area
Japanese destiny based on its characteristics
9
Limited habitable land
• The ratio of habitable land area to country area in Japan is lower than in foreign countries.
Legend Habitable area in white

Japanese destiny based on its characteristics
10
Infrastructure development under severe conditions
• Infrastructure in Japan has been developed against severe natural disasters under vulnerable condition.
Piers of HANSHIN Expressway in Japan Piers of access road to Charles-de-Gaulle Airport in France

Inundation disaster caused by the heavy rain on Sep 10 (2015) in Jyoso city
Jyoso city
Sep 2015 2006
:KINU river
basin
Recent Disasters
11

石巻市
南三陸町
東松島市
七ヶ浜町
仙台市
多賀城市
名取市
亘理町
山元町
岩沼市
南相馬市
新地町
相馬市
陸前高田市
気仙沼市
釜石市
大槌町
山田町
気仙沼市
陸前高田市
Maximum area inundated
※1: Aug 4 ,2011 press release by City Bureau
※2: Produced from “Damage Situation and Police
Countermeasures associated with 2011 Tohoku district - off the
Pacific Ocean Earthquake” by National Police Agency (As of
Feb. 14, 2012)
535km2 of land was inundated
Approx. 10% (119km2) was urban area
Approx. 129,000 buildings were destroyed
15,850 Fatalities, 3,282 missing
Recent Disasters
Great East Japan Earthquake and Tsunami in 2011
Produced from “Inundation Condition Map” by
Geospatial Information Authority
12

Recent Disasters
• Great Hanshin-Awaji Earthquake, January, 1995
13
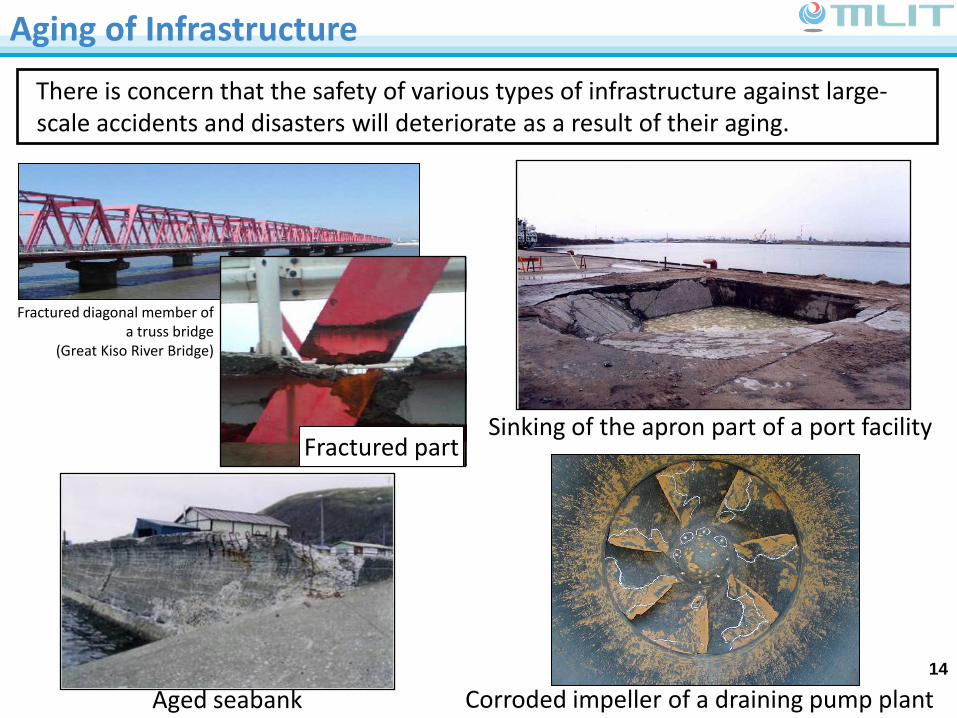
There is concern that the safety of various types of infrastructure against large-scale accidents and disasters will deteriorate as a result of their aging.
Corroded impeller of a draining pump plant Aged seabank
破断箇所 補修後
平成19年6月20日破断を発見 平成19年6月29日補修完了
Fractured diagonal member of a truss bridge
(Great Kiso River Bridge)
Sinking of the apron part of a port facility
Aging of Infrastructure
Fractured part
14
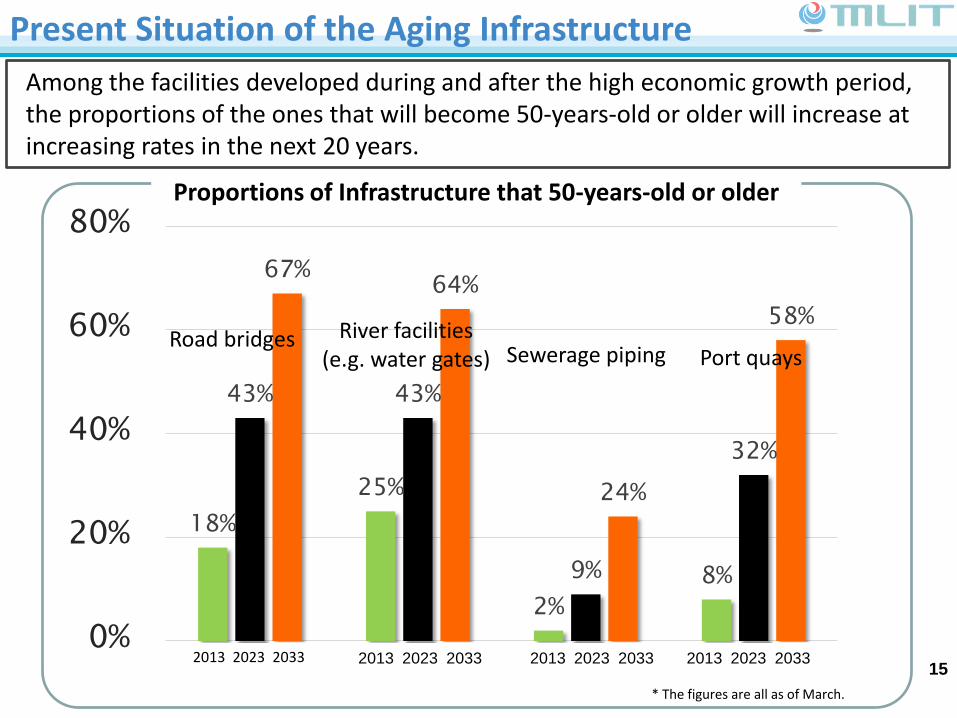
18%
25%
2%
8%
43% 43%
9%
32%
67% 64%
24%
58%
0%
20%
40%
60%
80%
2013 2023 2033 2013 2023 2033 2013 2023 2033
Road bridges River facilities (e.g. water gates) Sewerage piping Port quays
Among the facilities developed during and after the high economic growth period, the proportions of the ones that will become 50-years-old or older will increase at increasing rates in the next 20 years.
Present Situation of the Aging Infrastructure
2013 2023 2033
* The figures are all as of March.
Proportions of Infrastructure that 50-years-old or older
15

16
3. Our Challenges and Strategy

Challenges for “smart use of infrastructure”
• Under these limited conditions, Japan proactively has been selecting
“smart use of infrastructure” instead of “expanding it”.
出典 オンタリオ州政府
http://www.mto.gov.on.ca/english
/transtek/roadtalk/rt16-4/
17
Limitation of infrastructure development
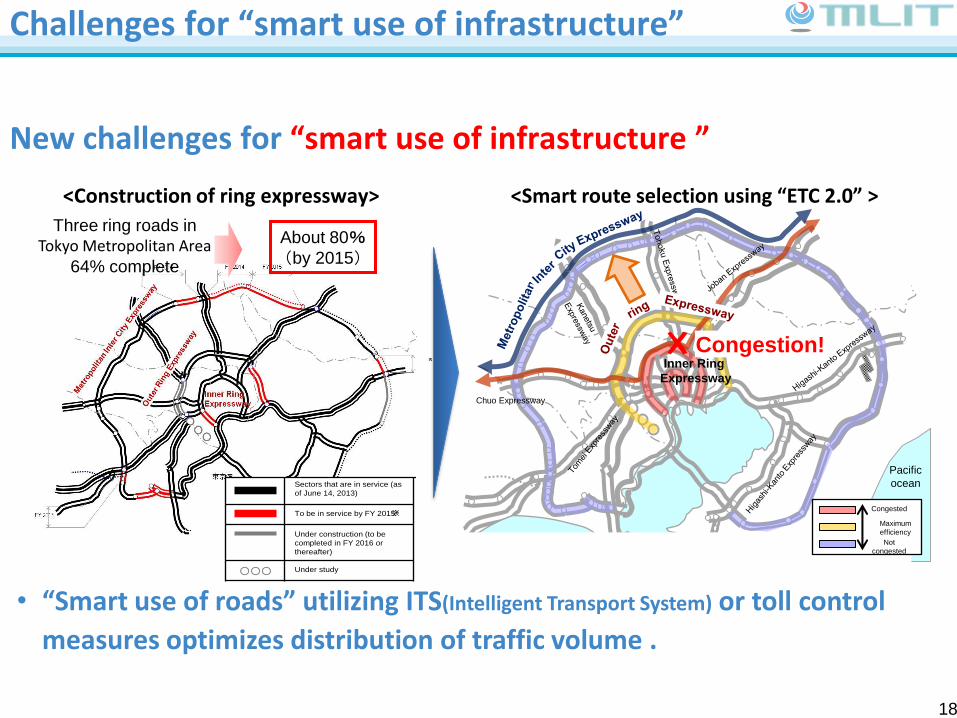
Challenges for “smart use of infrastructure”
18
<Smart route selection using “ETC 2.0” >
相模湾
Pacific
ocean
Maximum
efficiency
Congested
Not
congested
About 80%
(by 2015)
<Construction of ring expressway>
Three ring roads in Tokyo Metropolitan Area
64% complete
Chuo Expressway
Inner Ring
Expressway
Congestion!
22
Legend
Sectors that are in service (as
of June 14, 2013) Provisional 2
lanes*
To be in service by FY 2015* 4 lanes
Under construction (to be
completed in FY 2016 or
thereafter)
6 lanes
○○○ Under study
※
※
* It is not known when non-completed
lanes of provisional 2 lanes will be
constructed.
New challenges for “smart use of infrastructure ”
• “Smart use of roads” utilizing ITS(Intelligent Transport System) or toll control
measures optimizes distribution of traffic volume .

Challenges for “smart use of infrastructure”
19
• Congestion at toll gates on expressways throughout Japan is largely
eliminated
Successful examples of “smart use of infrastructure ”: “ETC” (Electronic toll collection system)
2000
(before ETC)
2008
(after ETC)
3,974 times (30% of congestion on
expressway)
60 times
< Congestion at toll gates >
Congestion is eliminated
※ETCは2001年に 本格導入
※渋滞回数: 年間渋滞回数が30回以上又は平均渋滞長が2km以上かつ渋滞回数が5回以上の主要渋滞ポイントの渋滞回数
0.0%
10.0%
20.0%
30.0%
40.0%
50.0%
60.0%
70.0%
80.0%
90.0%
100.0%
20
02
20
03
20
04
20
05
20
06
20
07
20
08
20
09
20
10
20
11
20
12
20
13
20
14
<Adoption rate for ETC>
(On-board Device) Roadside antenna
Bidirectional wireless
communications

Challenges for “smart use of infrastructure”
20
• The “SHINKANSEN” realizes high safety, reliability and environmental
friendliness.
Safety
1
Reliability
2
Environmental
Friendliness
3
Passenger
Fatalities
①Operating frequency CO2
emissions
②Average delay time
per trip
15trains/hour
within 1 min.
– ZERO – 50Years
(1964→2014) 1 : 5 : 7.5 g-CO2/person-km
Successful examples of “smart use of infrastructure ”: High speed train “SHINKANSEN”

21
Reduction through preventive maintenance and of new technologies.
○ To prevent further acceleration of the deterioration of infrastructures due to their aging, MLIT has been intensively conducting inspections, diagnoses, etc.
○ MLIT is aiming at establishing a preventive maintenance-based maintenance cycle to reduce and level the maintenance cost.
Image of the maintenance cost reduction and leveling to be achieved
Image of the envisaged maintenance cycle
Diagnosis
Recording
Lifespan Prolongation Plan
Reflection Improvement
Measures Inspection
Establishing a Maintenance Cycle
Leveling through planned efforts

Dejima Bridge (Nagasaki City) [1910 (105 years)]
Establishing a Maintenance Cycle - success examples
No.10 Sluiceway (Kamiita Town, Tokushima Prefecture) [1922 (93 years)]
Rokugo Water Gate (Ota Ward, Tokyo) [1930 (85 years)]
22

Imp
rovi
ng
the
pro
du
ctiv
ity
and
qu
alit
y
Consensus is reached faster.
Decisions can be made faster
Reduce mistakes in the design and the extra time
Workability is improved
Data sharing between CIM and ICT-aided project on site
Sho
rte
nin
g th
e t
ime
to
co
mp
leti
on
Comparisons and evaluations can be made easily.
Reinforcement bar layout
simulation
Selection of the optimal route
Confirmation of a complex order
of work steps
Meeting for explaining the project
to local residents
Meeting between the project
owner and contractor
Machine control
Design changes can be made easily
Re
sear
ch
De
sign
W
ork
im
ple
me
nta
tio
n
Mai
nte
nan
ce
wo
rk
センサー情報
モデル化素材
議論情報
etc
情報共有ツール
センサーデータヘルスモニタリング
異常値を感知すると、メンバーへの通知(アラート)が可能
Image of an information-sharing tool for maintenance work
Establishment and operation of an asset management system
Optimization of maintenance work
Evacuation route
Inclination
of slope
3-dimensional model (simplified)
3-dimensional model
(detailed)
Safety of the project site
3-dimensional model
3-dimensional model
3-dimensional model
One of the most advanced construction production systems in the world ⇒ Creation of a new industry
Introducing Construction Information Modeling (CIM)
The tool’s settings can be set so that an alarm
message will be sent to the members when an
abnormal value is detected.
Data for modeling
Discussion information
Sensor information
Monitor for the
operator
The record of the work
performed and the status of
the work being performed
are displayed.
Sensor data
Health monitoring
Information sharing tool
23
Ministry of Land, Infrastructure, Transport and Tourism
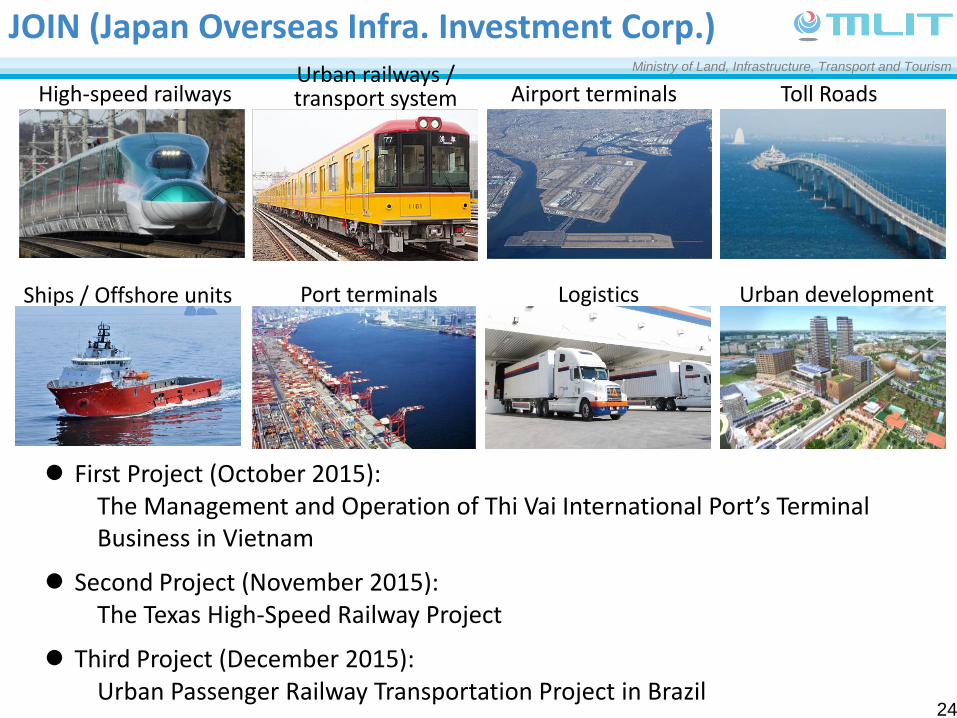
Logistics
High-speed railways Urban railways / transport system Toll Roads
Ships / Offshore units Port terminals
Airport terminals
Urban development
First Project (October 2015): The Management and Operation of Thi Vai International Port’s Terminal Business in Vietnam
Second Project (November 2015): The Texas High-Speed Railway Project
Third Project (December 2015): Urban Passenger Railway Transportation Project in Brazil
JOIN (Japan Overseas Infra. Investment Corp.)
24

Our Challenges and Strategy
1. “Revolution in Construction” to be realized (strategic
management, long-term plan, prioritizing effective stock effect, i-Construction)
2. Introduction and utilization of various funds (national, local,
PPP/PFI, charge, fare, JOIN, etc.)
3. Preventive and Strategic Maintenance (maintenance cycle,
maintenance industry, introducing robot in the fields, etc.)
4. Japanese Contribution for international fields (quality
infrastructure, technology transfer, capacity building, PPP, etc.)
Important strategy for future Infrastructure
A) Economic and Effective use of infrastructure and Preventive and Strategic Maintenance
B) Investment of Infrastructure Development must be recognized as basic needs for development
25
Ministry of Land, Infrastructure, Transport and Tourism
Thank you for your attention
26

![tokio.mfa.gov.hu³_omote.pdf · Toshio Hosokawa: Sen VI : Péter Eötvös: Secret Kiss [International Co-commissioned work/Japan Premiere] Noh performance: Ryoko Aoki [Harakiri/Secret](https://img.dokumen.tips/doc/110x75/610dafdeaf65fe1afd666c59/tokiomfagovhu-omotepdf-toshio-hosokawa-sen-vi-pter-etvs-secret.jpg)