Embed Size (px)
Citation preview

Energy systems & power systems modelling Comparing Experiences in Ireland and Japan
Brian Ó Gallachóir, Ryoichi Komiyama, Paul Deane, Alessandro Chiodi, Maurizio Gargiulo, Tatsuhiko Sugiyama, Takashi Otsuki, Yasumasa Fujii
IEA ETSAP Workshop Copenhagen Nov 17 – 18 2014

Overview
1. Context
2. Energy systems - power systems modelling Japan
3. Energy systems - power systems modelling Ireland
4. Results – Japan
5. Results – Ireland
6. Next Steps

Context - current
Japan
Population 127m
GDP PPP €3993bn €31k
Electricity Consumption
988 TWh 7.8 MWh
Peak Demand (GW)
200 GW
CO2 Emissions
1223 Mt 9.6t
Installed Capacity*
288 GW
Total Fossil Fuels
185 GW
Hydro 22 GW
Wind 2.5 GW 14 GW
Ireland
Population 4.5m
GDP PPP €165bn €36k
Electricity Consumption
26 TWh 5.6 MWh
Peak Demand
5.1 GW
CO2 Emissions
35 Mt 7.6t
Installed Capacity*
9 GW
Total Fossil Fuels
7 GW
Hydro 0.2 GW
Wind 2 GW
Value in italics are per person

Context - Future
Ireland
• 40% RES-E by 2020!
• 10% EVs by 2020
Electrification of transport
• -20% non-ETS GHG by 2020
Electrification of heat
• Low Carbon Energy by 2050
Decarbonise electricity
Japan
• >20% RES-E by 2030 !
(Before Fukushima)
• -30% CO2 by 2030
• Low Carbon Energy by 2030
Decarbonise electricity (Before Fukushima)
20% RE-E + 50% Nuclear

Energy & Renewable Policy in Japan
CO2 reduction target (before Fukushima): mitigate by 30% by 2030 from the 1990 level. Nuclear policy: uncertain after Fukushima due to public acceptance, though its fraction in power mix was discussed from 0% to 35% at 2030 in Atomic Energy Commission, Japan. Renewable policy: • Renewable is regarded as one of important alternative sources after Fukushima. • The government raised up the ratio of renewable to more than 20% by 2030 in the
latest energy policy. (PV: 53 GW~, wind: 10 GW~)
(Source) Compiled from Ministry of Economy,
Trade and Industry (METI)
• Japanese government begin with implementing FIT in July 2012, and PV, in particular, has shown a rapid growth.
• As of July 2014, renewable capacities certified by FIT surpassed 70 GW (almost PV), more than 30% of Japanese total capacity.
• Particularly in Kyushu (southern part of Japan), the certified PV and wind capacities reach more than its peak demand (112%). The company currently suspends the integration of PV and wind.
Agenda: How much of variable renewable could be integrated into the Japanese power system ?
0
2
4
6
8
10
12
14
16
199619971998199920002001200220032004200520062007200820092010201120122013
PV
Wind
[GW]
PV and Wind Capacities in Japan
FIT started
in July 2012
Current Status of Renewable in Japan
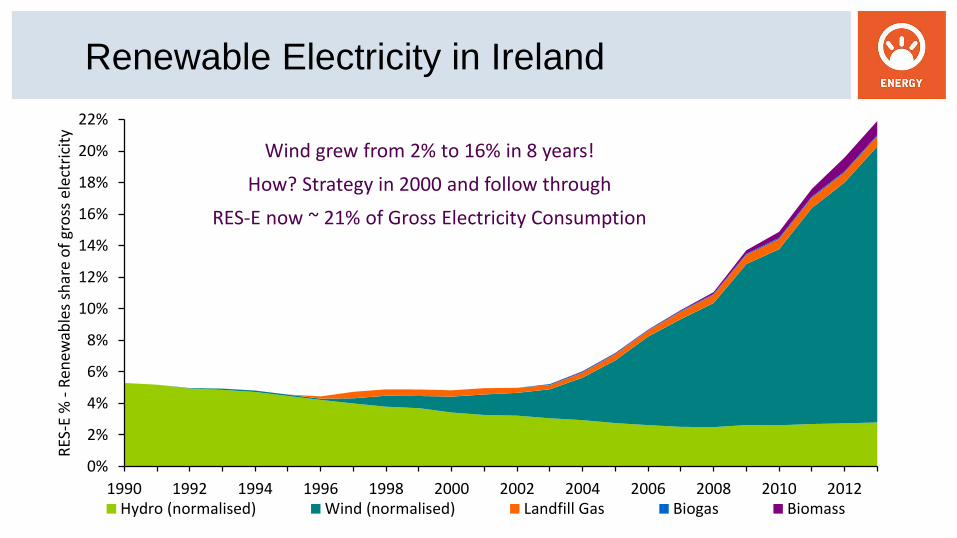
Renewable Electricity in Ireland
0%
2%
4%
6%
8%
10%
12%
14%
16%
18%
20%
22%
1990 1992 1994 1996 1998 2000 2002 2004 2006 2008 2010 2012
RES
-E %
- R
enew
able
s sh
are
of
gro
ss e
lect
rici
ty
Hydro (normalised) Wind (normalised) Landfill Gas Biogas Biomass
Wind grew from 2% to 16% in 8 years!
How? Strategy in 2000 and follow through
RES-E now ~ 21% of Gross Electricity Consumption

Modelling Tools Japan Optimal Power Generation Mix (OPGM) Model considering High Voltage Line Network in Japan
Geographical Resolution: whole region of Japan, 135 nodes, 166 transmission lines
Time Resolution: 10-min interval for 1 year (= 6 intervals/hour×24 hours/day×365 days = 52,560 time steps / year)
Power Flow Modelling: direct current method
Methodology: Linear programming (100 million constraints), single-period optimization
Power Line Network of OPGM model in Japan
Eastern Japan (50Hz) Western Japan (60Hz)
-30
-20
-10
0
10
20
30
40
50
60
70
80
Pow
er
Syste
m O
pera
tion [
GW
]
LossInter ChangeSuppressed PVSuppressed WindBattery2(out)Battery1(out)Pumped(ont)Battery2(in)Battery1(in)Pumped(in)PVWindOilLNG GCCLNG STCoalNuclearMarineBiomassGeothermalHydroLoad
-20
-10
0
10
20
30
40
50
60
70
Pow
er
Syste
m O
pera
tion [
GW
]
LossInter ChangeSuppressed PVSuppressed WindBattery2(out)Battery1(out)Pumped(ont)Battery2(in)Battery1(in)Pumped(in)PVWindOilLNG GCCLNG STCoalNuclearMarineBiomassGeothermalHydroLoad
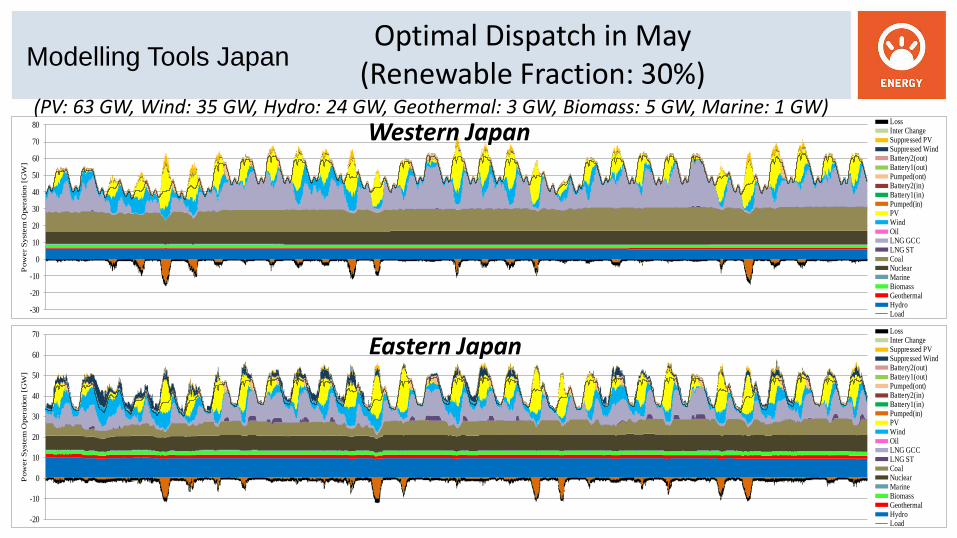
Optimal Dispatch in May (Renewable Fraction: 30%)
Western Japan
Eastern Japan
(PV: 63 GW, Wind: 35 GW, Hydro: 24 GW, Geothermal: 3 GW, Biomass: 5 GW, Marine: 1 GW)
Modelling Tools Japan

Modelling Tools Japan:
Global Energy Model (DNE21)
Global Energy Model (DNE21) • Cost minimization model (minimization of discounted total cost from 2000 to 2100) • Geographical Resolution: 54 regions (82 nodes) • Scale of Model: 24 million constraints, 16 million endogenous variables • Detailed consideration for Energy Transport: - Pipeline Transport, Tanker Transport, Power Transmission - Oil, Gas, Coal, Hydrogen, CO2, Methanol, Electricity
Energy System Modelling Regional Resolution & Energy Transportation Routes

Modelling Tools Ireland
Irish TIMES
• Energy systems model to 2060
• 12 timeslices in 5 – 10 year intervals
• Scenario analysis 2020, 2030 and 2050
PLEXOS_Ireland Power Systems Model
• Use TIMES results to build single year power systems model
• 15 minute, power plant detail, ramp rates, min load, cold start,
reserve modelling, market modelling
• Impacts of TIMES results on power system operation
• Use results to inform constraints in Irish TIMES

Soft-Linking Methodology

Results Japan: Linking OPGM Results to Global Energy Model (1)
By using OPGM model (single-regional version), numerical relationships between “PV/Wind fraction in annual power demand” and “PV/Wind power supplied to grid” are calculated.
This curves (RES Integration Curves) are mathematically formulated, and added to global energy model (DNE21, cost minimization model) as additional constraints.
RES Integration Curves (Additional constraints in DNE21)
Wind PV

Results Japan: Linking OPGM Results to Global Energy Model (2)
Power Generation Mix (World) Without RES integration curve With RES integration curve
Optimal Power Dispatch (Summer/Fair Weather/Japan) PV integration is reduced.

Results: Ireland (Annual Generation GWh)
Wind integration reduced.

Fuel Type Irish TIMES Model PLEXOS Model
Gas-CC 0.01 1.10
Gas-New 2.95 3.12
Gas- Turbine 0.00 0.01
Distillate 0.00 0.38
Coal 5.77 4.35
Peat 2.48 2.20
Waste 0.14 0.14
Total 11.35 11.29
Results: Ireland (Annual Emissions MT)

Comparing Approaches
Japan
OPGM Model:
• Cost Minimization Model • 10-min consideration of Wind & PV
RES Integration Curve
Global Energy Model (DNE21):
• Cost Minimization Model • Temporal Resolution: 4 hours
Detailed evaluation for wind & PV integration
More plausible evaluation of wind & PV integration in rough time-resolution model
Additional constraints in DNE21
Ireland
Irish TIMES:
• Energy Systems Model • Low Carbon Roadmap • 12 time slices
Irish TIMES:
• SNSP = 75% • Equiv 50% VRE
Extract 2020 or 2030 power system results More plausible power system results in Irish TIMES
PLEXOS_Ireland:
• Dispatch Model • 15 min – 1 hr temporal • power plant detail
Additional constraints in Irish TIMES

Planned Next Steps
Data Exchange between Ireland and Japan
- such as wind and PV outputs, power demand curves etc.
Build and compare energy models in both countries
- compare ETSAP-TIAM with DNE21 focusing on Japan
- build a PLEXOS model for Japan to compare with OPGM
- build an OPGM model for Ireland to compare with PLEXOS
Cross validation of simulated results
- such as power generation mix, storage, curtailment of wind
and PV etc.

Energy systems & power systems modelling Comparing Experiences in Ireland and Japan
IEA ETSAP Workshop Copenhagen Nov 17 – 18 2014
Brian Ó Gallachóir, Ryoichi Komiyama, Paul Deane, Alessandro Chiodi, Maurizio Gargiulo, Tatsuhiko Sugiyama, Takashi Otsuki, Yasumasa Fujii