Embed Size (px)
Citation preview

Social transfers against
malnutrition: what do we know
about their effectiveness?
Miguel Niño-Zarazúa
Significant poverty reduction since 1990s
0 20 40 60
Sub-Saharan Africa
Latin America and the Caribbean
Southern Asia
South-Eastern Asia
Western Asia
Oceania
Caucasus and Central Asia1990
2008
% of people living on less than $1.25 USD (2005 PPP)
• % of people living on less than $1.25 a day was halved between 1990 and 2010
• China alone was able to lift 630 million people out of poverty in 25 years
• The proportion of undernourished people has decreased from 23% in the 1990s to 15 per cent in 2010
2010

However, the development job is far from done
• Poverty stubbornly persist
– Still 1.2 million people live in extreme poverty
– Numbers of people going hungry remain disturbingly high— 1 in 8 worldwide, and 1 in 6 children under five are underweight
• Not only access, but access to good quality social services remain a challenge
– Functionally illiterate and innumerate children completing primary education
– Progress in child and maternal health care has been very slow
– 2.5 billion people still lack access to safe water and sanitation
The concern of malnutrition
• Malnutrition is the single biggest cause of the global burden of disease
• There are 180 million children worldwide who go hungry on a daily basis
• Every hour, 300 children under 5 die because of malnutrition
• One of the worst affected countries is India. Despite having a fast-growing economy, 40% of its children are malnourished

The heavy toll of child malnutrition
• Within regions and countries, stunting is far worse among the poor than among the non-poor
• Note: Stunting is measured here as the percentage of children less than –2 SD below the median height of children of the same age in the WHO reference population
60
47
38
34 33
39
27
9 12
16
0
10
20
30
40
50
60
70
South Asia (n=4) sub-Saharan Africa(n=26)
Latin America and theCaribbean (n=9)
Eastern Europe andCentral Asia (n=5)
Middle East and NorthAfrica (n=2)
Stunting among children under five
Lowest income quintile Highest income quintile
Source: Demographic and Health Surveys
Child malnutrition across regions
0
10
20
30
40
50
East Asia &Pacific
Latin America& Caribbean
Middle East &North Africa
South Asia Sub-SaharanAfrica
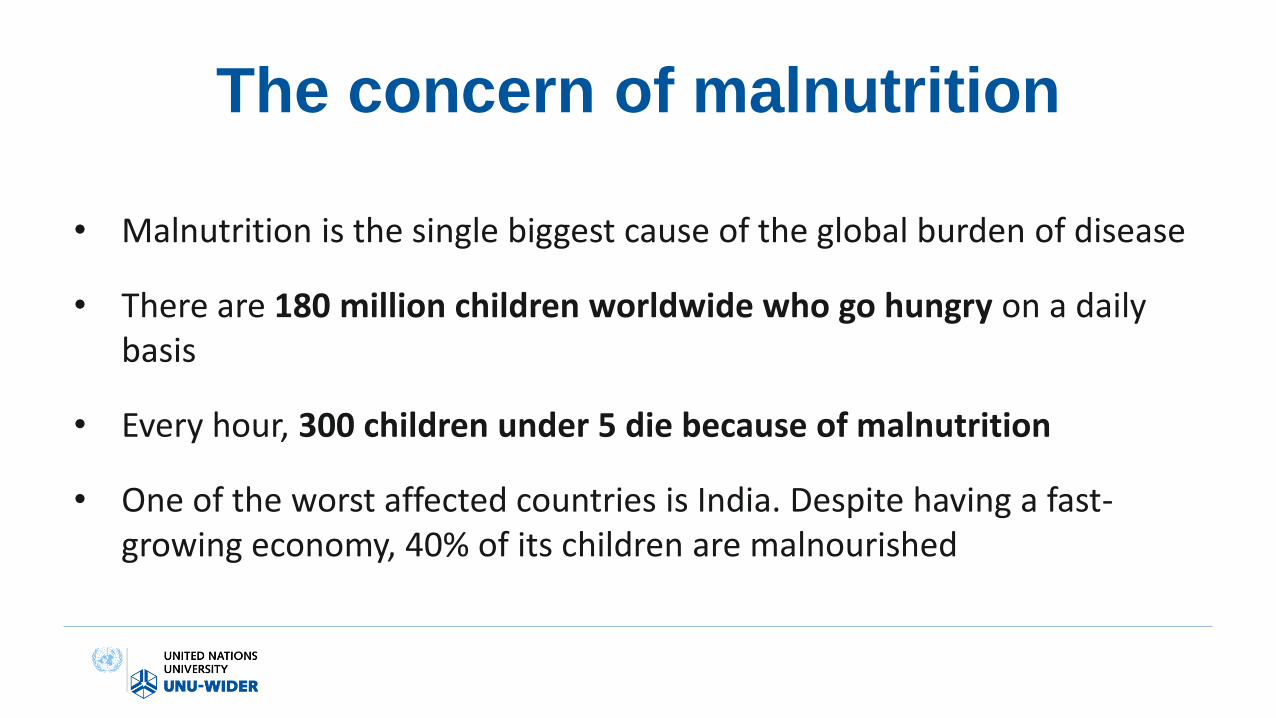
Prevalence of stunting Height for age (% of children under 5)
05
1015202530354045
East Asia &Pacific
Latin America& Caribbean
Middle East &North Africa
South Asia Sub-SaharanAfrica
Prevalence of wasting Weight for age (% of children under 5)
• Nearly 180 million children under the age of 5 (32%) are stunted (low height for age), and 55 million (10%) are wasted (low weight for height).
• Child malnutrition contribute to high mortality in developing countries
• It also has long-term impacts such as poor cognitive development and low productivity in adulthood
• Maternal and child malnutrition is the underlying cause of 3.5 million deaths annually
• Differences between stunting and wasting reflects a growing problem: child obesity
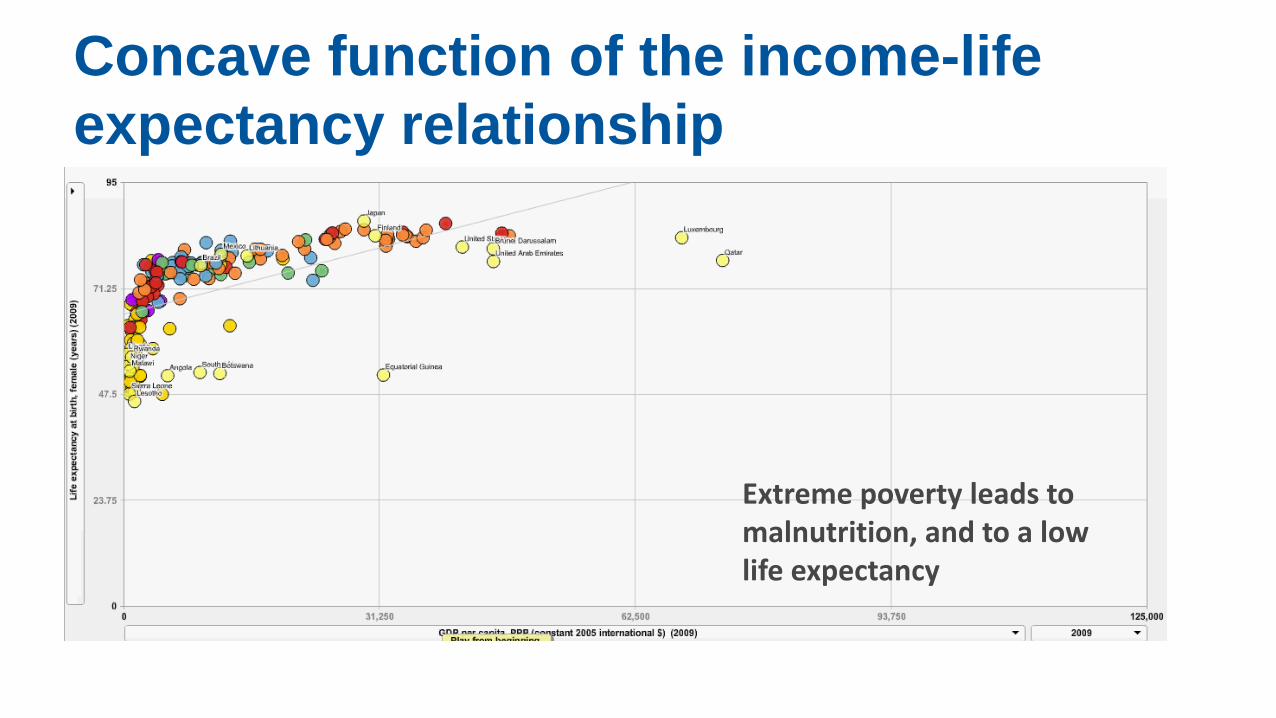
Concave function of the income-life
expectancy relationship
Extreme poverty leads to malnutrition, and to a low life expectancy

Convex function of the income-child
mortality relationship
Extreme poverty leads to malnutrition, and to high child mortality rates
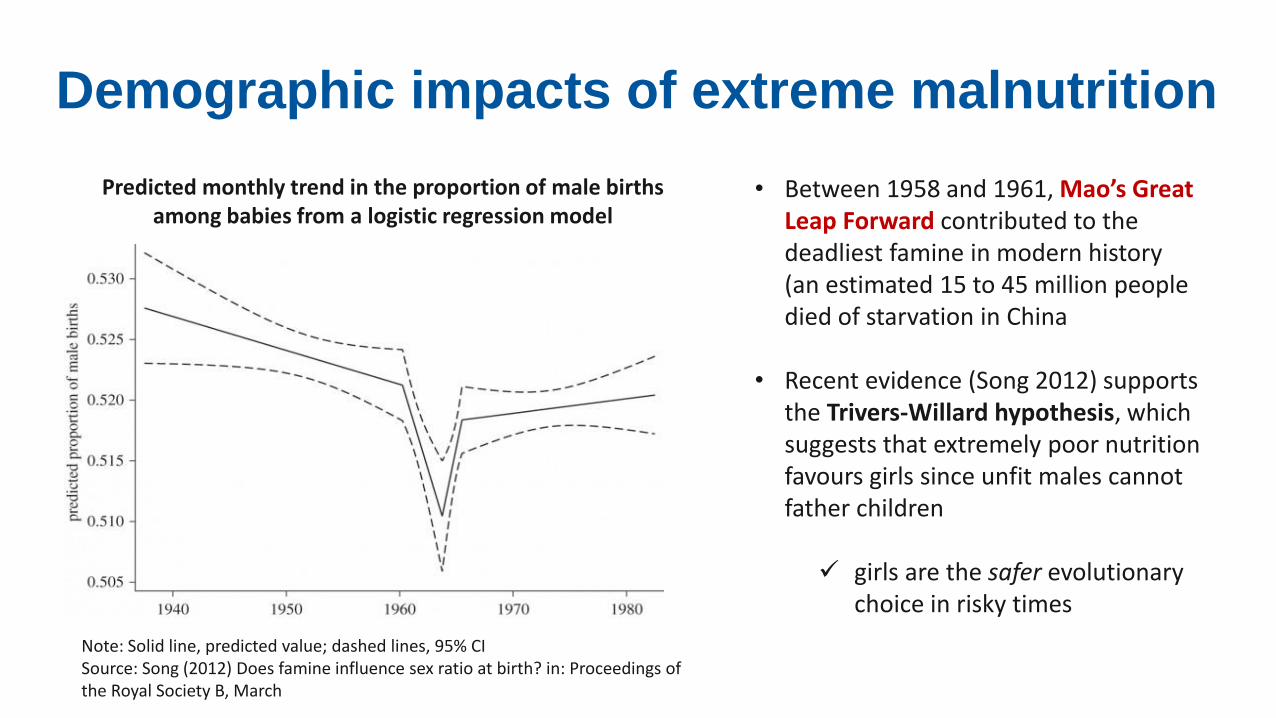
Demographic impacts of extreme malnutrition
• Between 1958 and 1961, Mao’s Great Leap Forward contributed to the deadliest famine in modern history (an estimated 15 to 45 million people died of starvation in China
• Recent evidence (Song 2012) supports the Trivers-Willard hypothesis, which suggests that extremely poor nutrition favours girls since unfit males cannot father children girls are the safer evolutionary
choice in risky times
Predicted monthly trend in the proportion of male births among babies from a logistic regression model
Note: Solid line, predicted value; dashed lines, 95% CI Source: Song (2012) Does famine influence sex ratio at birth? in: Proceedings of the Royal Society B, March

Nutritional deficits and the poverty trap
Nutritional status
Household income 0
a ●
b ●
● c
Income contribution from social transfers
Future labour
productivity
Poverty trap
Present investment in nutrition
Ability to invest in human capital
Actual investment
Future income
• Malnutrition leads to poor health and low labour productivity
• Low labour productivity translates into low incomes, which lead to a ‘vicious cycle’ of poverty or poverty traps.
• In low-income countries, the prevalence of malnutrition is often two to three times higher among the poorest income quintile

Intricate (mal)nutrition pathways
Public Policies Macro exogenous factors Extreme weather, prices,
technology, political instability
Micro endogenous factors Social norms, health and
nutritional practices
Other public Services Food subsidies, agricultural
policies, water and sanitation, infrastructure
Social Protection CCTs, School feeding
programmes, social pensions, workfare programmes
Public/private health systems Access to health care,
nutrients, quality of services
Households Income, assets, household composition, human capital, time
Child care practices
Dietary intake of mothers and
children
Number and spacing of children
Hygiene and sanitation
Preventive and curative health
care
Nutrition status Stunting, Wasting, Low birth
weight, micronutrient deficiency
Health status
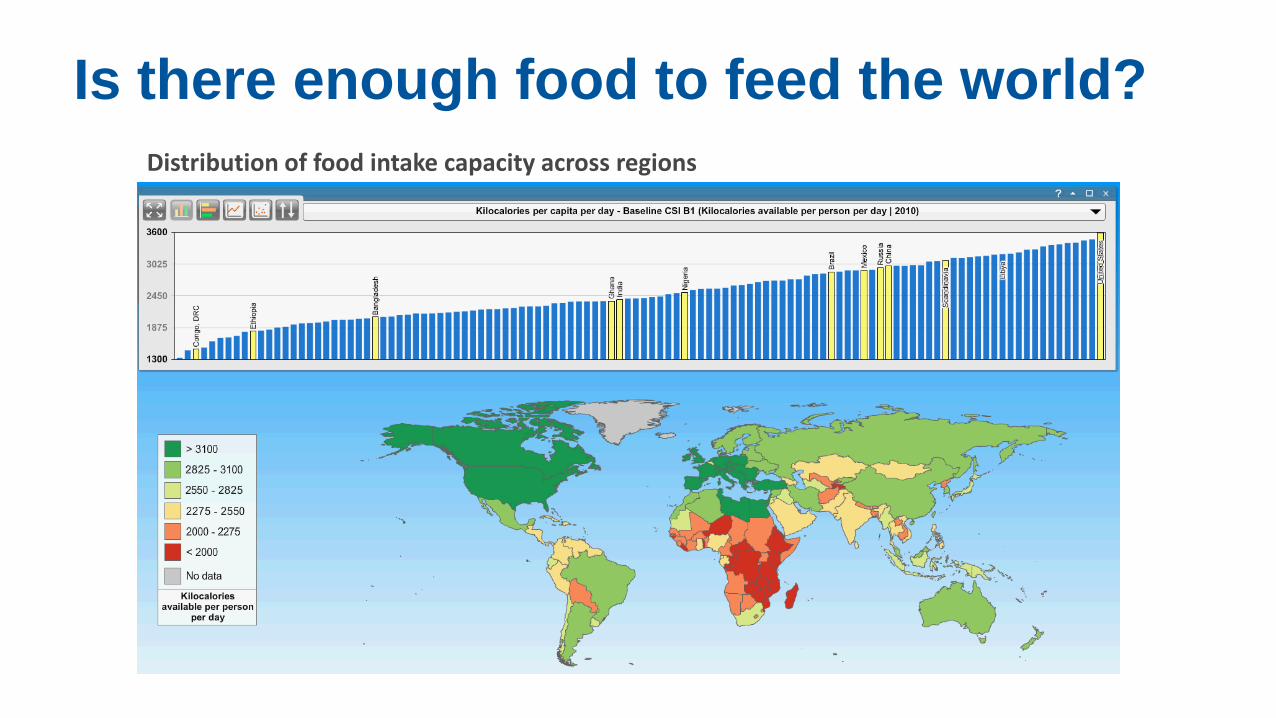
Is there enough food to feed the world?
Distribution of food intake capacity across regions

Social Protection as
a policy instrument
against malnutrition
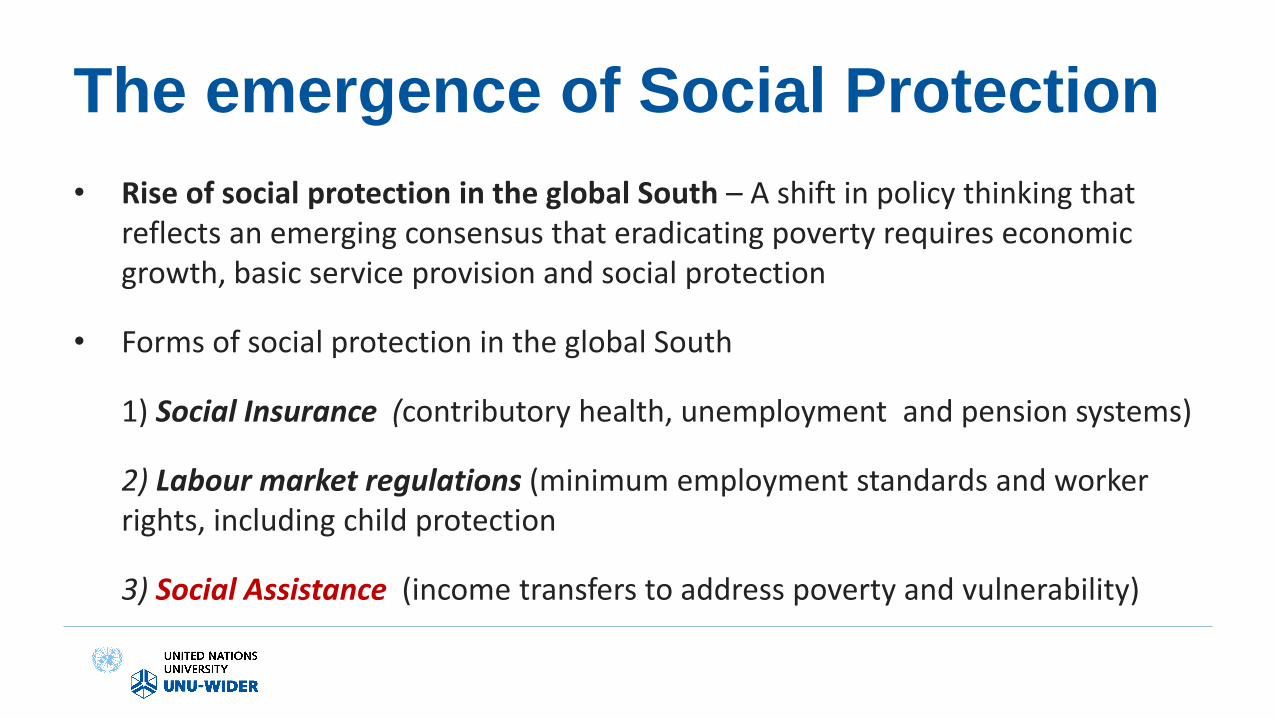
The emergence of Social Protection
• Rise of social protection in the global South – A shift in policy thinking that reflects an emerging consensus that eradicating poverty requires economic growth, basic service provision and social protection
• Forms of social protection in the global South
1) Social Insurance (contributory health, unemployment and pension systems)
2) Labour market regulations (minimum employment standards and worker rights, including child protection
3) Social Assistance (income transfers to address poverty and vulnerability)

Nu
mb
er
of
Pro
gram
me
s
180
Cumulative flagship transfer programme starts by type
160
140
120
100
80
60
40
20
0
1990 1991 1992 1993 1994 1995 1996 1997 1998 1999 2000 2001 2002 2003 2004 2005 2006 2007 2008 2009 2010 2011 2012
In Kind HD-CCT Employment Categorical-‐pension Categorical-‐Other

World largest Social Protection programmes
Programme title Country Type
Number of households (in millions)
Number of beneficiaries (in millions)
Country classification 1/ Poverty focus 2/
National Rural Employment Guarantee Scheme India Income transfer plus 48.0 240.0 Lower middle income High
Urban DiBao China Integrated antipoverty
22.0 110.0 Lower middle income High
Program Bantuan Tunai, Bantuan Tunai Langsung Indonesia Pure income 19.1 95.5 Lower middle income High
Bolsa Familia Brazil Income transfer plus 12.5 52.3 Upper middle income High
Rural Dibao China Pure income 10.5 42.0 Lower middle income High
Prêvidencia Social Rural Brazil Pure income 7.5 37.5 Upper middle income Categorical
Indira Gandhi National Old Age Pension Scheme India Pure income 15.7 31.4 Lower middle income High
Progresa-Oportunidades Mexico Income transfer plus 5.5 27.5 Upper middle income High
‘100 Days Employment Generation Scheme’ (EGP) Bangladesh Income transfer plus 3.0 15.0 Low income High
Tekun (transfer in less developed regions for destitute households)
China Pure income 6.6 10.7 Lower middle income High
Beneficio de Prestaçao Continuada Brazil Pure income 2.4 10.0 Upper middle income High
Expanded Senior Citizens Act of 2010 Philippines Pure Income 2.0 10.0 Lower middle income Categorical
National Family Benefit Scheme India Pure income 2.0 10.0 Lower middle income High
Old Age Pension South Africa Pure income 2.4 10.0 Upper middle income High
Child Support Grant South Africa Pure income 1.9 9.5 Upper middle income High
Subtotal for 15 largest programmes 161.0 711.4
Other 79 programmes 30.4 151.9
TOTAL Developing world 3/ 191.4 863.3

Household welfare
Marginal value of transfers
a
b
dc
.
.
. .
Income transfer for the worst-off
Income transfer for the better-off
Welfare enhancing for the worst-off
Welfare enhancing for the better-off
Social transfers have a poverty focus
• One of the most distinctive policy features of transfer programmes is their focus on the poorest and vulnerable
• The judgement about assisting the poorest has a strong foundation in principles of social justice. Welfare economics suggests that policies focusing on the poorest are welfare-enhancing
A dollar that helps the poor avoid starvation is more valuable than a dollar that helps the rich become richer

What do we know about the
impact of social transfers
on (mal)nutrition?

• Review studies have provided import but limited information on what works (Bhutta et al 2008, Fiszbein & Schady 2009; Barrientos & Niño-Zarazúa 2010, Manley et al 2011)
• Most evidence come from smaller-scale, randomized, pilot-based studies of single interventions. Very few studies come from national-scale transfer programmes mainly from Latin America and Southern Africa
• Overall, the evidence point at positive impacts of transfer programmes on nutritional outcomes (e.g. stunting, wasting), although the impact size and significance vary depending on:
– Design features that may (or may not) address behavioural constraints
– Access to, and quality of complementary public services
– Exogenous environmental factors
What do we know about social transfers’
impacts on (mal)nutrition?

What do we know about social transfers’
impacts on (mal)nutrition?
Programme Country Study Evaluation method anthropometric outcomes
Conditional cash transfers
Bolsa Alimentação Brazil Morris and others 2004 Instrumental Variables HAZ, WAZ
Familias en Acción Colombia Attanasio and others 2005 Propensity Score Matching, Difference-in-Difference
HAZ*, BW*
Oportunidades Mexico Leroy and others 2008 Propensity Score Matching, Difference-in-Difference
Height*, weight*, HAZ*, WHZ'*
Oportunidades Mexico Behrman and Hoddinott 2005 Randomised, Fixed effects Height*
Oportunidades Mexico Barber and Gertler 2008 Randomised, Instrumental Variables BW*, LBW*
Oportunidades Mexico Rivera and others 2004 Randomised Height*
Oportunidades Mexico Gertler 2004 Randomised Height*, stunting
Atención a Crisis Nicaragua Macours, Schady, and Vakis 2008 Randomised HAZ, WAZ, BW, LBW
Red de Protección Social Nicaragua Maluccio and Flores 2005 Randomised, Difference-in-Difference HAZ, stunting*, underweight*, wasting
Unconditional cash transfers
Bono Solidario Ecuador Leon and Younger 2007 Instrumental Variables HAZ*, WAZ*
Bono de Desarrollo Ecuador Paxson and Schady, forthcoming Randomised Height, HAZ
Humano
Child Support Grant South Africa Agüero, Carter, and Woolard 2007 Propensity Score Matching HAZ*
Note: BW = birthweight; HAZ = height-for-age z-score; LBW = low birthweight; WAZ = weight-for-age z-score; WHZ = weight-for-height z-score
Source: World Bank (2010)

What do we know about impacts on
(mal)nutrition?
Anthropometric measure
Results
Height
Mexico’s Oportunidades showed positive impacts on child height • In ‘treated’ rural areas children aged 12–36 months were one centimetre taller than the control group • In urban areas, children younger than six months grew 1.5 centimetres more than children in the control group However, Ecuador’s Bono de Desarrollo Humano, a UCT, showed no impact on the height of children aged three to seven years
HAZ (Height-for-age) z-scores
• Colombia’s Familias en Acción improved HAZ of children 0–24 months old, but not of children 24–72 months • In urban areas, Mexico’s Oportunidades improved HAZ of children 0–6 months, but not of those 6–12 or 12–24
months • South Africa’s Child Support Grant had positive impacts on HAZ on children 0–36 months Neither Brazil’s Bolsa Alimentação, Ecuador’s Bono de Desarrollo Humano, nor Atención a Crisis or Red de Protección Social had an impact on the HAZ of children in any age group
Stunting • Nicaragua’s Red de Protección Social reduced stunting by 5.2 percentage points among children younger than five
years of age, but Mexico’s Oportunidades had no impact on stunting of children 12–36 months old
Weight • Five out of six evaluations found positive programme impacts on the weight of children in different age groups.
Mexico’s Oportunidades program in urban areas improved the weight of children aged zero to six months at the time of enrolment by 0.77 kilogrammes; the weight of children from the lowest-income group also increased

What do we know about social transfers’
impacts on (mal)nutrition?
Anthropometric measure
Results
WAZ (Weight-for-age) z-scores
Half of CCTs programmes had no impact on WAZ, and in one CCT, WAZ actually worsened: Nicaragua’s Red de Protección Social CCT improved the WAZ of children under six years of age, but neither Nicaragua’s Atención nor Ecuador’s Bono Solidario had an impact on WAZ of children of any age group Each additional month of exposure to Brazil’s Bolsa Alimentação was associated with a 0.13 lower WAZ than that observed in children of the same age in the control group
WHZ (Weight-for-height) z-scores
In urban areas, Mexico’s Oportunidades, raised WHZ by 0.47 among children 0–6 months old in program areas, but not for those aged 6–12 or 12–24 months
Wasting Only in countries where children were widely wasted, studies focused on wasting. In Latin America less than 1% of children are wasted (less than 2.3% of the reference population), and that’s why few studies use wasting as proxy nutritional indicator
LBW (Low-Birthweight)
Birthweight and the incidence of LBW respond to activities targeted to pregnant women, including micronutrient, energy supplements and other prenatal services Most programmes reported a significant impact: Mexico’s Oportunidades reported a 127.3 g higher birth weight, and a 4.6 % point reduction in low birth weight Greater impact among women who spent more time in the programme and those who received more cash. Colombia’s Familias en Acción reported + impact on raising birthweight; but, Nicaragua’s Atención a Crisis had no impact on birthweight

What do we know about social trnsfers’
impacts on (mal)nutrition?
23
• The meta-regression line shows a positive and significant correlation between programme duration ad the estimated impact on HAZ z-scores
Source: Manley et al (2011)

What have we learned?
• Similar programmes offer different results due to differences in socio-economic contexts
• Programme effectiveness depends on:
1. Quality of service delivery (particularly health care and sanitation infrastructure)
2. Household behaviour (especially among mothers)
3. Prevailing social norms and practices (e.g. breastfeeding)
• Institutional and administrative capacity is key
• Interventions targeting gestation and the first two years of life are more effective for longer term impacts –strong correlation between low birthweight (LBW) and stunting in early life, and later cognitive deficits and poverty
• Education on complementary feeding seems to increase HAZ in populations with sufficient food
• The causal chain between public policy and nutrition outcomes should be seen as a long term process and addressed on an country/regional-level basis

Is it worth investing in nutritional policies?
Intervention Estimated benefits/cost savings Source
Peru's education programme It averted 11.1 cases of stunting per 100 children in the 0-18 month age range
Waters et al. (2006)
Mexico’s Oportunidades 2.9 % increase in lifetime earnings (Behrman and Hoddinott 2005)
South Africa' Child Support Grant
Present value exceeded by more than 60% the cost
Agüero, Carter, and Woolard (2007)
Bolivia's PIDI 1.37-2.48:1 benefit:cost ratio Behrman, Cheng and Todd (2004)
Complementary interventions
Micronutrient powders 37:1 benefit: cost ratio (iron) Sharieff et al. (2006)
Deworming 6:1 benefit:cost ratio Horton et al. (2008)
Iron fortification of staples 8:1 benefit:cost ratio Horton and Ross (2003, 2006)
Salt iodization 30:1 benefit:cost ratio Horton et al. (2008)

Key challenge ahead for
Low Income Countries:
Financing

Key challenge ahead for LICs: Financing
• Simulations suggest that 1% of GDP could be sufficient to cover a basic pension, 2% of GDP a child focused transfer, and 0.6% of GDP could finance an unemployment insurance – a transfer package would cost 3-6% of GDP
• If programmes were targeted, the cost would be lower
• However, even if a transfer package of poverty-targeted programmes was adopted, it would still represent between 18-40% of government revenues
• For most LIC countries, it would be hard to adopt social assistance programmes to scale, particularly when the room for redistribution is limited and the tax collection capacity is inadequate

What about redistribution?
• Redistribution policies have been important for the financial mix of social protection in industrialised countries. In SSA, however, redistribution policies remain very limited:
• The marginal tax rate (MRT) on the ‘rich’ that would be necessary to eliminate the normalised aggregate poverty gap in SSA would be simply economically and politically prohibitive as it would exceed 100% in most countries – MTR: proportion of tax paid for each additional income unit earned at the highest
income threshold
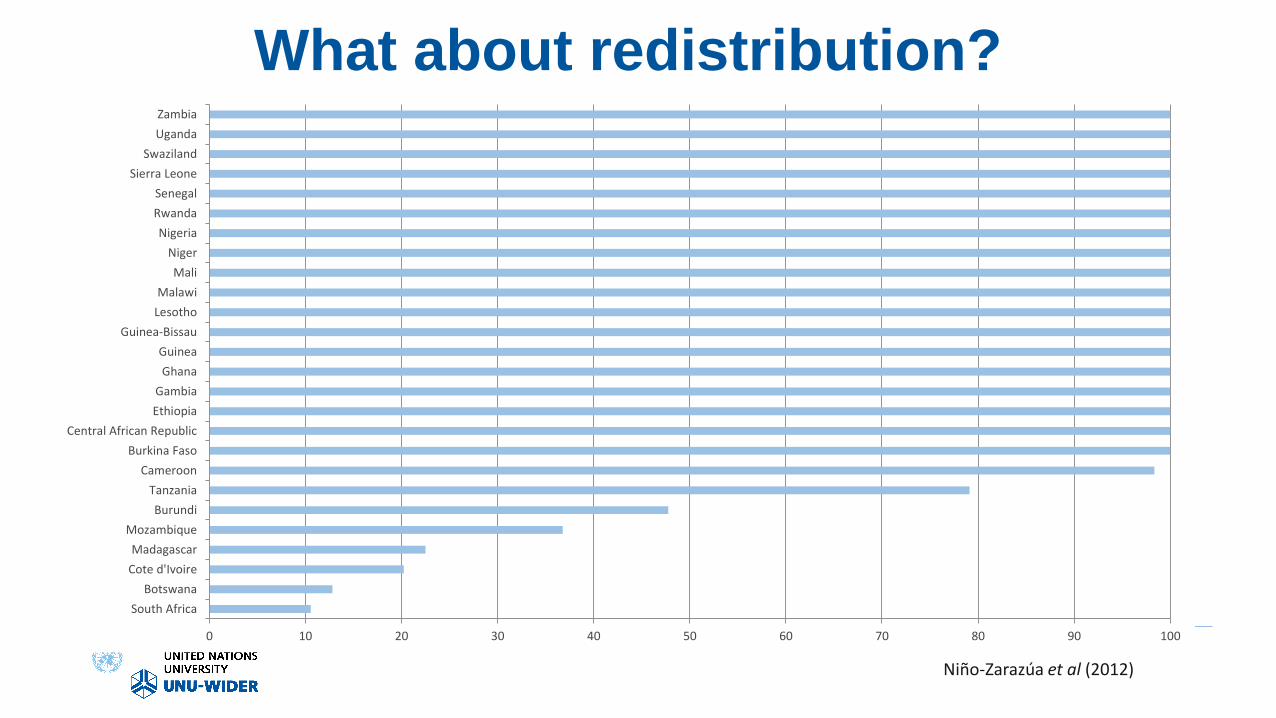
0 10 20 30 40 50 60 70 80 90 100
South Africa
Botswana
Cote d'Ivoire
Madagascar
Mozambique
Burundi
Tanzania
Cameroon
Burkina Faso
Central African Republic
Ethiopia
Gambia
Ghana
Guinea
Guinea-Bissau
Lesotho
Malawi
Mali
Niger
Nigeria
Rwanda
Senegal
Sierra Leone
Swaziland
Uganda
Zambia
What about redistribution?
Niño-Zarazúa et al (2012)

What about resource mobilisation? 1. Revenues from natural resources: the discovery and exploitation of natural resources (including oil) in many
countries in SSA have created, ‘in principle’, the conditions to support Social Assistance : – Angola, Botswana, Cameroon, Chad, Côte d'Ivoire, Gabon, Equatorial Guinea, Ghana, Namibia, Nigeria, Republic of Congo,
Sierra Leone, Togo, Uganda and Zambia
– Sovereign Wealth Funds introduced in Nigeria, Botswana and Angola
• Risks: opportunistic incumbents in non-competitive political systems have little incentives to reform tax regimes
2. Shifting expenditure –tax exemptions/subsidies on foodstuff, and fuel show large leakages to the non-poor while diminishing the tax base
• Obstacles: the greater the number of losers from policy change, and the more up front they are, the more difficult it is to shift public expenditure (e.g. the failing attempt to remove the fuel subsidy in Nigeria)
3. Medium-term fiscal policy objectives
– Rises in VAT earmarked for expenditures on Social Assistance (on e.g. sin products)
– Anti tax-evasion policies (Chile was able to reduce VAT evasion from 20% in the 1990s to less than 10% in 2009)

www.wider.unu.edu Helsinki, Finland