KINETICS OF THE VAPOUR-PHASE CATALYTIC DISPROPORTIONATION
OF TOLUENE
L.E. ANEKE
f /.I? ^^^y
KE^ETICS OF THE VAPOUR-PHASE CATALYTIC DISPROPORTIONATION
OF TOLUENE
PROEFSCHRIFT
TER VERKRIJGING VAN DE GRAAD VAN DOCTOR IN DE TECHNISCHE WETENSCHAPPEN AAN DE Ti;CH-NISCHE HOGESCHOOL DELET, OP GEZAG VAN DE RECTOR MAGNIFICUS PROF. DR. JR. H. VAN BEKKUM, VOOR EEN COMMISSIE AANGEWEZEN DOOR HIT
COLLEGE VAN DEKANEN TE VERDEDIGEN OP WOENSDAG 4 FEBRUARI 1976 TE 14.00 UUR
DOOR
P1138 5104
C10026 42385
LINUS ENEMMOR ANEKE
MASTER OF SCIENCE
GEBOREN TE ABIA, NIGERIA / / 3 (P •*>""/ 0 y
1976
DrukkcriJ J.H. Pasmans, 's-Gravcnhagc
BIBLIOTHEEK TU Delft
P 1138 5104
264238

r
2
Dit proefschrift is goedgekeurd door de promotoren
Prof.Drs.P.J.van den Berg
Prof.Ir.W.A.de Jong
k
ACKNOWLEDGEMENT
I gratefully acknowledge my indebtedness to all the people who
contributed in various ways to the realization of the work reported
here. In particular, I would like to express my deep appreciation
to Prof.Dr.J.J.F.Scholten, Lector Ir.A.C.Montfoort, Dr.Ir.T.van
Herwijnen and Mrs.L.A.de Wit for their interest and stimulating
discussions; to Mr.R.Th.Nijvenheim and his colleagues for their
efforts in the construction of the equipment used. Sincere thanks
are also due to R.A.Betckt, J.Eilers, L.A.Gerritsen,
R.E.van Iddekinge and R.Trion for their assistance with the
experiments and in the development of new ideas. Finally, I would like
to thank my family and friends for their faith and understanding which
were a constant source of encouragement.
F
4
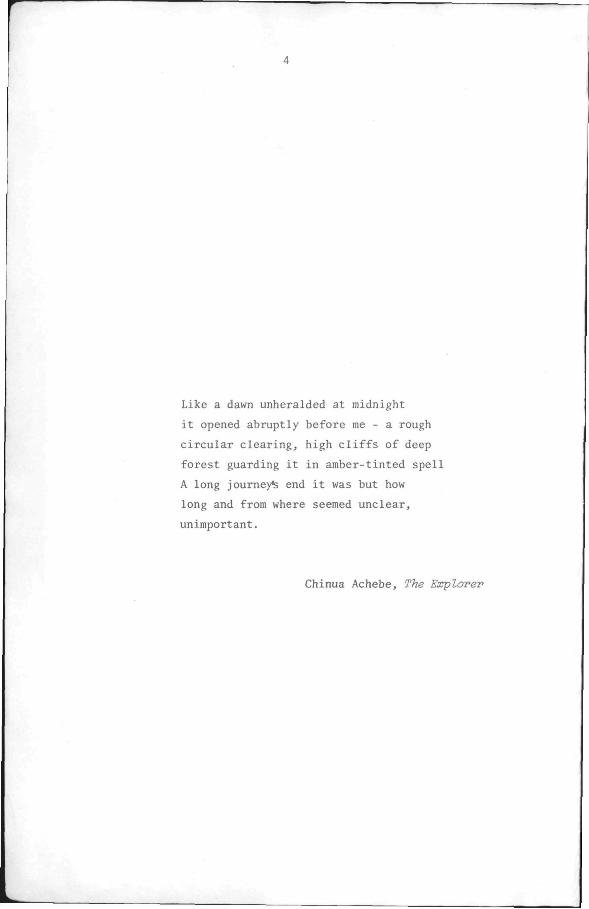
Like a dawn unheralded at midnight
it opened abruptly before me - a rough
circular clearing, high cliffs of deep
forest guarding it in amber-tinted spell
A long journey^ end it was but how
long and from where seemed unclear,
unimportant.
Chinua Achebe, The Explorer
DEDICATION
To my parents
Our ancestors, soul brother, were wiser
than is often made out.
Chinua Achebe, Beware,Soul Brother
6
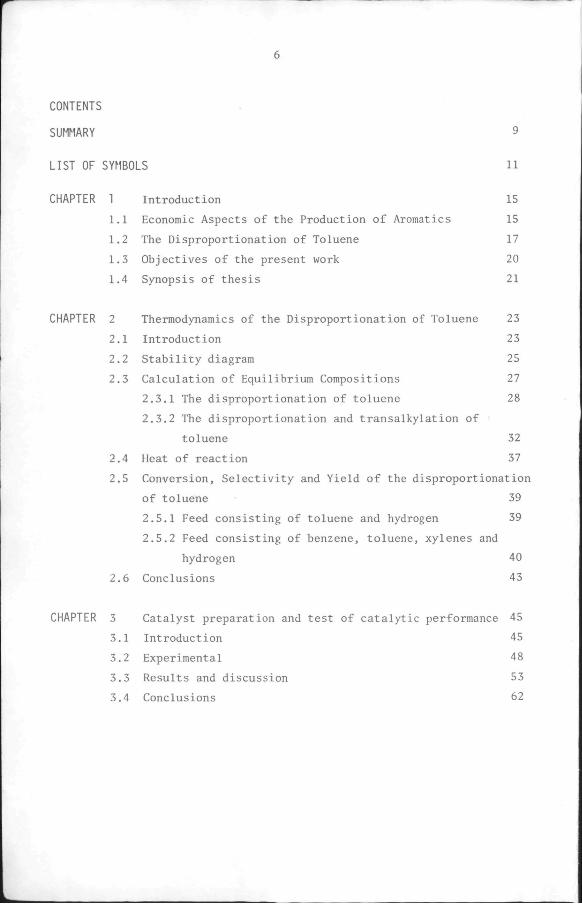
CONTENTS
SUMMARY 9
LIST OF SYMBOLS 11
CHAPTER 1 Introduction 15
1.1 Economic Aspects of the Production of Aromatics 15
1.2 The Disproportionation of Toluene 17
1.3 Objectives of the present work 20
1.4 Synopsis of thesis 21
CHAPTER 2 Thermodynamics of the Disproportionation of Toluene 23
2.1 Introduction 23
2.2 Stability diagram 25
2.3 Calculation of Equilibrium Compositions 27
2.3.1 The disproportionation of toluene 28
2.3.2 The disproportionation and transalkylation of
toluene 32
2.4 Heat of reaction 37
2.5 Conversion, Selectivity and Yield of the disproportionation
of toluene 39
2.5.1 Feed consisting of toluene and hydrogen 39
2.5.2 Feed consisting of benzene, toluene, xylenes and
hydrogen 40
2.6 Conclusions 43
CHAPTER 3 Catalyst preparation and test of catalytic performance 45
3.1 Introduction 45
3.2 Experimental 48
3.3 Results and discussion 53
3.4 Conclusions 62
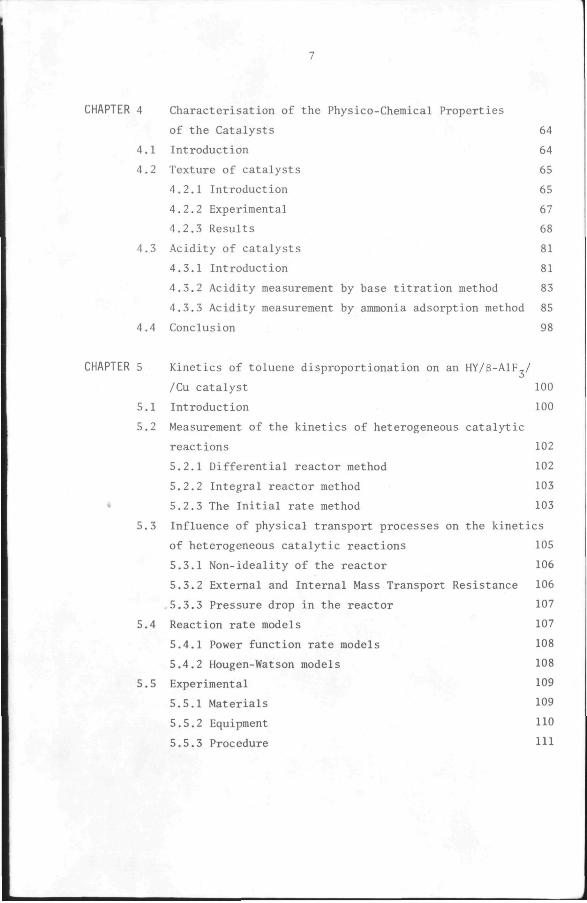
7
CHAPTER 4 Characterisation of the Physico-Chemical Properties
of the Catalysts 64
4.1 Introduction 64
4.2 Texture of catalysts 65
4.2.1 Introduction 65
4.2.2 Experimental 67
4.2.3 Results 68
4.3 Acidity of catalysts 81
4.3.1 Introduction 81
4.3.2 Acidity measurement by base titration method 83
4.3.3 Acidity measurement by ammonia adsorption method 85
4.4 Conclusion 98
CHAPTER 5 Kinetics of toluene disproportionation on an HY/6-A1F.-/
/Cu catalyst 100
5.1 Introduction 100
5.2 Measurement of the kinetics of heterogeneous catalytic
reactions 102
5.2.1 Differential reactor method 102
5.2.2 Integral reactor method 103
• 5.2.3 The Initial rate method 103
5.3 Influence of physical transport processes on the kinetics
of heterogeneous catalytic reactions 105
5.3.1 Non-ideality of the reactor 106
5.3.2 External and Internal Mass Transport Resistance 106
5.3.3 Pressure drop in the reactor 107
5.4 Reaction rate models 107
5.4.1 Power function rate models 108
5.4.2 Hougen-Watson models 108
5.5 Experimental 109
5.5.1 Materials 109
5.5.2 Equipment 110
5.5.3 Procedure 111
8
5.6 Results
5.6.1 Preliminary experiments
5.6.2 Kinetic measurements
5.7 Discussion and Conclusion
112
112
119
132
CHAPTER 6 Design Considerations 134
APPENDIX 1 Standard Free Energy and Enthalpy of formation of
components. 137
APPENDIX 2 Derivation of conversion, selectivity and yield. 139
APPENDIX 3 Adsorption Isotherms. 151
APPENDIX 4 Test of the Influence of transport processes. 154
APPENDIX 5 Internal normalization. 160
APPENDIX 6 Correction for catalyst deactivation. 161
APPENDIX 7 Derivation of a Langmuir-type rate model. 163
APPENDIX 8 F-test on the variances of the models. 165
APPENDIX 9 Formation of trimethylbenzene. 167
REFERENCES 169
SAMENVATTING 181
9
SUMMARY
Disproportionation is a potential alternative to methods of using
surplus toluene from the manufacture of aromatics. Although the
reaction may be carried out both in the liquid and vapour phases, the
latter is commercially the more important process and takes place in
the presence of solid acidic catalysts. Most of the work reported here
centres on the preparation and characterization of a catalyst with the
level of activity, selectivity and stability required for a commercial
process and for a study of the reaction kinetics.
First, the preparation of such a catalyst, designated ABl and with
the composition 72% HY/18% 6-AlF ./10% Cu, and the effect of some
process variables on its performance for the reaction are described.
The results reported show that the catalyst has good toluene
disproportionation performance and reveal that 500 C is its optimum
activation temperature, the activity all but disappearing when a
higher temperature is employed.
Subsequently, the physical and chemical properties of the
catalyst determined by analysis of nitrogen adsorption isotherms,
mercury penetration porosimetry and acidity measurements, are
discussed. The results of the texture determinations confirm that
most conventional methods for porous substances are inapplicable to
zeolites and zeolite-containing catalysts. Accordingly, a new method
is proposed and used to obtain values of the surface area in zeolitic
micropores which are in agreement with values computed from
crystallographic data. The mercury porosimetry experiments provide the
sizes of the voids between the catalyst particles as well as those of
the pores due to the 6-a.luminium fluoride and the copper present in
the catalyst. The results of the acidity measurements, determined by
n-butylamine titration and ammonia adsorption, are combined with the
texture of the catalysts to show that only about 10% of the total
surface area consists of acidic sites. Combination of the results of
texture and activity measurements also suggests that toluene
10
disproportionation activity of catalyst ABl is localized in its
transitional pores and that the micropores only serve to collect heavy
reaction products which would otherwise lead to deactivation. The
results of ammonia adsorption combined with the effect of activation
temperature on the catalytic activity suggest thatBrcinsted acid sites
are responsible for toluene disproportionation activity.
Reaction rate models derived from a number of postulated mechanisms
consisting of simple adsorption, surface reaction and desorption steps
are used to correlate the kinetic data. Non-linear weighted regression
analysis is applied to isolate a group of models with the smallest
variances. An F-test on these variances demonstrates that the difference
between those of the two models with the smallest values is not
significant at the 95% confidence level;thus, the two models are
equivalent from a statistical point of view. Experiments with reaction
products show that benzene has no measurable influence on the rate of
toluene disproportionation whereas xylenes have a definite retarding
effect.
The thesis concludes with some design considerations which are
regarded as relevant for the realization of an industrial toluene
disproportionation process.
11
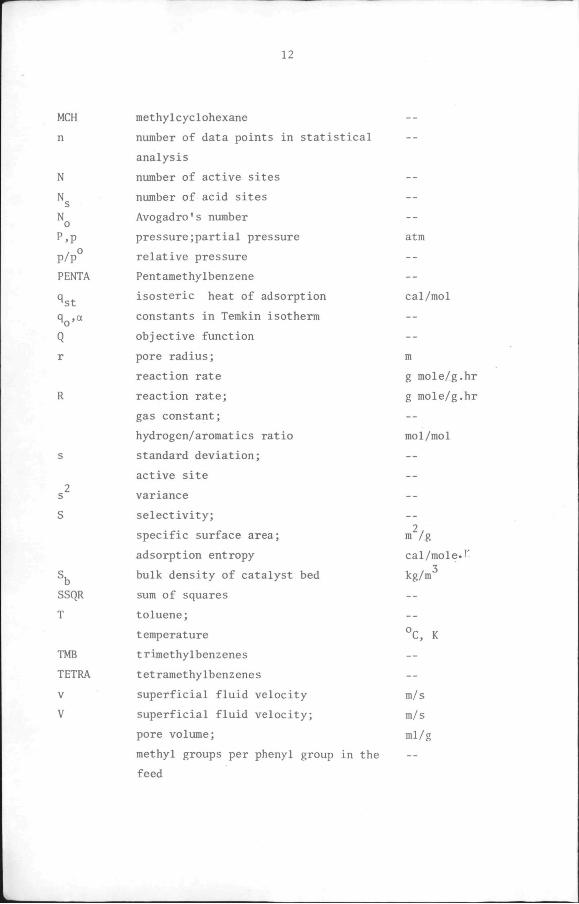
LIST OF SYMBOLS
a reaction order 2
A area occupied by a molecule; m
response factor in GLC detection
ABl 72 w%HY/18 w% B-ALF /10w% Cu catalyst
b reaction order
B benzene
BET Brunauer, Emmett and Teller 3
C concentration kg/m
d reactor diameter m
2, d catalyst pa r t i c l e diameter ra D dif fusivi ty m /s
2
D. longitudinal dispersion coefficient m /s
E activation energy cal/mol
E apparent activation energy cal/mol a
E, porosity of catalyst bed
F F-value from F-test
g ammonia adsorption; ml/g
moles of a component in GLC detection moles
G Free Enthalpy (Gibb's Free Energy) cal/mole
HEXA hexamethylbenzene
HY Hydrogen Y zeolite
k reaction rate constant g moles/(g.s.atm)
K equilibrium constant;
moles xylenes per mole toluene in the feed;
response factor in GLC detection; 2
mass transfer coefficient g moles/(m .s.atm)
L total number of active sites on catalyst
surface;
reactor length m
m mole fraction in GLC detection
M molecular weight; kg/kg mole methane
12
MCH
n
N
N s
% P.P
p/p°
PENTA
''st
%.a
Q r
R
s
2 s
S
\ SSQR
T
TMB
TETRA
V
V
methylcyclohexane
number of data points in statistical
analysis
number of active sites
number of acid sites
Avogadro's number
pressure;partial pressure
relative pressure
Pentamethylbenzene
isosteric heat of adsorption
constants in Temkin isotherm
objective function
pore radius;
reaction rate
reaction rate;
gas constant;
hydrogen/aromatics ratio
standard deviation;
active site
variance
selectivity;
specific surface area;
adsorption entropy
bulk density of catalyst bed
sum of squares
toluene;
temperature
t r imethy1ben z ene s
tetramethylbenzenes
superficial fluid velocity
superficial fluid velocity;
pore volume;
methyl groups per phenyl group in the
feed
--
~"
--
--
--
atm
--
--
cal/mol
--
--
m
g mole/g.hr
g mole/g.hr
—
mol/raol
--
--
—
--2,
m /g
cal/mole.!'
kg/m
--
--
°C, K
--
--
m/s
m/s
ml/g
--
13
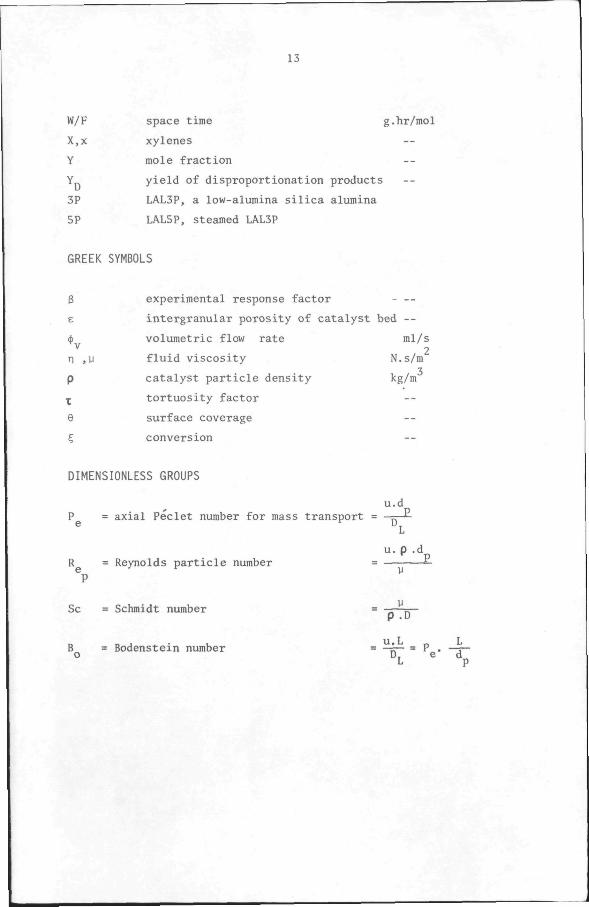
W/F space time g.hr/mol
X,x xylenes
Y mole fraction
Y_ yield of disproportionation products
3P LAL3P, a low-alumina silica alumina
5P LAL5P, steamed LAL3P
GREEK SYMBOLS
experimental response factor - —
intergranular porosity of catalyst bed --
volumetric flow rate ml/s 2
n ,y fluid viscosity N.s/m 3
p catalyst particle density kg/m
V
•J tortuosity factor
8 surface coverage
C conversion
DIMENSIONLESS GROUPS
P = axial Peclet number for mass transport u.d
R = Reynolds p a r t i c l e number
Sc = Schmidt number
B = Bodenstein number o
^L
u . p
y
V p . D
u.L
%
-
Pe-L
15
C H A P T E R 1
INTRODUCTION
1.1 Economic Aspects of the Production of Aromatics
Benzene, toluene and xylenes are the most commercially important
aromatic hydrocarbons. There are two traditional sources of these
aromatics:1) Fractional distillation of the light oil obtained as a
by-product of the pyrolysis of coal.
2) Catalytic reforming of naphtha fractions, where the aro
matics are separated from the rest of the reformate by selective ex
traction and the raffinate is refined into benzene, toluene and xylenes
by fractional distillation.
A third source, which is gaining in importance, is the fractional dis
tillation of the benzene-rich by-product of the thermal cracking
(pyrolysis) of naphtha for the manufacture of ethylene.
Until shortly after World War II, industrial demand could be met
by the production from coal pyrolysis. After the war, however, the
demand rose so rapidly that increasing amounts were produced from
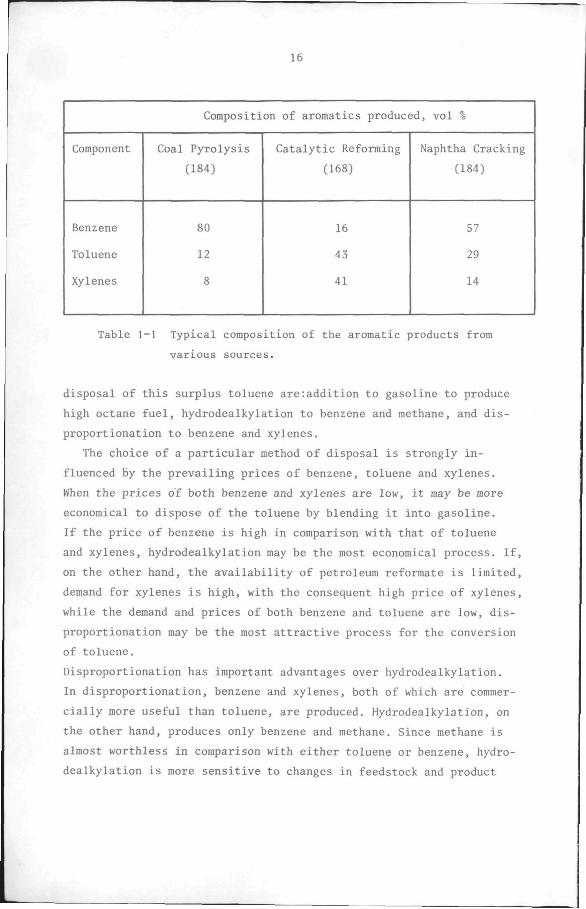
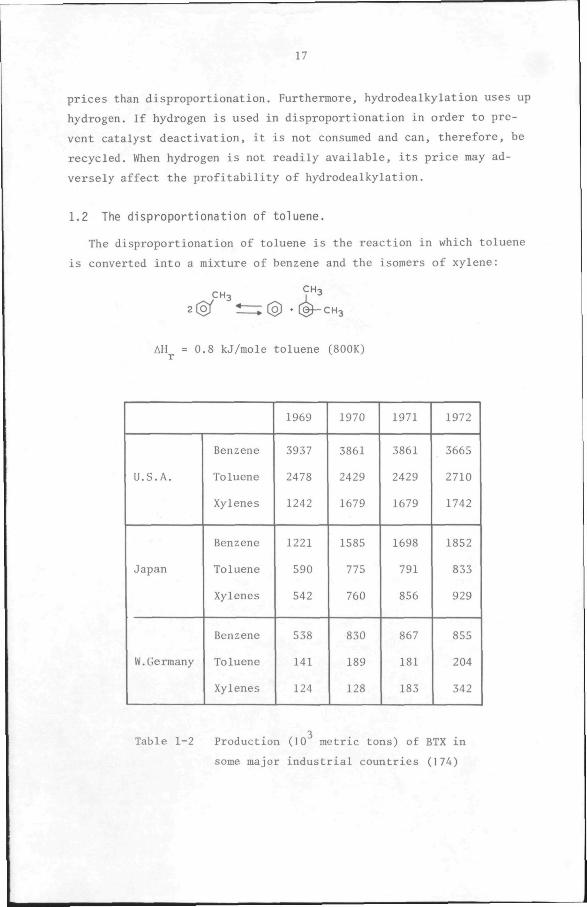
naphtha. Table 1-1 shows the typical composition of the aromatic
product obtained by the three sources mentioned above, while the pro
duction of these aromatics in some of the major industrial countries
is shown in Table 1-2. Table 1-1 shows that catalytic reforming, which
by 1970 accounted for almost 100% of the total production of the aro
matics, yields more toluene than either benzene or xylenes. However,
because of the use of large amounts of benzene for the manufacture of
nylon and polystyrene, and of p-xylene for the production of polyester
fibres, the demand for benzene and xylenes increased faster than that
for toluene. At the same time, the quantity of toluene commercially
available exceeded its demand as a chemical raw material, with the
result that the price of toluene is lower than those of benzene and
xylenes. This situation has led to attempts to develop processes based
on toluene as a raw material. The most important channels for the
16
Composition of aromatics produced, vol %
Component
Benzene
Toluene
Xylenes
Coal Pyrolysis
(184)
80
12
8
Catalytic Reforming
(168)
16
43
41
Naphtha Cracking
(184)
57
29
14
Table 1-1 Typical composition of the aromatic products from
various sources.
disposal of this surplus toluene are:addition to gasoline to produce
high octane fuel, hydrodealkylation to benzene and methane, and dis
proportionation to benzene and xylenes,
The choice of a particular method of disposal is strongly in
fluenced by the prevailing prices of benzene, toluene and xylenes.
When the prices of both benzene and xylenes are low, it may be more
economical to dispose of the toluene by blending it into gasoline.
If the price of benzene is high in comparison with that of toluene
and xylenes, hydrodealkylation may be the most economical process. If,
on the other hand, the availability of petroleum reformate is limited,
demand for xylenes is high, with the consequent high price of xylenes,
while the demand and prices of both benzene and toluene are low, dis
proportionation may be the most attractive process for the conversion
of toluene.
Disproportionation has important advantages over hydrodealkylation.
In disproportionation, benzene and xylenes, both of which are commer
cially more useful than toluene, are produced. Hydrodealkylation, on
the other hand, produces only benzene and methane. Since methane is
almost worthless in comparison with either toluene or benzene, hydro
dealkylation is more sensitive to changes in feedstock and product
17
prices than disproportionation. Furthermore, hydrodealkylation uses up
hydrogen. If hydrogen is used in disproportionation in order to pre
vent catalyst deactivation, it is not consumed and can, therefore, be
recycled. When hydrogen is not readily available, its price may ad
versely affect the profitability of hydrodealkylation.
1.2 The disproportionation of toluene.
The disproportionation of toluene is the reaction in which toluene
is converted into a mixture of benzene and the isomers of xylene:
2(0/ TIZ;(Q} -C^CHJ
AH =0.8 kJ/mole toluene (800K)
U.S.A.
Japan
W.Germany
Benzene
Toluene
Xylenes
Benzene
Toluene
Xylenes
Benzene
Toluene
Xylenes
1969
3937
2478
1242
1221
590
542
538
141
124
1970
3861
2429
1679
1585
775
760
830
189
128
1971
3861
2429
1679
1698
791
856
867
181
183
1972
3665
2710
1742
1852
833
929
855
204
342
Table 1-2 Production (10 metric tons) of BTX in
some major industrial countries (174)
18
The reaction was first reported in 1884 in the pioneering work of
Anschiitz (70,71,72), who refluxed toluene at atmospheric pressure with
aluminium chloride as a catalyst, identified the products and postu
lated a mechanism for the reaction. Besides benzene and xylenes from
the main reaction, hydrocarbons with higher boiling points and some
tarry products were formed by side reactions. Since that time, the
liquid-phase reaction has invariably been carried out over metal ha-
lides acting as classical Friedel-Crafts catalysts (73-76) .
The reaction also proceeds in the vapour phase. Solid catalysts,
such as silica-alumina and natural or synthetic zeolites, are used for
the vapour phase reaction. The first reported use of a solid catalyst,
silica-alumina, was in 1943 (80). After this time, most investigators
used silica-alumina (82) or boria-alumina catalysts (83). It is now
clear, however, that zeolites such as mordenite and faujasite are
superior in many respects to silica-alumina (87). Mordenite (88,90),
rare-earth-exchanged X-zeolite (87,89) and cation-exchanged Y-zeolite
(91,118) have been shown to possess the highest activity for this
reaction. Unfortunately, many of these catalysts show a low selectivity
as a result of hydrodealkylation and cracking reactions. Furthermore,
they have a low stability, with the result that the rate at which their
activity declines as a result of coke formation is usually so fast that
the activity decreases to a low value in a short time. In order to
improve their properties, the trend in the development of toluene
disproportionation catalysts has shifted towards the use of composite
catalysts (121). Satisfactory results have been obtained with alumina-
aluminium fluoride (92), mordenite-aluminium fluoride (94),
clinoptilolite-aluminium fluoride-copper (100), and mordenite-
aluminium fluoride-copper (93), combinations.
In spite of the attention which the process received after World
War II, especially in the U.S.A. and Japan, and the large number of
patents which have appeared on the subject (84), the disproportionation
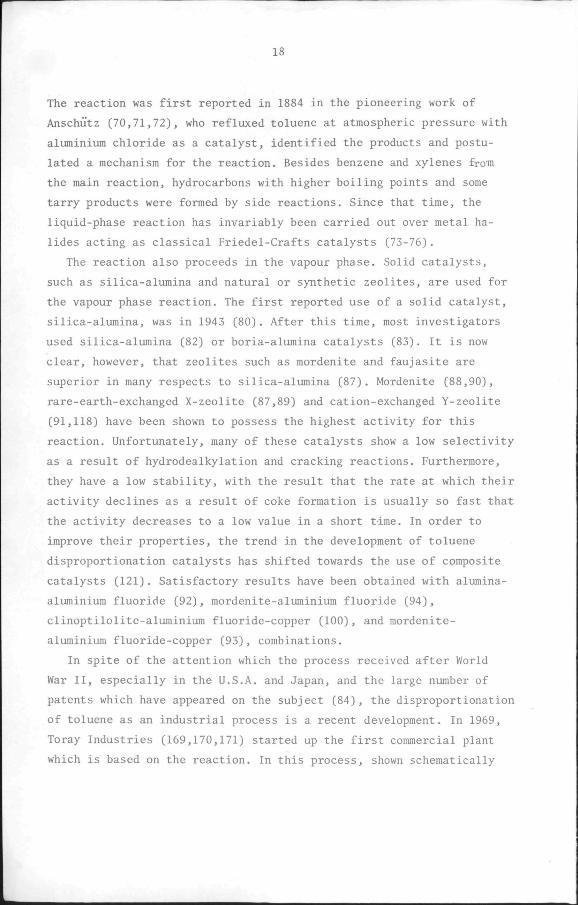
of toluene as an industrial process is a recent development. In 1969,
Toray Industries (169,170,171) started up the first commercial plant
which is based on the reaction. In this process, shown schematically
19
in Fig.1-1, the reaction takes place in the vapour phase. Hydrogen is
used as a diluent gas in order to avoid coke deposition and, conse
quently, catalyst deactivation. The reaction takes place at a pressure
of 30 atm, a temperature of 440°C, and with the molar ratio H./
aromatics in the reactor feed kept at 10. The concentration of hydrogen
in the make-up hydrogen stream is at least 70% by volume. The process
is claimed to be capable of an overall selectivity higher than 97%.
The details of the catalyst used have not been revealed. However, it
is probably a zeolite or a mixture of zeolites, alone or promoted with
other components.
A liquid phase process, the Mobil Low Temperature Disproportion
ation (LTD) process, has been developed by Mobil Oil Corporation
(172,173). The process, shown in Fig.i_2, uses a zeolite catalyst at a
pressure of 45 atm and a temperature of 260°C. The process uses no
diluent gas, but the reactor temperature is raised from the initial
value of 260°C during the process cycle in order to maintain the
conversion at a satisfactory level. After the temperature reaches about
Toluene recycle ca-Aromatks C 0 - Arontotlcs
hydrogen rich gas recycle
^
A \ j
r~\
R«oclor Separator Froctlonotors
V Hlgn boiling fraction
C9-Aromotics r«cyci«
Figure 1-1 Toray toluene disproportionation process
20
Toluene • • Toluene recycle
Non-Aromat ics Benzene
• ^
r~\
r\
feed heater Reactor Cooler
Distillation columns 08-Aromatics
Figure 1-2 Mobil LTD (Low Temperature Disproportionation) process
300°C, the catalyst is regenerated by controlled burning of the coke
deposited on it. The life of the catalyst is claimed to be 1 years.
There is as yet no industrial plant based on this process.
1.3 Objectives of the present work.
The goal of the investigation reported in this thesis is to prepare
an active, selective and stable catalyst for the disproportionation of
toluene and, subsequently, to use the catalyst to arrive at a descrip
tion of the kinetics of the reaction in the vapour phase. Although the
reaction has been known for almost a century, only a few kinetic
studies on it have been reported (83,84,85,90,175). Because of the poor
activity, selectivity and stability of some of the catalysts which have
been used in such kinetic studies (85,90), the results are of doubtful
accuracy. Inasmuch as a reaction rate equation is useful for an accu
rate design of a commercial reactor for the process, the aim of the
kinetic experiments is to obtain such a rate equation.
Linde molecular sieve Y-zeolite, SK-40 was selected as the basic
material for the preparation of the catalyst because the hydrogen form

21
of this zeolite has a very high initial activity for the disproportion
ation of toluene (88). Furthermore, preliminary experiments showed
that H-Y zeolite was much more active in this application than silica-
alumina and more stable than hydrogen mordenite. The results obtained
by other investigators with the type of composite catalysts mentioned
above suggest that promotion of hydrogen Y-zeolite with g-aluminium
fluoride and a metal such as copper may have a beneficial effect on its
selectivity and stability as a toluene disproportionation catalyst.
As previously mentioned, catalysts based on combinations of alumina,
mordenite or clinoptilolite with 6-aluminium fluoride and copper are
known. However, a catalyst in which hydrogen Y-zeolite is substituted
for these zeolites has not yet been mentioned in any of the large
number of patents and articles on this subject. Furthermore it was
considered potentially useful to try and prepare the B-aluminium
fluoride in a less laborious manner than has hitherto been the case
(93,108,109).
1.4 Synopsis of thesis.
After the introductory material dealt with in the present chapter,
the thermodynamics of the disproportionation of toluene is taken up
in chapter 2. This topic has not yet been sufficiently studied in the
literature, even though it is one of the prerequisites for an under
standing of the relative importance of the many possible reactions of
toluene as a function of temperature, pressure and concentration.
The method of preparation and the toluene disproportionation ac
tivity of the catalysts used in this study are described in chapter 3.
The results are presented in graphs of conversion and selectivity, at
"standard"reaction conditions, against time on stream. The graphs
facilitate comparison of the catalysts and show the effect of reaction
conditions, catalyst composition, and activation procedure on the dis
proportionation activity of the catalysts.
Experiments aimed at the characterisation of some physico-chemical
properties of the catalysts are described in chapter 4. The texture,
that is the pore structure properties, of the catalysts is determined.
22
Texture plays an important part in the transport of reactants and
products in a catalyst and, therefore, exerts an influence on the ef
fectiveness of a catalyst. For this reason, characterisation of the
texture of catalysts is essential for an understanding of their proper
ties. Also, acidic properties are among the determining factors of the
activity of a toluene disproportionation catalyst. Hence the amount,
strength, type and distribution of acid sites on the catalysts are
determined as well. The limitations of the methods used and the sig
nificance of the results obtained when applied to zeolites and zeolite-
based catalysts are discussed.
In chapter 5 the kinetic experiments are taken up. After a brief
introduction of the methodology for the study of the kinetics of
heterogeneous catalytic reactions, these methods are applied to the
kinetics of the disproportionation of toluene. The catalyst used is
selected on the basis of the work reported in chapter 3. The
derivation of the Langmuir-type reaction rate models which are used
to describe the kinetic data, and the significance of these models,
are discussed.
Finally, in chapter 6, the results of the experiments described in
previous chapters are combined and some design considerations of an
industrial toluene disproportionation process are examined.
23
C H A P T E R 2
THERMODYNAMICS OF THE DISPROPORTIONATION OF TOLUENE
2.1 Introduction
Pitzer and Scott (75) first reported on the thermodynamics of the
disproportionation of toluene. In their experimental investigation
liquid toluene was maintained in contact for five days at 50°C with a
catalyst consisting of an anhydrous AlBr /HBr mixture. Analysis of the
reaction products showed an abnormally low concentration of xylenes,
which they attributed to the consumption of xylenes by such side re
actions as the formation of trimethylbenzenes They determined that the
equilibrium constant for the disproportionation of toluene in the liquid
phase lies between 0.15 and 0.22.
Later, Hastings and Nicholson (176) and Egan (177) independently made
a theoretical study of the gas-phase equilibrium.
Their calculations were based on the assumption that methyl group trans
fer is the most probable reaction of methylbenzenes. The transfer re
actions are assumed to proceed in a step-wise manner, the products of
previous transfer steps undergoing subsequent transfer reactions
(isomerisation and either disproportionation or transalkylation with
toluene, see Table 2-5). At equilibrium, a mixture of products consist
ing of benzene and the twelve methylbenzenes is thermodynamically
possible.
As was pointed out in chapter 1, the vapour phase disproportionation
of toluene is carried out industrially with hydrogen as a diluent
gas in order to minimize coke-formation by cracking reactions and thus
avoid deactivation of the catalyst. In such a system many reactions
other than disproportionation are possible. The most probable among
these reactions are shown in Table 2-1. In these reactions, it is assum
ed that toluene is the only methylbenzene present. Actually, similar
reactions are possible with the benzene, xylenes and trimethylbenzenes
formed as well as with the higher methylbenzenes produced in subsequent
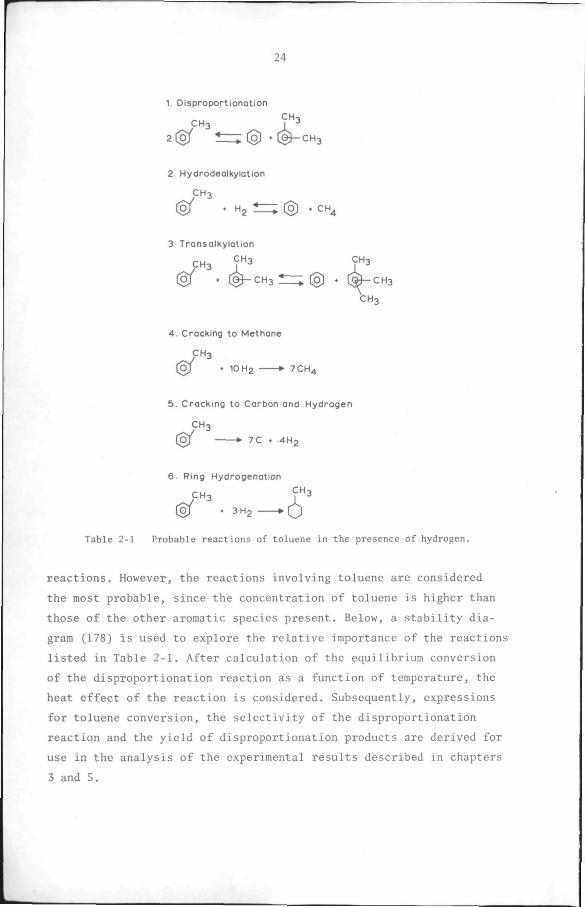
24
1 Disproport ionation
C H T t.M3 1 -
'.(of ^ZliCo) 'C^CH3
2 Hydrodealkylation
CH3
( g / • H2 t = i (5 ) . CH4
3 Transalkylation
(of . ( ^ c H a t Z ; (o) . CH3 9^^3 CH3
CH3
CH-,
4 Cracking to Methane
CH3
(of • 10 Hg *• 7CH4
5 Cracking to Carbon and Hydrogen
CH3
- - - -'12 to/ 7C . 4H'3
6 Ring Hydrogenotion
CH3 9^3
(3/ . 3H2 • O
Table 2-1 Probable reactions of toluene in the presence of hydrogen
reactions. However, the reactions involving toluene are considered
the most probable, since the concentration of toluene is higher than
those of the other aromatic species present. Below, a stability dia
gram (178) is used to explore the relative importance of the reactions
listed m Table 2-1. After calculation of the equilibrium conversion
of the disproportionation reaction as a function of temperature, the
heat effect of the reaction is considered. Subsequently, expressions
for toluene conversion, the selectivity of the disproportionation
reaction and the yield of disproportionation products are derived for
use m the analysis of the experimental results described in chapters
3 and 5.
25
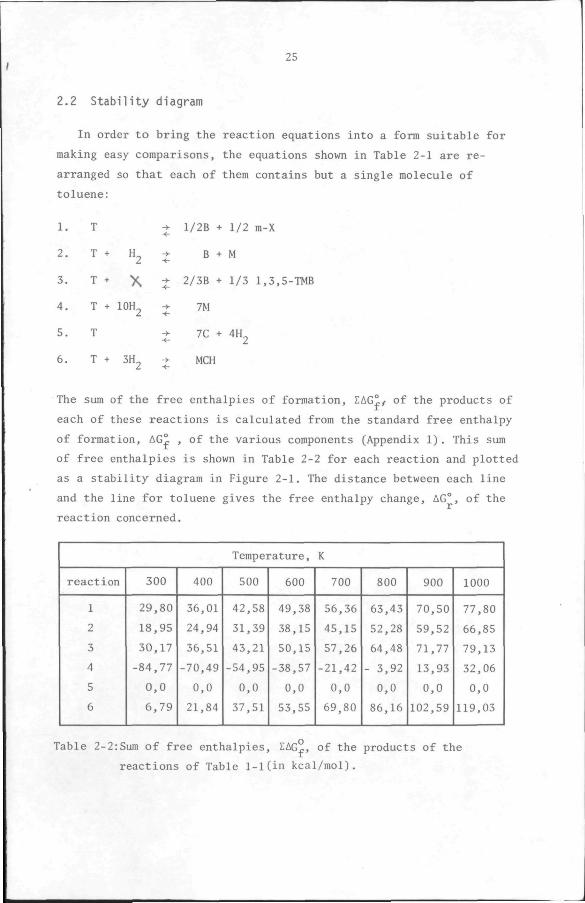
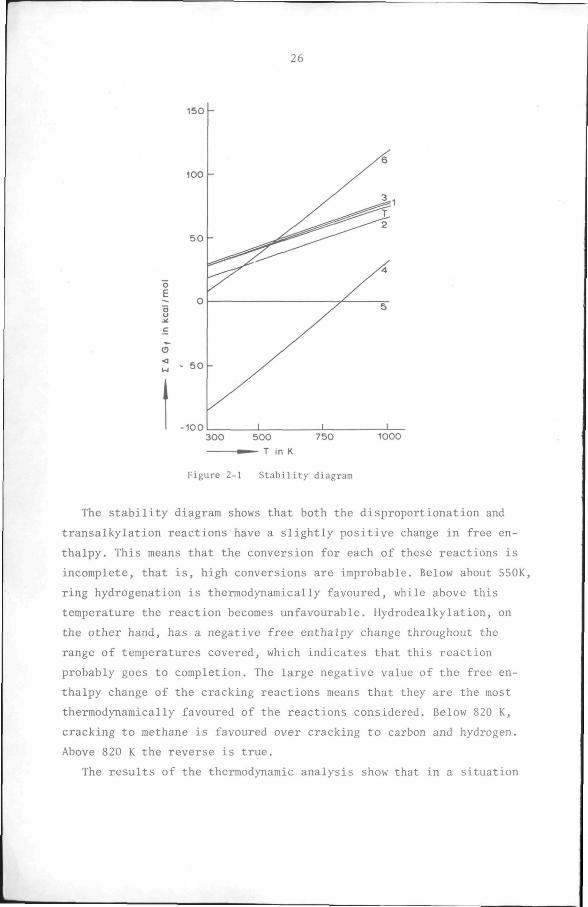
2.2 Stability diagram
In order to bring the reaction equations into a form suitable for
making easy comparisons, the equations shown in Table 2-1 are re
arranged so that each of them contains but a single molecule of
toluene:
1.
2.
3.
4.
5.
6.
T
T + H
T + >
T + lOH
T
T + 3H
-> 1/2B + 1/2 m-X
B + M
T + X J 2/3B + 1/3 1,3,5-TMB
•+ 7M
J 7C + 4H2
-> MCH
The sum of the free enthalpies of formation, lAG^/ of the products of
each of these reactions is calculated from the standard free enthalpy
of formation, AG^ , of the various components (Appendix 1). This sum
of free enthalpies is shown in Table 2-2 for each reaction and plotted
as a stability diagram in Figure 2-1. The distance between each line
and the line for toluene gives the free enthalpy change, AG°, of the
reaction concerned.
Temperature, K
reaction
1
2
3
4
5
6
300
29,80
18,95
30,17
-84,77
0,0
6,79
400
36,01
24,94
36,51
-70,49
0,0
21,84
500
42,58
31,39
43,21
-54,95
0,0
37,51
600
49,38
38,15
50,15
-38,57
0,0
53,55
700
56,36
45,15
57,26
-21,42
0,0
69,80
800
63,43
52,28
64,48
- 3,92
0,0
86,16
900
70,50
59,52
71,77
13,93
0,0
102,59
1000
77,80
66,85
79,13
32,06
0,0
119,03
Table 2-2:Sum of free enthalpies, £AG^, of the products of the
reactions of Table 1-1(in kcal/raol).
26
o E o u
C
O <
II
300 500 750 1000
^ — T in K
Figure 2-1 Stability diagram
The stability diagram shows that both the disproportionation and
transalkylation reactions have a slightly positive change in free en
thalpy. This means that the conversion for each of these reactions is
incomplete, that is, high conversions are improbable. Below about 550K,
ring hydrogenation is thermodynamically favoured, while above this
temperature the reaction becomes unfavourable. Hydrodealkylation, on
the other hand, has a negative free enthalpy change throughout the
range of temperatures covered, which indicates that this reaction
probably goes to completion. The large negative value of the free en
thalpy change of the cracking reactions means that they are the most
thermodynamically favoured of the reactions considered. Below 820 K,
cracking to methane is favoured over cracking to carbon and hydrogen.
Above 820 K the reverse is true.
The results of the thermodynamic analysis show that in a situation
150
100
-100
27
where all the reactions considered proceed at the same rate, the se
lectivity of the disproportionation reaction will be vanishingly small.
In order to increase the selectivity for disproportionation, a catalyst
is needed which will selectively accelerate the rate of the reaction
at the expense of the hydrodealkylation and cracking reactions.
In the experiments described in chapters 3 and 5, analysis of the
gaseous product obtained after condensation and separation of the aro
matics shows that only methane and hydrogen are present. This means
that if cracking to low-molecular weight hydrocarbons occurred, only
methane was formed (reaction 4 in Table 2-1). However, a methyl-group
balance shows that all the methane in the product can be accounted for
on the basis of the hydrodealkylation reaction. Thus, it can be con
cluded that no cracking to methane or other low molecular weight hydro
carbons occurs.
Cracking to carbon and hydrogen (reaction 5 in Table 2-1) results in
coke deposition on the catalyst. Catalyst deactivation is usually
attributed to this coke formation. From the slow deactivation of the
catalyst prepared in chapter 3 (30% in 3000 hours) and the fact that
the maximum carbon content determined for a sample of this catalyst
after deactivation with toluene at 500°C was 4.5%, this reaction can
be neglected under the conditions used in the experiments described in
chapters 3 and 5.
The product of ring hydrogenation, methylcyclohexane, was not detec
ted in the reaction products. Therefore, this reaction (reaction 6 in
Table 2-1) can also be left out of consideration. This means that
reactions 1, 2, and 3 of Table 2-1 are the only reactions of toluene
which are relevant for further consideration.
2.3 Calculation of Equilibrium Compositions
Reactions 1 and 2 as well as 2 and 3 are parallel reactions.
However, while reactions 1 and 3 are equilibrium reactions, reaction
2 essentially goes to completion. On the other hand, reactions 1 and
3 are consecutive types. As previously mentioned, the methylbenzenes
formed in these consecutive reactions undergo transalkylation reactions
28
with toluene to yield other methylbenzenes. Furthermore, these
methylbenzenes undergo isomerisation reactions.
In the calculations that follow, two separate situations will be
considered. Firstly, it is assumed that only toluene disproportionation
and subsequent isomerisation of the xylenes occur. Hydrodealkylation,
as well as the transalkylations is neglected. Secondly, toluene
disproportionation accompanied by isomerisations and transalkylations
of higher methylbenzenes is considered. Again hydrodealkylation is
left out. The first situation would be applicable in a case where a
highly selective catalyst is available so that only toluene dispropor
tionation and isomerisation of xylenes take place. The second is more
realistic because of the difficulty of finding such a selective
catalyst. In practical situations, satisfactory disproportionation
catalysts are also active for the isomerisations and, to a lesser
extent, for transalkylationsof methylbenzenes.
2.3.1 The disproportionation of toluene
Since the exact mechanism of the disproportionation of toluene is
unknown, it may be supposed that there are three disproportionation
reactions, one for the formation of each isomer of xylene:
2T J B + o-X
2T i B + m-X
2T J B + p-X
Since the experiments described in chapters 3 and 5 demonstrate that
the xylene isomers are in thermodynamic equilibrium, the system can
be represented by the following reactions:
2T J B + m-X 1
m-X J o-X 2
m-X I p-X 3
The following equilibrium relationships hold for these reactions:
Y, . Y 4 V _ b m-X
1 Y2 T
29
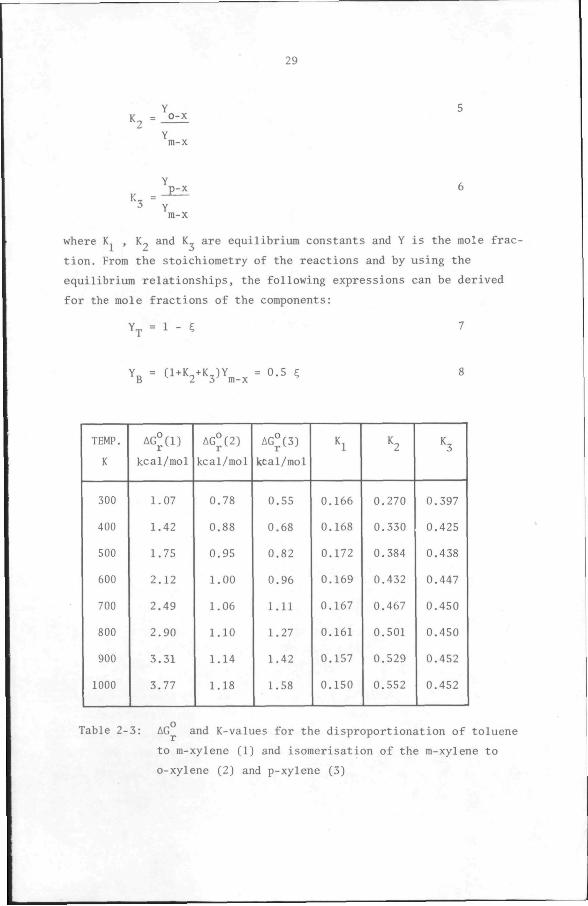
• 2
h-p-x
where K , K_ and K are equilibrium constants and Y is the mole frac
tion. From the stoichiometry of the reactions and by using the
equilibrium relationships, the following expressions can be derived
for the mole fractions of the components:
Y^ = 1 - C 7
Y3 = (1-K2^K3)Y^_^ = 0.5 C
TEMP.
K
300
400
500
600
700
800
900
1000
AG°(1)
kcal/mol
1.07
1.42
1.75
2.12
2.49
2.90
3.31
3.77
AG°(2)
kcal/mol
0.78
0.88
0.95
1.00
1.06
1.10
1.14
1.18
AG°(3)
kcal/mol
0.55
0.68
0.82
0.96
1.11
1.27
1.42
1.58
h
0.166
0.168
0.172
0.169
0.167
0.161
0.157
0.150
h
0.270
0.330
0.384
0.432
0.467
0.501
0.529
0.552
h
0.397
0.425
0.438
0.447
0.450
0.450
0.452
0.452
Table 2-3: AG and K-values for the disproportionation of toluene
to m-xylene (1) and isomerisation of the m-xylene to
o-xylene (2) and p-xylene (3)
30
TEMP.
K
300
400
500
600
700
800
900
1000
Toluene
conversion
51.2
52.1
52.8
53.0
53.1
52.8
52.7
52.3
Benzene
25.6
26.1
26 4
26.5
26.6
26.4
26.4
26.2
Toluene
48.8
47.9
47.2
47.0
46.9
47.2
47.3
47.7
o-xylene
4.1
4.9
5.6
6.1
6.5
6.8
7.0
7.2
m-xylene
15.4
14.8
14.5
14.1
13.8
13.5
13.3
13.0
p-xylene
6.1
6.3
6.3
6.3
6.2
6.1
6.0
5.9
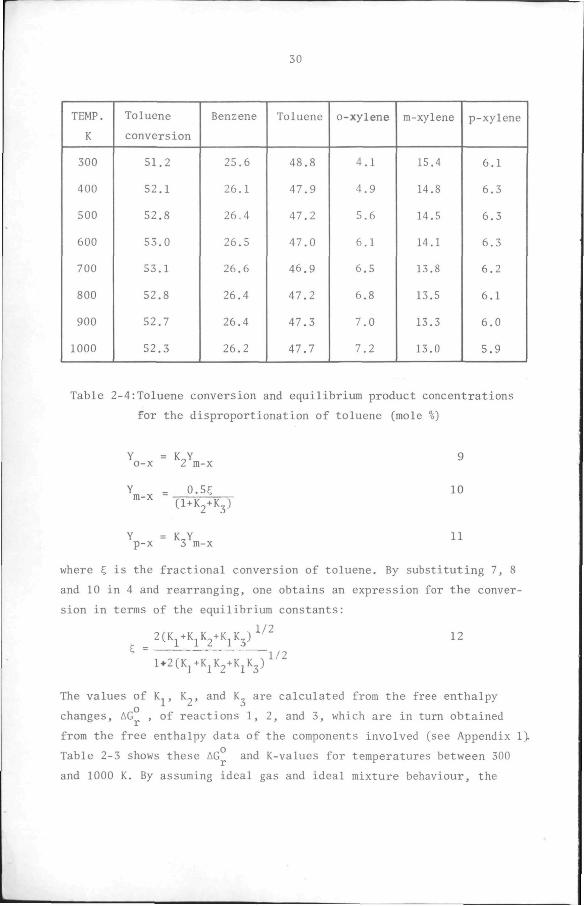
Table 2-4:Toluene conversion and equilibrium product concentrations
for the disproportionation of toluene (mole %)
Y = K„Y o-X 2 m-X
0.5C
9
10 (I+K2+K3)
Y = K^Y p-X 3 m-X
11
where E, is the fractional conversion of toluene. By substituting 7, 8
and 10 in 4 and rearranging, one obtains an expression for the conver
sion in terms of the equilibrium constants:
1/2
S = 2(K^+K^K2+KjK3)
1*2(K^+K^K2+K^K3)
12
1/2
The values of K., K_, and K are calculated from the free enthalpy
changes, AG , of reactions 1, 2, and 3, which are in turn obtained
from the free enthalpy data of the components involved (see Appendix 1).
Table 2-3 shows these AG and K-values for temperatures between 300
and 1000 K. By assuming ideal gas and ideal mixture behaviour, the
31
toluene conversion and the concentrations of the species present can
be calculated from equations 7-12 for any particular temperature,
as is shown in Table 2-4 for temperatures between 300 and lOOOK. This
table shows that the toluene conversion and the product distribution
do not vary much over the temperature range covered.
No.
1
2
3
4
5
6
7
8
9
10
11
Reaction
2(Toluene) j' Benzene + m-Xylene
m-Xylene j" o-Xylene
K, m-Xylene ^^ p-Xylene
Toluene+m-Xylene j'* Benzene+1,2,4-Trimethylbenzene
1,2,4-Trimethylbenzeit -*- 1,2,3-Trimethylbenzene
1,2,4-Trimethylbenzene j^ 1,3,5-Trimethylbenzene
1 Toluene+1,2,4-Trimethylbenzene j^ B+1,2,3,5-Tetramethylbenzene
1,2,3,5-Tetramethylbenzene j^ 1,2,3,4-Tetramethylbenzene
1,2,3,5-Tetramethylbenzene ^^ 1,2,4,5-TetramethyIbenzene
Toluene+l,2,3,5-Tetramethylbenzene j Benzene+Pentamethylbenzene
Toluene+Pentamethylbenzene i Benzene+Hexamethylbenzene
Table 2-5:Reactions in the disproportionation and transalkylation of
toluene.
32
2.3.2 The disproportionation and transalkylation of toluene:
In this case, toluene undergoes disproportionation as described
above as well as transalkylation with the methylbenzenes formed. The
possibility exists t'nat benzene and the twelve methylbenzenes will be
present at equilibrium. The reactions which can occur are summarized
in Table 2-5. The following equations can be written for the equili
brium constants of these reactions:
K. = Benzene.m-Xylene 1 2
(Toluene)
K_ = o-Xylene 2 m-Xylene
K_ = p-Xylene 3 m-Xylene
K. = Benzene.124-Trimethylbenzene 4
Toluene.m-Xylene
K_ = 123-Trimethylbenzene 5 124-Trimethylbenzene
K, = 135- Trimethylbenzene 6 124- Trimethylbenzene
K_ = Benzene.1235-Tetramethylbenzene 7 Toluene.124-Trimethylbenzene
K. = 1234-Tetramethylbenzene 8 1235-Tetramethylbenzene
Kg = 1245-Tetramethylbenzene 9 1235-Tetramethylbenzene
K. _= Benzene. Pentamethylbenzene 10 Toluene.1235-Tetramethylbenzene
K.,= Benzene.Hexamethylbenzene 11 Toluene.Pentamethylbenzene
In the equations above, the names of the components designate their
mole fractions. It is assumed that the reaction mixture is ideal so
that the fugacity and activity coefficients are both unity. Further
more, since each reaction consists of the same number of moles of
33
products as reactants, the total pressure does not enter into the
expressions for the equilibrium constants.
The eleven equations above contain thirteen variables. Two more
equations are required to define the system completely. These are the
methyl group and the phenyl group balances:
T+2(o-X+m-X+p-X)+3(123TMB+124TMB+135TMB)+4(1235TETRA
+1234TETRA+1245TETRA)+5(PENTA)+6(HEXA) = 1
B+T+o-X+'m-X+p-X+123TMB+124TMB+135TMB+
1235TETRA+1234TETRA+1245TETRA+PENTA+HEXA = 1
It is not possible to solve the thirteen equations above explicitly
for the mole fractions. They were solved numerically on an IBM 360/65.
To this end, equations 1-11 were rearranged to derive the mole frac
tions in terms of those of two independent components (180): m-xylene
and 1,2,4,-trimetlylbenzene. The expressions for the mole fractions of
benzene and toluene were obtained by combining equations 1 and 4, and
were substituted in the other equations above where necessary to derive
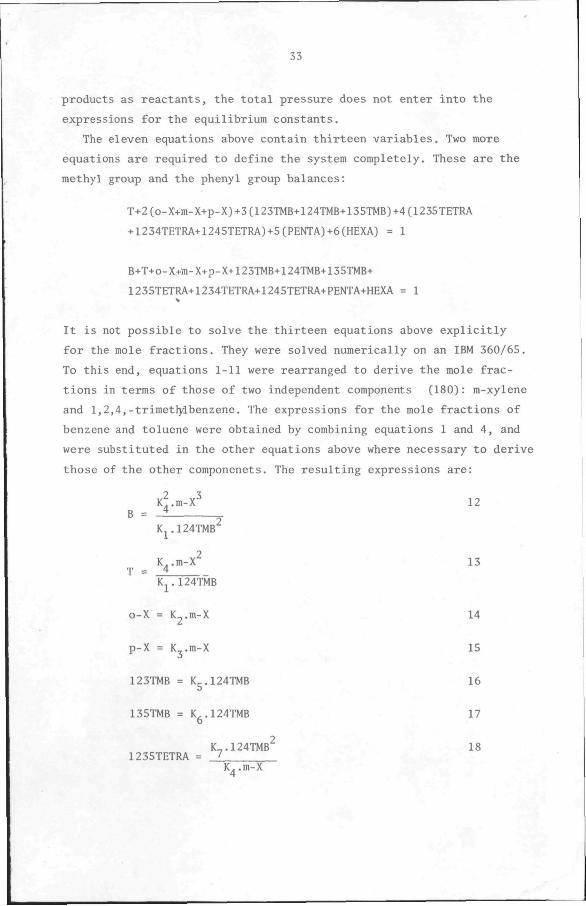
those of the other componenets. The resulting expressions are:
2 3 K^m-X 12
' - - 2 Kj.I24TMB
K,.m-X^ 13 J = _4
K^.124TMB
o-X = K2.m-X 14
p-X = K^.m-X 15
123TMB = Kg.l24TMB 16
13STMB = K^.124TMB 17 D K.,.124TMB 18
1235TETRA = _£ K^.m-X
34
K.,.Ko.l24TMB iq 1234TETRA = 7 S i»
K..m-X 4
K .K 124TMB^ 20 123i5TETRA =—^ ^
> K .m-X
K.,.K,„.124TMB^ 21 PENTA = '^' ^0
2 2 K^.m-X 4
K,„.K,,.K^.124TMB^ 22 HEXA = 1° ^1 '
3 3 K,.m-X- 4
Equations 12-22 were solved by assuming successive values for m-X and
124TMB, until the mass balance criteria (the conservation of the number
of methyl and phenyl groups) were fulfilled, the sum of the mole frac
tions then being unity. The standard free enthalpies of formation used
in the calculations are listed in Appendix 1. The results of the cal
culations are shown in Tables 2-6 and 2-7 and in Figure 2-2. The change
in free enthalpies, AG , and the equilibrium constants, of the reac
tions are given in Table 2-6. The results show that, as in disproportionation
alone, the equilibrium conversion and product distribution are not
strongly dependent on temperature.
The results obtained here are in statisfactory agreement, but not
identical, with those of Egan (177) and Hastings and Nicholson (176)
for the same problem. The difference in results is attributable to
differences in the standard free enthalpies, AG„, used. Hasting and
Nicholson used a method suggested by Kandiner and Brinkley (180) to
derive their equations. The discussion presented above demonptrates
that the same relationships, equations 12-22, can be derived analyti
cally and not simply by visual inspection as was done by Hastings and
Nicholson. Egan did not specify the equations used in his calculations.
The results obtained here may be considered an improvement over those
of Egan and Hastings and Nicholson in view of the more up-to-date free
enthalpy values used.
35
Temperature, K
Reaction
1
2
3
4
5
6
7
8
9
10
11
AG,
K
AG,
K
AG,
K
AG,
K
AG,
K
AG,
K
AG,
K
AG,
K
AG,
K
AG,
K
AG,
K
300
1.07
0.17
0.78
0.27
0.55
0.40
1.38
0.10
1.83
0.05
0.24
0.67
2.27
0.02
1.12
0.15
0.17
0.75
2.94
0.01
3.49
0.003
400
1.42
0.17
0.88
0.33
0.68
0.43
1.70
0.12
2.08
0.07
0.50
0.53
2.81
0.03
1.26
0.20
0.28
0.70
3.63
0.01
4.49
0.004
500
1.75
0.17
0.95
0.38
0.82
0.44
1.99
0.13
2.34
0.09
0.78
0.46
3.31
0.04
1.35
0.26
0.37
0.69
4.24
0.01
5.4
0.004
600
2.12
0.17
1.00
0.43
0.96
0.45
2.30
0.15
2.61
0.11
1.06
0.41
3.79
0.04
1.44
0.30
0.48
0.67
4.83
0.02
6.29
0.005
700
2.49
0.17
1.06
0.47
1.11
0.45
2.62
0.15
2.88
0.13-
1.35
0.38
4.24
0.05
1.50
0.34
0.60
0.65
5.37
0.02
7.14
0.005
800
2.90
0.16
1.10
0.50
1.27
0.45
2.95
0.16
3.16
0.14
1.64
0.36
4.69
0.05
1.56
0.37
0.72
0.64
5.90
0.02
8.00
0.007
900
3.31
0.16
1.14
0.53
1.42
0.45
3.29
0.16
3.43
0.15
1.93
0.34
5.12
0.06
1.61
0.41
0.84
0.63
6.41
0.03
8.82
0.007
1000
3.77
^.15
1.18
0.55
1.58
0.45
3.65
0.16
3.71
0.15
2.23
0.33
5.57
0.06
1.66
0.43
0.98
0.61
6.93
0.03
9.67
0.008
Table 2-6: AG O*-cal/mol) and K-values for the disproportionation
and transalkylation of toluene.
36
1 TEMPERATURE, K |
Toluene Conversion
Benzene
Toluene
1,2-Dimithyl benzen
1,3-Dimethyl benzene
1,4-Dimethyl benzene
1,2,3-Trimethyl benzene
1,2,4-Trimethyl benzene
1,3,5-Trimethyl benzene
1,2,3,4-Tetra methylbenzene
1,2,3,5-Tetra methylbenzene
1,2,4,5-Tetra methylbenzene
Pentamethyl benzene
Hexamethyl benzene
300
53.4
27.0
46.6
3.6
13.4
5.3
0.1
2.3
1.5
0,2
0.0
0.0
0.0
0.0
400
54.3
27.3
45.7
4.3
12.9
5.5
0.2
2.6
1.4
0.1
0.0
0.0
0.0
0.0
500
55.0
27.7
45.0
4.8
12.5
5.5
0.3
2.7
1.2
0.2
0.0
0.1
0.0
0.0
600
55.4
27.5
44.6
5.3
12.2
S.5
0.3
2.9
1.2
0.3
0.0
0.2
0.0
0.0
700
55.5
27.5
44.5
5.6
12.0
5.4
0.4
3.0
1.1
0.2
0.1
0.2
0.0
0.0
800
55.4
26.9
44.6
6.0
11.9
5.4
0.4
3.1
1.1
0.3
0.1
0.2
0.0
0.0
900
55.2
27.3
44.8
6.1
11.6
5.2
0.4
3.0
1.0
0.3
0.1
0.2
0.0
0.0
1000
55.5
27.5
44.5
6.3
11.4
5.1
0.5
3.1
1.0
0.3
0.1
0.2
0.0
0.0
Table 2-7:Toluene conversion and equilibrium product concentrations
for the disproportionation and transalkylation of toluene
(mole %)
37
400 600 800 1000 Temperature . K
Figure 2-2 Toluene conversion and equilibrium composition
o Toluene conversion
• Benzene;x Toluene;V o-Xylene;* m-Xylene
• p-Xylene;A 1, 2, 4-Trimethylbenzene;
• 1, 3 , 5-Trimethylbenzene
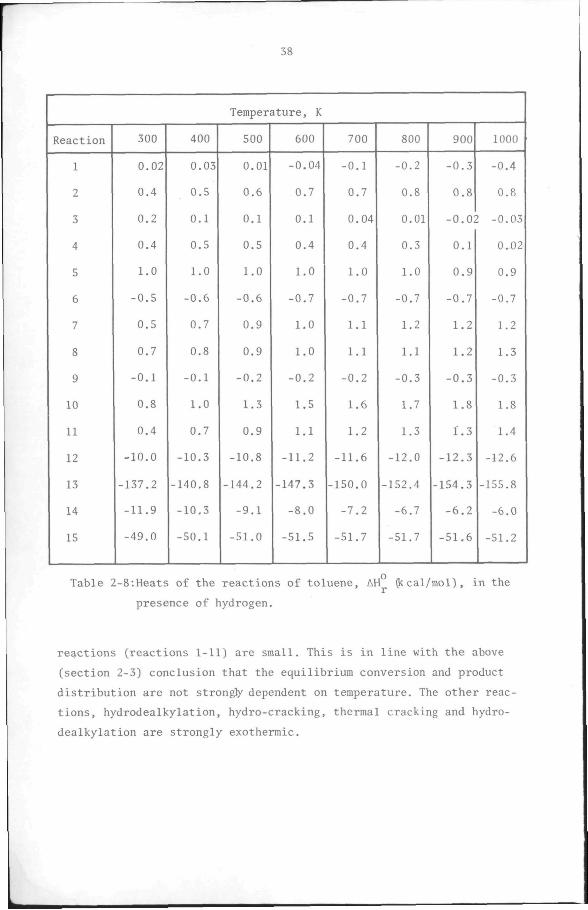
2.4. Heat of reaction
The heat effects of the disproportionation, isomerisation and trans
alkylation reactions(l-ll) listed in Table 2-5 are shown in Table 2-8.
Reactions 12-15 in Table 2-8 are, respectively, the hydrodealkylation
of toluene, the hydro-cracking of toluene to methane, the thermal
cracking of toluene to carbon and hydrogen, and the hydrogenation of
toluene to methylcyclohexane. The standard enthalpies of formation of
the components are shown in Appendix 1. Table 2-8 shows that the heat
effects of the disproportionation,isomerisation and transalkylation
38
Temperature, K
Reaction
1
2
3
4
5
6
7
8
9
10
11
12
13
14
15
300
0.02
0.4
0.2
0.4
1.0
-0.5
0.5
0.7
-0.1
0.8
0.4
-10.0
-137.2
-11.9
-49.0
400
0.03
0.5
0.1
0.5
1.0
-0.6
0.7
0.8
-0.1
1.0
0.7
-10.3
-140.8
-10.3
-50.1
500
0.01
0.6
0.1
0.5
1.0
-0.6
0.9
0.9
-0.2
1.3
0.9
-10.8
-144.2
-9.1
-51.0
600
-0.04
0.7
0.1
0.4
1.0
-0.7
1.0
1.0
-0.2
1.5
1.1
-11.2
-147.3
-8.0
-51.5
700
-0.1
0.7
0.04
0.4
1.0
-0.7
1.1
1.1
-0.2
1.6
1.2
-11.6
-150.0
-7.2
-51.7
800
-0.2
0.8
0.01
0.3
1.0
-0.7
1.2
1.1
-0.3
1.7
1.3
-12.0
-152.4
-6.7
-51.7
900
-0.3
0.8
-o.o;
0.1
0.9
-0.7
1.2
1.2
-0.3
1.8
1.3
-12.3
-154.3
-6.2
-51.6
1000
-0.4
0.8
I -0.03
0.02
0.9
-0.7
1.2
1.3
-0.3
1.8
1.4
-12.6
-155.8
-6.0
-51.2
Table 2-8:Heats of the reactions of toluene, AH J: cal/mol), in the
presence of hydrogen.
reactions (reactions 1-11) are small. This is in line with the above
(section 2-3) conclusion that the equilibrium conversion and product
distribution are not strongfy dependent on temperature. The other reac
tions, hydrodealkylation, hydro-cracking, thermal cracking and hydro
dealkylation are strongly exothermic.
39
2.5. Conversion, Selectivity and Yield of the disproportionation of
toluene
The conversion of toluene, the selectivity of the disproportionation
reaction and the yield of required products are important parameters
for judging the performance of disproportionation catalysts and in
studying the kinetics of the reaction. Furthermore, they determine the
amount of heat evolved or absorbed during the reaction.
2.6.1 Feed consisting of toluene and hydrogen
As was demonstrated at the end of section 2.2, the reaction prod
ucts obtained from a feed consisting of toluene and hydrogen in the
experiments described in chapters 3 and 5 can be completely accounted
for by solely considering disproportionation, hydrodealkylation and
transalkylation reactions, viz. the disproportionation of toluene, the
hydrodealkylation of toluene and the transalkylati'on of toluene and
xylenes (reactions 1, 2 and 3 in Table 2-1) as well as the dispropor
tionation of xylenes and the hydrodealkylation of the xylenes and
trimethylbenzenes formed in the afore-mentioned reactions. Thus, under
the conditions of the experiments, the following reactions are probable
-*-1
2
3
4
5
2X t T+TMB 6
where T,B,X,TMB and M designate toluene, benzene, xylenes, trimethyl
benzenes and methane. When considering the thermodynamics of the dis
proportionation of toluene, reactionsI,2 and 3 are sufficient to ac
count for the six species present in the products of the experiments
described in chapters 3 and 5, since reactions 4,5 and 6 can be derived
2T ^ B+X
T+H^ ^ B+M
T+X J
X+H^
TMB+H^
B+TMB
^ T+M
^ X+M
40
from 1,2 and 3. When dealing with rate problems, however, such as the
calculation of the selectivity for one of the above reactions, all six
reactions need to be considered simultaneously, at least in principle,
since, because of their individual rates, all six reactions may occur
at the same time. Nevertheless, under the conditions of the experiments
described in chapters 3 and 5 and where only toluene and hydrogen were
present in the feed, the yield of xylenes and trimethylbenzenes were
small in comparison with the concentration of toluene. Therefore,
reactions 4,5 and 6 were neglected.
If Y stands for the mole fraction of a particular component in the
reaction product, it can be derived (see Appendix 2) that the conver
sion of toluene is given by:
(Y,+Y +Y^ , )100 ^ b X tmb- „
" (YK+Y^+Y +Y, , ) "'' b t X tmb
the disproportionation selectivity by:
2(Y +Y^ u)100 _ X tmb^ o ^ ' (Y.+Y +Y^ , °
b X tmb
and the yield of disproportionation products by:
2(Y +Y^ u)100 _ X tmb^ ^ D (Y,+Y^+Y +Y^ , ) °
b t X tmb-
2.5.2 Feed consisting of benzene, toluene, xylenes and hydrogen
As was previously stated, under certain conditions some or all of
the reactions which were neglected in the above derivations of conver
sion, selectivity and yield must be considered. One such condition is
when benzene and/or xylenes are present along with toluene and hydrogen
in the feed (see chapter 5). Analysis of the reaction products of the
experiments described in chapter 5 with feeds consisting of hydrogen
and mixtures of the aromatics showed that only a negligible amount of
methane was formed and that this amount could be completely accounted
for by solely considering the hydrodealkylation of toluene. The reactions
41
which must be considered are, therefore, reactions 1,2,3 and 6 above.
It is , however, impossible to derive the selectivity for the dispro
portionation reaction and the yield of the disproportionation products
in terms of the mole fractions of the components present in the products
by considering these four reactions simultaneously, because it is im
possible to distinguish by analytical techniques between trimethylben
zenes formed by reactions 3 and 6. Data on the rates of these reactions
over the catalyst used in the experiments of chapter 5 are needed in
order to decide whether reaction 3 or 6 is the most probable under the
conditions of the experiments described in that chapter.
Since no such rate data are available, an experiment was performed
using the apparatus described in chapter 5. The conditions and results
of the experiment are summarized in Appendix 9. The choice of flow rates
in the two experiments shown in Table 5-11 ensured that the two aromat
ics mixtures had the same number of methyl groups per phenyl group and,
therefore, the same equilibrium compositions. The choice of reaction
pressure gave the same xylene partial pressure (0.17 atm) in both feeds.
The fact that roughly as much trimethylbenzenes were formed with mix
tures 1 and 2 indicates that under the conditions of the experiments
reaction 6 is favoured over 3. On the strength of these results it was
concluded that reaction 6 was more likely than reaction 3. Using reac
tions 1,2 and 6 and similar notations as in section 2.5.1 and using V
to represent the average number of methyl groups per phenyl group in
the feed and K to represent the mole ratio of xylenes and toluene in
the feed, one can derive (see Appendix 2) that when the feed contains
benzene, toluene, xylenes and hydrogen, the conversion of toluene is
given by:
((Y.+Y^+Y +Y^ ,)V-Y^(1+2K))100 ^ b t X tmb' t^ ^ 5,
^ " (Y,+Y^+Y +Y^ , )V '° ' ^ b t X tmb-
the disproportionation selectivity by:
((2Y +4Y^ , )(1 + 2K)-2VK(Y,+Y^+Y +Y^ ,))100 q _ X tmb-^ ' *• b t X tmb- - ,.
(Yv+Y^+Y +Y^ u)V-Y^ (1 + 2K) ^ b t X tmb" X.
42
and the yield of disproportionation products by:
° " f b ^ V mb ^
when the feed contains only hydrogen, toluene and benzene, the corres
ponding quantities are:
((Y,+Y^+Y +Y^ , )V-Y^)100 ^ b t X tmb^ t- „
C = (Y,+Y^+Y +Y^ , )V b t X tmb'
(2Y +4Y^ u)100 ^ ^ X tmb
((Y,+Y,+Y +Y, v,)V-Y ) b t X tmb t-
(2Y^MY^^,)100 ^
D - ((Yb^Y^.Y^.Y^^^)V) '»
When the feed contains only hydrogen, toluene and xylenes , the corres
ponding quantities are:
(CY,^Y^.Y^.Y^^^)(2-V)-Y^)100 ^
(Y,+Y^+Y Y^ , )(2-V) b t X tmb" -
(2Y +4Y^ ,-2(Y,+Y,+Y +Y, ,)(V-1))100 X tmb ^ b t X tmb '- •"' „
S = (^b^\^V\mbn2-V)-Y,)
Y (^V^^mb-^V^-V\mb^^^-^»^°V D- (Y^.Y^.^.Y^^j^)(2-V)
The expressions for the conversion, selectivity and yield for the
reaction of a feed consisting of toluene and hydrogen only is obtained
by substituting K = 0 and V = 1 in the appropriate relationships
above: (Y.+Y +Y^ ,)100 b X tmb J,
" (Y,+Y^+Y +Y^ , ) "" b t X tmb^
(2Y +4Y^ u)100 ^ X tmb (Y,+Y +Y^ , ) b X tmb
(2Y +4Y^ u)100 ^ X tmb
43
2.6 Conclusions
The stability diagram, Figure 2-1, shows that disproportionation is
equilibrium limited;hydrodealkylation, hydrocra:king and thermal cacking
are not. Ringhydrogenation is also equilibrium limited. At high hydro
gen/toluene ratios and low temperatures this reaction is likely to
become a competing reaction. A selective catalyst is therefore needed
in order to accelerate disproportionation at the expense of the other
reactions.
Even in the presence of such a highly selective catalyst, isomeri
sations and transalkylations are likely to occur along with the dis
proportionation of toluene. If only the disproportionation reaction
and the isomerisation of xylenes are considered, it is seen that the
equilibrium conversion is not strongly dependent on temperature and
has an average value of 52.5%. When the formation of the twelve methyl
benzenes by transalkylation reactions coupled with isomerisations is
considered, the equilibrium conversion increases to an average value
of 55% but remains still weakly dependent on temperature.
Disproportionation, isomerisations and transalkylations have small
heats of reaction. On the other hand, hydrodealkylation, cracking and
hydrogenation are highly exothermic.
Finally, relationships for toluene conversion, selectivity for the
disproportionation reaction and the yield of disproportionation pro
ducts have been derived in terms of the mole fractions of the components
present in theproducts by setting up chemical reactions which account
for the components present in these reaction products and then making
a mass balance. These relationships will be used in the ahalysis and
interpretation of the experimental results of chaptffs 3 and 5. The fact
that the expressions derived for the conversion, selectivity and yield
using reactions 1,2 and 3 are different from those obtained with 1,2
and 6 demonstrates the importance of the selectivity of the catalyst.
The set of reactions which take place determines the mathematical form
of the relationships derived for the conversion, selectivity and yield.
However, for the two sets of reactions considered above, the differen
ces in the relationships derived (see Appendix 2) are significant only
44
if trimethylbenzenes are formed in appreciable quantities.
In the experiments described in chapters 3 and 5, the relationships
derived above using reactions 1,2 and 3 are applied to analyse the
results in which no benzene or xylenes are present in the feed, the
assumption being that the high concentration of toluene would favour
reaction 3. The results of the experiments in which either benzene or
xylenes are present in the feed (chapter 5) are analysed with the rela
tionships derived above using reactions 1,2 and 6. It is assumed that,
under the conditions of the latter experiments, reaction 6 is more
probable than reaction 3.
45
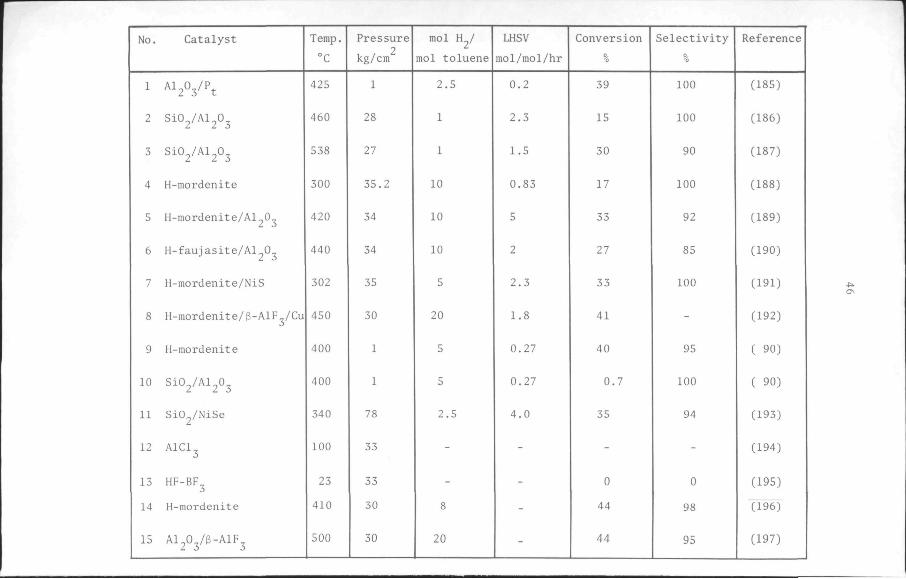
C H A P T E R 3
CATALYST PREPARATION AND TEST OF CATALYTIC PERFORMANCE
3.1 Introduction
Among the catalysts which have been claimed for the disproportion
ation of toluene are halides (70-76,78) such as aluminium chloride and
borontrifluoride-hydrogen fluoride, oxides (80,82,83,85,86), like
silica-alumina, silica-magnesia and silica-boria, and zeolites (87-94,
100, 118,121), such as faujasite and mordenite. While the halide
catalysts are normally used for the liquid phase reaction, the vapour
phase reaction is carried out over the metal oxide or zeolite catalysts.
The liquid phase reaction catalysed by halides has very low selec
tivity towards toluene disproportionation and is, therefore, unsatis
factory for this process. Various authors ascribe this low selectivity
to the following factors: the higher stability and basicity of
m-xylene relative to o-xylene and p-xylene, the faster rate of iso
merisation of both o-xylene and p-xylene to m-xylene than that of
m-xylene to the other isomers, and to the fact that a-complexes between
m-xylene and highly acidic halide catalysts are more stable than those
of the other isomers (75,76,79). One of the effects of these factors
is the presence at equilibrium of more m-xylene in the catalyst phase
at low temperatures than corresponds to thermodynamic equilibrium be
tween the three xylenes. At higher temperatures, enough energy is
available to make the o-complex less stable and to cause the m-xylene
to undergo not only isomerisation but also disproportionation and
transalkylation (with toluene). The two last-mentioned reactions de
crease the selectivity of the disproportionation of toluene.
The results of several studies (88,89,90) and the claims in patents
(84, Table 3-1) show that zeolites make better disproportionation cata
lysts than silica-aluminas. Among the zeolites mordenite possesses the
highest activity for this reaction (88,90). However, its activity de
teriorates rapidly as the reaction progresses. Faujasite, which has a
good activity, also suffers from too rapid a loss of activity (91).
No. Catalyst
1 Al^Oj/P^
2 SiO^/Al^Oj
3 S1O2/AI2O3
4 H-mordenite
5 H-mordenite/Al 0
6 H-faujasite/Al^Oj
7 H-mordenite/NiS
8 H-mordenite/e-AlF /Cu
9 H-mordenite
10 SiO^/Al^O^
11 SiO /NiSe
12 AlCl^
13 HF-BFj
14 H-mordenite
15 Al^Oj/B-AlFj
Temp.
°C
425
460
538
300
420
440
302
450
400
400
340
100
23
410
SCO
Pressure
kg/cm
1
28
27
35.2
34
34
35
30
1
1
78
33
33
30
30
mol H^/
mol toluene
2.5
1
1
10
10
10
5
20
5
5
2.5
-
-
8
20
LHSV
mol/mol/hr
0.2
2.3
1.5
0.83
5
2
2.3
1.8
0.27
0.27
4.0
-
-
-
-
Conversion
%
39
15
30
17
33
27
33
41
40
0.7
35
-
0
44
44
Selectivity 0 0
100
100
90
100
92
85
100
-
95
100
94
-
0
98
95
Reference
(185)
(186)
(187)
(188)
(189)
(190)
(191)
(192)
( 90)
( 90)
(193)
(194)
(195)
(196)
(197)
16 H-faujasite/P^
17 H-mordenite/Ag
18 Si02/Al203/Cr202
19 ^^0^/kl^Q^/Cr^Q^
20 Y-zeolite/Cr20
21 B^O^/Al^Oj/Pt
22 B^Oj/Al^Oj/Pd
23 B^O^/Al^O^/Ni
24 B^Oj/Al^O^/SnO/Pd
25 B^Oj/Al^Oj/SnO/Ni
26 Y-zeolite/Cr'^"
27 Mordenite/MnO /
SnO/Cr ""
28 Mordenite/MnO / 4 +
SnO/V^
29 NiY/SiO^/Al^Oj/
CoO/MoO
30 H-mordenite/CoS
Table :
480
400
566
538
538
538
538
538
538
538
538
483
483
480
280
33
67
28
56
56
28
28
28
56
56
56
35
35
21
53
5.1. Catalysts used
10
23
2
2
1.2
3.0
3.0
3.0
3.0
3.0
1.2
2.0
2.0
3.8
4
for the dis
8
-
1
1
1
1
1
1
0.5
0.5
1
1
1
1
1.7
30
21
14
20
29
36
27
21
42
48
29
57
56
43
50
100
100
64
72
90
88
93
96
46
50
90
100
100
100
100
jroportionation of toluene.
(190)
(198)
(203)
(203)
(203)
(200)
(200)
(200)
(200)
(200)
(201)
(201)
(201)
(199)
(202)
48
Studies (92,93,94,100) have shown that combining mordenite with alu
minium fluoride and copper results in an improvement of its selectivity
and stability for the reaction. It may therefore be expected that
aluminium fluoride and copper would have a similar effect on the per
formance of faujasite for the same reaction. The method of preparation
of a toluene disproportionation catalyst, based on a faujasite-type
zeolite, NaY, combined with g-aluminium fluoride and copper, is des
cribed in the next section. Afterwards, the activity of the catalyst,
measured in terms of the conversion of toluene, and the selectivity
of the reaction for the disproportionation of toluene, are presented
as a function of the time the catalyst is in use and compared with the
same quantities determined for other catalysts. Data on the effects
of catalyst composition and activation procedure on the performance
of the catalyst are also presented. The influence of the reaction con
ditions such as pressure, temperature and space velocity will be dis
cussed in chapter 5 along with the kinetics of the reaction.
3.2 Experimental
Materials. The toluene, analytical grade, was used without further
purification. However, precautions were taken to prevent it from coming
into contact with the atmosphere in order to avoid contamination with
oxygen and water vapour. The hydrogen, of chemically pure quality, was
purchased commercially, dried over molecular sieve 3A and passed over
reduced copper oxide (BASF R3-11 BTS) catalyst to remove traces of
oxygen.
The sodium Y zeolite, SK-40, was purchased from Union Carbide Cor
poration in the form of pellets with binder and as a powder without
binder. Other chemicals (copper nitrate, aluminium chloride, ammonium
chloride and ammonium fluoride) were reagent grade products purchased
commercially. The two silica-aluminas, which were studied along with
the zeolite-based catalysts, were obtained from AKZO Chemie (Ketjen,
Amsterdam). The first, LAL5P, is a low-alumina (15% alumina) sample
which had been subjected to steam treatment by the manufacturer. The
second, LAL3P, is similar to the first type, except that it was not
49
treated with steam. The hydrogen mordenite, Zeolon 100, was obtained
from Norton Company, U.S.A.
Preparation of catalysts. The silica-aluminas and the hydrogen mor
denite were used without further treatment. The ammonium form of the
above Y zeolite was prepared by exchanging the Na ions in SK-40 for
NH ions by three successive immersions of the SK-40 (25 g) in a
2.23N NH CI solution (250 ml). During each exchange, the resulting
slurry was heated under reflux for 2 hours, with thorough stirring.
After the final exchange the zeolite was filtered off, washed free of
chloride and sodium ions with deionized water and then dried overnight
in an oven at 110 C. Analysis of the NH.Y zeolite by atomic absorption
spectrophotometry showed that the unit cell composition had changed to
Na. ,(NH ) (AlO )^,(SiO )j^^.nH 0. This corresponds to a level of
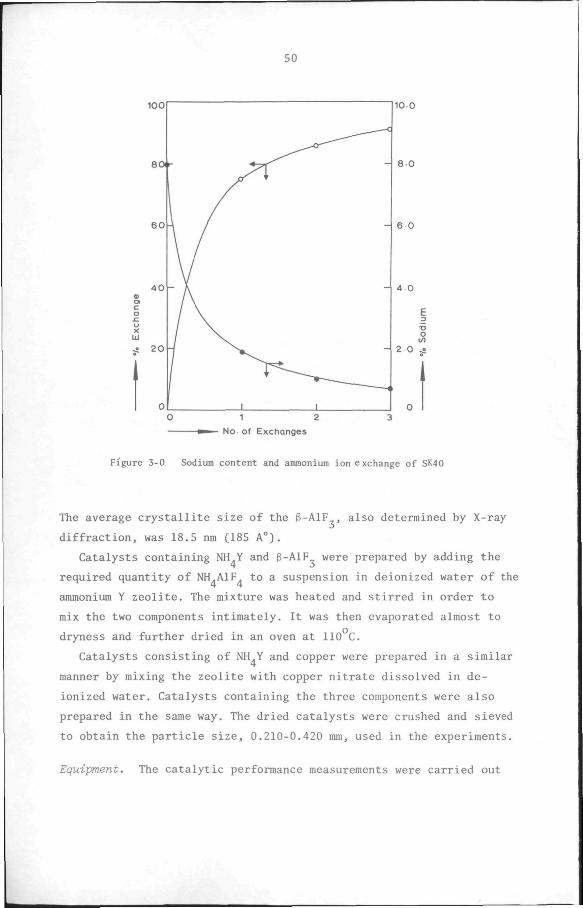
ammonium exchange of 91.8%. Figure 3-0 shows the sodium content and the
level of ammonium ion exchange as a function of the frequency of treat
ment. A higher level of exchange was not attempted in order not to
damage the crystalline structure of the zeolite.
The 6-AlF was prepared by a double decomposition reaction between
solutions, in deionized water, of stoichiometric quantities of aluminium
chloride (120.7 AlCl .6H 0 in 250 ml) and ammonium fluoride
(55.6 NH.F in 150 ml). The resulting solution, clear presumably as a
result of the preponderance of the soluble a-form of aluminium fluoride,
was partially evaporated and allowed to stand for two days. During this
time a white precipitate was formed. This precipitate was filtered off,
washed with cMonized water and dried in an oven at 110 C. X-ray dif
fraction analysis showed that it was ammonium aluminium fluoride,
NH AlF , formed according to the equations 4NH F + AlCl -*•
NH.AIF. + 3NH.C1. Chemical anylysis also showed that it was contamin-4 4 4 ^ •'
ated with excess ammonia and about 0.5 w% chloride. After calcination
at 500 C for 24 hours chemical analysis showed it to be free of
ammonium ions. X-ray diffraction analysis of the residue confirmed
that it was pure g-AlF , formed according to:
NH.AIF^ -> B-AIF, + NH. + HF 4 4 3 3
50
100
J 20
1 2 No of Exchanges
Figure 3-0 Sodium content and ammonium ion exchange of SK40
The average crystallite size of the 6-AlF , also determined by X-ray
diffraction, was 18.5 nm (185 A°).
Catalysts containing NH Y and 6-AlF were prepared by adding the
required quantity of NH AlF to a suspension in deionized water of the
ammonium Y zeolite. The mixture was heated and stirred in order to
mix the two components intimately. It was then evaporated almost to
dryness and further dried in an oven at 110 C.
Catalysts consisting of NH Y and copper were prepared in a similar
manner by mixing the zeolite with copper nitrate dissolved in de
ionized water. Catalysts containing the three components were also
prepared in the same way. The dried catalysts were crushed and sieved
to obtain the particle size, 0.210-0.420 mm, used in the experiments.
Equipment. The catalytic performance measurements were carried out
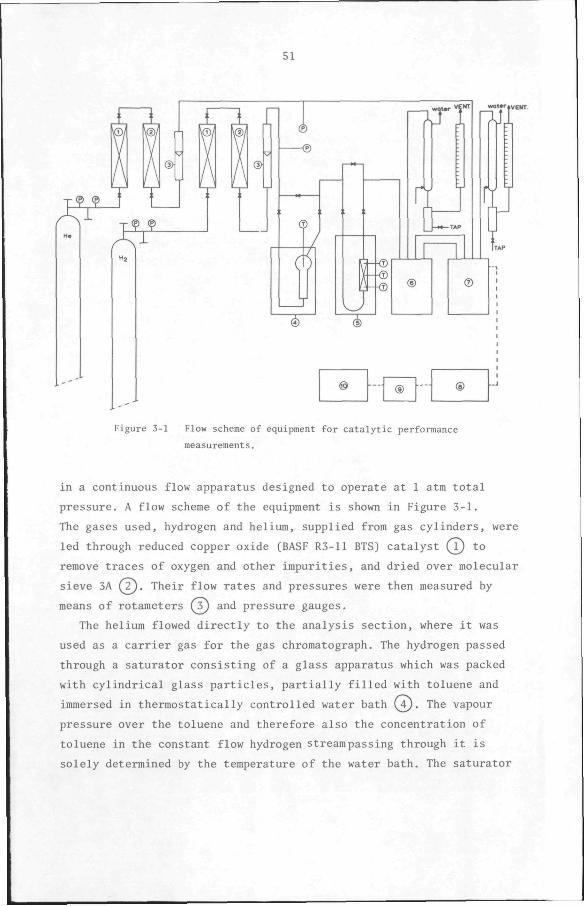
51
© ®
Figure 3-1 Flow scheme of equipment for catalytic performance
measurements.
in a continuous flow apparatus designed to operate at 1 atm total
pressure. A flow scheme of the equipment is shown in Figure 3-1.
The gases used, hydrogen and helium, supplied from gas cylinders, were
led through reduced copper oxide (BASF R3-11 BTS) catalyst (T) to
remove traces of oxygen and other impurities, and dried over molecular
sieve 3A (7). Their flow rates and pressures were then measured by
means of rotameters fs) and pressure gauges.
The helium flowed directly to the analysis section, where it was
used as a carrier gas for the gas chromatograph. The hydrogen passed
through a saturator consisting of a glass apparatus which was packed
with cylindrical glass particles, partially filled with toluene and
immersed in thermostatically controlled water bath Q4_). The vapour
pressure over the toluene and therefore also the concentration of
toluene in the constant flow hydrogen streampassing through it is
solely determined by the temperature of the water bath. The saturator
52
was calibrated in order to verify that its efficiency was constant
under the conditions of the experiments. To this end, the saturator
effluent was channelled through a trap immersed in liquid nitrogen and
the amount of toluene collected in a known period of time was weighed.
The results showed that the efficiency of the saturator was constant
for the duration of the experiments.
The hydrogen-toluene reactant stream then flowed through a heated
copper tube to the stainless steel reactor (20 cm long, 0.8 cm internal
diameter), which was placed in the middle of cylindrical electrical
oven (¥). The catalyst was kept in place by a sintered steel plate on
either end of the reactor. The temperature of the reactor was measured
by means of chromel-alumel thermocouples placed at three different
positions along the axis of the catalyst bed and was registered on a
Philips twelve-point recorder. It was constant within +_ 2°C.
The reactor effluent flowed to sampling valve (6), where a sample
was taken for analysis, and then to a water-cooled condenser where the
condensable components were separated. The non-condensables, mainly
hydrogen and some methane, were vented through a soap-film meter, with
which the flow rate of the gas leaving the system was measured.
Analysis. The sample taken above was carried in the helium gas stream,
flowing at 66 ml/min., into gas chromatographic column KjJ• The column
was made of a copper tubing (3 m long, 4 mm I.D. and 6 mm O.D.) and'
packed with chromosorb W impregnated with bentone and diisodecyl-
phthalate. The components in the column effluent were detected in a
catharometer connected to wheatstone bridge(8^. The signal from the
catharometer was electronically integrated by means of analog
integrator(9) before being registered on Hitachi-Perkin Elmer model 159
recorder (lO) . The sampling valve and the column with the catharometer
were maintained at 90°C by means of a thermostatically controlled air
bath.
The mole fractions of the components were calculated from the elec
tronically integrated peak areas by the method of internal normalisa
tion in which toluene was used as the internal standard. With these
mole fractions the conversion and selectivity were calculated using the
relationships derived in chapter 2.(see also Appendix 5).
53
Proaedure. The reactor was filled with catalyst and the system was
then tested under 2 atm hydrogen pressure to ensure that it was leak-
proof. After the pressure was reset to 1 atm, the hydrogen flow rate
was adjusted to 60 ml/min. The catalyst was activated by heating the
reactor from room temperature to 230°C at the rate of 1°C per minute
and holding it at this temperature for 2 hours. The temperature was
then increased to 500°C at the rate of 2''C per minute and held at this
temperature until a total of 24 hours had elapsed from the beginning
of the activation period.
At the end of the catalyst activation, the system was brought to
the standard conditions used to compare the activities of the cata
lysts. These standard conditions are shown in Table 3.2.
Reactor temperature
Reactor pressure
Reactor volume
Hydrogen flow-rate
Toluene flow-rate
Hydrogen/Toluene mole ratio
Saturator temperature
Toluene vapour pressure
Apparent residence time in the reactor
Particle size of catalyst
Liquid hourly space velocity
W/F
500 *_ 2°C
1 atm. absolute
10.4 cm^(L=20cm,I
0.590 ml/s (STP)
1.58 X 10'^ mol/s
16.7
33.9°C
0.056 atm
6 sees
0.210-0.420 mm
0.06 hr"^
859 g.cat.hr/mol.
.D.=0.8cm)
toluene
Table 3.2 Standard conditions for catalytic activity
measurements.
3.3 Results and Discussion
The toluene disproportionation activity and selectivity of the
HY zeolite obtained by activation of ammonium Y zeolite is shown in
Figure 3.2. The activity goes through a maximum at about 3 hours
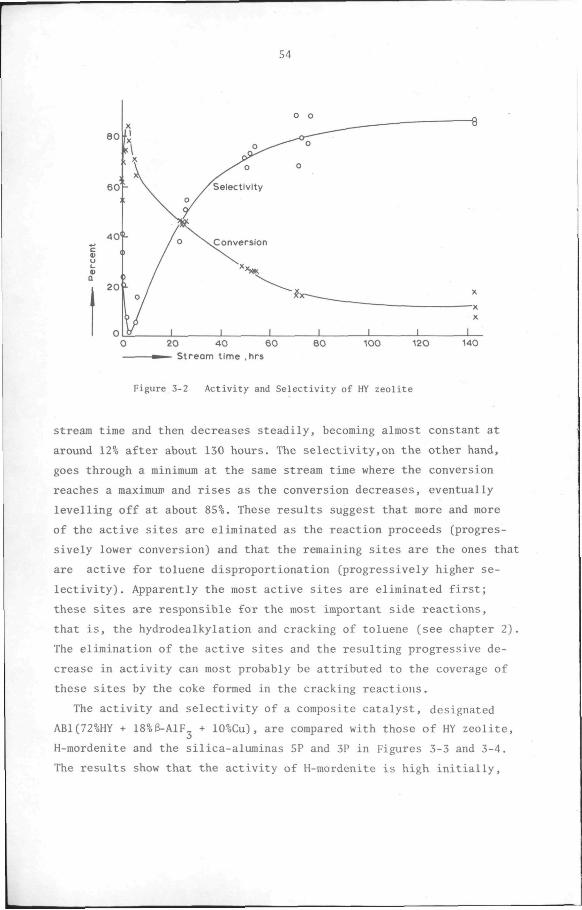
54
n l p I I I I I 1 L_ 0 20 40 60 80 100 120 140
^ — Streom time ,hrs
Figure 3-2 Activity and Selectivity of HY zeolite
stream time and then decreases steadily, becoming almost constant at
around 12% after about 130 hours. The selectivity,on the other hand,
goes through a minimum at the same stream time where the conversion
reaches a maximum and rises as the conversion decreases, eventually
levelling off at about 85%. These results suggest that more and more
of the active sites are eliminated as the reaction proceeds (progres
sively lower conversion) and that the remaining sites are the ones that
are active for toluene disproportionation (progressively higher se
lectivity) . Apparently the most active sites are eliminated first;
these sites are responsible for the most important side reactions,
that is, the hydrodealkylation and cracking of toluene (see chapter 2).
The elimination of the active sites and the resulting progressive de
crease in activity can most probably be attributed to the coverage of
these sites by the coke formed in the cracking reactions.
The activity and selectivity of a composite catalyst, designated
AB1(72%HY + 18%e-AlF + 10%Cu), are compared with those of HY zeolite,
H-mordenite and the silica-aluminas 5P and 3P in Figures 3-3 and 3-4.
The results show that the activity of H-mordenite is high initially,
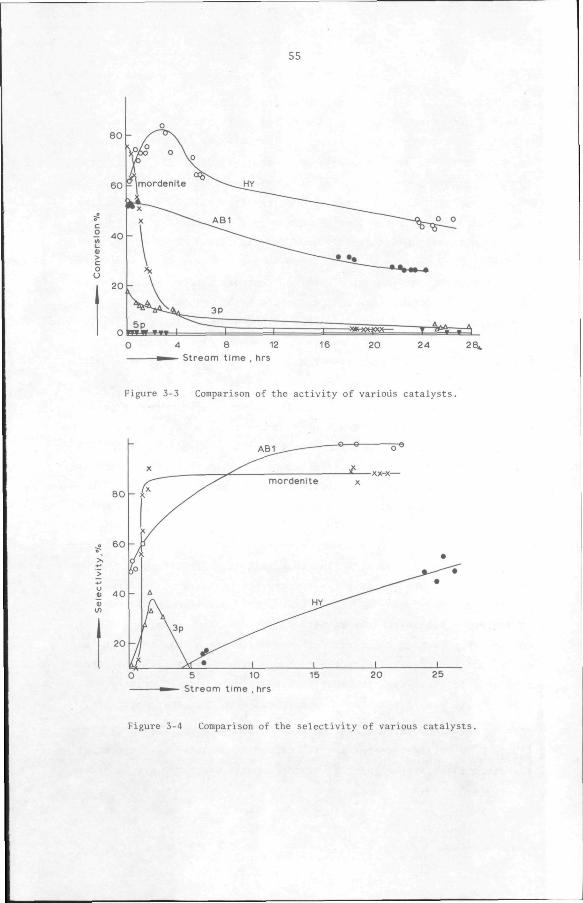
55
4 8 12 — stream time , hrs
16 20 24 28..
Figure 3-3 Comparison of the activity of various catalysts.
5 10
— Stream time , hrs
Figure 3-4 Comparison of the selectivity of various catalysts.
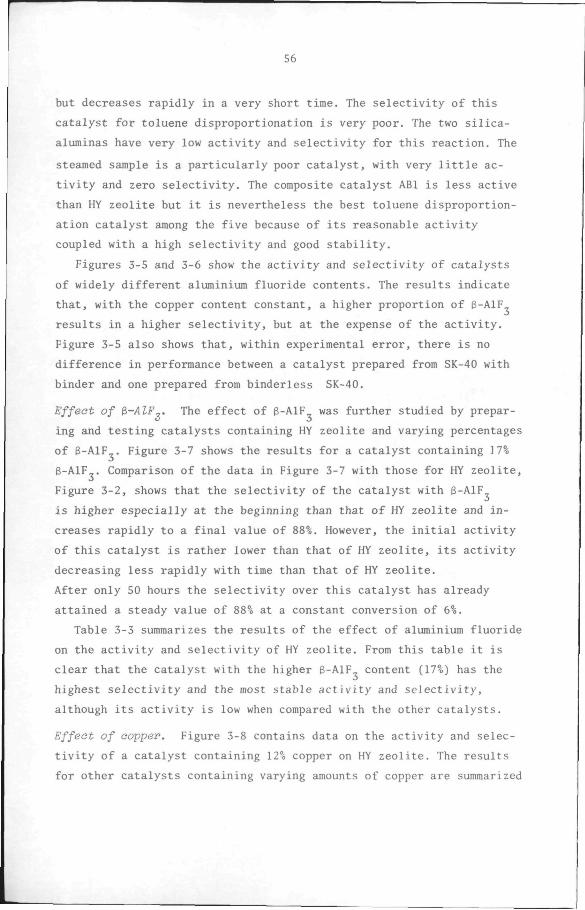
56
but decreases rapidly in a very short time. The selectivity of this
catalyst for toluene disproportionation is very poor. The two silica-
aluminas have very low activity and selectivity for this reaction. The
steamed sample is a particularly poor catalyst, with very little ac
tivity and zero selectivity. The composite catalyst ABl is less active
than HY zeolite but it is nevertheless the best toluene disproportion
ation catalyst among the fj.ve because of its reasonable activity
coupled with a high selectivity and good stability.
Figures 3-5 and 3-6 show the activity and selectivity of catalysts
of widely different aluminium fluoride contents. The results indicate
that, with the copper content constant, a higher proportion of B-AIF
results m a higher selectivity, but at the expense of the activity.
Figure 3-5 also shows that, within experimental error, there is no
difference m performance between a catalyst prepared from SK-40 with
binder and one prepared from bmderless SK-40.
Effect of &-AlF^. The effect of B-AIF was further studied by prepar-o 3
ing and testing catalysts containing HY zeolite and varying percentages
of g-AlF . Figure 3-7 shows the results for a catalyst containing 17%
B-AIF . Comparison of the data in Figure 3-7 with those for HY zeolite,
Figure 3-2, shows that the selectivity of the catalyst with g-AlF
IS higher especially at the beginning than that of HY zeolite and in
creases rapidly to a final value of 88%. However, the initial activity
of this catalyst is rather lower than that of HY zeolite, its activity
decreasing less rapidly with time than that of HY zeolite.
After only 50 hours the selectivity over this catalyst has already
attained a steady value of 88% at a constant conversion of 6%.
Table 3-3 summarizes the results of the effect of aluminium fluoride
on the activity and selectivity of HY zeolite. From this table it is
clear that the catalyst with the higher 6-AlF content (17%) has the
highest selectivity and the most stable activity and selectivity,
although Its activity is low when compared with the other catalysts.
Effect of copper. Figure 3-8 contains data on the activity and selec
tivity of a catalyst containing 12% copper on HY zeolite. The results
for other catalysts containing varying amounts of copper are summarized
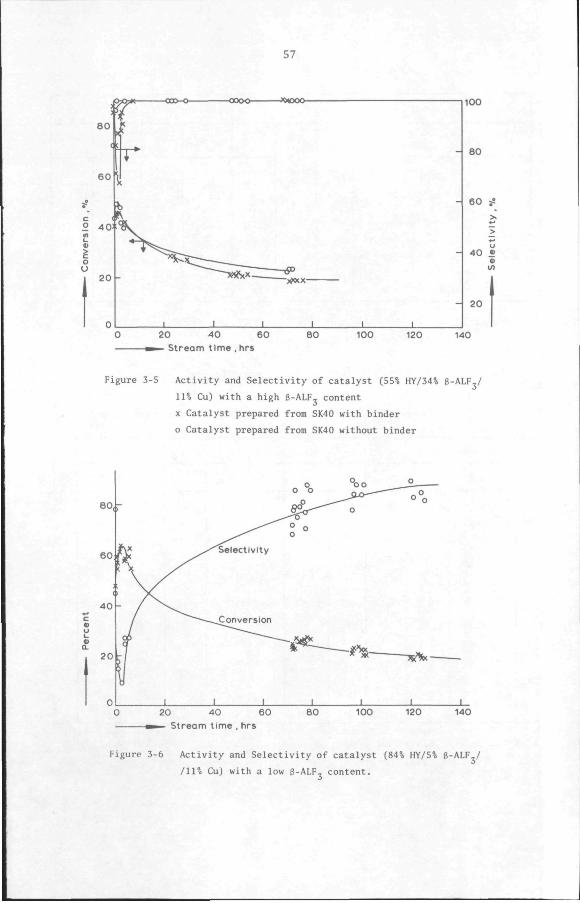
57
20 40 60 — Stream time .hrs
140
Figure 3-5 Activity and Selectivity of catalyst (55% HY/34% B-ALF^/
11% Cu) with a high B-ALF, content
X Catalyst prepared from SK40 with binder
o Catalyst prepared from SK40 without binder
80,
60 k 40
20
Selectivity
Conversion
o
20 40 60 — Stream time , hrs
80 100 120 140
Figure 3-6 Activity and Selectivity of catalyst (84% HY/5% B-ALF^/
/11% CuJ with a low B-ALF, content.
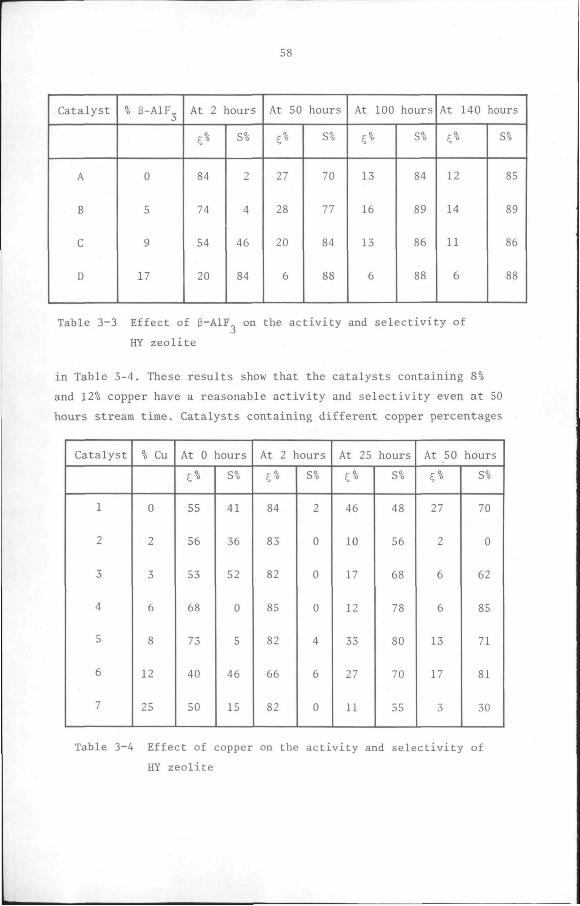
58
Catalyst
A
B
C
D
% B-AIF^
0
5
9
17
At 2 hours
S%
84
74
54
20
S%
2
4
46
84
At 50 hours
5%
27
28
20
6
S%
70
77
84
88
At 100 hours
C%
13
16
13
6
S%
84
89
86
88
At 140 hours
C%
12
14
11
6
S%
85
89
86
88
Table 3-3 Effect of 6-AlF on the activity and selectivity of
HY zeolite
in Table 3-4. These results show that the catalysts containing 8%
and 12% copper have a reasonable activity and selectivity even at 50
hours stream time. Catalysts containing different copper percentages
Catalyst
1
2
3
4
5
6
7
% Cu
0
2
3
6
8
12
25
At 0
e%
55
56
53
68
73
40
50
lours
S%
41
36
52
0
5
46
15
At 2 hours
5%
84
83
82
85
82
66
82
S%
2
0
0
0
4
6
0
At 25
5%
46
10
17
12
33
27
11
hours
S%
48
56
68
78
80
70
55
At 50
5%
27
2
6
6
13
17
3
hours
S%
70
0
62
85
71
81
30
Table 3-4 Effect of copper on the activity and selectivity of
HY zeolite
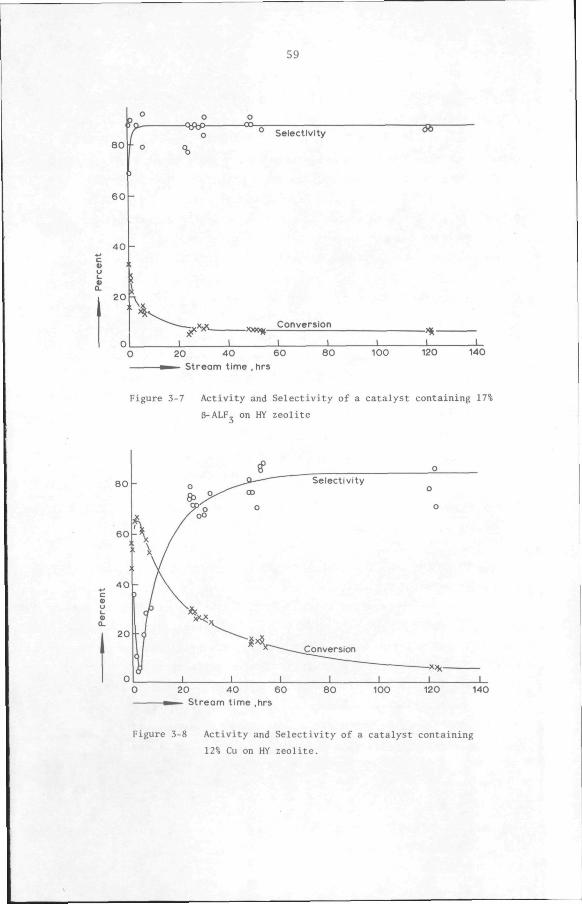
59
60 r 6 0
4 0
20 Ax
o o - 0 0 - Selectlvlty
%
SB-
—^"^ J L
-XMt^. Conversion
20 40 60 Stream time , hrs
80 100 120 140
Figure 3-7 Activity and Selectivity of a catalyst containing 17%
6-ALF, on HY zeolite
80
20 40 60 — Stream time ,hrs
80 100 120 140
Figure 3-8 Activity and Selectivity of a catalyst containing
12% Cu on HY zeolite.
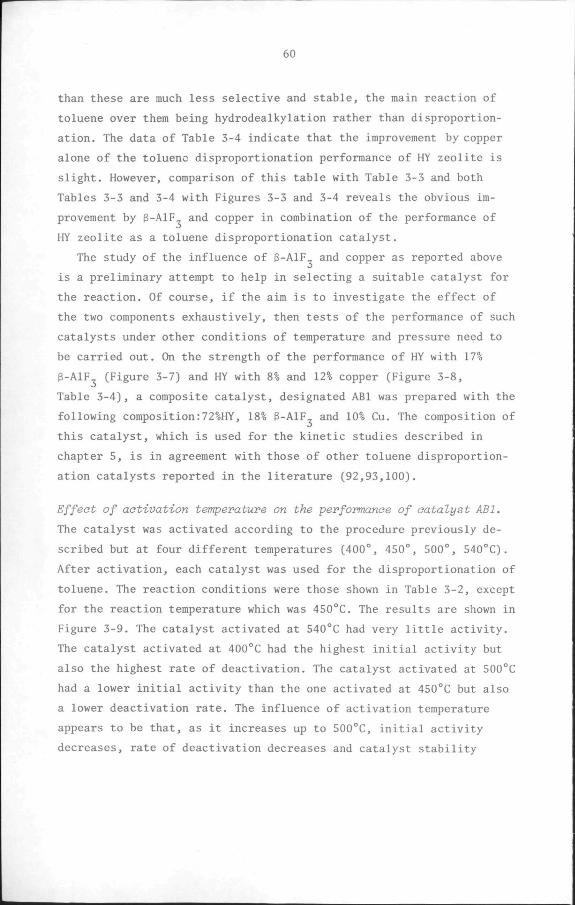
60
than these are much less selective and stable, the main reaction of
toluene over them being hydrodealkylation rather than disproportion
ation. The data of Table 3-4 indicate that the improvement by copper
alone of the toluene disproportionation performance of HY zeolite is
slight. However, comparison of this table with Table 3-3 and both
Tables 3-3 and 3-4 with Figures 3-3 and 3-4 reveals the obvious im
provement by B-AIF and copper in combination of the performance of
HY zeolite as a toluene disproportionation catalyst.
The study of the influence of 3-AlF and copper as reported above
is a preliminary attempt to help in selecting a suitable catalyst for
the reaction. Of course, if the aim is to investigate the effect of
the two components exhaustively, then tests of the performance of such
catalysts under other conditions of temperature and pressure need to
be carried out. On the strength of the performance of HY with 17%
0-AlF (Figure 3-7) and HY with 8% and 12% copper (Figure 3-8,
Table 3-4), a composite catalyst, designated ABl was prepared with the
following composition:72%HY, 18% S-AIF and 10% Cu. The composition of
this catalyst, which is used for the kinetic studies described in
chapter 5, is in agreement with those of other toluene disproportion
ation catalysts reported in the literature (92,93,100).
Effect of activation temperature on the performance of catalyst ABl.
The catalyst was activated according to the procedure previously de
scribed but at four different temperatures (400°, 450°, 500°, 540°C).
After activation, each catalyst was used for the disproportionation of
toluene. The reaction conditions were those shown in Table 3-2, except
for the reaction temperature which was 450°C. The results are shown in
Figure 3-9. The catalyst activated at 540°C had very little activity.
The catalyst activated at 400°C had the highest initial activity but
also the highest rate of deactivation. The catalyst activated at 500°C
had a lower initial activity than the one activated at 450°C but also
a lower deactivation rate. The influence of activation temperature
appears to be that, as it increases up to 500°C, initial activity
decreases, rate of deactivation decreases and catalyst stability
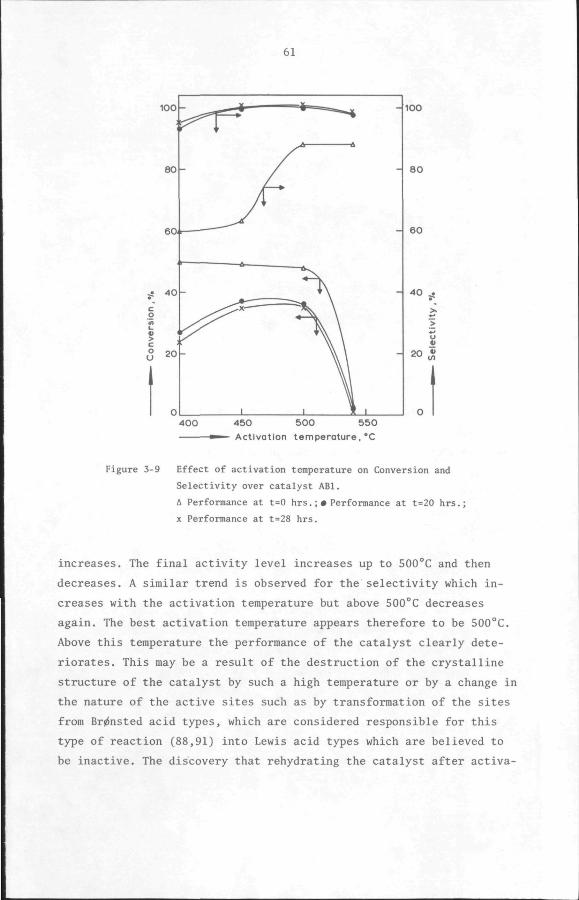
61
100
80
60
J 40 • c _o m > ° 20
O
400 450 500 550 ^"—Activation temperature, "C
Figure 3-9 Effect of activation temperature on Conversion and
Selectivity over catalyst ABl.
A Performance at t=0 hrs.;• Performance at t=20 hrs.;
X Performance at t=28 hrs.
increases. The final activity level increases up to 500°C and then
decreases. A similar trend is observed for the selectivity which in
creases with the activation temperature but above 500°C decreases
again. The best activation temperature appears therefore to be 500°C.
Above this temperature the performance of the catalyst clearly dete
riorates. This may be a result of the destruction of the crystalline
structure of the catalyst by such a high temperature or by a change in
the nature of the active sites such as by transfoinnation of the sites
from Br0nsted acid types, which are considered responsible for this
type of reaction (88,91) into Lewis acid types which are believed to
be inactive. The discovery that rehydrating the catalyst after activa-
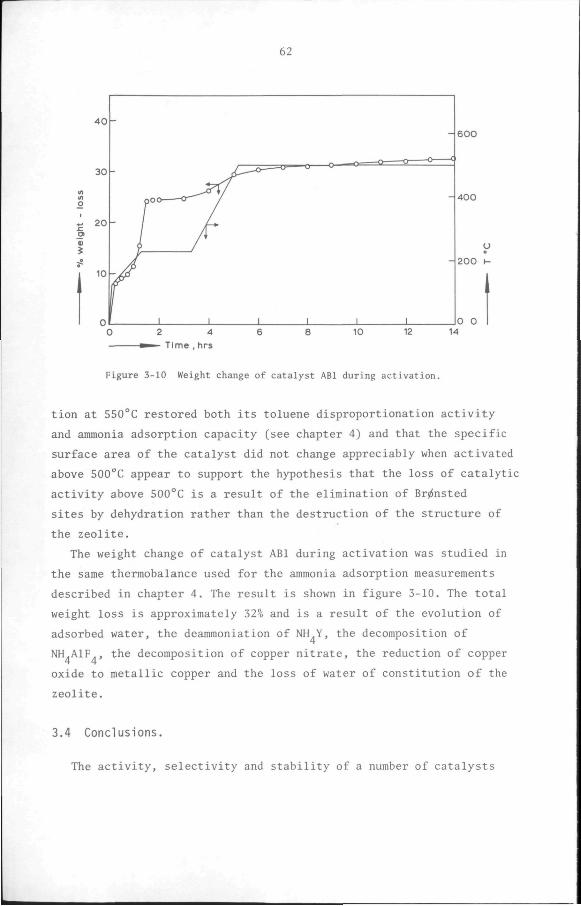
62
- 600
- 400
200
0 0
Figure 3-10 Weight change of catalyst ABl during activation.
tion at 550°C restored both its toluene disproportionation activity
and ammonia adsorption capacity (see chapter 4) and that the specific
surface area of the catalyst did not change appreciably when activated
above 500°C appear to support the hypothesis that the loss of catalytic
activity above 500°C is a result of the elimination of Br^nsted
sites by dehydration rather than the destruction of the structure of
the zeolite.
The weight change of catalyst ABl during activation was studied in
the same thermobalance used for the ammonia adsorption measurements
described m chapter 4. The result is shown in figure 3-10. The total
weight loss is approximately 32% and is a result of the evolution of
adsorbed water, the deammoniation of NH Y, the decomposition of
NH.AIF , the decomposition of copper nitrate, the reduction of copper
oxide to metallic copper and the loss of water of constitution of the
zeolite.
3.4 Conclusions.
The activity, selectivity and stability of a number of catalysts
63
for the disproportionation of toluene have been compared at a set of
standard conditions. The results show that a catalyst consisting of
72 w% HY zeolite, 18 w% B-AIF and 10 w% Cu has the most satisfactory
overall activity, selectivity and stability of the catalysts tested.
While this catalyst is less active than HY zeolite, its selectivity
and stability are much higher. Although neither B-AIF nor copper is
in itself active for the disproportionation of toluene, the combination
of these materials with HY zeolite results in a catalyst with an im
proved performance. It has also been demonstrated that B-AIF can be
prepared in a very simple manner. More laborious methods have often
been used to prepare this compound for incorporation in toluene
disproportionation catalysts (93,108,109). It was also shown that the
best activation temperature for the catalyst is 500°C. When activated
above this temperature its activity all but disappears. Activation
below 500°C, on the other hand, leads to a faster deactivation of the
catalyst with use.
64
C H A P T E R 4
CHARACTERISATION OF THE PHYSICO-CHEMICAL PROPERTIES OF THE CATALYSTS.
4.1 Introduction
The performance of a catalyst is stronglyinfluenced by its physico-
chemical properties. For the disproportionation of toluene, texture and
acidity are the most important determinants of catalytic behaviour.
Texture influences the transport of reactants and products through the
catalyst, while acidity is responsible for activity and selectivity .
The texture of zeolites and zeolite-based catalysts is characteri
zed by their highly porous structure combined with their very regular
crystalline framework. The adsorption selectivity shown by these mole
cular sieves depends on the differences in size and shape between the
molecules and the apertures in the zeolite crystals. The catalytic
properties, on the other hand, depend on the number and strength of
acidic surface sites. Thus, characterization of texture and acidity is
essential for a complete understanding of the properties of zeolite-
based catalysts.
Extensive crystallographic and structural information on zeolites,
mainly from X-ray crystal structure analysis, is available. However,
when zeolites are, for example, impregnated or combined with other
chemical components, as is often the case with industrial catalysts,
data on the zeolite carrier alone do not suffice to characterize the
composite catalyst and it becomes necessary to determine the properties
of such catalysts separately.
In the following sections, the texture and acidity of the catalysts
used in the experiments described in chapters 3 and 5 are determined.
The validity of the methods used when applied to zeolites and the
significance of the results are also discussed.
65
4.2. Texture of catalysts
4.2.1 Introduction
The most useful parameters for the characterization of the texture
of porous solids, namely the specific surface area, the total pore vol
ume , and the pore-size distributrion, are often determined by adsorp
tion measurements such as the adsorption of nitrogen at low temperatures.
With zeolites, thisposes the problem of selecting the correct adsorption
isotherm to be used for interpreting the data. A cursory inspection of
the low-temperature nitrogen adsorption isotherms of microporous adsor
bents such as zeolites gives the impression that they are of the Lang-
muir type. However, the adsorption isotherm cannot be a true Langmuir
type because zoelites contain not only micrpores but also meso- and
macropores , although they are usually classified simply as microporous
solids, that is solids to which a maximum pore radius of 2nm(20A) is
arbitrarily assigned. The meso- and macropores contribute to the total
adsorption by zeolites. Firstly there is, at low relative pressures,
the pore-filling adsorption in micropores, which occurs with a high
heat of adsorption. Then subsequently, at higher partial pressures,
adsorption in the meso- and macropores and on the external surfaces of
the zeolite crystals sets in, which is accompanied by a lower heat of
adsorption.
Similarly, the BET equation, which has often been used to estimate
the specific surface of porous and non-porous solids does not apply here :
since the isotherms of zeolites are obviously not of the BET type it
would be quite erroneous to apply the BET theory to such microporous
solids. Moreover, determination of the pore-size distribution by the
classical method, which utilizes Kelvin's theory of capillary conden
sation is of doubtful utility in the case of zeolite-based catalysts for
two reasons. Firstly, their nitrogen adsorption isotherms show no hys
teresis loop in the range of relative pressures at which the pores are
filled, which is characteristic of adsorption in pores with diameters of
less than 2 nm(20A). Secondly, the validity of Kelvin's theory becomes
66
questionable below approximately 2nm pore radius. Even the corrected
Kelvin equation derived by Broekhoff and de Boer (143,156) breaks down
at radii less than 2nm. The theory of capillary condensation in such
narrow pores is, therefore, still undeveloped. This is caused mainly by
the lack of knowledge of the density of the adsorbed phase and the ab
sence of concrete data on the surface tension of strongly curved nitro
gen/solid interfaces.
The use of mercury penetration porosimetry to determine the pore
size distribution of solids containing micropores is difficult because
very high pressures are needed to force mercury into the narrow pores.
Furtliermore, application of the Washburn equation, r(in A )=7500/p(in atm)
to analyse mercury penetration data is of questionable validity even in
transitional pores, since the values of surface tension and contact an
gle for mercury in strongly curved pores are not accurately known.
Since there is as yet no universally accepted method of determining
the relevant parameters, several methods are usually applied simulta
neously to analyse the texture of zeolites (44). For example. X-ray data
have been used to estimate the specific surface of CaA and NaX zeolites
(147), while the same quantity has been evaluated for H-Y zeolite by
low temperature nitrogen adsorption (23,89). However, the correctness of
the various methods which have been advanced for estimating the texture
of microporous solids remains a matter of active discussion (147,148,
149).
In the following sections, the texture of a number of catalysts, most
of them predominantly microporous in structure, is determined by some
well-known methods. The results obtained by the various methods serve
not only to characterize the catalysts but also to compare these methods,
in the hope that such a comparison may shed some light on their relative
utility. Also, an alternative method is suggested for the determination
of the specific surface area of zeolites. Finally, an attempt is made to
relate the texture of the catalysts to their activities for the dispro
portionation of toluene.
67
4.2.2. Experimental
Catalysts investigated
The catalysts investigated can be summarized as follows:
1. Linde SK-40 molecular sieve Y zeolite with binder, which was used as
purchased from the manufacturer.
2. The hydrogen form of the above Y zeolite, obtained by in situ eva
cuation at 350 C of ammonium Y zedite, which was prepared as described
in chapter 3.
3. A catalyst prepared by impregnating NH -Y with 18% 6-ALF, and 10%
copper, the preparation of which has been described in chapter 3.
4. The catalyst described in 3, above, activated for 24 hours at 500°C
under a constant flow of hydrogen (60ml/min).
5. The catalyst described in 4, above, after it had been used for 2
hours for the vapour-phase disproportionation of toluene at 500 C.
6. The same catalyst as described in 4., above, which had been used for
Ij months for the disproportionation of toluene at 500°C.
7. A steam-treated low-alumina silica-alumina catalyst (LAL5P).
8. An untreated low-alunina silica-alunina catalyst (LAL3P).
Procedure
Nitrogen adsorption measurements were carried out in a micro-BET
apparatus at -196 C according to the method described by Lippens and
co-workers (156,158). The system containing the catalyst sample was
evacuated for 16 hours at 350 C before measurement of each adsorption
isotherm.
A mercury penetration porosimeter, model 905-1, operating pressure
range 0-3500 atm., manufactured by Micromeritics Instruments Corp.,
was used for the mercury penetration measurements. The appropriate
corrections for mercury compressibility were applied (154). Further
details on the instrument and on the theory of its applications are
available in the literature (157).
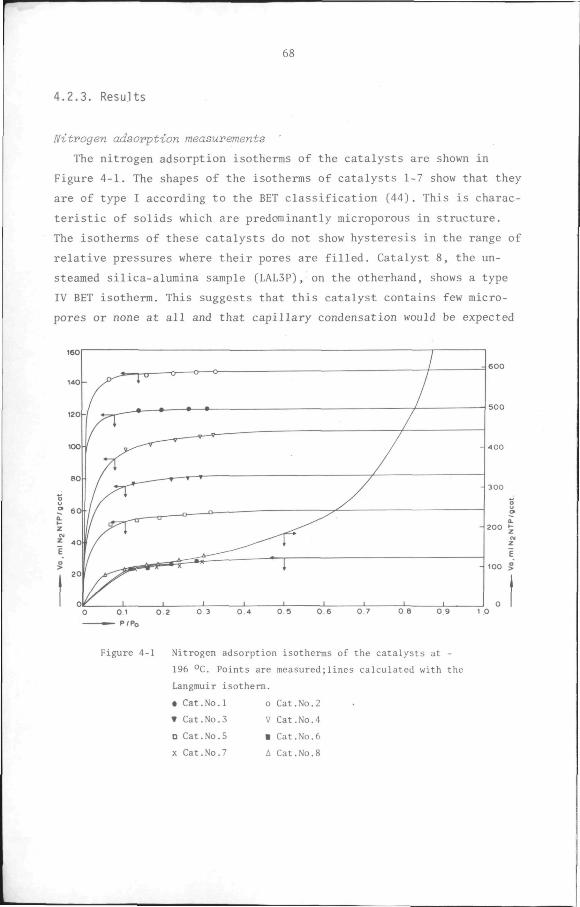
68
4.2.3. Results
nitrogen adsorption measurements '
The nitrogen adsorption isotherms of the catalysts are shown in
Figure 4-1. The shapes of the isotherms of catalysts 1-7 show that they
are of type I according to the BET classification (44). This is charac
teristic of solids which are predominantly microporous in structure.
The isotherms of these catalysts do not show hysteresis in the range of
relative pressures where their pores are filled. Catalyst 8, the un-
steamed silica-alumina sample (LAL3P), on the otherhand, shows a type
IV BET isotherm. This suggests that this catalyst contains few micro
pores or none at all and that capillary condensation would be expected
Figure 4-1 Nitrogen adsorption isotherms of the catalysts at -
196 °C. Points are measured;lines calculated with the
Langmuir isotherm.
• Cat.No. 1 o Cat.No.2
» Cat.No.3 V Cat.No.4
D Cat.No.5 • Cat.No.6
X Cat.No.7 A Cat.No.8
69
to occur in its pores. The corrected Kelvin equation (143,156) can be
used for the calculation of the pore-size distribution of this catalyst.
The isotherms of catalysts 1-7 are Langmuir-type in shape in the
relative pressure range of 0.02-0.3. Between relative pressures 0.1 and
0.3, only a limited amount of adsorption is observed. This suggests
that the surface of these catalysts is mostly made up of micropores and
that only a small proportion of the total surface is in the meso- and
macropores. On the other hand, the substantial adsorption of catalyst 8
above a relative pressure of 0.1 points to a preponderance of pores of
the transitional type.
The five methods listed below were used to study the texture of the
catalysts. In all cases,surface areas were calculated by assuming a val
ue of 0.162nm (16.2A'' ) for the cross-sectional area of an adsorbed
nitrogen molecule at -196 C, while pore volumes were determined by as
suming that nitrogen was adsorbed as a liquid having a density of
0.8081 ml/g.
1) The t-method of De Boer (143,146,159), Figure 4-2, was used to esti
mate the volume of the micropores, V , the area in transitional pores
S..., and the area in micropores, S . The "common t-curve " used in t' ^ ' m
this method is the curve determined by De Boer and co-workers (143,
158) for oxides, hydroxides and graphite.
2. The BET method was used to calculate the BET surface area, S_„_. bbl
However, as outlined above, the result has physical significance
for catalyst No.8 only, since multilayer adsorption, which is one of
the basic assumptions of the BET theory, can hardly occur in micro
pores. The surface area calculated by this method is, however, use
ful for comparison with values determined by other methods.
3. The nitrogen adsorption data were fitted to a Langmuir isotherm,
Figure 4-3, and used to calculate the specific surface, S,, of the
catalysts.
4. The methods of Dubinin and of Kaganer (44), Figure 4-4, were used to
evaluate the pore volumes, Vp,, and the specific surface areas,S re-U K
spectively of catalysts 1 through 7, which are microporous. 5. The Gurvitsch rule (44) was applied to calculate the pore volumes,
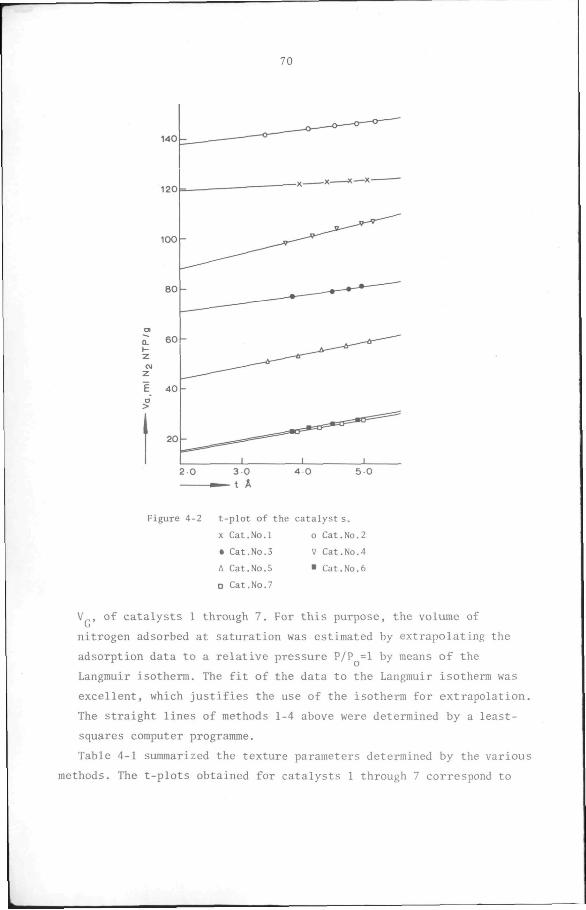
70
140-
120=-
100
0. I-z
CM
z E o >
80
60
40
20
2 0 3 0 - t A
4 O 5 0
F i g u r e 4-2 t - p l o t of t h e c a t a l y s t s .
X C a t . N o . 1 o C a t . N o . 2
• Ca t .No .3 V C a t . N o . 4
A Ca t .No .5 • C a t . N o . 6
D Ca t .No .7
V , of catalysts 1 through 7. For this purpose, the volume of
nitrogen adsorbed at saturation was estimated by extrapolating the
adsorption data to a relative pressure P/P =1 by means of the
Langmuir isotherm. The fit of the data to the Langmuir isotherm was
excellent, which justifies the use of the isotherm for extrapolation.
The straight lines of methods 1-4 above were determined by a least-
squares computer programme.
Table 4-1 summarized the texture parameters determined by the various
methods. The t-plots obtained for catalysts 1 through 7 correspond to
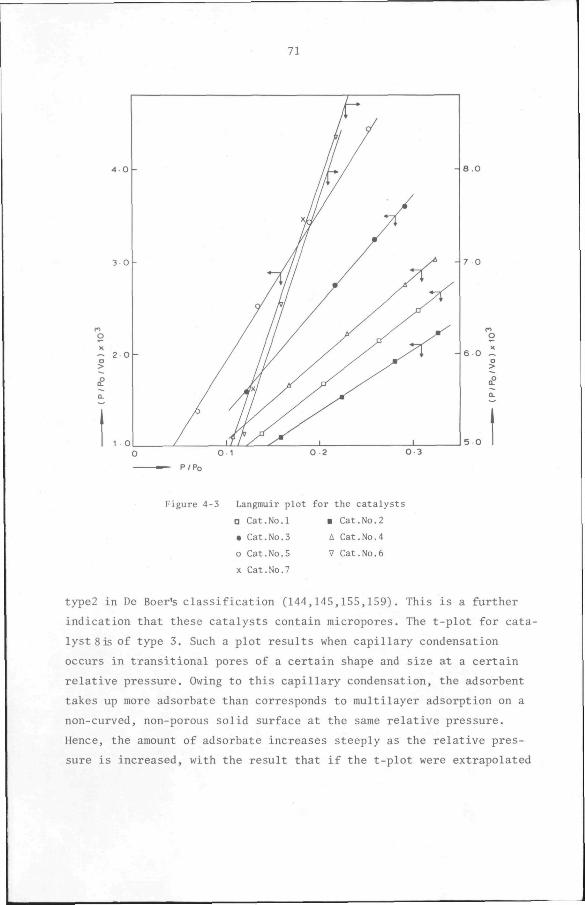
71
o 1 0 2 0 3
-8.0
- 7 0
- 6 0
5 O
P/Po
Figure 4-3 Langmuir plot for the catalysts
D Cat.No.l • Cat.No.2
• Cat.No.3 A Cat.No.4
o Cat.No.5 V Cat.No.6
X Cat.No.7
type2 in De Boer's classification (144,145,155,159). This is a further
indication that these catalysts contain micropores. The t-plot for cata
lyst Sis of type 3. Such a plot results when capillary condensation
occurs in transitional pores of a certain shape and size at a certain
relative pressure. Owing to this capillary condensation, the adsorbent
takes up more adsorbate than corresponds to multilayer adsorption on a
non-curved, non-porous solid surface at the same relative pressure.
Hence, the amount of adsorbate increases steeply as the relative pres
sure is increased, with the result that if the t-plot were extrapolated
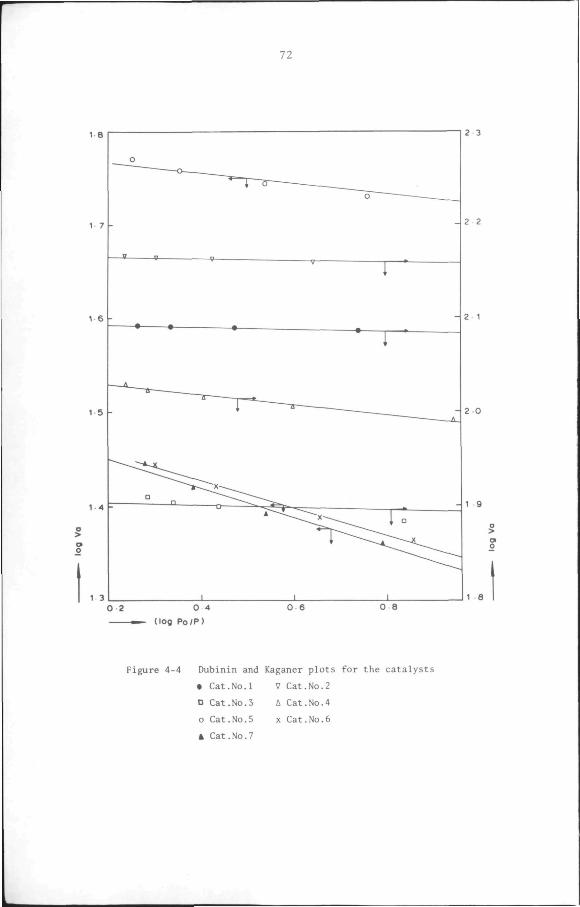
72
1 8
1 6
1 5
1 3
o
» 0
• •
O Q o
1
i^~~i-
1
-—o _ ^
i •
-
• i •
1
O 2 0 4
(log Po/P)
0 6 0 8
- 2 2
2 1
1 9
1 8
Figure 4-4 Dubinin and Kaganer plots for the catalysts
• Cat.No.l V Cat.No.2
D Cat.No.3 A Cat.No.4
o Cat.No.5 X Cat.No.6
* Cat.No.7
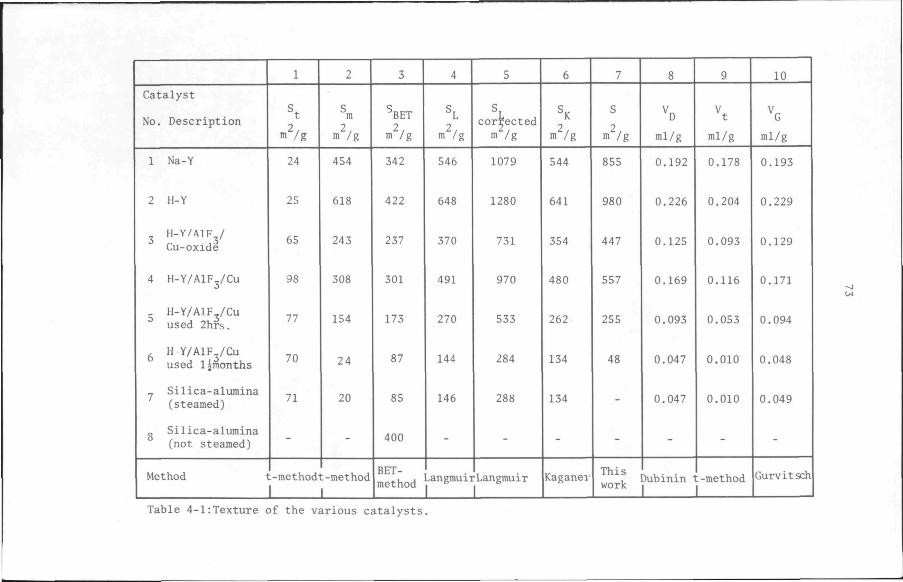
Catalyst
No. Description
1 Na-Y
2 H-Y
3 H-Y/AIF^/ Cu-oxide
4 H-Y/AlFj/Cu
H-Y/AIF /Cu used 2hrs.
g H Y/AlFj/Cu used l^months
._ Silica-alumina (steamed)
g Silica-alumina (not steamed)
Method 1
1
24
25
65
98
77
70
71
:-method
1
2
S m
2, m /g
454
618
243
308
154
24
20
t-method
1
3
s BET 2,
m /g
342
422
237
301
173
87
85
400
BET-method
4
2, m /g
546
648
370
491
270
144
146
5
corrected m /g
1079
1280
731
970
533
284
288
1 1 ^angmuirLangmuir
1 1
6
2, m /g
544
641
354
480
262
134
134
Kaganer
7
S
2, m /g
855
980
447
557
255
48
This work
8
^D
ml/g
0.192
0.226
0.125
0.169
0.093
0.047
0.047
9
ml/g
0.178
0.204
0.093
0.116
0.053
0.010
0.010
1 1 Dubinin t-method
1 1
10
ml/g
0.193
0.229
0.129
0.171
0.094
0.048
0.049
Gurvitsch
Table 4-1:Texture of the various catalysts.
74
to lower t values, it would not pass through the origin, but would
intercept the t-axis at a positive value.
It has been assumed that the "common t-curve"of De Boer and co-workers
(143,158) applies to the solids analysed in this study. The appropriate
'l;ommon t-curve"is one obtained by measuring the adsorption isotherm on
a non-porous reference substance, with a surface as nearly as possible
identical with the porous solid under investigation, as regards adsorp-
tive properties. When this condition is satisfied, the two solids have
identical adsorption potentials and,therefore, heats of adsorption. At
the same relative pressure, the thickness of the adsorbate multilayer
then is the same on the two solids. The difficulty of finding a truly
comparable reference substance for the determination of the t-curve of
a particular adsorbent is well-known (44, 160).
The results of the t-method (Table 4-1) show that when sodium Y zeolite
(catalyst No.l) is converted into the H-form (catalyst No.2), the
transitional pore area, S , does not change. This area consists of the
external surface of the zeolite crystals, which normally does not exceed 2
10m /g (147), and the area of the binding material used in the manufac-2
ture of zeolite pellets, which is normally 20-25m /g.
Comparison of No.2 with No.3 shows that the micropore volume has
decreased from 0.204ml/g to 0.093 ml/g, while the transitional pore 2 2
area, has increased from 25m /g to 65m /g. This decrease in micropore
volume indicates that the aluminium fluoride and copper oxide resulting
from the decomposition of copper nitrate have partially blocked the 2
micropores. The increase in the transitional pore area of 40m /g suggests
that the presence of aluminium fluoride and copper oxide particles in
troduces extra transitional pores.
When catalyst No. 3 is activated to form No.4, volatile components
are lost, notably by the decomposition of copper nitrate to copper oxide
and the reduction of the latter to metallic copper. The corresponding
weight loss causes an apparent increase in the micropore volume, V ,
and in the total pore volume, V . Comparison of S. found for catalysts VJ t
No.2 and No.4 indicates that the addition of copper and aluminium fluo-
de produces more surface area in the transitional pores.
75
Texture of zeolite-containing catalysts.
The specific surfaces of the microporous catalysts examined, as cal
culated from the Langmuir isotherm and by Kaganer's method, are in 2
satisfactory agreement. Benson et al. (23) determined a value of 850m /g
for H-Y zeolite by applying the Langmuir isotherm to nitrogen adsorption
2
data. This value is significantly higher than the value of 648m /g ob
tained in this study for the same catalyst, using the same method. The
discrepancy between the two results may well be significant since the
Y zeolite used here was ammonia-exchanged to a higher level (91.8%)
than the catalyst of Benson and co-workers (69%) and would, therefore, be expected to possess a higher surface area. Venuto et al. (89) ob-
2 tained a value of 676m /g for H-Y zeolite using the BET method, a value
which is higher than the BET surface obtained for a similar catalyst in
this work (Table 4-1). Since the deammoniation procedure employed here
(evacuation at 350 C for 16 hours) is considered adequate, the differ
ence between the two sets of results may be due to the presence of a
binder in our zeolite sample or to poorer crystallization of our sample
than those of the other investigators. It is known that incomplete
crystallization of zeolite preparations sometimes occurs during manufac
ture, resulting in inaccessibility of some pores and low values of
experimental surface areas and pore volumes.
All the values of specific surface referred to above were calculated
by assuming that the cross-sectional area of a nitrogen molecule at
-196°C is 0.162nm (16.2A°^). While this value may be valid for a flat
adsorbent surface, it is less justifiable for zeolites, owing to the
strong curvature of the surface of the zeolite cavity. From the molecu
lar diameter of the nitrogen molecule (0.315nm at 20 C) and the radius
of the large cage of Y zeolite (0.625nm), it can be calculated geometri-2
cally that the area occupied by a spherical nitrogen molecule is 0.32nm
(32A ). This value has been used to correct the surface areas calcula
ted from the Langmuir isotherm (Table 4-1). Nevertheless, this improve
ment notwithstanding , the basic assumptions underlying the Langmuir
theory, that is, monolayer adsorption, absence of mutual interaction
between adsorbed molecules, and constancy of the heat of adsorption as
76
a function of surface coverage, are not at all fulfilled. Therefore,
application of the Langmuir equation remains unsatisfactory.
Since the structure of zeolites is regular and well-known, it is
possible to calculate their texture analytically. By assuming the large
cages of Y zeolite to be perfectly spherical and by making use of the
fact that this zeolite has a cage radius of 0.625nm and a pore volume
of 0.296ml/g (181), its surface area, based on the area of the inner 2 -20 2
walls of its cages, is calculated to be 1419m /g or 491x10 m /cage. 2
A similar value, 1400m /g, was calculated by Dubinin for NaX zeolite
(147). The large discrepancy between such calculated results and expe
rimentally determined areas (Table 4-1) was also noted by other inves
tigators (147).
In the next section, a method which elimates this discrepancy is pre
sented.
The pore volumes of the microporous catalysts as calculated by the
method of Dubinin, Vp, and by the Gurvitsch rule,V , are in good agree-
ment (Table 4-1). These values and similar results by others (19,20)
are slightly higher than the estimates obtained in this study by the
t-method. This is easily explained by the fact that the t-method esti
mates the volume of the micropores only, whereas the other methods
determine the total pore volume. The t-method enables a distinction to
be made between the volume of nitrogen taken up in the cages of the
zeolite from the volume adsorbed on the external surface of the zeolite
crystals, on the binder and on the other materials brought on the zeolite.
An alternative method of determination of the specific surface area of
zeolites.
As has been pointed out above, the t-method provides, separately,
the amount of material adsorbed in the micropores and the amount in
transitional and larger pores. The slope of the t-plot gives an estimate
of the surface area, S , of the transitional and larger pores (Table 4-1).
If the cross-sectional area of an adsorbed nitrogen molecule and the
configuration of the adsorbed molecules in the micropores were known
with sufficient precision, it would be possible to estimate the surface
77
area of the micropores. Since neither is accurately known, the following
relationship, which combines calculated and experimental parameters, is
proposed for the determination of the surface area of zeolite catalysts:
S = V^.S^/V^ . 4-1
2 where S is the surface area in m /g, V is the volume of the micropores
3 determined by the t-method, cm /g, S is the calculated surface area of
2 '' one cage in m /cage, and V is the calculated volume of one cage in 3
cm /cage. S and V can be calculated from X-ray data (181). For NaY
zeolite,S , calculated by assuming a perfectly spherical cage (see
above) is 491x10 m /cage while V is 1023x10 cm /age.
This method can be used for other zeolites than NaY. The cross-sectional
area of the nitrogen molecule is not required. Furthermore, although
nitrogen is used as adsorbate, as is usual in texture studies, the re
sult should in theory be the same irrespective of the adsorbate used,
as long as the value of V is known. Nevertheless, since results are in
practice somewhat dependent on the adsorbate (44), it is better to use
the standard adsorbate, nitrogen. There are zeolites, however, such as
molecular sieves 3A with pores that are too narrow to admit nitrogen
molecules. In such cases another adsorbate than nitrogen may be used,
for example hydrogen or krypton. All the same, the t-method on which the
present method depends is as yet developed onlv for nitrogen adsorption.
The surface areas of the micropores of the catalysts as calculated by
this method using V are shown in Table 4-1 under S. The value for NaY 2 2
zeolite, 855m /g, is much lower than the expected value of 1419m /g
calculated above. The reason must be that the value obtained for
V ,0.178ml/g, is lower than it should be. If it is accepted that the
t-method determines the correct volume of the micropores, then the
explanation for the low value of V must lie either in the poor crystal
lization of the NaY sample or in the presence of a binder which has
blocked some of the micropores. It is also possible that both factors
come into play. The value of V calculated for binderless NaY is
0.334ml/g. With this value and using the method described above, a value 2
for the micropore surface area of S=1603m /g was calculated. This result
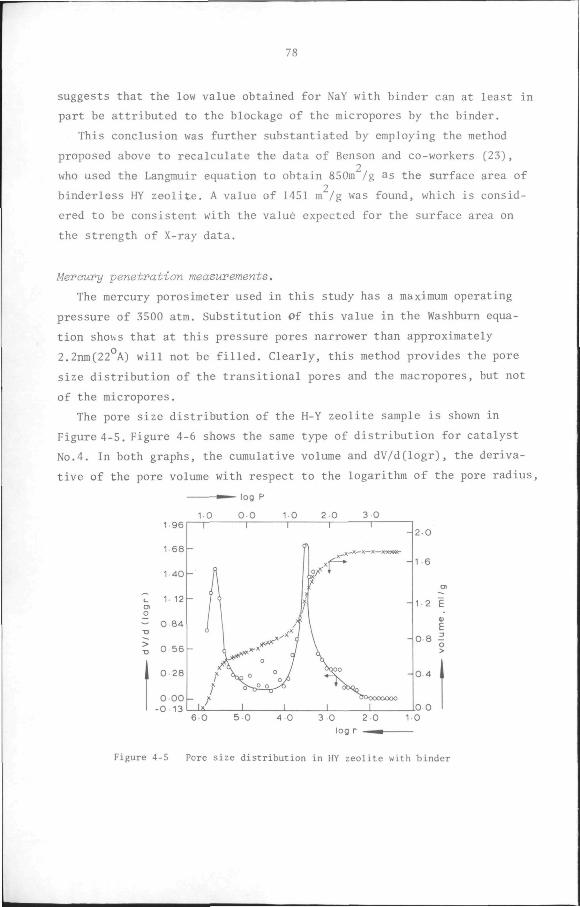
78
suggests that the low value obtained for NaY with binder can at least in
part be attributed to the blockage of the micropores by the binder.
This conclusion was further substantiated by employing the method
proposed above to recalculate the data of Benson and co-workers (23), 2
who used the Langmuir equation to obtain 850m /g as the surface area of 2
binderless HY zeolite. A value of 1451 m /g was found, which is consid
ered to be consistent with the value expected for the surface area on
the strength of X-ray data.
Mercury penetration measurements.
The mercury porosimeter used in this study has a maximum operating
pressure of 3500 atm. Substitution Of this value in the Washburn equa
tion sho'.vs that at this pressure pores narrower than approximately
2.2nm(22°A) will not be filled. Clearly, this method provides the pore
size distribution of the transitional pores and the macropores, but not
of the micropores.
The pore size distribution of the H-Y zeolite sample is shown in
Figure 4-5. Figure 4-6 shows the same type of distribution for catalyst
No.4. In both graphs, the cumulative volume and dV/d(logr), the deriva
tive of the pore volume with respect to the logarithm of the pore radius,
^— log P
10 0 0 10 2 0 3 0 1 96
1 68
1 40
Z 1 12 o - 0 84 "O
? 0 56
0 28
O 00 -0 13
6 0 5 0 4 0 3 0 2 0 10 log r •
Figure 4-5 Pore size distribution in HY zeolite with binder
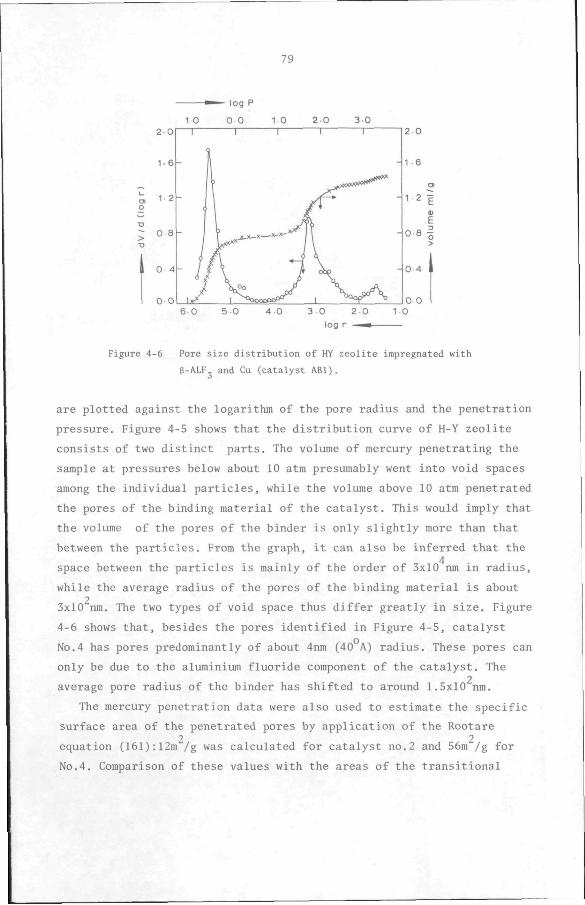
79
» — log P
10 0 0 10 2 0 3 0
o> o
x>
>
6 0 5 0 4 0 3 0 2 0 1 0 log r —^
Figure 4-6 Pore size distribution of HY zeolite impregnated with
g-ALF and Cu (catalyst A B l ) .
are plotted against the logarithm of the pore radius and the penetration
pressure. Figure 4-5 shows that the distribution curve of H-Y zeolite
consists of two distinct parts. The volume of mercury penetrating the
sample at pressures below about 10 atm presumably went into void spaces
among the individual particles, while the volume above 10 atm penetrated
the pores of the binding material of the catalyst. This would imply that
the volume of the pores of the binder is only slightly more than that
between the particles. From the graph, it can also be inferred that the 4
space between the particles is mainly of the order of 3x10 nm in radius,
while the average radius of the pores of the binding material is about 2
3x10 nm. The two types of void space thus differ greatly in size. Figure
4-6 shows that, besides the pores identified in Figure 4-5, catalyst
No.4 has pores predominantly of about 4nm (40 A) radius. These pores can
only be due to the aluminium fluoride component of the catalyst. The 2
average pore radius of the binder has shifted to around 1.5x10 nm.
The mercury penetration data were also used to estimate the specific
surface area of the penetrated pores by application of the Rootare 2 2
equation (161):12m /g was calculated for catalyst no.2 and 56m /g for No.4. Comparison of these values with the areas of the transitional
2-0 r z o
1-6-
1-2-
0 8 •
0 4-
0 0 .
.xwKxW*""'*'
1 -6
1 2
•0 8
0 4
0 0
80
pores, S , of the same catalysts estimated by the t-method and listed
in Table 4-I shows that the t-method gives consistently higher values.
This is due to the fact that S includes the areas of pores with radii
as small as 0.5nm(5A) while mercury penetrates pores with radii no smal
ler than 2.2nm at the maximum pressure at which the porosimeter was
operated.
Texture and toluene disproportionation activity.
The activities of catalysts No.5-No.8 for the disproportionation of
toluene are shown in Table 4-2. The conversion of toluene was used to
characterize the catalytic activity. Total toluene conversion and the
disproportionation selectivity were calculated with the expressions
derived in chapter 2.
Table 4-1 shows that the micropore volume and the micropore surface
area decrease drastically to about half their original values, that is, 2
from 0.116ml/g to 0.053ml/g for the pore volume, and from 557m /g to 2
255m /g for the micropore surface area, when catalyst No.4 is used for
2 hoin-s for the disproportionation of toluene (sample No.5). At the same
Catalyst
No. Description
5 HY/A1F,/Cu used 2hrs.
6 HY/AIF /Cu used if months
7 Silica-alumina (steamed)
8 Silica-alumina (not steamed)
Toluene disproportionation performance
Total conversion, %
42
25
2
15
Selectivity, %
85
92
0
70
Reaction conditions:P=10 ata, T=500°C, H2/toluene=16.7mol/mol,
W/F=176 g.hr/mol
Table 4-2:Toluene disproportionation performance of the catalysts.
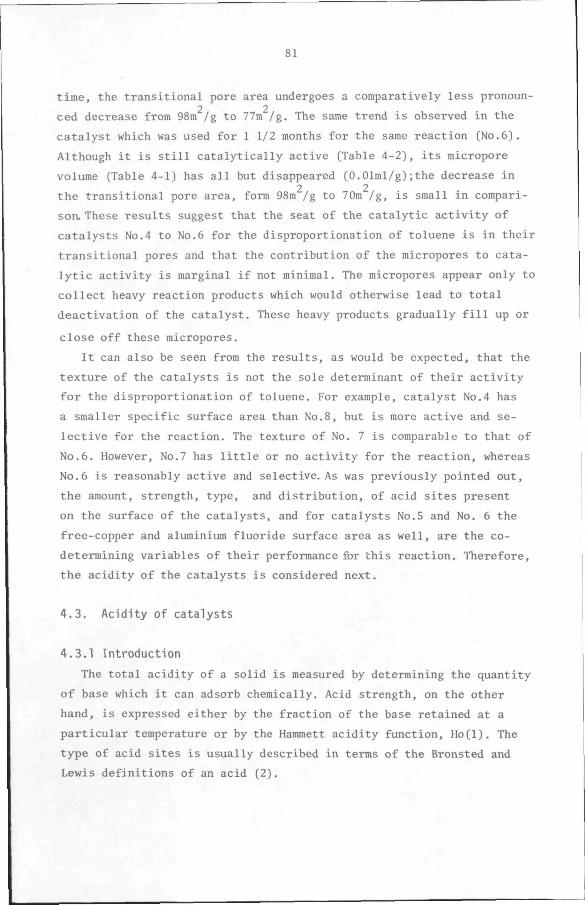
81
time, the transitional pore area undergoes a comparatively less pronoun-2 2
ced decrease from 98m /g to 77m /g. The same trend is observed in the
catalyst which was used for 1 1/2 months for the same reaction (No.6).
Although it is still catalytically active (Table 4-2), its micropore
volume (Table 4-1) has all but disappeared (0.Olml/g);the decrease in
2 2
the transitional pore area, form 98m /g to 70m /g, is small in compari
son. These results suggest that the seat of the catalytic activity of
catalysts No.4 to No.6 for the disproportionation of toluene is in their
transitional pores and that the contribution of the micropores to cata
lytic activity is marginal if not minimal. The micropores appear only to
collect heavy reaction products which would otherwise lead to total
deactivation of the catalyst. These heavy products gradually fill up or
close off these micropores.
It can also be seen from the results, as would be expected, that the
texture of the catalysts is not the sole determinant of their activity
for the disproportionation of toluene. For example, catalyst No.4 has
a smaller specific surface area than No.8, but is more active and se
lective for the reaction. The texture of No. 7 is comparable to that of
No.6. However, No.7 has little or no activity for the reaction, whereas
No.6 is reasonably active and selective. As was previously pointed out,
the amount, strength, type, and distribution, of acid sites present
on the surface of the catalysts, and for catalysts No.5 and No. 6 the
free-copper and aluminium fluoride surface area as well, are the co-
determining variables of their performance for this reaction. Therefore,
the acidity of the catalysts is considered next.
4.3. Acidity of catalysts
4.3.1 Introduction
The total acidity of a solid is measured by determining the quantity
of base which it can adsorb chemically. Acid strength, on the other
hand, is expressed either by the fraction of the base retained at a
particular temperature or by the Hammett acidity function, Ho(l). The
type of acid sites is usually described in terms of the Bronsted and
Lewis definitions of an acid (2).
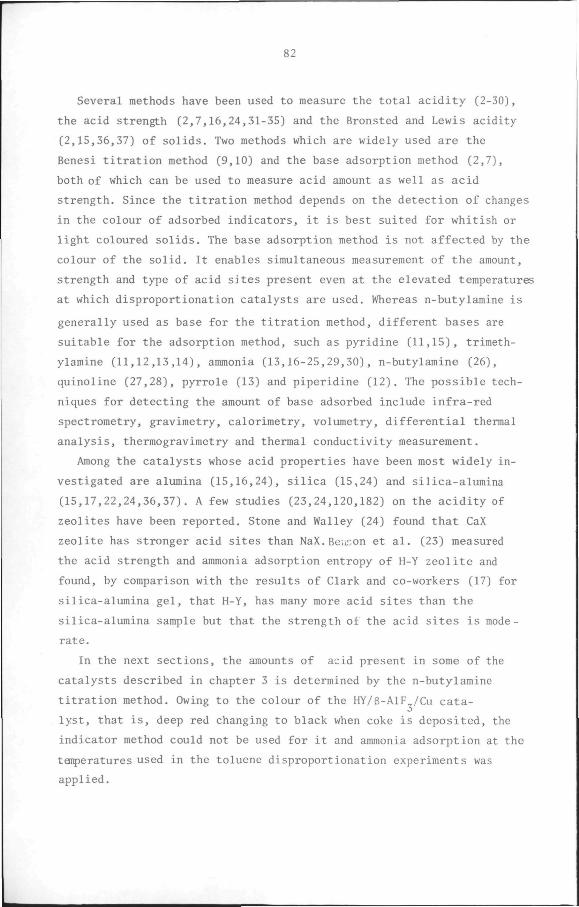
82
Several methods have been used to measure the total acidity (2-30),
the acid strength (2,7,16,24,31-35) and the Bronsted and Lewis acidity
(2,15,36,37) of solids. Two methods which are widely used are the
Benesi titration method (9,10) and the base adsorption method (2,7),
both of which can be used to measure acid amount as well as acid
strength. Since the titration method depends on the detection of changes
in the colour of adsorbed indicators, it is best suited for whitish or
light coloured solids. The base adsorption method is not affected by the
colour of the solid. It enables simultaneous measurement of the amount,
strength and type of acid sites present even at the elevated temperatures
at which disproportionation catalysts are used. Whereas n-butylamine is
generally used as base for the titration method, different bases are
suitable for the adsorption method, such as pyridine (11,15), trimeth-
ylamine (11,12,13,14), ammonia (13,16-25,29,30), n-butylamine (26),
quinoline (27,28), pyrrole (13) and piperidine (12). The possible tech
niques for detecting the amount of base adsorbed include infra-red
spectrometry, gravimetry, calorimetry, volumetry, differential thermal
analysis, thermogravimetry and thermal conductivity measurement.
Among the catalysts whose acid properties have been most widely in
vestigated are alumina (15,16,24), silica (15,24) and silica-alumina
(15,17,22,24,36,37). A few studies (23,24,120,182) on the acidity of
zeolites have been reported. Stone and Walley (24) found that CaX
zeolite has stronger acid sites than NaX.Bcison et al. (23) measured
the acid strength and ammonia adsorption entropy of H-Y zeolite and
found, by comparison with the results of Clark and co-workers (17) for
silica-alumina gel, that H-Y, has many more acid sites than the
silica-alumina sample but that the strength of the acid sites is mode
rate.
In the next sections, the amounts of acid present in some of the
catalysts described in chapter 3 is determined by the n-butylamine
titration method. Owing to the colour of the HY/6-A1F /Cu cata
lyst, that is, deep red changing to black when coke is deposited, the
indicator method could not be used for it and ammonia adsorption at the
tenperatures used in the toluene disproportionation experiments was
applied.
83
4.3.2. Acidity measurement by base titration method.
Experimental
Materials
The following catalysts were investigated:
1. Linde SK-40 molecular sieve, a Y zeolite with binder.
2. The toluene disproportionation catalyst prepared as outlined in
chapter 3 and consisting of ammonium-exchanged Y zeolite, 18%B-A1F„
and 10% copper as copper nitrate
3. An untreated low-alumina silica-alumina catalyst (LAL3P).
4. A steam-treated low-alumina silica-alumina catalyst (LAL5P).
Reagent grade benzene, n-butylamine and crystal violet were purchased
commercially.
Procedure.
The acidity of each catalyst was measured before and after activa
tion, which was effected by heating the catalyst sample in a stream of
hydrogen (60ml/min) in a fixed bed reactor from room temperature to
230 C at the rate of 1 C/min., holding for 2 hours, then raising the
temperature to 500 C at the rate of 2 C/min and holding at this temper
ature until a total of 24 hours had elapsed from the beginning of the
activation period.
About Igof catalyst, particle size less than 0.21 mm, was placed in
each of three previously weighed 20ml-weighing bottles. Precautions
were taken to avoid contamination of the catalysts by moisture from
the atmosphere. Ten ml benzene, dried over molecular sieves 3A, was
added to each bottle. The approximate quantity of n-butylamine required
to neutralize the acid was calculated from the rule of thumb that -4 2
8x10 m mcles of base are needed per m surface area (10). After this,
three different amounts of a O.IM -.:tyiamine sclution in benzene
were added to the three catalyst suspensions prepared above so as to
bracket the approximate quantity previously calculated. After shaking
for about 4 hours, a small quantity (1ml)of suspension was withdrawn
from each bottle and tested with one drop of crystal violet solution
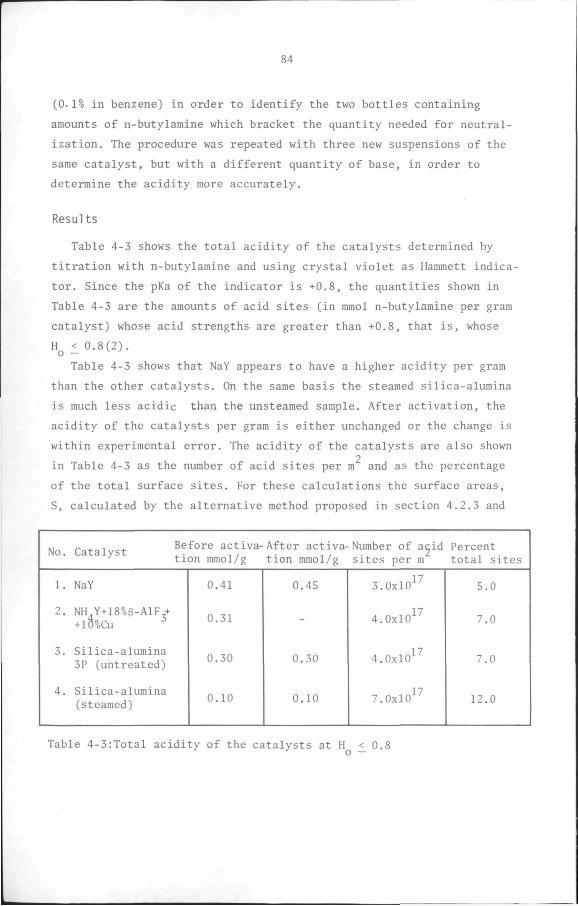
84
(0.1% in benzene) in order to identify the two bottles containing
amounts of n-butylamine which bracket the quantity needed for neutral
ization. The procedure was repeated with three new suspensions of the
same catalyst, but with a different quantity of base, in order to
determine the acidity more accurately.
Results
Table 4-3 shows the total acidity of the catalysts determined by
titration with n-butylamine and using crystal violet as Hammett indica
tor. Since the pKa of the indicator is +0.8, the quantities shown in
Table 4-3 are the amounts of acid sites (in mmol n-butylamine per gram
catalyst) whose acid strengths are greater than +0.8, that is, whose
H < 0.8(2). o — ^
Table 4-3 shows that NaY appears to have a higher acidity per gram
than the other catalysts. On the same basis the steamed silica-alumina
is much less acidic than the unsteamed sample. After activation, the
acidity of the catalysts per gram is either unchanged or the change is
within experimental error. The acidity of the catalysts are also shown 2
in Table 4-3 as the number of acid sites per m and as the percentage
of the total surface sites. For these calculations the surface areas,
S, calculated by the alternative method proposed in section 4.2.3 and
No.
1.
2.
3.
4.
Catalyst Before activa-After activa-Number of acid tion mmol/g tion mmol/g sites per m
NaY
NH Y+18%B-A1F + +10%Cu
Silica-alumina 3P (untreated)
Silica-alumina (steamed)
0.41
0.31
0.30
0.10
0.45
-
0.30
0.10
3.0x10^^
4.0x10 ''
4.0x10^^
7.0x10 ''
Percent total sites
5.0
7.0
7.0
12.0
Table 4-3:Total acidity of the catalysts at H £ 0.8
85
listed in Table 4-1, were used for the zeolite-based catalysts (No. 1
and No.2 in Table 4-3 are No.l and No.3 in Table 4-1) whereas the BET
surface areas were used for the silica-aluminas (No.3 and No.4 in Table
4-3 are No.8 and No.7 in Table 4-1). Table 4-3 shows that No.2 and
No. 3 have the same level of acidity per unit area. NaY has the lowest
acidity per unit area whereas steamed silica alumina has the highest.
4.3.3. Acidity measurement by ammonia adsorption method.
Experimental
Materials
Two different catalysts were used in this study:
1. The catalyst prepared by impregnating NH.-Y with 18%3-A1F_ and 10%
copper as copper nitrate. The preparation of this catalyst has been
described in chapter 3.
2. The untreated low-alumina (15% alumina), silica-alumina catalyst
(LAL3P), which has been used in many other experiments in this study.
Both catalysts were activated in situ at the beginning of the
experiment.
Ammonia, nitrogen and hydrogen, purchased commercially, were of
chemically pure quality. The ammonia, whose purity was verified by gas
chromatography to be 99.92%, was used without further purification. The
nitrogen and hydrogen were purified over reduced copper (BASF BTS R3-11)
catalyst to remove traces of oxygen and molecular sieve 3A to remove
moisture.
Equipment
The adsorption measurents were carried out in a Perkin-Elmer model
TGS-1 thermobalance equipped with a temperature programming unit. The
thermobalance was connected to a gas-dosing panel which made it possible
to work with a specified gas mixture. A baffle plate was installed just
above the furnace in order to minimize the effects of convection currents
on the temperature of the furnace.
86
Procedure
At the beginning of an adsorption series, the thermobalance was cali
brated by placing five ferromagnetic standards (monel, alumel, nickel,
mumetal and nicoseal deep draw) m the sample pan, followed by tempera
ture-programmed heating in a strong magnetic field. When a standard
reached its Curie Point the resulting loss of magnetic properties was
registered as an apparent loss of weight. From temperature readings on
the programmer at the known Curie Points a calibration curve for the
temperature of the furnace m terms of the programmer dial reading was
plotted.
After calibration of the Cahn electrobalance itself with standard
weights, about lOmg catalyst was introduced into the sample pan and ac
tivated for 24 hours with a mixture of hydrogen (60ml/min) and nitrogen
(108ml/min). The furnace was heated from room temperature to 230 C at
the rate of 1 C/min., held at this temperature for 2 hours, then to
500 C at 2 C/mm and maintained at this temperature until the end of
activation.
The temperature of the furnace was then adjusted to the desired
value and a mixture of ammonia and nitrogen passed over the catalyst.
Care was taken to use the same total volumetric flow each time.
Adsorption isotherms were measured at 400, 430, 450, 470, and 500 C
for the zeolite-based catalyst and at 300, 350, 400, 450, 500°C for
the silica-alumina. The adsorption of ammonia on both catalysts was
fast and completely reversible. Adsorption equilibrium, which was
presumed when there was no further increase m the weight of the sample,
was reached m about a quarter of an hour. After adsorption, the ammo
nia was desorbed by passing nitrogen over the sample. Although desorp
tion was somewhat slower than adsorption, it, too, was complete withm
half an hour.
The measurements were duplicated, approadiir^ the adsorption equili
brium from the high and the low temperature sides of the isotherms.
Isotherms obtained m duplicate runs with different batches of catalysts
agreed to within 5%.
87
Results
Ammonia adsorption on EY/^-AlF^Cu
Isotherms. The shapes of the ammonia adsorption isotherms (Figure 4-7)
are in agreement with the results of other investigators for similar so
lids (17, 152). They rise steeply at low coverages and gradually at
higher surface coverages. The coverage at which this transition takes
place varies with the temperature. This is typical of surfaces having
strong as well as weak adsorption sites (17).
In order to characterize the type of adsorption, the experimental
data were analysed according to the Langmuir, Freundlich and Temkin
theories of adsorption. These theories are discussed in detail in the
literature (44). The linearized forms of the Langmuir, Freundlich and
Temkin equations are shown in Figures 4-8, 4-9 and 4-10. The straight
lines in these figures were determined by a least-squares computer
programme. Visual inspection indicates that the Freundlich isotherm ap
pears to fit the experimental data best (see also Appendix 3).
Isosteric Heats of Adsorption. The isosteric heats of adsorption, q
were calculated from the Clausius-Clapeyron equation (39):
1 ^ = r i 1 "1 P R *• T^ T^ -'
where P and P_ are the equilibrium pressures corresponding to the same
level of adsorption on two isotherms at absolute temperatures T. and T_.
The surface coverage 0 was calculated from: 0 = g/g^, where g is milli
grams ammonia adsorbed per gram catalyst and g^ is the maximum ammonia
adsorption, milligrams per gram catalyst. The lines for 400 and 500 C
(Figure 4-9) do not converge to a point like the rest. This may be due
to experimental error or may mean that the adsorption isotherms at these
temperatures do not conform to the Freundlich theory. The value of g
was estimated from the point of convergence of the lines for 430, 450
and 470 C to be 10 milligrams ammonia per gram catalyst.
The isosteric heats are plotted against the surface coverage in Fig
ure 4-11. The average isosteric heats are also plotted in Figure 4-11.
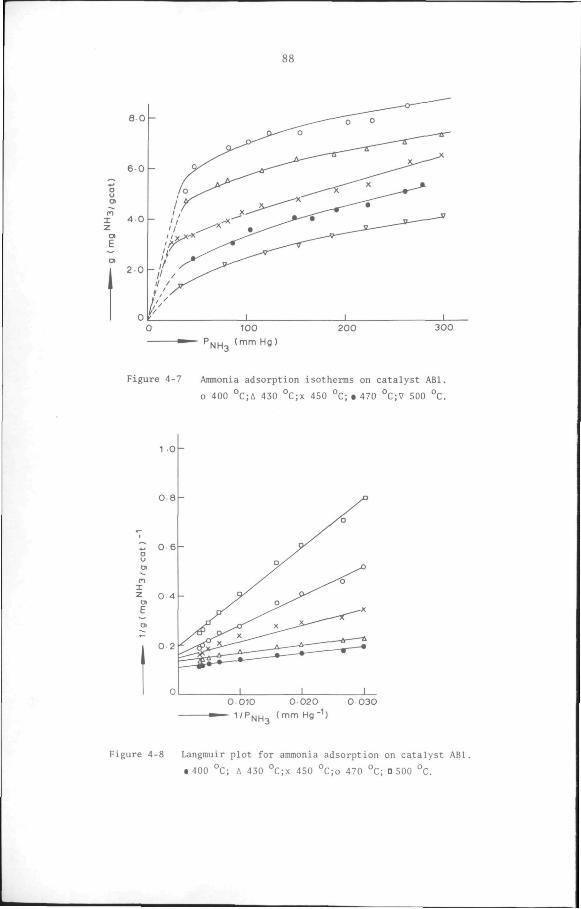
8 0 -
6 0 -
00 I 2
4 0 -
100 200 300
Figure 4-7 Ammonia adsorption isotherms on ca ta lys t ABl.
0 400 °C;A 430 °C;x 450 °C; • 470 °C;V 500 °C.
1 0 -
0 8
^ 0 6 -
0 4
0 2
0 010 0 020 0 030 - 1 ' P N H , f"^"" Hg-'')
Figure 4-8 Langmuir plot for ammonia adsorption on catalyst ABl.
• 400 °C; A 430 °C;x 450 °C;o 470 °C; 0 500 °C.
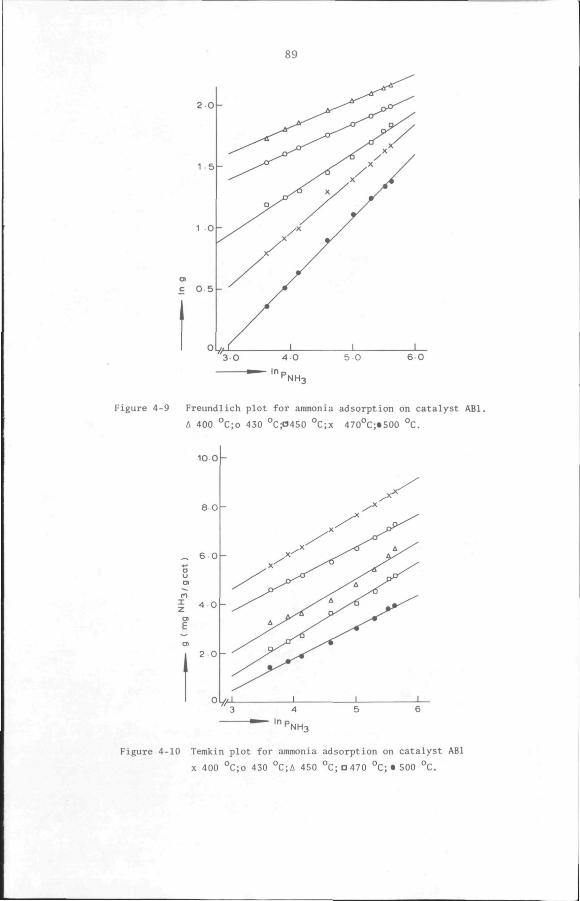
89
2 0
1 5 -
1 0
c 0 5
3 O 4 0 5 O 6 0
NH3
Figure 4-9 Freundlich plot for ammonia adsorption on ca ta lys t ABl.
A 400 °C;o 430 °C;a450 °C,x 470°C;«500 °C.
10 0
8 O
- , 6 0
4 0 -
2 O
Figure 4-10 Temkin plot for ammonia adsorption on catalyst ABl
X 400 °C;o 430 °C;A 450 °C;D470 °C; • 500 °C.
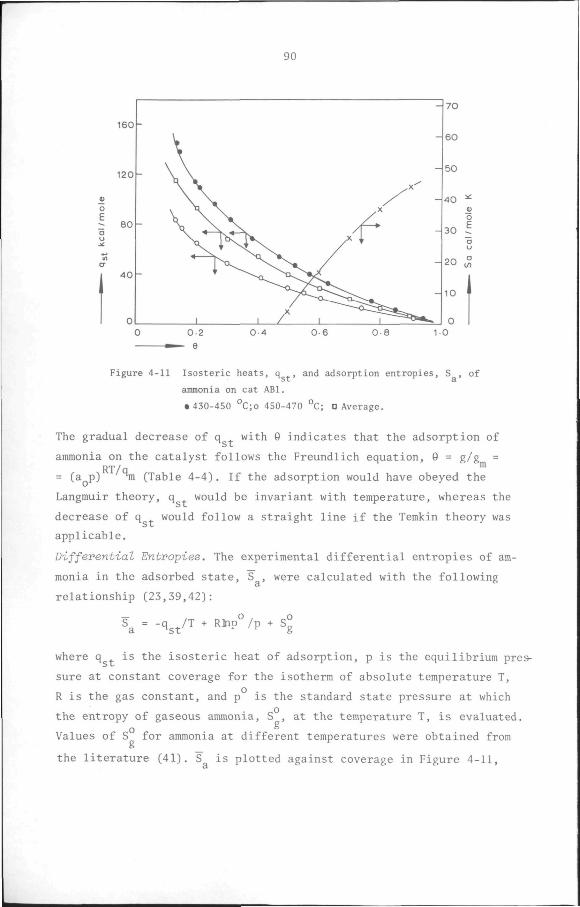
90
160
120
8 0
4 0
0
-
-
~
y
\ ^
^V * " f V *
' f^
1
S . s ^ ^ \ ^
, /
A X
/
^
/
1
/ ^ ^
^ ^
-
-
:
-
-
0 2 - 9
70
60
- 5 0
- 4 0
0 4 0 6 0 8 1 0
Figure 4-11 I sos te r i c hea ts , q and adsorption ent ropies , S , of
ammonia on cat ABl.
• 430-450 °C;o 450-470 °C; D Average.
The gradual decrease of q with 0 indicates that the adsorption of
ammonia on the catalyst follows the Freundlich equation, 0 = g/g = DT /n
= (a p) ™ (Table 4-4). If the adsorption would have obeyed the
Langmuir theory, q would be invariant with temperature, whereas the
decrease of q would follow a straight line if the Temkin theory was
applicable.
Differential Entropies. The experimental differential entropies of am
monia in the adsorbed state, S , were calculated with the following a
relationship (23,39,42): ^a = -'^s^'^ * "^^P" '^ ^ ^g
where q is the isosteric heat of adsorption, p is the equilibrium pres
sure at constant coverage for the isotherm of absolute temperature T,
R is the gas constant, and p is the standard state pressure at which
the entropy of gaseous ammonia, S , at the temperature T, is evaluated. o
Values of S for ammonia at different temperatures were obtained from
the literature (41). S is plotted against coverage in Figure 4-11, a.
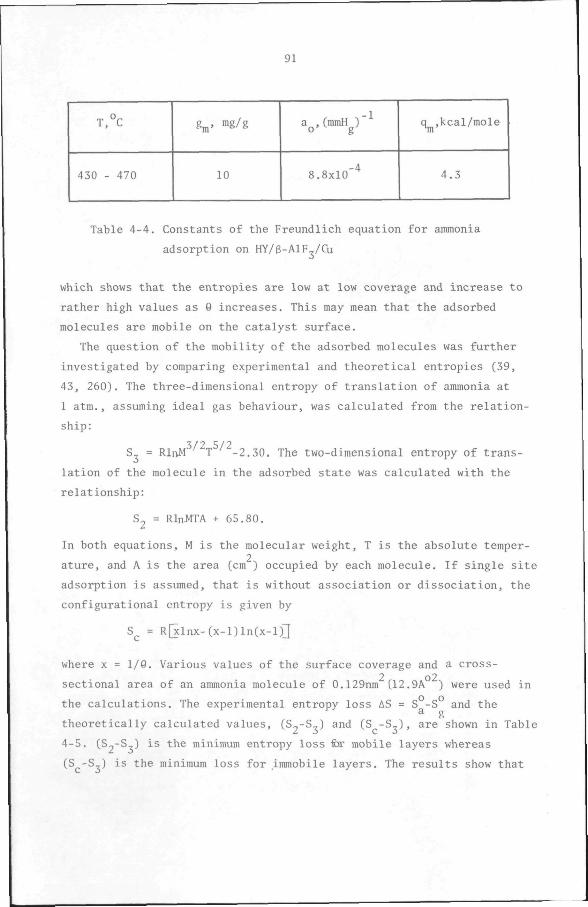
91
T,°C
430 - 470
g^,. mg/g
10
a ,(mmH ) 0 ' ' g'
8.8x10'"*
q ,kcal/mole
4 .3
Table 4-4. Constants of the Freundlich equation for ammonia
adsorption on HY/B-AIF^/Cu
which shows that the entropies are low at low coverage and increase to
rather high values as 0 increases. This may mean that the adsorbed
molecules are mobile on the catalyst surface.
The question of the mobility of the adsorbed molecules was further
investigated by comparing experimental and theoretical entropies (39,
43, 260). The three-dimensional entropy of translation of ammonia at
1 atm., assuming ideal gas behaviour, was calculated from the relation
ship:
3/2 5/2 S, = RlnM T -2.30. The two-dimensional entropy of trans
lation of the molecule in the adsorbed state was calculated with the relationship:
S2 = RlnJ TA + 65.80.
In both equations, M is the molecular weight, T is the absolute temper-2
ature, and A is the area (cm ) occupied by each molecule. If single site
adsorption is assumed, that is without association or dissociation, the
configurational entropy is given by
S = R[xlnx-(x-l)ln(x-l)]
where x = 1/0. Various values of the surface coverage and a cross-
sectional area of an ammonia molecule of 0.129nm (12.9A ) were used in
the calculations. The experimental entropy loss AS = S -S and the
theoretically calculated values, (S^-S,) and (S -S,), are shown in Table
4-5. (S_-S,) is the minimum entropy loss fin* mobile layers whereas
(S -S-) is the minimum loss for immobile layers. The results show that
92
9
0 . 5
0 . 6
0 . 7
0 . 8
0 . 9
S a
e .u .
4
17
28
37
44
S g
e .u .
54.8
54.8
54.8
54.8
54.8
h e .u .
38.8
38.8
38.8
38.8
38.8
^2
e .u .
17.3
17.3
17.3
17.3
17.3
S c
e .u .
2 . 8
2 . 3
1.7
1.3
0 . 7
S -S° a g
e .u .
-50 .4
-37 .8
-26 .8
-17 .8
-10 .8
S2-S3
e .u .
-21 .5
-21 .5
-21 .5
-21 .5
-21 .5
S -S^ c 3
e . u .
-36 .0
-36 .5
-37 .1
-37 .5
-38 .1
Table 4-5: Experimental and theoretical entropy losses for ammonia
adsorption on HY/&-AlF,/Cu.
Temperature range: 430-470 C
the experimental entropy loss is less than the quantities (S„-S,) and
(S -S_) at surface coverages higher than 0.8. This indicates that under
these conditions the adsorbed molecules are mobile. This conclusion is
in agreement with the results of other investigators on the adsorption
of ammonia on related catalysts (17).
The number of acid sites per gram of HY/B-AIF /Cu catalyst,N , was cal
culated from the maximum ammonia adsorption, g (=10mg/g) by the follow
ing relationship:
N = g. N /M, s ^ o '
where g is in grams ammonia per gram catalyst, M is the molecular weight
of ammonia and N is Avogadro's number. The surface area of the catalyst,
S, as computed by the alternative method proposed in section 4.2.3. and
listed in Table 4.1 was used to calculate the number of acid sites per
unit area and the percent of the total sites that are acidic. The re
sulting value for the number of acid sites on the activated catalyst
93
Acid sites/g
20 3.54x10
Acid sites/m
6.46x10^^
% acid sites
11
Table 4-6:Acid sites on HY/6-A1F /Cu at 450°C
(Table 4.6) is higher than the result obtained before activation using
the n-butylamine titration method at room temperature (Table 4-3).
The type of acid sites present on the HY/B-A1F„/Cu catalyst was inves
tigated by determining the ammonia adsorption capacity of samples ac
tivated at different temperatures. Table 4-7 shows the adsorption capa
city, at 500 C, of samples activated at 500°C and 550°C, as well as that
of a sample activated at 550 C to which a small quantity of water had
been added by injecting lyl into the nitrogen stream flowing over it.
The toluene disproportionation performance of the various samples is
also included in Table 4-7. The results show that the adsorption capa
city of the catalyst drops by 70% after activation at 550 C instead of
500 C. Injection of a small amount of water virtually restores its
ammonia adsorption capacity to its orginal level. An analogous result
is obtained for the toluene disproportionation performance of the cat
alyst: the activity of the catalyst activated at 550 C has all but dis
appeared, but addition of a small amount of water partly restores the
activity. The results can be explained on the basis of the formation of
Br(6nsted and Lewis sites on the catalyst surface during activation of
zeolites (88,112). At a certain water content, dissociation of hydrate
water occurs, leading to the formation of protons which combine with
lattice oxygen atoms in the catalyst to form hydroxyl groups which act
as Brjinsted acid sites. Still further water loss, as the temperature of
activation increases to 550 C, results in dehydroxylation of the zeolite
and the formation of inactive and possibly also Lewis acidic sites.
Upon injection of water, these sites revert to Bronsted sites by becom
ing rehydroxylated.
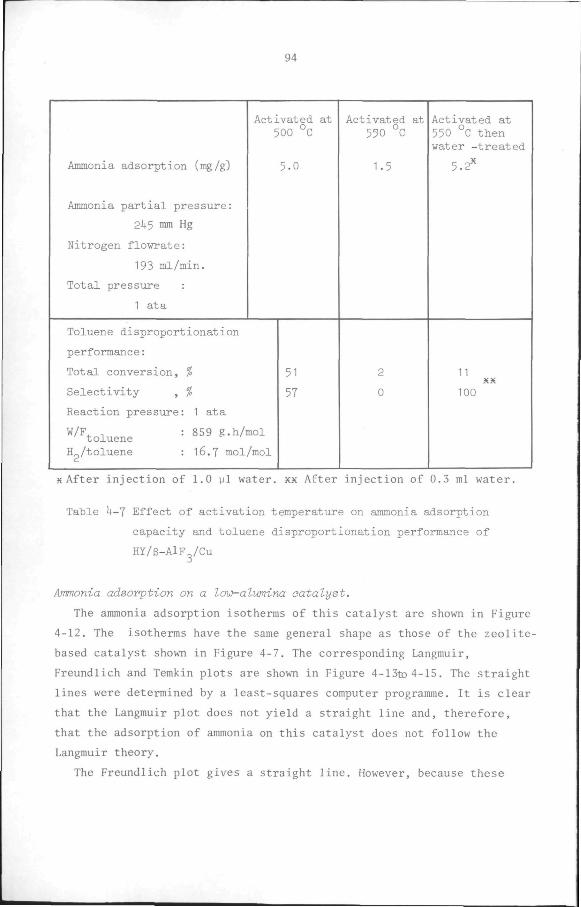
94
Ammonia adsorption (mg/g)
Ammonia partial pressure:
2U5 mm Hg
Nitrogen flowrate:
193 ml/min.
Total pressure :
1 ata
Activated at 500 °C
5.0
Toluene disproportionation
performance:
Total conversion, %
Selectivity , %
Reaction pressure: 1 ata
^/^toluene = 859 g.h/mol
H /toluene : I6.7 mol/mol
51
57
Activated at 550 °C
1.5
2
0
Activated at 550 °C then water -treated
5.2'
11 XX
100
KAfter injection of 1.0 yl water, xx After injection of 0.3 ml water.
Table 1t-7 Effect of activation temperature on ammonia adsorption
capacity and toluene disproportionation performance of
HY/e-AlF /Cu
Ammonia adsorption on a low-alumina catalyst.
The ammonia adsorption isotherms of this catalyst are shown in Figure
4-12. The isotherms have the same general shape as those of the zeolite-
based catalyst shown in Figure 4-7. The corresponding Langmuir,
Freundlich and Temkin plots are shown in Figure 4-13to4-15. The straight
lines were determined by a least-squares computer programme. It is clear
that the Langmuir plot does not yield a straight line and, therefore,
that the adsorption of ammonia on this catalyst does not follow the
Langmuir theory.
The Freundlich plot gives a straight line. However, because these
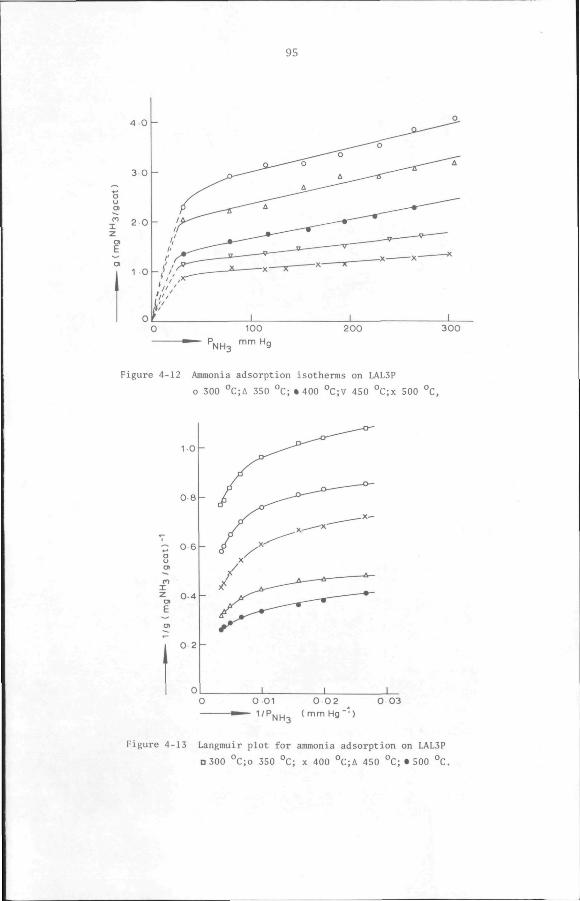
95
4 0 -
I z
Ol E
- P N H 3 ' " " " ^ '
Figure 4-12 Ammonia adsorption isotherms on LAL3P
o 300 °C;A 350 °C; • 400 °C;V 450 °C;x 500 °C,
10 -
0 8
:;: oe
I Z 0.4
O 2
0 01 - 1/P NH3
0 0 2 ( mm Hg " ' )
O 03
Figure 4-13 Langmuir plot for ammonia adsorption on LAL3P
D300 °C;o 350 °C; x 400 °C;A 450 °C; • 500 °C.
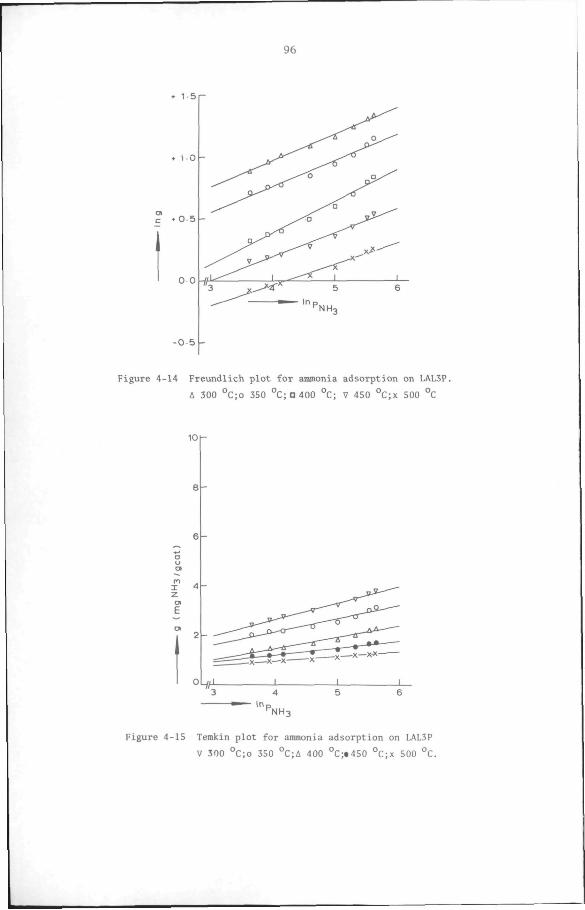
96
1 5 r
-o 5
0 0
-0 5 -
Figure 4-14 Freundlich plot for ammonia adsorption on LAL3P.
A 300 °C;o 350 °C;a400 °C; V 450 °C;x 500 °C
10K
8 -
X 4 z
4/f
" NH-.
Figure 4-15 Temkin plot for ammonia adsorption on LAL3P
V 300 °C;o 350 °C;A 400 °C;^450 °C;x 500 °C.
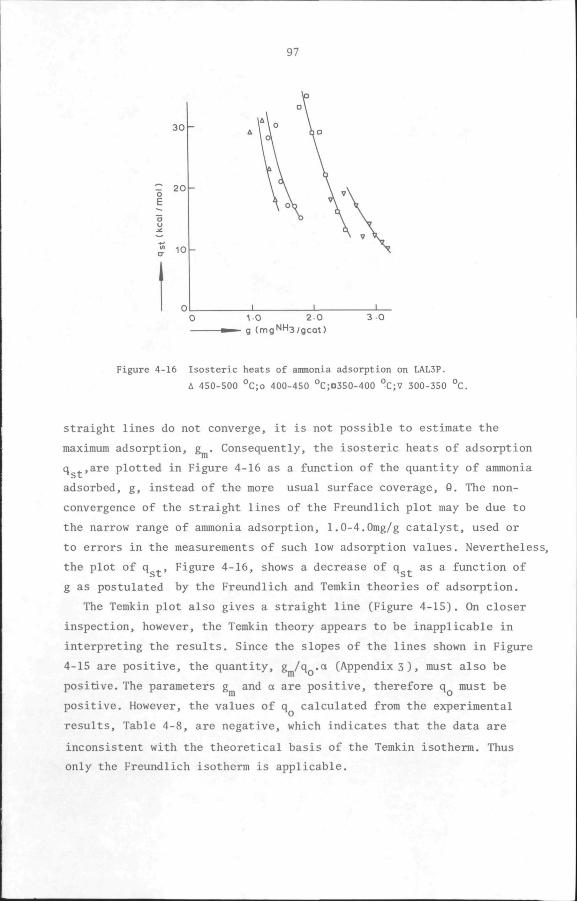
97
30
20
10
1 0 2 0 g (mgNH3/gcat)
3 0
Figure 4-16 Isosteric heats of ammonia adsorption on LAL3P.
A 450-500 °C;o 400-450 °C;D350-400 °C;V 300-350 °C.
Straight lines do not converge, it is not possible to estimate the
maximum adsorption, g . Consequently, the isosteric heats of adsorption
q . ,are plotted in Figure 4-16 as a function of the quantity of ammonia
adsorbed, g, instead of the more usual surface coverage, 0. The non-
convergence of the straight lines of the Freundlich plot may be due to
the narrow range of ammonia adsorption, 1.0-4.0mg/g catalyst, used or
to errors in the measurements of such low adsorption values. Nevertheless,
the plot of q , Figure 4-16, shows a decrease of q as a function of
g as postulated by the Freundlich and Temkin theories of adsorption.
The Temkin plot also gives a straight line (Figure 4-15). On closer
inspection, however, the Temkin theory appears to be inapplicable in
interpreting the results. Since the slopes of the lines shown in Figure
4-15 are positive, the quantity, g /q_-oi (Appendix 3) , must also be
positive. The parameters g and a are positive, therefore q must be
positive. However, the values of q calculated from the experimental
results. Table 4-8, are negative, which indicates that the data are
inconsistent with the theoretical basis of the Temkin isotherm. Thus
only the Freundlich isotherm is applicable.
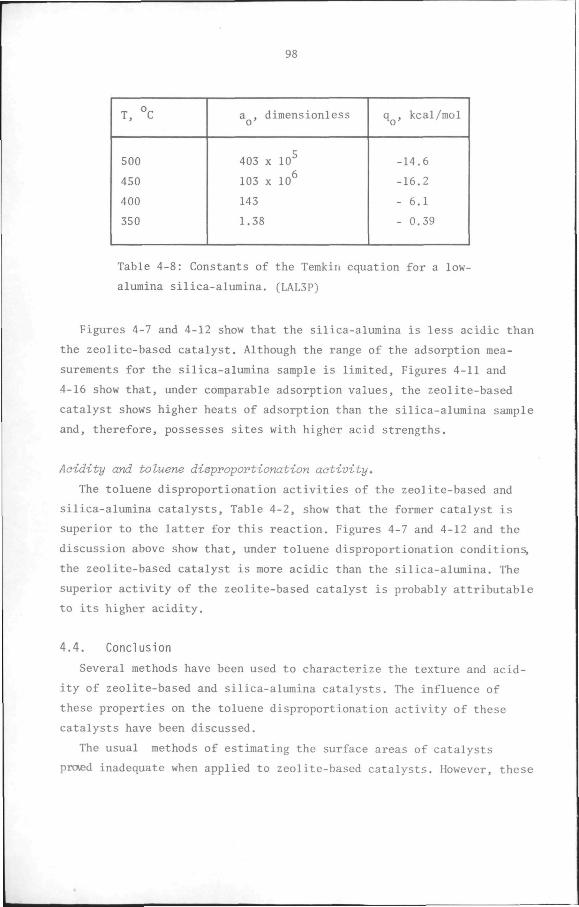
98
T, °C
500
450
400
350
a , dimensionless
403 X 10^
103 X 10^
143
1.38
q , kcal/mol
-14.6
-16.2
- 6.1
- 0.39
Table 4-8: Constants of the Temkin equation for a low-
alumina silica-alumina. (LAL3P)
Figures 4-7 and 4-12 show that the silica-alumina is less acidic than
the zeolite-based catalyst. Although the range of the adsorption mea
surements for the silica-alumina sample is limited. Figures 4-11 and
4-16 show that, under comparable adsorption values, the zeolite-based
catalyst shows higher heats of adsorption than the silica-alumina sample
and, therefore, possesses sites with higher acid strengths.
Acidity and toluene disproportionation activity.
The toluene disproportionation activities of the zeolite-based and
silica-alumina catalysts. Table 4-2, show that the former catalyst is
superior to the latter for this reaction. Figures 4-7 and 4-12 and the
discussion above show that, under toluene disproportionation conditions^
the zeolite-based catalyst is more acidic than the silica-alumina. The
superior activity of the zeolite-based catalyst is probably attributable
to its higher acidity.
4.4. Conclusion
Several methods have been used to characterize the texture and acid
ity of zeolite-based and silica-alumina catalysts. The influence of
these properties on the toluene disproportionation activity of these
catalysts have been discussed.
The usual methods of estimating the surface areas of catalysts
proied inadequate when applied to zeolite-based catalysts. However, these
99
methods yielded results which were useful in comparing the texture of the
catalysts used in the disproportionation studies reported here.
An alternative method of estimating the surface area of zeolites and
zeolite-based catalysts has been proposed. The surface area obtained by
this method for Y zeolite containing binder suggests that this binder
blocks some of the micropores. The micropore volumes required for this
calculation have been obtained by applying the t-method.
Mercury penetration was used to determine the pore-size distribution
in the transitional pores, but mercury was incapable of penetrating the
micropores.
The ammonia adsorption isotherms of the zeolite-based and silica-
alumina catalysts were consistent with the Freundlich theory of adsorp
tion.
The activity of the HY/B-AIF /Cu catalyst for toluene disproportion
ation appears to be localized mainly in its transitional pores. The
micropores, on the other hand, gradually fill up, presumably with coke
or heavy products, as the reaction progresses.
The acidic properties of the zeolite-based catalyst are consistent
with the hypothesis that its high performance for the disproportionation
of toluene is due to its acidity. The lower acidity and acid strength
of silica-alumina are thought to be responsible for its lower dis
proportionation performance
100
C H A P T E R 5
KINETICS OF TOLUENE DISPROPORTIONATION ON AN HY/B-ALF^/Cu CATALYST
5.1 INTRODUCTION
Very little of the large body of published information on the
disproportionation of toluene deals with the kinetics of the reaction.
The results of the kinetic studies reported in the literature are
summarized in Table 5-1. Izumi and Shiba (83), as well as Ogawa (175)
and Iwamura (84) identified the surface reaction as the rate-determining
step. The value of -1.0 kcal/mol for the heat of adsorption of toluene
in Ogawa and Iwamura's rate equation seems rather low in view of the
fact that chemisorption is very likely under their experimental
conditions. None of the above-mentioned authors corrected their data
for the effect of catalyst deactivation on the rate of reaction.
Yashima's (90) studies on H-mordenite took the rather pronounced
catalyst deactivation into account by using the reaction rates extra
polated to zero time on stream. Since the initial catalyst activity
was invariably high, the rates obtained in this manner were also high
and it is, therefore, not surprising that above 350 C pore diffusion
was the rate-determining step: above this temperature, the apparent
activation energy decreased to 11.8 kcal/mol from 88.8 kcal/mol as was
determined below 350 C. Yashima found a zero order dependency of the
rate on the partial pressure of toluene and ascribed this to the strong
adsorption of toluene on the catalyst.
In this chapter, the kinetics is studied with the HY/fs-ALF /Cu
catalyst (18% B-ALF. and 10% Cu) prepared in chapter 3, since
experimental results showed that it possessed a satisfactory activity,
selectivity and stability. After a discussion of the methodology of
measuring and interpreting the kinetics of heterogeneous catalytic
reactions, some preliminary experiments are performed in order to study
the influence of some important process variables on the reaction, viz.
space time, temperature, toluene partial pressure, hydrogen partial
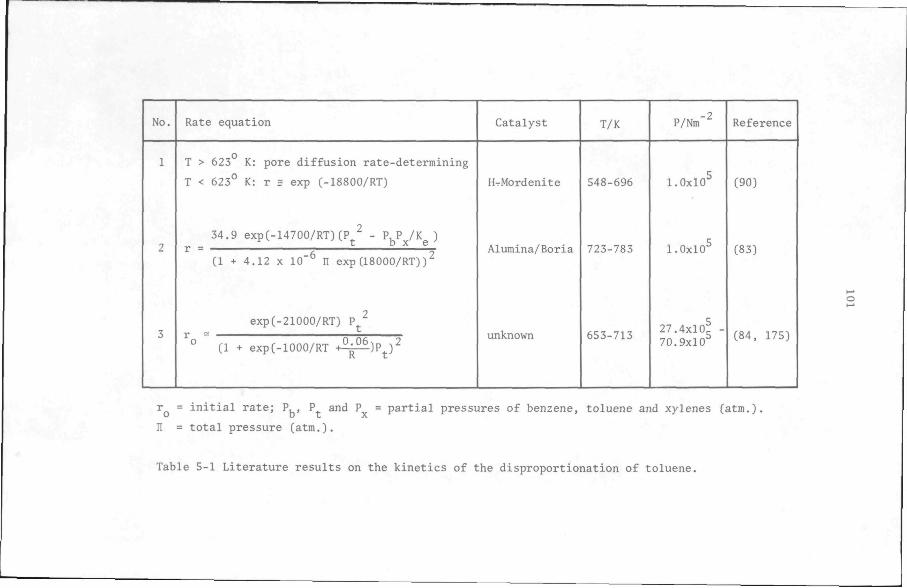
No.
1
2
3
Rate equation
T > 623 K: pore diffusion rate-determining
T < 623° K: r s exp (-18800/RT)
34.9 exp(-14700/RT)(P^ - P P /K^ )
(1 + 4.12 x 10'^ n exp(18000/RT))^
exp(-21000/RT) P^
'° (1 + exp(-1000/RT + M i ) P j 2
Catalyst
H-Mordenite
Alumina/Boria
unknown
T/K
548-696
723-783
653-713
P/Nm'^
1.0x10^
1.0x10^
27.4x10^ -70.9x10
Reference
(90)
(83)
(84, 175)
r^ = initial rate; P., P and P = partial pressures of benzene, toluene and xylenes (atm.).
n = total pressure (atm.).
Table 5-1 Literature results on the kinetics of the disproportionation of toluene.
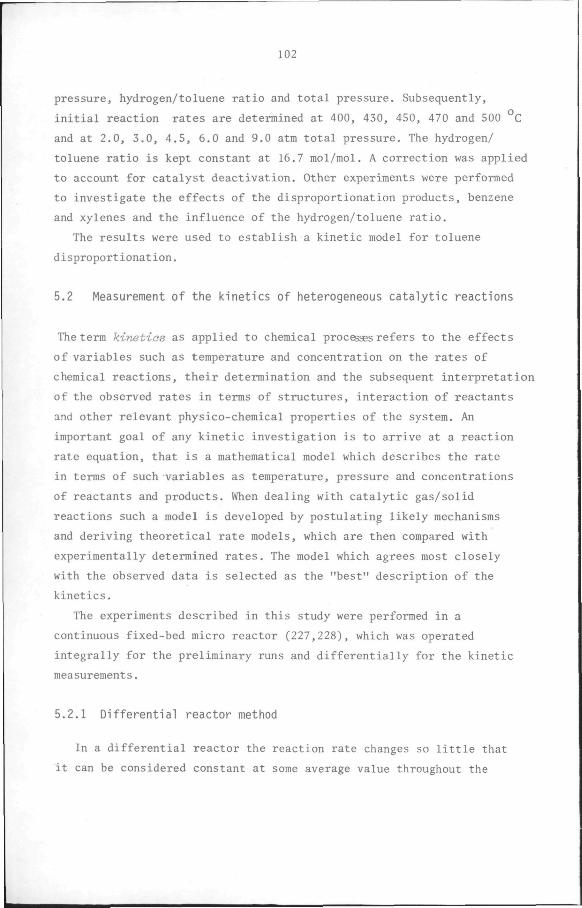
102
pressure, hydrogen/toluene ratio and total pressure. Subsequently,
initial reaction rates are determined at 400, 430, 450, 470 and 500 C
and at 2.0, 3.0, 4.5, 6.0 and 9.0 atm total pressure. The hydrogen/
toluene ratio is kept constant at 16.7 mol/mol. A correction was applied
to account for catalyst deactivation. Other experiments were performed
to investigate the effects of the disproportionation products, benzene
and xylenes and the influence of the hydrogen/toluene ratio.
The results were used to establish a kinetic model for toluene
disproportionation.
5.2 Measurement of the kinetics of heterogeneous catalytic reactions
The term kinetics as applied to chemical processsrefers to the effects
of variables such as temperature and concentration on the rates of
chemical reactions, their determination and the subsequent interpretation
of the observed rates in terms of structures, interaction of reactants
and other relevant physico-chemical properties of the system. An
important goal of any kinetic investigation is to arrive at a reaction
rate equation, that is a mathematical model which describes the rate
in terms of such variables as temperature, pressure and concentrations
of reactants and products. When dealing with catalytic gas/solid
reactions such a model is developed by postulating likely mechanisms
and deriving theoretical rate models, which are then compared with
experimentally determined rates. The model which agrees most closely
with the observed data is selected as the "best" description of the
kinetics.
The experiments described in this study were performed in a
continuous fixed-bed micro reactor (227,228), which was operated
integrally for the preliminary runs and differentially for the kinetic
measurements.
5.2.1 Differential reactor method
In a differential reactor the reaction rate changes so little that
it can be considered constant at some average value throughout the
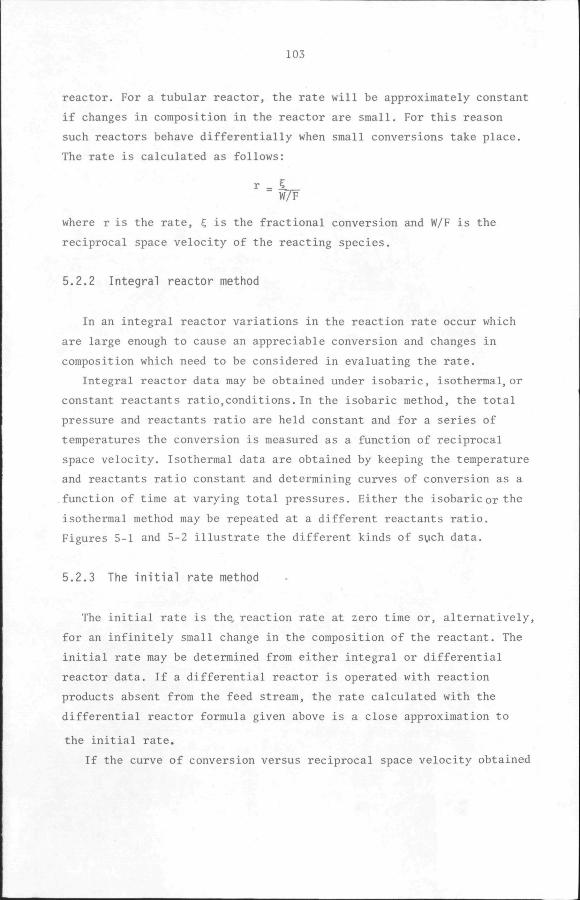
103
reactor. For a tubular reactor, the rate will be approximately constant
if changes in composition in the reactor are small. For this reason
such reactors behave differentially when small conversions take place.
The rate is calculated as follows:
r = L_ W/F
where r is the rate, E, is the fractional conversion and W/F is the
reciprocal space velocity of the reacting species.
5.2.2 Integral reactor method
In an integral reactor variations in the reaction rate occur which
are large enough to cause an appreciable conversion and changes in
composition which need to be considered in evaluating the rate.
Integral reactor data may be obtained under isobaric, isothermal, or
constant reactants ratio,conditions.In the isobaric method, the total
pressure and reactants ratio are held constant and for a series of
temperatures the conversion is measured as a function of reciprocal
space velocity. Isothermal data are obtained by keeping the temperature
and reactants ratio constant and determining curves of conversion as a
function of time at varying total pressures. Either the isobaric or the
isothermal method may be repeated at a different reactants ratio.
Figures 5-1 and 5-2 illustrate the different kinds of sych data.
5.2.3 The initial rate method
The initial rate is the, reaction rate at zero time or, alternatively,
for an infinitely small change in the composition of the reactant. The
initial rate may be determined from either integral or differential
reactor data. If a differential reactor is operated with reaction
products absent from the feed stream, the rate calculated with the
differential reactor formula given above is a close approximation to
the initial rate.
If the curve of conversion versus reciprocal space velocity obtained
104
430°C
400 °C
W/F (ghr/mol)
Figure 5-1 Hypothetical example of isobaric plot of integral reactor
data.
— W/F ( g h r / m o l )
Figure 5-2 Hypothetical example of isothermal plot of integral reactor data.
by the integral method as described above is extrapolated to zero
reciprocal space velocity and different ia ted graphically or analyt ical ly
at that point , the slope evaluated gives the i n i t i a l r a t e .
105
5,3 Influence of physical transport processes on the kinetics of
heterogeneous catalytic reactions
A heterogeneous catalytic process is made up of the following
sequence of steps:
(i) Transport of reactants from the bulk fluid to the adjoining fluid-
catalyst interface by film diffusion of reactants through the
Laminar boundary layer surrounding the catalyst particle.
(ii) Pore diffusion of reactants to the internal surface of the
catalyst, if porous.
(iii) Adsorption (chemisorption) of reactants on the active sites on
the catalyst.
(iv) Surface reaction of the adsorbed reactants to form adsorbed
products.
(v) Desorption of the adsorbed products from the active sites,
(vi) Pore diffusion of the products from the internal surface to the
outer surface of the particle.
(vii) Film diffusion of products through the laminar boundary layer
around the catalyst pellet to the bulk fluid stream.
If any of the physical steps, (i), (ii), (vi) and (vii) is slow in
comparison with the chemical reaction step, the overall rate as
determined by measurements in the bulk fluid phase will not accurately
reflect the intrinsic reaction rate and even the selectivity or product
distribution of the reaction may be affected (210). These physical
factors which can falsify the measured kinetics of a heterogeneous
catalytic reaction are (211-214): non-ideal flow in the reactor, film
diffusion, pore diffusion, adsorption, desorption and heat effects.
Heat effects in kinetic measurements are obviated by operating the
reactor isothermally. The effects of non-ideality and diffusion are
eliminated by choosing the reaction conditions in such a way that they
either do not occur or have been reduced to a level where their effects
can be neglected. With most of these steps eliminated as described above
the observed rate includes the adsorption-desorption and chemical
reaction steps, (iii)-(v), described above. The criteria which ensure
106
the absence or the elimination of the complicating effects of these
physical factors are described individually below whereas the
calculations concerning the kinetic studies discussed in this thesis
are presented in Appendix 4.
5.3.1 Non-ideality of the reactor
For the fixed-bed reactor employed here to approach plug-flow
behaviour, the radial velocity profile must be as flat as possible.
The following criteria (208, 210, 235, 236), which ensure that these
conditions are met, were applied to test the ideality of the
experimental reactor (see Appendix 4):
d/d ^ 20 P
L/d 5- 100 P
Re > 10 P
where d is the diameter of the fixed-bed reactor, d is the diameter of P
the catalyst particles, I, is the length of the fixed-bed reactor and
Re is the Reynolds number based on the particle diameter.
5.3.2 External and Internal Mass Transport Resistance
The absence of film and pore diffusion (209-211, 237, 238) was
checked by calculation. The significance of film diffusion was estimated
by calculating the drop in the partial pressure of the reactant over the
laminar boundary layer surrounding a catalyst particle using an
experimental reaction rate (see Appendix 4). The criterion applied was
that if ' p/p < 0.01, film diffusion could be considered negligible.
The criterion proposed by Weisz (240) was used to decide whether
pore diffusion could be disregarded:
d rP ^ = 4Vc <
e s
107
where $ is the Thiele modulus for a spherical catalyst pellet, d is
the diameter of the pellet,]' is the density of the catalyst pellet and
D is the effective diffusivity within the catalyst.
5.3.3 Pressure drop in the reactor
An excessive pressure drop over the reactor is undesirable not only
because it invalidates the plug-flow behaviour assumed for kinetic
analysis but also because it may adversely affect the selectivity of the
reaction under investigation. Methods for calculating the pressure
drop when compressible fluids flow over particles of different shapes
are described in the literature (242-247). Erguns equation is perhaps
the most widely used (245, 246) and is valid for spherical particles
and for a ratio of catalyst particle diameter to reactor inside diameter
of less than 0.05:
^ = ifL (l-j) C150_y ^ L d e- f Vd '• ^' • -•
2 where Ap = pressure drop, N/m
L = reactor length, m
J = fluid density, kg/m
V = superficial fluid velocity, based on empty reactor, m/s
d = catalyst particle diameter, m
E = intergranular porosity of catalyst bed 2
y = fluid viscosity, N.s/m
The pressure drop over the reactor under the conditions of the
experiments described in this chapter is calculated in Appendix 4 using
the relationship given above and assuming the catalyst particles to be
spherical.
5.4 Reaction rate models
Various kinds of rate models are used for correlating reaction rate
data (212). A model which is derived from some basic physical and
chemical phenomena taking place is described as mechanistic whereas one
108
which is not based on any such phenomena is termed empirical. The two
most widely used types are: power function and Hougen-Watson models
(213).
5.4.1 Power function rate models
In terms of partial pressures these are of the general form:
n ^j m , r = k, n R - ko n P.J
li=l' j=l -l
where r is the reaction rate, k and k are the rate constants for the
forward and reverse reactions respectively, P. and P. are the partial
pressures of the reactants and products respectively and a. and b. are
the reaction orders. The problem of using such a model to correlate
experimental data boils down to that of determining the reaction orders
and the rate constant (212, 219-226).
5.4.2 Hougen-Watson models
These models, which include Langmuir-Hinshelwood and Eley-Rideal
types, have the general form:
koexp(-E/RT) f(p) (1-a)
(1 + g(T, p) )"
In this equation the numerator is the product of a pure kinetic term,
f(p), and a potential term, (I-a), which corrects for the deviation
from thermodynamic equilibrium. The denominator contains adsorption
terms, g(T,P), which originate from the coverage of the active sites
by species present in the reacting system and n is the number of sites
involved in the rate-determining step. The Hougen-Watson (247, 250,
251 ) approach to reaction rate modelling can be summarized as follows:
The initial stage.
A family of plausible models is formulated by postulating a chemical
dissociation mechanism, assuming one of the elementary steps in the
mechanism to be rate-controlling while all the others are at
109
equilibrium, and deriving a reaction rate equation for each case. If
two adjacent active sites are involved in the rate-determining step,
the mechanism is the classical Langmuir-Hinshelwood dual-site type,
whereas if only one site is concerned it is an Eley-Rideal single-site
mechanism.
The intermediate stage.
The models developed in the previsous stage are fitted to the data by
non-linear regression analysis. Physical and chemical criteria are
used to reject those models which may be considered implausible. The
F-test is applied to the variances obtained for the unrejected models
in order to select those that have the lowest variances which are
indistinguishable from each other in a statistical sense.
The final stage.
If at this stage morethan one model is left, such quantities as surface
coverage and apparent activatian energy are calculated from these models and
compared with the corresponding values determined 'from the experimental
measurements (233). The trends in these quantities may provide further
arguments for a final choice among the models.
The Hougen-Watson method has been critized on theoretical (253) as
well as statistical grounds (205, 255). Weller (253) has challenged
the theoretical validity commonly attributed to Hougen-Watson models
and argued that power function models usually correlate kinetic data
just as well. Boudart (254), on the other hand, has defended the
rational application of Hougen-Watson models, emphasizing their value
in extrapolation and in gaining some insight into the mechanism of
reactions.
5.5 Experimental
5.5.1 Materials
The toluene, analytical grade, was used without further purification.
Chemically pure hydrogen was dried over molecular sieves 3A and passed
over reduced copper oxide (BASF R3-11 BTS) catalyst to remove traces of
oxygen and other impurities.
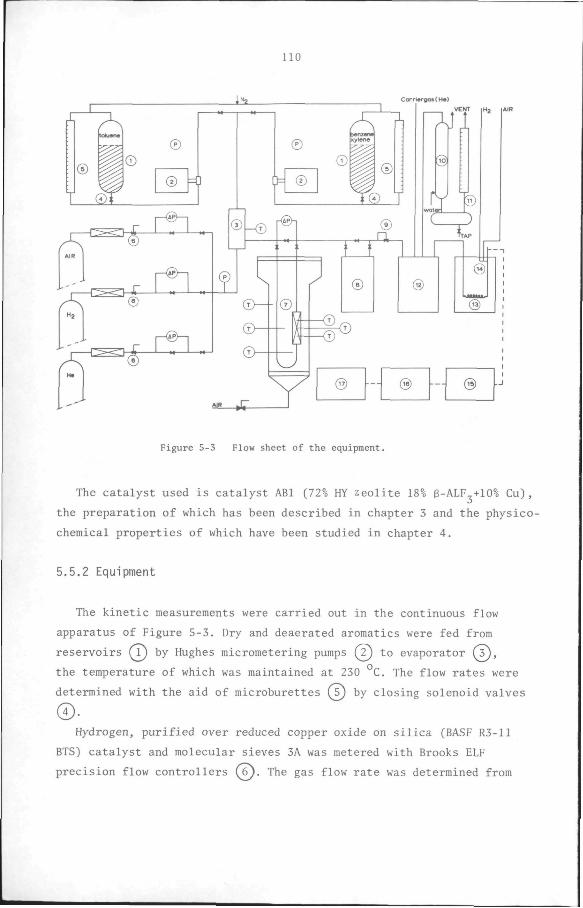
110
1
i ®
loMta
1 © ©
® _0]
_K_
^
£?1
®
n ®
®-<D HSh
©
CarriarQasCH*}
®
-® ^ (D
®
J ®
s
TTAP
@
Hj
@
® • - ® @
Figure 5-3 Flow sheet of the equipment.
The catalyst used is catalyst ABl (72% HY zeolite 18% 6-ALF +10% Cu),
the preparation of which has been described in chapter 3 and the physico-
chemical properties of which have been studied in chapter 4.
5.5.2 Equipment
The kinetic measurements were carried out in the continuous flow
apparatus of Figure 5-3. Dry and deaerated aromatics were fed from
reservoirs (Y) by Hughes micrometering pumps (2j to evaporator (3J,
the temperature of which was maintained at 230 C. The flow rates were
determined with the aid of microburettes (s) by closing solenoid valves
Hydrogen, purified over reduced copper oxide on silica (BASF R3-11
BTS) catalyst and molecular sieves 3A was metered with Brooks ELF
precision flow controllers (6). The gas flow rate was determined from
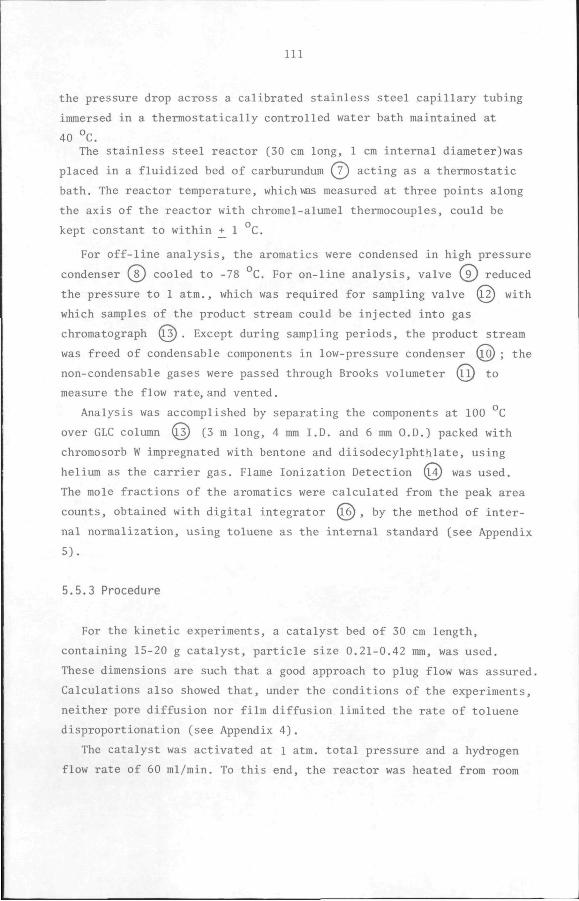
Ill
the pressure drop across a calibrated stainless steel capillary tubing
immersed in a thermostatically controlled water bath maintained at
40 °C.
The stainless steel reactor (30 cm long, 1 cm internal diameter)was
placed in a fluidized bed of carburundum (V) acting as a thermostatic
bath. The reactor temperature, which was measured at three points along
the axis of the reactor with chromel-alumel thermocouples, could be
kept constant to within + 1 C.
For off-line analysis, the aromatics were condensed in high pressure
condenser (sj cooled to -78 C. For on-line analysis, valve (V) reduced
the pressure to 1 atm., which was required for sampling valve H2) with
which samples of the product stream could be injected into gas
chromatograph Q_^. Except during sampling periods, the product stream
was freed of condensable components in low-pressure condenser \}v) ; the
non-condensable gases were passed through Brooks volumeter Q_l) to
measure the flow rate, and vented.
Analysis was accomplished by separating the components at 100 C
over GLC column (jj) (3 m long, 4 mm I.D. and 6 mm O.D.) packed with
chromosorb W impregnated with bentone and diisodecylphthlate, using
helium as the carrier gas. Flame Ionization Detection Q4) was used.
The mole fractions of the aromatics were calculated from the peak area
counts, obtained with digital integrator n6) , by the method of inter
nal normalization, using toluene as the internal standard (see Appendix
5).
5.5.3 Procedure
For the kinetic experiments, a catalyst bed of 30 cm length,
containing 15-20 g catalyst, particle size 0.21-0.42 mm, was used.
These dimensions are such that a good approach to plug flow was assured.
Calculations also showed that, under the conditions of the experiments,
neither pore diffusion nor film diffusion limited the rate of toluene
disproportionation (see Appendix 4).
The catalyst was activated at 1 atm. total pressure and a hydrogen
flow rate of 60 ml/min. To this end, the reactor was heated from room
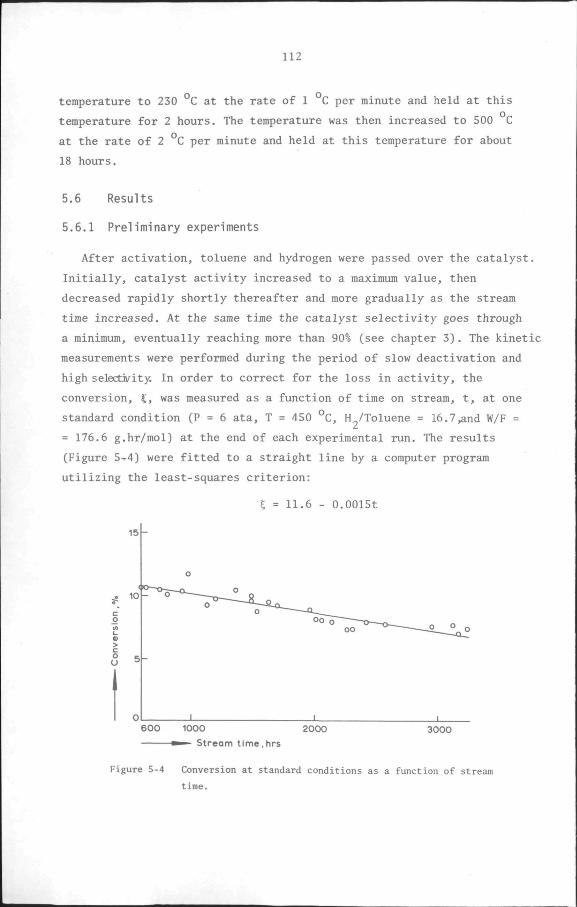
112
temperature to 230 °C at the rate of 1 C per minute and held at this
temperature for 2 hours. The temperature was then increased to 500 C
at the rate of 2 °C per minute and held at this temperature for about
18 hours.
5.6 Results
5.6.1 Preliminary experiments
After activation, toluene and hydrogen were passed over the catalyst.
Initially, catalyst activity increased to a maximum value, then
decreased rapidly shortly thereafter and more gradually as the stream
time increased. At the same time the catalyst selectivity goes through
a minimum, eventually reaching more than 90% (see chapter 3). The kinetic
measurements were performed during the period of slow deactivation and
high selectivity. In order to correct for the loss in activity, the
conversion, 5, was measured as a function of time on stream, t, at one
standard condition (P = 6 ata, T = 450 °C, H /Toluene = 16.7,and W/F =
= 176.6 g.hr/mol) at the end of each experimental run. The results
(Figure 5-'4) were fitted to a straight line by a computer program
utilizing the least-squares criterion:
C = 1 1 . 6 - O.OOlSt
1 5 -
o u
6 0 0 1000
" - Stream time,hrs
2000 3000
Figure 5-4 Conversion at standard conditions as a function of stream
time.
113
This relationship was used to correct for deactivation by normalizing
the measured conversions to the catalyst activity observed at 1400
hours stream time. The theory behind this method of correction is
presented in Appendix 6; the normalization equation is:
5 = 5 (11.6 - O.OOlSt) m.
where £ is the corrected conversion, £ is the measured conversion ' m
which is to be corrected and £ is the conversion measured at standard conditions at about the same stream time as £ . The value of 1400 hours
m was substituted for t in the above equation.
Influence of H^toluene ratio and total pressure on catalyst deactivation.
Figure 5.5 shows the results of two experiments, one with hydrogen
and toluene as the feed, the other with argon and toluene. The gas/
toluene ratio (16.6 mol/mol and the total pressure (1.1 ata) were the
same in both cases. The results show that deactivation is faster in the
absence of hydrogen and suggest that, at constant total pressure and
o u
50 100
Stream t ime , hrs 150
Figure 5-5 Influence of Hj/Toluene ratio on catalyst deactivatio
at 500 °C and 1.1 ata.
o H^/Toluene = 16.7 mol/mol;• Hj/Toluene = 0
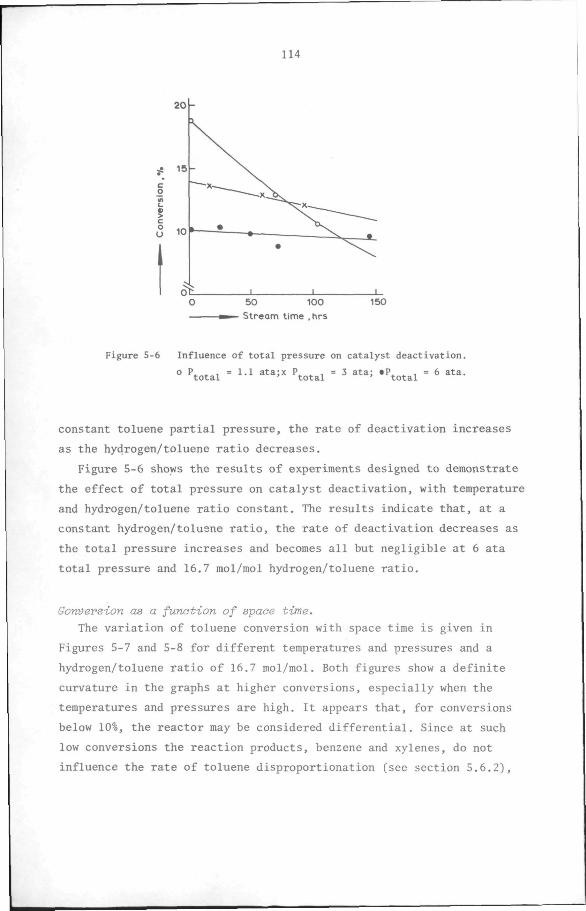
114
Ot I I l_ 0 50 100 150
^m— Stream time ,hrs
Figure 5-6 Influence of t o t a l pressure on ca ta lys t deac t iva t ion .
o P^ ^ , = 1 . 1 a ta ;x P.,. .„ , = 3 a t a ; •P^ ^ , = 6 a t a . t o t a l t o t a l ' t o t a l
constant toluene partial pressure, the rate of deactivation increases
as the hydrogen/toluene ratio decreases.
Figure 5-6 shows the results of experiments designed to demonstrate
the effect of total pressure on catalyst deactivation, with temperature
and hydrogen/toluene ratio constant. The results indicate that, at a
constant hydrogen/toluene ratio, the rate of deactivation decreases as
the total pressure increases and becomes all but negligible at 6 ata
total pressure and 16.7 mol/mol hydrogen/toluene ratio.
Gonversion as a function of space time.
The variation of toluene conversion with space time is given in
Figures 5-7 and 5-8 for different temperatures and pressures and a
hydrogen/toluene ratio of 16.7 mol/mol. Both figures show a definite
curvature in the graphs at higher conversions, especially when the
temperatures and pressures are high. It appears that, for conversions
below 10%, the reactor may be considered differential. Since at such
low conversions the reaction products, benzene and xylenes, do not
influence the rate of toluene disproportionation (see section 5.6.2),
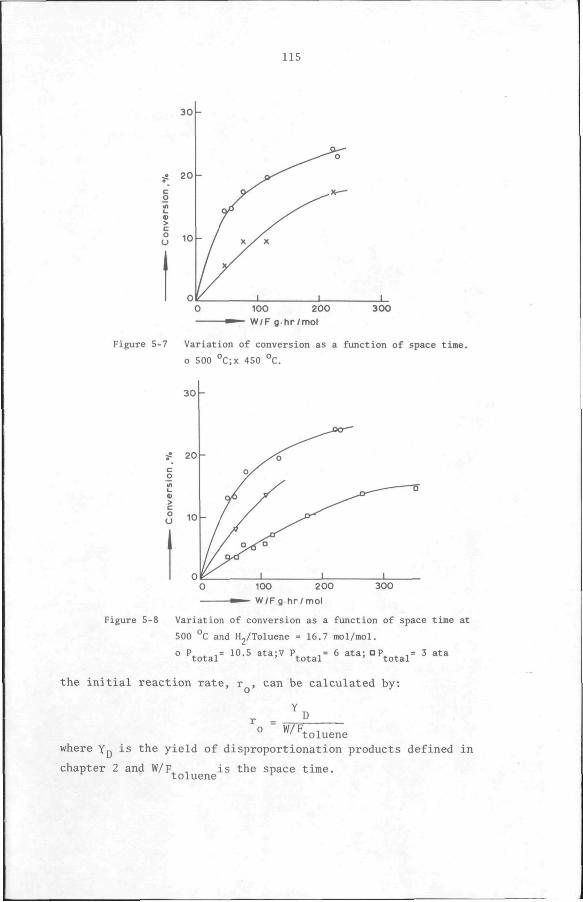
115
3 0 -
j 20 -
100 200 W / F g h r / m o l
300
Figure 5-7 Variation of conversion as a function of space time.
o 500 °C;x 450 °C.
30-
10O 200
W/Fg hr /mol
Figure 5-8 Variation of conversion as a function of space time at
500 °C and H2/Toluene = 1 6 . 7 mol/mol.
o P^ ^ = 10.5 ata;V P^ ^ = 6 a t a ; DP^ ^ ,= 3 a ta t o t a l ' t o t a l t o t a l
the i n i t i a l reaction r a t e , r , can be calculated by:
^o W/ F. D
toluene
where Yn is the yield of disproportionation products defined in
chapter 2 and W/F^ , is the space time. toluene
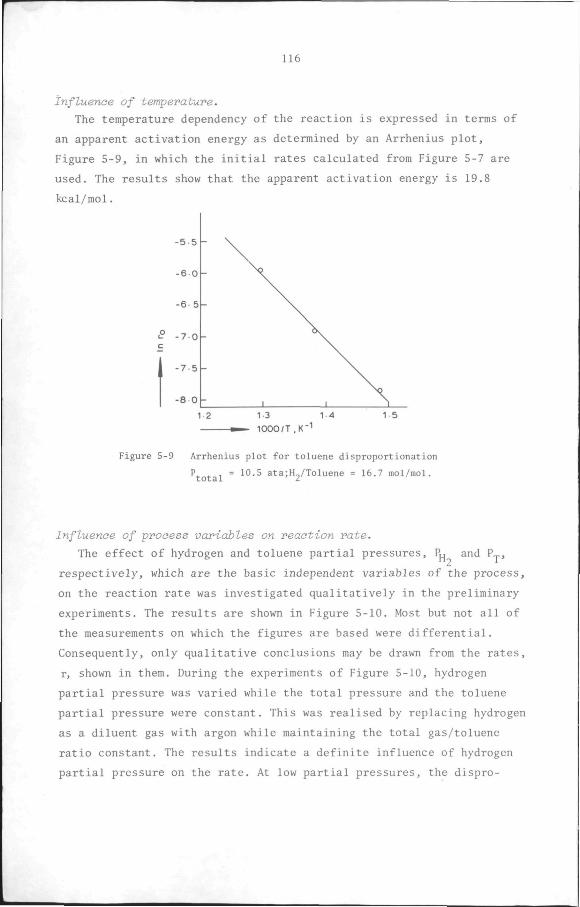
116
Influence of temperature.
The temperature dependency of the reaction is expressed in terms of
an apparent activation energy as determined by an Arrhenius plot,
Iigure 5-9, m which the initial rates calculated from Figure 5-7 are
used. The results show that the apparent activation energy is 19.8
kcal/mol.
-5 5
-6 0
-6 5
S -7 0 c
-7 5
-8 0
12 13 14 15 ^ — lOOO/T.K"''
Figure 5-9 Arrhenius plot for toluene disproportionation
''total ' "" ata.H^/Toluene = 16.7 mol/mol.
Influence of process variables on reaction rate.
The effect of hydrogen and toluene partial pressures, Pu and P„,
respectively, which are the basic independent variables of the process,
on the reaction rate was investigated qualitatively in the preliminary
experiments. The results are shown m Figure 5-10. Most but not all of
the measurements on which the figures are based were differential.
Consequently, only qualitative conclusions may be drawn from the rates,
r, shown m them. During the experiments of Figure 5-10, hydrogen
partial pressure was varied while the total pressure and the toluene
partial pressure were constant. This was realised by replacing hydrogen
as a diluent gas with argon while maintaining the total gas/toluene
ratio constant. The results indicate a definite influence of hydrogen
partial pressure on the rate. At low partial pressures, the dispro-
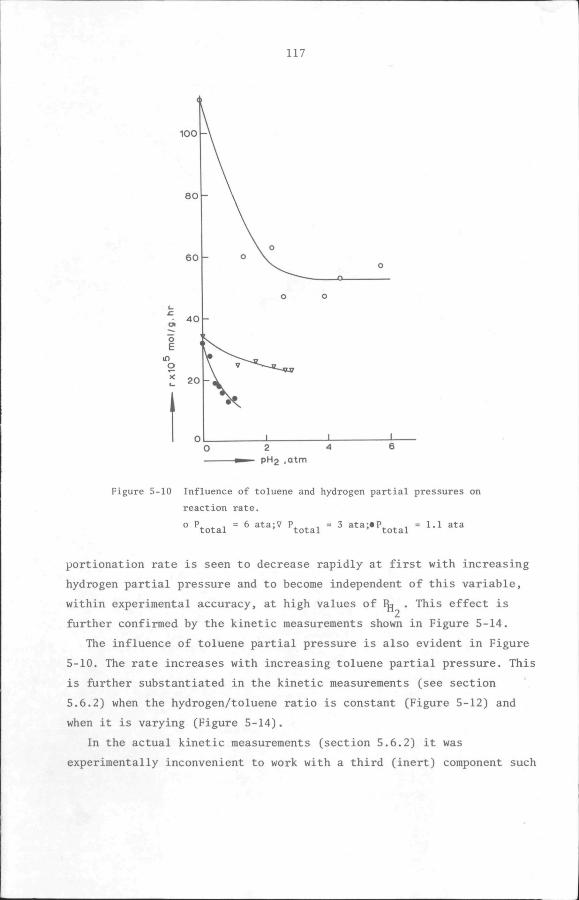
117
100 -
o E
in o
40
20
O o
2 4 pH2 ,atm
Figure 5-10 Influence of toluene and hydrogen partial pressures on
reaction rate.
o P^ ^ , = 6 ata;V P ^ , = 3 ata;«P^ ^ , = 1.1 ata total total ' total
portionation rate is seen to decrease rapidly at first with increasing
hydrogen partial pressure and to become independent of this variable,
within experimental accuracy, at high values of I . This effect is
further confirmed by the kinetic measurements shown in Figure 5-14.
The influence of toluene partial pressure is also evident in Figure
5-10. The rate increases with increasing toluene partial pressure. This
is further substantiated in the kinetic measurements (see section
5.6.2) when the hydrogen/toluene ratio is constant (Figure 5-12) and
when it is varying (Figure 5-14).
In the actual kinetic measurements (section 5.6.2) it was
experimentally inconvenient to work with a third (inert) component such
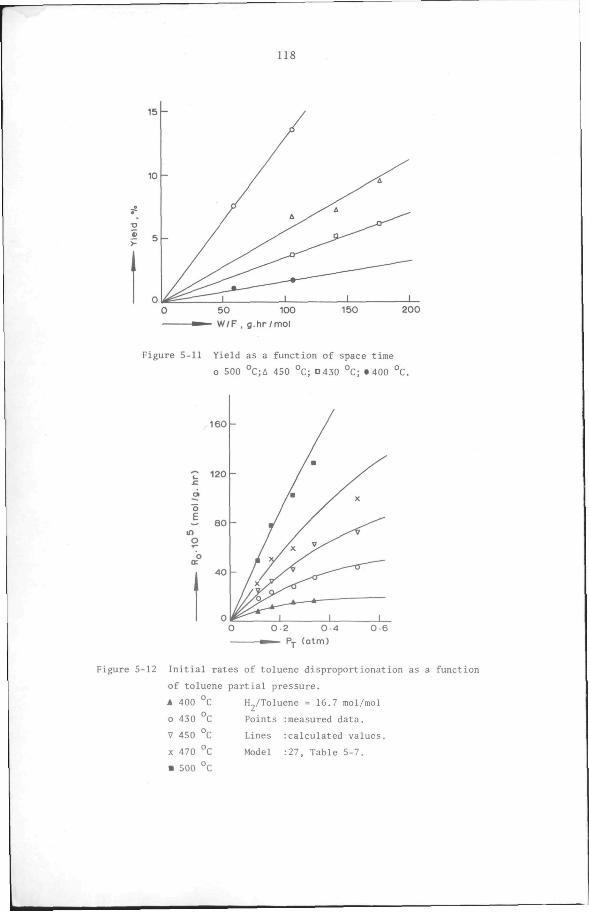
118
60 100 W/F , g h r /mo i
150 200
Figure 5-11 Yield as a function of space time
o 500 °C;A 450 °C; D430 °C; •400 °C.
160
•? 120 -
o E
in O
0 2 0 4
Pj (atm)
Figure 5-12 Initial rates of toluene disproportionation as a function
of toluene partial pressure.
o 430 C
V 450 °C
X 470 °C
• 500 °C
H-/Toluene = 16.7 mol/mol
Points :measured data.
Lines :calculated values.
Model -27, Table 5-7.
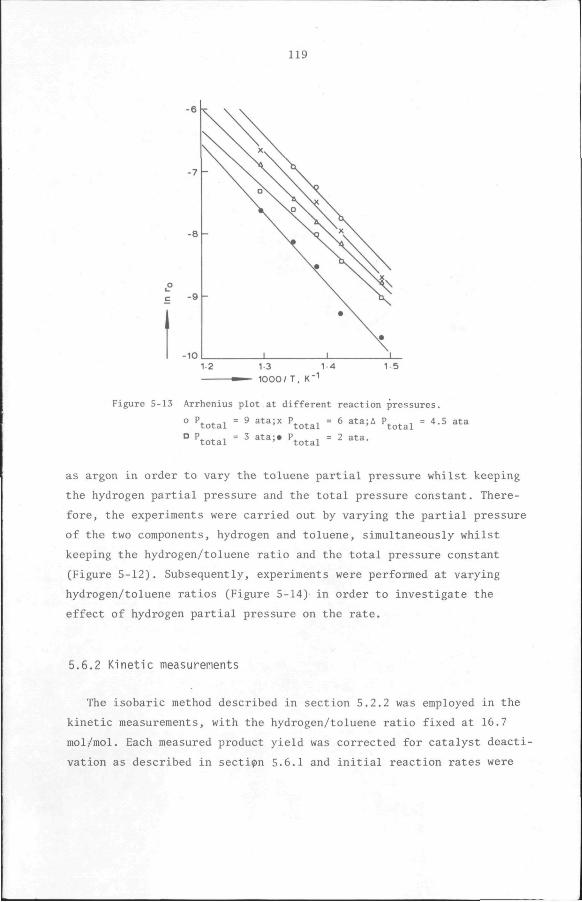
119
- 6 V
-10 1 2 1 3
1 0 0 0 / T , K" 1 4 1 5
Figure 5-13 Arrhenius plot at d i f fe ren t react ion pressures .
° P»- i-oi = 9 a ta ;x P._^ , = 6 ata;A P^ , , = 4.5 a ta t o t a l t o t a l ' t o t a l O P^ . , = 3 a ta ;» P, . , = 2 a ta . t o t a l t o t a l
as argon in order to vary the toluene partial pressure whilst keeping
the hydrogen partial pressure and the total pressure constant. There
fore, the experiments were carried out by varying the partial pressure
of the two components, hydrogen and toluene, simultaneously whilst
keeping the hydrogen/toluene ratio and the total pressure constant
(Figure 5-12). Subsequently, experiments were performed at varying
hydrogen/toluene ratios (Figure 5-14) in order to investigate the
effect of hydrogen partial pressure on the rate.
5.6.2 Kinetic measurements
The isobaric method described in section 5.2.2 was employed in the
kinetic measurements, with the hydrogen/toluene ratio fixed at 16.7
mol/mol. Each measured product yield was corrected for catalyst deacti
vation as described in secti?)n 5.6.1 and initial reaction rates were
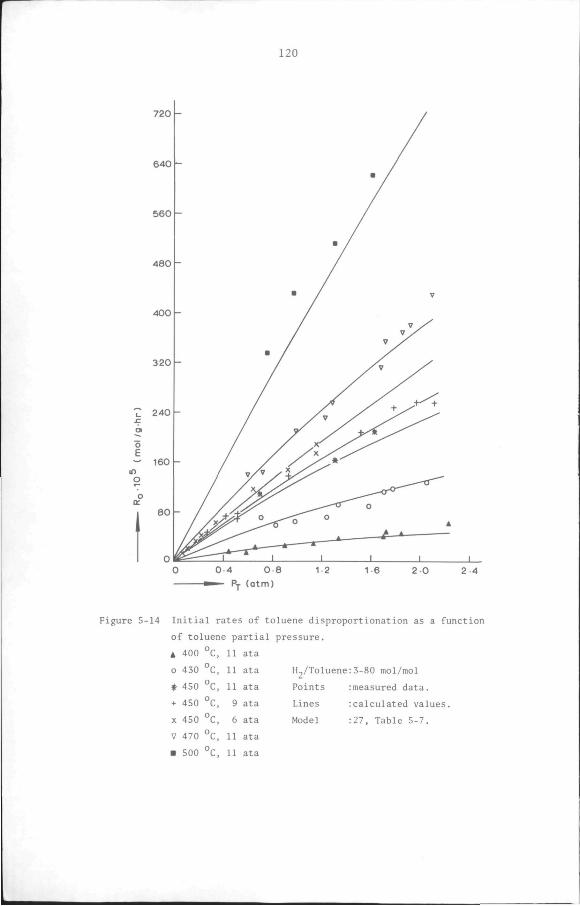
120
720 -
640 -
560 -
4 6 0
400 -
o E
in o
320 -
240 -
160 -
Figure 5-14 I n i t i a l r a tes of toluene dispropor t ionat ion as a function
of toluene p a r t i a l p ressure .
» 400 °C, 11 ata
o 430 °C, 11 a ta
t 450 °C, 11 a ta Points
+ 450 °C, 9 a ta Lines
Model
H,/Toluene-3-80 mol/mol
X 450 C, 6 ata
7 470 °C, 11 ata
• 500 °C, 11 ata
:measured data .
rcalculated values.
•27, Table 5-7.
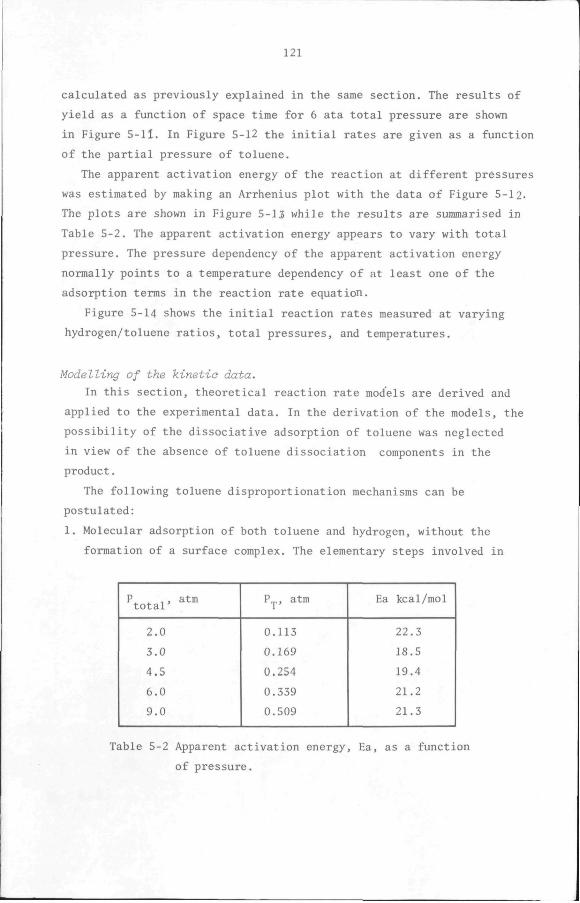
121
calculated as previously explained in the same section. The results of
yield as a function of space time for 6 ata total pressure are shown
in Figure 5-11. In Figure 5-12 the initial rates are given as a function
of the partial pressure of toluene.
The apparent activation energy of the reaction at different pressures
was estimated by making an Arrhenius plot with the data of Figure 5-12.
The plots are shown in Figure 5-13 while the results are summarised in
Table 5-2. The apparent activation energy appears to vary with total
pressure. The pressure dependency of the apparent activation energy
normally points to a temperature dependency of at least one of the
adsorption terms in the reaction rate equation.
Figure 5-14 shows the initial reaction rates measured at varying
hydrogen/toluene ratios, total pressures, and temperatures.
Modelling of the kinetic data.
In this section, theoretical reaction rate models are derived and
applied to the experimental data. In the derivation of the models, the
possibility of the dissociative adsorption of toluene was neglected
in view of the absence of toluene dissociation components in the
product.
The following toluene disproportionation mechanisms can be
postulated:
1. Molecular adsorption of both toluene and hydrogen, without the
formation of a surface complex. The elementary steps involved in
P ,, atm total
2.0
3.0
4.5
6.0
9.0
P.p, atm
0.113
0.169
0.254
0.339
0.509
Ea kcal/mol
22.3
18.5
19.4
21.2
21.3
Table 5-2 Apparent activation energy, Ea, as a function
of pressure.
122
this mechanism can be represented as follows:
H2 + s J H2,s
T + s J Ts
2Ts J Bs + Xs
Bs J B + s
Xs J X + s
By assuming one of these steps to be rate-determining, one obtains
the Hougen-Watson models shown in Table 5-3. The table includes
models derived from a single-site mechanism in which the reaction
step between two adsorbed toluene molecules is replaced by one
between an adsorbed toluene molecule and one in the gas phase. An
example of the derivation of models is given in Appendix 7.
Model No.
1
2
3
i+
No.of sites
2
2
1
1
Rate determining step
Adsorption of
toluene
Surface reaction
adsorption of
toluene
Surface reaction
Initial rate
k.p,
^'^W-^ k.p^2
fl^\-PH/'^T-PT^'
k.p,
^'^W^ k.p^2
^^^^•PH/'S-PT^
Figure 5-3 Reaction rate models from mechanism No.l
123
2. Molecular adsorption of toluene, dissociative adsorption of hydrogen
without the formation of a surface complex:
"2 * ^^
T + s
2Ts
Bs
Xs
<-
-*-
->-
2Hs
Ts
Bs + Xs
B + s
X + s
The models resulting from this mechanism are similar to those given
in Table 5-3 except that the hydrogen partial pressure p is 1 '^2
replaced by p* "2
3. Molecular adsorption of toluene, molecular adsorption of hydrogen,
with formation of a reactive surface complex.
H2 . s J H2,s T .H2.S : T^2'^ 2TH2,s t BH2,s +XH2,s
BH2,s i ^ "" ^2'^
XH2,s J X + ^2'^
The models obtained from this mechanism are given in Tabel 5-4.
4. Molecular adsorption of toluene, dissociative adsorption of
hydrogen, with formation of a reactive surface complex.
H2 + 2s J 2Hs
T + Hs t THs
2THs J BHs +XHs
BHs J B + Hs
XHs ? X + Hs
The models corresponding to this mechanism are obtained from those 1
given in Table 5-4 by substituting ]l„ for p„ . "2 2
5. Molecular adsorption of toluene, molecular adsorption of hydrogen
and formation of a non-reactive surface complex.
H2 + s -f- ^^2'
T + H2, s J TH2,S
T + s -> Ts
124
2Ts
Bs
Xs
Bs + Xs
B + s
X + s
The corresponding models are shown in Table 5-5.
6. Molecular adsorption of tojuene, dissociative adsorption of hydrogen
and formation of a non-reactive surface complex.
H2 + 2 s
T + Hs
T + s
2Ts
Bs
Xs
-<-
-<-
- * •
2Hs
THs
Ts
Bs + Xs
B + s
X + s
The models for this mechanism are obtained by replacing
p„ in the models in Table 5-5 by p„ "2 2
Model No.
9
10
11
12
No. of sites
2
2
1
1
Rate-determining step
Adsorption of
Surface reaction
Adsorption of
Surface reaction
Initial rate
k.PT.PH2
iUK^^^K^^H^P^)
•^•PH^-PT^
(1+Kj pH2 + K^.pH2.p ICj-P )
•^•PT-PH,
(UKj^ ?H K PH PJ)
2 2 ' 2
k.p.j,2.p ^
f 'Sl2PH2 ' cPTPH2 'SPT)
Table 5-4 Reaction rate models from mechanism N3.3
125
Model NO.
17
18
19
20
NO.of sites
2
2
1
1
Rate-determining step
Adsorption of toluene
Surface reaction
Adsorption of
Surface reaction
Initial rate
Kp,j, 1
(l Kj PH *\PH PT^ 2 2 ' 2
Kp^2
(UK^ PH ^^VT^\VJP^ )' 2 2 2
• PT 1 (UK^^p^^.K^p^^p,j,)
KPT^ 1 (UKj^^p^^.lCj.p^.K^p^p^^) 1
Table 5-5 Reaction rate models from mechanism NO.5
The models corresponding to the desorption of reaction products as
rate-determining steps are omitted in Tables 5-3 to 5-5. They yield
rates which are independent of toluene partial pressure. Inspection
of these models and their comparison with figure 5-13 show that they
are implausible. They are therefore not considered further (261, 262).
A total of 24 models are obtained, of which for the sake of brevity
only the models (1 lD4,9tol2,17 to 20)incorporating molecular adsorption
of hydrogen (mechanisms 1, 3 and 5 above) are listed in Tables 5-3 to
5-5.
The kinetic data plotted in Figures 5-12 and 5-14 were fitted to the
remaining models using a non-linear regression computer program based
on the modified steepest descent optimization method described by
Powell (256-258). The objective function minimized is Q, the sum of
squares of the deviations between measured rates,r , and the
126
corresponding calculated rates,r_ , from each model, weighted with ''i
the reciprocal of the squared observed rate:
" 2 2 Q =iil f-o. - ^c.^ 1-0.
i l l
Weighting the deviations in the manner just described gives each
measured point an equal weight in the regression analysis. The
computer program also calculates the sum of squares of the weighted
residuals between measured and calculated rates at convergence, SSQR.
Using SSQR and the number of degrees of freedom, v, the variance about 2
regression, s", and the standard deviation, s, can be calculated:
SSQR = 0^. =.2:, (r - r )^/r^ ^ Tnin 1=1 o. c. o.
I l l
V = n - p, where n is the number of data points and p is the number of
parameters in a particular model; v = SSQR/v.
The variance and the standard deviation are a measure of the goodness
of fit of a model.
The starting values of the parameters of the various models were
estimated by linear regression. The results of the subsequent non
linear regression analysis are shown in Table 5-6 for the models with
the smallest variances.
As was previously pointed out, the apparent activation energy, Ea,
seems to be a function of the total pressure at a constant hydrogen/
/toluene ratio (Figure 5-13, Table 5-2), which would mean that at
least one of the adsorption terms in the denominators of the reaction
rate equations is probably temperature dependent. Consequently, a
temperature dependency was introduced in the adsorption constants of
models 1, 5, 17 and 21 which have the smallest variances among models
1-24 by replacing each adsorption constant, K, in each of these models
by K exp (-AH/RT). The new models and their results are given in
Table 5-7 as models 25-28. These results show that of all the models
tested 27 and 28 have the smallest variances. An F-test (see Appendix
8) on these variances reveals that the difference between the two
models is not significant at the 95% confidence level. Hence it must
be concluded that from a statistical point of view it is impossible
Model No.
-
1
S
17
21
Initial rate, r ' 0
mol g'.hr.
ko exp(-E^/RT)p^
K exp(-E^/RT)p.j,
'''H2PH2
k exp(-E^/RT)p^
^^'^H2PH2"'^CPTPH2
k^ exp(-E /RT)p.j,
^"VH2 "' CPTPH2
k 0
mol g.hr.atm
5.99x10'*
1.29x10^
4.09x10'*
3.80x10^
E a
kcal mol
24.5
24.6
24.1
24.2
s atm"
0.109
0.924
0.035
0.200
K c
atm
0.038
0.150
sum of squares
-
3.708
3.935
2.869
2.965
variance for lack of fit
0.046
0.049
0.036
0.037
Table 5-6:Results of the regression on the initial toluene disproportionation rate.
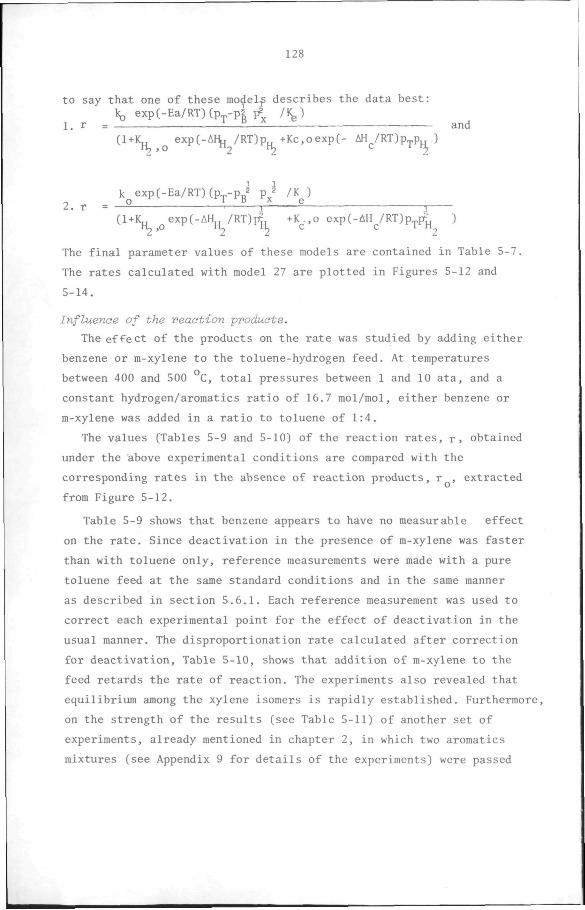
128
to say that one of these model^ describes the data best: 1^ exp(-Ea/RT)(p -p| f /K^)
1. r = -1 1 B X e _ _ ^ ^
(1+K„ exp(-AHH /RT)p„ +Kc,oexp(- AH /RT)p p ) H, ,0 2 "2 y.
k^exp(-Ea/RT)(p.j,-Pg^ p 5 /K^) 2. r
1 + K ^exp(-AH^ /RT)if„ +K .,o exp(-6H /RT)p.j.if )
The final parameter values of these models are contained in Table 5-7.
The rates calculated with model 27 are plotted in Figures 5-12 and
5-14.
Influence of the reaction products.
The effect of the products on the rate was studied by adding either
benzene or m-xylene to the toluene-hydrogen feed. At temperatures
between 400 and 500 C, total pressures between 1 and 10 ata, and a
constant hydrogen/aromatics ratio of 16.7 mol/mol, either benzene or
m-xylene was added in a ratio to toluene of 1:4.
The values (Tables 5-9 and 5-10) of the reaction rates, r, obtained
under the above experimental conditions are compared with the
corresponding rates in the absence of reaction products, r , extracted
from Figure 5-12.
Table 5-9 shows that benzene appears to have no measurable effect
on the rate. Since deactivation in the presence of m-xylene was faster
than with toluene only, reference measurements were made with a pure
toluene feed at the same standard conditions and in the same manner
as described in section 5.6.1. Each reference measurement was used to
correct each experimental point for the effect of deactivation in the
usual manner. The disproportionation rate calculated after correction
for deactivation. Table 5-10, shows that addition of m-xylene to the
feed retards the rate of reaction. The experiments also revealed that
equilibrium among the xylene isomers is rapidly established. Furthermore,
on the strength of the results (see Table 5-11) of another set of
experiments, already mentioned in chapter 2, in which two aromatics
mixtures (see Appendix 9 for details of the experiments) were passed
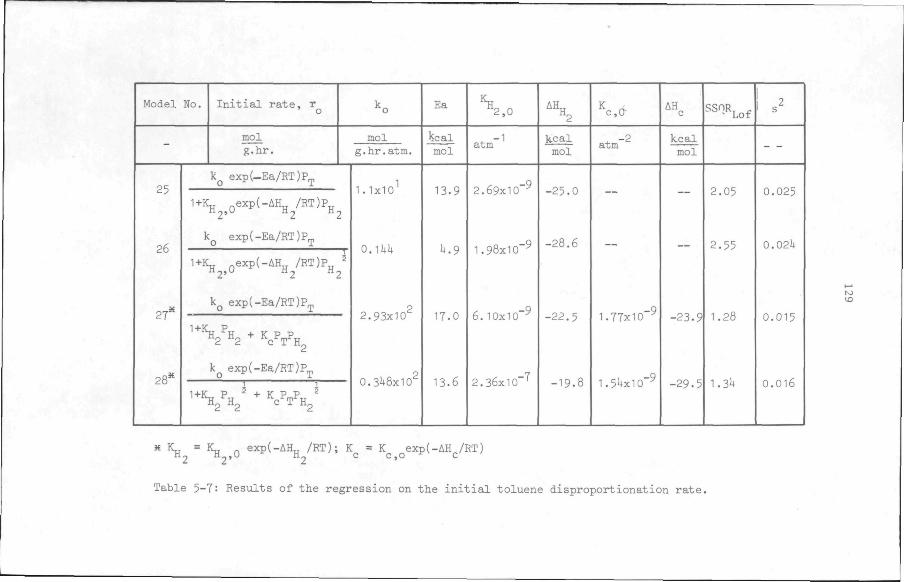
Model No.
-
25
26
27«
28' '
I n i t i a l r a t e , r
mol g .h r .
k^ exp(-Ea/RT)P^
1+Kjj^^Qexp(-AH^^/RT)P^
k^ exp(-Ea/RT)P^
K
2
l+Kjj^^Qexp(-AHjj^/RT)Pjj^^
k^ exp(-Ea/RT)P^
k^ exp(-Ea/RT)P^
^ ^ H ^ ' " ^ C V H /
mol g . h r . a t m .
1. Ixio' '
O.ll+U
2.93x10^
0.31+8x10^
Ea
kcal mol
13.9
17.0
13.6
\ , o
atm
2.69x10"^
1.98x10"^
6.10x10"^
2.36x10"'''
' \
kcal mol
-25 .0
-28 .6
- 2 2 . 5
- 1 9 . 8
^ c , a
^ -2 atm
1.77x10"^
1.5itx10"^
AH c
k c a l mol
- 2 3 . 9
-29 .5
- Lof
2.05
2.55
1.28
1.3U
2 s
0.025
0.021+
0.015
0.016
a K = K exp(-AH„ /ET); K = K exp(-AH /RT) n- ii ,U li„ c 0,0 C
Table 5-T: Results of the regression on the initial toluene disproportionation rate.
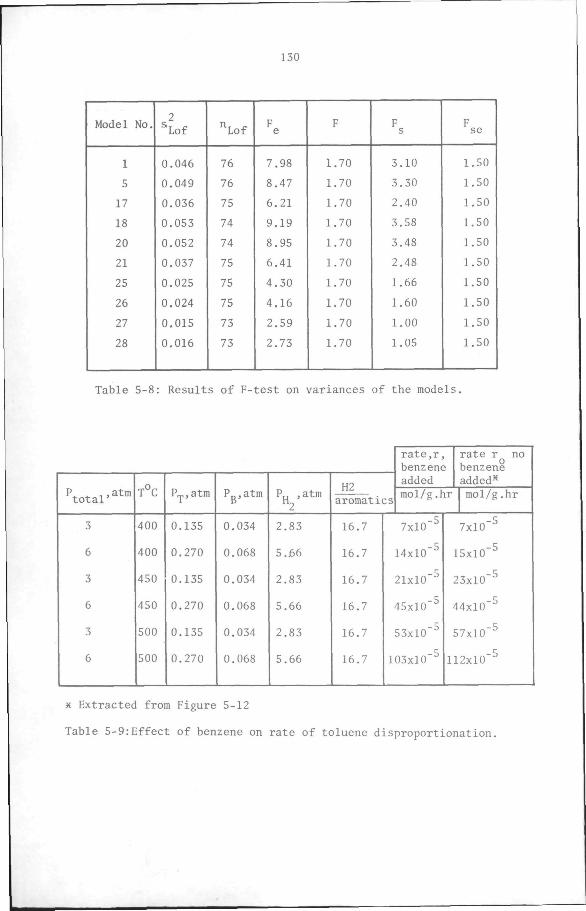
130
Model No.
1
5
17
18
20
21
25
26
27
28
2 ^Lof
0.046
0.049
0.036
0.053
0.052
0.037
0.025
0.024
0.015
0.016
' Lof
76
76
75
74
74
75
75
75
73
73
F e
7.98
8.47
6.21
9.19
8.95
6.41
4.30
4.16
2.59
2.73
F
1.70
1.70
1.70
1.70
1.70
1.70
1.70
1.70
1.70
1.70
F s
3.10
3.30
2.40
3.58
3.48
2.48
1.66
1.60
1.00
1.05
F se
1.50
1.50
1.50
1.50
1.50
1.50
1.50
1.50
1.50
1.50
Table 5-8: Results of F-test on variances of the models.
P^ ^ ,,atm total'
3
6
3
6
3
6
T°C
400
400
450
450
500
500
P.j,,atm
0.135
0.270
0.135
0.270
0.135
0.270
P ,atm
0.034
0.068
0.034
0.068
0.034
0.068
P„ ,atm "2
2.83
5..66
2.83
5.66
2.83
5.66
H2 aromatics
16.7
16.7
16.7
16.7
16.7
16.7
rate.r, benzene added mol/g.hr
7x10'^
14x10"^
21x10"^
45x10'^
53x10'^
103x10'^
rate r no benzene added* mol/g.hr
7x10"^
15x10'^
23x10"^
44x10"^
57x10'^
112x10"^
K Extracted from Figure 5-12
Table 5-9:Effect of benzene on rate of toluene disproportionation.
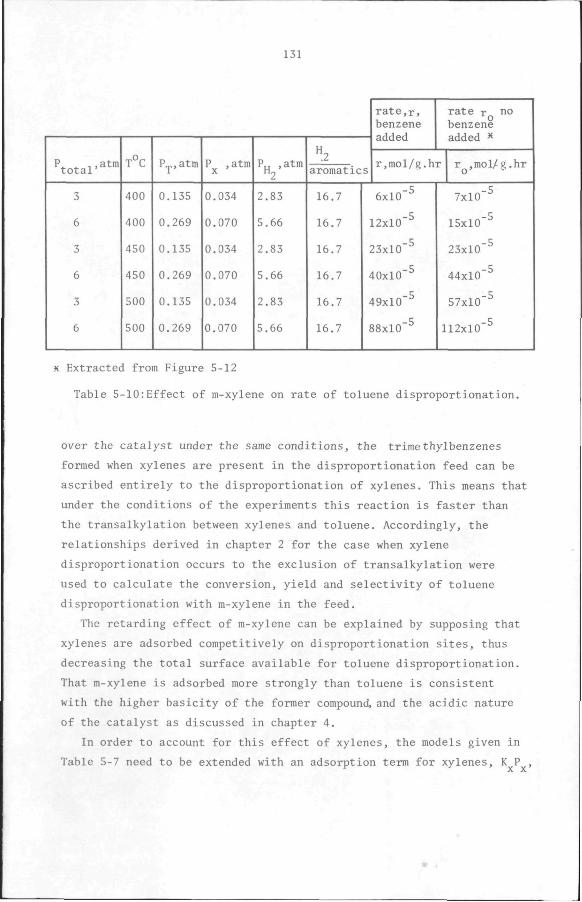
131
P^ ^ ,,atm total'
3
6
3
6
3
6
T°C
400
400
450
450
500
500
P.j,,atm
0.135
0.269
0.135
0.269
0.135
0.269
P ,atm X '
0.034
0.070
0.034
0.070
0.034
0.070
P^ ,atm
2.83
5.66
2.83
5.66
2.83
5.66
"2 aromatic
16.7
16.7
16.7
16.7
16.7
16.7
s
rate,r, benzene added
rate r no benzene added ^
r,mol/g.hr
6x10"^
12x10"^
23x10"^
40x10"^
49x10"^
88x10"^
r ,mol/g.hr
7x10"^
15x10'^
23x10"^
44x10"^
57x10"^
112x10'^
X Extracted from Figure 5-12
Table 5-10:Effect of m-xylene on rate of toluene disproportionation.
over the catalyst under the same conditions, the trimethylbenzenes
formed when xylenes are present in the disproportionation feed can be
ascribed entirely to the disproportionation of xylenes. This means that
under the conditions of the experiments this reaction is faster than
the transalkylation between xylenes and toluene. Accordingly, the
relationships derived in chapter 2 for the case when xylene
disproportionation occurs to the exclusion of transalkylation were
used to calculate the conversion, yield and selectivity of toluene
disproportionation with m-xylene in the feed.
The retarding effect of m-xylene can be explained by supposing that
xylenes are adsorbed competitively on disproportionation sites, thus
decreasing the total surface available for toluene disproportionation.
That m-xylene is adsorbed more strongly than toluene is consistent
with the higher basicity of the former compound, and the acidic nature
of the catalyst as discussed in chapter 4.
In order to account for this effect of xylenes, the models given in
Table 5-7 need to be extended with an adsorption term for xylenes, K P
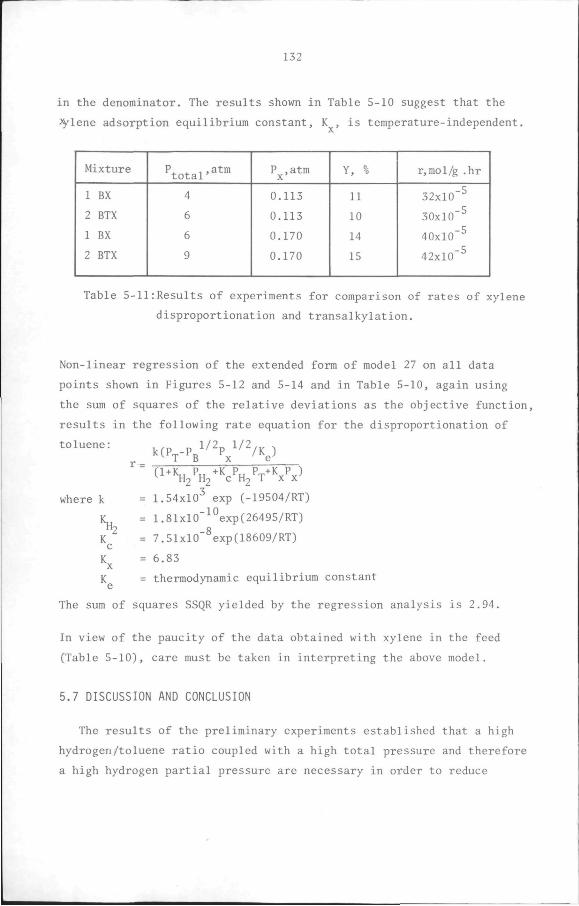
132
in the denominator. The results shown in Table 5-10 suggest that the
^lene adsorption equilibrium constant, K , is temperature-independent.
Mixture
1 BX
2 BTX
1 BX
2 BTX
Pfotal'^^"'
4
6
6
9
P ,atm x'
0.113
0.113
0.170
0.170
Y, %
11
10
14
15
r,mol/g .hr
32x10"^
30x10"^
40x10'^
42x10"^
Table 5-11:Results of experiments for comparison of rates of xylene
disproportionation and transalkylation.
Non-linear regression of the extended form of model 27 on all data
points shown in Figures 5-12 and 5-14 and in Table 5-10, again using
the sum of squares of the relative deviations as the objective function,
results in the following rate equation for the disproportionation of
k(P^-Pg^/^P^^/2/Kg)
= 1.54x10^ exp (-19504/RT)
= 1.81x10'•^°exp(26495/RT)
= 7.51xlO"^exp(18609/RT)
= 6.83
= thermodynamic equilibrium constant
The sum of squares SSQR yielded by the regression analysis is 2.94.
In view of the paucity of the data obtained with xylene in the feed
(Table 5-10), care must be taken in interpreting the above model.
5.7 DISCUSSION AND CONCLUSION
The results of the preliminary experiments established that a high
hydrogen/toluene ratio coupled with a high total pressure and therefore
a high hydrogen partial pressure are necessary in order to reduce
toluene:
where k
K "2
c K X
K
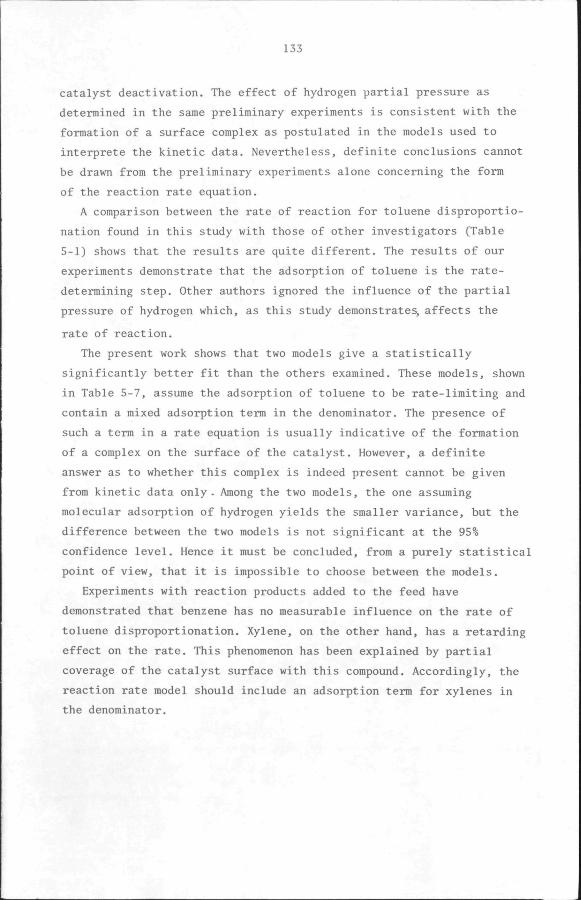
133
catalyst deactivation. The effect of hydrogen partial pressure as
determined in the same preliminary experiments is consistent with the
formation of a surface complex as postulated in the models used to
interprete the kinetic data. Nevertheless, definite conclusions cannot
be drawn from the preliminary experiments alone concerning the form
of the reaction rate equation.
A comparison between the rate of reaction for toluene disproportio
nation found in this study with those of other investigators (Table
5-1) shows that the results are quite different. The results of our
experiments demonstrate that the adsorption of toluene is the rate-
determining step. Other authors ignored the influence of the partial
pressure of hydrogen which, as this study demonstrates, affects the
rate of reaction.
The present work shows that two models give a statistically
significantly better fit than the others examined. These models, shown
in Table 5-7, assume the adsorption of toluene to be rate-limiting and
contain a mixed adsorption term in the denominator. The presence of
such a term in a rate equation is usually indicative of the formation
of a complex on the surface of the catalyst. However, a definite
answer as to whether this complex is indeed present cannot be given
from kinetic data only. Among the two models, the one assuming
molecular adsorption of hydrogen yields the smaller variance, but the
difference between the two models is not significant at the 95%
confidence level. Hence it must be concluded, from a purely statistical
point of view, that it is impossible to choose between the models.
Experiments with reaction products added to the feed have
demonstrated that benzene has no measurable influence on the rate of
toluene disproportionation. Xylene, on the other hand, has a retarding
effect on the rate. This phenomenon has been explained by partial
coverage of the catalyst surface with this compound. Accordingly, the
reaction rate model should include an adsorption term for xylenes in
the denominator.
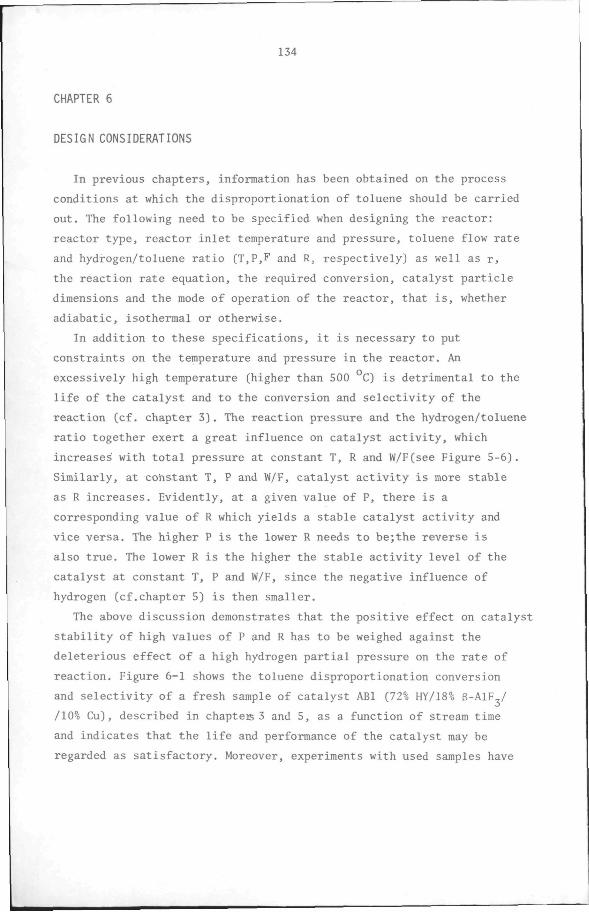
134
CHAPTER 6
DESIGN CONSIDERATIONS
In previous chapters, information has been obtained on the process
conditions at which the disproportionation of toluene should be carried
out. The following need to be specified when designing the reactor:
reactor type, reactor inlet temperature and pressure, toluene flow rate
and hydrogen/toluene ratio (T,P,F and R, respectively) as well as r,
the reaction rate equation, the required conversion, catalyst particle
dimensions and the mode of operation of the reactor, that is, whether
adiabatic, isothermal or otherwise.
In addition to these specifications, it is necessary to put
constraints on the temperature and pressure in the reactor. An
excessively high temperature (higher than 500 C) is detrimental to the
life of the catalyst and to the conversion and selectivity of the
reaction (cf. chapter 3). The reaction pressure and the hydrogen/toluene
ratio together exert a great influence on catalyst activity, which
increases with total pressure at constant T, R and W/F(see Figure 5-6).
Similarly, at constant T, P and W/F, catalyst activity is more stable
as R increases. Evidently, at a given value of P, there is a
corresponding value of R which yields a stable catalyst activity and
vice versa. The higher P is the lower R needs to be;the reverse is
also true. The lower R is the higher the stable activity level of the
catalyst at constant T, P and W/F, since the negative influence of
hydrogen (cf.chapter 5) is then smaller.
The above discussion demonstrates that the positive effect on catalyst
stability of high values of P and R has to be weighed against the
deleterious effect of a high hydrogen partial pressure on the rate of
reaction. Figure 6-1 shows the toluene disproportionation conversion
and selectivity of a fresh sample of catalyst ABl (72% HY/18% B-AlF,/
/10% Cu), described in chapteis 3 and 5, as a function of stream time
and indicates that the life and performance of the catalyst may be
regarded as satisfactory. Moreover, experiments with used samples have
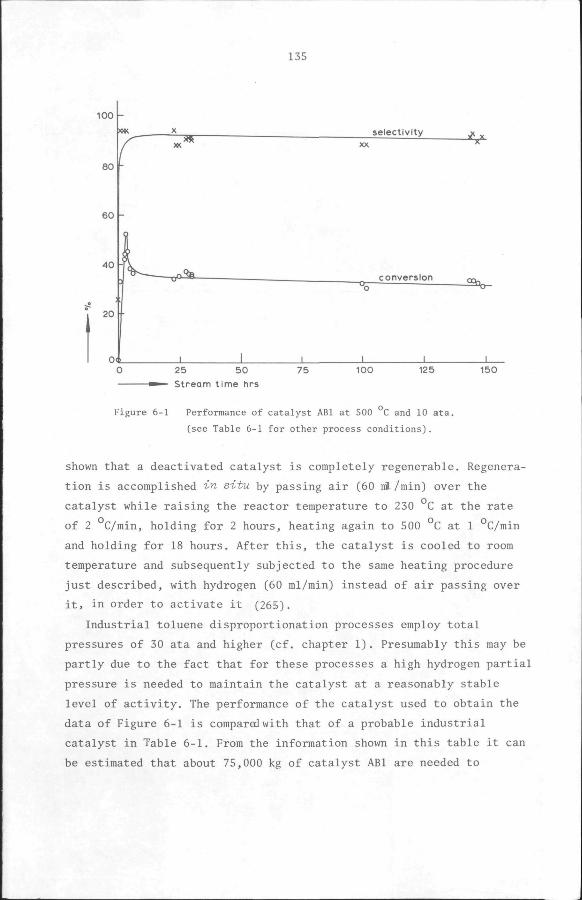
135
TJBT
D . ^
selectivity j< „
conversion - 5 9 a c ^
25 50 Stream t ime hrs
75 100 125 150
Figure 6-1 Performance of catalyst ABl at 500 C and 10 ata.
(see Table 6-1 for other process conditions).
shown that a deactivated catalyst is completely regenerable. Regenera
tion is accomplished in situ by passing air (60 ni/min) over the
catalyst while raising the reactor temperature to 230 °C at the rate
of 2 C/min, holding for 2 hours, heating again to 500 C at 1 °C/min
and holding for 18 hours. After this, the catalyst is cooled to room
temperature and subsequently subjected to the same heating procedure
just described, with hydrogen (60 ml/min) instead of air passing over
it, in order to activate it (265).
Industrial toluene disproportionation processes employ total
pressures of 30 ata and higher (cf. chapter 1). Presumably this may be
partly due to the fact that for these processes a high hydrogen partial
pressure is needed to maintain the catalyst at a reasonably stable
level of activity. The performance of the catalyst used to obtain the
data of Figure 6-1 is compared with that of a probable industrial
catalyst in Table 6-1. From the information shown in this table it can
be estimated that about 75,000 kg of catalyst ABl are needed to
136
Reaction variables
W/F, g. cat.hr/mol.toluene
Stream time, hrs
Temperature, °C
Pressure, ata
Hydrogen/toluene, mol/mol
Conversion, %
Selectivity, %
Catalyst ABl*''
177
100
500
10
16.7
32
91
Industrial
252
100
420
35
15
42
> 90
catalyst
K Catalyst = natural mordenite treated with Hci (259).
KK Catalyst AB1= 72% HY/18% 6-AlF2/10% Cu
Table 6-1 Comparison of the performance of catalyst ABl with that
of a probable industrial catalyst.
Q
disproportionate 1x10 kg of toluene per year under the conditions
specified, whereas 80,000 kg of the industrial catalyst are required.
However, in view of the differences in the experimental conditions
employed to obtain the data of Table 6-1, it is difficult to critically
compare the two catalysts.
Finally, it is expected that the performance of catalyst ABl can be
further improved. One way is to operate at a higher reaction pressure
than shown in Table 6-1. This would enable a lower hydrogen/toluene
ratio than 16.7 to be used without lowering catalyst stability. This
would result in a higher conversion than is given in Table 6-1 (268,
269).
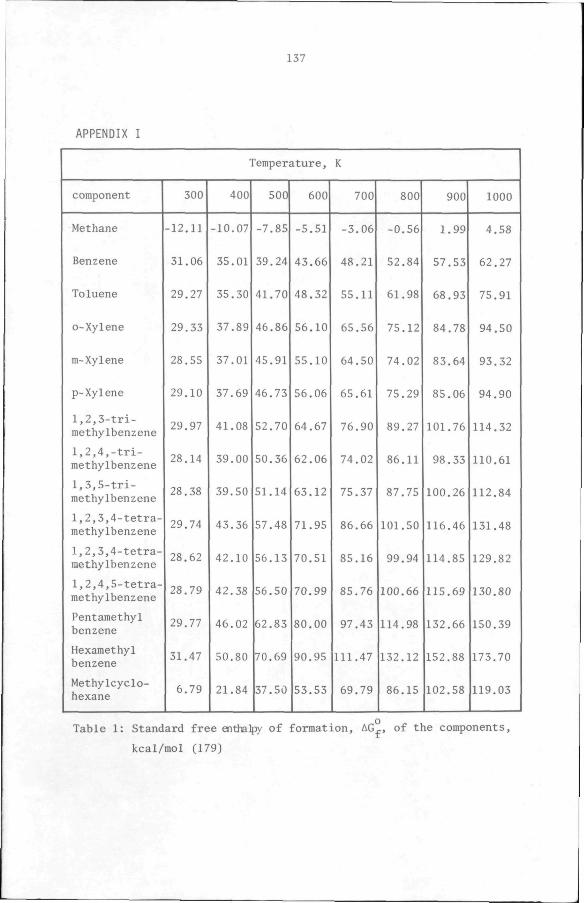
137
APPENDIX I
Temperature, K
component
Methane
Benzene
Toluene
o-Xylene
m-Xylene
p-Xylene
1,2,3-tri-methylbenzene
1,2,4,-trimethylbenzene
1,3,5-tri-methylbenzene
1,2,3,4-tetra-methylbenzene
1,2,3,4-tetra-methylbenzenc
1,2,4,5-tetra-methylbenzene
Pentamethyl benzene
Hexamethyl benzene
Methylcyclohexane
300
-12.11
31.06
29.27
29.33
28.55
29.10
29.97
28.14
28.38
29.74
28.62
28.79
29.77
31.47
6.79
400
-10.07
35.0
35.30
37.89
37.0
37.69
41.08
39.00
39.50
43.36
42.10
42.38
46.02
50.80
21.84
500
-7.85
39.24
41.70
46.86
45.9
46.73
52.70
50.36
51.14
57.48
56.13
56.50
62.83
70.69
37.50
600
-5.51
43.66
48.32
56.10
55.10
56.06
64.67
62.06
63.12
71.95
70.51
70.99
80.00
90.95
53.53
700
-3.06
48.2
55.1
65.56
64.50
65.61
76.90
74.02
75.37
86.66
85.16
85.76
97.43
111.47
69.79
800
-0.56
52.84
61.98
75.I2I
74.02
75.29
89.27
86.1
87.75
101.50
99.94
100.66
114.98
132.12
86.15
900
1.99
57.53
68.93
84.78
83.64
85.06
101.76
98.33
100.26
116.46
114.85
115.69
132.66
152.88
102.58
1000
4.58
62.27
75.91
94.50
93.32
94.90
114.32
110.61
112.84
131.48
129.82
130.80
150.39
173.70
ill9.03
Table 1: Standard
kcal/mol
f ree enthalpy of format ion, AG_, of the components,
(179)
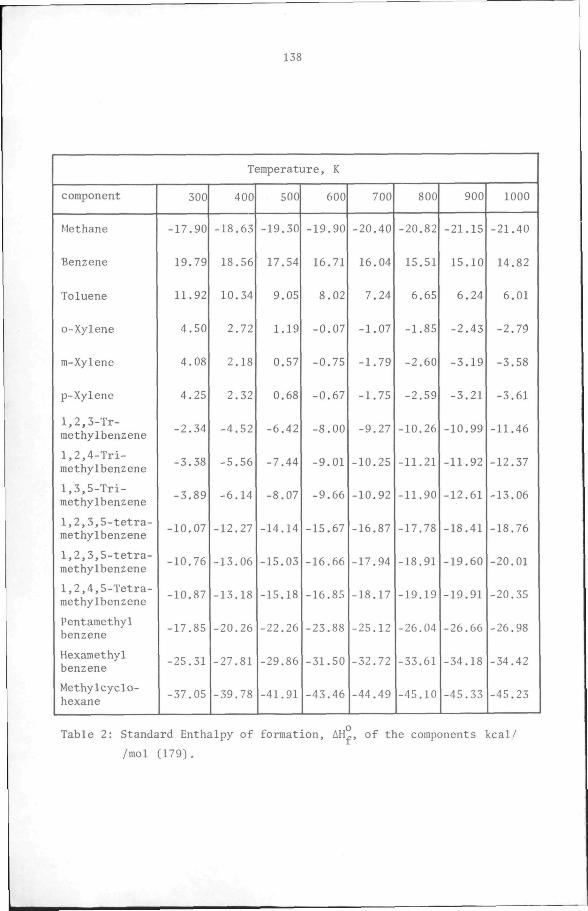
138
Temperature, K
component
Methane
Benzene
Toluene
o-Xylene
m-Xylene
p-Xylene
1,2,3-Tr-mcthylbenzene
1,2,4-Trimethylbenzene
1,3,5-Trimethylbenzene
1,2,3,5-tetra-methylbenzene
1,2,3,5-tetra-methylbenzene
1,2,4,5-Tetra-methylbenzene
Pentamethyl benzene
Hexamethyl benzene
Methylcyclohexane
300
-17.90
19.79
11.92
4.50
4.08
4.25
-2.34
-3.38
-3.89
-10.07
-10.76
-10.87
-17.85
-25.31
-37.05
400
-18.63
18.56
10.34
2.72
2.18
2.32
-4.52
-5.56
-6.14
-12.27
-13.06
-13.18
-20.26
-27.81
-39.78
500
-19.30
17.54
9.05
1.19
0.57
0.68
-6.42
-7.44
-8.07
-14.14
-15.03
-15.18
-22.26
-29.86
-41.91
600
-19.90
16.71
8.02
-0.07
-0.75
-0.67
-8.00
-9.01
-9.66
-15.67
-16.66
-16.85
-23.88
-31.50
-43.46
700
-20.40
16.04
7.24
-1.07
-1.79
-1.75
-9.27
-10.25
-10.92
-16.87
-17.94
-18.17
-25.12
-32.72
-44.49
800
-20.82
15.51
6.65
-1.85
-2.60
-2.59
-10.26
-11.21
-11.90
-17.78
-18.91
-19.19
-26.04
-33.61
-45.10
900
-21.15
15.10
6.24
-2.43
-3.19
-3.21
-10.99
-11.92
-12.61
-18.41
-19.60
-19.91
-26.66
-34.18
-45.33
1000
-21.40
14.82
6.01
-2.79
-3.58
-3.61
-11.46
-12.37
-13.06
-18.76
-20.01
-20.35
-26.98
-34.42
-45.23
Table 2: Standard Enthalpy of
/mol (179) .
formation, AH^, of the components kcal /
139
APPENDIX 2
In order to derive the conversion of toluene by disproportionation,
the disproportionation selectivity and the yield of disproportionation
products, all in terms of the mole fractions of the components detected
in the reaction products, equations 1,2 and 3 (see section 2.5) are
rewritten as follows, assuming that the feed consists only of hydrogen
and toluene:
2T i B^+X A
T.H2 - B2^M2 B
T+X^ J B2+Tr4B2 C
The following relationships can be established between the mole frac
tions of the components:
Y = Y bl xl
y = Y b2 m2 Y = Y = Y b3 tmb3 x3
\V = 'bl^^b2^\3
Y = Y ,-Y . xp xl x3
Y = Y tmbp tmb3
In these relationships, Y, ,Y ,Y and Y , stand for the mole fractions '^ b' x' m tmb
of benzene, xylenes, methane and trimethylbenzenes. The subscript p is
used to denote the product, while 1,2,3 denote the reaction in which a
particular component reacts or is formed. The total conversion is de
fined as follows:
J- _ mo^es toluene converted by all reactions moles toluene in the feed
Alternatively, a definition based on a phenyl or methyl balance, or on
140
mole fractions can be used instead of the absolute number of moles of
the components. From equations A,B and C above and using mole fractions
it is clear that:
(Y. ,+Y ,+Y,-+Y, JlOO ^ bl xl b2 b3 o (Y, .+Y ,+Y. .+Y, .+Y^ , ' bl xl b2 b3 tp)
where Y is the mole fraction of toluene in the product. By making use
of the relationships established above, the following final expression
is obtained:
(Y, +Y +Y^ K )100 _ _ hp xp tmbp^ 0^ (Y +Y +Y +Y , ) '* ^ bp tp xp tmbp
The selectivity to the disproportionation reaction is defined as
follows:
„ _ moles toluene converted by disproportionation moles of toluene converted by all reactions
" f^l^\l^^b2^^b3 '
2(Y +Y^ , )100 xp tmbp 0
~ XYTTf +Y1 , ) "" ^ bp xp tmbp'
Since we are mainly interested in the disproportionation of toluene,
the yield of disproportionation products will also be derived. The
definition is as follows:
Y moles toluene converted by disproportionation D moles of toluene in the feed
(Ybl^^xl^l°°
(Y, ,+Y 1+Y, _+Y, .,+Y^ ) ^ bl xl b2 b3 tp
141
2(Y +Y , )100 xp tmbp ^
(Yu +Y^ +Y +Y^ , , * bp tp xp tmbp)
When, on the other hand, the most probable reactions are 1,2 and 6
(see section 2.5) and the feed contains benzene and xylenes as well as
toluene and hydrogen, the conversion, selectivity and yield can be
derived as follows:
2T B+X
2X t T+TMB
T+H2 +- B+M
Reaction
1
2
3
Converted
T = tl
X = t2
T = t3
"2 " ^•^
Formed
B = tl/2
X = tl/2
T = t2/2
TMB = t2/2
B = t3
M = t3
V = methyl groups in the feed phenyl groups in the feed
= Y +2Y to xo Y, +Y^ +Y bo to xo
where Y, , Y^ and Y are the mole fractions of benzene, toluene and bo to xo
xylenes in the feed. From the phenyl balance:
Y. +Y^ +Y = Y,+Y^+Y +Y^ , , bo to xo b t X tmb'
and from the methyl balance:
142
Y, +2Y = Y, + 2Y +3Y^ ,+M bo XO t X tmb
From the stoichiometry of the reactions and the notations of the table
above, the following equations can be derived for the mole fractions:
Yu = Y, +t-, , +t., b bo 1/2 3
Y.. = Y^ -t,-t,+t-,T t to 1 3 2/2
Y = Y +t. ,^-t-X XO 1/2 2
^tmb " ''2/2
By solving the above equations simultaneously, one obtains:
h = 2(Y^„-Y,)+2(Y^^^-Y^)+2TMB
t = 2TMB
*3 = -^\o-\^-'^\o-V-™^ The phenyl balance can be used to simplify t, and t,:
t, = 2Y -2Y +4Y^ , 1 X xo tmb
^7 = Y,-Y -2Y^ .+Y -Y, 3 b x tmb xo bo
The conversion is defined as follows:
moles toluene converted by all reactions
moles toluene in the feed
^ = h-^2/2^^3
\'h-^2/2'H
= (Y,+Y +Y^ ,-Y -Y, )100 b X tmb xo bo
(Y, +Y^+Y +Y^ ,-Y, -Y ) b t X tmb bo xo -"
y- -« to
The slectivity is given by:
143
S = moles of toluene converted by disproportionation moles of toluene converted by all reactions
h ^r^2/2"^^3
(2Y -2Y +4Y^ . )100 x xo tmb
(Y.+Y +Y^ ,-Y. -Y ) b X tmb bo xo
(2Y -2Y +4Y^ u)100 X xo tmb
^^o-^t^
The yield is given by:
Y„ = moles of toluene converted by disproportionation moles of toluene in the feed
h \'h-^2/2^H
(2Y -2Y +4Y^ ,)100 X xo tmb „
(Y,+Y^+Y +Y .-Y. -Y ) '° b t X tmb bo xo
(2Y -2Y +4Y^ u)100 x xo tmb' „
- Y -6 ^ 6 to
The unknowns, Y and Y , can be eliminated from the above expressions to xo ^
by defining an extra quantity, K, which is the mole ratio of xylenes
and toluene in the feed:
K = Y /Y^ xo to
Combining K with the phenyl balance and the definition of V, one obtains
V = Y^ +2Y to xo Y. +Y, +Y to bo xo
Y, +Y +Y = Y +Y,+Y +Y , bo to xo t b X tmb
144
Y^ +2Y = Y^+Y,+Y +Y^ , to xo t b X tmb
V
Y^ = (Y^+Y,+Y +Y^ , )V to ^ t b X tmb
(I+2K)
2Y = 2VK(Y,+Y^+Y +Y^ , ) xo b t X tmb
1 + 2K
Substituting for Y^ and Y in 4, 5 ani 6 above, ^ to xo ' D '
((Y^+Y.+Y +Y^ ,)V-Y^(1+2K))100 ^ t b X tmb t '' o
(Y^+Y.+Y +Y, , )V ^ t b X tmb
((2Y +4Y^ ,)(1 + 2K)-2VK(Y^+Y,+Y +Y^ ,))100 q - X tmb'^ ' ^ t b X tmb ' „
f^^W^mb)V-^fl^2K)
((2Y^^4Y^^^)(1 + 2K)-2VK(Y^+Y^+Y^+Y^^^))100 ^
D - (YK+Y^+Y +Y^ , ) V
' b t X tmb'
When the feed contains only hydrogen, toluene and benzene, Y =0, from
the definition of V,
Y^ = V(Y^ +Y, ) to "• to bo'
From the phenyl balance,
Y^ +Y, = Y,+Y^+Y +Y^ , to bo b t X tmb
Therefore, Y = (Y,+Y^+Y +Y , )V ' t o b t X tmb
By substituting for Y and Y in equations 4,5 and 6 above:
(Y,+Y^+Y +Y^ ,)V-Y^)100 ^ ^ b t X tmb' t' „,
(Y,+Y^+Y +Y^ , )V b t X tmb
(2Y +4Y^ ,)100 X tmb „ ,
and (Y,+Y^+Y +Y^ jy-y^ b t X tmb' t
145
(2Y +4Y, ,)100 Y = X tmb' „ D (Y.+Y.+Y +Y^ , )V
b t X tmb
When the feed contains only hydrogen, toluene and xylenes, Y, =0.
From the definition of V,
Y^^ = r2-V>Y
From the phenyl ba l ance ,
Y^ +Y = Y,+Y^+Y +Y^ , t o xo b t x tmb
Therefore ,
Y . = Y,+Y^+Y +Y^ ,-Y = r2-ViY t o b t X tmb xo lTr~rJ ^°
Therefore ,
c-2-4,Y +Y = Y,+Y^+Y +Y . [rrrrj xo xo b t X tmb
Therefore,
Y = (Y,+Y^+Y +Y^ ,)CV-1) and xo ^ b t X tmb'^ '
Y, = (Y,+Y^+Y +Y^ K)(2-V) to ^ b t X tmb ^ '
By substituting for Y and Y in equations 4,5 and 6 above, one
obtains;
((Y^+Y^+Y^+Y^^^)(2-V)-Yjl00 ^
^ ^\^^^ V \ m b ^ ^2-V) '°
, K-%mb-^V\-V\mbH^-^^)^"" „ (Y,+Y^+Y +Y, ,)(2-V)-Y ^ b t X tmb' t •
Y K-^\mb-^(VV\mb^(^-^^^^°° D fV^^V^.mb^f2-V)
When the feed contains only toluene and hydrogen, V=l and K=0.
Substituting for V and K in any of the relationships above,
146
^^b-\-\mb)^°°
f^^^t^^x^^mb^
S = ^^^x-^^mb^l""
(2Y +4Y ,)100 Y ^ X tmb 5, D (Y,+Y^+Y +Y^ , ) °
b t X tmb'
When the feed contains benzene and xylenes as well as toluene and
hydrogen, the conversion, selectivity and yield, using reactions 1,2
and 3 instead of 1,2 and 6 are derived as follows:
2T
T+X
T+H,
^ B+X
t B+TMB
t B+M
1
2
3
Reaction
1
2
3
Converted
T=t^
T=t2
X=t2
T=t3
"2=^3
Formed
B=t^/2
X=t^/2
B=t2
TMB=t2
B=t3
M=t3
methyl groups in the feed phenyl groups in the feed
Y^ +2Y to xo
Yu "Y, + Y ~ bo to xo
where Y^ Y and Y are the mole fractions of benzene, toluene and to xo
xylenes in the feed. From the phenyl balances:
147
Y, +Y^ +Y = Y,+Y^+Y +Y^ , , and from the methyl balance: bo to xo b t x tmb' '
Y^ +2Y = Y^ + 2Y +3Y^ ,+M. to xo t X tmb
From the stoichiometry of the reactions and using the notations of the
table above, one drives the following equations for the mole fract ions:
Y, = Y, +t,/2+t-+t_ b bo 1 2 3
Y4- = Y^ - t , - t - - t , t to 1 2 3
Y = Y + t , /2 - t „ X xo r 2
Y = t tmb 2
By solving the above equations simultaneously, one obtains:
t, = 2(T -T)+2(B -B) 1 0 0
t- = (T -T)+(B -B)+(X -X) = Y^ , 2 ^ o ' ^ o 0 ' tmb
t, = -2(T -T)-3(B -B)-(X -X) 3 o 0 0
The phenyl balance can be used to simplify t. and t»:
t, = 2Y -2Y +2Y^ , 1 X xo tmb
t, = Y,-Y -2Y^ , Y, +Y 3 b X tmb bo xo
By combining the definitions of V and K with the phenyl balance, one
obtains:
Y^ = (Y,+Y^+Y +Y^ , )V to ^ b t X tmb
(1+2K)
2Y = 2/K(Y,+Y^+Y +Y^ ,) xo ^ b t X tmb'
(1+2K)
The conversion is defined as follows:
_ = moles toluene converted by all reactions moles toluene in the feed
148
= ^1^^2^^3
\'h'h'^3
- \ o - \ \o
((Y,+Y^+Y +Y^ .)V-y^(l+2K))l00 '' b t X tmb t -' 5,
(Y,+Y^+Y +Y^ , )V b t X tmb
The selectivity for disproportionation is defined as:
S = moles of toluene converted by disproportionation moles of toluene converted by all reactions
h ^l^h^^3
2Y -2Y +2Y^ , X xo tmb
Y,+Y +Y ,-Y, -b X tmb bo
2Y -2Y +2Y , X xo tmb Y. -Y^ to t
Y xo
= 2Y +2Y^ ,-2VK(Y,+Y^+Y +Y^ i/(l + 2K) X tmb ^ b t X tmb' '
(Y,+Y^+Y +Y^ , )V ^ b t X tmb'
(1+2K) " t
(^^V^^tmb»^^^'^^-^^'^^^b-\-V^mb^^^°" „ (Y^.Y^.Y^.Y^^^)V-Y^(1+2K)
The yield of disproportionation products is given by:
Y_ = moles of toluene converted by disproportionation moles of toluene in the feed
't^^l^^2^^3
= 2Y -2Y +2Y^ , X xo tmb
\o
149
= V^\mb-^^'^V^t-\mb^/^^-^'^^
f^b^^t^^x^^tmb^V/fl^^'^^
(Y,+Y^+Y^+Y^^,)V/(1+2K)
When the feed contains only hydrogen, toluene and benzene, K=0.
By substituting for K in the relationships above,
((Y.+Y^+Y +Y^ ,)V-Y^]lOO '• b t X tmb' t-' „
" CY.+Y^+Y +Y^ , )V ^ b t X tmb
(2Y +2Y^ K)100 g X tmb' o.
(Y,+Y^+Y +Y^ K)V-Y^ ^ b t X tmb' t
(2Y +2Y^ , )100 Y X tmb' D (Y,+Y^+Y +Y^ , )V
^ b t X tmb'
When the feed contains only toluene, xylenes and hydrogen, Y, =0 and
it can be shown from the definitions of V and K that,
K = V-J^ 2-V
Substituting for K in the relations previously derived,
(fV^t^V\mb^f2-V)-YjlOO ^ 5 = (Yu+Y^+Y +Y . )(2-V)
^ b t X tmb'^ '
Y,
(2Y +2Y^ ,-2(Y.+Y^+Y +Y^ ,)(V-l)]lOO S = X tmb ^ b t X tmb'^ ''
^\^\^^x^^mbn2-V)-Y,
(V^^tmb-^^V^^\mb^^^-l^)^°° „ D - (Yb-Y^-Y^-Y^^b)f2-V)
When the feed contains only toluene and hydrogen, V=l and K=0.
Substituting for V and K in any of the relationships above,

150
e = (Y,+Y +Y^ , ) 1 0 0 ^ b X t m b ' „ (Y^,+Y^+Y +Y, . ) "
b t X t m b '
S = ^^V^^tmb^^°° f b^^x^^mb^
D - TY^^Y^+Y^+Y^^^)
151
A P P E N D I X 3
ADSORPTION ISOTHERMS
INTRODUCTION
The isotherms which result from physical adsorption of vapours have
been classified into five types by Brunauer, Emmett and Teller (45).
Physical adsorption (and chemisorption) of gases are found to follow
Type I isotherms, while physically adsorbed vapours are more in
conformity with the other isotherms. From these isotherms, important
properties of the adsorbent can be determined, such as specific surface
area (Types II and IV), and pore size distribution (Type IV). The best-
known of the theories which give a mathematical expression of the
isotherms are those due to Langmuir; Freundlich; Temkin; and Brunauer,
Emmett and Teller.
Langmuir Isotherm
This isotherm may be expressed as follows (46 - 49):
e = g/g = ^P ^'^m 1+Kp
where 6 is the fraction of the surface covered; g is the amount of
adsorbate taken up by the adsorbent at the partial pressure, p; g
is the amount adsorbed when the surface is covered with a monolayer;
and K is the adsorption equilibrium coefficient. The dependence of K
with temperature is exponential (50):
K = Ko exp (- AH/RT)
where AH is the heat of adsorption and R is the gas constant. The
Langmuir isotherm can be linearised into the following form in order to
test its validity:
1 ^ 1__ i + i .
S 81 " ^m
152
Adsorption data which follow the Langmuir isotherm should yield a
straight line in the whole range of coverages from 9 = 0 to 6 = 1 when
—• is plotted against —. From such a ]
and the parameter K can be estimated.
—• is plotted against —. From such a plot the monolayer adsorption g
Freundlich Isotherm
This isotherm is an empirical relationship between the amount of an
adsorbate on an adsorbent surface and the pressure of the gas or vapour
in equilibrium with it (48, 51-53):
e = g/g, = c pi/"
where c and n are parameters dependent on temperature and on the
particular system under study. It has, however, been demonstrated that
the isotherm may be derived theoretically, either from a thermodynamic
or a statistical approach (39). The final form of the Freundlich
isotherm is:
6 = -8- = (a p)' 'r/% g o ^ **m
where a and q are constants which do not vary with temperature.
Numerically, a is the reciprocal of the pressure, p, necessary to
cover the surface with a monolayer while q (= - AH ) is the heat of ' ^m ^ m'
adsorption at monolayer coverage. For purposes of data analysis, the
isotherm may be rearranged into the following form and Ing plotted
against Inp: Ing = (Ing + Ina ) + — Inp
^m ^m
Temkin Isotherm
This isotherm, which is a modification of the Langmuir isotherm, may
be expressed as follows (54-56):
RT = = — In A g q a o °m ^o
153
where a is a positive constant, q (= - AH ) is the heat of adsorption
at zero surface coverage, A = a exp (q /RT), and a is a constant.
For correlation purposes, the isotherm is expressed as follows and g
plotted versus Inp: n q ?
a = -^ RT (Ina + -£) t- JH RT Inp • q a o RT q a ^
^o ^o
The BET Isotherm
This isotherm is obtained by extending the Langmuir theory of
adsorption, which focuses attention mainly on monolayer adsorption,
to multilayer physical adsorption. The formal form of the isotherm is
^^'^^- C(P/P )
g„ ' (l-P/P^)(l+P/P^(C-l))
where P is the vapour pressure of the adsorbate at the temperature
under consideration and C is a constant which depends on the nature
of the adsorbate-adsorbent system. For use in correlation of data the
BET isotherm is linearised into the following form, P/V(P -P) being
plotted against the relative pressure, P/P :
P V(P^ - P)
I
m + -^ - 1.
m
P • P
o
where V is the volimie of gas (NTP) adsorbed at a pressure P, V is the
volume necessary to form a monolayer and P and C are constants.
154
APPENDIX 4
TEST OF THE INFLUENCE OF TRANSPORT PROCESSES
1. Film diffusion . At steady state, the rate of reaction is equal to
the rate of transport of reactants through the film:
r = K Sv(P -P ) g g s'
^^fli .100^ = K (P -P ) 6(1-E,) 3600 g g s
3 where r = reaction rate, g moles/m .s
2 3 S = specific surface of catalyst, m /m
r = reaction rate, g moles/g.hr 3
S, = bulk density of catalyst bed, kg/m
d = effective diameter of catalyst particle = 6/Sv,m
K = mass transfer coefficient from fluid to particle, g 2
g moles/(m .s.atm)
P = partial pressure in the bulk gas, atm
P = partial pressure at outer surface of catalyst particle
atm
E, = porosity of catalyst bed
The mass transfer coefficient can be calculated from the relation
ship of Chu et al.(266): D
8 m ^ _ , p ,-0.78 „ -2/3 ^ , e „. — 5 — =5.7 (rj-%- ) . Sc for 1<_ p - 30
where P = total pressure, atm
M = molecular weight of gas mixture, kyk mole
V = superficial velocity (i.e. based on empty reaior),m/s 3
S = density of gas mixture, kg/m
R = Reynolds number based on catalyst particle.
155
Therefore,
P -P r S. d M , ' e „ .,0 ,._ Ap g s _ o b p m _1 , p ,0.78 2/3 P " P " 21.6(1-E,) • V • 5.7 4-E,-' •
^ b' s b m
The variables which affect film diffusion are r ,P,T,R and ^v,., , O n.,
where T= Temperature, R is the hydrogen/toluene ratio and iiiv,„ is 2
the volumetric flowrate of hydrogen. It can be shown from the
equations to be used below that film diffusion is more probable at:
1) higher reaction rates, r
2) higher total pressures, P
3) lower temperatures, T
4) lower hydrogen/toluene ratios , R
5) lower hydrogen flow rates, CIJV,^ "2
By considering the data points at 400 and 500 C with the highest
and lowest reaction rates (Figures 5-12 and 5-14), it can be
verified that the reaction rate is the more critical variable.
Consequently, the pressure drop over the film is calculated for
the highest reaction rate:
r = 0.006225 gnol/.g.hr
P =11 atm
T = 773 K • •
R =5.9 mol/mol
c)>v,u = 33.6 ml/s "2
P =1.60 atm
d = reactor diameter = 0.01 m
d = 420xl0'^m P
E, =0.5 ' 3
S^ = 550 kg /m The fol lowing phys i ca l cons t an t s can be computed:
_3 M = 15.08x10 kg/kg mole
" 3 S = 2.62 kg/m-^ m ^'
V = 0.12 m/s
cjj, „-, the constant in the Lennard-Jones potential function and n,
156
the collision integral are calculated (238):
" T , H 2 =4-38^ n^ = 0.79
-5 2 From these, the effective diffusivity D„ ^ = 1.72.10 m /s
1 ."2
«D,H2 = °-" .„ CL, = 5.79.10" m
-10 a„ =2.97.10 m "2
The viscosities are calculated:
n,p = 1.79.10'^ kg/m.s
n„ = 1.81.10"^ k /m.s Ho g *^; =4.59 ^ ^ = 0.099 "2'^ -5 r\ = 1.80.10 k /m.s m g'
where n = viscosity of gas mixture. m
The dimensionless numbers are calculated: S V d
R = ^ £ = 14.3
p h \ n
Sc = -^-^ = 0.409 m T,H2
With the values computed above, the relative pressure drop is
obtained:
| £ = 1.3.10-^
On the basis of this it is concluded that the effect of film
diffusion is negligible.
. Pore diffusion. Since the heat effect of the disproportionation
reaction is small, the porous sphere model (240) for an isothermal
catalyst particle is applied to analyse the effect of pore
diffusion on the kinetics. Since the reaction may be considered
irreversible (all measurements were in the differential range) and
first order in toluene (the kinetic results indicate this), Weisz'
157
criterion may be .pplied: r r
exp D ,-C^ $ = " P < 1
eff S
where cji is the experimental Thiele modulus, r is the reaction exp , * ' c rate in gmole/m .s,r- is the radius of the catalyst particle, in
P 2 m,D ^. is the effective diffusivity, m /s,and C is the concentration ' eff J > I s
of the reactant on the outside surface of the catalyst,gmol/m .
It can be shown from the equations to be used below that pore
diffusion is more serious at 1) higher reaction rates and 2)
higher temperatures, and that for the present case, the other
process variables (P, R,etc.) have no influence on pore diffusion.
On the basis of these considerations, the effect of pore diffusion
is calculated for the highest reaction rate and highest tempera
ture as was also chosen above for film diffusion:
r = 0.006225 gmol/g.hr
P =1.6 atm
T = 773 K
E, =0.5 b 3 S = 550 kg/m d = 420.10"^m P The pore radius, r , tortuousity factor,"^ and porosity of the catalyst, E , and the diffusivity of toluene in hydrogen already calculated above, D ,„_, have the following values:
-10 r = 4.5.10 m po t - 2 E = 0.5
" -5 2 D„ „ = 1.72.10 m' /s '."2
Knudsen diffusion which plays an important role in pore diffusion is calculated as follows:
F T 1/2 c -7 2
\ = 9 ^ - V ^& - f = 0-32.10 ^m2/s The effective diffusivity is given by:
°eff = F^— * 4 - " = 0.32.10-V/s "^ T,H2 K
158
p T 3
Cg = Rj = 25.2 gmol/m
0.006225 S^ ^Qoo , o n c ^ i / 3 ^o = (1 - E^) • 3600 = 1-9° ^"l/™ • =
With these values, ci = 0.11, which indicates that the effect ' exp
of pore diffusion is negligible.
Ideality of the reactor.
Reactor diameter, , „ „, ' d = 0.01 m
Catalyst diameter, d = 420.10" m ' P
Reactor length, L = 0.30 m d/d = 2 4
P L/d = 715
P For the experiments, R varied between 1 and 24, so that P varied
®p between 1 and 2. Consequently B is large enough in all cases. It is, therefore, concluded that the reactor was ideal under the
conditions of the experiments.
Pressure drop over the reactor
The pressure drop is given by:
Ap = L S V^ OzEi .150 p(l-E) ^ P d • ^3 *• S V d * i--'^)
p E p 2
where Ap = pressure drop, N/m
L = reactor length, m 3
S = gas density, kg/m
V = superficial fluid velocity (based on empty reactor),
m/s
d = catalyst particle diameter, m
E = intergranular porosity of catalyst bed 2
y = fluid viscosity, N.s/m
Using the same reaction conditions as in 1. and 2. above, and the
quantities already calculated:
L = 0.30 m
S =2.62 kg/m'
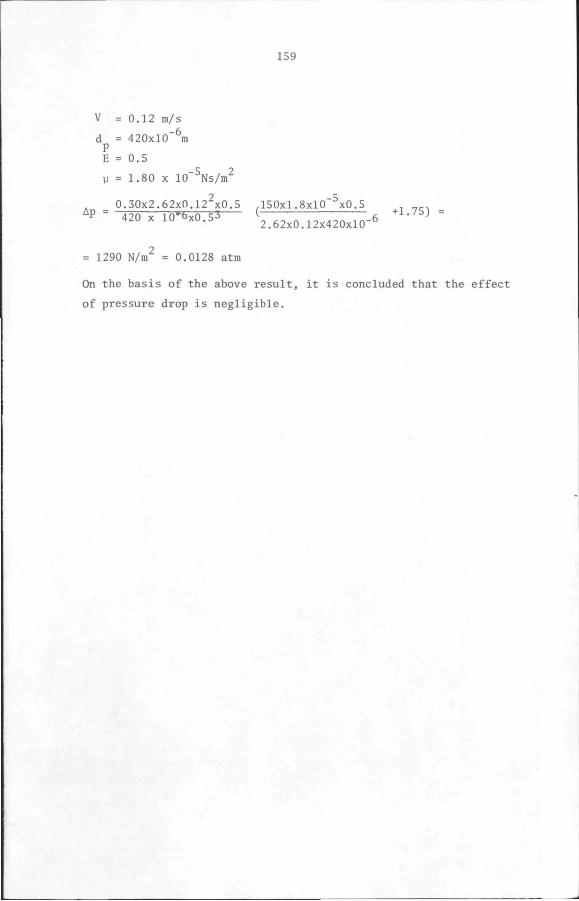
159
V = 0.12 m/s
d = 420xl0"^m P E = 0.5
y = 1.80 X 10"^Ns/m2
0.30x2.62x0.122x0.5 ,150x1.8xlO"^x0.5 , _^,
P 420 X io-bxo.5^— ^7T7TT7T:7T7-6 " " ^ 2.62x0.12x420x10'
1290 N/m^ = 0.0128 atm
On the basis of the above result, it is concluded that the effect
of pressure drop is negligible.
160
APPENDIX 5
INTERNAL NORMALIZATION
The response of an arbitrary component can be represented as
follows:
A. = K. g. 1 1 " 1
where A; is the response, for example peak area of component i
K. is the response factor of component i
g. is moles of component i
Therefore, g. = = B. A. 'l KJ 1 1
A similar relationship may be written for the standard component, s: g = B A 's s s
By combining both expressions, one obtains: g. k A. 6. A. A.
g k. A 6 A i,s A 's 1 s s s s
where g. is the experimentally determined response of i relative 1, s
to s.
If m. is the mole fraction of i, one obtains: 1
8. g A. ,A 6. A. m = gi = i,s.^ s . 1/ s ^ i,s 1 i n n n
j=l J j=l J.s S J S ^^^ ],S J
161
APPENDIX 6
CORRECTION FOR CATALYST DEACTIVATION
In order to develop a method of correction for catalyst deactivation,
the following assumptions are made:
1. Catalyst deactivation is due to the elimination of active sites with
time of reaction. Thus the number of active sites is a function of
time only,if other reaction variables are constant:N. = f(t).
2. The rate of reaction is a function of the number of active sites
and the reaction conditions. The form of this deactivation function
can be of any type (linear, exponential, polynomial, etc.) but must
not change during the course of the kinetic measurements.
3. Tte rate of reaction is a power function of the conversion. This is
because, as will be shown below, it is necessary to solve explicit^
for the conversion, which is the quantity usually measured in
kinetic studies.
Assuming an n power dependency of the rate on the conversion and
an m power for the rate on the number of active sites, one can write:
• s,t - '^^^")s,t = f(P' T' C < 1
' s,ts = '^f?"^s,ts = ffP'T.ON-^^ 2
• m,t = '^o(5")m,t = g^P.T.ON"^ 3
•^Cts - V^"^c,ts = gtP.T.C^N^^s '
where k and k are constants, R is the reaction rate at standard o s
conditions, R is the measured rate, R is the corrected rate, ts is m ' c ' the standard time, t is an arbitrary time and C is the conversion.
These equations can be transformed as follows:
^''s,t^'^" = ' l s,t = f'''"(P.T,C)N™/" 5
^'^s,ts)''" = '^l^s,ts= f^/"CP.T.C)<^ 6
162
f'^m,t^''" = 2^m,t = .^'"(P>T,C)N"'/"
^^,ts^''" = '^2^c.ts = g^'"(P.T.C)N™/^
6/5 =
8/7 =
There]
( R s , t s ) ^ / " (R^^^) i /n
( R e t s ) ! / "
m,t
fore , c , t s
m,t
^ s . t s
^ s , t
_ ^ c , t s
S , t
s , t s
j^m/n
j^m/n
Note:The correction applied must not be too great.
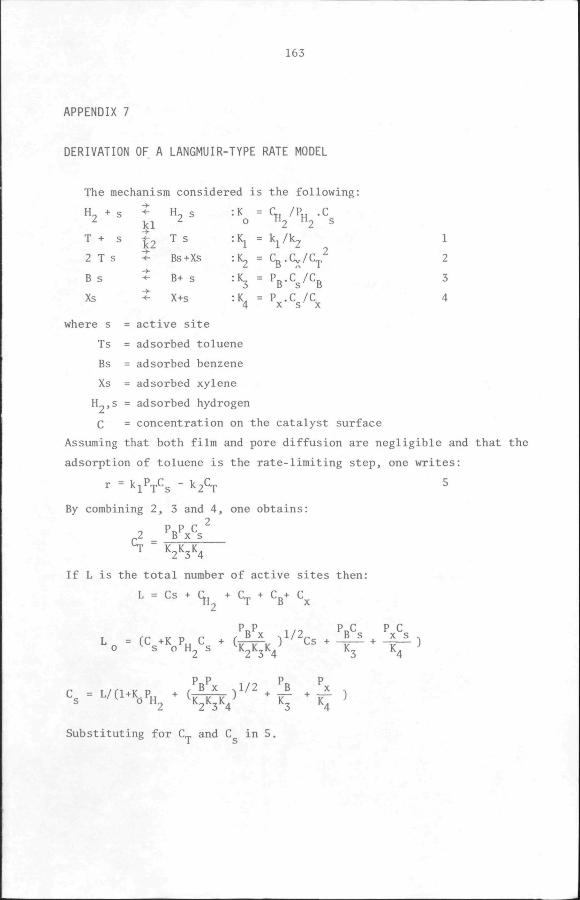
163
APPENDIX 7
DERIVATION OF A LANGMUIR-TYPE RATE MODEL
The mechanism considered is the following:
H2 + s
T + s
2 T s
B s
Xs
kl H2 s
T s
Bs+XS
B+ s
X+s
:K = o
•1 =
h -h -K, =
B * T
PB-VS P .C /C X s X
1
2
3
4
where s = active site
Ts = adsorbed toluene
Bs = adsorbed benzene
Xs = adsorbed xylene
H„,s = adsorbed hydrogen
C = concentration on the catalyst surface
Assuming that both film and pore diffusion are negligible and that the
adsorption of toluene is the rate-limiting step, one writes:
- = kiPTC3 ^2^1
By combining 2, 3 and 4, one obtains:
2 V x ^ 4 - K2K3K4
If L is the total number of active sites then:
L = Cs + Cj H2 ' S ' S^ x
PRP (C +K P„ C + (-JTV „ ^ s o H s K-K K.
, ,T PQC P C ,l/2_ Bs x s , ) Cs + - j ^ — + - j ^ — )
s = '»-oS • '^,'"' B
P X ^
^3 ^ ^ ^
Substituting for C_ and C in 5.
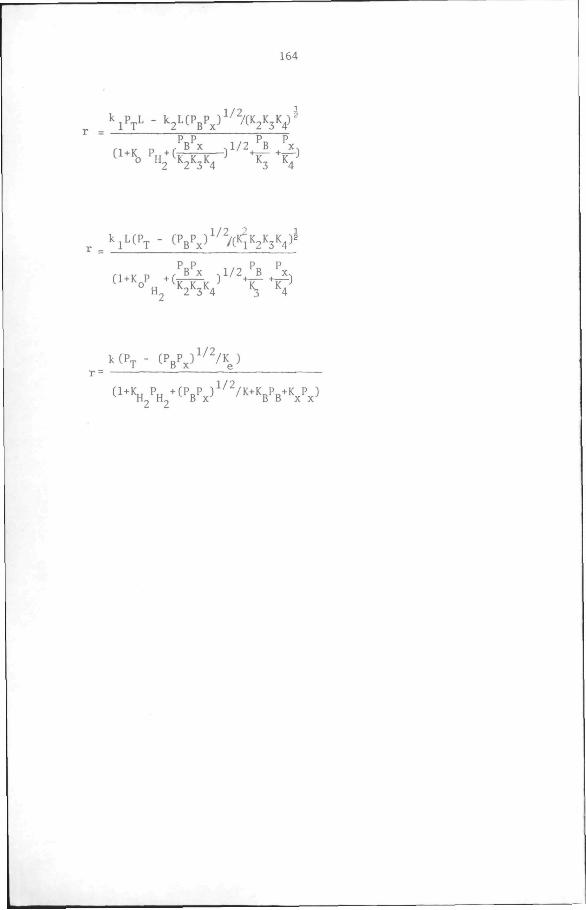
164
k^P.^L-k2L(P3P^)^/^/(K2K3K^)^
P P P P , , ^ „ / B X , 1 / 2 B X,
k^L(P^ - C P B P ^ ) ' ^ V I K 2 K 3 K ^ ) ^
(1 + K„P +(!B!2i ) 1 / 2 , ! B , ! X 3 H2 '^2S'^4 S 4
k(PT,- ( P B P , ) ' ^ H ^
^'^W^^h'f^'/^^VH^h".^
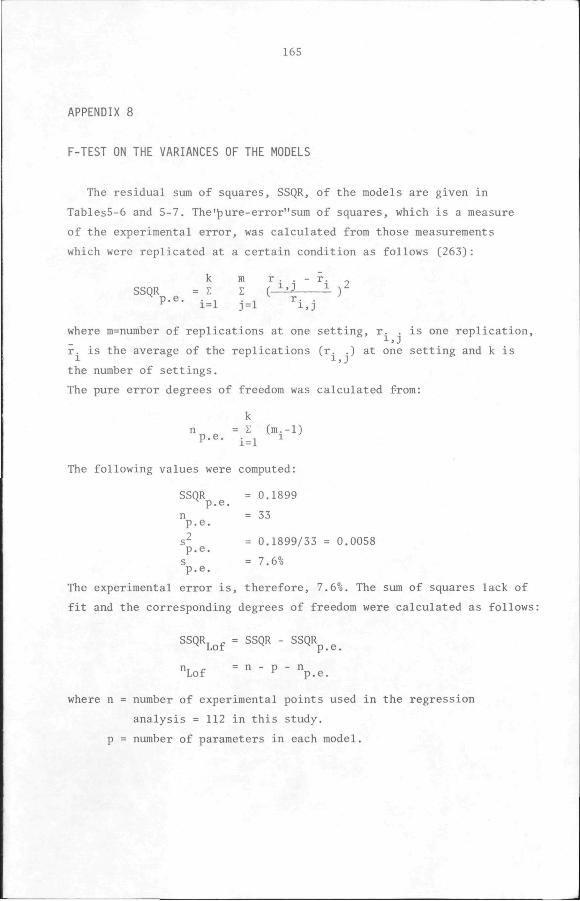
165
APPENDIX 8
F-TEST ON THE VARIANCES OF THE MODELS
The residual sum of squares, SSQR, of the models are given in
Tables5-6 and 5-7. The'j3ure-error"sum of squares, which is a measure
of the experimental error, was calculated from those measurements
which were replicated at a certain condition as follows (263):
k m r . . - r. „ SSQR = E l [-^^ ) ^ p.e. . , . ., r. . ^ 1=1 3=1 i,j
where m=number of replications at one setting, r. . is one replication,
r. is the average of the replications (r. .) at one setting and k is 1 i> J
the number of settings. The pure error degrees of freedom was calculated from:
k n = T. (m.-l) p.e. i=i 1
The following values were computed:
SSQR = 0.1899 ^ p.e.
n =33 p.e.
s^ = 0.1899/33 = 0.0058 p.e. s =7.6% p.e.
The experimental error is, therefore, 7.6%. The sum of squares lack of
fit and the corresponding degrees of freedom were calculated as follows:
SSQR = SSQR - SSQR
n, J. = n - p - n Lof ^ p.e.
where n = number of experimental points used in the regression
analysis = 112 in this study.
p = number of parameters in each model.
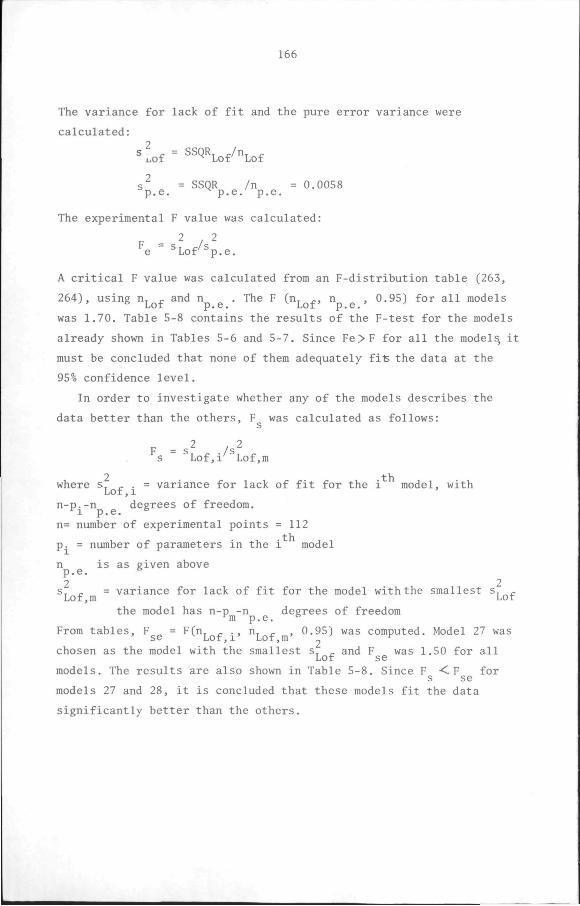
166
The variance for lack of fit and the pure error variance were
calculated:
s = SSQR, Jn, ^ i of ^ Lof Lof
s^ = SSQR /n = 0.0058 p.e. ^ p.e. p.e.
The experimental F value was calculated:
F - 2 2 e ' Lof'^p.e.
A critical F value was calculated from an F-distribution table (263,
264), using n, ^ and n . The F (n, , n , 0.95) for all models '' ^ Lof p.e. ^ Lof p.e.' '
was 1.70. Table 5-8 contains the results of the F-test for the models
already shown in Tables 5-6 and 5-7. Since Fe>F for all the models, it
must be concluded that none of them adequately fite the data at the
95% confidence level.
In order to investigate whether any of the models describes the
data better than the others, F was calculated as follows: s
2 2 F = sf ^ ./sf ^ s Lof,i Lof,m
where s, - . = variance for lack of fit for the i model, with Lof,i '
n-p.-n degrees of freedom. ^1 p.e. ^
n= number of experimental points = 112
p. = number of parameters in the i model
n is as given above p.e. ^ 2 2 s, ^ = variance for lack of fit for the model with the smallest s. ^ Lof,m Lor
the model has n-p -n degrees of freedom *m p.e. ^
From tables, F = F(n. _ ., n, ^ , 0.95) was computed. Model 27 was se Lot,i Lot,m ^
chosen as the model with the smallest s, - and F was 1.50 for all Lof se
models. The results are also shown in Table 5-8. Since F < F for s se
models 27 and 28, it is concluded that these models fit the data
significantly better than the others.
167
APPENDIX 9
FORMATION OF TRIMETHYLBENZENE
The r e a c t i o n s by which t r imethylbenzene can be formed from a feed
c o n s i s t i n g of t o luene and xylenes a r e :
2X ? T + TMB 1
T+X t B + TMB 2
The y ie ld of t r ime thy lbenzenes by the two r e a c t i o n s i s given by:
_ 2TMB 1 X
o
TMB ' 2 X
o
where TMB is the moles trimethylbenzene in the product and X is the
moles xylene in the feed.
Let SUM=total moles of aromatics in the reaction mixture. Then SUM =
B+T+X+TMB, where B,T and X denote the moles of benzene, toluene and
xylenes in the reaction product.
Let n = the mole fraction of xylenes in the feed.
Then X = n.SUM. o When the feed consists of a 1:1 mixture of benzene and xylenes, SUM =
= B +X = B+T+X+TMB, n= 1/2 and 0 0 ' '
B+T+X+TMB o 2
Since only reaction 1 above can occur with this mixture,
4TMB B+T+X+TMB
, where Y is the yield.
When the feed consists of a 1:1:1 mixture of benzene, toluene and
xylenes, SUM = B +T +X = B+T+X+TMB, n = 1/3 and X = B-'T+X+TMB ' ' o o o ' o 3
If reaction 1 above occurs to the exclusion of reaction 2 with this
mixture, then Y _ 6TMB
B+T+X+TMB
168
T4r .-I, • .. ^-u ^ 3TMB
If the reverse is true, then Y = _, _ „ .„•-D+1 + A+ IMrS
Now, assume that xylene disproportionation (reaction I) is the only
reaction which occurs in both mixtures. In other words, that toluene
has no effect on the reaction of xylene in the second mixture. This
hypothesis was tested by passing the first mixture (2.6 yl/s consisting
of 1:1 mole ratio of benzene and m-xylene) over the same catalyst
used in the kinetic experiments (chapter 5) at 4 and 6 ata total
pressure, and then the second mixture (3.9IJ1/S consisting of 1:1:1
mole ratio of benzene, toluene and m-xylene) at 6 and 9 ata. The
difference in pressure ensured the same m-xylene partial pressure, P ,
in both experiments. The remaining process conditions were the same in
both cases:
Temperature :450 C
H_/aromatics ratio :16.7 mol/mol
W/F , :352 g.hr/mol
m-xylene ^
If the lypothesis postulated above is valid, since the partial pressure
and space time of m-xylene is the same in both experiments, the yield
and the reaction rate determined in both cases should be the same.
The results shown in Table 5-11 support the hypothesis that xylene
disproportionation occurs to the exclusion of transalkylation between
toluene and m-xylene. The yields and rates shown in Table 5-11 were
corrected for catalyst deactivation.
169
REFERENCES
1. Hammett, L.P.,A.J.Deyrup, J.Am.Chem.Soc.,54,2721(1932)
Hammett, L.P. Chem.Rev.,16,67(1935)
Hammett, L.P.,Physical Organic Chemistry,Ch.9, Mc Graw-Hill, New
York, 1940.
2. Tanabe, K., Solid Acids and Bases, Academic Press, London, 1970.
3. Thomas, C.L.,Ind.Eng.Chem.Anal.,41,2564(1949).
4. Greenall, A., Ind.Eng.Chem.Anal.,41, 1485(1949).
5. Webb, A.N.,Ind.Eng.Chem., 49, 261(1957).
6. Tamele, M.W.,Disc.Faraday Soc.8,270(1950) .
7. Fiorni,L., Catalysis Reviews, 8,65(1973).
8. Johnson,0.,J.Phys.Chem.,59, 827(1955).
9. Benesi, H.A.,J.Am.Chem.Soc.,78, 5490(1956).
10. Benesi, H.A.,J.Phys.Chem.,61, 970(1957).
11. Richardson,R.L.,S.W.Benson, J.Physical Chemistry, 61, 405(1957).
12. Stone, R.L.,H.F.Rase, Anal.Chem., 29, 1273(1957).
13. Tezuka, Y.T.Takeuchi , Bull .Chem.Soc.Japan, 38, 485(1965) .
14. P ines , H.,W.O.Haag,J.Am.Chem.Soc.,82,2471(1960)
15. Parry, E.P.,J.Catalysis, 2, 371(1963).
16. Webb, A.N.,Ind.Eng.Chem.Anal.,49,261(1957).
17. Clark,A., V.C.F.Holm,and D.M.Balckburn, J.Catalysis, 1, 244(1962).
18. Clark,A., V.C.F.Holm, ibid, 2, 16, 21(1963).
19. Murakama,Y.,T.Shiba,Actes Congr.Intern.Catalyse, 2e,Paris III,No.
129(1960).
20. Nicholson, Nature, 186,630(1960).
21. Fripiat, J.J.,A.Leonard and J.B.Uytterhoeven, J.Phys.Chem.69,3274
(1965).
22. Hsieh, P.Y., J.Catalysis, 2, 211(1963).
23. Benson,J.E.,K.Ushiba and M.Boudart,J.Catalysis, 9, 91(1967).
24. Stone,F.S., L.Whalley, J.Catalysis, 8, 173(1967).
25. Peri, J.B., J.Phys.Chem.69, 231(1965).
26. Zettlemoyer,A.C., J.J.Chessick, J.Phys.Chem., 64, 1131(1960).
27. Mills, G.A., E.R.Boedecker,and A.G.Oblad,J.Am.Chem.Soc.72,1554(1950).
170
28. Milliken, T.H., G.A.Mills and A.G.Oblad, Discussions Faraday Soc.
8, 279(1950).
29. Schwab,G.M., H.Kral, Proc.Third Int.Congr.Catalysis,p.433, North-
Holland, Amsterdam (1965).
30. McIver,D.S., H.H.Tobin and R.T.Barth,J.Catalysis, 2, 485(1963).
31. Weil-Malherbe, H., Weiss,J., J.Chem.Soc.2164(1948).
32. Walling,C, J.Am.Chem.Soc.72, 1164(1950).
33. Hirschler, A.E., J.Catalysis, 2, 428(1963).
34. Leftin, H.P.,Hobson, M.C., Advances in Catalysis, Vol.14, p.115,
Academic Press London (1963).
35. Terenia, A.N., ibid, vol.15,p.227 (1964).
36. Mapes, J.E., Eischens, R.R.,J.Phys.Chem.,58, 809(1954).
37. Basila, M.R., T.R.Kantnes, ibid 71, 467(1967).
38. Stanislaus,A., M.J.B.Evans and R.F.Mann, Can.J.Chem.Eng.,51,725
(1973).
39. Hayward D.O., B.M.W.Trapnell, "Chemisorption", 2nded., Butterworths,
London (1964).
40. Weast, R.C., "Handbook of Chemistry and Physics, 52nded., The
Chemical Rubber Co., Cleveland (1971).
41. Kobe, K.A.,R.H.Harrison, Petroleum Refiner, 33, 11, 161(1954).
42. Gregg, S.J., "The Surface Chemistry of Solids", Chapman and Hall,
London (1961).
43. Kemball, C , "Advances in Catalysis", 2, 233(1950).
44. Gregg, S.J., K.S.W.Sing, "Adsorption, Surface Area and Porosity,
Academic Press, London (1967).
45. Brunauer, S., P.H.Emmett and E.Teller, J.Amer.Chem.Soc.,60, 309
(1938).
46. Langmuir, I., J.Amer.Chem.Soc.,38,2219(1916).
47. Langmuir, I., J.Amer.Chem.Soc., 37, 1139(1915).
48. Langmuir, I., J.Amer.Chem.Soc., 40, 1361(1918).
49. Langmuir, I Trans.Faraday Soc., 17, 621(1921).
50. Thomson, S.j., G.Webb, "Heterogeneous Catalysis", Oliver and Boyd
London (1968).
51. Freundlich,H.,"Kapillarchemie",Akad.Verlag M-B.H,Leipzig (1909).
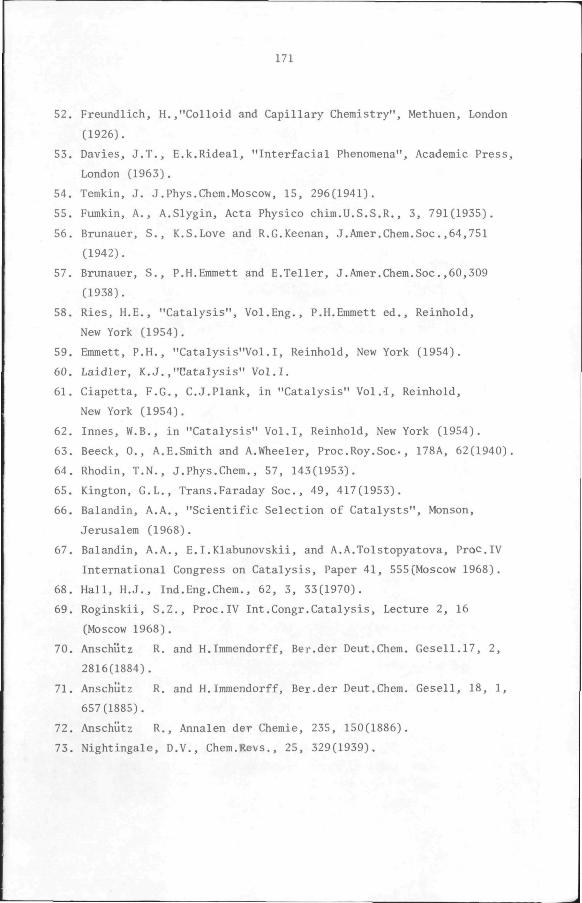
171
52. Freundlich, H.,"Colloid and Capillary Chemistry", Methuen, London
(1926).
53. Davies, J.T., E.k.Rideal, "Interfacial Phenomena", Academic Press,
London (1963).
54. Temkin, J. J.Phys.Chem.Moscow, 15, 296(1941).
55. Fumkin, A., A.Slygin, Acta Physico chim.U.S.S.R., 3, 791(1935).
56. Brunauer, S., K.S.Love and R.G.Keenan, J.Amer.Chem.Soc.,64,751
(1942).
57. Brunauer, S., P.H.Emmett and E.Teller, J.Amer.Chem.Soc.,60,309
(1938).
58. Ries, H.E., "Catalysis", Vol.Eng., P.H.Emmett ed., Reinhold,
New York (1954) .
59. Emmett, P.H., "Catalysis"Vol.I, Reinhold, New York (1954).
60. Laidler, K.J.,"Catalysis" Vol.1.
61. Ciapetta, E.G., C.J.Plank, in "Catalysis" Vol.-I, Reinhold,
New York (1954).
62. Innes, W.B., in "Catalysis" Vol.1, Reinhold, New York (1954).
63. Beeck, 0., A.E.Smith and A.Wheeler, Proc.Roy.Soc-, 178A, 62(1940).
64. Rhodin, T.N., J.Phys.Chem., 57, 143(1953).
65. Kington, G.L., Trans.Faraday Soc, 49, 417(1953).
66. Balandin, A.A., "Scientific Selection of Catalysts", Monson,
Jerusalem (1968).
67. Balandin, A.A., E.I.Klabunovskii, and A.A.Tolstopyatova, Proc.IV
International Congress on Catalysis, Paper 41, 555(Moscow 1968).
68. Hall, H.J., Ind.Eng.Chem., 62, 3, 33(1970).
69. Roginskii, S.Z., Proc.IV Int.Congr.Catalysis, Lecture 2, 16
(Moscow 1968).
70. Anschiitz R. and H. Immendorff, Ber.der Deut.Chem. Gesell.l7, 2,
2816(1884).
71. Anschiitz R. and H. Immendorff, Ber.der Deut.Chem. Gesell, 18, 1,
657(1885).
72. Anschiitz R., Annalen der Chemie, 235, 150(1886).
73. Nightingale, D.V., Chem.Revs., 25, 329(1939).
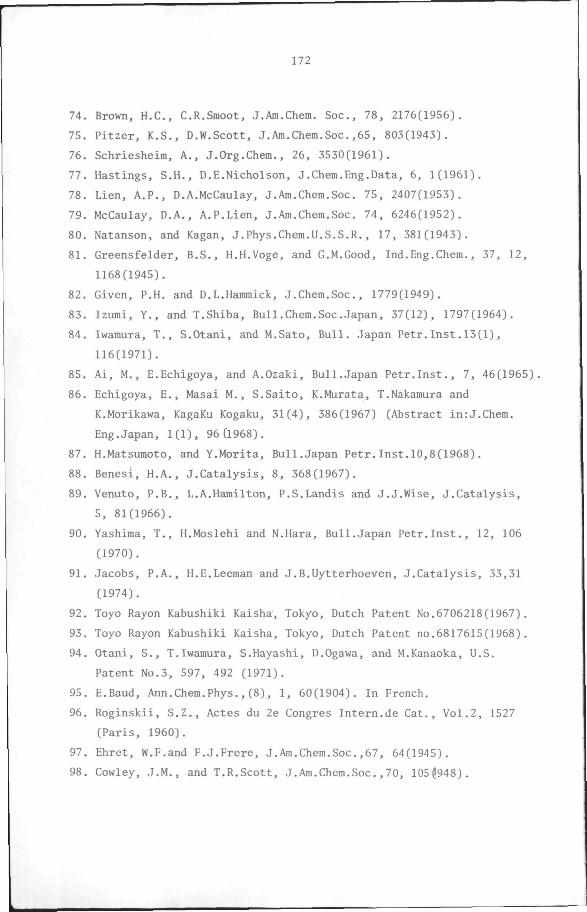
172
74. Brown, H.C., C.R.Smoot, J.Am.Chem. Soc, 78, 2176(1956).
75. Pitzer, K.S., D.W.Scott, J.Am.Chem.Soc.,65, 803(1943).
76. Schriesheim, A., J.Org.Chem., 26, 3530(1961).
77. Hastings, S.H., D.E.Nicholson, J.Chem.Eng.Data, 6, 1(1961).
78. Lien, A.P., D.A.McCaulay, J.Am.Chem.Soc. 75, 2407(1953).
79. McCaulay, D.A., A.P.Lien, J.Am.Chem.Soc. 74, 6246(1952).
80. Natanson, and Kagan, J.Phys.Chem.U.S.S.R., 17, 381(1943).
81. Greensfelder, B.S., H.H.Voge, and G.M.Good, Ind.Eng.Chem., 37, 12,
1168(1945).
82. Given, P.H. and D.L.Hammick, J.Chem.Soc, 1779(1949).
83. Izumi, Y., and T.Shiba, Bull.Chem.SocJapan, 37(12), 1797(1964).
84. Iwamura, T., S.Otani, and M.Sato, Bull. Japan Petr.Inst.13(1),
116(1971).
85. Ai, M., E.Echigoya, and A.Ozaki, Bull.Japan Petr.Inst., 7, 46(1965).
86. Echigoya, E., Masai M., S.Saito, K.Murata, T.Nakamura and
K.Morikawa, KagaKu Kogaku, 31(4), 386(1967) (Abstract in:J.Chem.
Eng.Japan, 1(1), 96(1968).
87. H.Matsumoto, and Y.Morita, Bull.Japan Petr.Inst.10,8(1968).
88. Benesi, H.A., J.Catalysis, 8, 368(1967).
89. Venuto, P.B., L.A.Hamilton, P.S.Landis and J.J.Wise, J.Catalysis,
5, 81(1966).
90. Yashima, T., H.Moslehi and N.Hara, Bull.Japan Petr.Inst., 12, 106
(1970).
91. Jacobs, P.A., H.E.Leeman and J.B.Uytterhoeven, J.Catalysis, 33,31
(1974).
92. Toyo Rayon Kabushiki Kaisha, Tokyo, Dutch Patent No.6706218(1967).
93. Toyo Rayon Kabushiki Kaisha, Tokyo, Dutch Patent no.6817615(1968).
94. Otani, S., T.Iwamura, S.Hayashi, D.Ogawa, and M.Kanaoka, U.S.
Patent No.3, 597, 492 (1971).
95. E.Baud, Ann.Chem.Phys.,(8), 1, 60(1904). In French.
96. Roginskii, S.Z., Actes du 2e Congres Intem.de Cat., Vol.2, 1527
(Paris, 1960).
97. Ehret, W.F.and F.J.Frere, J.Am.Chem.Soc.,67, 64(1945).
98. Cowley, J.M., and T.R.Scott, J.Am.Chem.Soc.,70, 105^948).
173
99. Johnson, R.L. and B.Siegel, Nature, 210, 1256(1966).
100. Toyo Rayon Kabushiki Kaisha, Tokyo, Dutch Patent No.6817616(1968).
101. Mills, W., U.S.Patent No.582,938(1896).
102. Mills, W., British Patent No.20377(1895).
103. Mills, W., German Patent No.94849(1896).
104. Gmelin, Handbuch der Anorganischen Chemie, Teil B, 35, 157,
Verlag Chemie, Berlin (1934).
105. Kochloefl, K., M.Kraus and V.Bazant, Proc.IV Int. Congr.
Catalysis, Paper 85, 490(Moscow, 1968).
106. Kraus, M., Adv.Catalysis, 17, 76(1967).
107. Boreskov, G.K., Actes du 2e Congres Intern, de Cat., Vol.1, 163
(Paris, 1960).
108. Moerkerken, A., B.Behr, M.A.Noordeloos-Maas, and C.Boelhouwer,
J.Catalysis, 24, 177(1972).
109. Reitsma, H.J. and C.Boelhouwer, J.Catalysis, 33,39(1974).
110. Uytterhoeven, J.B., L.G.Christner, and W.K.Hall, J.Phys.Chem,69,
2117(1965).
111. Jacobs,P.A., H.E.Leeman, J.B.Uytterhoeven, J.Catalysis, 33, 17
(1974).
112. Moscou, L. and M.Lakeman, J.Catalysis, 16,173(1970).
113. Benesi, H.A., J.Catalysis, 173(1973).
114. Csicsery, S.M., J.Catalysis, 19, 394(1970).
115. Papadatos, K. and K.A.Shelstad, J.Catalysis, 28, 116(1973).
116. Moscow, L. and R.Mone, J.Catalysis, 30, 417(1973).
117. Ward, J.W. and R.C.Hansford, J.Catalysis, 13, 154(1969).
118. Wang, K.M. and J.H.Lansford, J.Catalysis, 24, 262(1972).
119. Lunsford, J.H., J.Phys.Chem., 72, 4163(1968).
120. Ward, J.W., J.Catalysis, 17,355(1970).
121. Gutberlet, L.C. and R.J.Bertolacini, U.S.Patent 3, 548,020(1970).
122. Voge, H.H., in "Catalysis", Vol.6, P.H.Emmett, ed., p.407,
Reinhold, New York (1958).
123. Loewenstein, W., Amer.Mineral., 39, 92(1954).
124. Breck, D.W., "Zeolite Molecular Sieves", Wiley, New York (1974).
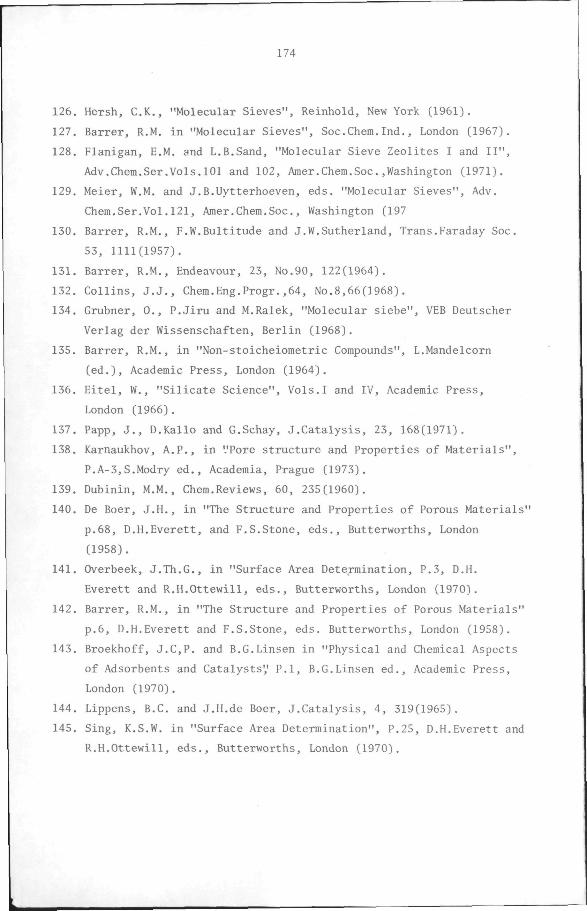
174
126. Hersh, C.K., "Molecular Sieves", Reinhold, New York (1961).
127. Barrer, R.M. in "Molecular Sieves", Soc.Chem.Ind., London (1967).
128. Flanigan, E.M. and L.B.Sand, "Molecular Sieve Zeolites 1 and II",
Adv.Chem.Ser.Vols.101 and 102, Amer.Chem.Soc,Washington (1971).
129. Meier, W.M. and J.B.Uytterhoeven, eds. "Molecular Sieves", Adv.
Chem.Ser.Vol.121, Amer.Chem.Soc., Washington (197
130. Barrer, R.M., F.W.Bultitude and J.W.Sutherland, Trans.Faraday Soc.
53, 1111(1957).
131. Barrer, R.M., Endeavour, 23, No.90, 122(1964).
132. Collins, J.J., Chem.Eng.Progr.,64, No.8,66(1968).
134. Grubner, 0., P.Jiru and M.Ralek, "Molecular siebe", VEB Deutscher
Verlag der Wissenschaften, Berlin (1968).
135. Barrer, R.M., in "Non-stoicheiometric Compounds", L.Mandelcorn
(ed.). Academic Press, London (1964).
136. Eitel, W., "Silicate Science", Vols.l and IV, Academic Press,
London (1966).
137. Papp, J., D.Kallo and G.Schay, J.Catalysis, 23, 168(1971).
138. Karnaukhov, A.P., in '.'Pore structure and Properties of Materials",
P.A-3,S.Modry ed., Academia, Prague (1973).
139. Dubinin, M.M., Chem,Reviews, 60, 235(1960).
140. De Boer, J.H., in "The Structure and Properties of Porous Materials"
p.68, D.H.Everett, and F.S.Stone, eds., Butterworths, London
(1958).
141. Overbeek, J.Th.G., in "Surface Area Determination, P.3, D.H.
Everett and R.H.Ottewill, eds., Butterworths, London (1970).
142. Barrer, R.M., in "The Structure and Properties of Porous Materials"
p.6, D.H.Everett and F.S.Stone, eds. Butterworths, London (1958).
143. Broekhoff, J.C,P. and B.G.Linsen in "Physical and Chemical Aspects
of Adsorbents and Catalysts',' P.l, B.G.Linsen ed.. Academic Press,
London (1970).
144. Lippens, B.C. and J.H.de Boer, J.Catalysis, 4, 319(1965).
145. Sing, K.S.W. in "Surface Area Determination", P.25, D.H.Everett and
R.H.Ottewill, eds., Butterworths, London (1970).
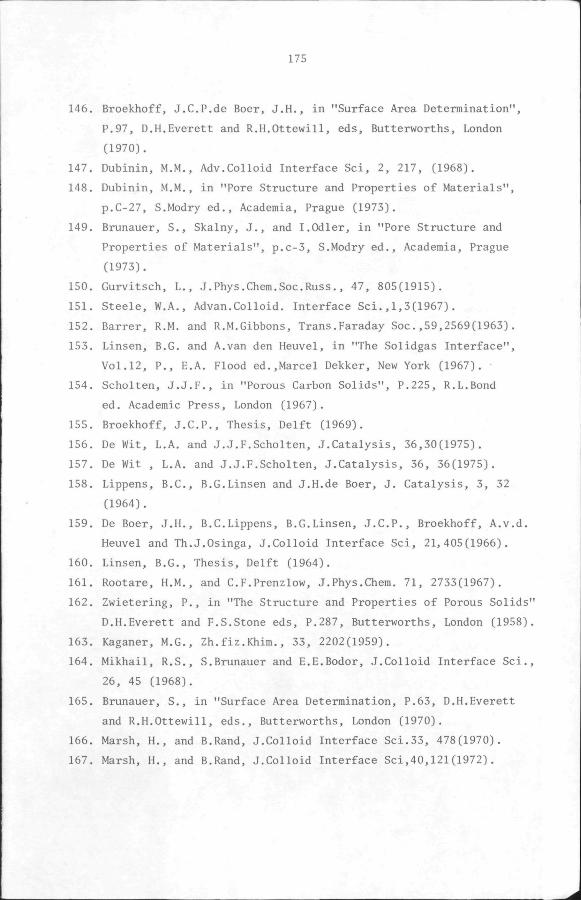
175
146. Broekhoff, J.C.P.de Boer, J.H., in "Surface Area Determination",
P.97, D.H.Everett and R.H.Ottewill, eds, Butterworths, London
(1970).
147. Dubinin, M.M., Adv.Colloid Interface Sci, 2, 217, (1968).
148. Dubinin, M.M., in "Pore Structure and Properties of Materials",
p.C-27, S.Modry ed., Academia, Prague (1973).
149. Brunauer, S., Skalny, J., and I.Odler, in "Pore Structure and
Properties of Materials", p.c-3, S.Modry ed., Academia, Prague
(1973).
150. Gurvitsch, L., J.Phys.Chem.SocRuss., 47, 805(1915).
151. Steele, W.A., Advan.Colloid. Interface Sci.,1,3(1967).
152. Barrer, R.M. and R.M.Gibbons, Trans.Faraday Soc.,59,2569(1963).
153. Linsen, B.C. and A.van den Heuvel, in "The Solidgas Interface",
Vol.12, P., E.A. Flood ed.,Marcel Dekker, New York (1967).
154. Scholten, J.J.F., in "Porous Carbon Solids", P.225, R.L.Bond
ed. Academic Press, London (1967).
155. Broekhoff, J.C.P., Thesis, Delft (1969).
156. De Wit, L.A. and J.J.F.Scholten, J.Catalysis, 36,30(1975).
157. De Wit , L.A. and J.J.F.Scholten, J.Catalysis, 36, 36(1975).
158. Lippens, B.C., B.G.Linsen and J.H.de Boer, J. Catalysis, 3, 32
(1964).
159. De Boer, J.H., B.C.Lippens, B.G.Linsen, J.C.P., Broekhoff, A.v.d.
Heuvel and Th.J.Osinga, J.Colloid Interface Sci, 21,405(1966).
160. Linsen, B.G., Thesis, Delft (1964).
161. Rootare, H.M., and C.F.Prenzlow, J.Phys.Chem. 71, 2733(1967).
162. Zwietering, P., in "The Structure and Properties of Porous Solids"
D.H.Everett and F.S.Stone eds, P.287, Butterworths, London (1958).
163. Kaganer, M.G., Zh.fiz.Khim., 33, 2202(1959).
164. Mikhail, R.S., S.Brunauer and E.E.Bodor, J.Colloid Interface Sci.,
26, 45 (1968).
165. Brunauer, S., in "Surface Area Determination, P.63, D.H.Everett
and R.H.Ottewill, eds., Butterworths, London (1970).
166. Marsh, H., and B.Rand, J.Colloid Interface Sci.33, 478(1970).
167. Marsh, H., and B.Rand, J.Colloid Interface Sci,40,121(1972).
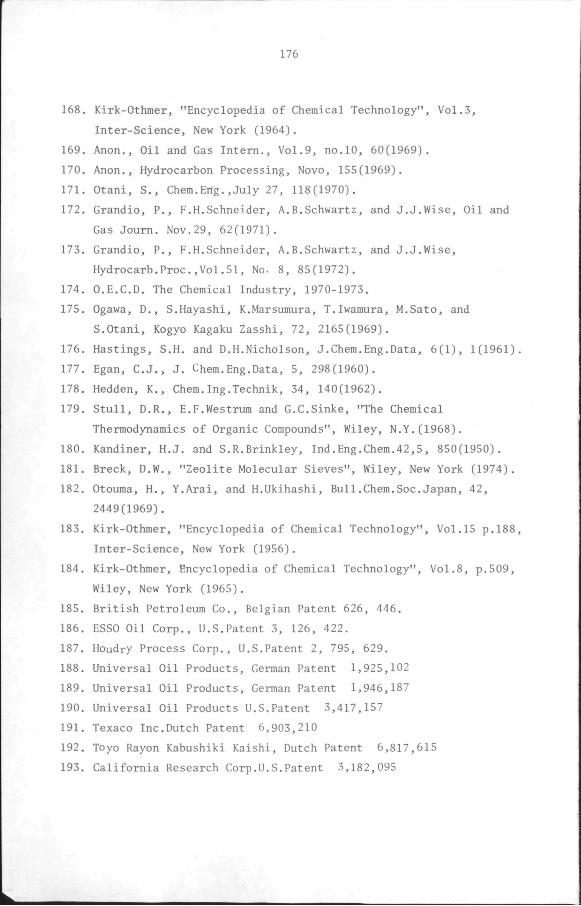
176
168. Kirk-Othmer, "Encyclopedia of Chemical Technology", Vol.3,
Inter-Science, New York (1964).
169. Anon., Oil and Gas Intern., Vol.9, no.10, 60(1969).
170. Anon., Hydrocarbon Processing, Novo, 155(1969).
171. Otani, S., Chem.Eng.,July 27, 118(1970).
172. Grandio, P., F.H.Schneider, A.B.Schwartz, and J.J.Wise, Oil and
Gas Journ. Nov,29, 62(1971).
173. Grandio, P., F.H.Schneider, A.B.Schwartz, and J.J.Wise,
Hydrocarb.Proc.,Vol.5I, No. 8, 85(1972).
174. O.E.C.D. The Chemical Industry, 1970-1973.
175. Ogawa, D., S.Hayashi, K.Marsumura, T.Iwamura, M.Sato, and
S.Otani, Kogyo Kagaku Zasshi, 72, 2165(1969).
176. Hastings, S.H. and D.H.Nicholson, J.Chem.Eng.Data, 6(1), 1(1961).
177. Egan, C.J., J. Chem.Eng.Data, 5, 298(1960).
178. Hedden, K., Chem.Ing.Technik, 34, 140(1962).
179. Stull, D.R., E.F.Westrum and G.C.Sinke, "The Chemical
Thermodynamics of Organic Compounds", Wiley, N.Y.(1968).
180. Kandiner, H.J. and S.R.Brinkley, Ind.Eng.Chem.42,5, 850(1950).
181. Breck, D.W., "Zeolite Molecular Sieves", Wiley, New York (1974).
182. Otouma, H., Y.Arai, and H.Ukihashi, Bull.Chem.SocJapan, 42,
2449(1969).
183. Kirk-Othmer, "Encyclopedia of Chemical Technology", Vol.15 p.188,
Inter-Science, New York (1956).
184. Kirk-Othmer, Encyclopedia of Chemical Technology", Vol.8, p.509,
Wiley, New York (1965).
185. British Petroleum Co., Belgian Patent 626, 446.
186. ESSO Oil Corp., U.S.Patent 3, 126, 422.
187. Houdry Process Corp., U.S.Patent 2, 795, 629.
188. Universal Oil Products, German Patent 1,925,102
189. Universal Oil Products, German Patent 1,946,187
190. Universal Oil Products U.S.Patent 3,417,157
191. Texaco Inc.Dutch Patent 6,903,210
192. Toyo Rayon Kabushiki Kaishi, Dutch Patent 6,817,615
193. California Research Corp.U.S.Patent 3,182,095
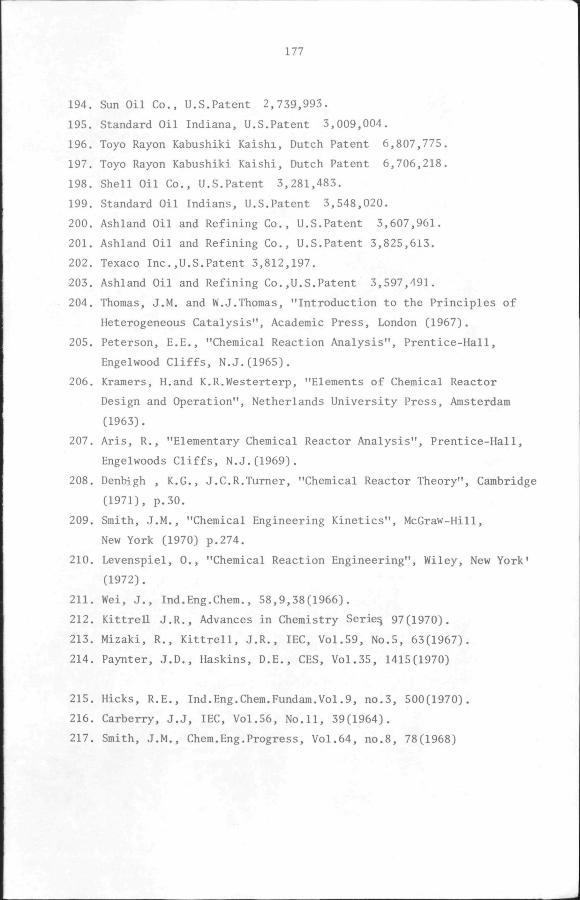
177
194. Sun Oil Co., U.S.Patent 2,739,993.
195. Standard Oil Indiana, U.S.Patent 3,009,004.
196. Toyo Rayon Kabushiki Kaishi, Dutch Patent 6,807,775.
197. Toyo Rayon Kabushiki Kaishi, Dutch Patent 6,706,218.
198. Shell Oil Co., U.S.Patent 3,281,483.
199. Standard Oil Indians, U.S.Patent 3,548,020.
200. Ashland Oil and Refining Co., U.S.Patent 3,607,961.
201. Ashland Oil and Refining Co., U.S.Patent 3,825,613.
202. Texaco Inc.,U.S.Patent 3,812,197.
203. Ashland Oil and Refining Co.,U.S.Patent 3,597,491.
204. Thomas, J.M. and W.J.Thomas, "Introduction to the Principles of
Heterogeneous Catalysis", Academic Press, London (1967).
205. Peterson, E.E., "Chemical Reaction Analysis", Prentice-Hall,
Engelwood Cliffs, N.J.(1965).
206. Kramers, H.and K.R.Westerterp, "Elements of Chemical Reactor
Design and Operation", Netherlands University Press, Amsterdam
(1963).
207. Aris, R., "Elementary Chemical Reactor Analysis", Prentice-Hall,
Engelwoods Cliffs, N.J.(1969).
208. Denbigh , K.G., J.C.R.Turner, "Chemical Reactor Theory", Cambridge
(1971), p.30.
209. Smith, J.M., "Chemical Engineering Kinetics", McGraw-Hill,
New York (1970) p.274.
210. Levenspiel, 0., "Chemical Reaction Engineering", Wiley, New York'
(1972).
211. Wei, J., Ind.Eng.Chem., 58,9,38(1966).
212. KittreU J.R., Advances in Chemistry Serie^ 97(1970).
213. Mizaki, R., Kittrell, J.R., lEC, Vol.59, No.5, 63(1967).
214. Paynter, J.D., Haskins, D.E., CES, Vol.35, 1415(1970)
215. Hicks, R.E., Ind.Eng.Chem.Fundam.Vol.9, no.3, 500(1970).
216. Carberry, J.J, lEC, Vol.56, No.11, 39(1964).
217. Smith, J.M., Chem.Eng.Progress, Vol.64, no.8, 78(1968)
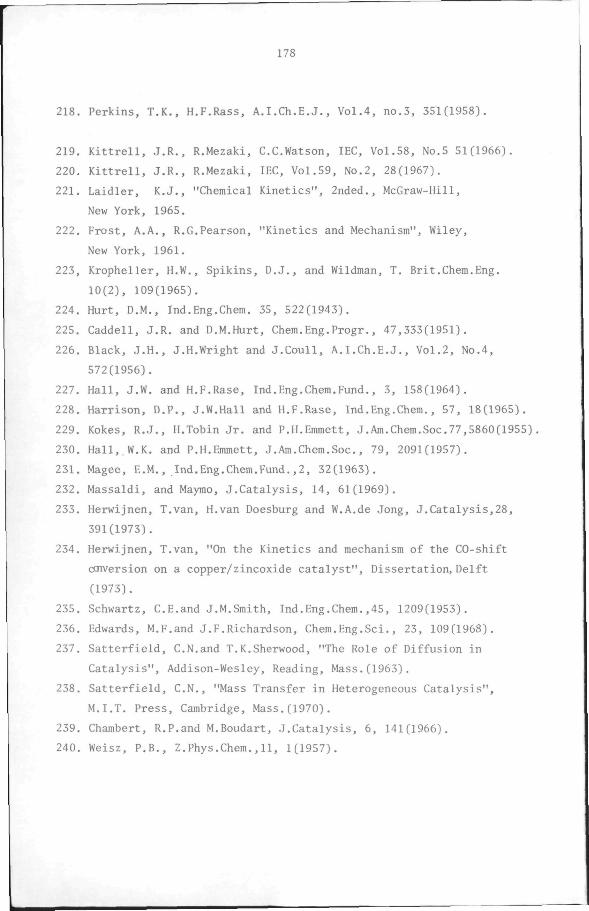
178
218. Perkins, T.K., H.F.Rass, A.I.Ch.E.J., Vol.4, no.3, 351(1958).
219. Kittrell, J.R., R.Mezaki, C.C.Watson, lEC, Vol.58, No.5 51(1966).
220. Kittrell, J.R., R.Mezaki, lEC, Vol.59, No.2, 28(1967).
221. Laidler, K.J., "Chemical Kinetics", 2nded., McGraw-Hill,
New York, 1965.
222. Frost, A.A., R.G.Pearson, "Kinetics and Mechanism", Wiley,
New York, 1961.
223. Kropheller, H.W., Spikins, D.J., and Wildman, T. Brit.Chem.Eng.
10(2), 109(1965).
224. Hurt, D.M., Ind.Eng.Chem. 35, 522(1943).
225. Caddell, J.R. and D.M.Hurt, Chem.Eng.Progr., 47,333(1951).
226. Black, J.H., J.H.Wright and J.Coull, A.I.Ch.E.J., Vol.2, No.4,
572(1956).
227. Hall, J.W. and H.F.Rase, Ind.Eng.Chem.Fund., 3, 158(1964).
228. Harrison, D.P., J.W.Hall and H.F.Rase, Ind.Eng.Chem., 57, 18(1965).
229. Kokes, R.J., H.Tobin Jr. and P.H.Emmett, J.Am.Chem.Soc.77,5860(1955).
230. Hall,.W.K. and P.H.Emmett, J.Am.Chem.Soc, 79, 2091(1957).
231. Magee, E.M., Ind.Eng.Chem.Fund.,2, 32(1963).
232. Massaldi, and Maymo, J.Catalysis, 14, 61(1969).
233. Herwijnen, T.van, H.van Doesburg and W.A.de Jong, J.Catalysis,28,
391(1973).
234. Herwijnen, T.van, "On the Kinetics and mechanism of the CO-shift
coiversion on a copper/zincoxide catalyst". Dissertation, Delft
(1973).
235. Schwartz, C.E.and J.M.Smith, Ind.Eng.Chem.,45, 1209(1953).
236. Edwards, M.F.and J.F.Richardson, Chem.Eng.Sci., 23, 109(1968).
237. Satterfield, C.N.and T.K.Sherwood, "The Role of Diffusion in
Catalysis", Addison-Wesley, Reading, Mass.(1963).
238. Satterfield, C.N., "Mass Transfer in Heterogeneous Catalysis",
M.I.T. Press, Cambridge, Mass.(1970).
239. Chambert, R.P.and M.Boudart, J.Catalysis, 6, 141(1966).
240. Weisz, P.B., Z.Phys.Chem.,11, 1(1957).
179
241. Hudgins, R.R., Chem.Eng.Sci., 23, 94(1968).
242. Perry, J.H., "Chemical Engineers Handbook", 4. th ed., McGraw-Hill,
New York (1963).
243. Coulson,J.M. and J.F.Richardson, "Chemical Engineering", Vol.2,
Pergamon Press, London (1968).
244. Ergun, S., Chem.Eng.Progr., 48, 89(1952).
245. Ergun, S. Chem.Eng.Prog., 48, 227(1952).
246. Beek, J., in "Advances in Chemical Engineering", vol.Ill, Academic
Press, 203 (1962).
247. Hougen, O.A. and K.M.Watson, "Chemical Process Principles", John
Wiley, New York (1962).
248. Downes, H.R., "The Chemistry of Living Cells", 2nded., Longmans,
London (1962).
249. IVhite, A., P.Handler, E.L.Smith and D.Stetten, "Principles of
Biochemistry", 2nded., McGraw-Hill, New York (1959).
250. Hougen, O.A.and K.M.Watson, Ind.Eng.Chem. 35(5), 529(1943).
251. Yang, K.H. and O.A.Hougen, Chem.Eng.Prog.46, 146(1950).
252. Hinshelwood, C.N., "Kinetics of Chemical Change", Oxford
University Press, London (1940).
253. Weller, S., A.I.Ch.E.J., 2, 59(1956).
254. Boudart, M., A.I.Ch.E.J., 2, 62(1956).
255. Kittrell, J.R., W.G.Hunter and C.C.Watson, A.I.Ch..E.J.11(6),
1051(1965).
256. Powell, M.J.D., Computer J. 3, 175(1960).
257. Powell, M.J.D., Computer J., 6, 155(1964).
258. Valstar, J.M.,"A study of the fixed bed reactor with application
to the synthesis of vinyl acetate", p.149, Dissertation, Delft
(1969).
259. Otani, S., T.Iwamura, S.Hayashiand D.Ogawa, U.S.Patent No.3, 597,
490(1971).
260. Kruijer, S., "Entropie en beweeglijkheid bij adsorptie op actieve
kool". Dissertation, Delft (1955).
261. Filers, J., Internal Report, Delft (1975).
262. Gerritsen, L.A., Internal Report, Delft (1975).
180
263. Draper, N.R.and H.Smith, "Applied Regression Analysis", Wiley,
New York (1966).
264. Perry, R.H. and C.H.Chilton, "Chemical Engineers Handbook", 5th
ed., McGraw-Hill, New York (1973).
265. Betcke, R.A., Internal Report, Delft (1973).
266. Chu, C.J., J.M.Kalil and W.A.Wetteroth, Chem.Eng.Progr.,49, 141
(1953).
267. Aneke, L.E. P.J.van den Berg and W.A.de Jong, Paper for the
6th Int.Congr.Catalysis, London (1976).
268. Aneke, L.E. and T.van Herwijnen, "A method for solving material
and heat balances of complex chemical processed'. Delft (1971) .
269. Aneke, L.E. "Preliminary Process Design of the disproportionation
of Toluene", Delft (1970).
181
SAMENVATTING
Disproportionering is een potentiele alternatieve methode voor het
benutten van een overschot aan tolueen afkomstig van de fabricage van
aromatische koolwaterstoffen. Alhoewel de reaktie zowel in een vloei-
bare als in een gasfase bedreven kan worden,is de laatstgenoemde
commercieel gezien een interessanter proces. Het vindt plaats in de
aanwezigheid van vaste zure katalysatoren. Het meeste hier vermelde
werk heeft betrekking op de bereiding en karakterisering van een
katalysator met een niveau van aktiviteit, selektiviteit en stabili-
teit dat voor een commercieel proces alsmede voor een studie van de
reaktie kinetiek vereist is.
Ten eerste zijn de bereiding van zo een katalysator, aangeduid als
ABl en met een samenstelling 72% HY/18% B-ALF2/10% Cu, en het effekt
van enige proces condities op de aktiviteit, selektiviteit en stabili-
teit beschreven. De vermelde resultaten laten zien dat de katalysator
een redelijke tolueen disproportioneringsprestatie bezit en tonen aan
dat 500 C de optimale aktiveringstemperatuur is:de aktiviteit ver-
dwijnt vrijwel als er een hogere temperatuur gebruikt wordt. Daarnaast
zijn de fysische en chemische eigenschappen bepaald door stikstof-
adsorptie, kwikpenetratie porosimetrie en zuurgraad bepalingen.
De resultaten van het textuur onderzoek bevestigen dat de meeste
konventionele methoden voor poreuze stoffen niet van toepassing zijn
voor zeolieten en zeoliet bevattende katalysatoren. Dienovereenkomstig
wordt er een nieuwe methode voorgesteld en gebruikt om waarden van de
oppervlaktes van zeolitische microporieen te verkrijgen die in over-
eenstemming zijn met de waarden berekend uit kristallografische ge-
gevens. De kwikpenetratie-experimenten geven een maat voor de ruimtes
tussen de katalysatordeeltjes en die van de porien behorende tot het
in de katalysator aanwezige B-aluminium fluoride en koper. De resul
taten van de zuurgraad bepalingen, gemeten door n-butylamine titratie
en ammoniak adsorptie, zijn gekombineerd met die van de textuur van de
katalysator om aan te tonen dat slechts 10% van de totale oppervlakte
182
bestaat uit zure plaatsen. De resultaten van textuur- en aktiviteits-
metingen suggereren dat de tolueen disproportioneringsaktiviteit van
katalysator ABl is gelokaliseerd in de overgangsporien en dat de micro-
porien slechts dienen om de zware reaktieprodukten te verzamelen die
anders tot deaktivering zouden leiden. De resultaten van ammoniak
adsorptie gekombineerd met de invloed van de aktiveringstemperatuur
op de katalytische aktiviteit suggereren dat Bronsted zure plaatsen
verantwoordelijk zijn voor de tolueen disproportioneringsaktiviteit.
Reaktiesnelheidsmodellen, afgeleid aan de hand van een aantal
mechanismen bestaande uit eenvoudige adsorptie, oppervlaktereaktie en
adsorptiestappen worden gebruikt om de kinetische gegevens te be-
schrijven. Niet-lineaire regressie techniek wordt toegepast om een
groep van modellen te isoleren met de kleinste varianties. Een
F-test op deze varianties toont aan dat het verschil tussen die van
twee modellen met de kleinste waarden niet significant is op een 95%
betrouwbaarheidsniveau;de twee modellen zijn statistisch gezien gelijk-
waardig. Experimenten met reaktieprodukten tonen aan dat benzeen geen
meetbare invloed heeft op de tolueen disproportioneringssnelheid
terwijl xylenen een zeker vertragend effekt hebben. Het proefschrift
besluit met enige ontwerpbeschouwingen voor de realisatie van een
industrieel disproportioneringsproces.
STELLINGEN
1. De studie door Yashima et al. over de dampfase disproportionerings-
reaktie van tolueen over H-mordeniet is een klassiek voorbeeld van
de invloed van diffusie limitering op kinetiek metingen.
Yashima, T., H.Moslehi and N.Hara, Bull.Japan Petr.Inst., 12,
106(1970).
2. Bij porievolume-gegevens afgeleid uit capillaire adsorptie en con-
densatie kunnen extrapolatie methodes zoals die van Gurvitsch en
van Dubinin tot verkeerde conclusies leiden.
3. Voor een nauwkeurige bepaling van het inwendige porievolume van
poreuze massa's met kwikporosimetrie is het nodig om kwikpenetratie
metingen uit te voeren voor een aantal monsters van varierende
deeltj esgrootte.
4. Bij complexe reakties is het niet altijd mogelijk om analytische
uitdrukkingen van opbrengst en selektiviteit af te leiden.
Dit proefschrift:hoofdstuk 2.
5. De disproportionering van xyleen op de katalysator ABl, die gebruikt
is voor de kinetische studie beschreven in dit proefschrift, ver-
loopt sneller dan de transalkylatie reaktie met tolueen.
Dit proefschrift:appendix 9.
6. Het idee van het optreden van een ternaire zadel azeotroop in het
systeem Ureum-H.O-CO_-NH_ bij chemisch evenwicht moot gezien worden
als het meest eenvoudige model dat de tot nu toe gedane fasemetingen
goed beschrijft.
Lemkowitz, S.M., Dissertatie, Delft (1973).
7. Experimentele resultaten verkregen met industriele katalysatoren
moeten niet worden gepubliceerd in wetenschappelijke tijdschriften
zonder volledige openbaring van de samenstelling van deze katalysatoren.
Dit proefschrift:referenties 84 en 175.
8. Vooruitgang in de biologische wetenschappen zal alleen gelijke tred
houden met die in de chemie en de natuurkunde indien mathematische
analyse op veel groter schaal toegepast wordt op biologische pro-
blemen.
Beck, S.D.,"The simplicity of Science",Pelican (1962).
Bronowski, J."The Ascent of Man", BBC Press, London (1973).
9. Hoewel Langmuir-type modellen nuttig zijn om de snelheden van hete-
rogene katalytische reakties te beschrijven, zijn zij zwak op
fysische en chemische gronden.
10. Politieke onafhankelijkheid van zowel "oosf'als "west", gepaard
gaande met economische zelfbekwaamheid is het enige levensvatbare
antwoord op problemen van de zogenaamde derde wereld.
11. Het zou goed zijn wanneer aanhangers van "aangepaste technieken"
zich beter op de hoogte zouden stellen van de locale ervaring en
behoefte in zich snel ontwikkelende landen.
12. De bekwaamheid van nieuwe werknemers kan verbeterd worden door een
goed gepland orientatieprogramma en een duidelijke specificatie van
hun eventuele plichten.
13. Het ontwerp van de plaat aangebracht op het ruimteschip "Pioneer 10"
waarvan men hoopt dat het onderschept zal worden door een "Intelli-
gente beschaving" elders in het heelal, is gebaseerd op twijfel-
achtige veronderstellingen.
Britannica Book of the Year, 1975, p.632.
STELLINGEN
1. The study by Yashima et al. of the vapour-phase disproportionation
of toluene over H-mordenite is a classic example of the influence
of diffusion limitation on measured kinetics.
Yashima, T., H.Moslehi and N.Hara, Bull. Japan Petr.Inst., 12,
106(1970)
2. For pore volume data derived from capillary adsorption and
condensation measurements, extrapolation methods like those of
Gurvitsch and of Dubinin may lead to misleading conculsions.
3. For accurate determination of the internal pore volume of porous
solids by mercury porosimetry it is necessary to carry out
penetration measurements on a number of samples of different par
ticle sizes.
4. When complex reactions are involved, it is not always possible
to derive an analytical expression for quantities like yield and
selectivity.
This thesis:section 2.5
5. Xylene disproportionation is faster than transalkylation with
toluene over the catalyst ABl used in the kinetic study reported
in this thesis.
This thesis:Appendix 9
6. The idea of the existence of a ternary saddle azeotrope in the
system Urea-H^O-CO^-NH_ at chemical equilibrium must be seen as
the simplest model which describes the current experimental results
adequately.
Lemkowitz, S.M., Thesis, Delft (1975).
7. Experimental results obtained with industrial catalysts should not
be published in scientific journals without full disclosure of
the nature and composition of such catalysts.
This thesis:references 84 and 175.
8. Progress in the biological sciences will keep pace with that in
chemistry and physics only when mathematical analyses are applied
on a much greater scale to biological problems.
Beck, S.D., "The Simplicity of Science", Pelican (1962).
Bronowski, J."The Ascent of Man", BBC Press, London (1973).
9. Although Langmuir-type models are useful for representing the
reaction rates of heterogeneous catalytic reactions, they are
weak on physical and chemical grounds.
10. Political independence from both east and west accompanied by
economic self-sufficiency is the only viable answer to the
problems of the so-called third world.
11. It would be good for the adherents of "intermediate technology"
to acquaint themselves more with the local experience and needs
in the fast-developing countries.
12. The efficiency of new employees can be improved by a well-planned
orientation program and a clear spcification of their eventual
duties.
13. The design of the plaque on Pioneer 10 space craft which, it is
hoped, will be intercepted by an "intelligent civilization"elsewhere
in the universe is based on some questionable assumptions.
Britannica Book of the Year, 1975, p.632.
Recommended