Embed Size (px)
Citation preview

How different agricultural practices affect soil health KATARINA HEDLUND LUND UNIVERSITY

Agriculture and soil threats
Decline in: Lead to: soil carbon soil erosion biological activity soil compactionsoil biodiversity reduced
resistance to pests
reduced nutrientprovisioning
Intensificationof agriculture

Soil ”health” - ecosystem services
Intermediate ecosystem services
Nutrient retentionCarbon storageWater retentionResistance to pestsRegulation of above ground diversity
Final ecosystem services
FoodFeedBiofuelClean waterClimate mitigation
Soil biodiversity
Actions and inter-actions among soil organisms
feedingdigging burrowsmycorrhiza
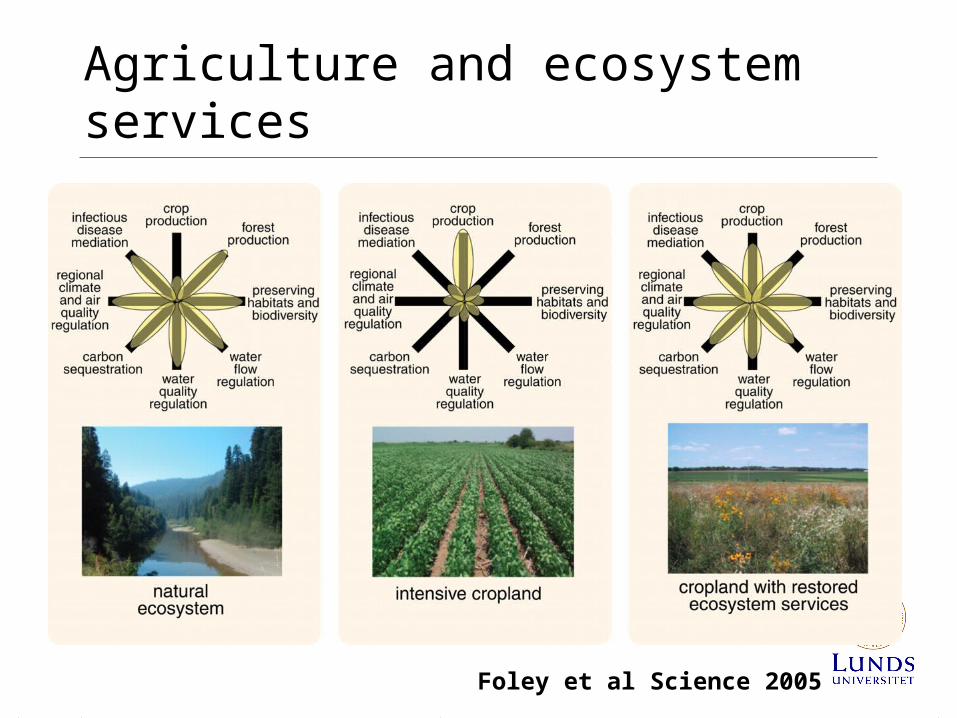
Agriculture and ecosystem services
Foley et al Science 2005

Long term decline of soil-C in Europe
Brady et al 2015 Agronomy Journal

How can we change Soil C ?
Management C decline per year
Intensive cereal production -1.0% UK
Inorganic fertilisers -0.5% SE
Farm yard manure (5 ton/ha) -0.2% SE
Straw addition (3 ton/ha) -0.2% DK
Management C increase per year
Cover crops 0.2% FR
Straw addition (12 ton/ha) 0.3% DK
Farm yard manure (35 ton/ha) 0.4% UK
Ley 2 yrs (in 8 yr rotation) 0.3% SE
Miscanthus grass 2.0% US

Soil carbon and agriculture in Europe?
SOC in agricultural land 2009 Wheat yield
g/kg 100 kg/ha
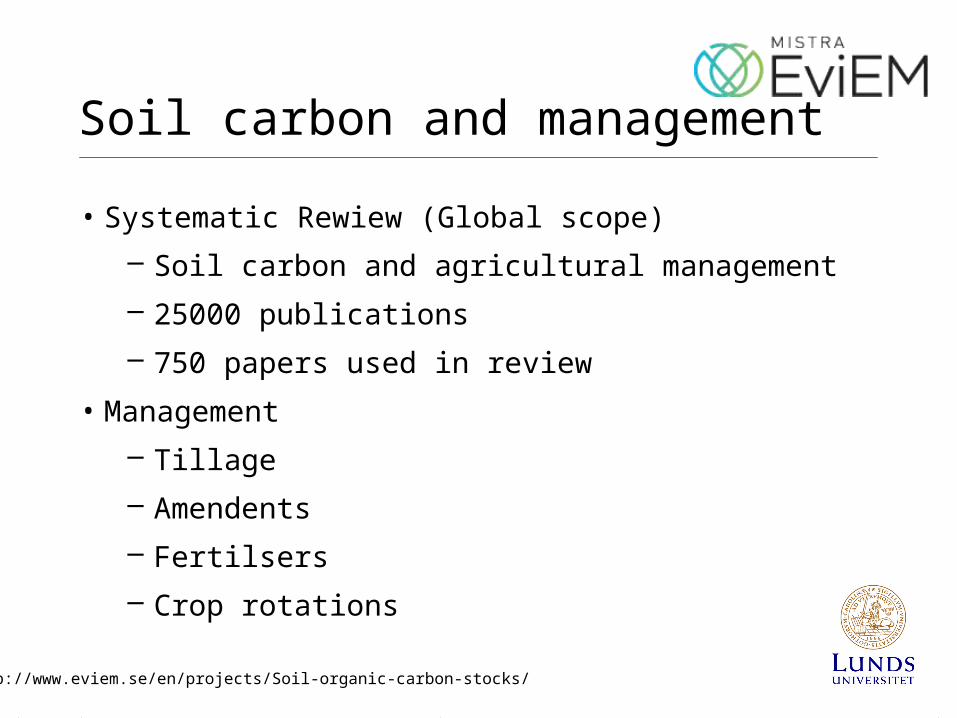
Soil carbon and management
• Systematic Rewiew (Global scope)
– Soil carbon and agricultural management
– 25000 publications
– 750 papers used in review
• Management
– Tillage
– Amendents
– Fertilsers
– Crop rotations
http://www.eviem.se/en/projects/Soil-organic-carbon-stocks/

Systematic map – review of global evidence
25000 papers checked750 in the database to be used in meta-analyses

Systematic map – review of evidence
Interactive map – with metadata and links to published evidence
Open access during 2015
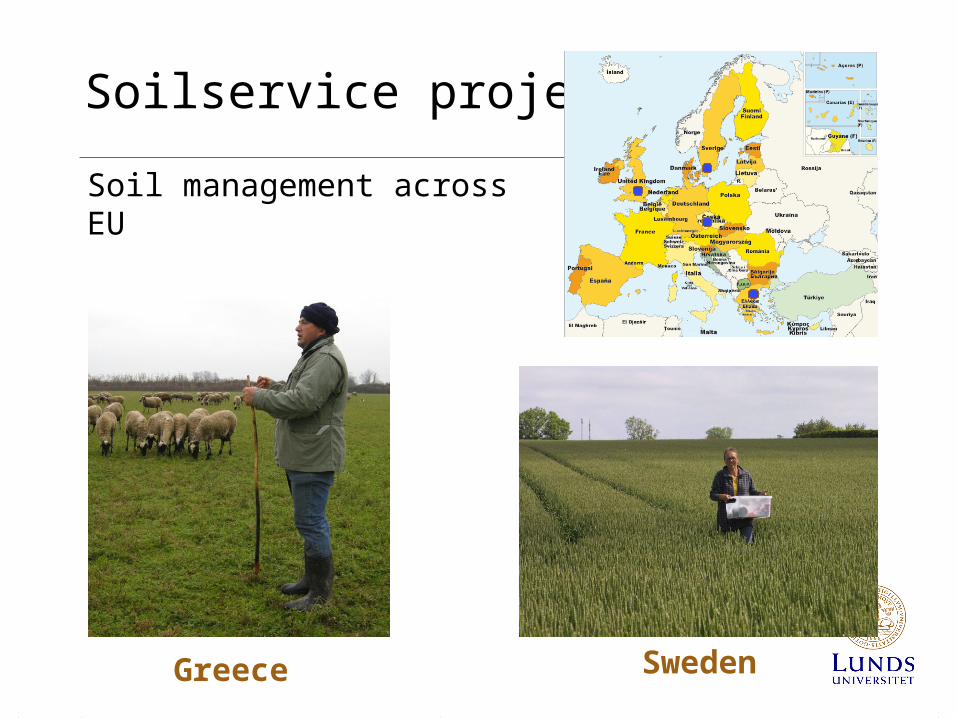
Soilservice project
Soil management across EU
SwedenGreece

Soil carbon and biodiversity
Gradient of intensive crop rotation to pastures
Tsiafouli et al Global Change Biology 2014

Producers of ecosystem servicesThe soil food web

Food web diversity
Lower food chain length
Steeper biomass pyramid
Lower C & N mineralization rates
Loss of larger species
low intensity
high intensity

Greenhouse gas emissions
De Vries et al PNAS 2013
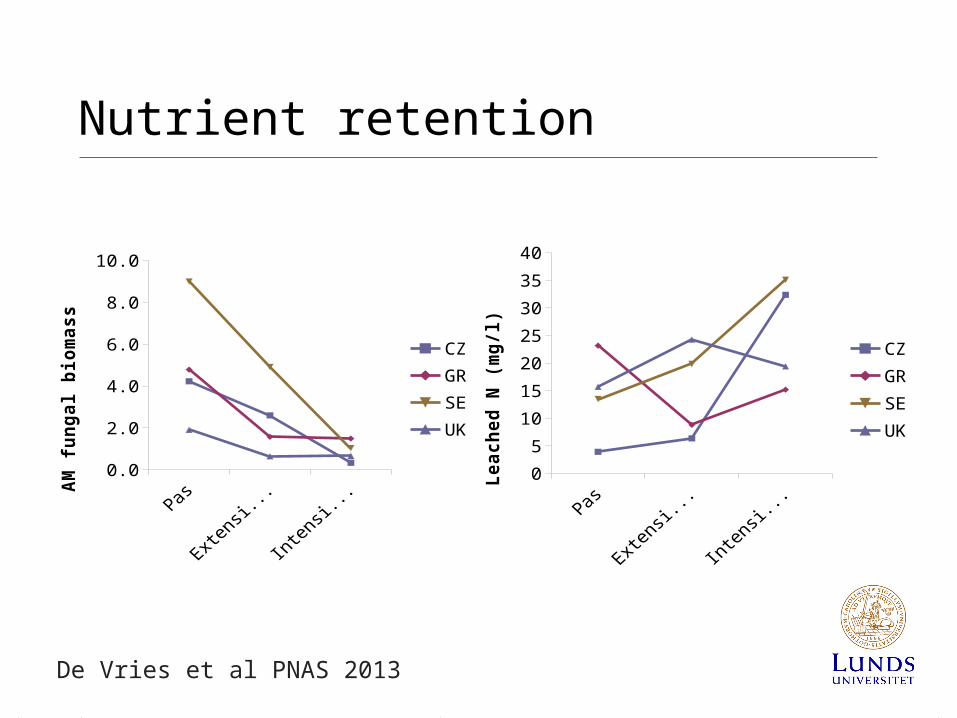
Nutrient retention
Pasture Extensive rotation
Intensive rotation
0
5
10
15
20
25
30
35
40
CZGRSEUK
Le
ac
he
d N
(m
g/l)
0.0
2.0
4.0
6.0
8.0
10.0
CZGRSEUK
AM
fu
ng
al b
iom
as
s
De Vries et al PNAS 2013
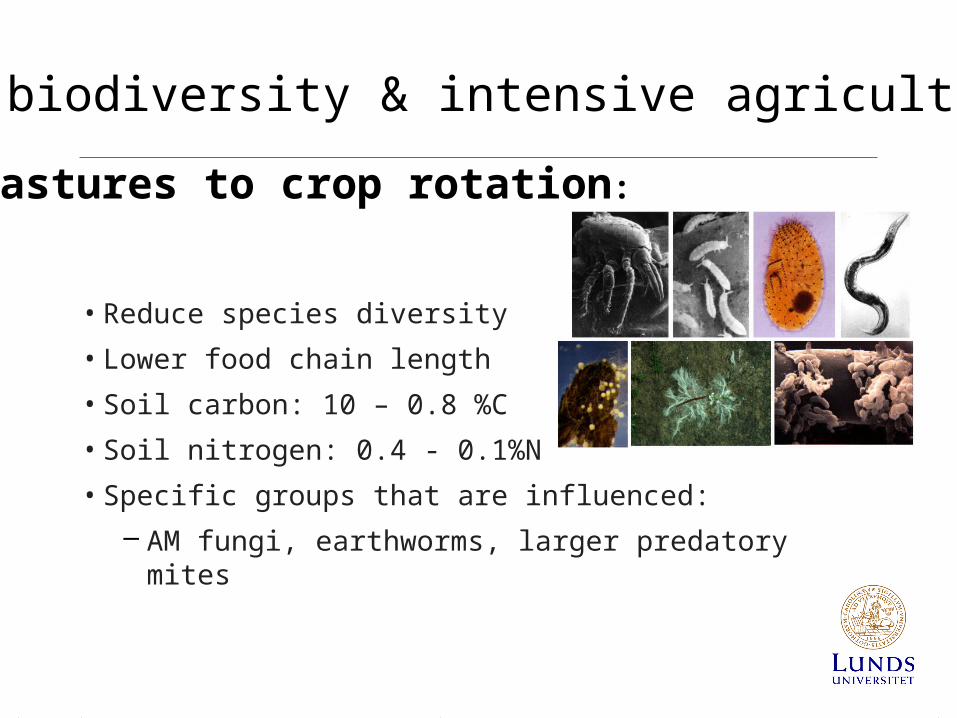
Soil biodiversity & intensive agriculture
• Reduce species diversity
• Lower food chain length
• Soil carbon: 10 – 0.8 %C
• Soil nitrogen: 0.4 - 0.1%N
• Specific groups that are influenced:
– AM fungi, earthworms, larger predatory mites
Pastures to crop rotation:

Smart management decisions?Support ecosystem services
Nutrientretention
Food
Fiber
Water regulation
Natural pest controlCarbon
retention
Soil formation
Climate regulation
Nutrient retention
Food
Fiber
Water regulation
Natural pest controlCarbon
retention
Soil formation
Climate regulation

Using ecosystem services for decisions
Ecosystems &biodiversity
Ecosystem services
Decisions
Institutions(farmers, EC)
Values
Agricultural management
Information on sustainable soil use
Incentives
After Daily et al 2009
”decision loop”
Valuation models
Mapping services

Information transfer

"Natural Capital” - The ecosystem services from nature which are essential for human life.
http://bankofnaturalcapital.com/category/ecosystem-services/agriculture/

Value of soil ecosystem services
Value to farmers
• Fertile soils
• Water retention
• Less erosion
• Less use of – fertilizers
– pesticides
Value to society
• Reduce eutrofication
• Clean water
• Carbon retention
€?

Economic valuation:Carbon a currency for natural capital
Brady et al 2015 Agronomy Journal

Optimal use of soil C
0.75 1.25 1.75 2.25 2.75 3.253000400050006000700080009000
100001100012000
Sweden DenmarkEngland Germany
% soil Carbon
Yiel
d t/
ha
0.75 1.25 1.75 2.25 2.75 3.250
20406080
100120140160180200
Sweden DenmarkEngland Germany
% soil Carbon
Nitr
ogen
kg/
ha
Optimal yield Optimal fertiliser use

Carbon a natural capital
0.75 1.25 1.75 2.25 2.75 3.25200
400
600
800
1000
1200
1400
1600
1800
Sweden Denmark England Germany
% soil Carbon
Max
imum
pro
fit €
/ha

400
450
500
550
€/ha
2008 2012 2016 2020 2024 2028 2032y ear
Sweden
250
300
350
400
€/ha
2008 2012 2016 2020 2024 2028 2032y ear
UK
Ley in the crop rotation Profit per hectare
40
42
44
46
48
50
52
2008 2012 2016 2020 2024 2028 2032 2008 2012 2016 2020 2024 2028 2032
Sweden UK
0% set aside 7% 15% 25%
kg w
heat/kg N
year
Graphs by region
N-efficiency
Saarbacher et al in prep /SOILSERVICE project

Soil natural capital
• Promoting soil C means increasing soil biodiversity and soil ecosystem services
• Processes are long term and yields will be affected in the future
• The value of soil natural capital can be used to promote sustainable management
• Soil C- investment banks?

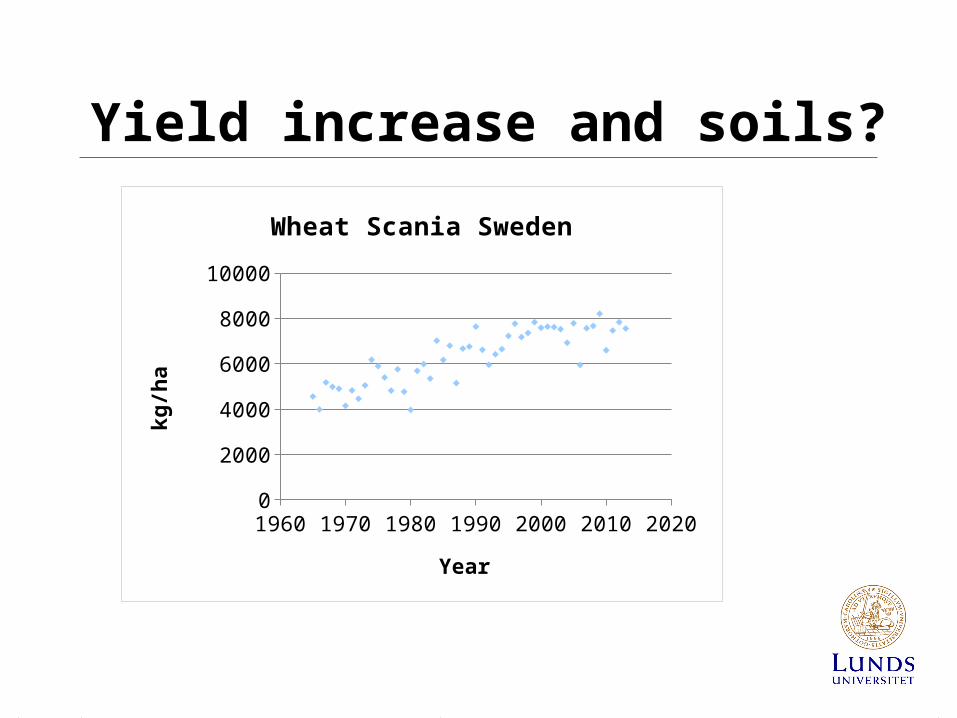
1960 1970 1980 1990 2000 2010 20200
100020003000400050006000700080009000
Wheat Scania Sweden
Year
kg
/ha
Yield increase and soils?

Filling yield gaps (wheat) with natural capital (20 years)
Business as usual 0.3% SOC/yr increase rate
100kg/ha
Nelson E, Brady M, Hedlund K in prep
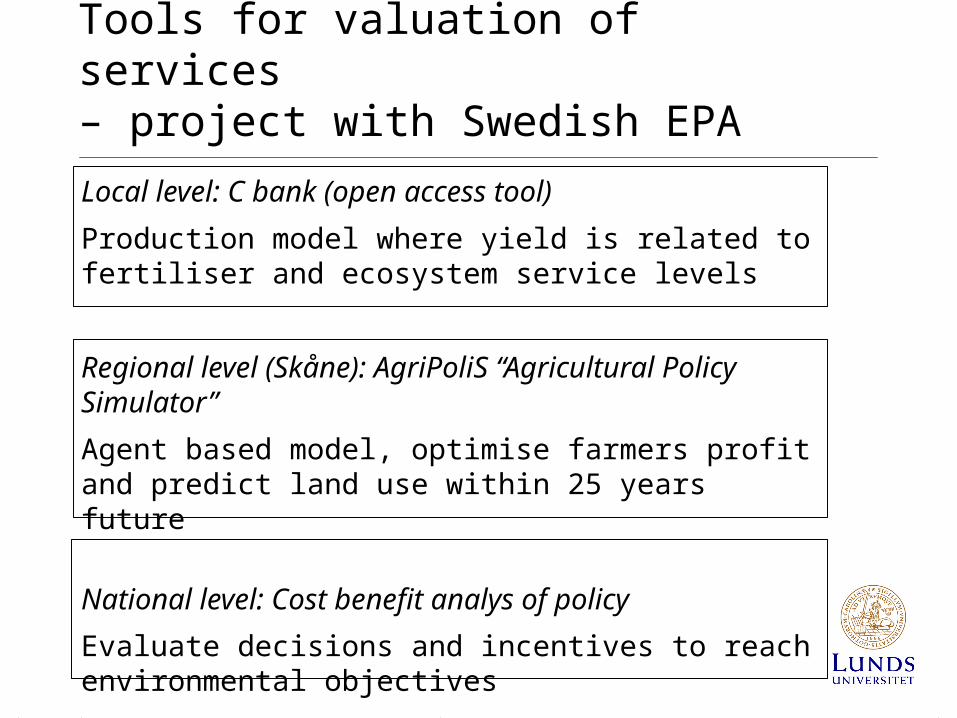
Tools for valuation of services – project with Swedish EPA
Local level: C bank (open access tool)
Production model where yield is related to fertiliser and ecosystem service levels
Regional level (Skåne): AgriPoliS “Agricultural Policy Simulator”
Agent based model, optimise farmers profit and predict land use within 25 years future
National level: Cost benefit analys of policy
Evaluate decisions and incentives to reach environmental objectives