Embed Size (px)
Citation preview
Achievement of sustainable solid waste management in developing countries
– A case study of waste management in the Kavango region, Namibia Arvid Lindell Master dissertation 2012 Environmental and Energy System Studies Department of Technology and Society Lund University

Achievement of sustainable solid waste management in developing countries -A case study of waste management
in the Kavango region, Namibia
Arvid Lindell
Master Dissertation
December 2012

ISRN LUTFD2/TFEM--12/5068--SE + (1-117)

ii
Organisation, The document can be obtained through
LUND UNIVERSITY
Department of Technology and Society
Environmental and Energy Systems Studies
Box 118
SE - 221 00 Lund, Sweden
Telephone: int+46 46-222 00 00
Telefax: int+46 46-222 86 44
Type of document
Master thesis Date of issue
16-01-2013
Author
Arvid Lindell
Title and subtitle
Achievement of sustainable waste management in developing countries – A case study of the waste
management in the Kavango region, Namibia
Abstract
With an increasingly population and urbanization, the solid waste management have become a major challenge for local authorities
in developing countries all over the world. The local authorities must improve their waste management in order to minimize the
negative effects of solid waste and to avoid future land use conflicts. At the same time the economical resources are limited and
solid waste management puts already today a significant pressure on the local economies. There is a need for a sustainable waste
management which offer solutions to issues of social-, economical- and environmental aspects.
This study aims to identify concepts for improving waste management in developing countries and evaluate them from a
sustainability perspective. The report consists of a literature review and a case study. The literature review identifies different
concepts and investigates the differences between developing countries to determine if it is possible to adopt the same concepts
everywhere. Four different concepts for improving the waste management were identified; Integrated Solid Waste Management,
Integration of the informal sector, Private Public Partnerships and Decentralization. The term of a developing country were found to
lack a standard definition. In fact the differences between countries often referred to as developing were found to be significant in
many aspects, even in waste characteristics. The conclusion is that waste management is a decentralized activity which needs
decentralized solutions of how to achieve sustainable waste management.
The case study uses the Kavango region in Namibia as an example for the possibilities of utilizing the different concepts. The first
step in the case study was to find out about the current waste management. A mixed method of qualitative and quantitative research
methods were used to map the current waste management. Examples of methods used are open ended interviews with key
stakeholders and waste characterization studies. Two of the results were that only 0.11 kilogram solid waste is generated per person
and day in the household and that the household waste consist of relatively low amounts of organic waste (26 %) and relatively high
amounts of recyclable waste (> 50 %).
The second step of the case study was to evaluate the current solid waste management from a sustainability perspective. Criteria for
a sustainable waste management found in literature were used for a sustainability assessment of the current were management in the
Kavango region. Out of eight criteria only two were fulfilled and due to poor efficiency, inability to cover it own costs and severe
environmental impacts the conclusion is that the current waste management is unsustainable.
The last step of the case study was to investigate the possibilities and effects of introducing different concepts for improving the
waste management in the Kavango region. Several aspects of the concepts were already found in the current solid waste
management, however possibilities exists to adopt the concepts in a much more comprehensive way. The conclusion is that the use
of one concept does not rule out other concepts. In fact the concepts focus on different aspects of solid waste management and
complement each other.
Keywords solid waste management, developing countries, sustainable waste management, informal sector, Kavango region, Namibia, integrated solid waste management, public private partnerships, integration of informal sector, decentralization
Number of pages 117
Language English
ISRN
LUTFD2/TFEM--12/5068--SE + (1-117)

iii

Achievement of sustainable solid waste management in developing countries -A case study of waste management in the Kavango region, Namibia
Master’s dissertation by: December 2012 Arvid Lindell Supervisors: Environmental and Energy Systems Studies Eva Leire & Department of Technology and Society Charlotte Retzner Lund University

1
Summary With an increasing population and urbanization, the solid waste management have become a
major challenge for local authorities in developing countries all over the world. The local
authorities must improve their waste management in order to minimize the negative effects of
solid waste and to avoid land use conflicts. At the same time the economical resources are
limited and solid waste management puts a significant pressure on the local economies. There
is a need for a sustainable waste management which offer solutions to issues of social-,
economical- and environmental aspects.
This study aims to identify different concepts for improving waste management in developing
countries and to evaluate them from a sustainability perspective. The report consists of a
literature review and a case study. The literature review identifies different concepts for
improving solid waste management and evaluates the differences between developing
countries to determine if there is possibility to adopt the same concepts everywhere. Four
different concepts for improving the waste management were identified; Integrated Solid
Waste Management, Integration of the informal sector, Private Public Partnerships and
Decentralization. The term of a developing country were found to lack a standard definition.
In fact the differences between countries often referred to as developing were found to be
significant in many aspects, even in waste characteristics. The conclusion is that waste
management is a decentralized activity which needs decentralized solutions of how to achieve
sustainable waste management.
The case study uses the Kavango region in Namibia as an example for the possibilities of
utilizing the different concepts. The first step in the case study was to find out about the
current waste management. A mix of qualitative and quantitative research methods were used
to map the current waste management. Examples of methods used are open ended interviews
with key stakeholders and waste characterization studies. Two of the results were that only
0.11 kilogram solid waste is generated per person and day in households and that the
household waste consist of relatively low amounts of organic waste (26 %) and relatively high
amounts of recyclable waste (> 50 %).
The second step of the case study was to evaluate the current solid waste management from a
sustainability perspective. Criteria found in literature were used for a sustainability
assessment of the current were management in the Kavango region. Out of eight criteria only
two were fulfilled and due to poor efficiency, inability to cover it own costs and severe
environmental impacts the conclusion is that the current waste management is unsustainable.
The last step of the case study was to investigate the possibilities and effects of introducing
different concepts for improving the waste management in the Kavango region. Several
aspects of the concepts were already found in the current solid waste management, however
possibilities exists to adopt the concepts in a much more comprehensive way. The conclusion
is that the use of one concept does not rule out other concepts. In fact the concepts focus on
different aspects of solid waste management and complement each other.
Keywords: solid waste management, developing countries, sustainable waste management,
informal sector, Kavango region, integrated solid waste management, public private
partnerships, integration of informal sector, decentralization

2
Acknowledgements This thesis could never have been put together without the great contribution from many
people. Even though it is impossible to mention all of them I will give it a try. If you as a
reader did not find your name in this short list do not worry, I will always remember the help
and support I received from you and will be ever thankful for that.
First of all I would like to thank my supervisors Eva Leire and Charlotte Retzner for their
academic support. Without them I would still be putting headings together.
SIDA and ÅForsk deserve acknowledgements for their financial support to this thesis.
The third person in Sweden to whom I am in great debt to is Bo Troedsson at River Emån
Catchment Management Association. His contacts and support were essential for the case
study. He also made a wonderful travelling company during my first weeks in Namibia.
The Kavango regional council and all staff deserve acknowledgements for their support
during my stay in Namibia and their work to improve the waste management. Without their
drive for improvement the waste management will doubtfully improve at all.
The technical department at Rundu town council also contributed for this study. Especially
big thanks to Miss Muyo at Environmental Health department for all of her help and to all
people helping me with the waste characterization study.
I also want to direct an extra acknowledgement to Mr and Mrs Sinimbo whom generously let
me be part of their family during my stay in Namibia. Their company were highly appreciated
and they gave me an invaluable insight of the Namibian society.
Another person in Namibia who deserves all my thanks is Miss Dorothy W. Matengu. She
meant a lot to me during my stay and I can without doubts say that she means a lot for the
sustainable development in Kavango as well.
I would also like to thank the delegation from Vetlanda and all other relevant people for the
travel company. The last thank will be directed to friends and family for their encouragements
during the process of putting this thesis together.
Arvid Lindell 12 December 2012, Lund

3
Table of contents
1 READING THE REPORT .............................................................................................. 5
2 GLOSSARY AND ABBREVIATIONS .......................................................................... 5
3 INTRODUCTION ............................................................................................................ 7
3.1 AIM OF STUDY ............................................................................................................. 7 3.2 METHODS .................................................................................................................... 8
3.2.1 Literature review .................................................................................................... 9 3.2.2 Qualitative methods ................................................................................................ 9
3.2.3 Quantitative methods ............................................................................................ 11 3.3 DELIMITATIONS ......................................................................................................... 12
4 BACKGROUND & THEORY ...................................................................................... 13
4.1 DEFINITION OF A DEVELOPING COUNTRY................................................................... 13 4.2 DEFINITION OF SOLID WASTE ..................................................................................... 13
4.2.1 Solid waste categories .......................................................................................... 14 4.3 MANAGEMENT OF WASTE .......................................................................................... 15
4.3.1 Collection of waste ............................................................................................... 15
4.3.2 Disposal of waste ................................................................................................. 16
4.3.3 Informal sector ..................................................................................................... 17 4.4 DEFINITION OF A SUSTAINABLE WASTE MANAGEMENT .............................................. 18
5 WASTE MANAGEMENT IN DEVELOPING COUNTRIES – A LITERATURE
REVIEW ................................................................................................................................. 20
5.1 SOLID WASTE GENERATION ....................................................................................... 20 5.1.1 Generation rates ................................................................................................... 20 5.1.2 The total amount of generated waste - distribution within a country .................. 22
5.2 HOW DIFFERS THE SOLID WASTE COMPOSITION FROM ONE PLACE TO ANOTHER AND
MORE IMPORTANTLY WHY? ................................................................................................... 22 5.3 DRIVERS FOR SUSTAINABLE WASTE MANAGEMENT ................................................... 23
5.3.1 Social aspects ....................................................................................................... 23
5.3.2 Economical aspects .............................................................................................. 25 5.3.3 Environmental protection ..................................................................................... 27
5.4 CONCEPTS FOR ACHIEVING A SUSTAINABLE WASTE MANAGEMENT IN DEVELOPING
COUNTRIES ............................................................................................................................ 28
6 WASTE MANAGEMENT IN KAVANGO ................................................................. 33
6.1 PROFILE OF THE KAVANGO REGION ........................................................................... 33 6.2 KEY STAKEHOLDERS ................................................................................................. 35
6.3 INSTITUTIONAL SETUP ............................................................................................... 36 6.4 REGULATORY FRAMEWORK....................................................................................... 37 6.5 PREVIOUSLY STUDIES ................................................................................................ 38 6.6 DESCRIPTION OF FIELD STUDY ................................................................................... 38
6.6.1 Open ended interviews ......................................................................................... 38
6.6.2 Focus group discussions ...................................................................................... 39 6.6.3 Household and willingness to pay surveys ........................................................... 40 6.6.4 Field observations ................................................................................................ 40 6.6.5 Literature review, official documents ................................................................... 40
6.6.6 Waste characteristics by hand sorting waste ....................................................... 40 6.7 RESULT A: OPEN ENDED INTERVIEWS ....................................................................... 43

4
6.7.1 Definition of waste ............................................................................................... 43
6.7.2 Waste as a problem for development ................................................................... 44 6.7.3 Improvement of waste management ..................................................................... 47 6.7.4 Barriers for improvement ..................................................................................... 49
6.8 RESULT B: WASTE CHARACTERIZATION, WASTE FROM HOUSEHOLDS ....................... 50 6.8.1 Waste composition ................................................................................................ 50 6.8.2 Waste generation rate .......................................................................................... 50
6.9 RESULT C: WHERE DOES THE WASTE GO? – A SCHEMATIC MAP ................................ 53 6.10 RESULT D: ECONOMY ............................................................................................... 55
6.10.1 Costs of managing waste .................................................................................. 55 6.10.2 Willingness to pay ............................................................................................ 56
6.11 RESULT E: PRACTICIES OF WASTE COLLECTION AND WASTE DISPOSAL IN KAVANGO 56 6.11.1 Waste collection in Kavango ............................................................................ 56
6.11.2 Waste treatment ................................................................................................ 59 6.11.3 Administration of waste management .............................................................. 61
7 SUSTAINABILITY ANALYSIS OF WASTE MANAGEMENT IN KAVANGO .. 62
7.1 IS THE WASTE MANAGEMENT IN KAVANGO SUSTAINABLE? ....................................... 62 7.2 UTILIZATION OF CONCEPTS FOR IMPROVING SOLID WASTE MANAGEMENT ................ 63
7.2.1 Integrated solid waste management ..................................................................... 63 7.2.2 Public private partnerships .................................................................................. 63
7.2.3 Integration of informal sector .............................................................................. 64 7.2.4 Decentralization ................................................................................................... 64
8 DISCUSSION ................................................................................................................. 66
8.1 SOURCES OF ERROR ................................................................................................... 66
8.2 GENERAL DISCUSSION ............................................................................................... 67 8.3 DISCUSSION KAVANGO ............................................................................................. 68
9 CONCLUSIONS AND RECOMMENDATIONS FOR FUTURE WORK .............. 73
9.1 RECOMMENDATIONS FOR FUTURE WORK: THE PROCESS OF IMPROVING SOLID WASTE
MANAGEMENT IN KAVANGO.................................................................................................. 74
REFERENCES ....................................................................................................................... 76
APPENDIX A: OPEN ENDED INTERVIEWS .................................................................. 79
APPENDIX B: HOUSEHOLD SURVEYS, WILLINGNESS TO PAY ......................... 105
APPENDIX C: WASTE CHARACTERIZATION STUDY ............................................ 107
APPENDIX D: FIELD OBSERVATION .......................................................................... 109
APPENDIX E: STATISTICAL ANALYSES OF WASTE GENERATION RATES ... 111

5
1 Reading the report This report is divided into three major parts which in total make up the masters thesis;
background information of waste management in general, a literature review of solid waste
management in developing countries and a case study for the Kavango region. They are
created in order to complement each other and should therefore be seen as one continuous
study. The intention has been to make a report readable for people with basic knowledge
about environmental science in general but with low knowledge of solid waste management.
People with advanced knowledge in waste management might therefore find some chapters
superfluous.
2 Glossary and abbreviations
Developed and Developing country Terms for classifing countries according of their
level of development, see chapter 4.1for information
about different classification methods
Hazardous waste Waste which might be harmful for human or
environmental health, e.g. Medical and chemical
waste
Household The basic residential unit for shelter and
consumption. Is not necessarly equal to family
Informal sector Activites with the purpose of income generation
without being regulated or registered
Organic waste Waste which can be broken down in a reasoneble
amount of time by bacterias and other
microorganisms
Recycling Reuse of material from waste for producing other
items
Scavenging Reclaiming of valuable waste at a disposal site or
from transportation vehicles
Solid waste See chapter 4.2, often shorten to waste only
Urbanization The process of changing the population distibution
towards a bigger proportion of people in urban areas
AFR Africa region
ECA Europe and Central Asia region
EAP East Asia and Pacific region
ISWM Integrated Solid Waste Management
LAC Latin America and the Carribbean region
MENA Middle east and North Africa region
MSW Municipal Solid Waste
OECD Organisation for Economic Co-operation and
Development

6
PPP Public Private Relationship
SAR South Asia region

7
3 Introduction Solid waste has been part of human society for as long as the existence of humans.
Traditionally ad hoc solutions have been used opting for minimizing negative health impacts
of waste in major cities. Transporting the waste out of areas inhabited by humans has been the
primary objective. During the second half of the 20th
century some parts of the world started
to focus on the disposal of waste. A growing population and urbanization increased the
demand of urban land and safe disposal where needed to avoid land use conflicts. Since then
other drivers for waste management have been discovered and a number of waste treatment
methods have been developed and utilised in the developed part of the world. Today many
developing countries are facing a future of population increase and high urbanization rates.
The need for a sustainable solid waste management becomes higher by the minute.
Transferring technical solution and knowledge in the field of waste management from
developed countries to developing countries can be seen as a way of accelerating the
improvement of waste management. However local differences between the area where the
technical solutions have been developed and the receiving area complicate a direct transfer of
methods and many examples of failures can be found. Quick fixes are therefore not regarded
as an alternative for achieving improvements in waste management. Knowledge is needed
how different local aspects affect the possibilities for improving the management in
developing countries. Using concepts, which takes local aspects into consideration, for
improving a waste management system is a way of actively working for minimizes the risk of
failure.
One region in need of improving their waste management is the Kavango region in Namibia.
In a twinning program with Vetlanda municipality in Sweden, the region launches a three year
project to develop a strategic waste management plan for its 200,000 inhabitants.
3.1 Aim of study
The overall aim of the study is to identify different concepts for improving waste management
in developing countries and to evaluate them from a sustainability perspective. For this
purpose the Kavango region in Namibia act as an object of study.
The report serves as a master dissertation in environmental engineering at Lund University.
The report is also part of an ongoing twinning project in waste management between the
Kavango Regional Council and Vetlanda Municipality, where it will be used as a knowledge
base for future collaboration work. The optimal outcome of the thesis would be a general
approach which takes environmental, social and economical aspects of the solid waste
management into consideration and is possible to apply in all developing countries. However
such a result is based on the assumption that the possibilities for sustainable waste
management are the same in all developing countries. To evaluate the validity of such an
assumption the following research questions are used:
What determine the solid waste generation rate?
How does the waste composition differ from one place to another and more
importantly why?
What are the driving forces for waste management in developing countries?

8
The findings from the initial part of the thesis will be used in the Kavango case study. The
case study aims to describe the current waste management and to present a roadmap for a
sustainable waste management in the Kavango region for the future. The case study enables
an evaluation of the concepts on another level, since more focus can be put into details. The
following research questions are used for the Kavango case study:
How much waste is produced in the region and what does the composition of waste
look like?
What are the issues of the current waste management and how can it be improved?
What are the barriers for improving the solid waste management?
Is the solid waste management in the region sustainable? If not, how can a sustainable
waste management be achieved in Kavango?
3.2 Methods
To be able to plan a region’s future solid waste management the most fundamental knowledge
needed is the composition and quantities of the waste streams. In developed countries this is
usually achieved by waste auditing and other quantitative methods in waste characterization
studies. (Newenhouse & Schmit, 2000). There are however several reasons why a different
approach is needed for mapping the waste management in developing countries. One of them
is the range of the waste collection system. Whereas waste collection in developed countries
takes place on an extensive centralized scale, the formal waste collection in developing
countries is much more inadequate. (The World Bank, 2012). The importance of the informal
sector is another reason why an approach which includes other elements of the waste
management than waste auditing is needed (Medina, 2010). A more flexible mapping method
than only using waste characterization studies is to use complementary qualitative analysis
methods, such as open-ended interviews and field observations (Newenhouse & Schmit,
2000).
Another argument of using mixed methods for research on waste management systems can be
found in the theories of the methods. Traditionally, qualitative research methods have been
used to answer exploratory questions about unknown aspects of a phenomenon, while
quantitative research methods have been used to answer confirmatory questions to test
theoretical propositions. The use of qualitative and quantitative methods in the same study
benefits from the possibility to ask both confirmatory and exploratory research questions and
thereby verify and generate theory in the same study. Providing stronger inferences and
greater assortment of divergent views are two other benefits from a mixed method approach.
(Teddie & Tashakkori, 2009). A mixed approach of both qualitative and quantitative methods
is therefore recommended in studies of waste management systems in developing countries.
(Medina, 2010)
For the first part of the report a literature review have been conducted. The literature review
attends to issues connected to waste management in developing countries in a general
perspective and summarizes different concepts for improving current waste management. The
second part of the thesis is the case study of the Kavango region in Namibia. A mixed method
approach has been adopted in the Kavango case study. Qualitative methods used in the case
study are interviews with people representing key stakeholders for waste management, field
observations and focus group discussions. For the quantitative methods waste characterization
analysis by hand sorting of waste from urban and rural areas and household surveys are used.
The results are analysed in a sustainability perspective and possibilities for introducing
different concepts from the literature review are discussed.
9
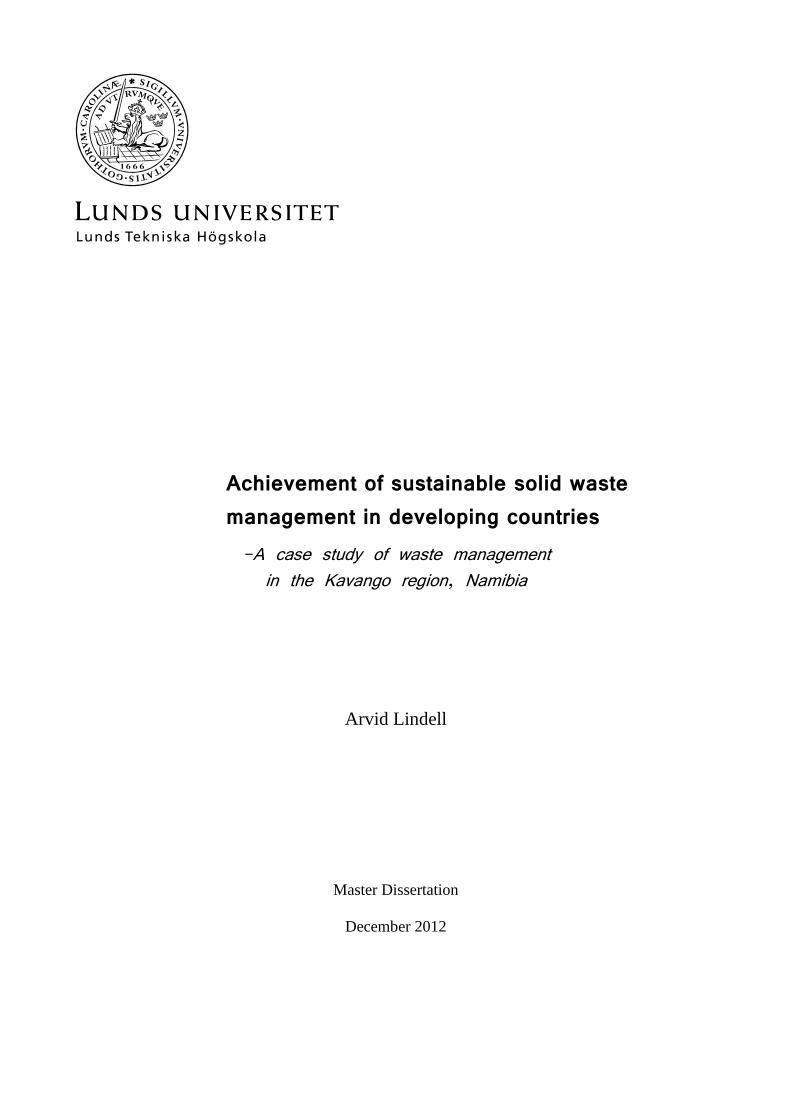
3.2.1 Literature review
A literature review is commonly used as an integrated part of research. Reviews can be used
to identify a researchable idea or to investigate keywords associated to a research idea. A
hypothetical literature review follows the following 12 step method (Teddie & Tashakkori,
2009):
1. Identify a research topic
2. Identify keywords or descriptors that are useful in locating materials
3. Develop an overall search strategy for the literature review
4. Search for preliminary sources
5. Select relevant primary and secondary sources
6. Search the library for secondary and primary sources that have been identified
7. Establish a computer and paper trail, including research summaries in yor own words
that will be used in the literature review
8. Repeat steps 4-7 as needed
9. Develop themes or concepts that synthesize the literature
10. Relate the themes to one another through an outline of the literature reviue
11. Produce a final literature review that structures or organizes the literature thematically
or by important concepts
12. Use the literature review to develop or refine the research questions
A literature review is performed on the topic, solid waste management in developing
countries. The twelve steps method described above has been used to give a description of the
following themes: Waste generation, Waste composition, Drivers for sustainable waste
management and concepts for improving waste management. Published articles as well as
relevant reports from organisations have been used.
3.2.2 Qualitative methods
Open ended interviews
One of the most dominant qualitative methods for data collection in this study has been open
ended interviews. The questions can be open or close ended. Open ended questions are, in
contrast to closed ended questions, mainly used as a qualitative method in initial studies on
topics unfamiliar to the researcher. The open ended interview method is important in cross-
cultural studies where psychological differences are unknown. Information given from open
ended questions is essential to design other data collection methods in the research. (Teddie &
Tashakkori, 2009)
Besides how the questions are formulated the structure of interviews is of relevance. In an
unstructured interview the questions are not determined on beforehand but emerge from the
immediate context. On the other end of the scale the interview can be structured with
predetermined questions with same exact wording to all interviewees. Somewhere between
there are semi-structured interviews where the topics and issues have been determined, but
not the exact wording of the questions. In that case the interviewer decides the sequence and
wording along the course of the interview. (Teddie & Tashakkori, 2009)
In structured and semi structured interviews an interview plan is created with questions and
topics relevant for the aim of the study. The structured interview plan consists of the exact
questions asked during the interview, while the semi structure plan can consist of topics and
some example question. Interview plans are used to ensure standardized interviews. Other
planning aspects are how many interviewees and how the selection of interviewees is suppose

10
to be made (Teddie & Tashakkori, 2009). A higher number of interviews need more resources
but can at the same time result in more and better material. The necessary number of
interviews is determined by the theoretical satiation. When satiation is reached very little new
information is given from an extra interview. The complexity of the study object determines
how quickly theoretical satiation is reached. Performing too few interviews might however
lead to difficulties spotting trends and omitting information. (Wibeck, 2010)
In the case study open ended semi structured interviews are performed as a way to get basic
information of the waste management in the Kavango region and to learn more about the
perspectives of the people living there.
Focus group discussions
Another interview related method is focus group discussions. Many planning aspects are the
same as for interviews. However the fundamental difference from regular interviews is that
more than one interviewee participate. A group of people together answer questions and
discuss certain issues. As a consequence group dynamics become relevant for the result. If the
participants are familiar to each other before the discussion a functioning group dynamic
might already exist. However a risk of only including people familiar to each other is that
aspects considered as obvious within the group are left out in the discussion.
In the case study focus group discussion is only used when regular open ended interview is
seen as inappropriate due to the high number of people want to participate.
Field observations
Field observations are a method to gather information through direct observation of a study
site. Direct observation of practices within a certain field is the main means for collecting
field observation data. The method is commonly used for familiarizing with a study site
before other techniques are employed.
Field observations have been used in the cases study as a complement to other qualitative
methods. The method is used to validate results from other methods.
Analysing qualitative data
The data from qualitative research are inductive by nature, meaning that general conclusions
are made out of particular facts in data. Categorise data in the search for trends are a common
way of analysing the data. Three different analysis strategies are (Teddie & Tashakkori,
2009):
Categorical strategy: The narrative data is divided and rearranged according to
categories. The rearrangements enable comparison between the interviews and leads
to a better understanding of the research questions. The categorizing process includes
predetermined categories. Each category has a number of rules which describes the
properties of the category. These rules are used for the categorization. By categories
with definitions distinct from each other, data can only belong to one of the
categories.
Contextualizing: The narrative text is kept as a whole text. Instead of rearranging the
text into categories, interconnections and statements within the text are analysed.
Display of data: The third and last strategy is to make data comprehensible by visual
presentations. A summary of the themes emerging from other analyses are presented.
This is done in combination of either one of the first two strategies.

11
A combination of categorical strategy and display of data have been used for the open ended
interviews and field observations in this study. For focus group discussion result are instead
analysed by contextualizing.
3.2.3 Quantitative methods
Waste characterization study
Waste auditing is a method used in waste characterization studies to investigate the waste
composition and quantities. In the European Union a standard method for waste auditing, the
solid waste analysis tool was developed in year 2004. Even though it is not anymore regarded
as a standard method in EU, it still summarizes the waste auditing procedure. (iC consulenten
ZT GmbH, 2004). The EU method for waste auditing is divided into four different phases:
Pre-Investigation
Analysis Design and Planning
Execution of Waste Analysis
Evaluation of Waste Analysis
In the pre-investigation phase necessary background information about the object of study are
gathered and evaluated. It is also possible through a stratification to divide the sampling
according to statistical subdivisions. (iC consulenten ZT GmbH, 2004)
During the analysis design and planning phase the type and number of sampling is decided.
The planning should also include the aspects of how to get random and representative samples
(iC consulenten ZT GmbH, 2004). The most common method for collecting samples is to use
a mother sample for each strata, or statistical subdivision, which is divided into smaller
samples. A randomized selection of the smaller samples is used for the waste characterization
(RVF, 2005). Samples can either be taken from a specific part of a collection system or
directly from where the waste is generated (iC consulenten ZT GmbH, 2004).
For the execution of waste analysis the samples are collected. The samples are sorted and
weighed. The result is documented in protocols according to a number of categories,
depending on the desired level of detail. (iC consulenten ZT GmbH, 2004)
The last step is evaluation of the waste analysis. The raw data is digitalized and statistical
values are calculated. The results can also be extrapolated to a parent population. (iC
consulenten ZT GmbH, 2004)
There are several limitations of the method; Waste characterization studies demands a large
effort if results of a high statistical precision are needed. It is also necessary to consider how
to design the analysis in order to achieve the decided purpose. In order to fulfil the purpose it
might be necessary to adjust the standard method. (RVF, 2005)
Household surveys
Surveys are counted as a quantitative research method as long as the questions have fixed
response alternatives. It differs from interviews due to the lack of communication between the
interviewer and interviewee. The survey approach forces the respondents to fit their answers
and knowledge to the predetermined categories and is therefore often criticized for the lack of
responses freedom. However using surveys might also be beneficial in situations where basic
information is needed for other analyse purposes. Surveys can therefore be used in
combination to other methods. Another situation when surveys might be a good research

12
method is when the surveys are to be repeated several times. Surveys with fixed response
alternatives are easy to repeat and the results are measurable. (Teddie & Tashakkori, 2009)
Household surveys have been used in this study in combination with the waste
characterization study as a way to gather necessary data about the participants.
3.3 Delimitations
Improvement of waste management is a complex process which includes aspects in many
different fields. It is not possible to address all issues related to waste management in a single
thesis. The emphasis of this thesis is therefore delimited to waste data collection and concepts
for improving waste management.
A sustainability perspective includes per definition economical, social and environmental
approaches. The experience of the author within these fields varies, with most experience on
environmental protection. Due to lack of experience within the fields of economy and social
science a risk of leaving out important aspects exists in those fields. To limit the risks
important aspects in the different fields are investigated in the literature study. Hopefully
including information from researchers more experienced in the fields of social science and
economy can make up for the author’s own lack of experience.
Even though an approach including developing countries in general has been used in the
literature review, the Kavango region in Namibia is the only representative for the developing
countries in the case study. The geographic delimitation is therefore set to the Kavango
region. An effort has been made to include all parts of the region in the study, however most
research methods have been focused on the biggest town, Rundu. Interviews have however
been performed with people from Rundu, Nkurenkuru and Divundu. The disposal site at all
these places has also been visited. The waste characterization study on the other hand only
included households from Rundu and a village in the rural area. For the interviews only
people representing companies and institutions in the Kavango region have been chosen. This
leaves out central governments, recycling companies and other national stakeholders.
The waste characterization study is also limited to waste from households. Business waste
from hospitals, lodges, shebeens, shops, garages and offices are examples of waste generators
which is also part of the local waste management. These different waste generators are
however included in the open ended interviews, meaning that waste practices of these
stakeholders can be evaluated from a qualitative perspective, but not quantified.

13
4 Background & Theory
4.1 Definition of a developing country
The classification in developing and developed countries is controversial and no general
standardized method of such classification exists. Several questions are also raised in the
classification process; can a country be fully developed? Is it enough only to include
economical aspects? Which indicators should be used? Different organisations attitude
towards these questions have led to several classification methods which all can be used when
describing a country’s development status. The World Bank describes countries according to
their gross national income per capita (GNI). This method only includes economical aspects
to describe the development status. Depending on the GNI a country classifies as low income,
lower middle income, upper middle income or high income. The first three categories are
counted as developing whereas the last category is counted as developed. (The World Bank,
n.d.). UN has a different view compared to the World Bank. There exists no established
definition of developing and developed countries. Kofi Annan, former secretary general,
proposed that:
“A developed country is one that allows all its citizens to enjoy a free and healthy life in a
safe environment.”
As a way of measuring development UN uses the Human Development Index (HDI). The
index measures several indicators in the areas of health, education and living standards in the
country to classify it in the different categories very high human development, high human
development, medium human development and low human development. (Human
Development Report Office, n.d.). IMF does also classify countries in terms of developing
and developed. A general classification was made in year 1980. Since then several countries
have been reclassified between groups. However little information can be found on which
bases IMF decisions are made. (Nielsen, 2011). WTO chooses not to define what a
developing and developed country is. Instead the country by itself decides if it should be
treated as developing or developed when applying for a membership in WTO. Other members
may however challenge this decision. (World Trade Organization, n.d.)
Both the World Bank and the United Nations are examples of organizations which actively
work with solid waste management programs. Hence their classification systems are the most
common to find in literature in the field of waste management. In this report no active choice
has been made between the different classification methods. However most of the sources
have used the World Bank method. For that reason the literature review also use the World
Bank method for classifying developing and developed countries.
4.2 Definition of solid waste
Solid waste can be defined as
“Solid materials as well as some liquids in containers, which are discarded or rejected as
being spent, useless, worthless, or in excess.” (Nelson, et al., 2009)
In another definition waste is referred to as
14
“Lack of use or value, or useless remains. Waste is a by-product of human activity. Physically
it contains the same materials as are found in useful products; it only differs from useful
production by its lack of value”. (White, et al., 1999).
Both examples from literature describe the reason for waste generation as either lack of use or
lack of value. However this perspective is not necessarily reflected in legislation. In the
European Union waste is defined as:
“Any substance or object which the holder discards or intends or is required to discard.”
(2008/98/EC, EU waste framework legislation)
The value, or rather lack of value, is in this case not adopted in the definition. National
legislation in Namibia, which is described in more detailed in the case study, define waste as
“any matter, whether gaseous, liquid or solid or any combination thereof, which is from time
to time listed by the Minister by regulation as an undesirable or superfluous byproduct,
emission, residue or remainder of any process or activity.” (Environmental management act
no.7, 2007)
This is a rather complicated definition and demands an active effort to define each type of
waste. However in a proposal to new legislation waste should be defined as:
“any substance or thing that the holder discards or disposes of, or intends or is required to
discard or dispose of, irrespective of its value to any person, and any substance or thing
deemed by regulations to be waste “ (Pollution Control and Waste Management Bill, third
draft, 2003)
The legislation in Namibia share, or at least might share in the future, the same approach as
the European union of only including the usefulness aspect of items. The lack of value is not
regarded in either legislation.
4.2.1 Solid waste categories
The solid waste can be categorized according to the origins of the waste streams. There are
two main groups. The solid waste-mix generated and collected in urban areas is often referred
to as Municipal Solid Waste (MSW). The MSW include waste from houses but can sometimes
also include waste from industries and small scale businesses in the urban area. The waste is
characterized by being heterogeneous. On the other hand there is homogenous solid waste
generated from industries farms, mines etc, in both rural and urban areas. Waste from these
sources is in many cases easier to collect since it is concentrated to certain large producers.
The treatment process itself can also be easier to perform because of the homogeneity of the
waste. (United Nations Environment Program, 2005)
It is also possible to categorize the waste depending on the character and content. Two main
groups in this method are organic and inorganic waste. There are also many alternatives when
it comes to sublevels. The inorganic waste can for example be divided according to the
material, e.g. plastic, paper, metal, glass etc. (United Nations Environment Program, 2005)
One category of waste which deserves some extra attention is the hazardous waste. Hazardous
consist of the two subcategories medical waste and chemical waste. The definition of
hazardous waste, used in the national legislation, differs a bit from country to country. The

15
general term is however that hazardous waste is waste which might be harmful for human or
environmental health. Both heterogeneous and homogeneous waste streams may contain
hazardous waste. (The World Bank, 2012)
4.3 Management of waste
The life of waste can consists of many steps. The first step is no doubt the generation of
waste. As soon as the waste is generated it needs to be managed in one way or the other.
Figure 1 summarizes the different steps of waste management.
4.3.1 Collection of waste
Waste collection is the first step in waste management. As can be seen in Figure 2, the
collection efficiency is generally poor in regions with many developing countries. In most
developing countries only waste from some of the urban areas are collected. Rural areas are
seldom included in any collection schemes. However this does not exclude the possibilities of
small scale informal collection in the rural villages. (The World Bank, 2012)
Figure 1. General description of the steps of waste management, with emphasis in developing countries. All solid waste
does not necessary go through all the different steps. Many of the treatment and disposal method demands collection of
waste, however open dumping and burning occur on a household level without the waste being collected.
Figure 2. Urban waste collection rate in different regions. OECD has the
highest efficiency whereas Africa and South Asia have the lowest. (The
World Bank, 2012)

16
The collection method varies from one city to another. Some examples of waste collection
are:
House to house collection: Waste is collected directly from individual houses. For
this service, the user often pays a fee.
Community bins: Waste generators bring their waste to a communal collection point
in the neighborhood. The solid waste is then picked up by the municipality according
to a schedule.
Curbside collection: In a schedule, set by local authorities, solid waste is collected in
a neighborhood. People living in the neighborhood place their waste directly outside
their houses.
Self delivered: No communal collection. The waste generators by themselves
transport the waste to a disposal site, transfer station or similar.
Contracted/delegated service: To encourage collection efficiency a private
entrepreneur is contracted to take care of the waste collection. The entrepreneurs in
some cases take demand fee for the service directly from the waste generators, in other
cases money goes through the municipality who collect fees from the inhabitants and
later pays the entrepreneur. (The World Bank, 2012)
A city’s waste collection can consist of one, or a combination of several of the examples
above. In developing countries the prerequisite for waste collection can vastly differ even
within the city border. One example of this is the occurrence of unplanned and densely
populated suburban areas, or slums, which lack adequate infrastructure. The possibility of
waste collection from the slums might be different from the rest of the town. To cope with
this variation a combination of collection method are necessary (Henry, et al., 2006).
Different collection method for different type of waste is also common. (Wilson, et al., 2006)
4.3.2 Disposal of waste
Common waste treatment methods are dumping, landfill, incineration, biological treatment
and recycling. The use of method for disposal is different between developing and developed
countries. In Table 1 a comparison between African countries and OECD countries are made.
In African countries waste disposal occur almost only via dumping and landfill. In OECD no,
or low amount of waste is dumped. Instead more waste is recycled and incinerated.
Table 1. Distribution of waste disposal methods in Africa compared to OECD. The distribution is presented in
millions tonnes per year and percent of the total waste disposal in the correspondingly region. (The World Bank,
2012)
Africa OECD
Dumping 2.3 44 % - 0 %
Landfill 2.6 50 % 242 42 %
Compost 0.05 1 % 66 12 %
Recycling 0.14 3 % 125 22 %
Incineration 0.05 1 % 120 21 %
Other 0.11 2 % 20 3 %
Dumping
Open dumping is one of the most common waste disposal methods in developing countries.
Dumping is characterized by low control, low or none planning and low regulations,
consequently dumping sites are also low engineered. Dumping often take place in a
centralized scale, but can also be executed on an individual scale. Illegal incineration is also

17
common as a method to reduce the volume of the solid waste. (Zurbrügg & Schertenleib,
1998)
Landfill
If lack of necessary precaution the practices of land filling are similar to open dumping. The
risks and characteristics of uncontrolled and unplanned land filling are equal to the risks and
characteristics of open dumping. Sanitary landfills however is built to reduce the possible
risks through liners in the bottom to prevent leachates from polluting the surroundings, earth
cover to prevent animal access to organic waste, and methane uptake. In low-income and
middle-income countries there is a scarcity of proper sanitary landfills. (Medina, 2010)
Incineration
Another waste disposal method is incineration under controlled forms. Uncontrolled
incineration at open dumping sites is not included in this category. In the process combustible
waste is transformed to energy with the possibility of filtering and monitoring pollution.
Experiences have proven developing countries as unsuitable for incineration as a main
disposal method. The waste composition of high rate of moist waste makes incineration
difficult to perform at low costs. (Medina, 2010)
Biological treatment
Biological treatment is divided into two categories, composting and controlled anaerobic
digestion. The former can be executed in low-tech conditions, whereas controlled anaerobic
degradation demands a high level of technical knowledge. For that reason controlled
anaerobic digestion of solid waste is almost none-existing in developing countries. The lack
of the possibility for energy recovery when composting is another important difference. When
waste is biological treated, the product can be applied to soil to improve agricultural activities
in the area. (The World Bank, 2012)
Recycling
In this report recycling as a waste treatment method is only considered when the material
itself is recovered and used in new materials. Hence energy recovery is not included. The
recycling process consists of recovery of materials from the waste stream, intermediate
processing (e.g. sorting), transportation of material and final processing. The end product of a
recycling process can either be a new product or raw materials for manufacturers comparable
with virgin materials. (Daskalopoulos, et al., 1998)
4.3.3 Informal sector
In developing countries the informal sector plays a significant role in solid waste
management. The informal sector is characterized by being small-scale, often based on
household labor, and labor intensive. Per definition the informal sector is also unregulated and
unregistered and hence it is not included in social welfare or government insurance schemes.
(Ahmed & Ali, 2004; Wilson, et al., 2006). The informal sector is primarily involved in two
types of activities, informal refuse collecting and scavenging.
In many cities in developing countries residents areas exists which are not covered by the
municipality’s solid waste collection service. Local entrepreneurs can see this as an
opportunity and arrange an informal refuse collecting system, using pushcarts, tricycle,
donkey carts or pickup trucks for transport purposes. Residents do pay a fee as normal for this
service (Medina, 2010). Another activity which involves the informal sector is scavenging. In
this case the informal sector is driven by economical valuable waste, material which

18
otherwise would be lost for the society (Medina, 2010). Scavenging can take place at any
system level of waste managing, everything from alternative collection, sweeping of streets,
hand sorting waste transports and at dumps and landfills. The secondary material collected
through scavenging are processed through sorting and cleaning and are then normally traded
locally via an intermediate dealer, see Figure 3 . The secondary material can pass several
dealers before reaching its end user, e.g. local industry and craftsmen. (Wilson, et al., 2006)
Figure 3. Flow chart example of an informal recycling system. (Wilson, et al., 2006)
4.4 Definition of a sustainable waste management
The concept of sustainable development was first defined by the Brundtland report in year
1987 as:
“development that meets the needs of the present without compromising the ability of future
generations’ needs”. (UN, 2012)
The sustainable development concept was further widening during the UN World Summit in
year 2005. The outcome document declared that economic development, social development
and environmental protection are three independent and mutually reinforcing pillars of
sustainable development. Furthermore the report identifies the following requirement for
sustainable development: poverty eradication, changing unsustainable patterns of production
and consumption and managing the natural resource base of economic and social
development. (UN - Genereal Assembly, 2005)
The possibility of a sustainable solid waste management is an idea commonly used by
scientific authors. Focus is however sometimes limited to the choice of treatment processes,
such as recycling and energy recovery (Troschinetz & Mihelcic, 2009; Daskalopoulos, et al.,
1998). Such a limitation has a tendency to omit important social aspects. For that reason
sustainable solid waste management in this report is defined as a part of a society’s general
sustainable development. The general requisite of a development that meets the present needs

19
without compromising the future needs, therefore apply. Furthermore sustainable solid waste
management should meet the necessary demands of social development, economical
development and the environmental protection.
To evaluate if a waste management system is sustainable it is necessary to define a number of
criteria for sustainability. The international water and sanitation centre use the following
criteria for a sustainable sanitation system (IRC, 2004):
it is functioning and being used;
it is able to deliver an appropriate level of benefits (quality, quantity, convenience,
continuity, health) to all, including the poorest women and men;
it continues to function over a prolonged period of time (which goes beyond the
life span of the original equipment);
its management is institutionalized;
its operation, maintenance, administrative and replacement costs are covered at the
local level;
it can be operated and maintained at local level with limited but feasible external
support; and
it does not affect the environment negatively.

20
5 Waste management in developing countries – a literature review
5.1 Solid waste generation
Two different alternatives for measuring the solid waste generation are the solid waste
generation rate and the total amount of generated waste. The generation rate allows
comparison of different countries when investigating why solid waste is generated. However
to describe the actual situation, the total amount of solid waste is more relevant since the
population of the inhabitants is included. The total amount of generated waste can be used to
estimate impacts of the waste management as well as to evaluate different treatment options.
5.1.1 Generation rates
The solid waste generation rates in different countries are presented in Figure 4. Solid waste
generation is suggested by UNEP to reflect the lives of people and the activities in the
country. With that perspective the waste generation would be a combined function of the
living standards of the inhabitants and the region’s natural resources (United Nations
Environment Program, 2005). This view is also partly shared by other authors who address
the income level of the people as the most important factor for waste generation rates
(Medina, 2010; The World Bank, 2012). Suggested other factors of importance for the waste
generation rate is the degree of industrialisation, public habits, local climate and level of
urbanisation (The World Bank, 2012).
Figure 4. Solid waste generation rates in the world. The map indicates the generation rate to be highest in North
America, Europe, Australia & New Zeeland and in some of the Arabic countries. The generation rate is lowest in the
sub Sahara part of Africa, South Asia and South America. Source of data: (The World Bank, 2012)
Analyses and comparison of solid waste in different countries of the world are a challenge
since the definition of waste differs from one country to another. Furthermore the available
waste data are limited. (Wilson, et al., 2012). No model of acceptable quality for estimating
the waste generation rates in a region has been identified in literature. In an attempt to
evaluate the relevance of the previously suggested factors for waste generation rate, data from
the report What a waste (The World Bank, 2012) and indicators for the factors in Table 2
have been used in a multiple regression to find out if there are any linear relationships

21
R² = 0,2707
0,00
1,00
2,00
3,00
4,00
5,00
6,00
7,00
0,20 0,70
Living standards
HDI
Linear (HDI)
R² = 0,3835
0,00
1,00
2,00
3,00
4,00
5,00
6,00
7,00
0 50000 100000
Income level
GNI
Linear (GNI)
R² = 0,0051
0,00
1,00
2,00
3,00
4,00
5,00
6,00
7,00
0 50 100
Industrialization
Linear (level of industry)
between the factors and the waste generation rates. For details about this analysis see
Appendix E: Statistical analyses of waste generation rates.
Table 2. Suggested factors which explain the generation rate in a country, the respectively indicator and the source of
indicator data. Usable indicators could only be identified for living standard, income level, industrialization and
urbanization.
Factor Indicator Source
Living standard Human development
index
(UNDP, 2011)
Natural resources N/A
Income level GNI per capita (The World Bank, 2012)
Public habits N/A
Industrialization Percent of GNI from
Industry
(CIA, 2012)
Local climate N/A
Urbanization Percent of people living
in urban areas
(CIA, 2011)
R² = 0,2214
0,00
1,00
2,00
3,00
4,00
5,00
6,00
7,00
0 50 100
Urbanisation
Urbanisation
Linear (Urbanisation)
Figure 5. Linear relationship between the waste generation rate (kg per person and day) and the four different
factors; Living standards (HDI), Income level (GNI/capita), Urbanization (% of population) and Industrialization
(% of GNI from industry). The R square value of the linear regression indicates how well the data fits to the model,
i.e. how much of the variation of data which could be explained by the factor. Income level is indicated to be the
most important factor with 38 % of the data possible to explain with the factor. Industrialization has the lowest R
square value.

22
In Figure 5 the waste generation rate is plotted against the four different indicators and linear
regressions are made. There are some signs of a relationship between the four factors and the
waste generation rate. However no single factor was able to explain more than 38 % of the
data variance by itself. A multiple linear regression is also made to see if combinations of the
different factors are more statistically successful to explain the data. The multiple linear
regressions received a R2
value of 0.43 which is only slightly higher than the 0.38 received
when the waste generation were plotted against the income level.
5.1.2 The total amount of generated waste - distribution within a country
A common view among scientific authors is to see the population growth combined with an
escalating urbanisation as the main problem when it comes to waste generation in developing
countries. (Troschinetz & Mihelcic, 2009; Ahmed & Ali, 2004; Barton, et al., 2008; Zurbrügg
& Schertenleib, 1998). The consequence of the population growth and the escalating
urbanisation is a concentration of waste to urban areas.
The urbanisation in developing countries has become a large factor in later years and the
urban populations in developing countries are estimated to grow more than 150 000 people
every day (Troschinetz & Mihelcic, 2009). It is also estimated that 90 % of the urbanisation
the next 25 years will take place in developing countries (Ahmed & Ali, 2004).
In most developing countries the per capita income is higher in urban areas compared to rural
areas (Medina, 2010). This would also contribute to concentration of the waste generation to
cities. However if economic activities, such as large scale agriculture and mining, exists in the
rural area large amount of homogeny solid waste is produced (Medina, 2010).
One aspect which complicates the waste management in cities in developing countries is the
large number of people living in slum areas. About one billion people are currently living in
slums. This is people who lack adequate waste management. The slum areas are also expected
to increase if the urbanization increases faster than the local authorities can handle. (Barton, et
al., 2008)
5.2 How differs the solid waste composition from one place to another and more importantly why?
The composition of waste determines possibilities for waste treatment and a change in waste
composition can therefore have a severe impact on the waste management practices. The
composition of waste also determines the effects of improperly managed waste. (Medina,
2010)
A distinct difference between the composition of waste in developing and developed countries
is the degree of organic content. In general, developing countries have a larger extent of
organic waste, a difference which can be up to three times the degree of organic content in
waste from a developed country. (Medina, 2010). In Figure 6, countries are divided according
to the degree of organic waste in the waste composition.

23
Figure 6. Map over the degree of organic waste in the solid waste composition in a number of countries. Red countries
are high organic waste producers, with more than half of the composition being organic waste. The yellow countries
are low organic waste producers with less than half of the composition being organic waste. The map indicates that
most of the high organic waste producers are located in Africa, South America and Asia. In Europe and North
America most of the countries are low organic waste producers. Data used from (The World Bank, 2012)
The difference of organic waste content between developing and developed countries can
been explained with the different way of handling food. In developing countries most of the
food consumed are fresh fruit, vegetables and unpacked food compared to the consumption in
developed countries where a larger rate consists of food packaged in cans, bottles, plastic
containers etc. (Medina, 2010). This explanation assumes that most food is produced within
the developing country, or region, and at the same time a low proportion of imported food.
There are also regional differences in the composition. Solid waste from humid, tropical and
semitropical areas consists of a high amount of plant debris. Regions with distinct seasonal
changes in temperature, on the other hand, have a higher amount of ash in their solid waste.
The ash originates from heating in the colder winter season. (United Nations Environment
Program, 2005)
5.3 Drivers for sustainable waste management
5.3.1 Social aspects
Public health
Protection of public health is often the most important incitement for municipal solid waste
management in developing countries. Without proper waste collection the public health can
be threaten from several diseases. The quantity of vector transmitted diseases, such as dengue
fever (mosquitoes), leptospirosis (rats) and enteric bacteria (houseflies) are higher in absence
of proper solid waste management. Waste supply the vectors (mosquitoes, rats, houseflies
etc.) with food and shelter. Hence, collecting the waste in urban areas and thereby increase the
sanitation level of the population, can be an effective way to reduce the risk of vector
diseases. Furthermore the public health can also be threatened by the waste itself. Hazardous
waste, such as medical and chemical waste, is in developing countries seldom separated from
other waste. Direct contact with hazardous waste can lead to injuries and transmitting of blood
diseases. (Cointreau, 2006)

24
Even when the waste is collected the waste treatment can propose a threat to public health.
Dumping waste at inadequate landfills without leaching control is a vast source to
contamination of drinking water. Another common treatment option in the developing world
is uncontrolled incineration. In these cases, the incineration process is far from optimal, with
high emission of VOC (Polychlorinated dibenzodioxins, dibenzofurans, polycyclic aromatic
hydrocarbons, etc.) which have been known for causing cancer at high concentrations.
(Cointreau, 2006)
Workers health
Working with waste is a high risk occupation with several injuries and health issues. The risk
in developing countries have proven higher than in developed countries since the worker is in
more direct contact with the waste. Some of the most common issues in solid waste
management are: (Cointreau, 2006)
Respiratory illness from ingesting particulates during waste collection and dusty
conditions at open dumps
Infections from direct contact with contaminated waste
Puncture wounds leading to tetanus, hepatitis and HIV infection
Headaches and nausea from anoxic condition in disposal sites
Lead poisoning from burning materials
Informal workers and health
The informal sector usually consists of poor and marginalized people living in urban areas. It
is not uncommon the entire informal sector in a city belongs to the same minority, e.g.
Zabbaleen in Egypt. These discrete social groups can earn some money from the waste
management and does not necessarily belong to the poorest in a city. However they are
always socially distanced from the rest of the population. (Wilson, et al., 2006)
Many informal workers, especially scavengers, are children, pregnant women and seniors.
These groups are also more vulnerable to toxics and diseases than other groups. Children
intake more water, food and air per body mass than adults and even a low concentration of
toxins can disrupt their development. Low immune defense among children and seniors is
also a contribution to high risk when exposed to diseases. (Cointreau, 2006)
Most of the informal worker lack protective equipment such as gloves, face masks or even
shoes. Many scavengers also live at or near large disposal site. Exposure to emissions and
diseases from the waste is therefore not restricted to their occupational time, but presence
during their life altogether. Domestic animals such as pigs, goats and cows can also obtain
and transmit diseases to their owners. (Cointreau, 2006)
Gender
Before describing gender differences, the cultural differences in developing countries when it
comes to waste management, should be noted. The role of man and women in the society
highly differ from one country to another. This text should therefore only be seen as
generalized descriptions which may not be true everywhere.
Solid waste management includes many aspects which are gender related. The waste itself
may not differ from a women and a man, but when it comes to waste management there are
several gender specific differences. Women plays a traditionally import role in the household
and are often responsible for waste generating activities such as cooking, cleaning etc. The
management of the waste inside the household therefore often fell upon the woman. As a

25
consequence of this women, in many instances, also take more responsibility on a community
level when they become aware of the negatively impact of inadequate waste management.
(Bernstein, 2004)
The voluntary work by women in waste management at a community level may come from
purely altruistic reasons. When the work becomes legitimized and paid as a part of
development, women often have to step back for the benefit of men doing the same work, but
with a salary (Bernstein, 2004). One activity commonly performed by women are waste
recovery through scavenging. The physical level of waste recovery is such that other works
with the same level is normally designated for men. Why women are more likely to be
involved in material recovery than other work of a similar physical level is a mystery but can
perhaps be explained their daily contact to waste in the household. Women also tend to be
amongst the most marginalized groups and could therefore be forced into material recovery
(United Nations Environment Program, 2005). A woman who has a paid occupancy in waste
management often has lower salaries and worse work conditions compared to men. It is
therefore crucial that effort is put into development projects to protect and improve the
situation of women. (Bernstein, 2004)
Women also have a higher willingness to pay for waste services. Experiences also indicate
that household economies managed by women are more reliable users when it comes to
payment for waste services. It is therefore necessary to investigate other aspects than income
level when determine tariffs for the waste service. (Bernstein, 2004)
5.3.2 Economical aspects
Public finances
Waste management activities can either be financed by public funds or by private individuals
through user fees. A simplistic view is that public funds only should be used for financing
public goods delivered by public agencies and private goods by user charges. How waste
management should be financed would therefore be a question of the character of the activity.
Many aspects of waste management do not only favor individuals but the whole public and
should therefore be considered as being public goods, for example sweeping of streets and
cleaning of public parks. Other activities, such as resource recovery, are more difficult to
categorize in public/private goods. (Cointreau-Levine, 1994)
Waste collection and treatment are two activities highly affecting the economy of local
authorities in developing countries. Waste management is predicted to consume about 30 %
of the local authorities’ budgets in developing countries (Henry, et al., 2006). Waste
collection is the most costly activity of waste management, predicted to stand for 60-75 % of
the total waste management costs (Nemerow, et al., 2009). The costs of disposal and
treatment of waste depends on the choice of activity, see Table 3.

26
Table 3. Costs of different disposal methods in low, lower middle, upper middle and high income countries. (The
World Bank, 2012)
US$/tonne waste Low income
<$876
Lower middle
income
$876-3,465
Upper middle
income
$3,466-10,725
High
income
>$10,725
Sanitary Landfill 10-30 15-40 25-65 40-100
Open Dumping 2-8 3-10 NA NA
Composting 5-30 10-40 20-75 35-90
Waste -to-Energy
Incineration NA 40-100 60-150 70-200
Anaerobic
Digestion NA 20-80 50-100 65-150
A change of treatment method accompanied by higher costs should only be performed if the
difference in treatment methods contributes to the public good in such a way that it makes up
for necessary subvention from public funds. Another valid option would be if the higher costs
are covered by market based revenues. (Cointreau-Levine, 1994)
Economy of the users
One of the basic needs for a cost-recovery system is a working method for collecting money
from the people. This can be done either by taxes, or by user fees. Two examples of collecting
money are house taxes and user fees connected to water and electricity bills. In the first case
the sanitation costs are based on the ownership of a house in urban areas. The latter is based
on locally determined tariffs and is combined with billing for other services such as water
distribution and electricity. Both methods falls short when it comes to urban informal areas
where buildings are unregistered and where access to power grid and communal water is
limited. (Zurbrügg, 2002)
Another aspect of importance for the possibility to collect user fees is the local economy and
willingness to pay. A poor economy of the people constrains the income possibilities of the
local authority and thereby also the possibilities of a proper waste treatment. People are often
willing to pay for visible activities, such as collection, but not as willing to pay for less visible
activities, such as sanitary land filling. (Zurbrügg, 2002)
Incomes of the informal sector
Two different sources of income exist for the informal sector; User fees in an informal
collection system or from scavenging valuable material. The informal sector often consists of
poor and marginalized people. The income possibilities for this sector from solid waste
management are therefore an example of the linkage between poverty eradication, described
in the millennium development goals, and solid waste management. The informal sector is a
complement of the formal sector when it comes to delivering waste services, a situation which
needs to be considered when changing a waste management system to avoid a loss of income
for marginalized people. (Wilson, 2007)

27
Value of waste
The value of specific waste streams can be an incitement for resource recovery. Examples of
resource recovery are recycling of materials, energy recovery and composting. In developing
countries common resource recovery activities are collection of recyclable materials and
composting. The recycling materials are collected from anywhere in the waste management
process, from separate collection at source to scavenging in dumping sites. Due to lack of
recycling infrastructure the recycling process normally is centralized. Therefore the recycling
activities are in most places limited to collection, separation and cleaning. The materials then
have to be transported to a recycling plant. Both transportation costs and the existence of a
working market for recovered materials determine the actual value of waste and are important
for recycling possibilities. The benefits of composting, from an economical perspective, are
perhaps mostly avoiding organic waste in landfills, which reduce the needed capacity of the
landfill and the methane gas emissions. The products of composting can however be sold in a
local market to farmers and landscapers as a soil improving material.
(Henry, et al., 2006)
5.3.3 Environmental protection
Hazardous waste
A source of environmental pollution is inadequate treatment of hazardous waste. When the
hazardous waste is mixed with other solid waste, pollution can occur through leaching from
dumping sites and landfills, or by air pollution when burning waste. It is also a health problem
for workers and animals that get in direct contact with the waste. (The World Bank, 2012)
Hazardous waste can be divided into the two subcategories medical waste and chemical
waste. The largest producers of chemical waste are chemical manufacturing, petroleum
industry, waste treatment and remediation, metal production and pharmaceutical production
(Rosenfeld & Feng, 2011). The most common sources of medical waste are medical facilities
such as hospitals, nursing homes and clinics (The World Bank, 2012). Hazardous waste can
also origin from households and be a part of the municipal solid waste mix.
Carbon emissions
Every waste management activity generates greenhouse gases (GHG), either directly from the
activity itself or from energy consumption. The actual effect of the GHG emissions is a result
of generated emissions during the waste management and the avoidance of emissions from
downstream activities. The two most common GHG in waste management are carbon dioxide
(CO2) and methane (CH4). Examples of waste management activities generating carbon
dioxide are transportation from collection, burning and incineration of waste, aerobic
digestion through composting and other energy consumption. Methane is primarily generated
when organic waste is digested in anaerobic conditions in landfills. Informal landfills and
open dumping produce less methane than sanitary landfills due to less anaerobic conditions.
Improving treatment conditions in developing countries towards sanitary landfills would
ironically lead to larger methane emissions. The global warming potential (GWP) for the
different gases, can be seen in Table 4. (United Nations Environmental Program, 2010)

28
Table 4. Global warming potential for the three greenhouse gases carbon dioxide, methane and Nitrous oxide. As can
be seen in the table both methane and nitrous oxide have a much higher global warming potential compared to the
equal amount of carbon dioxide (United Nations Environmental Program, 2010).
Greenhouse gas GWP 20 years (kg
CO2-e)
GWP 100-years (kg
CO2-e)
GWP 20 years (kg
CO2-e)
Carbon dioxide CO2 1 1 1
Methane CH4 72 25 7.6
Nitrous oxide N2O 289 298 153
Landfills are the largest source of GHG emissions in solid waste management and globally
stand for a methane emission equally to 700 Mt CO2-e. The second largest GHG source in
waste management is incineration which globally has an annual emission of 40 Mt CO2-e.
(United Nations Environmental Program, 2010).
Protection of local environment
In countries with a scarcity of natural resources, such as drinkable water and arable land,
protection of the local environment is a driver for improving the waste management.
Inadequate disposal of waste can contaminate sensitive ground and surface water (Wilson,
2007). Two causes for local pollution are inadequate waste collection and improperly
disposing of hazardous waste. Uncollected waste might end up sensitive areas and contribute
to pollution. Mixing hazardous waste with other municipal solid waste is not only a health
problem for workers, but also cause for polluting leachate (The World Bank, 2012)
Daily covering at land-fills and leachate control are two examples of how to adjust the waste
management to protect the local environment. Depending on the nature of waste and disposal
methods the potential threats differ. In landfills leachates contain high amounts of organic
concentrations. However at dumping sites with regularly burning, the amount of organic
leachates is lower. Leachate might also contain ammonia, nitrate, phosphate, chloride,
calcium, potassium, sulfate, iron and the heavy metals lead, zinc, cadmium and nickel
(Cointreau, 2006).
5.4 Concepts for achieving a sustainable waste management in developing countries
Integrated Solid Waste Management (ISWM)
Integrated solid waste management, or ISWM, is a concept for approaching the task of
designing a new waste management system, or rationalize an already existing one. With an
ISWM approach all aspects of a waste management system, technical as well as non-
technical, are important. A genuine relationship between technical and non-technical aspects
is considered, with no possibility of changing one aspect without affecting others. As a result
technical and non-technical aspects should always be analysed together. (United Nations
Environment Program, 2005)
Social desirable, environmental sound and economically viable is the three aims of an
integrated solid waste management system. If achieving the spoken aims, the approach is
qualified for being called a sustainable solid waste management. The integrated waste
management approached is also considered as the alternative which is the most compatible
with environmentally sustainable development (Medina, 2010). Many examples of solid
waste management system failures can be found in history. The reasons why a failure occurs
are seldom due to technical difficulties. Instead politics, economical aspects and institutions
are far more important. Integration of governance in solid waste management reduces the risk
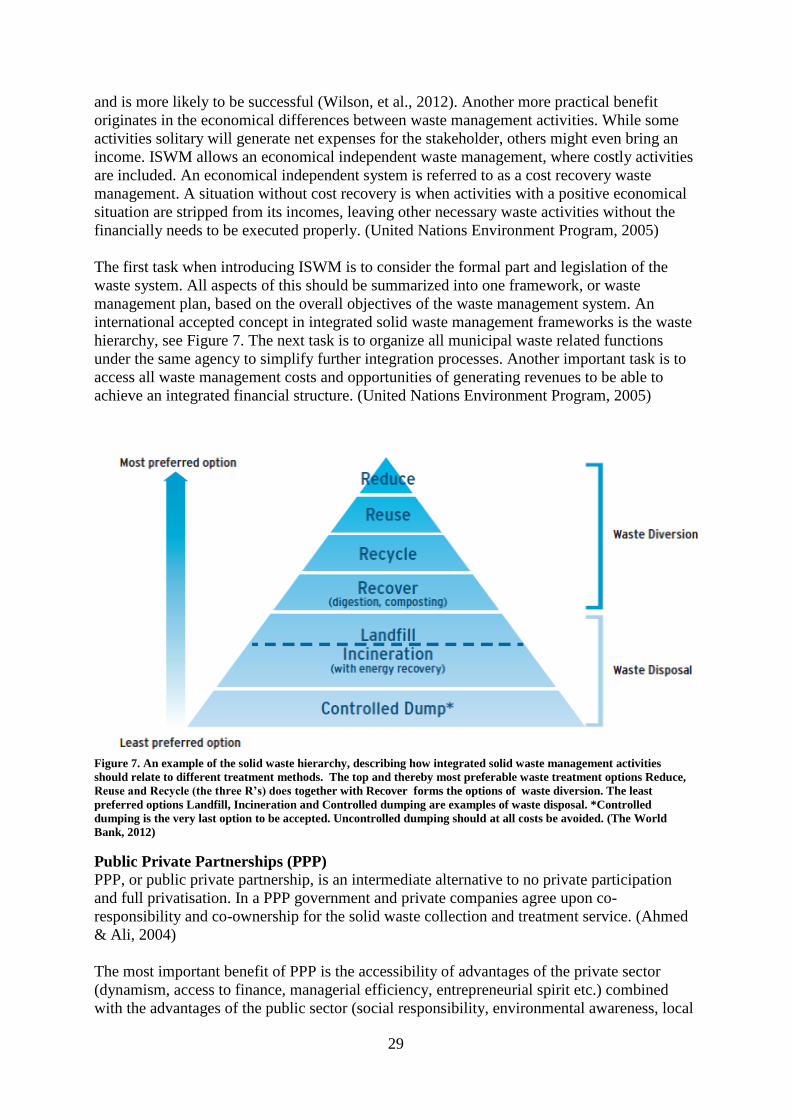
29
and is more likely to be successful (Wilson, et al., 2012). Another more practical benefit
originates in the economical differences between waste management activities. While some
activities solitary will generate net expenses for the stakeholder, others might even bring an
income. ISWM allows an economical independent waste management, where costly activities
are included. An economical independent system is referred to as a cost recovery waste
management. A situation without cost recovery is when activities with a positive economical
situation are stripped from its incomes, leaving other necessary waste activities without the
financially needs to be executed properly. (United Nations Environment Program, 2005)
The first task when introducing ISWM is to consider the formal part and legislation of the
waste system. All aspects of this should be summarized into one framework, or waste
management plan, based on the overall objectives of the waste management system. An
international accepted concept in integrated solid waste management frameworks is the waste
hierarchy, see Figure 7. The next task is to organize all municipal waste related functions
under the same agency to simplify further integration processes. Another important task is to
access all waste management costs and opportunities of generating revenues to be able to
achieve an integrated financial structure. (United Nations Environment Program, 2005)
Figure 7. An example of the solid waste hierarchy, describing how integrated solid waste management activities
should relate to different treatment methods. The top and thereby most preferable waste treatment options Reduce,
Reuse and Recycle (the three R’s) does together with Recover forms the options of waste diversion. The least
preferred options Landfill, Incineration and Controlled dumping are examples of waste disposal. *Controlled
dumping is the very last option to be accepted. Uncontrolled dumping should at all costs be avoided. (The World
Bank, 2012)
Public Private Partnerships (PPP)
PPP, or public private partnership, is an intermediate alternative to no private participation
and full privatisation. In a PPP government and private companies agree upon co-
responsibility and co-ownership for the solid waste collection and treatment service. (Ahmed
& Ali, 2004)
The most important benefit of PPP is the accessibility of advantages of the private sector
(dynamism, access to finance, managerial efficiency, entrepreneurial spirit etc.) combined
with the advantages of the public sector (social responsibility, environmental awareness, local

30
knowledge, job generation concerns etc.). The introduction of the private sector in a
municipality solid waste management could relief the burden of the authority’s waste
management budget, due to higher effectiveness and access to external finance. (Ahmed &
Ali, 2004)
Accomplishment of a PPP with all partners acting under mutually favourable circumstances is
however not obvious. Both partners have to share the commitment to pursue common goals
(Ahmed & Ali, 2004). The public sector interest in introducing a PPP is to save money,
whereas the private sector needs to make money. With these differences commitment to
common goals is not obvious and can be problematic. (Cointreau-Levine, 1994).
PPP concept originates from the developed world. Hence, there could be difficulties
introducing PPP in the developing world where the regulatory framework is generally weak.
A poorly executed PPP without transparency, fairness and accountability could even open up
waste management for corruption and inefficiency (Ahmed & Ali, 2004). To avoid this
situation an important step towards PPP is to strengthen the capability of the public sector, so
that proper contract control over the private sector can be executed. (Bartone, et al., 1991)
Integration of the informal sector
About 2 % of the population in Asia and Latin America is involved in the informal sector of
waste management. Besides a large number of people occupied in the informal sector, it also
plays a significant role diverting recyclable materials from solid waste. Integrating the
informal sector simply means making the informal, formal. The main benefit of an integration
of the informal sector is the possibility to positively change the social impacts solid waste
management have on the informal sector. (Sembring & Nittivattananon, 2010)
Despite the informal sector’s relevance for a municipality’s waste management most of the
governments in the developing world ignore or sometimes actively discourage the informal
sector activities. One common opinion amongst local politicians is that the informal sector is
associated with unhygienic environment and risk to the public health. Another common
opinion is that an integration of the sector would lead to higher costs. As a consequence a
political resistance can occur when integrating the informal sector in local waste management.
(Sembring & Nittivattananon, 2010)
A suggested conceptual method for integrating the informal sector argues for the following
integration steps (Sembring & Nittivattananon, 2010):
The first step always is changing the negative perception of decision makers about the
contribution of the informal workers.
Establishment of partnerships, or alliances, between individuals in the informal sector
should be encouraged.
An alliance between individuals increases the informal sector’s ability to add value to
collected materials. This can be done by strengthen social and human capital amongst
the informal sector. In informal sector recycling a hierarchy can be assumed, see
Figure 8. Partnerships, alliances and co-operation all helps the individuals out by
climbing the hierarchy and thereby add value.
The informal sector then has the possibility to provide individual services and improve
living conditions and other infrastructure.

31
Decentralization
There are both non-technical and technical aspects of decentralization. Non-technical aspects
comprise the distribution of responsibility between national, regional and local governments.
A decentralized approach allows the local authority which in most cases is responsible for
solid waste management, also manage all related affairs to the waste management, e.g. collect
user fees and other revenues (Schübeler, 1996). The technical aspects of decentralization take
place at an even lower scale than non-technical aspects. Differences in physically and
socioeconomically aspects can be found even within a city or region. The composition and
generating rates of the solid waste differ between neighbourhoods. In middle- or upper-
income neighbourhoods the infrastructure is also often better than in low income
neighbourhoods, enabling truck based waste collection. The situation in slum areas can
however be quite different. A decentralized solid waste management takes these differences
into consideration enabling a proper solid waste service for all inhabitants.
A decentralized solid waste management system grants several benefits, it is more flexible,
efficient and receptive for local needs and potential. It also eases the burden upon the
centralized authority and thereby let the authority focus on their responsibly in legislation,
definition of standards, environmental monitoring and support to municipalities (Schübeler,
1996). In slum areas a decentralized solution also actively involves the community and the
informal sector (Medina, 2010).
To achieve an effective decentralization it is important that the local authority have
appropriate financial and administrative power. The local authority also needs to have
sufficient capacity for system planning and operation of the waste management. In many
cases the local authority in developing countries need to improve the solid waste management
budget to better agree upon actual costs. (Schübeler, 1996)
Aspects of importance
The headline “Aspects of importance” does not relate to any specific concept, instead some
conclusions are presented from researchers, on why and when sustainable solid waste
management can be achieved.
Figure 8. Hierarchy of the informal recycling sector. At the bottom, individual
waste scavengers bring the lowest values of the recovered materials. For every
step in the hierarchy value can be added. (Wilson, et al., 2006)

32
Troschinetz & Mihelcic have analysed 23 different case studies in developing countries,
identified barriers and incentives to recycling. Twelve factors for influencing sustainable
waste management were found. The three most important barriers were solid waste
management personnel education, waste collection & segregation and government finances.
Furthermore, the relationship between the factors was investigated. The conclusion from the
research is that sustainable waste management is dependent of stakeholder involvement and
collaboration between different sectors. (Troschinetz & Mihelcic, 2009)
Diaz proposes, in a research of waste management in Latin America, focus is needed on the
non-technical issues. National policy, institutional capacity, regulatory activity, personnel
education, community involvement and financial stability are identified as the most important
aspects for a successful introducing of sustainable solid waste management. (Diaz, 1998)
Yongsheng et al. draws the conclusion in a Kenyan case study that community involvement is
the most important aspect for any waste management system. A proper waste management is
determined by the people’s attitude towards the waste. The attitudes can be a result of Socio-
economic characteristics, however attitudes can be changed by community involvement
activities. (Henry, et al., 2006)

33
6 Waste management in Kavango The case study allows a detailed evaluation of the possibilities and difficulties of achieving a
sustainable waste management in developing countries and is therefore a good complement to
the literature review. The study object for the case study is Kavango region in the northeast of
Namibia.
The Kavango regional council and the Swedish municipality of Vetlanda are jointly
participating in a twinning program since the year of 2009. The program includes specific
projects in different areas such as rescue service and waste management. The waste
management project is newly formed in 2012 and aims to improve the waste management in
the Kavango region so that:
“By 2030, the citizens in the Kavango Region will have the sustainable long-term local
democracy, security, capacitated and better living condition concerning waste managing. The
environmental and social impact will be very low.”
The project has objectives within three main topics, strategic waste management planning,
capacity building at Kavango regional council and public awareness. (River Eman Catchment
Management Association, 2012)
6.1 Profile of the Kavango region
The Kavango region is located in the northeaster part of Namibia and share borders with
Angola and Botswana.
Figure 9. Map over the Kavango region with settlements, villages, towns, major roads and administrative boarders.
Soils in the region are dominated by a deep layer of sand. During earlier, drier times in history
the sand was formed by the wind to the shape it has today. Sandy soils allow rain water to
drain rapidly and there are also low amount of nutrients in the soil. Around the Okavango
River other soils types with a slightly higher nutrient content occur. (Mendelsohn & el Obeid,
2003)
The Kavango region is a dry place where rainfall comes scarcely, however in some parts of
the region the average rainfall exceeds 550 mm annually. The rainfall varies from year to year
and also within the region. The rainfall is periodical and about 80 % of the rain fall under

34
December to March. The temperature also varies over the year. During the warmest period in
September to November the mean temperature is about 25 ⁰C with maximum temperatures at
about 35-40 ⁰C. During the coldest period of May-July the mean temperature is about 16 ⁰C,
with a maximum temperature around 30 ⁰C. (Mendelsohn & el Obeid, 2003)
Most of the people living in the Kavango region have their homes near to the Okavango
River, which constitute the north border of the region. The Okavango river supply significant
amount of the people in the area with freshwater. The catchment area of the river is situated in
Angola and Namibia, but most of the contributing runoff to the river occurs in Angola.
(Mendelsohn & el Obeid, 2003)
The Region has two towns, Rundu and Nkurenkuru. Rundu is the capital of the region and
with its 81 400 inhabitants it plays a key role in many ways. There are also a number of
settlements in the region, which of Divundu is the largest. The distance between the two
towns and large settlements are rather large; 140 km between Rundu and Nkurenkuru, and
220 km between Rundu and Divundu. (Mendelsohn & el Obeid, 2003)
The population in Namibia is counted in periodical census. Preliminary results from the last
census in year 2011 indicates a population of 222 500 people gender distributed as 53 %
female and 47% male inhabitants in the Kavango region. An area of 48 742 km2
gives a
population density of 4.2 people per km2. This is an average population density comparing to
other regions in Namibia. However compared to other countries is this a very scarcely
populated area. (National Planing Comission, 2012). The population is dominated by young
people going to school, work as an employee or running informal businesses (Mendelsohn &
el Obeid, 2003). The people in the Kavango region make a living in a various number of
ways, see Table 5.
Table 5. Sources of Income. (Kavango Regional Council, 2011)
Source Percentage of total income
Farming 52%
Pensions 5%
Wages & salaries 21%
Business, non farming 14%
Cash remittance 4%
Other 4%
Unemployed 20%
The lives in urban areas, such as Rundu, and rural areas differ when it comes to sources of
income. In urban areas wages and salaries is the dominating source of income. Occupations in
Rundu mostly originate from governmental services, private services, shops/stores and small
scale production. In the rural areas a combination of farming and wages from public and
private services is the dominating sources. There are no large scale industries or mines in the
region. (Mendelsohn, 2009). The region is the poorest in Namibia with high number of
poverty both in urban and rural areas. The latest statistics indicates that 56.5 percent of the
people are poor and 36.7 percent of the people are severely poor. (River Eman Catchment
Management Association, 2012)
Cultivation of crops as source of food and income in the rural areas is a difficult task. Due to
the sandy soils, dry seasons and high evaporation rate weather conditions are not optimal for
cultivation. Mahangu is the crop often cultivated due to its durability in poor soils and low

35
rainfalls. Cultivation is rarely enough as self sufficient food source and most households in
rural areas have at least two sources of income. Nevertheless is the Kavango region often
spoken of as a potential breadbasket for the rest of Namibia. However this demands large
scale irrigation and high input of resources. Projects aiming at creating such farms have not
been successful in the past. (Mendelsohn, 2009)
Another important crop for the rural areas is the Thatching grass. Quite opposite to the
Mahangu the Thatching grass is not cultivated for own use but exported to other regions and
countries as material for roof-building, example for tourist lodges. Livestock of cattle, goats
and donkeys is yet another important food and income source. It is estimated that at least
150.000 cattle and 65.000 goats lives in the region. (Mendelsohn, 2009)
The governmental power of the region is divided between authorities on a national, regional
and local level. At the national level the governance is done by the different ministries.
Governance at a regional level is done by the ministry of regional and local authorities
through the Kavango Regional Council (KRC). The KRC also have a local administrative
responsibility for the two settlements Divundu and Ndiyona. Otherwise the two town councils
in Rundu and Nkurenkuru are the government’s representatives at a local level. In rural areas
outside the towns and settlements traditional authorities still have a lot of power when it
comes to issues about land-use. (River Eman Catchment Management Association, 2012)
6.2 Key stakeholders
Stakeholders with great importance for the waste management in the Kavango region are
referred to as key stakeholders. They can be found at a national, regional and local level. A
screening of key stakeholder has been made from literature and interviews with some of the
stakeholders. The result of the screening is presented in Table 6.
Table 6. List of key stakeholder for the waste management in the Kavango region
Stakeholder Geographic
level
Influence on waste management
Ministry of Health
and Social Services
National Responsible for the national waste management
policy and also to develop and review legislation,
standards and guidelines on waste management.
Explore alternative methods on waste treatment
and consult with stakeholders on ideal places for a
disposal site etc.
Ministry
Environment and
Tourism
National Ensure and develop policies and legislation for
sanitary landfill sites. Also conduct Environmental
Impact Assessment
Ministry of
Agriculture, Water
and Forestry
National Regulates water pollution, hazardous and solid
waste.
Ministry of Trade
and Industry
National Enforce policy to small and medium enterprises
and industries regarding pollutants.
Ministry of Works,
Transport and
Communication
National Responsible for a routine maintenance and plans
for health care risk waste. Also responsible for
maintenance equipments (e.g. incinerators)
Large scale
recycling companies
National A key factor for the possibility of implementing a
recycling system. Without the large scale
recycling companies much waste material would

36
not be able to be recycled.
Producers of
packaging and other
products
National The industry and especially the packaging
industry can decide which material ending up as
waste.
Regional town
Council
Regional Developing and implementation of a regional
waste management plan. Responsible for waste
management in Settlements
Transportation
companies
Regional Supply transport of recyclable waste to large scale
recycling companies.
Town councils
(Rundu/Nkurenkuru)
Local Coordinate and provides waste collection and
waste disposal sites in respectively town.
Contractors Local Is in Rundu hired to provide waste collection
services. Responsible for daily collection of waste
bins in the town.
Small scale recycle
companies
Local Recycle waste when the value of waste is easily
accessible.
Hospital and
medical clinics
Local The hospital in Rundu and all medical clinics
generate hazardous waste. The staffs need to deal
the medical waste with extra care.
Food stores Local The way food store handle the food can influence
the amount of biodegradable waste produced.
They could also play an important role of
recycling glass and plastic bottles.
Other stores Local Produces empty packages which could be
necessary to collect separately
Building projects Local Can produce a lot of incombustible waste.
Building projects could also be a market for
reusable waste.
Industries Local Possible producer of homogenous waste.
Currently no such industries are located in the
region.
Hotell & Lodges Local Generates mixed waste from accommodation and
restaurants.
Governmental
institution, Offices,
Schools
Local Produce mixed waste from their activities. A
source of paper waste.
Citizens Local Generate household waste and is also a key factor
when it comes to waste collection.
Informal workers Local People who scavenge dumping sites after valuable
waste. Increases the recycling levels at high health
costs.
6.3 Institutional setup
The governance over solid waste management is divided depending on location of the
Kavango region. A summary of the different important institutions is described in Figure 10.

37
Figure 10. Organizational chart over the waste management in the Kavango region on a national, regional and local
level.
6.4 Regulatory framework
There are several international conventions and declarations which incorporate waste
management. Namibia has for example signed the Basel convention on the control of
transboundary movement of hazardous wastes and their disposal, the London convention on
the prevention of marine pollution by dumping of wastes and other matter as well as the Rio
declaration on environment and development. (Hasheela, 2009)
On a national level the Namibian government drafted the Pollution Control and Waste
Management Bill in year 2003. The bill proposes that:
“No person may produce, collect, transport, sort, recover, treat, store, dispose of or
otherwise manage waste in a manner that results in or creates a significant risk of harm to
human health or the environment.”
Furthermore the bill proposes regulation on national waste management plans, waste
management licenses, responsibilities for local authorities and import and export of waste.
The bill is still to be approved as an act. (Pollution Control and Waste Management Bill, third
draft, 2003)
The Environmental management act was approved in the year of 2007 and regulates the waste
management in a couple of different areas. The act state that reduction, reuse and recycling of
waste should be promoted. It also state that waste generation at source should be reduced
when the cost is acceptable for the society. (Environmental management act no.7, 2007)

38
The National waste management policy was put together by the Ministry of Health and
Social service in year 2010. The main policy goal is to:
“Prevent and reduce health risks associated with exposure to healthcare substances,
household, radiation and other waste from healthcare workers, waste handlers and public by
promoting sound environmental waste management practices.”
Two of the objectives of the policy were to design appropriate means of safe and sustainable
waste management and to provide a legal framework for development of waste management
legislation. In addition the policy provides an implementation plan and indicators to measure
the implementation process. (Ministry of health and social service, 2010)
On a regional level the Kavango Regional Council have adopted the following goal:
“By 2030, the citizens in the Kavango Region will have the sustainable long-term local
democracy, security, capacitated and better living condition concerning waste managing. The
environmental and social impact will be very low.” (Kavango regional Council, 2012)
6.5 Previously studies
No previous scientific studies which focus on waste management in this part of the country
have been identified. There are however several reports on the subject which might be of
interest.
In 2007 a feasibility study of the possibilities to introduce an integrated waste management
system were conducted by a consultant, on the behalf of Rundu Town Council. Though not
very scientific in its approach, it presents an interesting solution to the waste management
problem in Rundu by introducing recycling as an integrated approach. (Rundu Town Council,
2007). The report does not calculate with specific numbers of waste generation and
composition for Rundu. The relevance of the results should therefore be questioned.
Another study of interest is a doctoral thesis about the municipal waste management in
Namibia in general, with focus on Windhoek. It thoroughly investigates different aspects of
the waste management system and proposes possible improvements of the same. (Hasheela,
2009)
In Windhoek the household waste is investigated in periodical audits. The audits investigate
the amount of generated waste in formal households in Windhoek. The results are presented
in audit reports. (Solid Waste Management Division, 2008) The results of the audits could be
used as a comparison to results in the case study.
6.6 Description of field study
An integrated quantitative/qualitative approach described in chapter 3.2 has been adopted.
The following methods were selected as most suitable for this study: Open ended interviews,
Focus group discussions, Household and willingness to pay surveys, Field observations,
Literature review and Waste characterization.
6.6.1 Open ended interviews
Interviews as a qualitative analytical method of waste management allow integration of many
different perspectives. A number of 22 people associated with key stakeholders of the waste

39
management have been interviewed for this purpose. For details about the interviewees see
Table 7. Examples of people which have been interviewed are development planners at the
Kavango regional council, administrative staff at the Rundu town council and Nkurenkuru
town council, staff at the technical office in Rundu, contractors, residents and managers at
supermarkets, hotels, medical facilities and garages.
Table 7. Information about the interviewed institutions. Depending if the institution is a provider or user of waste
services different interview plans have been used. A total of 22 people have been interviewed at ten different
institutions.
Institution Provider/ User Number of people
interviewed
Kavango regional council Provider 5
Rundu town council Provider 4
Nkurenkuru town council Provider 3
Kavango regional council,
Mukwe constituency
Provider 3
Ministry of youth,
Nkurenkuru
Provider 1
Contractors Provider 2
Medical facilities User 1
Lodges (Hotel) User 1
Supermarkets User 1
Garages User 1
The interviews have been performed as a semi structured interview with open ended
questions. The interviews have in general been executed according to the interview plans, but
the semi structured approach enabled a flexible approach. Hence questions outside the plans
have also been used.The interviewees are divided into two different groups, providers of
waste management services and users of waste management services. The interview plans are
slightly different for the two groups as different perspectives might be important for a supplier
of waste services rather than the user of the same, see Appendix A: Open ended interviews.
The length of each interview varied. Generally the interviews with users have lasted for 10 to
15 minutes and for suppliers between 10 and 50 minutes.
The interviews were recorded and transcribed. The information from the interviews were
divided into the same categories as for the field observations; waste generation, waste
collection disposal and treatment, waste characteristics, informal workers, other.
Four of the questions in the interview plan also allow a quantitative analysis. These are; What
is waste? How is waste a problem for development? How can waste management be
improved? What are the barriers for improvement? The answers to these questions are
aggregated into several standard answers which allow an evaluation of the most common
answers. The quantitative results are complemented with qualitative examples of answers.
The information of the interviews is used to describe the current waste management system
and to design the waste characterization study.
6.6.2 Focus group discussions
When interviews were difficult to perform due to the vast number of people wanted to
participate a focus group discussion were used. Focus group discussions are performed more
improvised without following the standard interview plan.

40
Only one focus group discussion was performed with a group of women scavenging on a
dumping site. The information from the discussion was used to get a general picture on a
specific issue.
6.6.3 Household and willingness to pay surveys
When performing the waste characterization study the household participating also had to
answer a smaller survey about their waste management and willingness to pay, see Appendix
B: Household surveys, Willingness to pay. The survey also included necessary information
for the waste characterization study. The survey was answered by 39 households within
Rundu.
6.6.4 Field observations
Direct observations of waste, and waste practices in the Kavango region are in this study refer
to as field observations. The need of a scientific method to manage field observations was
found early on during the visit of the Kavango region due to the many observations made.
Field observations have been made during all kinds of situations and time periods during the
two months visit. A small note, which summarizes the observation, was recorded in a
notebook directly after field observations were made. Later the same day the note was
transcribed in a computer and the information about the field observation is expanded to
include the following characteristics:
Time of field observation
Place of field observation
Summary of field observation
Observation category
The observation category can be one of the following six categories: waste generation, waste
collection disposal and treatment, waste characteristics, informal workers, other. The use of
categories is a way of coding the field observations and thereby spot trends and other
information which else might be difficult to observe.
6.6.5 Literature review, official documents
Local authorities have been screened for official documents regarding the solid waste
management. The contacted local authorities were Rundu town council, Nkurenkuru town
council and Kavango regional council. Due to unexpected circumstances the response rate
was low and only official documents regarding the economy of Rundu town council were
collected. Waste management is however not a separate category in Rundu budgeting. The
results of the literature review is therefore of limited use.
6.6.6 Waste characteristics by hand sorting waste
Collection and hand sorting of waste from houses have been carried out in October 2012 as a
quantitative method of characterize the waste generated in Kavango. Waste has been collected
directly from families in Rundu and nearby rural areas. Thus only household waste was
included in the waste characterization study. 53 households were selected to participate in the
study during a two week period. Of them 20 lived in the central and formal parts of Rundu,
another 20 in the outskirts of Rundu in different informal settlements and 13 houses in the
rural village of Kayengona about 10 kilometers east of Rundu. The distribution of different
households between the urban areas and settlements can be seen in Table 8.
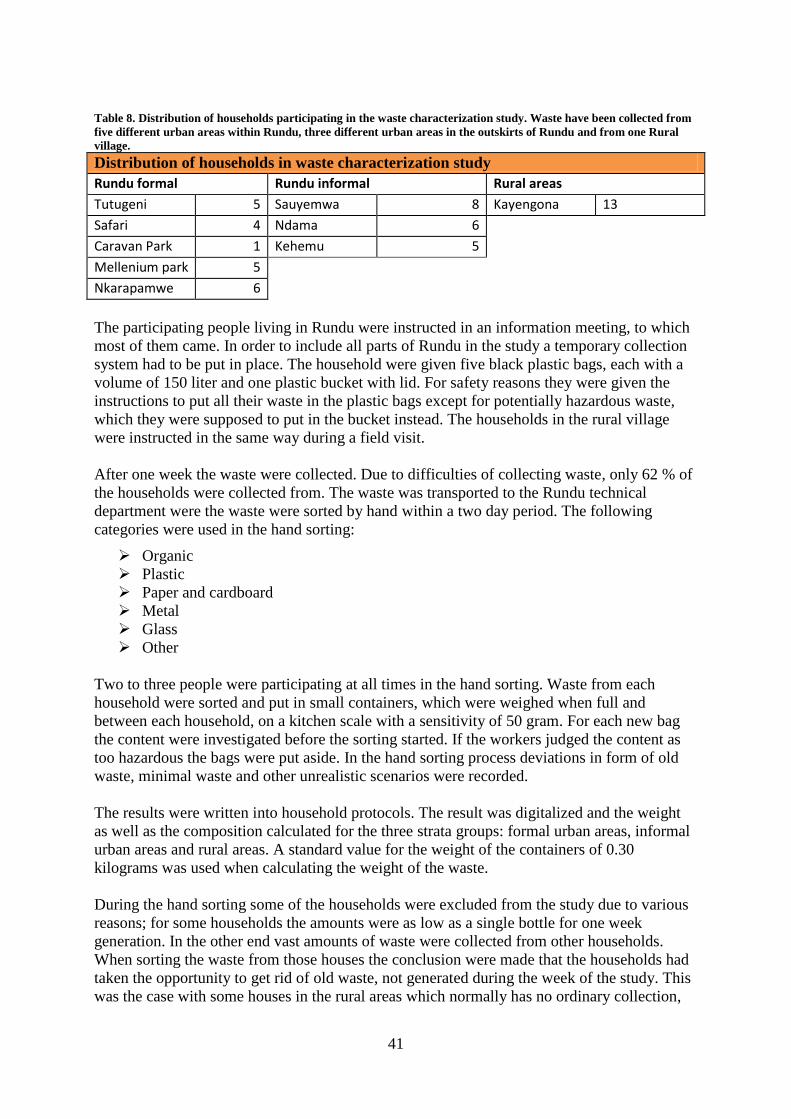
41
Table 8. Distribution of households participating in the waste characterization study. Waste have been collected from
five different urban areas within Rundu, three different urban areas in the outskirts of Rundu and from one Rural
village.
Distribution of households in waste characterization study
Rundu formal Rundu informal Rural areas
Tutugeni 5 Sauyemwa 8 Kayengona 13
Safari 4 Ndama 6
Caravan Park 1 Kehemu 5
Mellenium park 5
Nkarapamwe 6
The participating people living in Rundu were instructed in an information meeting, to which
most of them came. In order to include all parts of Rundu in the study a temporary collection
system had to be put in place. The household were given five black plastic bags, each with a
volume of 150 liter and one plastic bucket with lid. For safety reasons they were given the
instructions to put all their waste in the plastic bags except for potentially hazardous waste,
which they were supposed to put in the bucket instead. The households in the rural village
were instructed in the same way during a field visit.
After one week the waste were collected. Due to difficulties of collecting waste, only 62 % of
the households were collected from. The waste was transported to the Rundu technical
department were the waste were sorted by hand within a two day period. The following
categories were used in the hand sorting:
Organic
Plastic
Paper and cardboard
Metal
Glass
Other
Two to three people were participating at all times in the hand sorting. Waste from each
household were sorted and put in small containers, which were weighed when full and
between each household, on a kitchen scale with a sensitivity of 50 gram. For each new bag
the content were investigated before the sorting started. If the workers judged the content as
too hazardous the bags were put aside. In the hand sorting process deviations in form of old
waste, minimal waste and other unrealistic scenarios were recorded.
The results were written into household protocols. The result was digitalized and the weight
as well as the composition calculated for the three strata groups: formal urban areas, informal
urban areas and rural areas. A standard value for the weight of the containers of 0.30
kilograms was used when calculating the weight of the waste.
During the hand sorting some of the households were excluded from the study due to various
reasons; for some households the amounts were as low as a single bottle for one week
generation. In the other end vast amounts of waste were collected from other households.
When sorting the waste from those houses the conclusion were made that the households had
taken the opportunity to get rid of old waste, not generated during the week of the study. This
was the case with some houses in the rural areas which normally has no ordinary collection,

42
and with garden waste in Rundu which are only normally collected at an extra fee. Samples
were excluded from the study in the following cases:
Extremely low amount of waste or only waste from one specific category. (3
households)
Households delivering high amounts of old looking waste, such as rusty tins and cans,
see Figure 11. (2 households)
Households delivering high amounts of waste with a high content of sand. (2 houses)
Waste excluded due to safety reasons (3 households)
Figure 11. Example of old looking waste as a reason for excluding the sample
from the study.
After the hand sorting a number of 23 households, or a quarter of the originally participants,
were valid for statistical analysis. The exact numbers can be found in Appendix C: Waste
characterization study.

43
Useless items; 14
Both useless items
and items without
economical value; 1
Items without
economical value; 1
Materials
originates from the
use of
items/products; 1
Materials not
managed properly;
1
Only examples; 4
6.7 Result A: Open ended interviews
The results of the open ended interviews are dived into the following topics Definition of
waste, waste as a problem for development, improving waste management and barriers for
improvement.
6.7.1 Definition of waste
The interviews always started with the question How do you define waste? In chapter 4.2 two
different ways of defining solid waste were revealed; Useless items and items without a value.
As can be seen in Figure 12, the answers of the interviewees did in most cases mention the
useless aspect, but did not the economical aspect. Some examples:
“Things become absolute you cannot use it again, and it becomes waste”
“Waste to my own understanding is everything which is in no use to humans.”
“In my own understanding waste are products no longer useful, offspring of the original
products.”
Two people also specified that the waste is only useless for the person throwing it away. The
waste could be useful for another person.
“You could have a very old chair, if I am no longer interested and I don’t want to keep the
chair, there are times when you either can give it to somebody which is interested, If you not
give it to somebody you could also throw it away. It becomes waste to you, but the next person
who picks it up it is not waste.”
“Waste to me is any items or goods that will no longer be used by a particular person, but it
could be useable to the next person. “
Figure 12. Distribution of answers to the question How do you define waste? in the open ended interviews. The
majority of the people mentioned the usefulness of an item as the most important factor for defining waste.
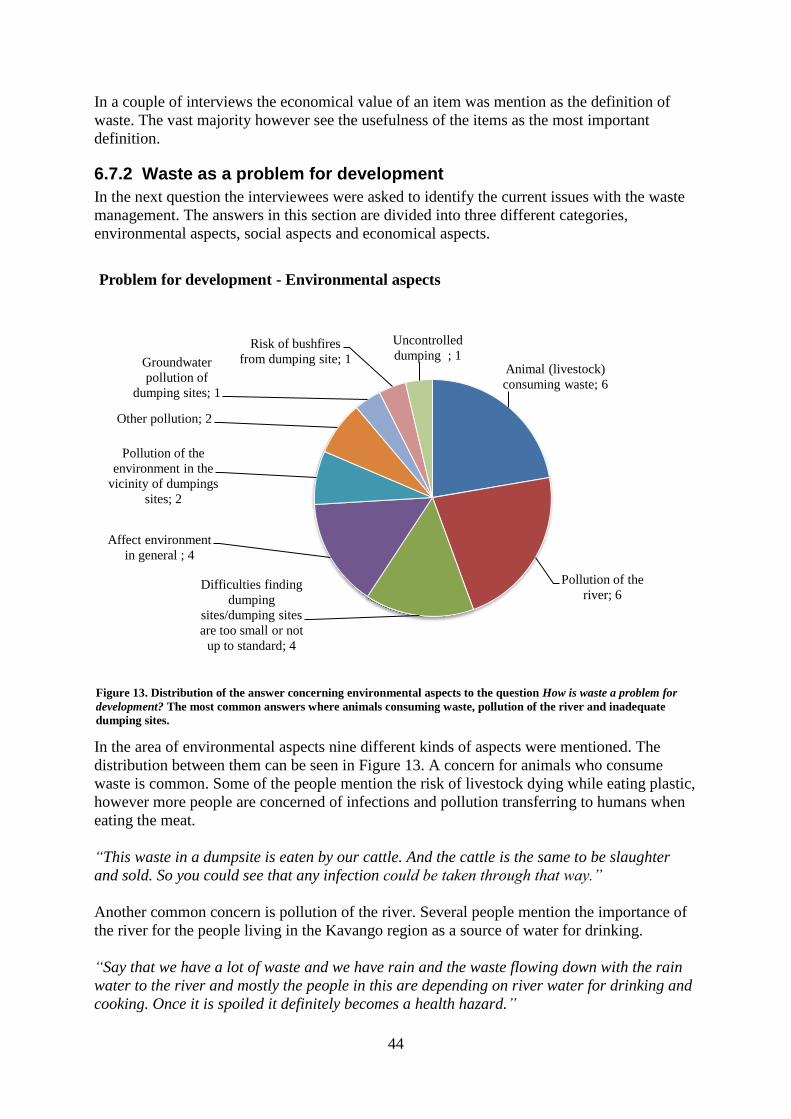
44
In a couple of interviews the economical value of an item was mention as the definition of
waste. The vast majority however see the usefulness of the items as the most important
definition.
6.7.2 Waste as a problem for development
In the next question the interviewees were asked to identify the current issues with the waste
management. The answers in this section are divided into three different categories,
environmental aspects, social aspects and economical aspects.
In the area of environmental aspects nine different kinds of aspects were mentioned. The
distribution between them can be seen in Figure 13. A concern for animals who consume
waste is common. Some of the people mention the risk of livestock dying while eating plastic,
however more people are concerned of infections and pollution transferring to humans when
eating the meat.
“This waste in a dumpsite is eaten by our cattle. And the cattle is the same to be slaughter
and sold. So you could see that any infection could be taken through that way.”
Another common concern is pollution of the river. Several people mention the importance of
the river for the people living in the Kavango region as a source of water for drinking.
“Say that we have a lot of waste and we have rain and the waste flowing down with the rain
water to the river and mostly the people in this are depending on river water for drinking and
cooking. Once it is spoiled it definitely becomes a health hazard.”
Figure 13. Distribution of the answer concerning environmental aspects to the question How is waste a problem for
development? The most common answers where animals consuming waste, pollution of the river and inadequate
dumping sites.
Animal (livestock)
consuming waste; 6
Pollution of the
river; 6 Difficulties finding
dumping
sites/dumping sites
are too small or not
up to standard; 4
Affect environment
in general ; 4
Pollution of the
environment in the
vicinity of dumpings
sites; 2
Other pollution; 2
Groundwater
pollution of
dumping sites; 1
Risk of bushfires
from dumping site; 1
Uncontrolled
dumping ; 1
Problem for development - Environmental aspects

45
It is also mentioned that one problem is a lack of knowledge when it comes to how the waste
affect the environment. The third frequently mentioned topic is how the dumping sites can
pollute the nearby areas.
“The environmental impact, currently it is now difficult for do in the assessment, some of us think we need research and so on. From a theoretical perspective it is important that a proper dumping site needs to be put in place. We do not know any immediate knowledge what impact the waste might have. Even without that immediate knowledge it is good to do it in a proper way. My personal view particularly from the environmental impact is: number one the site where we dispose the waste might have impact in groundwater and so on. That is way the identification of the dumping site needs to be done in a proper way. The disposal method must also be environmental friendly. What we currently do is to take the waste to the dumping site we put it on fire. When we burn it there is some implications. Some of the waste might not burn. And it can have implication on the surrounding environment.”
Figure 14. Distribution of the answer concerning social aspects to the question How is waste a problem for
development? The most common answers where public health affected through diseases, health hazard for informal
workers, public health through injuries and waste burning close to houses.
When it comes to social aspects of the waste management all answered were connected to
health issues in different ways. The most common answer were about waste as a potential
cause for spreading diseases. Out of different diseases a concern for waste increasing the
spreading of malaria through mosquitoes is the most common. One person mentioned blood
transferring diseases.
“The waste is a problem because is not supposed to be where the people are, it is supposed to
be far so it could not harm the people. The waste for example blood there is bacteria there
which can harm people. It need proper handling so it can not cause diseases.”
Public health
affected through
diseases ; 8
Health hazard to
Informal workers
due to lack of saftey
equipment; 4
Public health
through injuries; 3
Burning waste close
to people; 3
Health of workers; 1
Health hazard due to
inadequete
management och
hazardouse waste; 1
Problem for development - Social aspects

46
“It is a problem when it becomes too much and is not taken care. This can lead, because we
are close to the river side, to too much mosquitoes. A lot of people would encounter a lot of
problem like malaria diseases. It can pollute the environment leading to an unhygienic
environment, so it is not really good for health.”
“We use the swamps as a dump site which invites the mosquitoes to breed in those swamps“
Another health hazard worth mentioning is the physical danger of some waste and injuries.
“When it comes to bottles sometime when the children plays there they injure themselves. At
the end they needs to be hospitalized and the children cannot go back to school again.”
A few people were concerned about how the burning of waste affects the people.
“It could also cause a lot of health hazard. Because sometimes they have only one mean,
people have to burn. There is a lot of toxic in the material disposed. When you burn the gases,
the fume of that kind of burning it can also affect people when inhaling the gas.”
Figure 15. Distribution of the answer concerning economical aspects to the question How is waste a problem for
development? The most common answers were dirty towns leads to less tourists, costly to manage, waste of reasources
and dirty towns leads to less investors.
In the area of economical aspects many people mention the waste effect on the impression of
towns as a concern. A bad impression is suggested to act repellent on both tourists and
investors.
Dirty towns leads to
less tourists; 5
Costly to manage; 4
No recycling =
waste of reasources;
4
Dirty towns leads to
less investors; 3
Lower productivity
level throw lower
public health; 1
Job creation
(Benefit); 1
Cost/recovery
system difficult with
people coming from
outside town; 1
Old equipment,
expensive
maintainance costs;
1
Problems for development - Economical aspects

47
“Economical impact one is maybe no one wants to work in a polluted environment. We try to
convince investors to invest in our area but then if Divundu pollution is such high the
investors would not be able to come and invest, because investors need a clean environment
to operate in. From their side it is one of their conditions. They would like to operate in clean
environment. Also tourists. People who are coming to Namibia for example. In the process it
could lead to an economical viability of the area itself.”
“Economically it also impacts the economy of the town and the region, simply if not managed
properly the investors would not like to invest in such a town. Clean environment attract
investors which would improve the local economy.”
The two other aspects with more than one people mentioning is the costs of managing waste
and the lack of recycling. Another interesting aspect is the connection between health risks
and economy.
“The economical impact it is linked to the health issue. If people are affected through the
waste management and there health condition could be affected it would translate into
productivity even at home or at work. The immediate economical implication is that the waste
must be managed properly so the health risk could be avoided.”
6.7.3 Improvement of waste management
Figure 16. Distribution of different categories of answers to the question How can the waste management be improved?
Most suggestions concern organisatorial and management issues. Other existing categories are waste collection, waste
treatment and public relation.
In the next part of the interview the people were asked to describe how the waste management
can be improved. The answers are divided into four differenet categories, see Figure 16.
These are Waste collection, Waste treatment, Organisatorial and management and Public
relation. The more detailed subcategories can be seen in Table 9.
Waste collection; 15
Waste treatment; 13
Organisatorial and
management; 21
Public relation; 6

48
Table 9. Suggestions to improvements in the areas of waste collection, waste treatment, organisatorial and
management and public relation.
Waste collection Number
of people
Waste treatment Numb
er of
people
More transport vehicles 6
Introduce recycling 6
Seperate collection for some waste (e.g.
glasses) 4 Fencing of dumping site/better
control over dumping sites 4
Improve the organisation and performance of
RTC. Sometimes RTC are late for pickup 2
Seperate dumping sites for
different types of waste 1
Introduce communal collection points to
approve the efficiency of waste collection 1 Decentralisation of treatment
(Medical waste) 1
More cleaning campaigns 1 Improve dumping sites 1
Bigger dust bins 1
Organisatorial and management Number
of
People
Public relation Num
ber of
people
Involvement of central government
2
Improve the awerness level of the
people about waste problems and
risks
4
Improved national legasilation 2 Signs "no dumping" 1
More workers 2 Fines for illegal dumping 1
Import knowledge from developed countries 2
Capacity building through training 2
Improve knowledge about effects from the
waste management through studies 2
More control of contractors - transportation of
people must be easier 2
Involve the companies, parastates initiatives 1
Improve knowledge about possible
improvements and from where to access
money
1
Knowledge sharing with other municipalities 1
Better infrastructure (Roads) 1
Waste management plan 1
Follow national and international standards 1
Include the informal workers and improve their
salaries 1

49
6.7.4 Barriers for improvement
Figure 17. Distribution of answers to the question Which are the barriers for improvement? The most common answer
in the open – ended interviews were insufficient funds, lack of capacity, low public awareness and insufficient
legislation.
The interviewees were also asked to describe the barriers for improvement. The distribution
of the different categories can be seen in Figure 17.
The most common category was by far insufficient funds, both in general and for the
Kavango regional council. One person summarized many of the barriers with this answer:
“The barriers would be the financial resources, another is because the absence of policies to
guide people. But the biggest one I think is the mindset of the will to do it. Those who are in
charge need to drive this process. But again for driving a process you need to be competent
you need to understand how to drive. The Ministry of environment and tourism need to have
people who are trained and have some education in waste management, so that when they
drive the process they know exactly what they want and they know exactly how to do it.
Another thing in the setup of the government there is so much of the region structure based on
old laws that does not seem to coup with the current reality. What we have, does it serve with
our current needs? We are just sticking to the old updated law regulation. “
The financial pressure is also mentioned by this person who wanted to have a gravel road to
the dumping site:
“The barriers for improvement will be a lack of resources. These things we are planning to
do only if we would have assistance from somewhere, somehow it is possible to realize. We
should try to ask for finance everywhere where it is possible. If the road to the dump site is to
be maintained which is necessary. The current road stops some private people from reaching
the dump site and offload the waste along the road. You are required to have a 4x4. We just
need a gravel road.“
Insufficient funds in
general; 9
Lack of capacity by
staffmembers
(knowledge) at local
and national
authorities; 5
Lack of concern and
awerness among the
public; 4 Old legasilation/lack
of legasilation; 4
Not enough capacity
for collecting all
waste; 2
Insufficient founds
at the Kavango
regional council; 2
Lack of proper
dumping sites; 2
Other; 10

50
6.8 Result B: Waste characterization, waste from households
6.8.1 Waste composition
Figure 18. Distribution of the sorted solid waste in the waste characterization study. The three bags on top represent
waste from the three different groups; Rundu informal areas, Rundu formal areas and rural areas. Each bag is
divided vertically according to the amount of waste within each group. In the chart the distribution of all the sorted
waste is presented.
In Figure 18 the results of the waste characterization study is presented. Details about the
result can be found in Appendix C: Waste characterization study. The waste composition
differs in the strata groups. However since the number of samples were fewer than expected,
the classification in strata groups is considered as doubtful from a statistical perspective. The
result is therefore presented for all samples. The results indicates that the most common type
of waste is organic waste (26%) followed by other (19%). Paper, Plastic, Glass and Metal
stands for about the same portion of the weight (12-16%).
6.8.2 Waste generation rate
The distribution of waste generation rates for, each household participating in the waste
characterization study can be seen in Figure 19.

51
0
1
2
3
4
5
6
7
8
9
0,0
2
0,0
4
0,0
6
0,0
8
0,1
0,1
2
0,1
4
0,1
6
0,1
8
0,2
0,2
2
0,2
4
0,2
6
0,2
8
0,3
0,3
2
0,3
4
Mo
re
Nu
mb
er
of
ho
use
ho
lds
kg solid waste / person / day
Waste generation rates
The average solid waste generation rate for the three different groups Rundu informal, Rundu
formal and rural areas are 0.10, 0.11 and 0.13 kg solid waste per person and day respectively.
The median values are slightly lower at 0.04, 0.06 and 0.08 kg solid waste per person and day
respectively. The average value for all of Kavango is 0.11 kg solid waste per person and day.
The differences between the three groups are low and statistically insignificant.
Due to low statistical differences previously stratification is neglected for the extrapolation of
the waste generation rates. In Figure 20 the average waste generation rate combined with
population data is used to extrapolate the waste generation for the entire Kavango region.
Figure 20. Total amounts of household solid waste generated in the different constituencies in the Kavango region.
The highest amounts are generated in Rundu Rural West constituency with approximately 4200 kilogram per day.
Figure 19. Distribution of waste generation rates for different household in Rundu and rural
areas. The numbers are a result of the amounts weighted in the waste characterization study.
As can be seen most households produce less than 0.2 kg solid waste / person / day. A few
household produce much more which contribute to a higher average generation rate.

52
In Figure 21 the waste generation rate in the different constituencies has been divided with the
constituency area to achieve a waste generation density.
Figure 21. The density of waste generated in the different constituencies in kilogram per square kilometer and week.
The highest density can be found in Rundu Urban with 1265 kg/km2 and week. The waste generation density in other
constituencies are far lower and only the two Rundu Rural constituencies have high enough density to be distinguish
in the map.

53
6.9 Result C: Where does the waste go? – A schematic map
Figure 22, the schematic map is a result of information from interviews, focus group
discussions as well as a number of field observations. The map does not include any aspects
of quantities.
Figure 22. A schematic map over the solid waste in the Kavango region
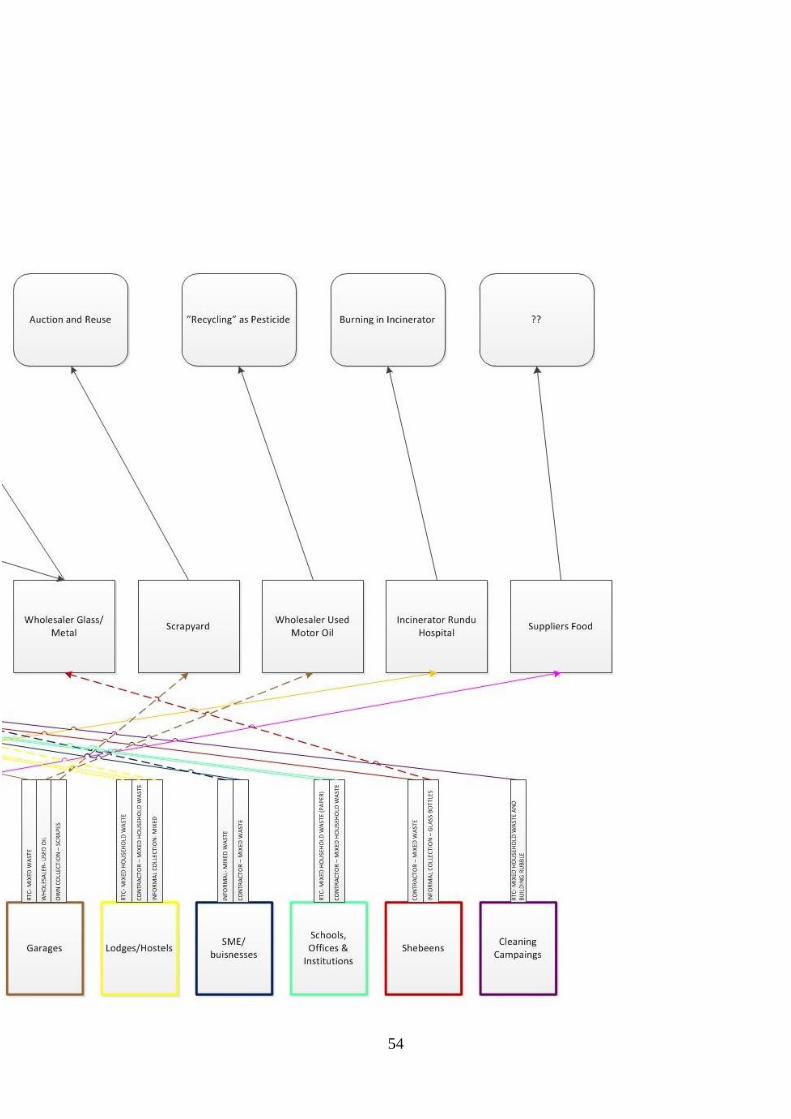
54

55
6.10 Result D: Economy
6.10.1 Costs of managing waste
In an attempt to estimate the current costs for managing the waste in the Kavango region
official documents have been screened. Budgeting and economical reports were found to be
based on division figures. Solid waste management is a responsibility of the environmental
health division at Rundu town council. It is a problem to distinguish the total waste
management costs since the environmental health division also have other responsibilities
which share common expenses with waste management. These are:
Food safety
Occupational health
Business registration and regulation
Environmental management
Inspection building
Pest control
Health education
Table 10. Economy of the environmental health division at Rundu Town Council concerning waste management. The
direct costs of waste management have the last years been bigger than the incomes. A situation which are projected to
continue the next year 2012-2013 as well.
2010/2011
(N$)
2011/2012
(N$)
2012/2013
(N$)
Income waste management
Refuse removal Domestic 1062587 846467 1100000
Refuse removal Business
500 000
Garden refuse removal 1173 869 10000
Dustbin rental domestic
237435 400000
Dustbin rental buisness 272460 38240 50000
Fines illegal dumping
30000
Total income refuse 1336220 1123011 2090000
Direct expenses waste management
Contractor services 1990893 1594641 2800000
Protective clothing
9947 20000
Refuse plastic bags 30797
50000
Vehicle expenses 23973 172384 220000
Repair and maintanance 126164 159111 200000
Total direct expenses refuse 2171827 1936083 3290000
Total expenses Environmental
health 3436581 2757727 5667352
Net result Environmental health -1273251 -383685 -1787352
Some of the direct incomes and costs connected to waste management in Rundu can be seen
in Table 10 above. The direct expenses have been bigger than the income possibilities in the

56
past, and will continue to be so in the next year. The direct cost of waste management stands
for 58 % of the total costs of the environmental health division.
A general concern has been razed about how the economy in Rundu town council is managed.
National newspapers have been reporting about issues found when the economy has been
audited. When it comes to sewage and refuse removal people have been charged at the wrong
tariffs. (Isaacs, 2012)
6.10.2 Willingness to pay
Households participating in the waste characterization study were answering the willingness
to pay survey. The results of the survey can be seen in Table 11.
Table 11. Results of the Willingness to pay survey. For the formal areas only households without a current waste
collection answered how much they were willing to pay for waste services.
Area Average
household
size
Current fees
(N$/month)
Number of
household
participating
with waste
collection
Willingness
to pay (N$)
Average
value
willingness
to pay
(N$)
Rundu
Informal 9 NA NA 50-500 201
Rundu
Formal 4 30-45 10 (50%) 15-450 105
The results indicate a higher willingness to pay for waste services than the current tariff.
Households from informal areas are surprisingly willing to pay nearly twice as much as the
household from the formal sector. The standard deviation for the willingness to pay survey
were 156 N$ for the informal areas and 179 N$ for the formal areas.
6.11 Result E: Practicies of waste collection and waste disposal in Kavango
The information of in this chapter is a summary of interviews, focus group discussion and
field observation and should be considered as a complement to the schematic map in Result
C. Statements about the waste management in interviews and focus group discussions are
utilized to the describe details in the waste management. When possible the statements have
been confirmed or rejected by field observations.
6.11.1 Waste collection in Kavango
Collection of waste is a luxury and is not provided to everyone: The communal collection
is limited to the formal areas of the towns Rundu and Nkurenkuru where it is performed by
the town councils. Kavango regional council also collect waste from the two settlements
Divundu and Ndiyona. In informal areas of Rundu and in the rural areas no formal collection
occurs. In those areas waste has to be dealt with in other ways. Field observations of open
dumping in the vicinity of living areas have been made, see Figure 23. An estimation based
on population statistics, from the latest consensus in 2011, is that waste services are offered to
30-50 % of the population.

57
Figure 23. Example of open dumping in Rundu. Photo taken the 13th of October 2012.
The town council lack adequate equipment to perform effective waste management: A
large number of dustbins have been purchased with the intention to increase the effectiveness
of the collection. However in Rundu it is not mandatory to have a dustbin and the town
council demands an extra fee for renting or selling the dustbin to the household. This has lead
to a slow process to get the dustbins out to the people. Households included in the communal
collection without dustbins have been observed. A large number of stored dustbins have also
been observed within the technical departments of Rundu and Divundu.
The town councils do not have enough collection vehicles to collect all waste. The existing
vehicles are not specified for waste collection and consist of smaller trucks. One skipper truck
exists to collect the nine containers which have been put out in areas in Rundu outside the
normal waste collection areas.
Waste is not collected from communal areas such as parks and the sport stadium: The
communal areas where waste is regularly collected are main streets and business area. In these
areas modified oil barrels are used for collection, see Figure 24. The capacities of the oil
barrels are limited and overflowing waste have been observed at several occasions in the
business areas. At an irregularly basis cleaning campaigns are performed. In the cleaning
campaign schools and the town council clean the city from the waste which not otherwise
collected. This has not been observed.
Waste is collected with the help of contractors: In order to cope with the demands of waste
services, the local authorities in Rundu, Divundu and Ndiyona uses contractors for collecting
waste. A number of eight contractors collect waste in Rundu and one contractor covers
Divundu and Ndiyona. In Rundu each contractor has a certain area from where they are
suppose to collect from. The contractor must have their own collection vehicle and staff.
Contractors collecting have been observed.

58
Figure 24. Collection from communal areas. Oil barrels are modified and painted and used as a collection bin. Photo
taken the 8th of September 2012
The waste collection is not effective due to frequent breakdowns: A common concern in
interviews with users of the waste management system is that waste collection is irregular due
to breakdowns of collection vehicles. Problems due to breakdowns can be avoided if back-up
vehicles are on standby. Field observations have confirmed that breakdowns do happen,
though backups for normal collection trucks can be arranged. However for special vehicles
like the skipper truck in Rundu, backups are hard to arrange. As a result breakdowns have a
tremendous effect on the possibilities of collecting waste from certain locations. In Figure 25
one of the containers which would normally be emptied by the skipper truck is overflow due
to a breakdown. It has not been possible to complete a quantification of the breakdowns.
Figure 25. Unattended container with surrounding waste. The photo is an example of problems during collection
vehicles breakdown. Photo taken the 17th of October.

59
6.11.2 Waste treatment
Kavango lack adequate waste disposal: There are four official dumping sites in the region,
one in each town and settlement.
Rundu Dumping site: Rundu dumping site is by far the biggest site. It is fenced and guarded
some hours of the day. There exist however no control over who come and dispose waste. It is
located a few kilometers west of town outside the informal area Sauyemwa. Waste is
unloaded by hand and normally burned to reduce the amount of waste and to avoid plastic
waste spreading to the vicinity areas. The dumping site has a bulldozer which is supposed to
make sure the site is in order and to push the waste into a manmade pit. There exists no
leachate or emission control of the dumping site. Field observations during several visits to
the dumping site confirmed the information given in the interviews. The bulldozer was also
found to be out of order and have been so for some time (estimated 6 months). As a
consequence the waste was scattered uncontrolled at the site.
Nkurenkuru Dumping site: Nkurenkuru have not yet created a permanent dumping site. A
temporary dumping site exists a few kilometers outside the town center. The area is neither
fenced nor guarded. During a field visit the waste were put into one large pile. Some signs of
burning were seen but some waste was left unburned as well.
Divundu and Ndiyona dumping sites: Divundu dumping site is located approximately 10 km
west of the settlement. The last part of the road is a several kilometer long sand road which is
difficult to access without a 4x4 wheel vehicle. The road was blocked by a couple of cut down
trees. The dumping site is not fenced or guarded. In the dumping site a manmade pit is used
for dumping and burning the waste. Recently, fire had spread from the burning of waste to the
surroundings of grass and bushes. During a field visit scattered waste outside the pit and piles
of older waste along the road were also discovered. No field visit was made to the Ndiyona
dumping site. Information from interviews describes the dumping site to be similar to
Divundu dumping site.
Some of the waste are recycled or reused
Namibia breweries limited, located in Windhoek, are the largest brewery in Namibia. They
have together with some of the supermarkets in Rundu introduced a return system for NBL
glass bottles in Kavango. The company offers 1 N$ for each of their returned bottle and an
extra 11 N$ for the crate. The bottles are shipped back to Windhoek for reuse via a communal
collection point. The transport is done by lorries. Only the NBL 750 ml bottles are valid in the
system. Quantification of the reuse has not been possible.
Information from interviews indicates that glass also is collected for recycling. An unknown
company based in Windhoek is said to buy broken glass. Collection and volume minimization
have been observed in Rundu. The recycling market in Namibia is limited and transportation
to South Africa is therefore necessary. The value of reclaimed materials at the South African
market can be seen in Table 12.

60
Table 12. Value of recovered material on the South African
market in year 2011. (Okavango basin management committee, 2012)
Material Value on South
Africa market (N$ /
tonne)
Plastic 648.00
Glass 106.66
Metal (cans) 396.00
Cardboard 199.50
Paper 501.04
People in the informal sector make a living out of waste in Kavango: The informal sector
is small, but exists. A group of women, with the size of 30 individuals, make some money
from scavenging at Rundu dumping site. They sort out glass, aluminium and iron and repack
it in plastic bags. According to a focus group discussion with the women their return is very
limited. A big bag of broken glass, which takes a couple of months to collect for two to three
people see Figure 26, gives them 60 N$ in return. This would give a monthly salary of only
10 N$ per person. This is an unbelievingly low salary. Even an increase of 25 times their
current salary would barely get the people above 1 US$ per day. A few numbers of people
collecting broken glass in the centre of Rundu have also been observed. An estimation based
on field observations gives an extra number of 10-20 people informally collecting recycling
material besides Rundu dumping site.
Figure 26. Informal collection of broken glass for recycling at Rundu dumping site. Photo taken the 10th of October.
No informal waste collection from households has been identified. In areas where the
communal collection is limited it would be possible with a complementary informal
collection. Since no such system was identified it is assumed that no other informal collection
is carried out on a larger scale.
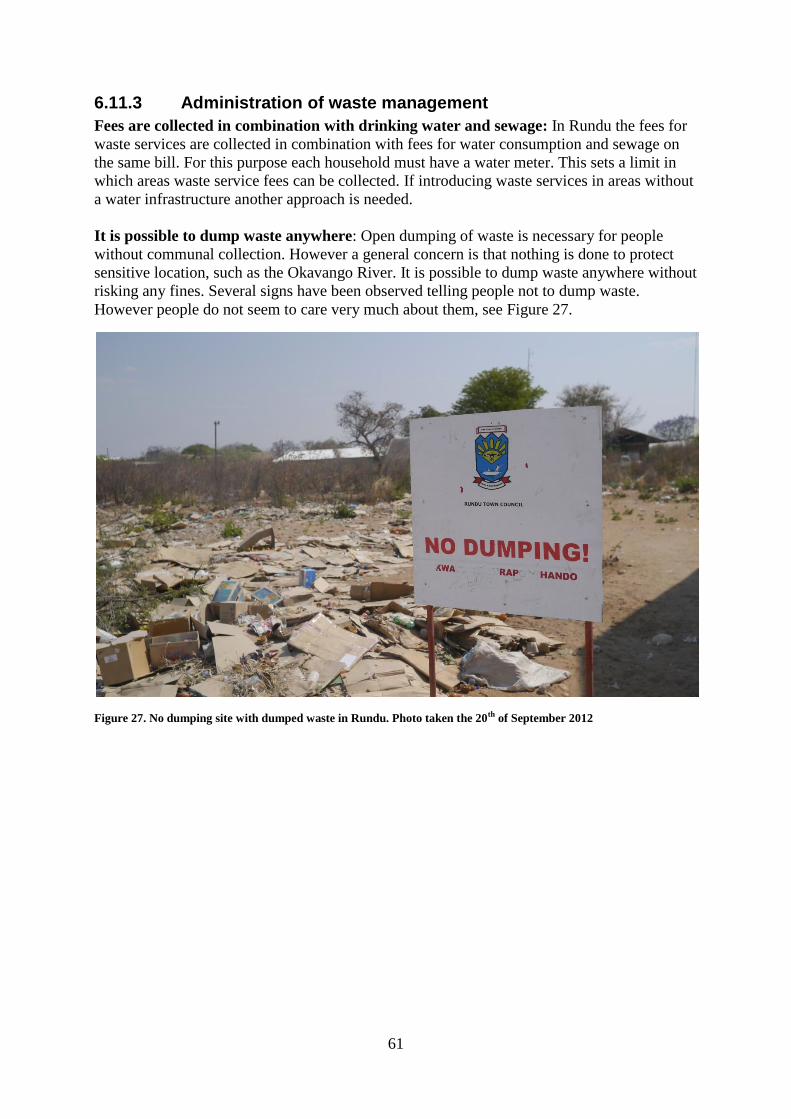
61
6.11.3 Administration of waste management
Fees are collected in combination with drinking water and sewage: In Rundu the fees for
waste services are collected in combination with fees for water consumption and sewage on
the same bill. For this purpose each household must have a water meter. This sets a limit in
which areas waste service fees can be collected. If introducing waste services in areas without
a water infrastructure another approach is needed.
It is possible to dump waste anywhere: Open dumping of waste is necessary for people
without communal collection. However a general concern is that nothing is done to protect
sensitive location, such as the Okavango River. It is possible to dump waste anywhere without
risking any fines. Several signs have been observed telling people not to dump waste.
However people do not seem to care very much about them, see Figure 27.
Figure 27. No dumping site with dumped waste in Rundu. Photo taken the 20th of September 2012

62
7 Sustainability analysis of waste management in Kavango
7.1 Is the waste management in Kavango sustainable?
Using the criteria for a sustainable sanitation system presented in chapter 4.4 the current waste
management is analysed from a sustainability perspective. The waste management is only
sustainable if it is possible to fulfil all of the criteria. Indications from previously results are
used to determine whether a criterion is satisfied. The analysis is summarized in Table 13.
Table 13. Summary of sustainability analysis.
Criteria for a sustainable waste
management
Is the
criteria
fulfilled?
= no
= yes
? = no data
Indications
It is functioning and being used From interviews (Result A) and
field observations (Result E) the
conclusion is made that waste
management is unreliable and
forces people to use other disposal
methods.
It is able to deliver appropriate level
of benefits (quality, quantity,
convenience, continuity, health) to all,
including the poorest
Since no waste collection exist in
the poor informal areas of Rundu
the criteria is not fulfilled.(Result
E)
It function over a prolonged period of
time (which goes beyond the life span
of the original equipment)
? No positive or negative indicators
have been identified.
Its management is institutionalized Waste management are performed
by town councils and regional
council. Informal waste treatment
exist, but at a limited scale.
Its operation, maintenance,
administrative and replacement costs
are covered at the local level
Even without administrative and
replacement costs, the direct
operating costs of waste
management in Rundu are higher
than the incomes (Result D).
It can be operated and maintained at
local level with limited but feasible
external support
Besides economical problems for
investments (Result D) and some
specialist knowledge, the current
system is managed with only
limited external support.
It does not affect the environment
negatively Inadequate waste disposal and
lack of collection system in
informal areas leads to negatively

63
environmental effect (Air
pollution, risk of fires, ground &
water pollution, animal
consumption)
7.2 Utilization of concepts for improving solid waste management
The concepts described in chapter 5.4 are in this chapter analysed from the local perspective
of Kavango region. The existence of the concepts in the current waste management, the
possibilities to introduce the concepts and possible environmental-, social- and economical
effects are discussed.
7.2.1 Integrated solid waste management
Lack of national legislation in the field of solid waste managment and lack of an existing
waste management plan for Kavango region are strong indications that an integrated solid
waste management approach have not been used in the past.
Estabilishing a waste management plan deeply rooted and accepted at the local authorities and
among the inhabitants, is seen as the most critical step for introducing a integrated solid waste
management. The waste management plan should also consider nontechnical aspects such as
social- and environmental effects of the waste management. The lack of proper national
legislation is a problem since aspects of waste management goes beyond the regional
boarders, e.g. recycling possiblities. The waste management plan should also set the road
forward for how the waste management should be improved in the future. Legsilation
deciding how the waste management is to be performed must be based on the will of the
people in combination with experties from the field and scientific knowledge.
From a sustainability view an integrated solid waste management approach can only be seen
as positive. Environmental, social and economical aspects are included already in the
legislation and planing phase of waste management, improving the possibility to create a
sustainable waste management. Moreover it is also seen as necessary with a sound national
legislation which create good administrative opportunities for the local authorities.
7.2.2 Public private partnerships
Today contractors are used for collection of waste in a substantial part of the formal areas.
The town councils and regional council decide which contractor to use through tenders. The
local authorities are therefore already today involved in public private partnerships in
collection of waste.
When it comes to the collection of waste, more private public partnerships might be difficult
to introduce. Since many areas in Rundu are without collection and people are willing to pay
for the service it might however be possible for private businesses to start up a wider
collection. Administrative issues such as how to collect fees must first be resolved.
Public private partnerships can be a way to increase the efficiency of waste collection and to
attract external founds through private investors. However in order to maintain a partnership
capacity building at local authorities is important. Firstly the right demands must be set for
tenders so the contractors fulfil the standards. Secondly the local authorities need a working
system for evaluating the contractors. Thirdly a good communication between the local
authorities and the contractors needs to be maintained in order to resolve issues in an effective

64
way. A proper working PPP would lead to less costs and new possibilities which can improve
the development of a sustainable waste management. However a poorly executed PPP can
lead to worse working conditions, a less effective waste collection, inadequate waste
treatment and a negative public opinion on waste management. Consequently PPP can be a
way to improve the economy in waste management, but must be carefully monitored by the
local authorities in order for the partnership to contribute towards a sustainable waste
management.
7.2.3 Integration of informal sector
Rundu town council has made small efforts to regulate the informal sector. This has led to
prevention of children at the Rundu dumping site. However the informal sector activity and
waste recovery is unregulated and not integrated.
An integration of the informal sector can be done in two different fields, collection and
treatment. It is possible as in the same way as described in the PPP introduced an informal
collection of waste in the informal areas and integrate that to the communal waste
management. No such activities have been identified, but if the opportunity would arise it
would be an opportunity to extend the communal waste collection to more people. For the
field of waste treatment integrating the informal sector can be performed in a scale from low
to high integration. At the lower end the group of women scavenging at the dumping site
would continue their business without local authorities’ interference. A good communication
would be needed so the dumping site can be properly managed but other issues as safety
equipment and selling the items would be done by the women themselves. At the other end a
waste management separation plan could be introduced, hiring the already experienced
women. Somewhere in the middle would perhaps be to continue the current scavenging but
combining that with job assignments such as monitoring the dumping site and make sure the
area outside the fence are clean from waste. In return the women could get safety equipment
and an extra salary.
Introducing informal collection in combination with communal collection points demands an
improved infrastructure of containers and skipper truck. The pressure on the dumping site
would also increase. However the extended collection would be beneficial for social and
environmental aspects. The possibilities to integrate the scavenging informal sector are
interesting for lowering the pressure of the dumping site and to increase the amount of waste
for recycling. The most important barriers for this would be the market for recovered
resources. Without a good market it would be impossible to expand the number of recyclable
items to also include other waste fractions beside glass and metal. It is also a question of the
amounts of waste. Are the amounts of waste high enough for creating an economical feasible
sorting plant? The environmental benefits of recycling waste are dependent of the needed
transportation distance and the material which the recycled items replace. For the informal
sector integration could lead to safer working conditions and possible higher incomes.
7.2.4 Decentralization
The waste is managed at an intermediate decentralization level in the region. The two towns
have their own town councils with responsibility for waste management and for the two
settlements Kavango regional council is responsible, with a local office in Divundu.
The waste management could be decentralized even further and especially in the informal
areas which is not included in the current waste collection. Finding an administrative and
organisation for this is perhaps a key issue.

65
A further decentralization could be a way to include more people in the waste collection
system and thereby decrease waste management negative effect on some environmental and
social aspects. One benefit is also that a successful decentralization would automatically
improve the awareness level of the public. A decentralized system could also find solutions to
the problem how to collect fees from people without water meters.

66
8 Discussion
8.1 Sources of error
When performing field studies a choice of method always has to be made. This must be done
carefully since choosing an inadequate combination of methods might end up with limited
results, or in worst case even false conclusions. Investigating waste management in a field
study has proven to be difficult due to the high number of aspects involved. A classical choice
of quantitative methods, such as waste characterization might be good to get an overview over
the waste and to monitor changes. Waste characterization demands however a lot of resources
in form of people and time. It has also been proven difficult to cover all population within a
waste characterization study since the normal collection rate is low in many developing
countries. In this study the issue was solved by introducing temporarily collection systems.
However this solution also affects the result, since people get aware of the study and possibly
change their habits. Three consequences which affect the results when introducing the
temporary collection system were:
People avoid throwing things in general since they do not want to participate in the
study. When introducing the household to the study only one member of the
household were present. It is possible that only parts of a household participate in the
study. The consequence of this is that the waste generation in Kavango can be
underestimated.
A free temporary system can be seen as an opportunity to get rid of old waste which is
not produced during the time of the study. The consequence of this can be an
overestimation of the waste generation in Kavango.
People avoid throwing away certain types of waste due to integrity issues,
misunderstanding instructions or a poorly planned collection operation. The
consequence of this might be false conclusions of the waste composition.
Out of the three cases above, the first and second case can be easily spotted as outliners. The
third case is harder to discover since the natural variation of waste from households, cover
small variations in waste composition. Another source of error in the waste characterization
study is the selection of samples. Due to lack of resources only 120 kilogram of approved
waste were characterized, which are a relatively small amount of waste. The low number of
participating household makes the result of the characterization less secure.
Another source of error which can be applied for both open ended interviews as well as for
waste characterization is the aspect of achieving representative selections. For the interviews
the selective aspect was the interviewee’s occupation. For example people were nominated to
be interviewed at local authorities only because of their occupation. The corresponding aspect
for waste characterization was living area. By balancing the selection in different
occupations/living areas the expectation is that the selected people/household are
representative. When the data sample is small the selection of people gets even more
important. Making radical conclusion based on quantified results should be done with caution
due to the low number of samples since even a small shift of balance of representative
samples affect the results.
Subjective consideration is unwanted in research. Avoiding subjective considerations
however, could lead to a less flexible research method. In this study it was necessary with an
adjustable research method which could be modified due to new information. A semi

67
structured interview enables for example the questions to be modified depending on the
interviewee. A subjective filter had also to be put on in the waste characterization study to
cope with flaws in the method. The aim has been to make as few subjective considerations as
possible. How subjectivity affect the results are impossible to measure in numbers but is
nevertheless an important source of error.
Interview methods are based on good communication between the interviewer and the
interviewee. To be able to get representative result the interviewer has to be observant when
interviewee does not tell all of the truth. Several times during the open ended interviews the
most interesting information was told after the interview ended. Even though such
information was not included in the results it did provide several new perspectives. The fact
that some information were kept from the interview itself is seen as an indication of
information suppression. Even though most answers felt honest and a good communication
were achieved with the interviewee it is impossible to know if all information were given.
Cultural differences between the interviewee and interviewer also contributes to
communication difficulties
8.2 General discussion
The main aim of this thesis was to investigate how sustainable waste management can be
achieved in developing countries. For several reason this was hard to accomplish. The
classification of countries in developing and developed countries was found to be inadequate
in the waste management field, since there is a vast range of level in development among the
countries normally referred to as developing countries. Despite the fact that no standard
classification of development exist, it is fair to say that the level of development affects
aspects such as local economy, level of education and industrialization. Even though no
statistically significant correlation was found between such aspects and waste generation in
this study, a general scientific opinion is that the level of development influence the waste
generation. As a consequence the waste generation and composition would also vary within
the group of developing countries. It is therefore not appropriate to claim that one single
solution could be enough for solving the waste management problems in developing
countries. In fact, the decentralization of waste characteristics which occur in all countries
also makes it difficult to use the same waste management methods even within all regions in a
country.
The issue of defining a sustainable waste management is also relevant for approaching the
main aim. If seeing sustainability as absolute, a solid waste management can only be one out
of two things; sustainable or unsustainable. The need for waste management, and perhaps
even more waste disposal, can be seen as a result of an unsustainable civilization. The
question then arises if waste management, from a sustainability perspective, can and should
be separated from the society itself. Even if an isolation of waste management is accepted
sustainability is problematic to evaluate. In an evaluation of sustainability only two results can
be given, yes or no. The result would be theoretical and not very useful for improving the
waste management. A suggestion is therefore to use continuous indicators to evaluate how far
from sustainable a solid waste management system is. In this study only absolute indicators
where identified. Developing continuous standard indicators of a sustainable waste
management would not only make evaluation of waste management systems easier but also
increase the awareness of sustainability aspects among people working with waste
management.

68
The nature of waste data is a problem for the field of statistical analysis. Definitions of waste
in national legislation differ from one country to another and waste characterization data can
have unsatisfying information about how data have been collected. Analyses which compare
data from different countries and from different studies have to be able to handle these
variations. In developing countries the choice of characterization method is crucial for the
results, since waste can be diverted by the informal sector. Depending on where in the waste
management system samples are taken the result would differ. On top of that, seasonal
variations can have an impact on the data. The consequences of the data variation are that
trends are difficult to spot and statistical valid conclusions impossible to make when
comparing data from different locations. In the literature review, chapter 5, a statistical
analysis of waste data from several countries was made. All of the waste data came from the
same report, which in turn had a number of sources. The results of the analysis were
statistically inconclusive even if some trends are indicated. It is possible that a correlation
between the living standard (HDI), Income level (GNI/capita), Urbanization and waste
generation exist even though it was not proven in this study. A better analysing method, and
perhaps a different perspective, is necessary to be able to make valid statistical conclusions.
Several drivers for improving the waste management were found in the literature review. The
drivers belongs to all three of the sustainability fields; social aspects, economy aspects and
environmental protection. Improving local waste management should be done with
consideration of as many drivers as possible. For a local authority with responsibility for
waste management this complexity might be difficult to comprehend. It is therefore necessary
with future initiatives and tools which can be used as a help at a local level. Some concepts
were found in literature for improving a waste management system. None of them might be
good enough for achieving a sustainable waste management alone. However all of the
concepts focus on important aspects of the waste management and a combination of concepts
could therefore be used to get a more comprehensive tool.
A repeating issue in this thesis is the difficulties of making scientific research on a global or
even national scale when it comes to waste management due to local differences. A
theoretical issue therefore exist whether knowledge how to improve waste management can
be utilized on a centralized scale when waste management itself are decentralized. This issue
are crucial for the conclusions of this thesis. Can the results and conclusions from the
Kavango region be extrapolated to developing countries as a whole? The answer to this
question is both yes and no. The solid waste situation varies in developing countries, both
when it comes to the character of waste and the economical-, social- and environmental-
aspects. Methods for working with solid waste in one part of the world might not work in
another part. However, the criteria for a sustainable waste management should be the same in
all parts of the world. It is possible to describe the objectives for improving waste
management in general terms, but the road to sustainability must be flexible and adoptable
everywhere.
8.3 Discussion Kavango
The case study focusing on the Kavango region resulted in a numerous of different results.
Some of the most important results are discussed below.
Interviews
Since a vast amount of information was given in the open ended interviews, an attempt has
been made to process the information to spot trends and to pinpoint the most important
information. A majority of the interviewed people shared the same view of how to define

69
waste. This might sound as a technicality, but if people do not agree up on what waste is, it is
difficult to work together to improve the waste management. How a person defining waste
can be seen as an indication of the awareness level and knowledge about waste. In line with
the Namibian legislation the usefulness aspect was the most commonly answer of how to
define waste. Nevertheless some people used other definitions or even had difficulties to give
an answer at all.
When it comes to waste as a problem for development a number of common aspects were
mentioned. Animals consuming waste, pollution of the river, dumping sites and a general
negative effect on the environment were the most common answers regarding environmental
aspects. Compared to less common answers such as ground water pollution, these are issues
visible for the public. For social aspects various issues connected to health were a common
answer. In a region as Kavango highly affected with diseases, e.g. HIV and malaria, the result
is not very surprising. People at local authorities have to deal with the health issues on a
regular basis and seems to have knowledge how to connect waste with the diseases. Only a
few people mentioned the burning of waste as a health problem. This is a problematic since
burning is the most common waste treatment option. Low knowledge about negative affects
reduces the possibility of people understanding the needs of improving the waste
management. People are more diverged when it comes to economical aspects. The most
common answers where either connected to the economical impact of dirty towns, costly
waste management or waste of resources. The impression of the answers is that the economy
of waste management is seen as a limit rather than a possibility. This perspective usually
comes back later in the interviews when discussing improvements and barriers.
In the interview a vast number of ways how to improve the waste management were
suggested. Many of them were connected to organisatorial and management issues, but not
the five most common suggestions; more transport vehicles, separate collection for some
waste streams, introduce recycling, better control over dumping sites and improving the
awareness level of the people. With the exception of a few common answers many of the
suggestion were only mention by one or two people. Hence there is no consensus of how the
waste management should be improved. Personal perspectives and experiences, lack of
knowledge and no obvious answers are all possible explanations of the diversity.
Insufficient funds where the most common suggested barrier for improvement. With this in
mind it is hard to understand why so few people mentioned economical aspects for improving
the waste management. People seem to take the need for external funding for granted. Three
other common answers were lack of capacity (human resources), lack of public awareness and
lack of legislation. This is all non-technical aspects which demands education and national
efforts to improve.
Waste Characterization
One of the major parts of the field work was the waste characterization study. The result
indicating that a quarter, or 26 weight %, of the waste in Kavango are organic waste and about
half the waste are material which can be recycled, such as paper, plastic, glass and metal. As a
relatively poor region in a developing country the proportion of organic waste was expected
to be higher. According to the theory poor regions produce fewer amounts of packages and
therefore a higher proportion of organic waste. This is based on an assumption of a self
sufficiency food production in the region. In Kavango some food are produced, but the region
still import processed food from other parts of the country and even more from South Africa.
This can be an explanation to the low proportion of organic waste.

70
The waste generation rates are low with an average value of 0.11 kilogram solid waste per
person and day. This cannot directly be compared to other statistics, since the waste
characterization study in this case only included waste directly collected from households.
Solid waste generated by smaller businesses and from public places is normally also included
in the municipality waste management and therefore part of most waste characterization
studies. Compared to world statistics for waste generation, only a few countries have an
average waste generation below 0.4 kilogram solid waste per person and day, see Figure 4. A
waste generation of 0.11 kilogram per person and day is very low even if the numbers for
Kavango region are incomplete. Another interesting aspect is the variation of waste
generation. Quite many households produce lower than the average amount, while a few
produce much more. The dynamics in waste generation is not well understood and an
interesting field for future research. When extrapolating the waste generation rates at a region
level, with perspective on the constituencies, the amounts of the generated waste is fairly
equal among the different constituencies, see Figure 20. The extrapolation is based on the
population level in the different constituencies. The density of generated waste is also
investigated with the result that Rundu Urban is by far the constituency with the highest
amount of generated waste per area. This could be used as an argument for concentrating
waste collection efforts to the Rundu urban area. A high density of generated waste would
lead to a higher pressure on the area in terms of health and environmental impacts. The
extrapolation does have limitations since population data were not found at a more detailed
level than constituencies. Some constituencies do have relatively high population density in
certain sub-areas.
Waste map
The schematic waste map is not an absolute description of the waste management in the
Kavango region. However four different aspects in the result are worth discussing. Firstly the
map shows all identified informal waste management activities, or at least activities outside
the municipal waste management. As can be seen the informal waste management are not
limited to scavenging of materials. Both other collection and dumping of waste occur without
going through the local authorities. This waste management are not institutionalized and are
therefore uncontrolled. Special consideration must be taken to include the uncontrolled waste
management if an improving program for waste management is put into place. Secondly the
map indicates a complexity of different waste activities. Many different participants handle
waste. Thirdly some examples of existing recycling systems exist. If a decision is made to
introduce a more comprehensive recycling system, the work of designing the system should
start by looking at the presents recycling activities and incorporate them. Fourthly hazardous
waste in form of medical waste is taken care of with consideration. However the same
consideration is not present when it comes to chemical waste. This is perhaps not a great
problem today, but plans for future establishment of industry plants demands a proper
handling of hazardous waste in order to avoid severe negatively impacts on the environment.
Economy
Unfortunately economy numbers where only identified for Rundu town council and the
numbers are inconclusive. Some direct costs of the waste management are presented but the
numbers are an underestimation since hidden and shared costs are omitted. However when
comparing the direct costs to the incomes from waste collection it is evident that a cost
recovery system is not in place. Including other costs makes the difference between the costs
and incomes even more obvious. It is a problem to create a cost recovery waste management
when the real costs are unknown. A first step to get the economy in order would therefore be
to make sure that the real costs are present for the solid waste management. This could be

71
done by changing the routine for budgeting and present activity based costs instead of only
including the aggregated division based numbers. From the willingness to pay study it is also
clear that households are in general willing to pay more than the current tariffs for services.
The willingness vary from one household to another and a recommendation is to perform a
larger survey to get good material for future tariff planning
Practices of waste collection and waste disposal in Kavango
The chapter describing the practices is a channel for including other aspects not included in
the other results. It was important to include this in the results to give a general description of
the waste management in the Kavango region. The chapter also presents necessary
information for the sustainability analysis in chapter 7. A few of the aspects are discussed
here.
A collection activity worth discussing is the cleaning campaigns. At a regular basis, areas
inside Rundu which are not included in the normal collection are cleaned in a cleaning
campaign. Schools and volunteers participate in the campaign. Besides a cleaner environment
the awareness level of waste also benefits from the activity. With appropriate precaution for
health issues increasing the occurrence of cleaning campaigns could be used to both increase
the collection range and to put waste issues on the agenda.
The disposal sites in the Kavango region are not up to international standards, not even to
national legislation. Without fences and leachate control, the dumping sites are easily
accessible and risks contaminating one of the most precious resources in Namibia, safe
drinking water. The burning of waste is a common procedure at the dumping sites and the
knowledge about the negative effects of burning is low. As mentioned in the discussion about
interviews, this is considered as a major issue for improving the waste management.
Some numbers are presented in Table 12 about the economical value of recovered materials.
The value of the resources not only sets the limit for which kind of material can be recycled,
but also how much the recycling activities are allowed to cost. Recovering material from the
Kavango region should be plausible to accomplish within the economical value of the
materials. Transporting the materials to the market in South Africa is decisive if a recycling
system can be put into place. The next step in designing a recycling system should be to
investigate why only glass is recycled today and to investigate how the recyclable waste can
be transported as cost efficient as possible.
Other
By using criteria, found in the literature, the waste management in Kavango have been
evaluated in the sustainability analysis in chapter 7. The criteria are not very detailed and a
certain level of informal judgement is needed for the assessment. Two out of eight criteria are
considered as fulfilled in the Kavango region. For one of the criteria not enough data is
collected to make an assessment. The waste management are not considered as sustainable
until all of the criteria are fulfilled. Consequently the current waste management in Kavango
is not considered as sustainable. By using the sustainability criteria approach areas in need of
improvements can be pinpointed. However sustainability criteria are not very useful as a tool
for work on improvements. For that a combination of developing goals, which are easy to
evaluate on regular basis, and a careful evaluation of activities made for improvements are
suggested.

72
All of the identified concepts for achieving a sustainable waste management are considered as
applicable for Kavango. In fact today already some aspects of the concepts are incorporated in
the waste management. One concept does not rule out another and actively working with the
different concepts is a possible way to achieve a sustainable waste management.

73
9 Conclusions and recommendations for future work The following conclusions are made from the literature review and the case study:
Significant correlations between the average waste generation rates and the living
standard, income level, urbanization and industrialization of countries could not be
confirmed. Finding international solid waste data of high quality was proven to be
difficult.
A hypothesis exists that solid wastes in developing countries consist of higher
proportions of organic waste than in developed countries. This could not be confirmed
neither in the literature nor the case study.
Solid waste management affect the three pillars of sustainable development; social
development, economical development and environmental protection. It is therefore
functional to use the term sustainability in the field of solid waste management.
The waste management in Kavango are not sustainable today, according to existing
predetermined sustainability criteria. A combination of poor efficiency, unable to cover
it owns cost and severe environmental impacts are some examples of why the current
system is not considered as sustainable.
Relatively low amounts of waste are generated from the households in Kavango.
Previously studies assume much higher amounts. This has to be considered when
deciding how to improve the system. The waste consists of relatively low amounts of
organic waste (26 %) and relatively high amounts of recyclable waste (> 50 %).
Interviewed people directly connected to the waste management have a moderate
awareness level. Most of the people are able to define waste, however the knowledge
about certain negative impacts of current waste management are low. The people do
not agree upon how the waste management should be improved. However most people
agree that insufficient funds and lack of capacity is the biggest barriers for
improvement.
Waste is generated across all of Kavango and no significant differences could be found
between people living in urban areas and people living in rural areas. However due to
the high population density in Rundu and its vicinity, it is likely that the negative
impacts of the waste management are largest there.
The low standard of the disposal methods as well as insufficient waste collection in the
informal areas of the Kavango region are seen as the two largest technical challenges in
the current waste management. The barriers for improving these areas are lack of
resources and knowledge about how to build safe dumping sites.
Several concepts for improving the solid waste management exist; integrated solid
waste management, public private partnerships, integration of the informal sector and
decentralization. The concepts address different technical and non-technical issues and
can be used together to improve the waste management.

74
9.1 Recommendations for future work: The process of improving solid waste management in Kavango
Improvement work in solid waste management should be regarded as continuous. The
improvement process in Figure 28 is based on the experiences and results from this study and is
one example of how the Kavango region can work to improve the most important challenges
in their solid waste management.
1st phase: Investigating the future:
1. Investigate and map the current situation, introduce regular measurement (waste
characterization studies)
2. Investigate top-down incitements from a national level (legislation, national solid
waste management planning and private recycling businesses) and collaboration
possibilities with other regions.
Figure 28. Example of improvement process for the Kavango region. The ten activities are divided into the three
phases, investigating the presence, defining the future and creating the future. The activities 1-3, or the first and second
phase are partly performed in this study, however repeating these steps are necessary to maintain the improvement
work up-to-date.
75
2nd
phase: Defining the future
3. Define aims for the solid waste management and the necessary improvements to
reach them.
3rd
phase: Creating the future
Non-technical improvements
4. Capacity building at local authorities. The main responsibility for improving the
waste management should be clarified and limited to a single institution or working
group
5. Awareness rising amongst the public about the impacts of inadequate solid waste
management
6. Investigate the possibilities for a cost-recovery system. This activity should start by
clarify the costs of solid waste management in budget processes.
7. Improve the existing private public partnerships, better communication with
contractors and incorporate backup plans to limit disturbances in collection services
8. Integrate the informal sector in the waste management system
Technical improvements
9. Decentralised technical solutions to increase the collection rate.
10. Improve the disposal sites (fencing, decrease the spreading of waste, issue of burning
and leachates, increase recycling).

76
References Ahmed, S. A. & Ali, M., 2004. Partnerships for solid waste management in developing
countries: linking theories to realities. Habitat International, Issue 28, pp. 467-479.
Bartone, C. R., Leite, L., Triche, T. & Schertenleib, R., 1991. Private sector participation in
municipal solid waste service: Experiences in Latin America. Waste Management &
Research, Issue 9, pp. 495-509.
Barton, J., Issaias, I. & Stentiford, E., 2008. Carbon - making the right decision for
developing countries. Waste Management, Issue 28, pp. 690-698.
Bernstein, J., 2004. Social Assessment and public participation in municipal solid waste
management, s.l.: Urban Evironment Thematic Group.
CIA, 2011. The World factbook - Urbanization. [Online]
Available at: https://www.cia.gov/library/publications/the-world-factbook/fields/2212.html
[Accessed 10 10 2012].
CIA, 2012. The World Factbook, GDP- Composition by sector. [Online]
Available at: https://www.cia.gov/library/publications/the-world-factbook/fields/2012.html
[Accessed 10 10 2012].
Cointreau-Levine, S., 1994. Private Sector Participation in Municpal Solid Waste Services in
Developing Countries, Washington: The World Bank.
Cointreau, S., 2006. Occupational and Environmental heath issues of solid waste
management, Washington: The world Bank.
Daskalopoulos, E., Badr, O. & Probert, S., 1998. An integrated approach to municipal solid
waste management. Resources, Conversation and Recycling, Issue 24, pp. 33-50.
Diaz, L. F., 1998. Institutional, Economic, and Human Resources Issues Associated with
Solid Waste Services in Latin America. Los Angeles, Asia-North-America Waste
Management Conference.
Environmental management act no.7, 2007. s.l.:s.n.
Hasheela, R., 2009. Municicpality Waste Management in Namibia: The Windhoek case study,
s.l.: Universidad Azteca.
Henry, R. K., Yongsheng, Z. & Jun, D., 2006. Municipal solid waste management challanges
in developing countries- Kenyan case study. Waste Management, Issue 26, pp. 92-100.
Henry, R. K., Yongsheng, Z. & Jun, D., 2006. Municipal solid waste management challenges
in developing countries- Kenyan case study. Waste Management, Issue 26, pp. 92-100.
Human Development Report Office, n.d. Human Development Index (HDI). [Online]
Available at: http://hdr.undp.org/en/statistics/hdi/
[Accessed 06 08 2012].
iC consulenten ZT GmbH, 2004. Methodology for the Analysis of Solid Waste (SWA-Tool),
s.l.: European Comission.
IRC, 2004. What is cost recovery?. [Online]
Available at: http://www.irc.nl/page/7584
[Accessed 26 11 2012].
Isaacs, D., 2012. Rundu finances in a mess. Namibian Sun, 8 10.

77
Kavango Regional Council, 2011. Main sources of income. [Online]
Available at: http://www.kavangorc.com.na/
[Accessed 7 September 2012].
Kavango regional Council, 2012. Application, Cooperation project between Kavango
Regional Council in Namibia and Vetlanda Municipality. s.l.:s.n.
Medina, M., 2010. Solid Wastes, Poverty and the Environment in Developing Country Citires,
s.l.: UNU-WIDER.
Mendelsohn, J., 2009. Land Use in Kavango: Past, Present and Future, s.l.: Raison.
Mendelsohn, J. & el Obeid, S., 2003. Sand and Water A profile of the Kavango Region. Cape
Town: Struik Publishers.
Ministry of health and social service, 2010. National waste management plan. Windhoek: s.n.
National Planing Comission, 2012. Namibia 2011 population and housing census prilimenary
results, Windhoek: s.n.
Nelson, L. N., Franklin, J. A. & Joseph, A. S., 2009. Environemntal engineering:
environmental health and safety for municipal infrastructure, land use and planning, and
industry. 6th ed. s.l.:John Wiley & Sons.
Nemerow, N. L., Agardy, F. J. & Salvato, J. A., 2009. Environmental Engineering:
Environmental Health and Safety for Municipal Infrastructure, Land Use and Planning, and
Industry. s.l.:John Wiley & Sons.
Newenhouse, S. & Schmit, J., 2000. Qualitative methods add value to waste characterization
studies. Waste Management Res, Volume 18, pp. 105-114.
Nielsen, L., 2011. IMF Working paper; Classification of Countries Based on their Level of
Development, s.l.: s.n.
Okavango basin management committee, 2012. Situation overview, OKBMC profiling study
consultitative meeting. Rundu: s.n.
Pollution Control and Waste Management Bill, third draft, 2003. s.l.:s.n.
River Eman Catchment Management Association, 2012. Cooperation project between
Kavango Regional Council in Namibia and Vetlanda municipality in Sweden, s.l.: s.n.
Rosenfeld, P. E. & Feng, L., 2011. Risks of hazardous wastes. 1st ed. Oxford: Elsevier Inc.
Rundu Town Council, 2007. Intergrated waste management system - feasibility study, s.l.: s.n.
RVF, 2005. Manual för plockanalys av hushållsavfall (RVF UTVECKLING 2005:19), s.l.:
s.n.
Schübeler, P., 1996. Conceptual Framework for Municipal Solid aste Management in Low-
Income Countries, St. Galen: SKAT.
Sembring, E. & Nittivattananon, V., 2010. Sustainable solid waste management toward an
inclusive sociiety: Integration of the informal sector. Resources, Conversion and Recycling,
Issue 54, pp. 802-809.
Solid Waste Management Division, 2008. Audit Report October-November, Windhoek: s.n.
Teddie, C. & Tashakkori, A., 2009. Foundations of mixed methods research. s.l.:SAGE
Publications.
78
The World Bank, 2012. Data, GNI Atlas Method. [Online]
Available at: http://data.worldbank.org/indicator/NY.GNP.ATLS.CD?display=default
[Accessed 10 10 2012].
The World Bank, 2012. What a Waste - a global review of solid waste management,
Washington: s.n.
The World Bank, n.d. How we classifie countries. [Online]
Available at: http://data.worldbank.org/about/country-classifications
[Accessed 06 08 2012].
Troschinetz, A. M. & Mihelcic, J. R., 2009. Sustainable recycling of municipal solid waste in
developing countries. Waste Management, Issue 29, pp. 915-923.
UN - Genereal Assembly, 2005. 2005 World Summit Outcome, s.l.: s.n.
UN, 2012. Our Common Future, s.l.: s.n.
UNDP, 2011. Human Development Report, New York: UNDP.
United Nations Environment Program, 2005. Solid Waste Management, s.l.: s.n.
United Nations Environmental Program, 2010. Waste and Climate change, Osaka: UNEP.
White, P., Franke, M. & Hindle, P., 1999. Integrated Solid Waste Management: A Lifecycle
Inventory. s.l.:Springer.
Wibeck, V., 2010. Fokusgrupper - Om fokuserade gruppintervjuer som undersökningsmetod.
2:3 ed. Lund: Studentlitteratur.
Wilson, D. C., 2007. Development drivers for waste management. Waste Management
Research, Issue 25, pp. 198-207.
Wilson, D. C. et al., 2012. Comparative analysis of solid waste management in 20 cities.
Waste Management & Research, Issue 30, pp. 237-254.
Wilson, D. C., Velis, C. & Cheeseman, C., 2006. Role of Informal Sector recycing in waste
management in developing countries. Habitat International, Issue 30, pp. 797-808.
World Trade Organization, n.d. Who are the developing countries in the WTO?. [Online]
Available at: http://www.wto.org/english/tratop_e/devel_e/d1who_e.htm
[Accessed 06 08 2012].
Zurbrügg, C., 2002. Urban solid waste in Low-Income countries of Asia - How to cope with
the garbage crises. Durban: s.n.
Zurbrügg, C. & Schertenleib, R., 1998. Main problems and issuses of municipal solid waste
management in developing countries with emphasis on provblems related to disposal by
landfill, s.l.: s.n.

79
Appendix A: Open ended interviews Two different interview plans were used depending on which category of supplier and user of
waste services the interviewee belonged to.
Interview plan, supplier
Introduction question
What is waste? Exemplify
Topic 1: Waste as a problem for development
In what way is waste a problem for Rundu/Nkurenkuru/Kavngo region?
Why does this problem exist?
What are the environmental impacts of the current waste management
What are the social impacts of the current waste management?
What are the economical impacts of the current waste management?
Topic 2: Waste generation and characteristics
What activities here in Rundu/Nkurenkuru/the Kavango region generate Waste?
What kind of waste is generated from the activites?
Which activities produce waste harmful for the public health and environment, i.e. hazardous
waste?
Topic 3: Waste Collection and treatment
Which services do Rundu/Nkurenkuru/the Kavango region, offer its citizens when it comes to
waste?
How is waste collected in Rundu/Nkurenkuru/the Kavango region?
In which areas are waste not collected?
Who collect?
Formal/Informal?
Topic 4: Possible improvements of waste management
How could the waste management be improved in the future?
What are the barriers for such a development?
Ending
This was all my prepared questions for this interview, do you have anything you want to add
about the waste management in Rundu/Nkurenkuru/Kavango region?
Thank you!

80
Interview plan, user
Introduction question
What is waste?
Exemplify
Topic 1: Waste as a problem for development
How is waste a problem for you?
Why does this problem exist?
Topic 2: Waste generation and characteristics
What kind of waste do you generate here?
Exemplify
Do you produce any waste which is harmful for people or the environment?
Topic 3: Waste Collection and treatment
How do you get rid of your waste?
Which services do Rundu TC/Nkurenkuru TC/the Kavango region, offer you when it comes
to waste?
Do you pay anything to get rid of the waste today?
How much would you be willing to pay for waste collection?
Topic 4: Possible improvements of waste management
How could the waste management be improved in the future?
Ending
This was all my prepared questions for this interview, do you have anything you want to add
about your waste management or the general waste management in
Rundu/Nkurenkuru/Kavango region?
Thank you!

81
Data analysis The interview answers were transcript and categorized into the following categories:
Waste generation
Waste collection, treatment and disposal
Waste characteristics
Informal worker
Other
To be able to quantify the results, further analysis was necessary. Relevant information for the
following topics were identified and made available for quantification:
What is waste?
Waste as a problem for development
Possible improvements of waste management
Barriers for improvement
Waste generation Interview
ID Relevance Waste is just to do with dispose of products that have less economic value. They
can be disposed of, some can be recycled. Normally it is things that just have to
be isolated from the other environment to insure that people maintain a healthy
and clean environment. I3
Things that have lost value, the usage time the lifecycle time is over. Things
become absolute you cannot use it again, and it becomes waste I4 Waste is the disposal of material which is not in use. I13 Waste to my own understanding is everything which is in no use to humans. It
cannot be used otherwise, maybe recycled to be reused. I14 Waste in my own understanding is any unwanted materials or any unuseful
things which needs to be disposed of is part of waste perspective I15
In my own understanding waste are products no longer useful, offspring of the
original products. It needs to be carried away where it can be disposed. I16 Waste is normally like something which is not usable again or which has been
used already and it cannot be used again. Then it is a waste product.
I17 The refuses and waste products you see at our houses. I17 Waste is something which is no more in use,
U18 Waste is like bad thing likes paper tins and bottles that paper throwing on the
roads or on the houses of the people. I19
Normally what we use to do is to get people to do stock rotation. U21
Most of the waste is just ignored. People take things which will expire 2-3 years
instead of the one which expire in a couple of months.
U21 The expiring dates are very important. We are happy with the system.
U21

82
A place like this, Rundu, the people are there. If you have stock they will buy. U21
You found various type waste. Some might only affect the environment, some
might even affect the environment. Even properly even uncontrolled waste can
in settlements were people lives the animals can come and consume which can
cause deaths. I1
I live in a community just south of this town in an informal settlement. We
struggle to cope with waste. Everywhere it is just waste. It might be a problem
here in town, but is more of a problem in the informal settlements. I3
The waste is a result of the residents. There is a lot of littering going on. People
just throw waste where they want. I14
I cannot say waste is a problem, it depends on the costumers. When you have
costumers you don’t have waste.
U21 There are a number of things generating waste. One is people and toilets. One is
people buying bottles which they throw as they go.
I1
Shops, business buy in bulk, the plastic they might just throw them away. And
also the plastics, when people go and buy an put items in the plastics. When
people go they wouldn’t dispose them well. They just leave them there. And
also the schools, they just books. When the books become absolute they must
dispose them in the waste. I1
The biggest waste generation is coming from the commodities that we are
buying, in the forms of food items, cans, plastic, paper. It is mostly coming from
the shops. So the households are buying these items. After usage we have a lot
of waste that needs to be disposed. Those are mainly where it is coming from,
from the household as well of shops. If you see on a weekly basis the collection
of waste, there are larger amounts that are coming from the shops. Larger
amounts of bottles, of empty liquor that has been used, that is mostly coming
from bottle store. I think in this region that is how it is being produced. I2
Particularly from the clinics and the hospital that is from where these type of
waste is coming from (ref. to hazardous waste), even though I cannot classify
the exact items
I2
The activities range from various factors. Some of them includes households
products that we consume. It has to do with things that you buy from the shop.
You use plastic bags, caned products, bottled products, including packaging of
some sort. At the end of the day this things that are used on a regular, high rate,
you have them only monthly weekly daily bases you have to discard them after
use. I3
Other waste has to do with commercial waste from offices, work places,
hospitals, shops. The shops are always shipping or bringing in a lot of volumes
of boxes/containers which thay have to pile and stock in the shop. In the end of
the day they have to discard the packaging material.
I3
Other products have to do with old clothing, hair products, beauty products for
those use makeup. It is just a lot. These things that people find difficult to deal
with when it comes to dispose it at sites where it can not affect the environment.
I3
Other has also to do with byproducts, cycles from material like wood. If people
is doing something with three/timber there is always byproducts which you need
to dispose of. The sources is endless. I3
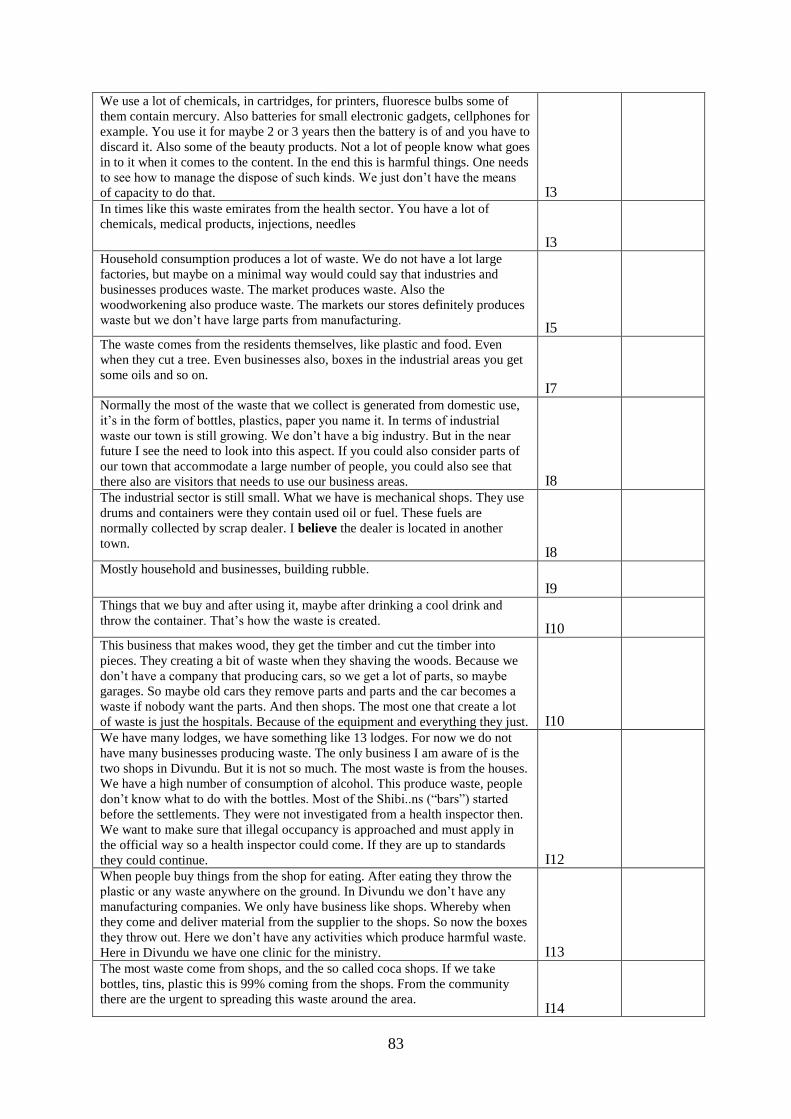
83
We use a lot of chemicals, in cartridges, for printers, fluoresce bulbs some of
them contain mercury. Also batteries for small electronic gadgets, cellphones for
example. You use it for maybe 2 or 3 years then the battery is of and you have to
discard it. Also some of the beauty products. Not a lot of people know what goes
in to it when it comes to the content. In the end this is harmful things. One needs
to see how to manage the dispose of such kinds. We just don’t have the means
of capacity to do that. I3
In times like this waste emirates from the health sector. You have a lot of
chemicals, medical products, injections, needles
I3
Household consumption produces a lot of waste. We do not have a lot large
factories, but maybe on a minimal way would could say that industries and
businesses produces waste. The market produces waste. Also the
woodworkening also produce waste. The markets our stores definitely produces
waste but we don’t have large parts from manufacturing. I5
The waste comes from the residents themselves, like plastic and food. Even
when they cut a tree. Even businesses also, boxes in the industrial areas you get
some oils and so on. I7
Normally the most of the waste that we collect is generated from domestic use,
it’s in the form of bottles, plastics, paper you name it. In terms of industrial
waste our town is still growing. We don’t have a big industry. But in the near
future I see the need to look into this aspect. If you could also consider parts of
our town that accommodate a large number of people, you could also see that
there also are visitors that needs to use our business areas. I8
The industrial sector is still small. What we have is mechanical shops. They use
drums and containers were they contain used oil or fuel. These fuels are
normally collected by scrap dealer. I believe the dealer is located in another
town. I8
Mostly household and businesses, building rubble.
I9
Things that we buy and after using it, maybe after drinking a cool drink and
throw the container. That’s how the waste is created. I10
This business that makes wood, they get the timber and cut the timber into
pieces. They creating a bit of waste when they shaving the woods. Because we
don’t have a company that producing cars, so we get a lot of parts, so maybe
garages. So maybe old cars they remove parts and parts and the car becomes a
waste if nobody want the parts. And then shops. The most one that create a lot
of waste is just the hospitals. Because of the equipment and everything they just. I10
We have many lodges, we have something like 13 lodges. For now we do not
have many businesses producing waste. The only business I am aware of is the
two shops in Divundu. But it is not so much. The most waste is from the houses.
We have a high number of consumption of alcohol. This produce waste, people
don’t know what to do with the bottles. Most of the Shibi..ns (“bars”) started
before the settlements. They were not investigated from a health inspector then.
We want to make sure that illegal occupancy is approached and must apply in
the official way so a health inspector could come. If they are up to standards
they could continue. I12
When people buy things from the shop for eating. After eating they throw the
plastic or any waste anywhere on the ground. In Divundu we don’t have any
manufacturing companies. We only have business like shops. Whereby when
they come and deliver material from the supplier to the shops. So now the boxes
they throw out. Here we don’t have any activities which produce harmful waste.
Here in Divundu we have one clinic for the ministry. I13
The most waste come from shops, and the so called coca shops. If we take
bottles, tins, plastic this is 99% coming from the shops. From the community
there are the urgent to spreading this waste around the area. I14

84
We have industrial waste when construction companies producing waste like the
left overs of the building materials, rubbers etc. Domestic waste like grass and
trees they want to be disposed of and also the food leftovers. The paperwork like
the offices, unwanted paper we also need to manage this kind of waste. We have
also business complex were they also various kind of waste, papers, bottles, tins
etc. That is the bulk in our town. They are producing a lot. I15
At the moment Nkurenkuru is a newly established town. We have some
activities producing hazardous waste but not very much. But since the industries
are coming we will have that problem. Here and there you could look at the
health centre we have some hazardous waste they produce. But they have their
managing that waste. In the future when will have industrial areas I think we
will have that kind of problem. I15
The waste normally comes from households, hospitals and other institutions.
Government institutions, schools, churches and so on. We don’t have industries
here yet. I16
For now there are no activities which produce hazardous waste. The only thing I
could think of is the hospital. They are having some medical disposal goods that
can be harmful. Appart from that I don’t know about any other. I16
Normally the waste comes from the shops; some is coming from the people who
uses the plastic or bottles and they use throw it there.
I17
Normally since up to now we don’t have any business which produces
hazardous waste.
I17
The dust waste comes from come from like the fabrics if they are burning and
car gas.
I19
Only shops, industries we don’t have here.
I19
It come from if people burning something. If you go to the bush people are
burning the bush, the gases from there is dangerous.
I19
We generate food stuff, which are not used, tins, bottles and cardboard boxes.
Basically anything which you can find in the kitchen and the bar.
U20
Over the weekend you have a tremendous amount of waste. U20
Sometimes you think this is end of the month I need to make more, but you
don’t get more costumers, so It is where you end up with more waste. U21
Waste is something uncontrollable most of the time U21
Waste is a normal thing, no waste = no business. U21
Normally things have expiring dates, so when it is expired, it is waste. Then you
remove it, procedure follow and you call for the town council to come and
collect.
U21
The amounts depends, it is just up, down, down sometimes. U21
The metal we don’t throw away unless it is rubbish, caboxes and those things in
paper, but the metal we put on the scrap yard. We have our own scrap yard. We
sell things, chokes, brakes etc. It is easy to sell. U22
We are not throwing anyway from the cars, just like maybe broken cables. U22
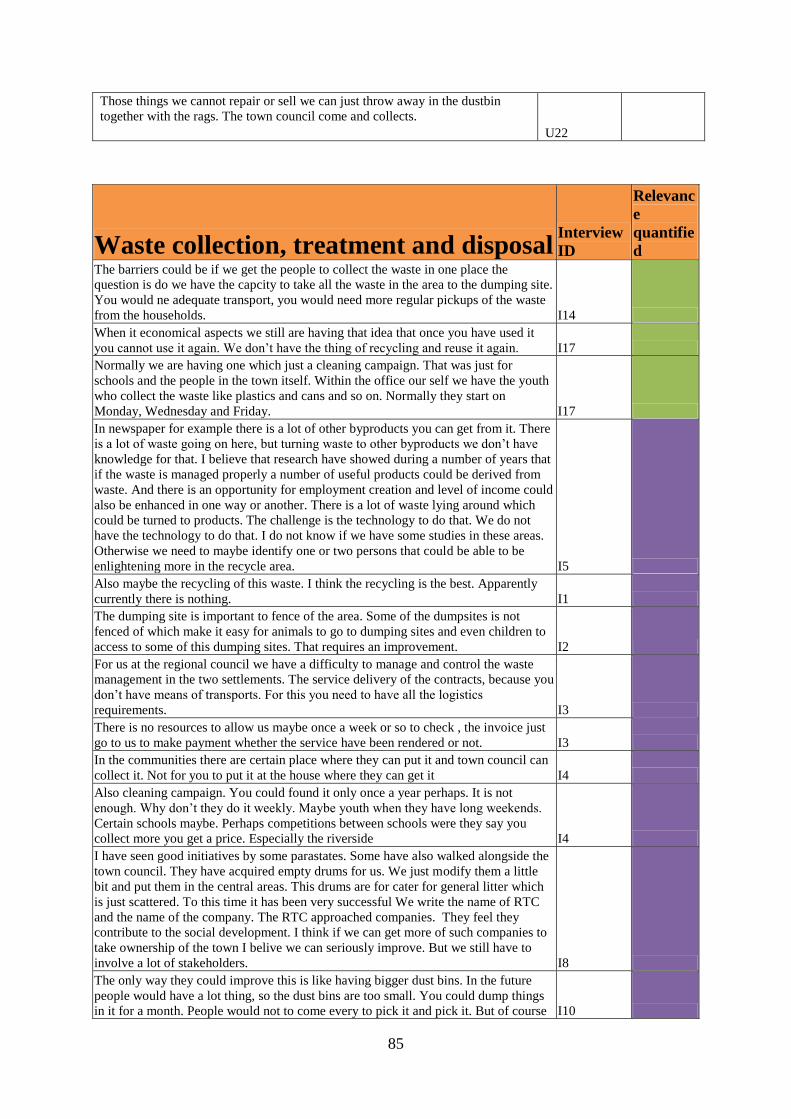
85
Those things we cannot repair or sell we can just throw away in the dustbin
together with the rags. The town council come and collects.
U22
Waste collection, treatment and disposal Interview
ID
Relevanc
e
quantifie
d The barriers could be if we get the people to collect the waste in one place the
question is do we have the capcity to take all the waste in the area to the dumping site.
You would ne adequate transport, you would need more regular pickups of the waste
from the households. I14
When it economical aspects we still are having that idea that once you have used it
you cannot use it again. We don’t have the thing of recycling and reuse it again. I17
Normally we are having one which just a cleaning campaign. That was just for
schools and the people in the town itself. Within the office our self we have the youth
who collect the waste like plastics and cans and so on. Normally they start on
Monday, Wednesday and Friday. I17
In newspaper for example there is a lot of other byproducts you can get from it. There
is a lot of waste going on here, but turning waste to other byproducts we don’t have
knowledge for that. I believe that research have showed during a number of years that
if the waste is managed properly a number of useful products could be derived from
waste. And there is an opportunity for employment creation and level of income could
also be enhanced in one way or another. There is a lot of waste lying around which
could be turned to products. The challenge is the technology to do that. We do not
have the technology to do that. I do not know if we have some studies in these areas.
Otherwise we need to maybe identify one or two persons that could be able to be
enlightening more in the recycle area. I5
Also maybe the recycling of this waste. I think the recycling is the best. Apparently
currently there is nothing. I1
The dumping site is important to fence of the area. Some of the dumpsites is not
fenced of which make it easy for animals to go to dumping sites and even children to
access to some of this dumping sites. That requires an improvement. I2
For us at the regional council we have a difficulty to manage and control the waste
management in the two settlements. The service delivery of the contracts, because you
don’t have means of transports. For this you need to have all the logistics
requirements. I3
There is no resources to allow us maybe once a week or so to check , the invoice just
go to us to make payment whether the service have been rendered or not. I3
In the communities there are certain place where they can put it and town council can
collect it. Not for you to put it at the house where they can get it I4
Also cleaning campaign. You could found it only once a year perhaps. It is not
enough. Why don’t they do it weekly. Maybe youth when they have long weekends.
Certain schools maybe. Perhaps competitions between schools were they say you
collect more you get a price. Especially the riverside I4
I have seen good initiatives by some parastates. Some have also walked alongside the
town council. They have acquired empty drums for us. We just modify them a little
bit and put them in the central areas. This drums are for cater for general litter which
is just scattered. To this time it has been very successful We write the name of RTC
and the name of the company. The RTC approached companies. They feel they
contribute to the social development. I think if we can get more of such companies to
take ownership of the town I belive we can seriously improve. But we still have to
involve a lot of stakeholders. I8
The only way they could improve this is like having bigger dust bins. In the future
people would have a lot thing, so the dust bins are too small. You could dump things
in it for a month. People would not to come every to pick it and pick it. But of course I10

86
it is dangerous as well because you could not have waste for a long time.
The people themselves and the house they need to be advised how waste can be
dangerous for their lives. They need another dust bin where they could put different
glasses. They have provided a lot of places for dumping; At least there have to be a
place, like a dust bin where they put certain waste, like glasses. The people who
would come and pick up glasses would glasses. The people would be different. It is
dangerous when you pick up all waste in the same time when you don’t know what it
is in the waste. I10
The truck parks and there is one person who pull the dust bin. The person and a
assistant empty the waste in the truck and there people on the truck to push the waste
forward. The work condition could be improved if the waste was separated waste in
the houses it would be ok. Then all people don’t need masks and so on. Like the waste
that has to be recycled. They could collect waste and perhaps boils the waste. I10
They should also have different dumping sites for different types of things. It is risky
for the contractors when everything is dumped on one site. I10
We have talked about fencing of the area and also to make sure the contractor burn of
the waste immediately in order not to leave them to be exposed, to fly. We have
compiled a report to the deputy director and are waiting for response, are they going
to consider fence of the area? And are they going to assist us digging the hole. But
even if we fence the area of there are no security there. We should expect the fence to
disappear. Hopefully if it would be possible we need to allocate somebody, even only
daytime security to look after the place. I12
Apart from that we also should consider how to approach a recycling system. It will
not help if you only dump and dump and things are pilling. In the end you will not
have any land. Right now that is what you are seeing. The waste is already being
pilling in the dug hole in the dumping site so now we need to dig another hole, but we
will not have enough area to dig every now and then. So the best option is to start
what we are doing already and se have the place can be secured. You now even kids
have access to the waste. You now if kids go there they would even use items from
the hospital. I12
I think we should start from the national level with recycling.
I12
The only way to improve the waste management in the future is to procuring a truck
in Divundu settlement and employs a driver for the truck and also to fence the
dumping area so that this truck would be working on daily bases from Monday to
Friday. Then it would be no way for the animals or children enter the dumping area
because it would be fenced with a gate. That is how the waste management in
Divundu could be improved. I13
Normally as we are speaking now our dumping site is getting full. In top of that again
it is good if we start separating the waste. Bottles might be aside and the boxes might
be set aside. I17
Another thing again it would be good to cover the place with a fence, even though it is
very far. There are people who would attempt to go there. To avoid disease it would
be very good to keep people from the dumping site. Fence and separating that would
be very good. I17
Just to keep it working all the time. We also need an incinerator here in the future so it
is not needed to ship the waste to the district hospital. U18
If the waste is not properly disposed it would of course probelrbly cause diseases
which will affect the productivity level of the people. Also their health. I 1
It is becoming a health hazard because we have problem in terms of waste
management. I have been lucky to see how it is done elsewhere, but for us we just
have an area identified and then it becomes a dumping side. With our dumping sites
you would find a lot of flies. These areas are smelly, the areas becoming too small
because af the amounts of waste. I2
Another problem is if you travel around in Rundu town you se a lot of littering. That
is becoming a problem in the sense that the town is becoming dirty. So it has a
financially implication because insuring the town is clean it becomes costly by the end
of the day. That is how it becoming a problem for us because it require money for use
to maintain or manage the waste. In this of what we are not do probably because of I2

87
lack of machinery and other things.
Even the environment is becoming affected. In a regional level it is not yet that
significant, except for what I have mentioned. In terms of finding dumping sites, that
has become a problem already. You go to our river where most of our people go, it
becomes a environmental problem because even the river becomes polluted with
waste. The areas have becoming polluted with most of the waste. The carrying
capacity on a daily there are large amounts of waste being produced. The waste areas
are limited. I2
One thing is also people can try to manage waste in a household level, but where do
you dispose it? It is one of the biggest challenges. The town council cannot coup with
the demand of it. Even if you are able to manage it in refuse bin but the end of the day
where are you going to dispose it? IF there was maybe some equipment, materials that
can be used to take this thing away by the town council and take it away to certain
disposal sites it would be better, but you just have to coup with it. In the end of the
day it is also affecting the neighborhood and environment. I3
We are involved in waste management in that way that refuses removal is function
that is done by the regional council itself. So we having contracts to remove waste
from our settlements areas. Not much is been done in that area, the waste is just taken
to identified dumping areas. What do we do with the waste that we collect to recycle
or maybe produce some byproducts from that? What we at the regional council
thinking now is that area is taking away from us. The one we are getting (Money??)
for the dust bin removal is limited. Maybe we can turn that into more diversified way
of merging it I think it will be okay. I5
That is her primary business (ref. to person recycling bottles). She have bought herself
a small truck and she will go to the lands in every part of Kavango and pack it, and
then it comes people from Windhoek to collect it, big trucks. That is just how she
makes her money, it is really lucrative. I5
We need more recycling things that can be reused again instead of it be throw away,
to save more and keep the town clean. I6
We are using overalls and gloves and the moth protection and boots. But we have
medically checkup. This year we did not go. It is the same for the contractors. I7
Here in Rundu it is difficult, you see people burning there, and it is too close to the
people it is not good. I7
The impact on the environment is quite negative in a sense that even the dumping site
is not up to standards. I feel that we can do more to have a proper dumping site. Then
we can also maybe bring in measures that can allow us to sort or arrange the waste
into different categories. And then we could also maybe consider the possibility to
recycle some waste. Since we don’t have a proper dumping site what we are doing is
not acceptable. I8
We don’t have a proper way to store the waste. And how to recycle it, just dump it
and nothing really happens to it, it just piles up I9
Some of the things are supposed to be recycled. We won’t get enough things to be
recycled to make another production and another job. When the waste is there you
need to recruit or get people to collect it. So the waste is good for people that are
unemployed, so the money stays with them. So it s utilized, its benefits for everyone
as it well create job creations. I10
Roads and dumping site. The roads are not so nice, but we do it.
I11
We burn the waste out, but there are no people staying close to the dumping site. We
dig holes, than we dump it and after dumping we burn it out. We stand and look after
the fire, sometime the wind is to strong and can take the fire out. When the blow it can
take the fire out to the grass so we monitor. The lodges do it by their own. Then they
came with the tractor and trailer. They dumped it and burned it but they never stay.
The whole area was burning. It was good that the government put in that the tender is
now responsible if something happens. We had a problem a few months ago. The
chief of the area came to us and asked what happened and say that you people where
responsible. We asked him when the fire started and he said it started on Sunday. It
was too far from when we where there. The people don’t put it in the whole, they just
do it on the sides and then they just burn it. I11

88
Some of the private people dumped it on the road. If they don’t have a 4x4 they can’t
reach the dumping site. I don’t think there is a good control over the transport used
when a tender either. They should inspect the vehicle. It is not a problem even if you
have a 2x4 if you the work proper. But everybody doesn’t do that. I11
If you go to the dumping site just look at what happens with the tree. They are just
everywhere and they have no concern. They just cut down trees on the road. I11
In case of Nkurenkuru I believe there is a challenge for us in terms of waste
management, particularly in terms of we don’t have a proper dumping site. As a result
every type of waste is disposed or thrown in one site. That alone I believe is a
challenge for Nkurenkuru town council. I16
In terms of the management itself from the councils perspectives there are costs
involved. They are making use of vehicles which are making use of manpower, fuel
and maintenance. Even though the return is necessary based on a cost-recovery
because most of the people the council is charging lives in town. But the waste
coming in the town is not necersary only from the residents of the town, because the
town is a center for all the area. So most people come to town for shopping and so on,
they throw the waste. As a result we spend money and time for collecting waste and
keeping the town clean. That money we collect from refuse removal is only based on
the number of property owners in town while the waste is not only generated from the
residents. The money we collect does not cover all of the operation. The people might
not pay all the money on monthly bases. They might have some problem to pay us, as
a result of these operations are subsidized by the council. I16
We need to have the waste removed twice a week. And irreverable we need to phone
for them to come here. If it was not for miss Muyo I think rubbish would have been
right through our door really. The town council are not up to it, but if I phone her they
will inventible come. U20
They are suppose to come twice a week but they don’t. They are suppose to come on
Monday and Friday. But then they don’t come on the Friday and then we have rubbish
where we don’t want rubbish. U20
Ever since a while we have had this problem because they don’t have enough removal
transport and as far as I am concerned they don’t have fixed schedules. Because if I
phone on a Friday and ask them please remove the waste they will come here but not
anywhere around. U20
The economical impact of waste is that what we are reading it might be if properly
managed waste can be an asset. It might even sell to those who want to use it for
gardens. It might also generate an income. I 1
In Rundu the town Council probably have a program were they have distributed waste
bins were people can throw papers were they can be collected and disposed. I1
In our case of the settlements, we have two settlements that were we have recently
procured dust bins also that can be distributed to schools and so on. We have
contracted somebody to go and remove those and disposal them. I1
I think in each of the two settlements we have identified a site were the waste is
disposed I1
The Kavango regions itself is very big. Our services are just limited to proclaimed
settlements. Other villages were people lives there is no such services. I1
. I know that they are required to use special methods or procedures in terms of
disposing them. Unlike the ordinary waste that they just collect and then dumped at
the dumping sites, the waste coming from the hospital and clinics I think it is
classified in terms of their hazards and some is required to be burnet. Other is also
disposed in special matters to avoid risk for the community. I2
Starting with the Kavango regional council, we are responsible as a regional council,
for some of the areas we call settlements areas. These are small towns at a very very
low level. We are point contractors on a one year basis, and then they collect the
wastes which are normally dumped at dumpsites identified by the regional council.
The same principal applies to the Rundu town council as well as the Nkurenkuru town
council. They equally appoint small contractors and then they given sites and
schedules for the collection fo the waste. And then they transport it to dumping sites.
Of course some of the house owners including myself, there are times when we can I2

89
also dispose of our own waste. We load in our cars and dispose at the dumpsite.
Others they burn they waste. They dig some holes and then burns. This becomes a
problem. I remember when I was digging our swimming pool. Digging was a
problem; it was just full of bottles. It was amount and amounts of waste it was just
terrible. Maybe that is also another way we damaging the environmental. I never
thought I would be able to overcome that.
In Rundu we have two options. The one option some of the households were provided
by the town council with bins. I do not know how many numbers. They are those who
are provided by the town council. The people are paying a fee on monthly bases; it
comes with their water bills. Other households do not have that. They would put in
plastics or bags and on weekly bases as per the town council schedule they would then
take up the items to be collected for collection by the contractors. I2
For Rundu it is a petty that it is that way. It was not implemented to long back, maybe
six years or so. The problem the community has the fee was extremely to high. I think
it is almost 100 N$. Some of the people felt that buying a bin of that nature would be
less than 300. So why spend so much just for the bin. So therefore people did not go
for that option. The town council also made a mistake, they did not make it
compulsory. I2
I am not very sure about that (areas not collected). The collection is supposed to be at
all different sites households, business that is within the town jurisdiction and even
the settlements. The collection is supposed to be done at all places. My experience is
that sometimes the contractors don’t follow their schedule. The contractors also only
collect waste which is in bins or plastics at these houses. Now if you look at other
areas like the stadium, nobody is putting these items in plastic, unless the employees
of the town council go there. If people have littered there is nobody to pick that up
until the council takes their own employees or get people to do a cleanup. Cleaning in
general public places that are not done on regular bases. I2
Those are things that they may incinerate. But the volume is just to much. If you go to
the hospital the surroundings and even inside the hospital you found piles of these
used things. It is also a challenge of condoms these days. How do you dispose such
things? People just want to throw it in the bin or somewhere. Where it ends up is a
concern. Sometimes children can take such things and start playing with it. It could
become a big health risk. I3
I don’t think really it is such a structured kind of operation. I say it is a sporadic
exercise. It is more like crises management than a program or structured activity. It is
a challenge because it is not nearly close to what you would expect. I don’t know
whether there is a certain issue with capacity. It also has to do with management,
whether people is empowered to be able to manage and control the operations. It is
not really a program that you can say is predictable. I3
They brought big containers they put in several sites within the informal settlement.
But the demand is quite huge. The container can fill in a day or two, but yet it could
take a month for them to come and empty. By the time when they would come and
empty that the whole surrounding is filled with garbage or waste. I3
I can identify one activity at the riverside, mostly things have been thrown at the
riverside as a waste dumping site. Especially at a community level. People and
animals still use the same water as where there are dumping. I4
Sometime someone have for instance a bar and at the end you don’t know where to
throw it bins of waste and you end up dumping it by the side of the river, which is
wrong. It is a large problem, especially here in Rundu it is a big big problem.
Sometimes the town council can’t afford picking or getting all the waste in one place
due to the transporting or something like that. People think it is easy when they dump
in the backyard. I4
Mostly I remember when bottles were thrown in the river and people going there for
swimming and so on hurt in the river when there is glass there which are dirty. I4
Currently I only know one which is the town council. Sometimes a big challenge,
because they can say an allocation is only one a week. For example here in the
Kavango council we have a lot of meeting. We prefer it daily. When there is a lot of
meetings and you reach Friday when they come and collect it is to much. Sometimes
we put it aside were people come and take it or dogs, or people who are in need of I4

90
them come. I wish there were other companies taken part and come and collect.
Maybe schools weekly to assist the town council.
They (ref. to town council) hire constructor. That constructor may have a small
buggy. Sometimes the buggy during the process it brakes. It can stay in the garage for
one or two weeks, that is also a big challenge. I4
Households it is the same. It is not always they are on time to pick it. Maybe there is
one day or week when they have problems. If for example they are schedule to pick
up at Mondays. If they jump that Monday you have to wait for the other Monday. And
the Monday there is something and at the end you have to wait whole month no
picking which is challenge. I4
. Sometime you put things in the black plastics where town council advises us. But
that is not always right because there might be food things inside in there which dogs
come and just break things. At the end you just have to do it yourself. But you are
paying monthly. For instance I pay 5 N$ /month whether they pick it up or not. But
they are also limited I4
Just refuse collection. That is just it basically. They have scheduled times for
collection. I5
I believe in large parts of the region especially where there is no government
institution the waste may not be managed or controlled. In the town it is more
controlled. The large parts of the areas is part of rural communities, or communal
land. Their waste is not managed properly, except if maybe the owners themselves
take initiative. I5
Contractors, cleaning campaigns.
I6
Supermarkets and big business, we need to collect at least two or three times a week,
they receive a lot of unwanted things. I6
The industries, the one manufacture madrasses, it could also pollute the air. The
Chinese produce madrasses and the industry could pollute the air. I6
We do have contractors separated according to locations. Just at least to help us
collecting once a week at each location to keep the town clean. So far we are not
having enough transport so we are able to manage all the location once a week and
hard working men’s are not enough. We are not able to manage the town which is
growing step by step. And there is a lot of shops also receiving a lot of things. We
couldn’t be able to manage, that’s why we hire some contractors on those different
locations. I6
So far we don’t have enough bins and the bins are too small. We have managed to
pick some businesses in informal areas. I6
The only areas we don’t collect is the informal settlements. We only collect were they
have our bins. Clinics and schools in the informal areas we use to pick. WE don’t pick
from each house. We put a big container on the location, when it is full we just go
offload it and emptying and bring it back again. I6
We are having a program; we are dealing with schools, hospital and the lodges. The
school we have to clean them every Monday and Friday, open market every Friday.
The shops the contractor collects from Monday to Friday. The residents twice per
week. The collection has been given dust bins. The collection is individually. For the
open areas we use containers. We have eight containers which we collect when they
are full. We only have one container truck, which is broken. The gravel roads are not
good for the truck. Now the containers are full but we cannot empty them. I7
Waste from the hospitals we sort it separately. The town council has a very old
compactor truck for this type of waste. We trust our team to burn it to protect animals
and people to come in contact with the waste. I8
We have a program which involves about nine contractors. These contractors are
outsourced to provide equipment or fleet that could collect the refuse. We allocate and
are that we name a zone. We have eight zones. For the zone we have specific
contractor to collect from the zone. What we have done is provided refuse bins in
every zone. In the main street we have a different contractor. I entrust this contractor
to give a good impression to our visitors. The fees are quite high to involve these
contractors. The monthly payment range from 20000 to 30000 N$ per month. This is
a quit massive amount for the TC to pay out. But since we don’t have enough I8
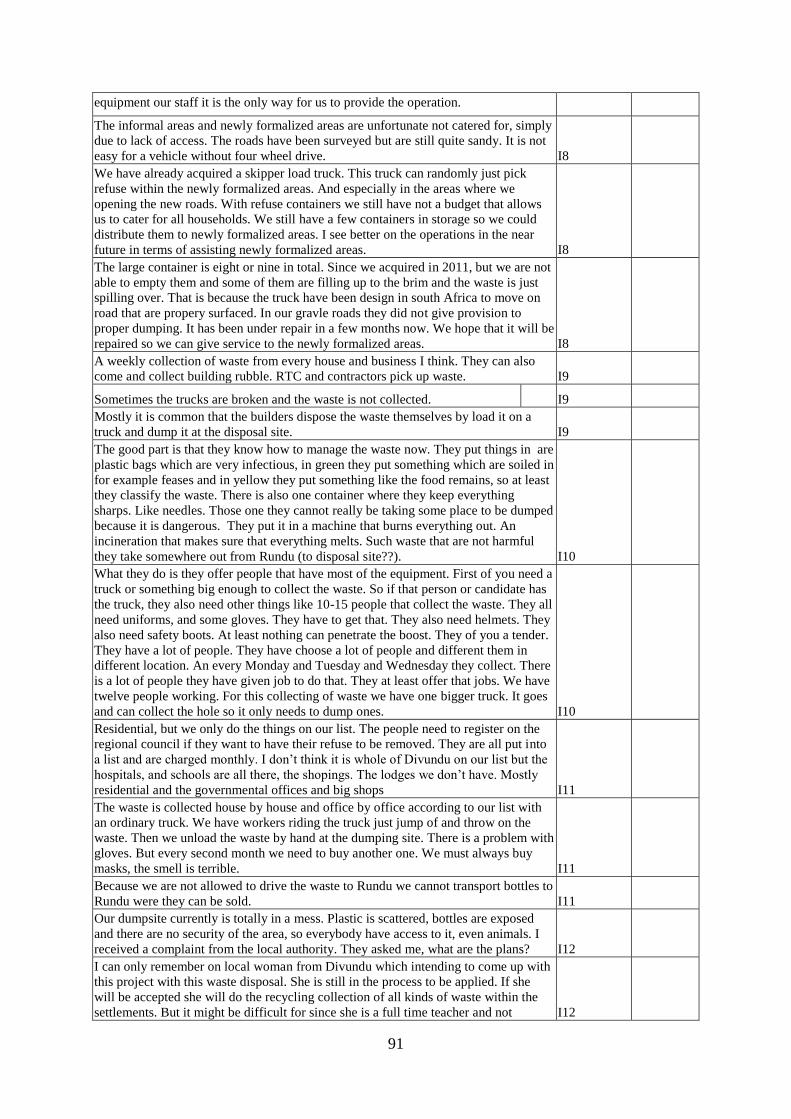
91
equipment our staff it is the only way for us to provide the operation.
The informal areas and newly formalized areas are unfortunate not catered for, simply
due to lack of access. The roads have been surveyed but are still quite sandy. It is not
easy for a vehicle without four wheel drive. I8
We have already acquired a skipper load truck. This truck can randomly just pick
refuse within the newly formalized areas. And especially in the areas where we
opening the new roads. With refuse containers we still have not a budget that allows
us to cater for all households. We still have a few containers in storage so we could
distribute them to newly formalized areas. I see better on the operations in the near
future in terms of assisting newly formalized areas. I8
The large container is eight or nine in total. Since we acquired in 2011, but we are not
able to empty them and some of them are filling up to the brim and the waste is just
spilling over. That is because the truck have been design in south Africa to move on
road that are propery surfaced. In our gravle roads they did not give provision to
proper dumping. It has been under repair in a few months now. We hope that it will be
repaired so we can give service to the newly formalized areas. I8
A weekly collection of waste from every house and business I think. They can also
come and collect building rubble. RTC and contractors pick up waste. I9
Sometimes the trucks are broken and the waste is not collected.
I9
Mostly it is common that the builders dispose the waste themselves by load it on a
truck and dump it at the disposal site. I9
The good part is that they know how to manage the waste now. They put things in are
plastic bags which are very infectious, in green they put something which are soiled in
for example feases and in yellow they put something like the food remains, so at least
they classify the waste. There is also one container where they keep everything
sharps. Like needles. Those one they cannot really be taking some place to be dumped
because it is dangerous. They put it in a machine that burns everything out. An
incineration that makes sure that everything melts. Such waste that are not harmful
they take somewhere out from Rundu (to disposal site??). I10
What they do is they offer people that have most of the equipment. First of you need a
truck or something big enough to collect the waste. So if that person or candidate has
the truck, they also need other things like 10-15 people that collect the waste. They all
need uniforms, and some gloves. They have to get that. They also need helmets. They
also need safety boots. At least nothing can penetrate the boost. They of you a tender.
They have a lot of people. They have choose a lot of people and different them in
different location. An every Monday and Tuesday and Wednesday they collect. There
is a lot of people they have given job to do that. They at least offer that jobs. We have
twelve people working. For this collecting of waste we have one bigger truck. It goes
and can collect the hole so it only needs to dump ones. I10
Residential, but we only do the things on our list. The people need to register on the
regional council if they want to have their refuse to be removed. They are all put into
a list and are charged monthly. I don’t think it is whole of Divundu on our list but the
hospitals, and schools are all there, the shopings. The lodges we don’t have. Mostly
residential and the governmental offices and big shops I11
The waste is collected house by house and office by office according to our list with
an ordinary truck. We have workers riding the truck just jump of and throw on the
waste. Then we unload the waste by hand at the dumping site. There is a problem with
gloves. But every second month we need to buy another one. We must always buy
masks, the smell is terrible. I11
Because we are not allowed to drive the waste to Rundu we cannot transport bottles to
Rundu were they can be sold. I11
Our dumpsite currently is totally in a mess. Plastic is scattered, bottles are exposed
and there are no security of the area, so everybody have access to it, even animals. I
received a complaint from the local authority. They asked me, what are the plans? I12
I can only remember on local woman from Divundu which intending to come up with
this project with this waste disposal. She is still in the process to be applied. If she
will be accepted she will do the recycling collection of all kinds of waste within the
settlements. But it might be difficult for since she is a full time teacher and not I12

92
exposed in that field. She is just someone trying.
We have these plastic refusal bins. I12
It is only this guy who is contracted. He follows a list where to pick up the waste. In
the case of those local operators who have the time to put their waste together at one
point, the contractor goes and collects at these points. The local people only point
some only put in their sites. Some don’t even bother. I12
Sometimes the contractor has to put the things together when collecting. We noticed
the contractor to approach us when the people is not put their waste together. I12
The waste collection in Divundu we only do it once a week which is on Wednesday
only. What happens is that the Regional council lease out a tender and the contractor
applies, and the contractor reach the acquirements get the tender. Then he starts now
with the collection on a weekly basis. Then the regional council pays to the contractor
on the ends of the month. I13
We have some areas, especially some residential who does not have any dust bins.
Now those ones are very difficult for the contractor to go to the house where there are
no dustbins. But hence we have dust bins at the office, but we have a challenge
because in Divundu settlement itself we don’t have a transport or vehicle to take the
dust bin to each and every household and also inform them to throw the waste in the
dustbins. We have the dust bins to be supplied but not the means to supply them. It is
compulsory that you should have a dustbin and pay at the end of the month for
households. But is not expensive, only 11$ per month. I13
The lodges collect the waste themselves and dump it at the dumping area, but
sometimes they dump anywhere else because the distance is a problem. I13
The only thing I want to add is to say to you institution to help us of capacity
building, like informing us what are the negative impacts, especially for the regional
council so they could put on the strategic plan of the waste management for the
Kavango region. I13
The settlement committee through the regional council, we have realized that there is
a lot of pollution going on in Divundu. At least you have seen this morning there is a
dumping site. I14
But our challenge is that all waste is being collected. For now it is only lodges and
schools and some of the business communities are using the dumping site. But most
of the houses is waste not collected. There is no central place in each homestead
where to put waste in order to be collected. That’s why you see there are a lot of bins
here that were supposed to be delivered to the people I14
The dustbins I was informed is not for free. If you get one you need to contribute 30 $
/month which include the waste collection. People is still struggling. Some might say
it is to expensive, some might say they are not willing. They need to be educated so
they are willing to take the bins so they can put their waste there. I14
Wastes differ, so we cannot classify waste in one category. We need to separate the
waste. Bottles could be recycled and tins or they could be compressed so that the
volume becomes small. If we also could supply plastic bags so that bottles could be
kept in one bag, the plastics in one bag and the food waste in one bag. We have food
waste which could be decompose and disappear, I14
The medical centre treats their waste according to the health standard. They put them
into categories and don’t mix them. The hazardous one they have a place where they
burn. I15
The town council provides only a transport to the youth group which decided to take
over the management over the waste. Actually the council outsourced the function to
this youth group to collect the waste while the council provides the transport to the
provisional dumping site. At the moment the council does not have a dumping site
because of finance implications but we are optimistic that we need urgent a dumping
site, a proper one. I15
The youth groups get some founds from the town council on monthly bases. It is up to
the youth group to see how will participate. The council just makes sure that the waste
collection is done. I15
The council provides refuse bins to all the houses, residential houses and business I15

93
places included a bulk skipper in business shops. It is compulsory to have the bins.
All the built up areas the council charge them for this service a minimal amount for
collect the refuse from their premises. It is a must that they must have. Except from
the (någonting) townlands. Because they are just their temporarily, they must move.
The town is still new, when they get the area planned they must moved to that site so
they could get town services.
The collection is done three times a week. We have outsourced this service to a youth
group, just for the purpose of creating employment, but it is in partnership with the
council. The council provides machineries and equipments and skippers and then the
youthgroup provide the manpower so they do the physical collection. They pick up
papers or bottles all around and they empty the plastic bins and put it in the car. Even
though we have outsourced it is still a public private partnership with the council. I16
Within the town the collection is supposed to be based on cost recover. It is only the
area where service is provided. Because the refuse removal have to be cost recovery.
If we collect at other sites where there are no proper ….services… we cannot collect
any fees. I16
They don’t have the idée this is a town. But probably the town council has provided
the drums, whereby when you are done with you cool drink you can just throw it there I17
The council is providing by a tender to the youth. They collect the waste products.
The house owner doesn’t need to get the waste to the dumping site. Just to keep the
youth busy by collecting the waste from houses instead. Normally they are using our
council cars. Normally they put on safety clothes and gloves before getting the waste. I17
Within town we do collect. Even in open spaces they do collect.
I17
I don’t know about any recycling.
I17
The disposal site is very far 9 or 10 km. It is expensive with fuel. And by separating
bottles it would be very easy to recycle. I17
We have sewage. According to the equipment we wash it and sterilization it in a
machine. If we have blood bandages we put it a red plastic and burn it. We have a big
whole where we put it and burn it there. And when it comes to needles we have a
safety box. We put it in the safety box and when it is half full then we put it in a red
plastic. We don’t have an incinerator here but we do have in the district hospital. It is
the same for all clinics in the region. U18
We don’t pay anything for the incineration since we are in the same ministry. The
incineration is done by the government and they make sure that the equipment works. U18
We are having youth that have volunteer to collect the waste, they work three days a
week. The town council car collect. I19
The people who volunteer get something but not so much. The person if you having a
house cannot afford to survive on that money. I19
Some of our youth collect waste here at Kahengi which is part of town. But they don’t
get anything. The people are unemployed. Starting from 18 to 25 years old. They
don’t go to school. Some are failing the grades, some are go up to grade twelve but
the points are not good. I19
We put it in black plastic bags. When they come they just load the black bags and take
it to the dumping site. U20
We store the bags in a room behind the kitchen.
U20
We pay about 900 N $ / month. I think it is a reasonable figure.
U20
We are working differently. Used oil as the one we empty from cars, that oil we have
a dem. In our region here they use to come and take the oil out to use it for private
“….” For insector killers. They use the oil for gardens and so on. U22
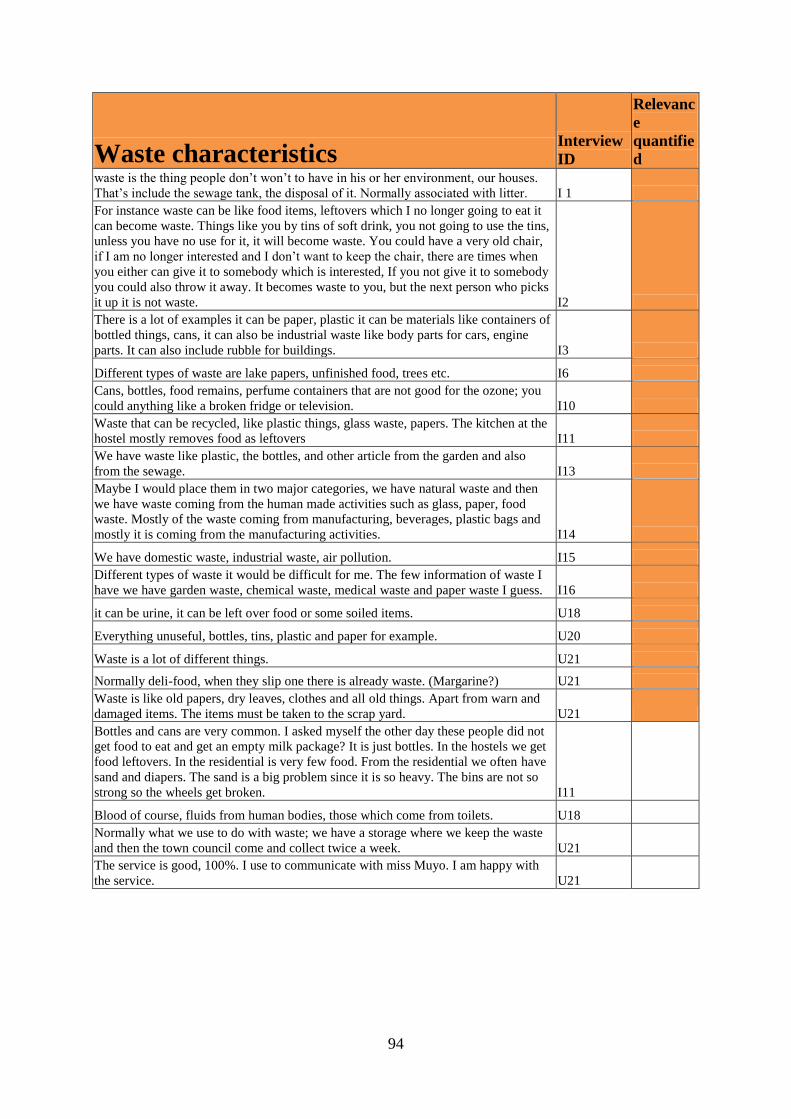
94
Waste characteristics Interview
ID
Relevanc
e
quantifie
d waste is the thing people don’t won’t to have in his or her environment, our houses.
That’s include the sewage tank, the disposal of it. Normally associated with litter. I 1
For instance waste can be like food items, leftovers which I no longer going to eat it
can become waste. Things like you by tins of soft drink, you not going to use the tins,
unless you have no use for it, it will become waste. You could have a very old chair,
if I am no longer interested and I don’t want to keep the chair, there are times when
you either can give it to somebody which is interested, If you not give it to somebody
you could also throw it away. It becomes waste to you, but the next person who picks
it up it is not waste. I2
There is a lot of examples it can be paper, plastic it can be materials like containers of
bottled things, cans, it can also be industrial waste like body parts for cars, engine
parts. It can also include rubble for buildings. I3
Different types of waste are lake papers, unfinished food, trees etc. I6
Cans, bottles, food remains, perfume containers that are not good for the ozone; you
could anything like a broken fridge or television. I10
Waste that can be recycled, like plastic things, glass waste, papers. The kitchen at the
hostel mostly removes food as leftovers I11
We have waste like plastic, the bottles, and other article from the garden and also
from the sewage. I13
Maybe I would place them in two major categories, we have natural waste and then
we have waste coming from the human made activities such as glass, paper, food
waste. Mostly of the waste coming from manufacturing, beverages, plastic bags and
mostly it is coming from the manufacturing activities. I14
We have domestic waste, industrial waste, air pollution. I15
Different types of waste it would be difficult for me. The few information of waste I
have we have garden waste, chemical waste, medical waste and paper waste I guess. I16
it can be urine, it can be left over food or some soiled items. U18
Everything unuseful, bottles, tins, plastic and paper for example. U20
Waste is a lot of different things. U21
Normally deli-food, when they slip one there is already waste. (Margarine?) U21
Waste is like old papers, dry leaves, clothes and all old things. Apart from warn and
damaged items. The items must be taken to the scrap yard. U21
Bottles and cans are very common. I asked myself the other day these people did not
get food to eat and get an empty milk package? It is just bottles. In the hostels we get
food leftovers. In the residential is very few food. From the residential we often have
sand and diapers. The sand is a big problem since it is so heavy. The bins are not so
strong so the wheels get broken. I11
Blood of course, fluids from human bodies, those which come from toilets. U18
Normally what we use to do with waste; we have a storage where we keep the waste
and then the town council come and collect twice a week. U21
The service is good, 100%. I use to communicate with miss Muyo. I am happy with
the service. U21

95
Informal Workers Interview ID
Relevanc
e
quantifie
d some of the people who are extremely very very poor, they are trying to find their
ways to getting access or lay their hands on some of the items that are disposed. In
that way people are contracting some deceases that are health hazard related. I2
For we actually have some people scavenging the dumping site now and then.
Somehow we have in some extent taking care of that problem by fencing of the
dumping site and a security personal to control their movement. I8
They make holes that they dig. Theese holes are then filled with garden waste and
trees that could be composted over time. These holes are then covered. With the
bottles and other litter they discard it somewhere else. This type of waste can also
be seen on main roads. They don’t have access of refuse bins or bigger container
where they can dump this waste. I8
Sometimes I need to get people from the street looking for job for putting aside or
digging a hole to wait for the town council. I4
Most people from informal areas they help it to do it themselves. They dig a hole,
they put it there and burn it there, and they cover the hole. After two or three
months they same again. I4
There are values in some of the waste. There are people on the other side that
separate the waste. If we would do it would take much longer times and we would
need more people. But if the waste is separated in the homes it would be better. As
far as I know there are places like behind bars bottles are crashed and put in a big
big sack. What they do with that there are certain companies that buy it and take it
to recycle it. You get the bottles here and also in the disposal site. Later it would
be and truck that would come and pick up the broken bottle and take it for recycle
in Windhoek. One place where they break the bottles is behind these shops called
fish-market. They are just two big big sacks. This area is circulated by two bars.
Those peoples work is to collect the bottles and breaks it. Some of them do it for
themselves. When it started it was self-employed, so you talked with the person
that picked it up and him pay for his work. I don’t know if they have made it
officially. I10
The people working in the disposal site don’t have any equipment and that is a big
problem. At least if they could have any equipment. I10
Maybee boxes are also collected. Like behind shops, they collect from the shops.
When they collect the boxes they kept outside and is burned, no recycling. I10
Informal recycle is when other people or companies are coming in and collect
bottles on their own, and other waste like iron. But not in big numbers because
they are still doing it on their own without the council. I15
Other Interview
ID
Relevan
ce
quantifi
ed It is a big problem, one is that it is not really considered as a concern to most of
the people in the general public one thing also is also it is a problem because a
lack of awareness and also the lack of a capacity to be able to manage waste
disposal. Also the elements of the education part of it, what impact it can have on
people when they live round to waste. And more to it has to do with the
authorities not being able to manage waste because of incapacity. I3
Maybe the barriers are the insufficient founds at the Kavango regional council
that prevents us to have those services. Maybe also the capacity of the people in
those areas. I1
The barriers would be the financial resources, another is because the absence of
policies to guide people. But the biggest one I think is the mindset of the will to I2
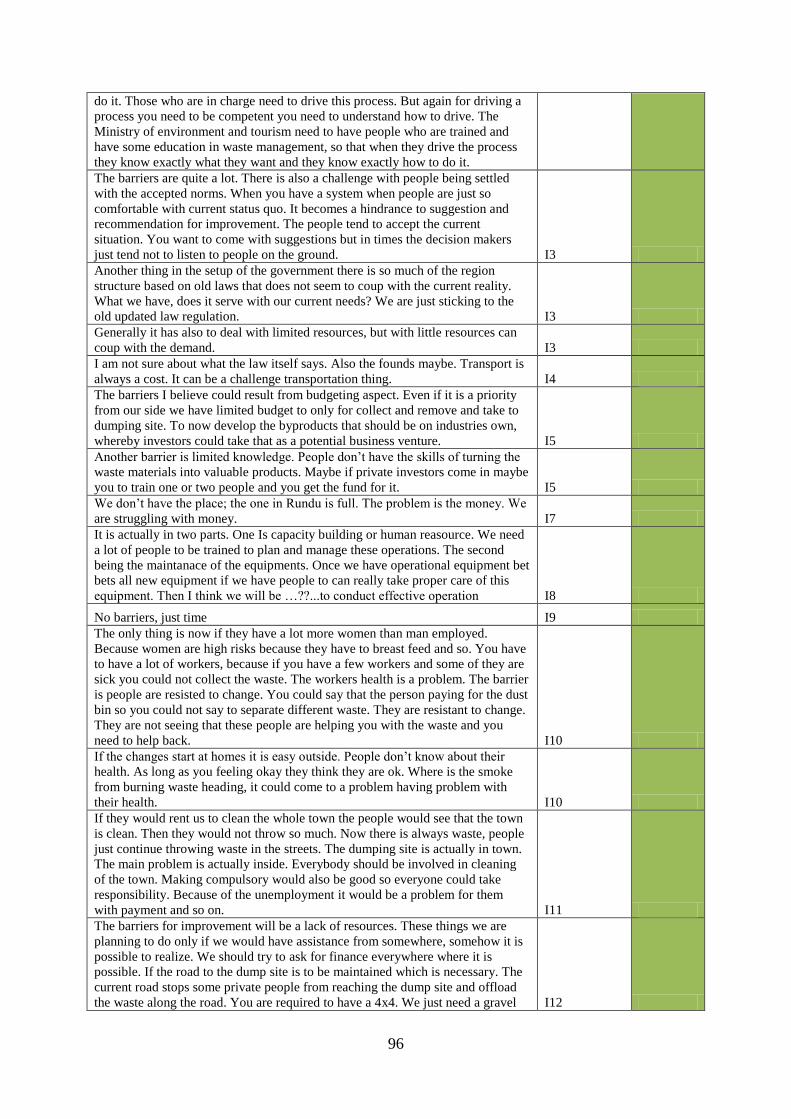
96
do it. Those who are in charge need to drive this process. But again for driving a
process you need to be competent you need to understand how to drive. The
Ministry of environment and tourism need to have people who are trained and
have some education in waste management, so that when they drive the process
they know exactly what they want and they know exactly how to do it.
The barriers are quite a lot. There is also a challenge with people being settled
with the accepted norms. When you have a system when people are just so
comfortable with current status quo. It becomes a hindrance to suggestion and
recommendation for improvement. The people tend to accept the current
situation. You want to come with suggestions but in times the decision makers
just tend not to listen to people on the ground. I3
Another thing in the setup of the government there is so much of the region
structure based on old laws that does not seem to coup with the current reality.
What we have, does it serve with our current needs? We are just sticking to the
old updated law regulation. I3
Generally it has also to deal with limited resources, but with little resources can
coup with the demand. I3
I am not sure about what the law itself says. Also the founds maybe. Transport is
always a cost. It can be a challenge transportation thing. I4
The barriers I believe could result from budgeting aspect. Even if it is a priority
from our side we have limited budget to only for collect and remove and take to
dumping site. To now develop the byproducts that should be on industries own,
whereby investors could take that as a potential business venture. I5
Another barrier is limited knowledge. People don’t have the skills of turning the
waste materials into valuable products. Maybe if private investors come in maybe
you to train one or two people and you get the fund for it. I5
We don’t have the place; the one in Rundu is full. The problem is the money. We
are struggling with money. I7
It is actually in two parts. One Is capacity building or human reasource. We need
a lot of people to be trained to plan and manage these operations. The second
being the maintanace of the equipments. Once we have operational equipment bet
bets all new equipment if we have people to can really take proper care of this
equipment. Then I think we will be …??...to conduct effective operation I8
No barriers, just time I9
The only thing is now if they have a lot more women than man employed.
Because women are high risks because they have to breast feed and so. You have
to have a lot of workers, because if you have a few workers and some of they are
sick you could not collect the waste. The workers health is a problem. The barrier
is people are resisted to change. You could say that the person paying for the dust
bin so you could not say to separate different waste. They are resistant to change.
They are not seeing that these people are helping you with the waste and you
need to help back. I10
If the changes start at homes it is easy outside. People don’t know about their
health. As long as you feeling okay they think they are ok. Where is the smoke
from burning waste heading, it could come to a problem having problem with
their health. I10
If they would rent us to clean the whole town the people would see that the town
is clean. Then they would not throw so much. Now there is always waste, people
just continue throwing waste in the streets. The dumping site is actually in town.
The main problem is actually inside. Everybody should be involved in cleaning
of the town. Making compulsory would also be good so everyone could take
responsibility. Because of the unemployment it would be a problem for them
with payment and so on. I11
The barriers for improvement will be a lack of resources. These things we are
planning to do only if we would have assistance from somewhere, somehow it is
possible to realize. We should try to ask for finance everywhere where it is
possible. If the road to the dump site is to be maintained which is necessary. The
current road stops some private people from reaching the dump site and offload
the waste along the road. You are required to have a 4x4. We just need a gravel I12

97
road.
We may initiate these good ideas we are talking about, but at the end the
dumping site is nearly already in the vicinity where the town is intended to grow,
so we might end up with no site. I12
But the main thing is the resources. The Regional council did not receive enough
founds for the budget. I12
The barrier we have no is the budget. I remember we put a request to buy the
fence, which is 800m but it was not budgetated for. Now at the truck for the
regional can’t afford. The other barrier we also have is the capacity building. Our
people are not capacitated on what are the negative effects of the waste, and also
the management at the regional council needs to be capacitated on what is the
positive impacts and what are the negative impacts on the waste. Through that
when it comes to budgeting they could make a provision one day for budget for a
truck or a fence. I13
The other challenge is also our business communities. They are doing business
but in the same you should not pose danger to the people you are serving. They
must also see a way of how do they participate in waste management. For
example I rather have a shop encouraging my plans to have carry bags that you
reuse. Because the plastics just becoming a danger. The shops must also think of
the community itself. If you have a community where pollution is a health hazard
your business would not prosper. I14
The country the revolution manufacturing, rules and policies that regulate
manufacturing. Some of the waste could be stopped right at the manufactory
rather than reaching. Which material do we use for packaging etc. I have seen in
some countries they sell less bottles and more tins. Then you have limited types
of waste with a program how to recycle it, rather than having the variety and in
the end you don’t have the capacity to recycle them. I14
Another one is regulations. In a settlement we must regulate that if you throw
something you would be fined. If you would be fined you would be afraid of
throwing things away. I14
The barriers for the improvement of proper waste management are funding.
Funding is a problem since this is a newly established town. Also it emanate from
communal land to move from rural to a town. It is a bit difficult because the
income will not be that big, because most of the people are unemployed, and also
culture place a role. Now we are trying the people from that concept from being
from rural to a town. Now we need to start telling them to adapt to the town
norms. Which mean funding is one of the struggle apart from the social issues.
Then we could realize proper waste management. I15
The barriers are number one knowledge and information. Number two is the
economy, the living standard of the people. You might have a plan to set up even
a recyclingplant but now there are costs involved. I16
The problem is the financing. It is the thing keeping us still behind. That idée
have already been brought up but the finance can just not allow us. I17
Central government need to come in. The way we manage our waste should be
done perhaps as in the city Windhoek were they have proper machines, proper
structures and proper systems to do waste management. In most towns of
Namibia, they do not even have a structure or people who are qualified and have
studied waste management. Waste management is just seen as a extra
responsibility, it is not a dedicated function. I2
The second one is perhaps to benchmark with the developed countries to see how
they are doing it to see what are the thing we are not doing right and then those
things can become the areas for our improvements. I2
Another area I have said, even though we have not proper system in place, in the
meantime we are doing these responsibilities, people must receive training so that
we can within our limited resources and capacity we can improve that. I2
Maybe also policies and laws which can help us with littering. Because at this
stage people can just throw a can without concerning about the consequence.
Besides of the law, mobilizing people, educating is very important and we are not
doing that. I2

98
First of all it has to start with empowering people in terms of awareness, capacity
building. Because I always tend to think that if you could not tell the people to
understand the harm or the danger of doing things one would be regard it as
normal. I3
It has to do with a lot of awareness rising, education in order to inform people.
How they can be able to understand the problem. In addition to that it has to be
passed on to the next level which would be what to do with it, how to coup with
the waste management? Because understanding would then facilitate the process
of managing the waste. I3
Secondly it would also have to do with how to inform town council or the local
authorities and the regional council how to sort and manage it. In terms of waste
that can be recycled and waste that must be disposed in certain ways and waste
that totally take away from the surroundings. That is key. I3
It also has to do with the empowerment how to build the capacity of the local
authorities in terms of trying to make studies, what best would be needed. First to
understand the magnitude. The local authorities need to understand how big the
problem is. Then certain recommendations can be made as to where to excess
capital and things like that in order to deal with the problem. If all just looks at it
as a problem and there is nothing one can do then it will just be there. I3
The procurement section does not have an independent fleet. I need to turn to
other sections to get transport. It is some of the things that really I would say gaps
in the systems. I3
Maybe that town council gives authority to the community like the way they are
fighting crimes. Mostly you fight a group of crime in the community. Maybe
collection of bins in certain areas, maybe 4 or 5 youth that could do that. I4
Think about those people themselves what they have to do. They have to find
funds for maybe helping those people. Voluntary they can do that part time,
maybe students. I4
I believe for KRC the twinning agreement with Vetlanda, is one of the areas we
look in to. We look in terms on the waste management technologies from the
expertise. Even during my visit in Sweden we saw there is an opportunity in
waste management and we would like to see if we could develop that part. And
maybe leverage on the technology and platforms it is possible for people to those
areas. The opportunities in those areas could be exploiting. The KRC and RTC
have indicated very high interest in getting more technologies and knowledge in
waste management. I5
As well as we should have enough transport and more employees that could do
their job we would not have any problem and we could collect at least once a
week. I6
We should just at least give information on our people in town how to use things,
they should be a recycle bin and start recycle things, and they should know more
about the environment and educate them. Some of them just know about the
effects, they just throw things away. I6
If we had a lot of transports it would be better. If we would have a lot of
transports its better. I7
We need some signs in Rundu. The sign is better to show the people that this is
not a dumping area, you cannot dump here. An also to put some fine, when
something is dumped illegal you get some fine. The fine could be paid to the
town council. Also we need training and we should also communicate to other
municipalities to share some ideas. I7
If the RTC could reach them halfway hopefully we could in the near future a
compactor truck. We have a lot of old veichels. The idé is to auction them and
with the revenue secure a shipment of a compactor truck that can step in and
improve the operations. I8
More staff and more equipment. I9
In some city the use the big trucks that pick up the bin and empty it itself, but I
would not recommend that because then we wouldn’t have any job. They are
giving the tenders to local contractors which creates job. The settlements are very
very dirty. Before we started it was even worse. I tried to pick up bottles from the I11

99
shops. But it is still a big problem. The road to the dumping site needs to be
better. A gravel road is enough. The dumping site is also a problem, they made it
wrong. The put all sand they dug up so it is hard to get in. The disposal site at
diona is squared and better. I was there when they prepared it and told them what
to do. We had problem with tire cutting. With the new disposal it is better. The
disposal site needs to be controlled better, with fence and so on. We get a lot of
dead things in the drums, for example snakes. Once we got a living snake. The
lack of knowledge is also a problem. Once we delivered letters warning them that
they would be fined if they messed up the town, however the letter did not do any
good.
The way I think it should be improved are a bit by bit. We need to insure that the
dump site it secured. I12
The only thing I want to add is to say to you institution to help us of capacity
building, like informing us what are the negative impacts, especially for the
regional council so they could put on the strategic plan of the waste management
for the Kavango region. I13
If the ministry of the local and regional government would be informed they
could also push the regions when it comes to the waste management. I13
To improve I think priority number one is I think we need to have community
meetings to educate our community about waste management. We can do it in
schools, we can do it in communities hand in hand with the traditional authorities
so people exactly know what do we mean by waste management. The people can
hear us talking about it but they must know what they should do. I14
Secondly it is also important that everyone, we must make every community
member to be part of waste management. Because one way or the other
everybody holds waste in their hands on a daily basis. I14
I remember when I was at school littering was prohibited. If you were caught you
were fired. So up to now when I eat sweets for examples I put the waste in my
pockets. I am used. Even if you go to my car you could find tins, everything I
consume I keep it and don’t throw it away. You must put it in the right place. In
order for them to know, especially for them to know what is the danger, then they
would start realizing something needs to be done. I14
We want to see to it to that the management of waste in Nkurenkuru complies
with the general standard of the country and also international. I15
In my own opinion it would be good if we could have an identification of
separation of these waste products. Things that can be recycled it would save us
more. Those things that we cannot recycle we could dispose. If we could recycle
we could create employments and so on. In the same time we create a healthy
environment. There is no recycling right now, not informal either. I16
In the future we could continue what we do with our youth but at our regional
council we are asking for doing something for the youth collecting without
getting something. It would be good if the youth could get more money, maybe to
buy at the shop. Perhaps some could continue with further study. Some want to
go to Namco but they don’t have the money to go to Namco. I19
If the people were absolutely organized so I don’t have to phone. U20
They should have a schuedle. This is Omashare on Monday, and them some other
companies and then on Fridat it is Omashare again. U20
If they have a brakedown they must have a standby. Even if it is only a small
bukky which could get rid of most of the waste. This has miss Muyo organized
for us in the past. She is pretty good. U20
I don’t know how to improve the waste management. U22
Sometimes people from the town council come late to pick up. U22
Normally waste can be a problem to Kavango region, in the sense that if the
waste is not properly managed. One is that visitors that would come would not
like to stay or in the environment not hygiene I1
If not properly managed it would definitely pollute the environment. I1
It could lead to polluting the environment and soils. It could affect the children
playing in the environment. It could also cause a lot of health hazard. Because I3

100
sometimes they have only one mean people have to burn. There is a lot of toxic
in the material disposed. When you burn the gases, the fume of that kind of
burning it can also affect people when inhaling the gas.
It never reaches the right people who are in need. It can also cause health
problem. Sometimes we throw the waste, but in the end kids or poor people they
take it and use it which might be dangerous. I4
It is just thrown there, in the environment which is not good for the animals who
just come and eat it. Or the place might end up being dead. I4
There is money involved, somebody maybe work hard at getting that and at the
end it might up being waste. I4
For Kavango region the waste could become a problem is the waste is not
management, especially pollution. Waste effect pollution as well. It might affect
different hygienic conditions or the environment, including our useful resources
as the river. If the waste is not management it ends up in the river. People can be
affected or pick up diseases from that. People can pick up diseases if the
environment is not clean. I5
Waste is a problem because it is very harmful; it can cause injuries on kids. It can
contain mosquitoes and spread malaria. Many diseases is surrounded there. I6
There also air pollution, water pollution. I6
Currently Rundu have a big challenge to manage waste. The technical services
are quite determined to see to it that the services are conducted effectively. But
we have shortcomings and massive challenges to overcome. These come from a
lack of resources and a lack of capacity within our structure at the department.
We actually have our people doing the administrating as well as general worker.
As you can see the planning of these operations require at least someone that
conduct effective administrative task. Then in our case we only have two people
to do that. Considering the town with a size of Rundu it is a quite massive task.
You have one heading the division and one to supervise the operations. There
have been some considerable efforts to expand this structure and fill as many
vacancies as possible. I8
On another front you also need proper facilities. In our case it comes in the shape
of equipment and safe fleet. In our case we have very old equipment. It breaks
frequently, is not reliable and most of the equipment have been inherited. The
maintenance cost is very excessive. You have a lot of things to deal with, in the
end of the day the reasources I simply not big enough. I8
Unfortunately for the limited resources and that is the best we can do right now.
That does not mean we stop looking for effective solutions. We are trying with
the few staff we have, but we are still handicapped with the finances and we can
only take small steps every time. Hopefully in the future the ministry of local and
regional government, I feel that they are also making major strides to assist local
authorities. I hope that they give us some sort of a motivation that we somehow
can conduct effective operation in the near future. I8
But overall we have so many newly formalized areas; I think there are five in
total. The access to these areas is quite limited. In terms of roads infrastructure
the roads is not that proper. Improper meaning that they are to sandy. You could
not simply go with any time of vehicle. If you don’t have a four-wheel driven
vehicle you cannot access these areas. And this is now where the biggest
population resides in the city. If we cannot attend or address the refuse removal
in these areas we have a serious impact on the environment. In terms of sanitation
you could already imagine what tragic possibilities may arise. For now I believe
our resident also tries on their part. I8
Solid waste ends up in the river. When there is rain season it is pushed out in the
water. I9
In Rundu it does not affect the public health very much I9
It is a problem when it becomes too much and is not taken care. This can lead,
because we are close to the river side, to too much mosquitoes. A lot of people
would encounter a lot of problem like malaria diseases. It can pollute the
environment leading to an unhiengenic environment, so it is not really good for
health. I10
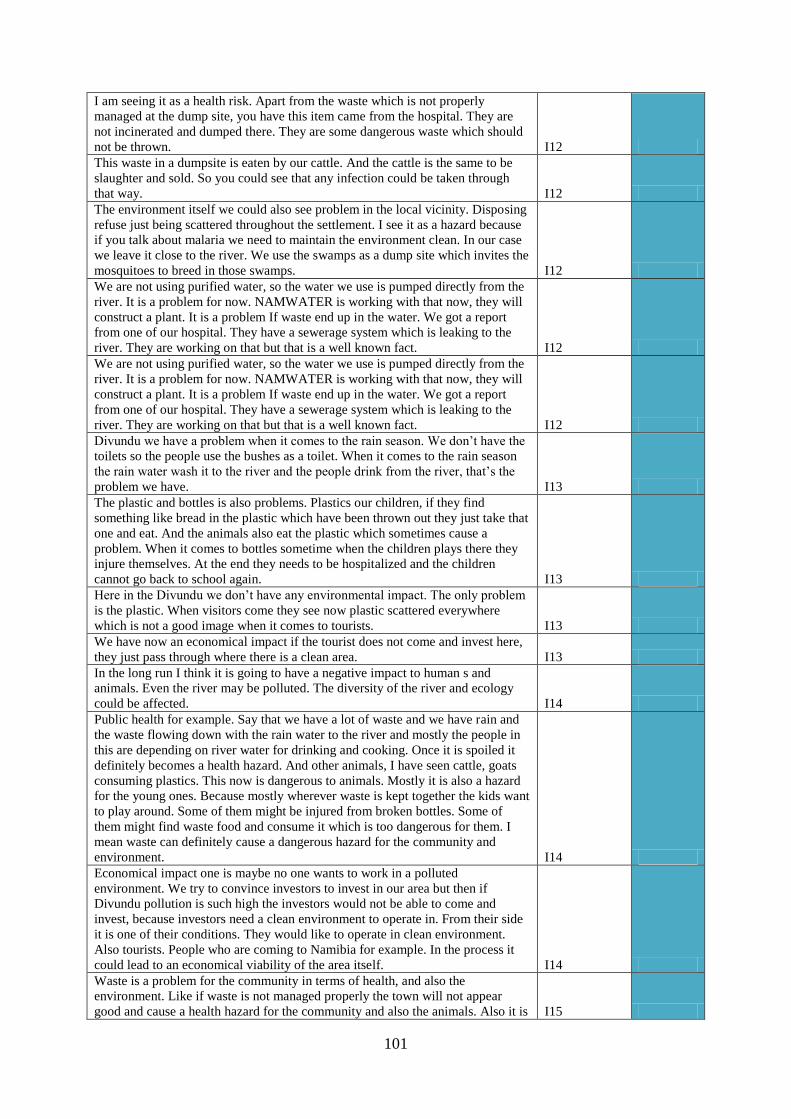
101
I am seeing it as a health risk. Apart from the waste which is not properly
managed at the dump site, you have this item came from the hospital. They are
not incinerated and dumped there. They are some dangerous waste which should
not be thrown. I12
This waste in a dumpsite is eaten by our cattle. And the cattle is the same to be
slaughter and sold. So you could see that any infection could be taken through
that way. I12
The environment itself we could also see problem in the local vicinity. Disposing
refuse just being scattered throughout the settlement. I see it as a hazard because
if you talk about malaria we need to maintain the environment clean. In our case
we leave it close to the river. We use the swamps as a dump site which invites the
mosquitoes to breed in those swamps. I12
We are not using purified water, so the water we use is pumped directly from the
river. It is a problem for now. NAMWATER is working with that now, they will
construct a plant. It is a problem If waste end up in the water. We got a report
from one of our hospital. They have a sewerage system which is leaking to the
river. They are working on that but that is a well known fact. I12
Divundu we have a problem when it comes to the rain season. We don’t have the
toilets so the people use the bushes as a toilet. When it comes to the rain season
the rain water wash it to the river and the people drink from the river, that’s the
problem we have. I13
The plastic and bottles is also problems. Plastics our children, if they find
something like bread in the plastic which have been thrown out they just take that
one and eat. And the animals also eat the plastic which sometimes cause a
problem. When it comes to bottles sometime when the children plays there they
injure themselves. At the end they needs to be hospitalized and the children
cannot go back to school again. I13
Here in the Divundu we don’t have any environmental impact. The only problem
is the plastic. When visitors come they see now plastic scattered everywhere
which is not a good image when it comes to tourists. I13
We have now an economical impact if the tourist does not come and invest here,
they just pass through where there is a clean area. I13
In the long run I think it is going to have a negative impact to human s and
animals. Even the river may be polluted. The diversity of the river and ecology
could be affected. I14
Public health for example. Say that we have a lot of waste and we have rain and
the waste flowing down with the rain water to the river and mostly the people in
this are depending on river water for drinking and cooking. Once it is spoiled it
definitely becomes a health hazard. And other animals, I have seen cattle, goats
consuming plastics. This now is dangerous to animals. Mostly it is also a hazard
for the young ones. Because mostly wherever waste is kept together the kids want
to play around. Some of them might be injured from broken bottles. Some of
them might find waste food and consume it which is too dangerous for them. I
mean waste can definitely cause a dangerous hazard for the community and
environment. I14
Economical impact one is maybe no one wants to work in a polluted
environment. We try to convince investors to invest in our area but then if
Divundu pollution is such high the investors would not be able to come and
invest, because investors need a clean environment to operate in. From their side
it is one of their conditions. They would like to operate in clean environment.
Also tourists. People who are coming to Namibia for example. In the process it
could lead to an economical viability of the area itself. I14
Waste is a problem for the community in terms of health, and also the
environment. Like if waste is not managed properly the town will not appear
good and cause a health hazard for the community and also the animals. Also it is I15

102
not good for visitors and tourist passing the town will not happy because their
health will be at stake
Economically it also impacts the economy of the town and the region, simply if
not managed properly the investors would not like to invest in such a town. Clean
environment attract investors which would improve the local economy. I15
The environmental impact, currently it is now difficult for do in the assessment,
some of us think we need research and so on. From a theoretical perspective it is
important that a proper dumping site needs to be put in place. We do not know
any immediate knowledge what impact the waste might have. Even without that
immediate knowledge it is good to do it in a proper way. My personal view
particulary from the environmental impact is: number one the site where we
dispose the waste might have impact in groundwater and so on. That is way the
identification of the dumping site needs to be done in a proper way. The disposal
method must also be environmental friendly. What we currently do is to take the
waste to the dumping site we put it on fire. When we burn it there is some
implications. Some of the waste might not burn. And it can have implication on
the surrounding environmental. I16
For the public health it could be that kids can have access to the dumping site, as
a result there is a health risk already. People who are herding cattle might also be
tempted to spend some time there and look for things and be infected and so on.
Even the animals can go on the site trying to eat things and some might be
affected. When the animals are slaughtered it would pass on to the consumers. I16
The economical impact it is linked to the health issue. If people are affected
throw the waste management and there health condition could be affected it
would translate into productivity even at home or at work. The immediate
economical implication is that the waste must be managed properly so the health
risk could be avoided. I16
Normally it is a problem especially here in town the people still have the village
manors they are not used to how a town should be. They are just throwing
anything which is dirtyfying the town. And then they would not see it as a
problem. They would just throw everything in the areas which is not good for the
view of the town. I17
The environmental impact, it really can destroy the environmental. The challenge
of the impression. If you can see the town is very dirty and the impression you
can see it looks not very nice. And even especially like the bottles it want even
look nice to get all over the place is full of the waste products. I17
The waste products are all over, and the health is in danger. Especially in the
summertime we have a lot of rain. The mosquitoes spread diseases; the
mosquitoes would just spread malaria due to the waste products which is all over.
Whereby go and get it and spread it to the people in town. Therefore it is good if
we place it very far from the town. I17
The waste is a problem because is not supposed to be where the people are, it is
supposed to be far so it could not harm the people. The waste for example blood
there is bacteria there which can harm people. It need proper handling so it can
not cause diseases. U18
It is a problem with people, if people throwing the waste, throw the shops, if the
people come and visit the places, they see this town is very dirty. I19
If the damage something like threes they damage the environmental. I19
Public health, if the people burning something, in the air it affects people. I19
Waste to me is any items or goods that will no longer be used by a particular
person, but it could be useable to the next person. When one is on the opinion
that you no longer need the particular item and you don’t want it anymore and
you want to dispose it it qualifies as waste. I2
My own understanding of waste is sometime for the community itself it might be
the waste for food items they donate, maybe the food is not properly stored it end
up as waste. Maybe rats or rain can make the food to waste. I4
To use waste is now the materials you get after you have used that articles,
materials or products. Usually it comes in the form of containers, things like
plastic containers. I5

103
Waste is something like unwanted things that is thrown either by house or
anyway. I6
We are doing these bottles, but we don’t have recycling machines. I7
It is too high, we have a lot of illegal dumping. If you go down by the river you
can find a lot of illegal dumping. Actually we don’t give them any fine, it is
better if we give them some fines. It is a problem; it is no program that if you
dump illegal you are judged. I7
In my opinion waste would be anything. That is a product which has been used
and is in no relevance in terms of usage. Actually it has an undesired affect of
environment in terms of discarding. Waste is unwanted for the general public,
which need to be contained to avoid diseases. I8
The result of a product not needed anymore. Mostly solid waste, metal waste I9
Waste is something that is used and not needed now. Its need to be taken
somewhere else or just disposed. Waste is something that is not really needed
around. I10
Waste is the things you don’t use anymore, rubbish. I11
I regard it as anything sort of disposal that is not taking in a proper manner. Be it
the littering taking place in our settlement. Be it the sewage system It can also be
linked to waste. Any kind of refuse or disposal that is just not maintained in a
proper way I will regard it as waste. I12
It is the first time I have been given the opportunity of giving my opinion. We
never give that opportunity. The communities itself are very import to include. I4
Prevention is better than cure; we still have a chance in Kavango. I4
Yeah of course that is other ones, broken bottles around town for example. That
for me is highly hazardous. Maybe to those villages nearby town the animals
could eat the waste and it s effect their systems. Sometimes people wants to use
the river to wash the cars. That may also be hazardous polluting the river I5
It is also a big problem provided that we only have two people in the division.
The head of the division delegate the monitoring of the contractors as well as our
own operation. When I refer to our own operation I mean I our team composed of
general workor that accompany our own trucks. It is quite challenge for one
person. But we do manage, however in difficult circumstances from time to time. I8
The town council doesn’t have any four wheel drive trucks, so we have to
compromise, by opening a few roads depending on the availability of founds. For
now we our making process. We have allocated a quite significant amount of
money with the curtsey of the inland ministry. They have allocated an amount of
which we have taking a large portion to survey roads in newly formalized areas.
So in the future we will have at least adequate access to assign more contractors
to these areas. We could also use larger container to provide service for more
household. I8
I think we could seriously get assistant that can also help us in the planning of the
dumping site as we really don’t have expertise in the structure right now. If we
could also get short workshops, maybe to visit nearby town councils or
municipalities. I think that could also help us to plan the dumping site properly. I
believe the expertise will do a lot of justice in our case, as the capacity building is
the biggest problem we experience right now. I8
I have seen like in the school where I am. The sewerage system was not working
properly. The human waste was flowing to the river direction. We had to run
down and rescue the river. And I have also seen people who are consuming
bottles they throw the broken bottles, especially on the tire roads. This is
dangerous to the road users, it might cause accidents. I14
. The people do not have the understanding, they need education. When Divundu
is waste free we can say we have done our homework, but there is a lot that needs
to be done. I14
but bottles don’t disappear. It will remain in the environment for millions and
millions of years and I don’t know if anything will happen to it. But we need to
educate people I14
Just a bit of not understanding the way of a town. The council soon will use their I17

104
power. Once you have been seen throwing something the fine would be
distribution to the person. Maybe they will get the idée that if they throw
something they get a fine and should use the drum instead. Still there are not yet
any fines.
Some are uneducated, so they not get employed. Some don’t have higher grades.
Some are out of school grade 8 9 or 10 perhaps. It is difficult for them to get jobs.
(Fick inte svar på frågan!!) I19
If food goes rotten, they don’t remove it in time, it can be pretty dangerous. Flies
brings it in, you can’t prevent the flies how hard you try and it can spread. U20

105
Appendix B: Household surveys, Willingness to pay
The household survey was filled in by people participating in the waste charactarization
study. Most of the questions were necessary for the waste characterization, however a
willingness to pay assessment were also made. The following question were included.
House ID: RF ( ), RI ( ), RUR ( ) Number___________ Adress /description: ____________________________________________________________________________________________________________________________________________________________________ People living in house?: Children__________ Adults_________ How do you get rid of waste today? Individual collection ( ), Communal collection ( ), Informal collection ( ), Own dumping ( ), Other ( ) Do you pay someone for that? Yes, how much? ___________ No ( ) How much would you be willing to pay per month for someone to take care of the waste for you? ____________
Willingness to pay household in Informal areas.
ID-tag Size of household How much would you be willing to pay per month for
someone to take care of the waste for you?
RI 1 6 50
RI 2 11 0
RI 3 16 500
RI 4 7 125
RI 5 7 0
RI 6 18 450
RI 7 11 300
RI 8 4 200
RI 9 5 300
RI 10 6 0
RI 11 6 200
RI 12
RI 13 3 500
RI 14 15 50
RI 15 23 0
RI 16 10 300
RI 17 8 200
RI 18 9 400
RI 19 2 50
RI 20 4 200
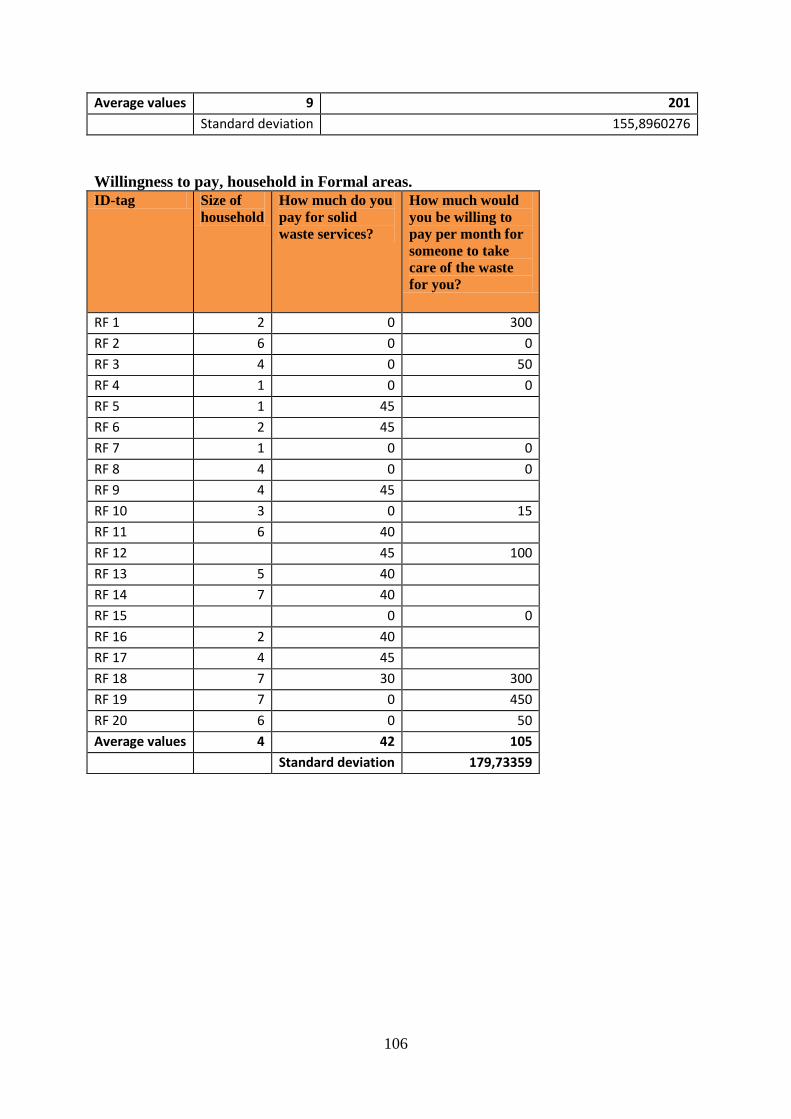
106
Average values 9 201
Standard deviation 155,8960276
Willingness to pay, household in Formal areas.
ID-tag Size of
household
How much do you
pay for solid
waste services?
How much would
you be willing to
pay per month for
someone to take
care of the waste
for you?
RF 1 2 0 300
RF 2 6 0 0
RF 3 4 0 50
RF 4 1 0 0
RF 5 1 45
RF 6 2 45
RF 7 1 0 0
RF 8 4 0 0
RF 9 4 45
RF 10 3 0 15
RF 11 6 40
RF 12 45 100
RF 13 5 40
RF 14 7 40
RF 15 0 0
RF 16 2 40
RF 17 4 45
RF 18 7 30 300
RF 19 7 0 450
RF 20 6 0 50
Average values 4 42 105
Standard deviation 179,73359

107
Appendix C: Waste characterization study The waste characterization study aims for two different resutls, composisition of waste and
waste generation rates.
The composition of waste have been calculated according to the following equation:
C= composition of the material x in percent.
Wx = The total weight of the collected material x
Wt = The total weight of all collected waste
The waste genereation rate were calculated for each household. To calculate the waste
genaration rate the following equation were used:
Waste generation rate = amount of waste generated per person and day in an household
WH = Total amount of sorted waste from one household
P = number of people living in the housheold
D = number of waste generated days for the sample
The result of the waste characterization study can be seen in the table below
id Organic Paper Plastic Glass Metall
Hazardous
People Days
Generation rate (kg/p/d)
RI 3 4,25 4,35 5,35 5,25 1,55 0,2 16 7 0,3026
RI 4 0 0,05 0,25 0 0,1 0,1 7 8 0,0089
RI 5 0,3 0,4 0,15 0 0 0,05 7 8 0,0321
RI 6 8,55 0,3 0,4 1,55 0,4 0 18 2 0,3125
RI 7 0,4 0,4 1,05 0,7 0,2 0 13 7 0,0324
RI 10 0,85 0,3 0,2 0 0,3 0,45 6 7 0,05
RI 14 0,15 0,35 0,3 0,5 1 0,05 15 7 0,0238
RI 15 1,45 0,65 1,2 0,4 4,1 0,3 22 8 0,0875
RI 18 0,15 0,05 0,05 0,7 0 0,1 9 5 0,0311
RI 20 0 0,05 0,35 0,45 0,8 0 4 7 0,0714
TOT RI
16,1 6,9 9,3 9,55 8,45 1,25 117
0,0952
Procent 0,22 0,09 0,13 0,13 0,11 0,017
RF 1 0,45 0,65 0,2 0 0,3 0 2 7 0,1142
RF 10 0,1 0,15 0,25 0,15 0,2 0 3 7 0,0404
RF 11 1,2 0 0,1 0 0,1 0 5 9 0,0311
RF 12 2,1 0,2 0,3 0 0,1 0 1 9 0,3222
RF 14 0,15 0,6 0,6 0,35 0,05 0 7 3 0,0833

108
RF 18 0 1,15 0 0,4 0,5 0 7 8 0,0401
TOT RF
4 2,75 1,45 0,9 1,25 0 25
0,1052
Procent 0,37 0,25 0,13 0,083 0,12 0
RUR 1 3,6 1,55 1,9 1,9 1,85 0 8 7 0,1928
RUR 3 3,1 0,55 3,1 1,75 0,65 0 3 7 0,4357
RUR 6 0,3 0,4 1,4 1,2 2,4 0 10 7 0,0814
RUR 7 0 0,55 0,4 0 0,6 0 8 7 0,0276
RUR 9 1,4 0,4 0,6 0 0,2 0 3 7 0,1428
RUR 12 0,7 0,5 0,7 0,4 0,5 0 15 7 0,0267
RUR 13 0 0,2 0,3 0 0,1 0,2 4 7 0,0321
TOT RUR
10,8 4,15 8,4 5,25 6,3 0,2 51
0,1341
Procent
0,32 0,12 0,25 0,15 0,19 0,01

109
Appendix D: Field observation Time Place Summary Category
28-aug Technical office Rundu Oilbarrels are repainted in blue and white and placed
along different roads at Rundu. They are emptied and
collected daily by contractors.
waste collection,
disposal and
treatment
28-aug Technical office Rundu A supply of 120 l plastics waste containers. They are
placed by contractors in diiferent places in town. The
technical office should have a register of them.
waste collection,
disposal and
treatment
28-aug Along the roads Many dumping sites can be spotted along the roads,
specially in the informal areas. Needs to be
investigated and controlled.
waste collection,
disposal and
treatment
28-aug Near SWAPO House
Rundu
A group of people sits near several large white plastic
bags. They seems to collect or have collecting mixed
waste in the plastic bags. The plastic bags where
rented from a company.
waste collection,
disposal and
treatment
28-aug Rundu Waste disposal
Site
Outside the disposal site are large areas of open
dumping, the waste smokes from uncontrolled
incineration.
waste collection,
disposal and
treatment
28-aug Rundu Waste disposal
Site
The disposal sites are fenced, but the guard is not
present. Everyone can enter the disposal site. The
disposal site have one machine to deal with the waste,
however it is broken.
waste collection,
disposal and
treatment
28-aug Rundu Waste disposal
Site
The waste at the disposal site mostly compiles of
packaging. Papper, glass, metall etc. Very few
organic wast can be seen.
waste
characteristics
28-aug Rundu Waste disposal
Site
At the disposal site several womens (10-20) are
collecting glass and metall into plastic bags with
different colors. The womens are not alowed to bring
children and most sign when they enter the area. It is
unclear who buy the waste.
informal workers
29-aug Outskirts of Rundu Relativly large open dumping site along the road.
Two conteiners with RTC (Rundu town council)
marked on the side stands at the dumping sites. They
are full. A lot of incineration at the site.
waste collection,
disposal and
treatment
29-aug Outskirts of Rundu At a large open dumping site two women sort out tin
cans and other packaging in to black plastic bags. A
children without shoes came with a 120l plastic
container with waste from nearby informal area.
informal workers
30-aug Nkurenkuru Around houses there often plastic waste (bags etc)
however very little else waste
waste
characteristics
30-aug Nkurenkuru dumping
site
Nkurenkuru has a temporary dumping site. The waste
are stacked up prety nicely in a pile. Much of the
waste seems to be glass bottles. NTC pays the
transport of waste from the town to the dumping site.
waste collection,
disposal and
treatment
06-sep Outside SAREP office Large pile of gardening wate. Some plastic and paper
aswell. Size of a smal "majbrasa". Have been present
during a couples of weeks
waste collection,
disposal and
treatment
10-sep Greenhouse guesthouse A wagon with no wheels is used as a waste depo.
When the wagon is full wheels are put on and the
wagon is emptied somewhere.
waste collection,
disposal and
treatment
10-sep Greenhouse guesthouse Contractors emptying the communal collection
barrels (Keep Rundu clean). A small truck were used.
~ 5 people worked on the truck. The barrells were
turned upside down and the waste was put on a fabric
beneeth the barrel. The fabric was then lifted up on
the truck by hand. Same piece of fabric for all
barrells. Heavy lifting!
waste collection,
disposal and
treatment
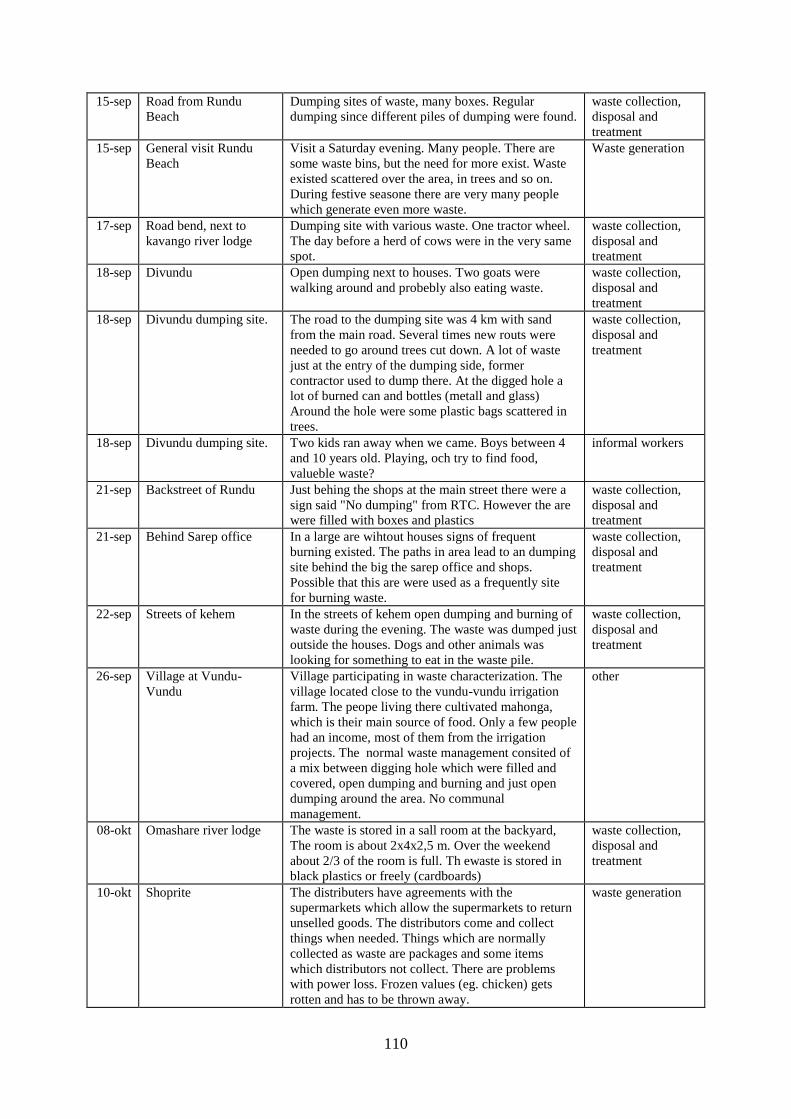
110
15-sep Road from Rundu
Beach
Dumping sites of waste, many boxes. Regular
dumping since different piles of dumping were found.
waste collection,
disposal and
treatment
15-sep General visit Rundu
Beach
Visit a Saturday evening. Many people. There are
some waste bins, but the need for more exist. Waste
existed scattered over the area, in trees and so on.
During festive seasone there are very many people
which generate even more waste.
Waste generation
17-sep Road bend, next to
kavango river lodge
Dumping site with various waste. One tractor wheel.
The day before a herd of cows were in the very same
spot.
waste collection,
disposal and
treatment
18-sep Divundu Open dumping next to houses. Two goats were
walking around and probebly also eating waste.
waste collection,
disposal and
treatment
18-sep Divundu dumping site. The road to the dumping site was 4 km with sand
from the main road. Several times new routs were
needed to go around trees cut down. A lot of waste
just at the entry of the dumping side, former
contractor used to dump there. At the digged hole a
lot of burned can and bottles (metall and glass)
Around the hole were some plastic bags scattered in
trees.
waste collection,
disposal and
treatment
18-sep Divundu dumping site. Two kids ran away when we came. Boys between 4
and 10 years old. Playing, och try to find food,
valueble waste?
informal workers
21-sep Backstreet of Rundu Just behing the shops at the main street there were a
sign said "No dumping" from RTC. However the are
were filled with boxes and plastics
waste collection,
disposal and
treatment
21-sep Behind Sarep office In a large are wihtout houses signs of frequent
burning existed. The paths in area lead to an dumping
site behind the big the sarep office and shops.
Possible that this are were used as a frequently site
for burning waste.
waste collection,
disposal and
treatment
22-sep Streets of kehem In the streets of kehem open dumping and burning of
waste during the evening. The waste was dumped just
outside the houses. Dogs and other animals was
looking for something to eat in the waste pile.
waste collection,
disposal and
treatment
26-sep Village at Vundu-
Vundu
Village participating in waste characterization. The
village located close to the vundu-vundu irrigation
farm. The peope living there cultivated mahonga,
which is their main source of food. Only a few people
had an income, most of them from the irrigation
projects. The normal waste management consited of
a mix between digging hole which were filled and
covered, open dumping and burning and just open
dumping around the area. No communal
management.
other
08-okt Omashare river lodge The waste is stored in a sall room at the backyard,
The room is about 2x4x2,5 m. Over the weekend
about 2/3 of the room is full. Th ewaste is stored in
black plastics or freely (cardboards)
waste collection,
disposal and
treatment
10-okt Shoprite The distributers have agreements with the
supermarkets which allow the supermarkets to return
unselled goods. The distributors come and collect
things when needed. Things which are normally
collected as waste are packages and some items
which distributors not collect. There are problems
with power loss. Frozen values (eg. chicken) gets
rotten and has to be thrown away.
waste generation
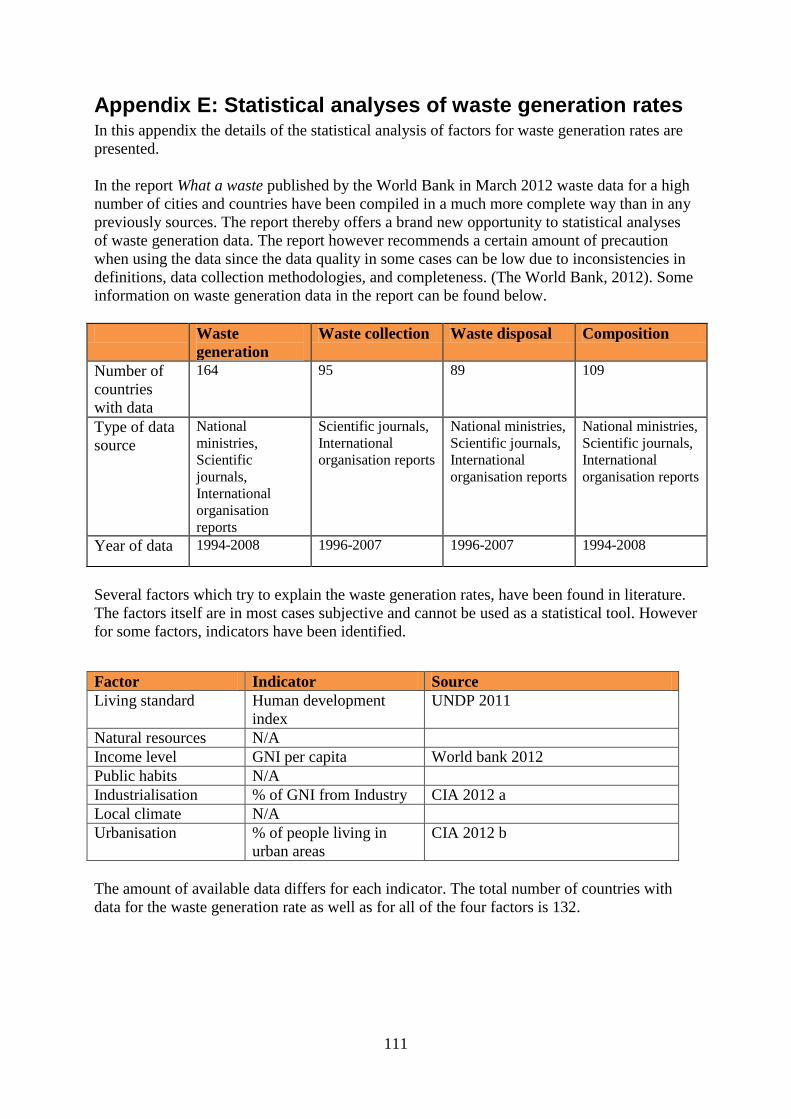
111
Appendix E: Statistical analyses of waste generation rates In this appendix the details of the statistical analysis of factors for waste generation rates are
presented.
In the report What a waste published by the World Bank in March 2012 waste data for a high
number of cities and countries have been compiled in a much more complete way than in any
previously sources. The report thereby offers a brand new opportunity to statistical analyses
of waste generation data. The report however recommends a certain amount of precaution
when using the data since the data quality in some cases can be low due to inconsistencies in
definitions, data collection methodologies, and completeness. (The World Bank, 2012). Some
information on waste generation data in the report can be found below.
Waste
generation
Waste collection Waste disposal Composition
Number of
countries
with data
164 95 89 109
Type of data
source
National
ministries,
Scientific
journals,
International
organisation
reports
Scientific journals,
International
organisation reports
National ministries,
Scientific journals,
International
organisation reports
National ministries,
Scientific journals,
International
organisation reports
Year of data 1994-2008 1996-2007 1996-2007 1994-2008
Several factors which try to explain the waste generation rates, have been found in literature.
The factors itself are in most cases subjective and cannot be used as a statistical tool. However
for some factors, indicators have been identified.
The amount of available data differs for each indicator. The total number of countries with
data for the waste generation rate as well as for all of the four factors is 132.
Factor Indicator Source
Living standard Human development
index
UNDP 2011
Natural resources N/A
Income level GNI per capita World bank 2012
Public habits N/A
Industrialisation % of GNI from Industry CIA 2012 a
Local climate N/A
Urbanisation % of people living in
urban areas
CIA 2012 b

112
Land Income level Waste gen
[kg/cap/day]
Gin per cap
[US dollar]
HDI Urbanizati
on
[% of
pop.]
Industry
(% of
GNI)
Brunei High income:
nonOECD
0,87 31800 0,84 76 67
Croatia High income:
nonOECD
0,29 13850 0,80 58 26
Cyprus High income:
nonOECD
2,07 29450 0,84 70 17
Kuwait High income:
nonOECD
5,72 48910 0,76 98 47
Oman High income:
nonOECD
0,70 19260 0,71 73 50
Qatar High income:
nonOECD
1,33 80440 0,83 96 73
Saudi Arabia High income:
nonOECD
1,30 17820 0,46 82 69
The Bahamas High income:
nonOECD
3,25 21960 0,73 84 7
United Arab Emirates High income:
nonOECD
1,66 40760 0,73 84 54
Australia High income:
OECD
2,23 46200 0,93 89 25
Austria High income:
OECD
2,40 48300 0,89 68 29
Belgium High income:
OECD
1,33 46160 0,89 97 22
Canada High income:
OECD
2,33 45560 0,91 81 27
Czech Republic High income:
OECD
1,10 18520 0,86 74 38
Denmark High income:
OECD
2,34 60390 0,89 87 19
Estonia High income:
OECD
1,47 15200 0,83 69 29
Finland High income:
OECD
2,13 48420 0,88 85 29
France High income:
OECD
1,92 42420 0,88 85 19
Germany High income:
OECD
2,11 43980 0,91 74 29
Greece High income:
OECD
2,00 25030 0,86 61 18
Hungary High income:
OECD
1,92 12730 0,82 68 31
Iceland High income:
OECD
1,56 35020 0,90 93 25
Ireland High income:
OECD
3,58 38580 0,91 62 29
Israel High income:
OECD
2,12 28930 0,89 92 31
Italy High income:
OECD
2,23 35330 0,87 68 25
Japan High income:
OECD
1,71 45180 0,90 67 27
Luxembourg High income:
OECD
2,31 78130 0,87 85 14

113
Netherlands High income:
OECD
2,12 49730 0,91 83 24
New Zealand High income:
OECD
3,68 29350 0,91 86 25
Norway High income:
OECD
2,80 88890 0,94 79 40
Poland High income:
OECD
0,88 12480 0,81 61 34
Portugal High income:
OECD
2,21 21250 0,81 61 23
Slovakia High income:
OECD
1,37 16070 0,88 55 36
Slovenia High income:
OECD
1,21 23610 0,51 50 7
South Korea High income:
OECD
1,24 20870 0,90 83 39
Spain High income:
OECD
2,13 30990 0,88 77 26
Sweden High income:
OECD
1,61 53230 0,90 85 27
Switzerland High income:
OECD
2,61 76380 0,90 74 28
United Kingdom High income:
OECD
1,79 37780 0,86 80 21
United States of
America
High income:
OECD
2,58 48450 0,68 82 19
Bangladesh Low income 0,43 770 0,50 28 29
Benin Low income 0,54 780 0,43 42 6
Burundi Low income 0,55 250 0,32 11 21
Central African
Republic
Low income 0,50 470 0,34 39 15
Chad Low income 0,50 690 0,33 28 7
Eritrea Low income 0,50 430 0,35 22 34
Ethiopia Low income 0,30 400 0,36 17 13
Gambia Low income 0,53 610 0,42 58 17
Haiti Low income 1,00 700 0,45 52 16
Kenya Low income 0,30 820 0,51 22 16
Madagascar Low income 0,80 430 0,48 30 16
Malawi Low income 0,50 340 0,40 20 17
Mali Low income 0,65 610 0,36 36 22
Mauritania Low income 0,50 1000 0,45 41 38
Mozambique Low income 0,14 470 0,32 38 24
Nepal Low income 0,12 540 0,46 19 15
Niger Low income 0,49 360 0,30 17 16
Rwanda Low income 0,52 570 0,74 19 14
Sierra Leone Low income 0,45 340 0,87 38 22
Togo Low income 0,52 560 0,77 43 23
United Republic of
Tanzania
Low income 0,26 540 0,91 26 24
Zimbabwe Low income 0,53 640 0,38 38 25
Albania Lower middle
income
0,77 3980 0,74 52 20

114
Armenia Lower middle
income
0,68 3360 0,72 64 41
Belize Lower middle
income
2,37 3690 0,70 52 20
Bhutan Lower middle
income
1,46 2070 0,52 35 45
Bolivia Lower middle
income
0,33 2040 0,66 67 40
Cameroon Lower middle
income
0,77 1210 0,48 58 31
Egypt Lower middle
income
1,37 2600 0,64 43 38
El Salvador Lower middle
income
1,13 3480 0,67 64 30
Fiji Lower middle
income
2,10 3680 0,69 52 20
Georgia Lower middle
income
1,69 2860 0,73 53 23
Ghana Lower middle
income
0,09 1410 0,54 51 21
Guatemala Lower middle
income
2,00 2870 0,57 49 24
Honduras Lower middle
income
1,45 1970 0,62 52 26
India Lower middle
income
0,34 1410 0,55 30 26
Indonesia Lower middle
income
0,52 2940 0,62 44 47
Ivory Coast Lower middle
income
0,48 1100 0,40 51 21
Laos Lower middle
income
0,70 1130 0,52 33 35
Lesotho Lower middle
income
0,50 1220 0,45 27 33
Mongolia Lower middle
income
0,66 2320 0,65 62 33
Morocco Lower middle
income
1,46 2970 0,58 58 32
Nicaragua Lower middle
income
1,10 1170 0,59 57 26
Nigeria Lower middle
income
0,56 1200 0,46 50 34
Pakistan Lower middle
income
0,84 1120 0,50 36 26
Paraguay Lower middle
income
0,21 2970 0,66 61 19
Philippines Lower middle
income
0,50 2210 0,64 49 32
Republic of the Congo Lower middle
income
0,53 2270 0,29 62 71
Senegal Lower middle
income
0,52 1070 0,77 42 23
Sudan Lower middle
income
0,79 1300 0,41 40 29
Swaziland Lower middle
income
0,51 3300 0,52 21 47
Syria Lower middle
income
1,37 2750 0,63 56 27
Vanuatu Lower middle 3,28 2870 0,64 26 10

115
income
Vietnam Lower middle
income
1,46 1260 0,59 30 40
Zambia Lower middle
income
0,21 1160 0,46 36 35
Algeria Upper middle
income
1,21 4470 0,70 66 57
Angola Upper middle
income
0,48 4060 0,49 59 66
Argentina Upper middle
income
1,22 9740 0,80 92 31
Belarus Upper middle
income
0,78 5830 0,76 75 46
Botswana Upper middle
income
1,03 7480 0,63 61 45
Brazil Upper middle
income
1,03 10720 0,72 87 28
Bulgaria Upper middle
income
1,28 6550 0,77 71 31
Chile Upper middle
income
1,08 12280 0,80 89 42
China Upper middle
income
1,02 4940 0,69 47 47
Colombia Upper middle
income
0,95 6110 0,71 75 38
Costa Rica Upper middle
income
1,36 7660 0,74 64 22
Cuba Upper middle
income
0,81 5460 0,78 75 21
Dominican Republic Upper middle
income
1,18 5240 0,69 69 26
Ecuador Upper middle
income
1,13 4140 0,72 67 35
Gabon Upper middle
income
0,45 7980 0,67 86 54
Iran Upper middle
income
0,16 4520 0,71 71 38
Jamaica Upper middle
income
0,18 4980 0,73 52 30
Jordan Upper middle
income
1,04 4380 0,70 79 31
Latvia Upper middle
income
1,03 12350 0,81 68 22
Lebanon Upper middle
income
1,18 9110 0,74 87 20
Lithuania Upper middle
income
1,10 12280 0,81 67 28
Macedonia Upper middle
income
1,06 4730 0,49 59 27
Malaysia Upper middle
income
1,52 8420 0,76 72 40
Mexico Upper middle
income
1,24 9240 0,77 78 34
Namibia Upper middle
income
0,50 4700 0,63 38 33
Panama Upper middle
income
1,21 7910 0,77 75 17
Peru Upper middle
income
1,00 5500 0,72 77 38

116
Republic of Serbia Upper middle
income
2,98 5680 0,77 56 19
Romania Upper middle
income
1,04 7910 0,76 57 33
Russia Upper middle
income
0,93 10400 0,43 73 37
Suriname Upper middle
income
1,36 7630 0,68 69 24
Thailand Upper middle
income
1,76 4420 0,61 34 34
Tunisia Upper middle
income
0,81 4070 0,70 67 35
Turkey Upper middle
income
1,77 10410 0,70 70 28
Turkmenistan Upper middle
income
0,98 4110 0,69 50 25
Uruguay Upper middle
income
0,11 11860 0,78 92 22
Venezuela Upper middle
income
1,14 11920 0,74 93 36
.
By using the identified indicators for the different factors the correlation between the waste
generation rate and the suggested factors can be analyzed.
To test the correlation a multiregression analysis, with waste generation as the dependent
variable and indicators as independent variables have been used. Only linear relashonship
between the waste generation rate and the independent variables is tested.
For this to be possible the following assumptions have been made; the method assumes used
data to be normally distributed. Furthermore the all variables except the waste generation rate
are assumed to be independent of each other. Both these assumption might in this case
contribute to sources of error.
The waste generation rate is the result of one or several factors according to the following
equation:
equation (1)
Where y is the waste generation rate
k1,k2,k3 ... is the correlation coefficients for variable, or indicator 1,2 and 3
x1,x2,x3 is the value of the different indicators
m is the intersection with the y-axis
The equation is an extension of the more common single linear regression equation
. equation (2)
The first step of the analysis is to test the correlation between the waste generation rate, and
each of the independent variables individually according to equation 2.
To measure the strength of the relationship between the waste generation rate and the variable
the correlation coefficient r can be used. The correlation coefficient describes how well the
actual values fit to the linear function.

117
Another way of measuring is the coefficient of determination, R2. This coefficient expresses
the amount of variance on one dimension that can be explained by the variance on another
variable. The R2 values achieved in the linear regression indicates that variance in waste
generation rate best can be explained by variation in Income level since the R2 value is the
highest. The correlation between the waste generation rate and Living standards and
Urbanization respectively are similar when it comes to the R2 value. The Industrialization is
however very poor at explaining variances in the waste generation rate.
Living standard 0.2702
Urbanization 0.2214
Income level 0.3835
Industrialization 0.0051
What happens if the variables are combined into a multiple regression? With equation 1 a
linear regression are computed. The result can be found in below.
Regression Statistics
Multiple R 0,657326609
R Square 0,43207827
Adjusted R Square 0,414190972
Standard Error 0,668426489
Observations 132
The combined R2 value of 0,432 should be compared to the individual R
2 values. It is slightly
higher than the highest individual R2 value, but it can still only explain 43 % of the variances
in the waste generation rate.