Embed Size (px)
Citation preview
Presentation of Real Time Monitoring & Alert
Systems used in Singapore
By : Dr G H Tan (SysEng)
Agenda
1. Introduction
2. Automatic Real Time Monitoring & Alert System used in
Deep Excavations
3. Challenges of Operating the Real Time Systems
4. Workings of Vibrating Wire Gages and Manufacturer
Specifications
5. Measurement Flow from Vibrating Wire Signals until the
Engineering Units of kN force
6. Data Quality affected by Electromagnetic Noise Sources
and On site troubleshooting
7. Planning for Data Quality starts with proper site planning
8. Live Demonstration of the Types of Noise which can
increase or decrease the Strain Gage Forces measured
9. Q & A
Straits Times March 24th 2007
`
• SysEng is a System
Engineering Company with
Multi-disciplinary Engineering
Capabilities
• Started in 1994 by Engineers
• To deliver the Right Data , at
the Right Time, at the Right
Place with the Right Price
and the Right Quality to
make the Right Decision
• Vertical Integration of M2M
applications with a One-
Stop Shop Engineering
Solution Service to ease the
deployment and support of
complex technologies to
help in the growth of the
client’s business

An Automatic Real Time Monitoring & Alert System to help
Professional Engineers, Consultants and Authorities
monitor Geotechnical and Structural movements 24 x7
without any human effort.
The Benefits are :-
• Equipments & System are leased to clients without Fixed
Overheads, Engineering Team and Investments.
• Pays for Timely, Quality and Reliable data.
• No Hidden Repair and Support costs.
• One time setup fee and monthly monitoring fee to help your
cash flow.
• Leverage on SysEng Engineering Expertise in Sensors,
Electronics, Communication, Software, EMI Noise Prevention &
troubleshooting to support the clients.
• Technical Service Support with 24 Hours Alarm Monitoring
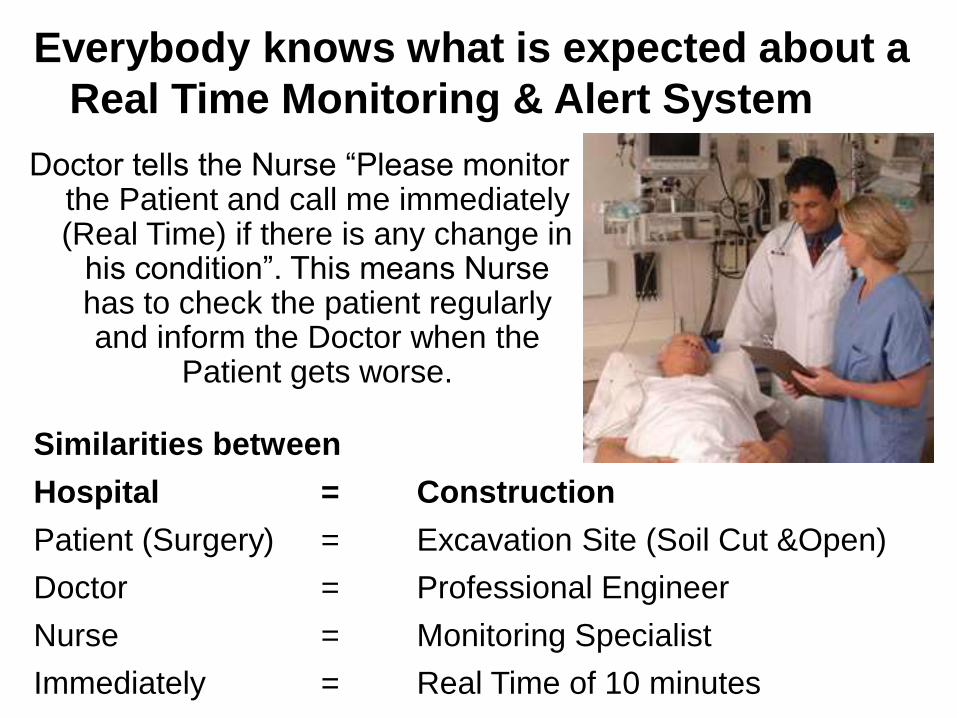
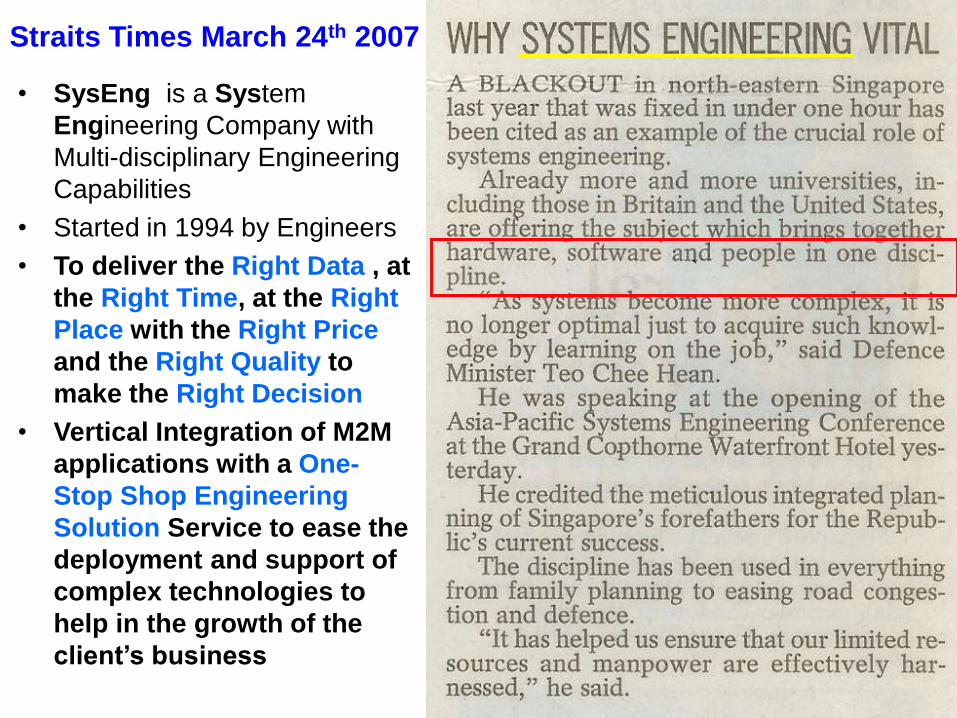
Everybody knows what is expected about a
Real Time Monitoring & Alert System
Doctor tells the Nurse “Please monitor the Patient and call me immediately (Real Time) if there is any change in
his condition”. This means Nurse has to check the patient regularly and inform the Doctor when the
Patient gets worse.
Similarities between
Hospital = Construction
Patient (Surgery) = Excavation Site (Soil Cut &Open)
Doctor = Professional Engineer
Nurse = Monitoring Specialist
Immediately = Real Time of 10 minutes
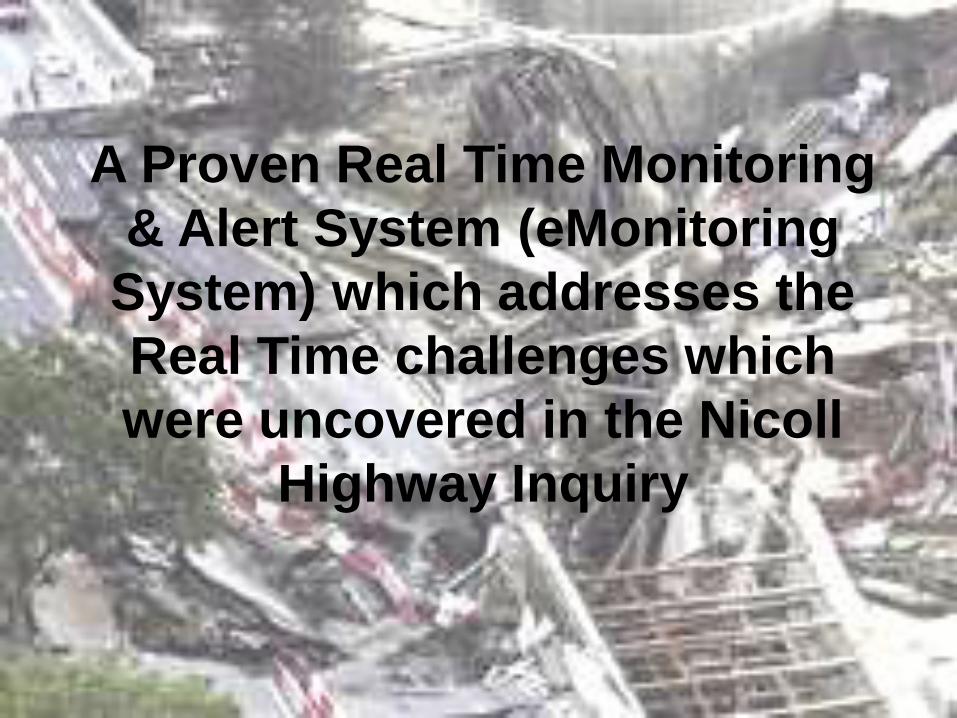
A Proven Real Time Monitoring
& Alert System (eMonitoring
System) which addresses the
Real Time challenges which
were uncovered in the Nicoll
Highway Inquiry
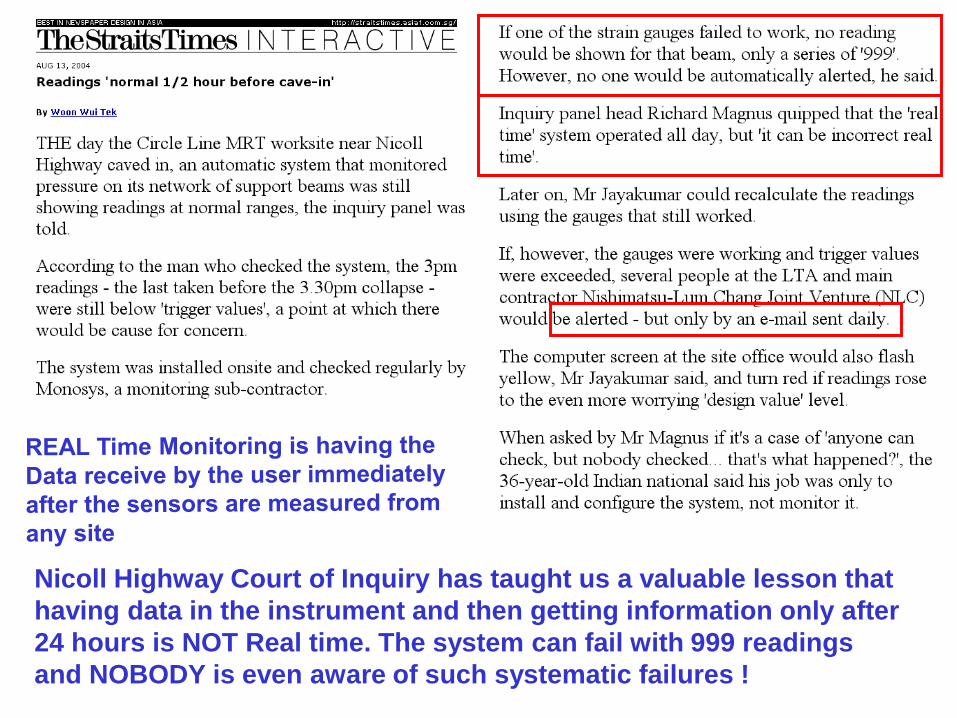
Nicoll Highway Court of Inquiry has taught us a valuable lesson that
having data in the instrument and then getting information only after
24 hours is NOT Real time. The system can fail with 999 readings
and NOBODY is even aware of such systematic failures !
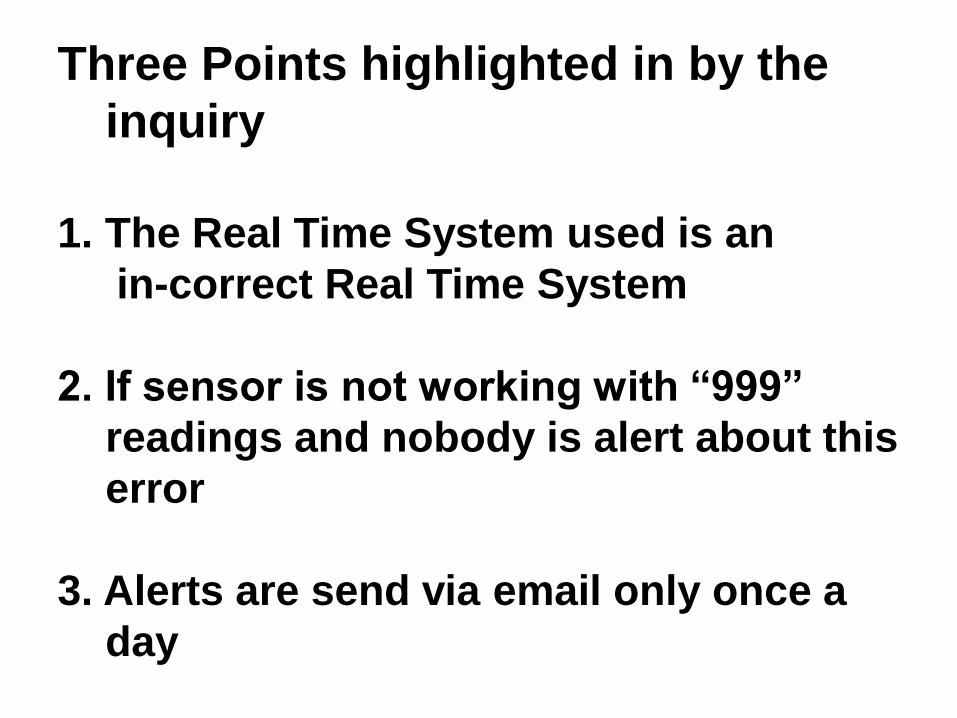
Three Points highlighted in by the
inquiry
1. The Real Time System used is an
in-correct Real Time System
2. If sensor is not working with “999”
readings and nobody is alert about this
error
3. Alerts are send via email only once a
day
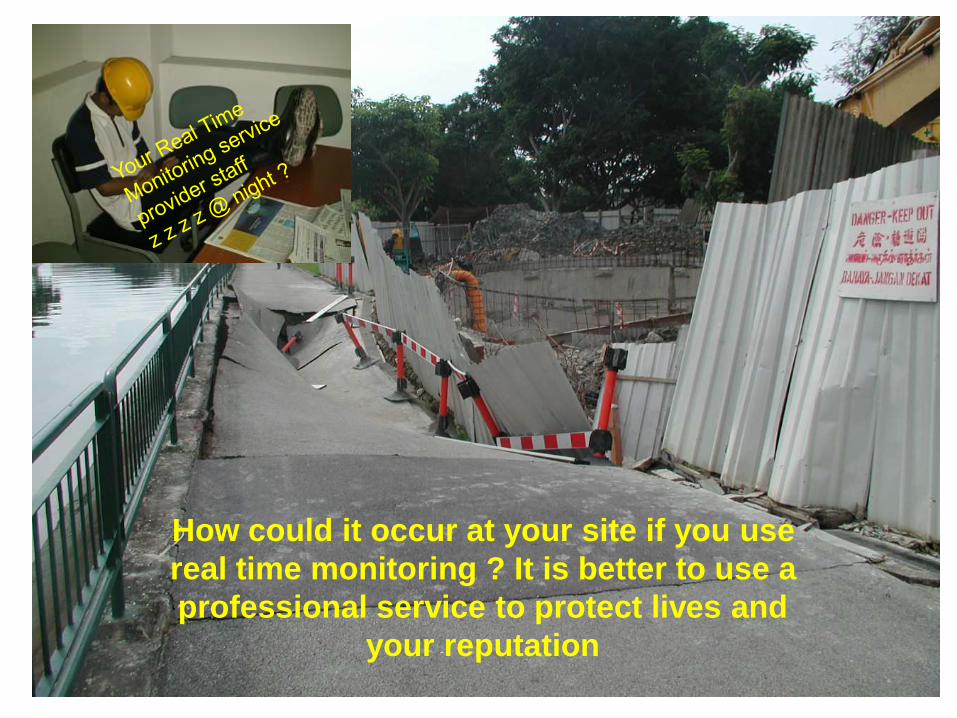
How could it occur at your site if you use
real time monitoring ? It is better to use a
professional service to protect lives and
your reputation
SysEng’s Proven Automated Real Time
Monitoring & Alert System (eMonitoring
System) which addresses theses challenges
•This System has been presented in many
International Civil Engineering Conferences
•It’s Development was funded by Singapore
InfoComm Development Authority
•It is used many Singapore Land Transport
Authority Monitoring Projects after the
Nicoll Highway incident
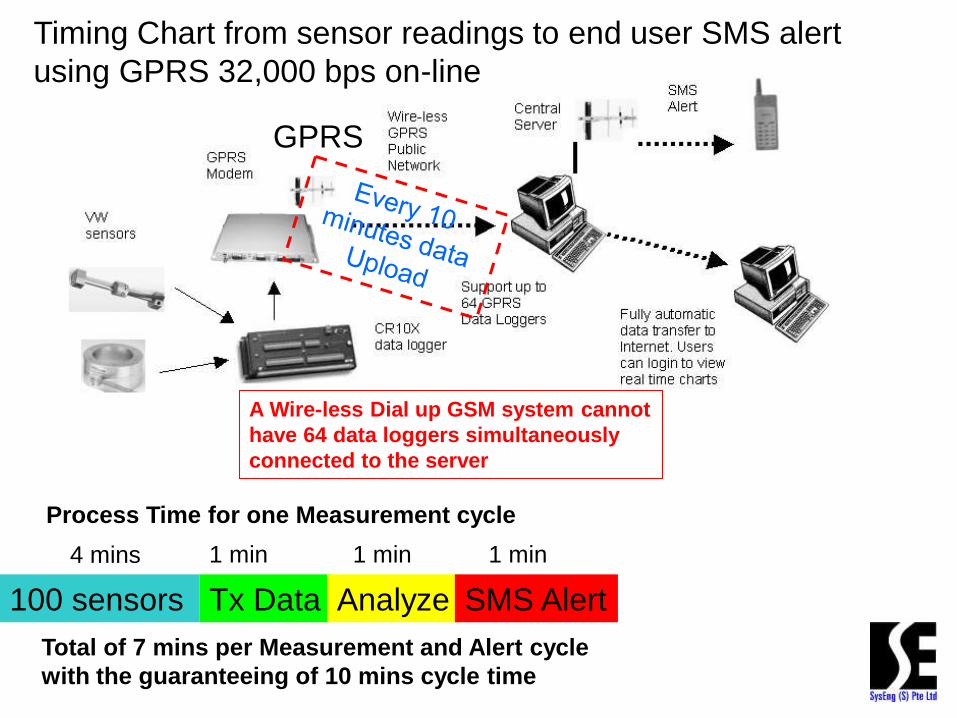
Timing Chart from sensor readings to end user SMS alert
using GPRS 32,000 bps on-line
Total of 7 mins per Measurement and Alert cycle
with the guaranteeing of 10 mins cycle time
GPRS
4 mins
100 sensors Tx Data
1 min
Analyze
1 min
SMS Alert
1 min
Process Time for one Measurement cycle
A Wire-less Dial up GSM system cannot
have 64 data loggers simultaneously
connected to the server
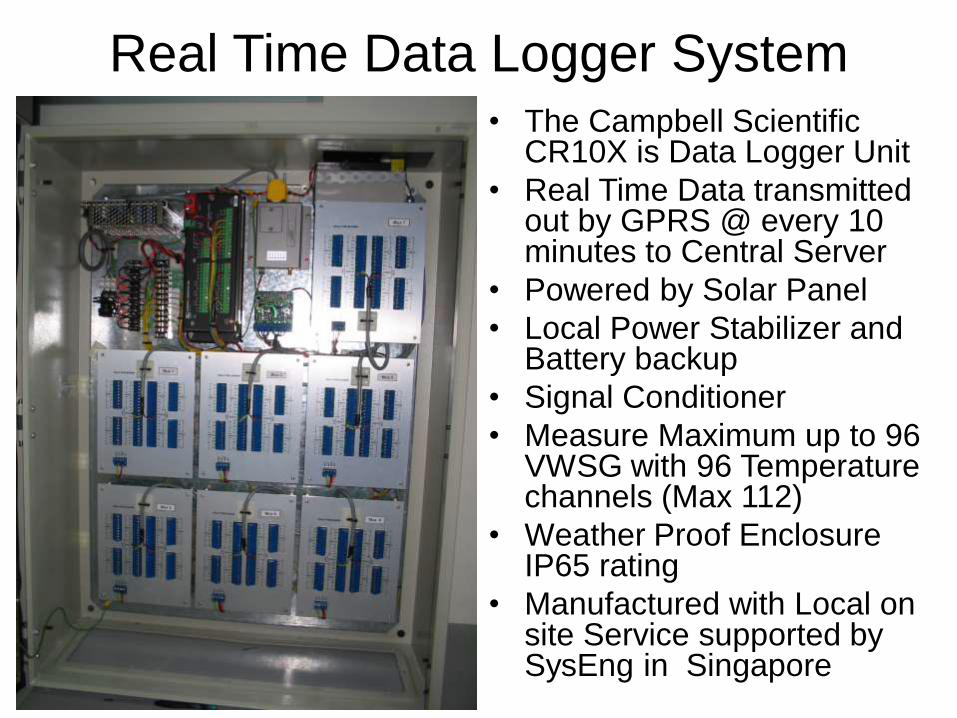
Real Time Data Logger System• The Campbell Scientific
CR10X is Data Logger Unit
• Real Time Data transmitted out by GPRS @ every 10 minutes to Central Server
• Powered by Solar Panel
• Local Power Stabilizer and Battery backup
• Signal Conditioner
• Measure Maximum up to 96 VWSG with 96 Temperature channels (Max 112)
• Weather Proof Enclosure IP65 rating
• Manufactured with Local on site Service supported by SysEng in Singapore
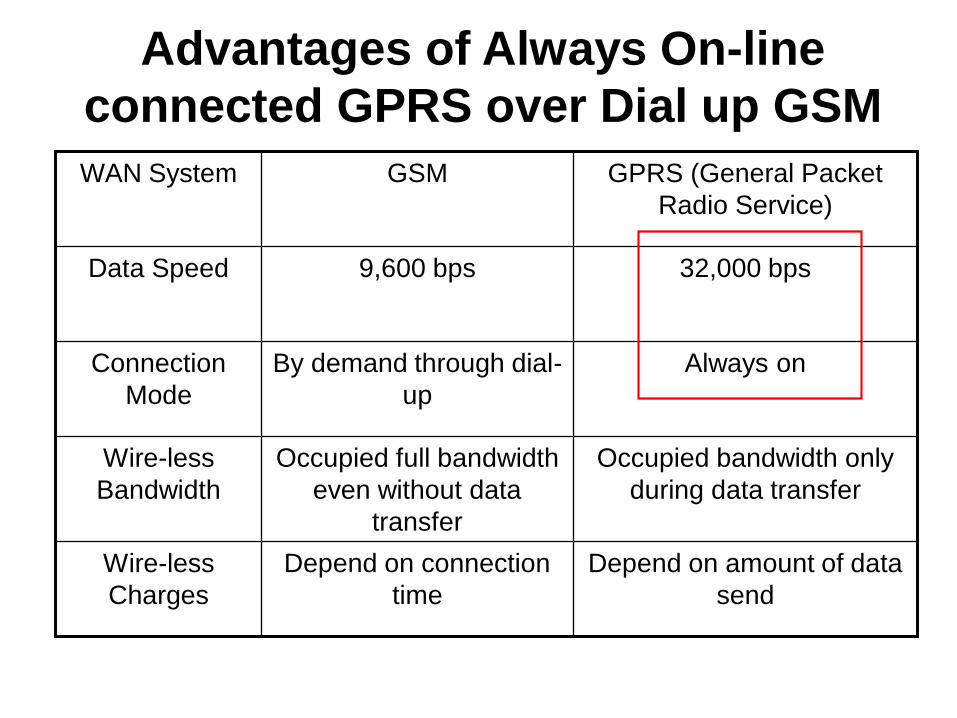
Advantages of Always On-line
connected GPRS over Dial up GSM
Depend on connection
time
Occupied full bandwidth
even without data
transfer
By demand through dial-
up
9,600 bps
GSM
Depend on amount of data
send
Wire-less
Charges
Occupied bandwidth only
during data transfer
Wire-less
Bandwidth
Always onConnection
Mode
32,000 bpsData Speed
GPRS (General Packet
Radio Service)
WAN System

IDA featured
SysEng in
their
Website as a
Recognition
of our
contribution
towards
M2M
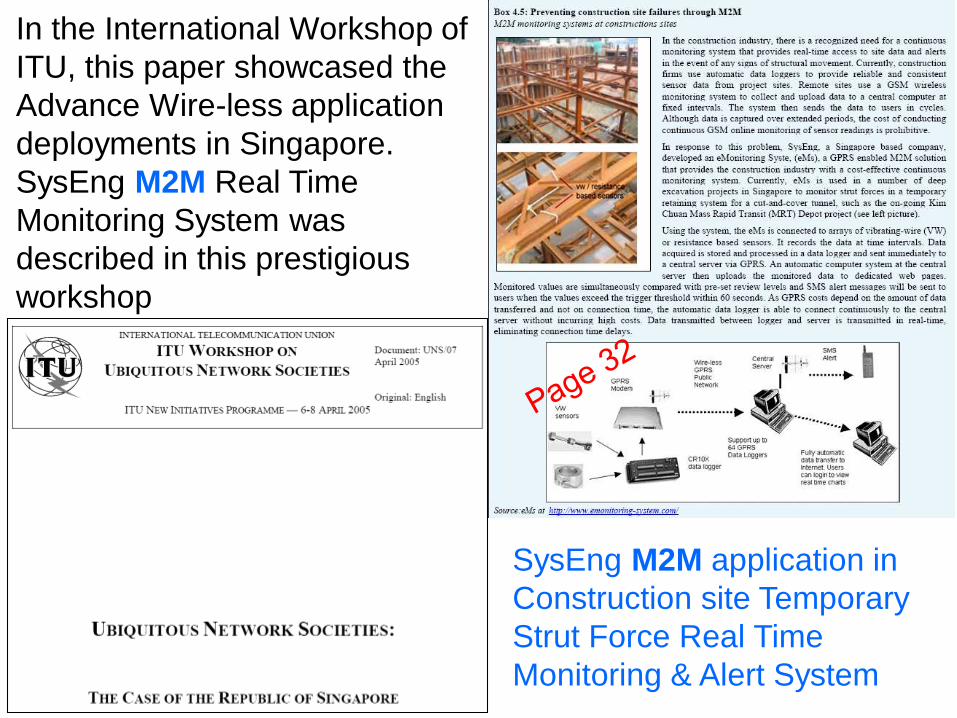
In the International Workshop of
ITU, this paper showcased the
Advance Wire-less application
deployments in Singapore.
SysEng M2M Real Time
Monitoring System was
described in this prestigious
workshop
SysEng M2M application in
Construction site Temporary
Strut Force Real Time
Monitoring & Alert System
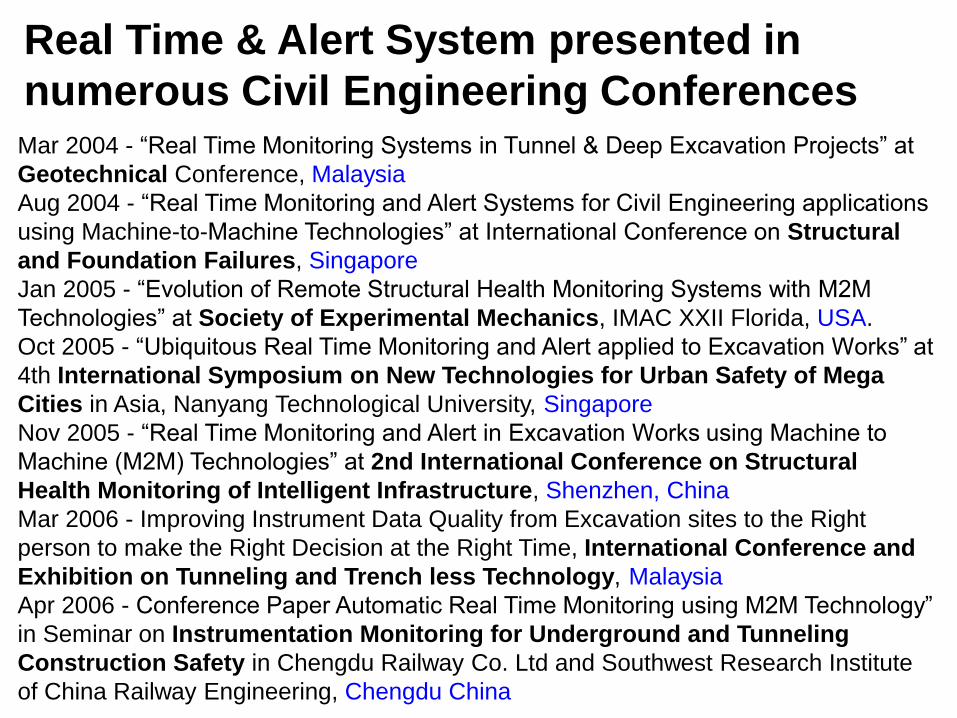
Mar 2004 - “Real Time Monitoring Systems in Tunnel & Deep Excavation Projects” at
Geotechnical Conference, Malaysia
Aug 2004 - “Real Time Monitoring and Alert Systems for Civil Engineering applications
using Machine-to-Machine Technologies” at International Conference on Structural
and Foundation Failures, Singapore
Jan 2005 - “Evolution of Remote Structural Health Monitoring Systems with M2M
Technologies” at Society of Experimental Mechanics, IMAC XXII Florida, USA.
Oct 2005 - “Ubiquitous Real Time Monitoring and Alert applied to Excavation Works” at
4th International Symposium on New Technologies for Urban Safety of Mega
Cities in Asia, Nanyang Technological University, Singapore
Nov 2005 - “Real Time Monitoring and Alert in Excavation Works using Machine to
Machine (M2M) Technologies” at 2nd International Conference on Structural
Health Monitoring of Intelligent Infrastructure, Shenzhen, China
Mar 2006 - Improving Instrument Data Quality from Excavation sites to the Right
person to make the Right Decision at the Right Time, International Conference and
Exhibition on Tunneling and Trench less Technology, Malaysia
Apr 2006 - Conference Paper Automatic Real Time Monitoring using M2M Technology”
in Seminar on Instrumentation Monitoring for Underground and Tunneling
Construction Safety in Chengdu Railway Co. Ltd and Southwest Research Institute
of China Railway Engineering, Chengdu China
Real Time & Alert System presented in
numerous Civil Engineering Conferences
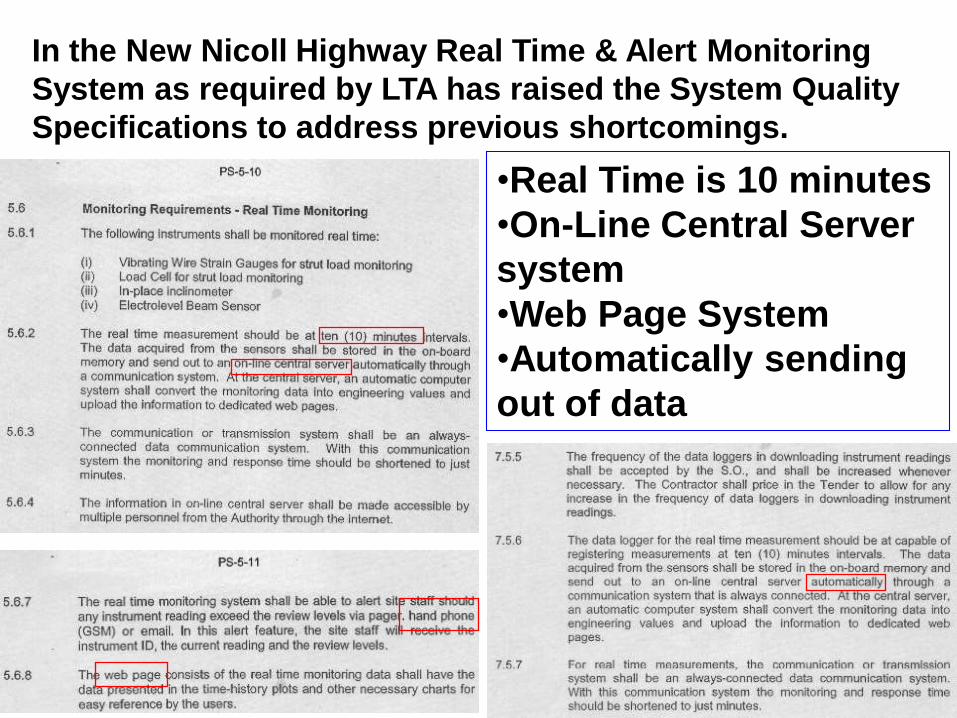
In the New Nicoll Highway Real Time & Alert Monitoring
System as required by LTA has raised the System Quality
Specifications to address previous shortcomings.
•Real Time is 10 minutes
•On-Line Central Server
system
•Web Page System
•Automatically sending
out of data
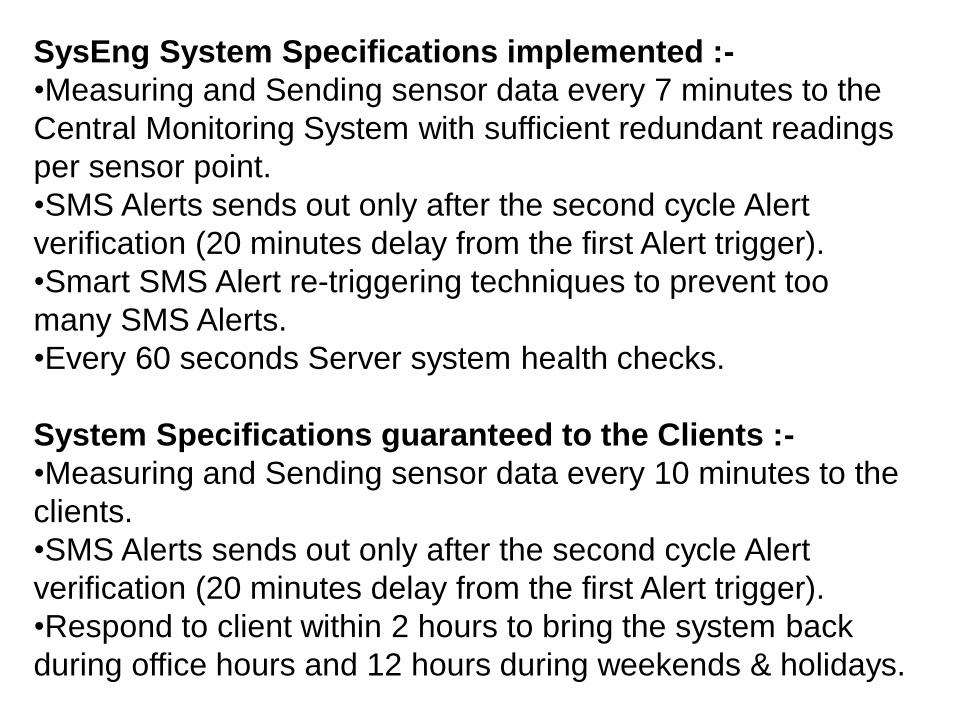
SysEng System Specifications implemented :-
•Measuring and Sending sensor data every 7 minutes to the
Central Monitoring System with sufficient redundant readings
per sensor point.
•SMS Alerts sends out only after the second cycle Alert
verification (20 minutes delay from the first Alert trigger).
•Smart SMS Alert re-triggering techniques to prevent too
many SMS Alerts.
•Every 60 seconds Server system health checks.
System Specifications guaranteed to the Clients :-
•Measuring and Sending sensor data every 10 minutes to the
clients.
•SMS Alerts sends out only after the second cycle Alert
verification (20 minutes delay from the first Alert trigger).
•Respond to client within 2 hours to bring the system back
during office hours and 12 hours during weekends & holidays.
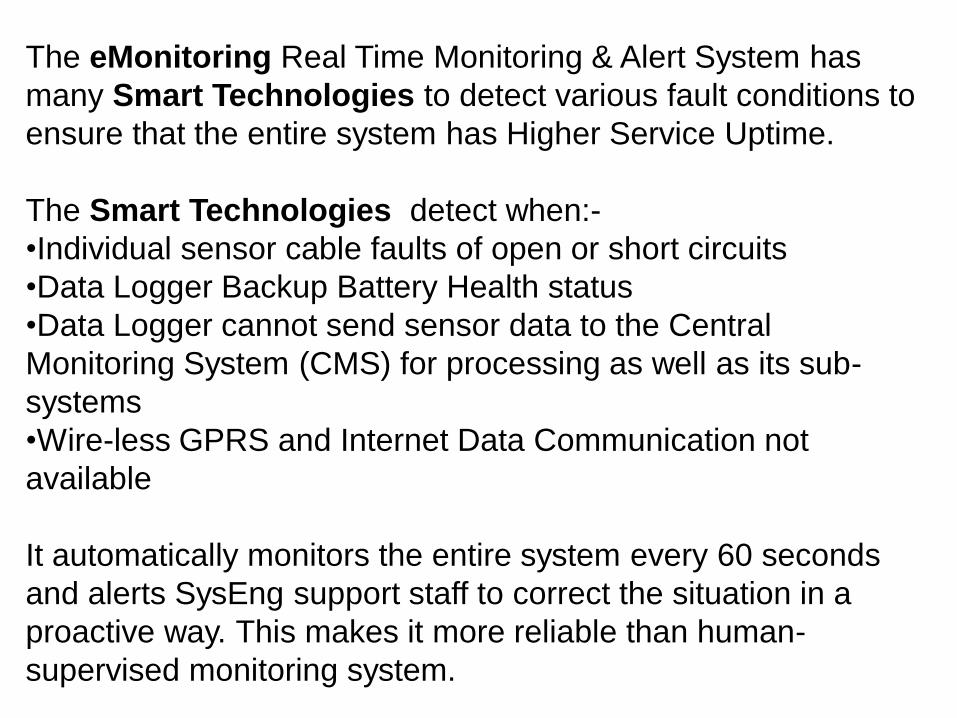
The eMonitoring Real Time Monitoring & Alert System has
many Smart Technologies to detect various fault conditions to
ensure that the entire system has Higher Service Uptime.
The Smart Technologies detect when:-
•Individual sensor cable faults of open or short circuits
•Data Logger Backup Battery Health status
•Data Logger cannot send sensor data to the Central
Monitoring System (CMS) for processing as well as its sub-
systems
•Wire-less GPRS and Internet Data Communication not
available
It automatically monitors the entire system every 60 seconds
and alerts SysEng support staff to correct the situation in a
proactive way. This makes it more reliable than human-
supervised monitoring system.
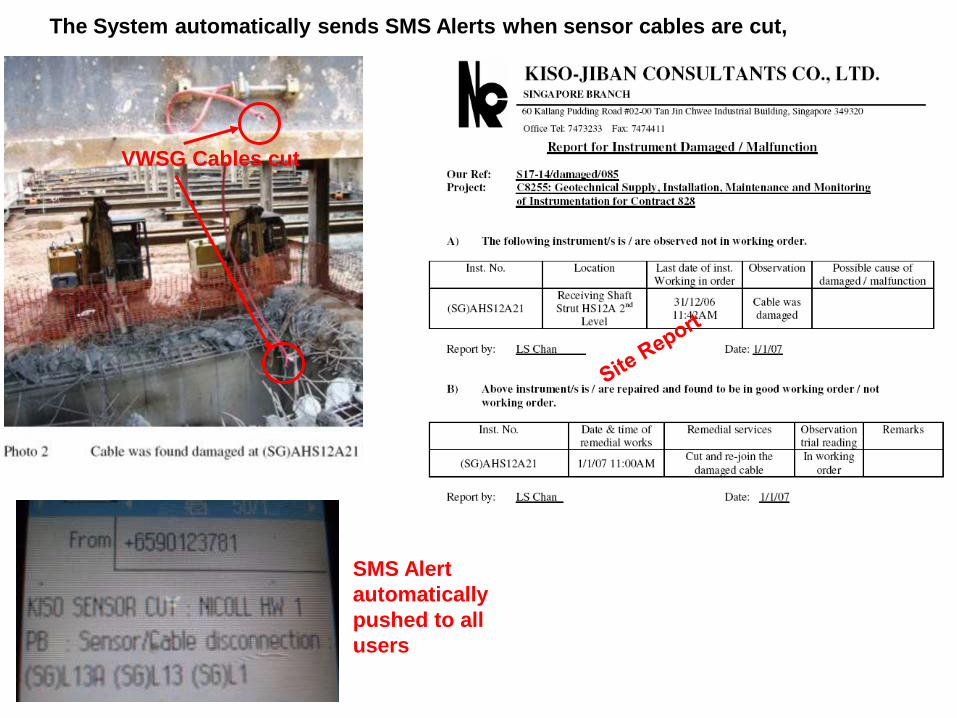
The System automatically sends SMS Alerts when sensor cables are cut,
VWSG Cables cut
SMS Alert
automatically
pushed to all
users
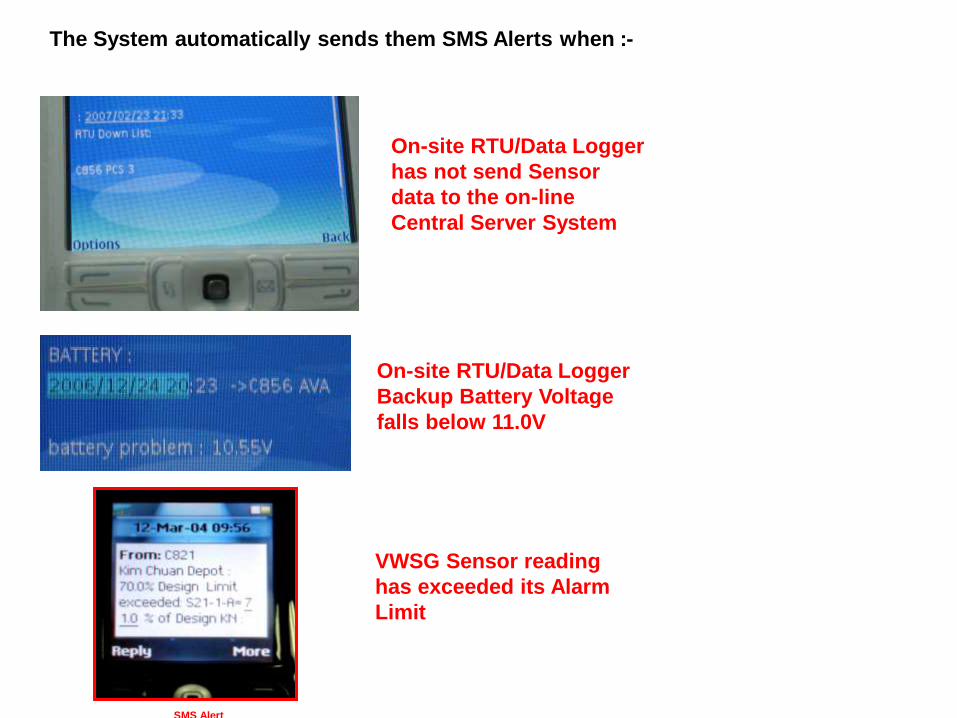
The System automatically sends them SMS Alerts when :-
On-site RTU/Data Logger
has not send Sensor
data to the on-line
Central Server System
On-site RTU/Data Logger
Backup Battery Voltage
falls below 11.0V
SMS Alert
VWSG Sensor reading
has exceeded its Alarm
Limit
With Real Time
Monitoring & Alert
System, the Demand
for Higher Sensor
Quality Data becomes
a Major Challenge
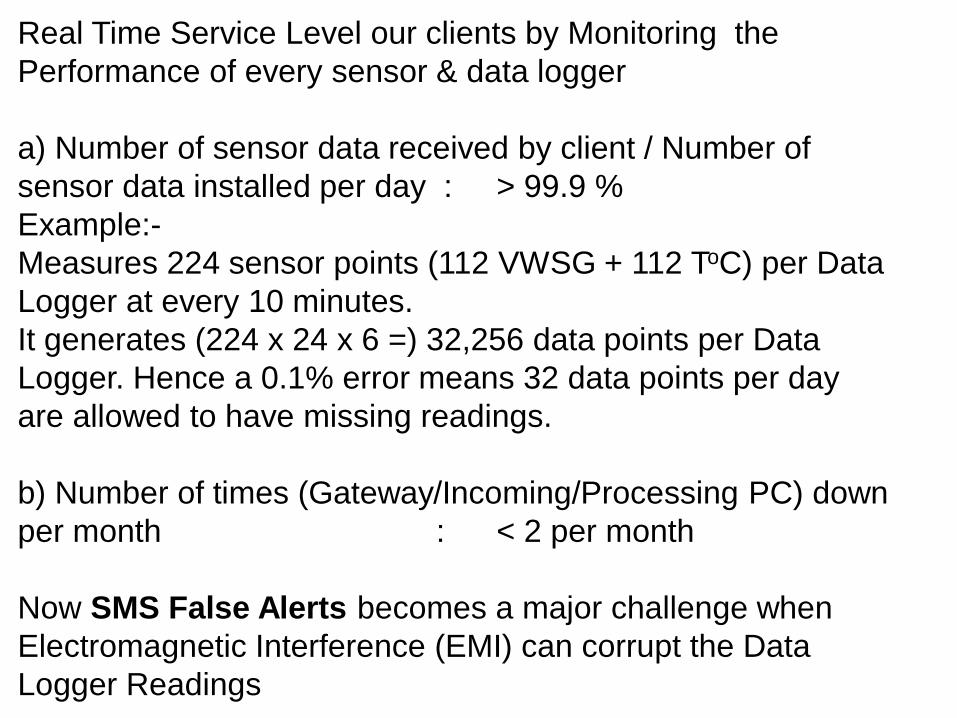
Real Time Service Level our clients by Monitoring the
Performance of every sensor & data logger
a) Number of sensor data received by client / Number of
sensor data installed per day : > 99.9 %
Example:-
Measures 224 sensor points (112 VWSG + 112 ToC) per Data
Logger at every 10 minutes.
It generates (224 x 24 x 6 =) 32,256 data points per Data
Logger. Hence a 0.1% error means 32 data points per day
are allowed to have missing readings.
b) Number of times (Gateway/Incoming/Processing PC) down
per month : < 2 per month
Now SMS False Alerts becomes a major challenge when
Electromagnetic Interference (EMI) can corrupt the Data
Logger Readings

Factors affecting the Quality
of data of sensors
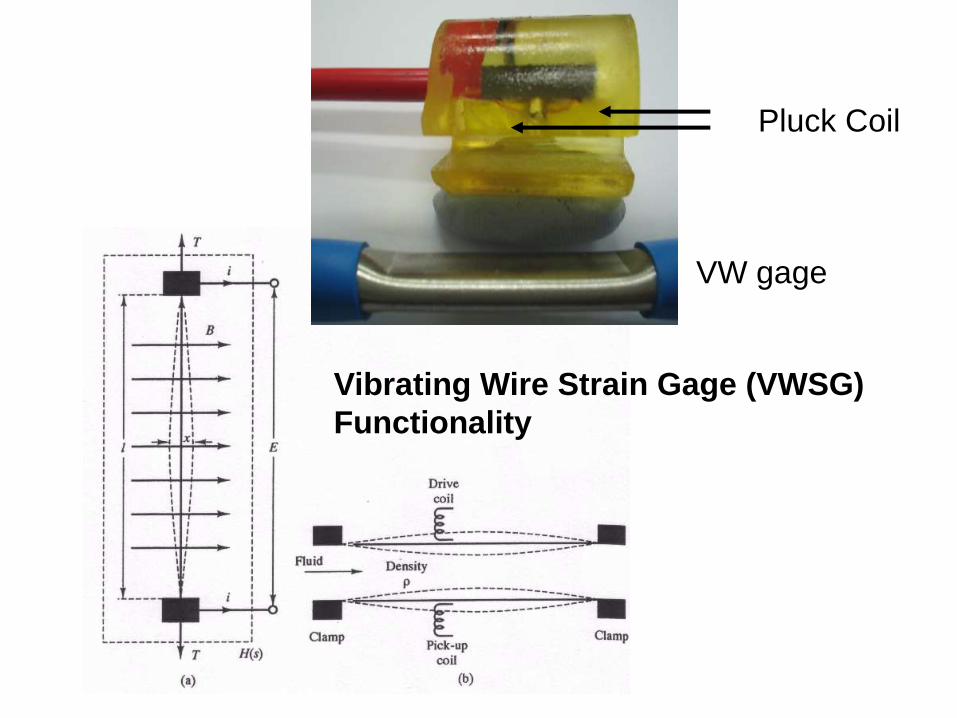
VW gage
Pluck Coil
Vibrating Wire Strain Gage (VWSG)
Functionality
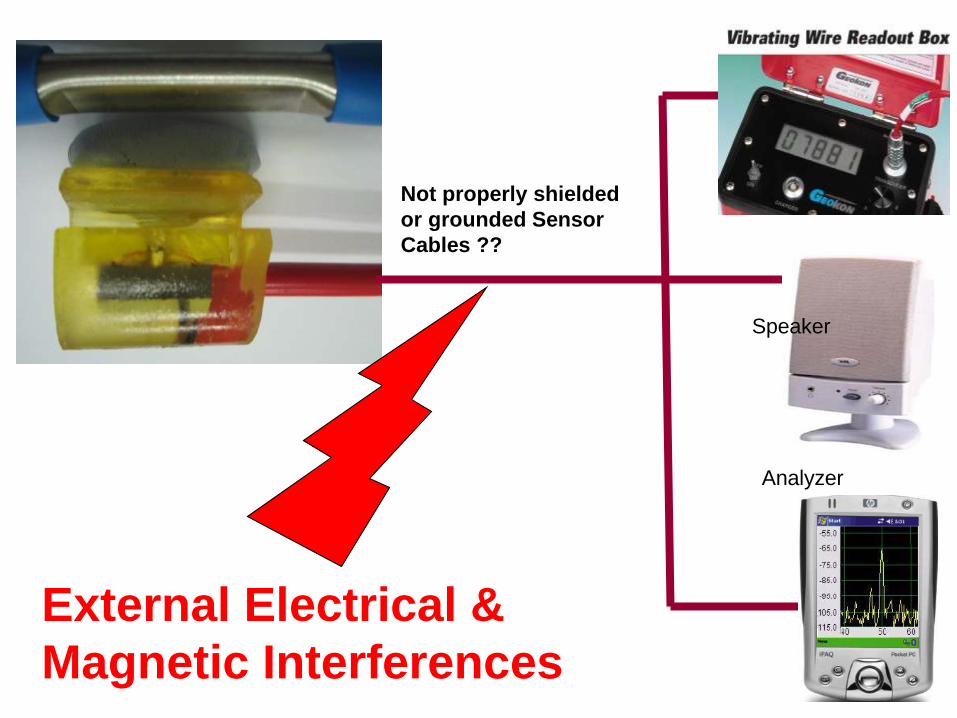
External Electrical &
Magnetic Interferences
Not properly shielded
or grounded Sensor
Cables ??
Speaker
Analyzer

The VWSG Specifications are taken from the
Manufacturers Website
Read the Fine print from the various Vibrating Wire
Strain Gage Manufacturers
•All VWSG can transmit out over long distances
without affecting output Quality ?
•How long is long 10 m or 10 km ?
•Immunity to noise, how high is the Noise level ?
•How large is the Signal to Noise ?
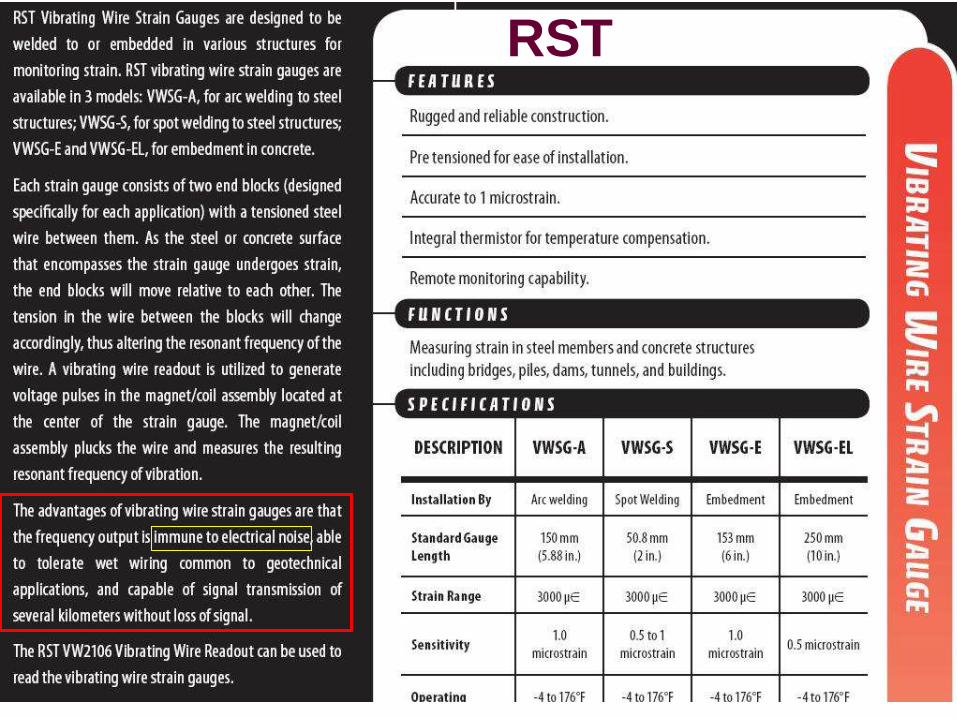
RST

SINCO
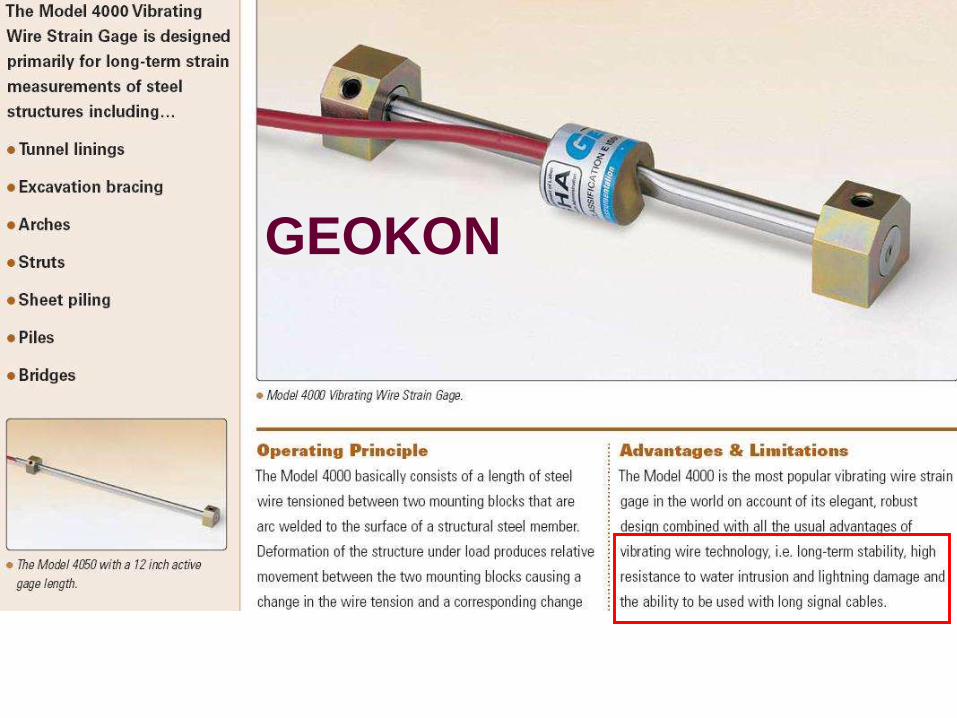
GEOKON
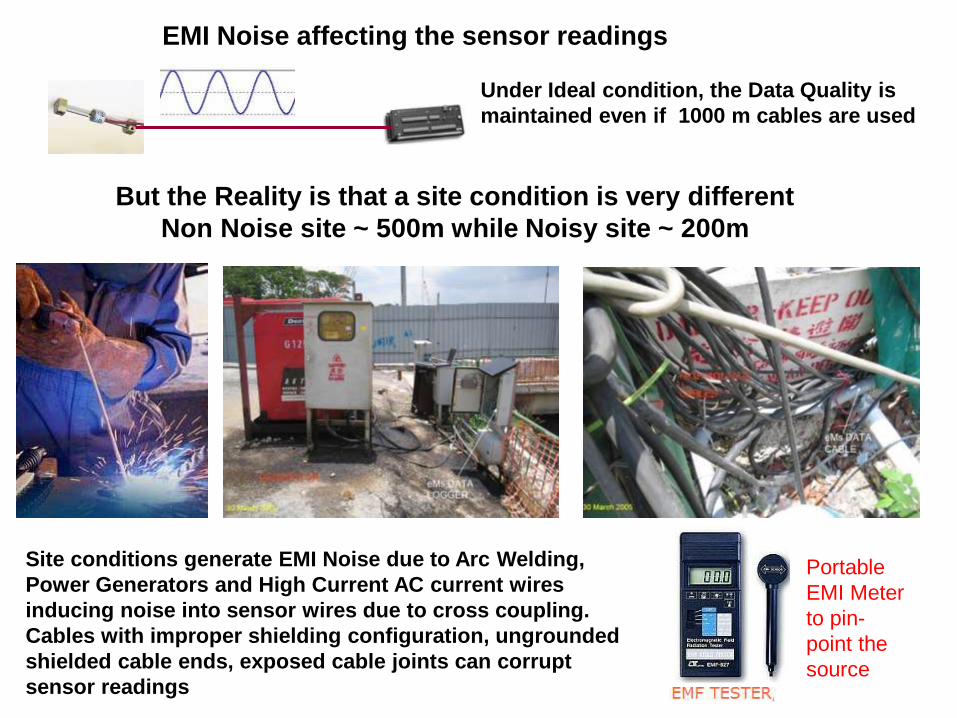
EMI Noise affecting the sensor readings
Under Ideal condition, the Data Quality is
maintained even if 1000 m cables are used
Site conditions generate EMI Noise due to Arc Welding,
Power Generators and High Current AC current wires
inducing noise into sensor wires due to cross coupling.
Cables with improper shielding configuration, ungrounded
shielded cable ends, exposed cable joints can corrupt
sensor readings
But the Reality is that a site condition is very different
Non Noise site ~ 500m while Noisy site ~ 200m
Portable
EMI Meter
to pin-
point the
source

What is Actually EMI ?

Generate EMI
No affected by EMI source

Electro Magnetic Interference Field
obeys the Rule of Inverse Square Law
EMI
Source
0
2
4
6
8
10
12
3 4 5 6 7 8
DISTANCE (CM)
ST
RE
NG
TH
(dB
)
Strength
proportional to 1.000
Distance2
Moving EMI source from 1 m
to 5 m away reduces 100% to
4 % in EMI signal strength !

How does the external EMI signal
which affects the frequency in
turn corrupt the strain readings ?
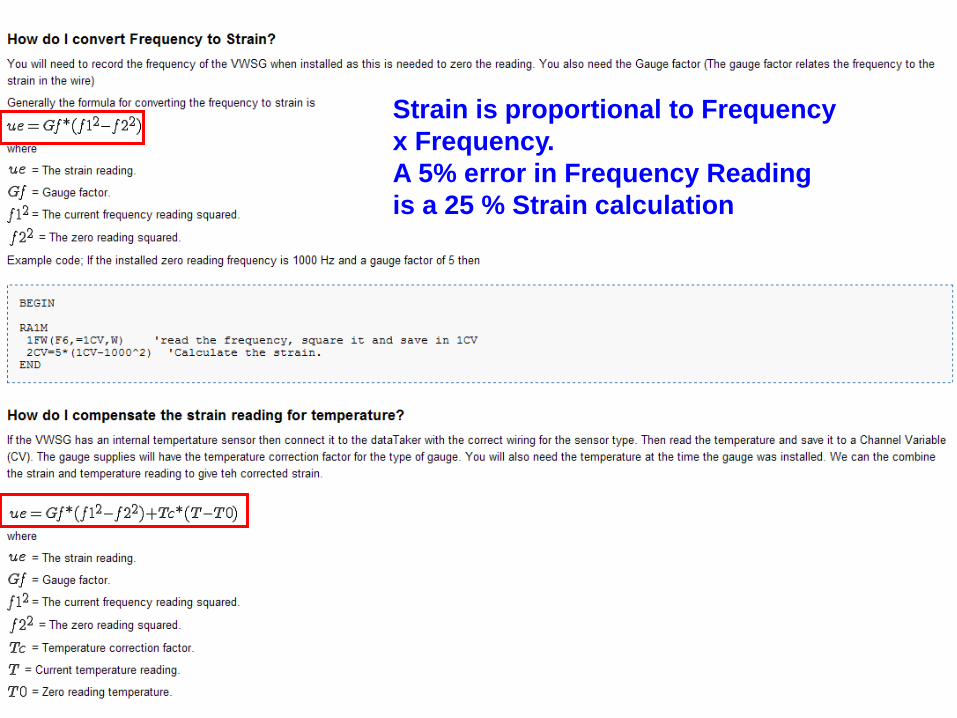
Strain is proportional to Frequency
x Frequency.
A 5% error in Frequency Reading
is a 25 % Strain calculation
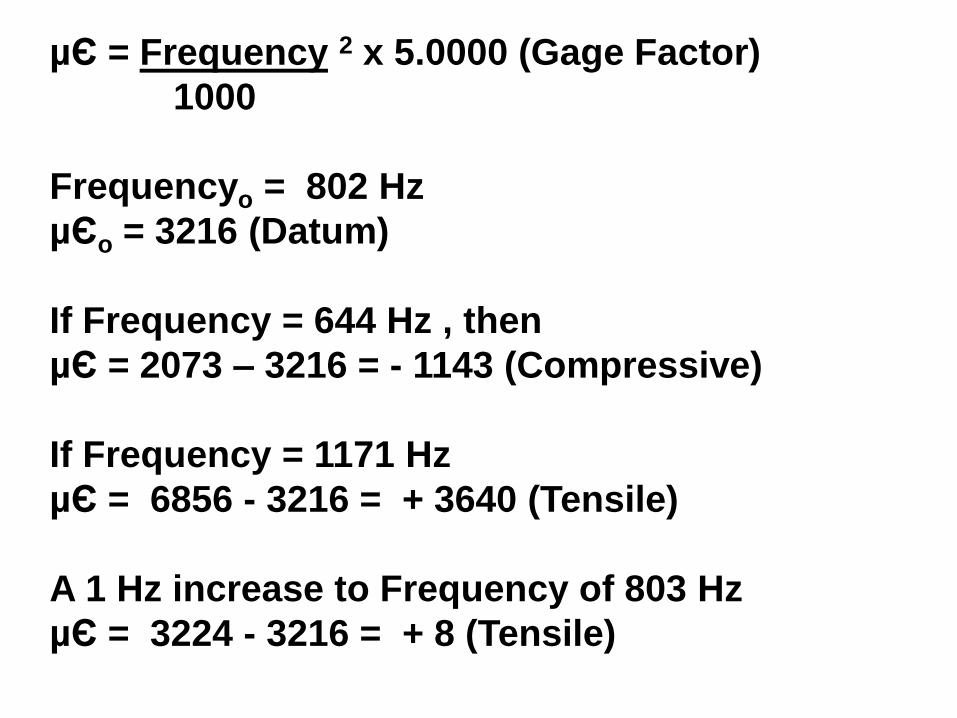
µЄ = Frequency 2 x 5.0000 (Gage Factor)
1000
Frequencyo = 802 Hz
µЄo = 3216 (Datum)
If Frequency = 644 Hz , then
µЄ = 2073 – 3216 = - 1143 (Compressive)
If Frequency = 1171 Hz
µЄ = 6856 - 3216 = + 3640 (Tensile)
A 1 Hz increase to Frequency of 803 Hz
µЄ = 3224 - 3216 = + 8 (Tensile)
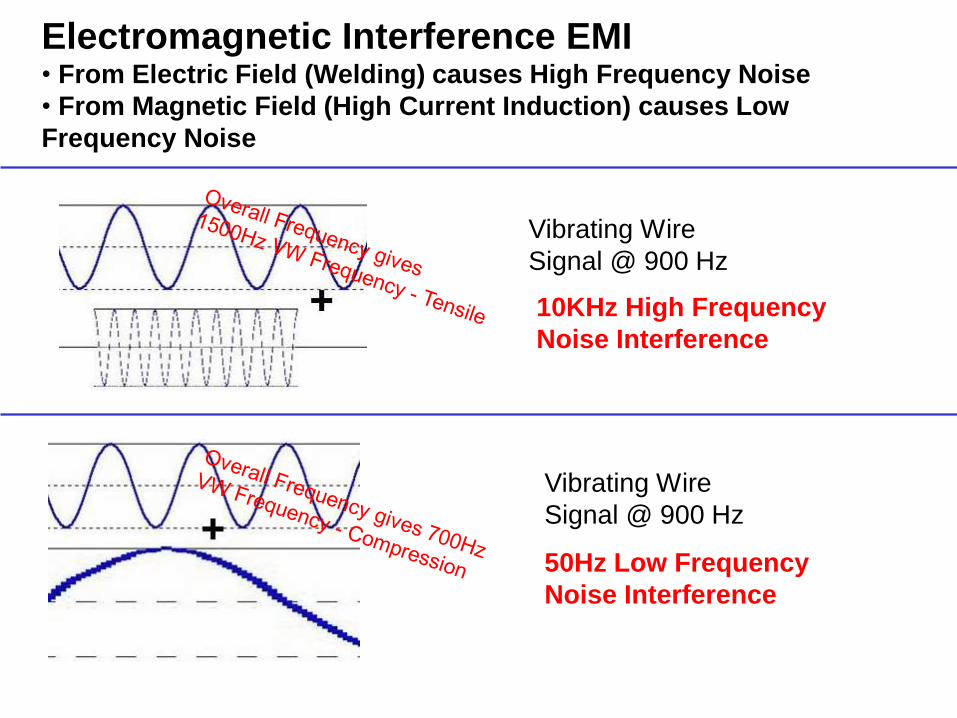
Vibrating Wire
Signal @ 900 Hz
Vibrating Wire
Signal @ 900 Hz
10KHz High Frequency
Noise Interference
50Hz Low Frequency
Noise Interference
Electromagnetic Interference EMI• From Electric Field (Welding) causes High Frequency Noise
• From Magnetic Field (High Current Induction) causes Low
Frequency Noise
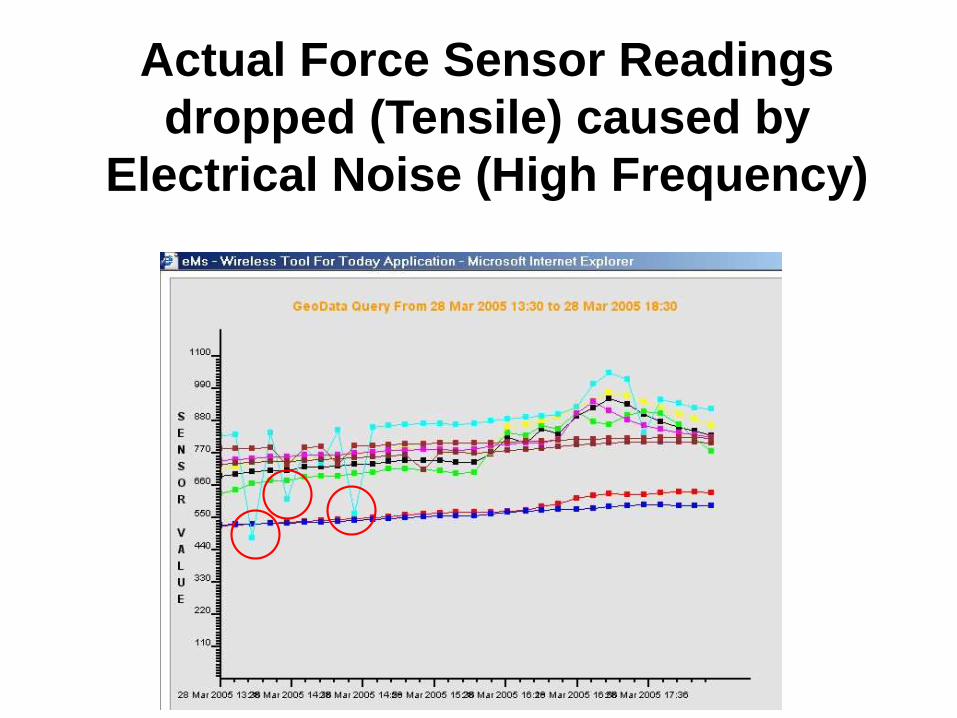
Actual Force Sensor Readings
dropped (Tensile) caused by
Electrical Noise (High Frequency)

VWSG Sensor Noise Checks
for EMI at site location using
EMI Analyzers
EMI
Spectrum
Various Portable EMI Analyzers
For analyzing
noise signals in
VWSG cables
For tracing noise
source on sites
Power Transformer 50Hz and its
Harmonics Magnetic Field site survey
at Labrador Sub-Station done on
18/03/2005.
The EMI checks were carried out at
the VW Strain gage outputs without
VW Excitation Signals. This formed
the base noise level which would be
mixed together with the VWSG
signals into the Data Logger
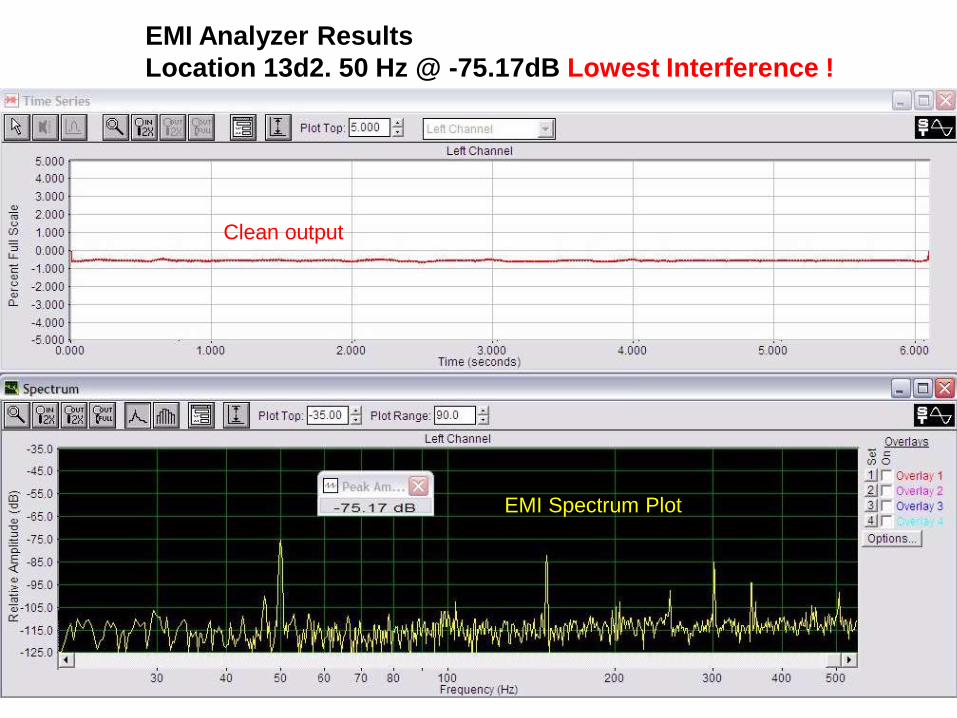
EMI Analyzer Results
Location 13d2. 50 Hz @ -75.17dB Lowest Interference !
Clean output
EMI Spectrum Plot
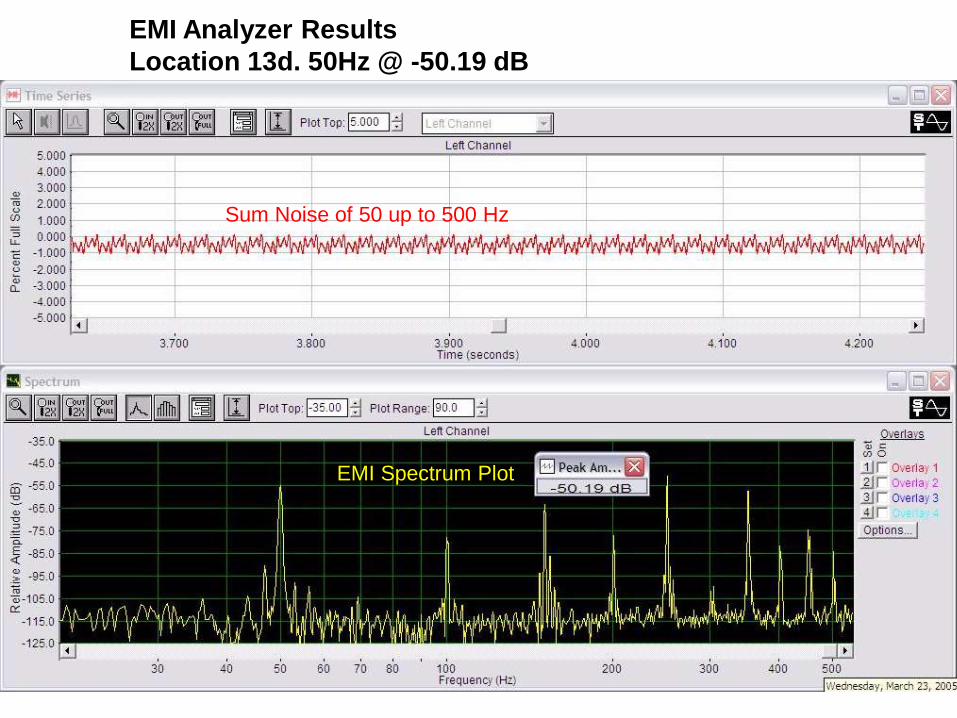
EMI Analyzer Results
Location 13d. 50Hz @ -50.19 dB
Sum Noise of 50 up to 500 Hz
EMI Spectrum Plot
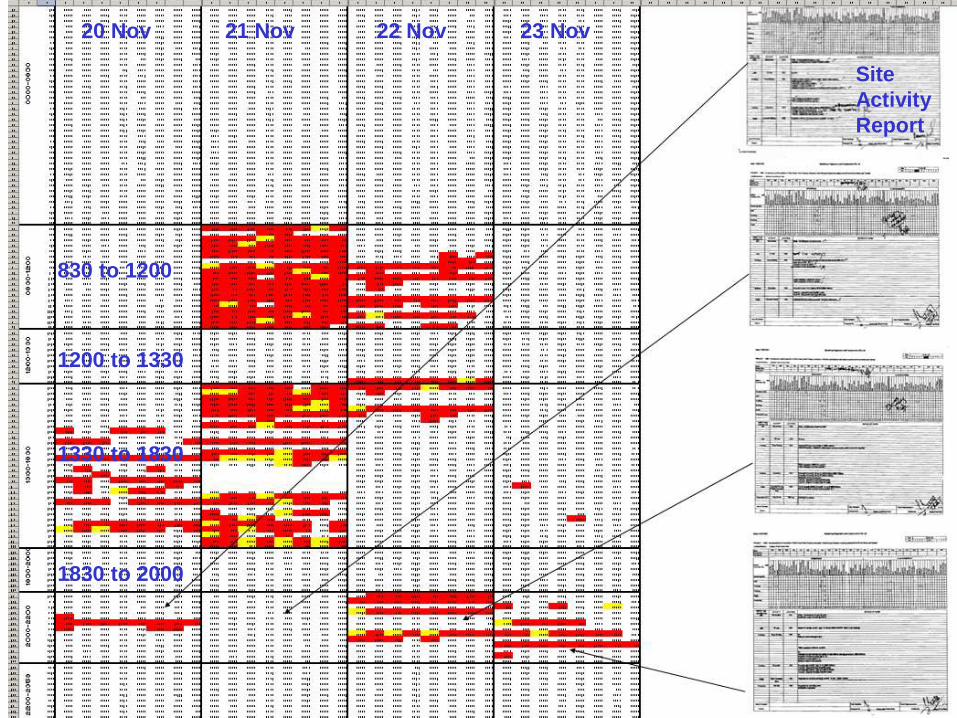
1200 to 1330
830 to 1200
1330 to 1830
1830 to 2000
Site
Activity
Report
20 Nov 21 Nov 22 Nov 23 Nov
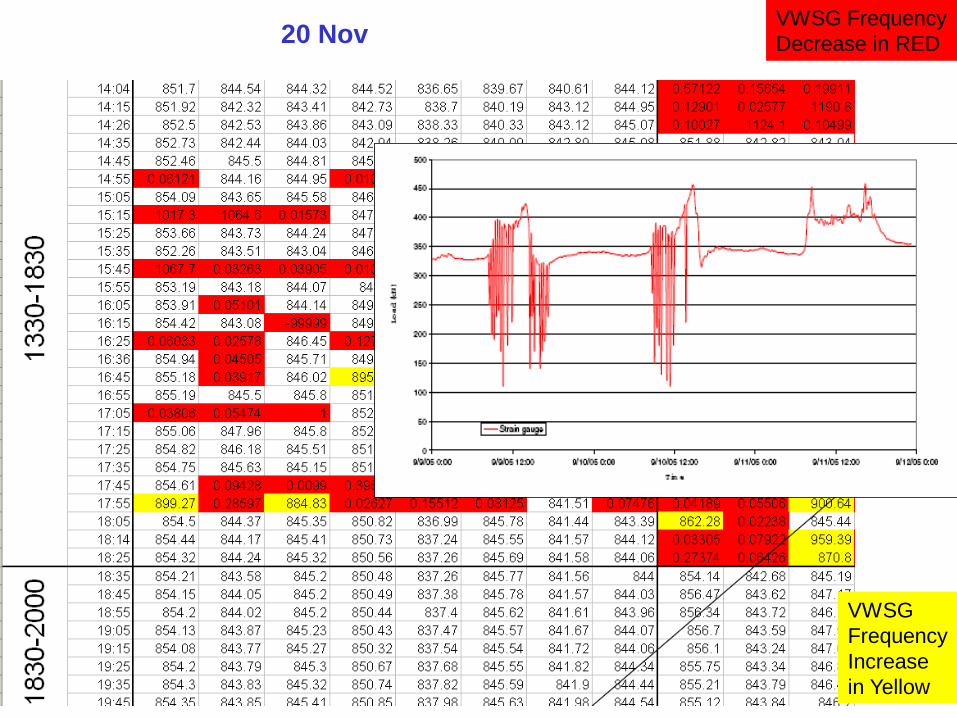
Data Logger
cannot Read
VWSG Frequency
Decrease in RED
VWSG
Frequency
Increase
in Yellow
20 Nov
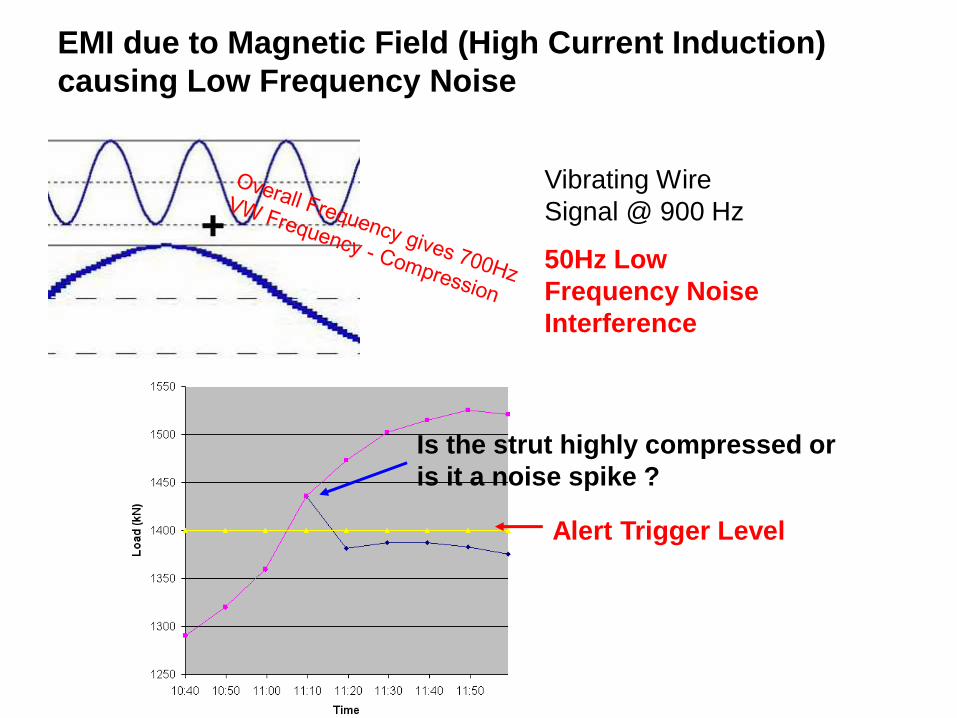
Vibrating Wire
Signal @ 900 Hz
50Hz Low
Frequency Noise
Interference
EMI due to Magnetic Field (High Current Induction)
causing Low Frequency Noise
Alert Trigger Level
Is the strut highly compressed or
is it a noise spike ?
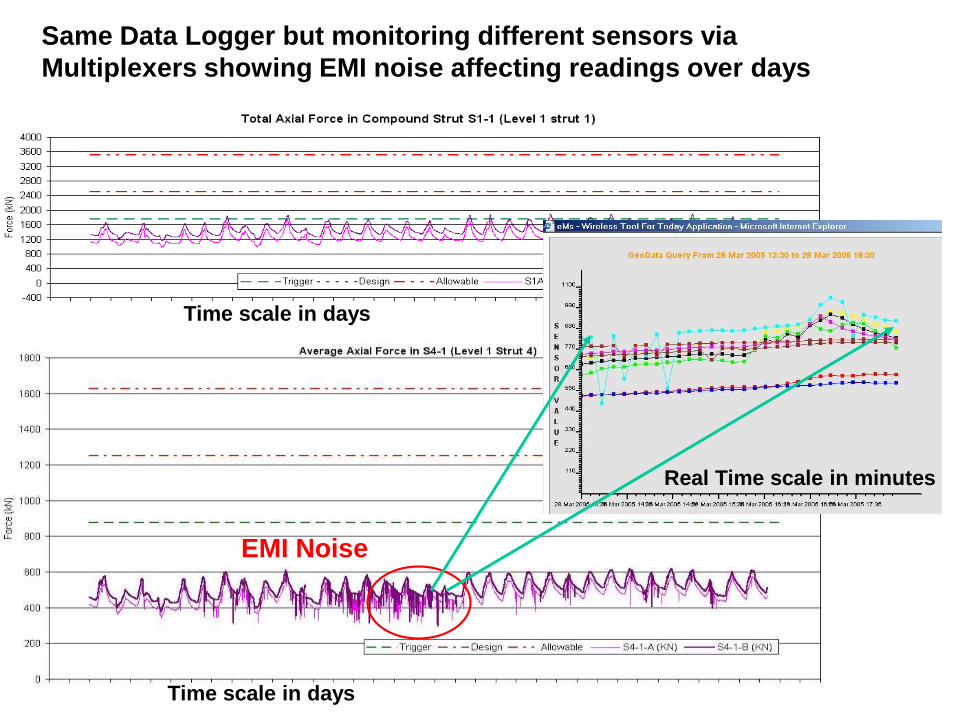
Same Data Logger but monitoring different sensors via
Multiplexers showing EMI noise affecting readings over days
EMI Noise
Time scale in days
Time scale in days
Real Time scale in minutes
Time
% of
Design
Limit 1
2
3Sensor
Alert
Limit
Bands
Normal
Operational
Zone
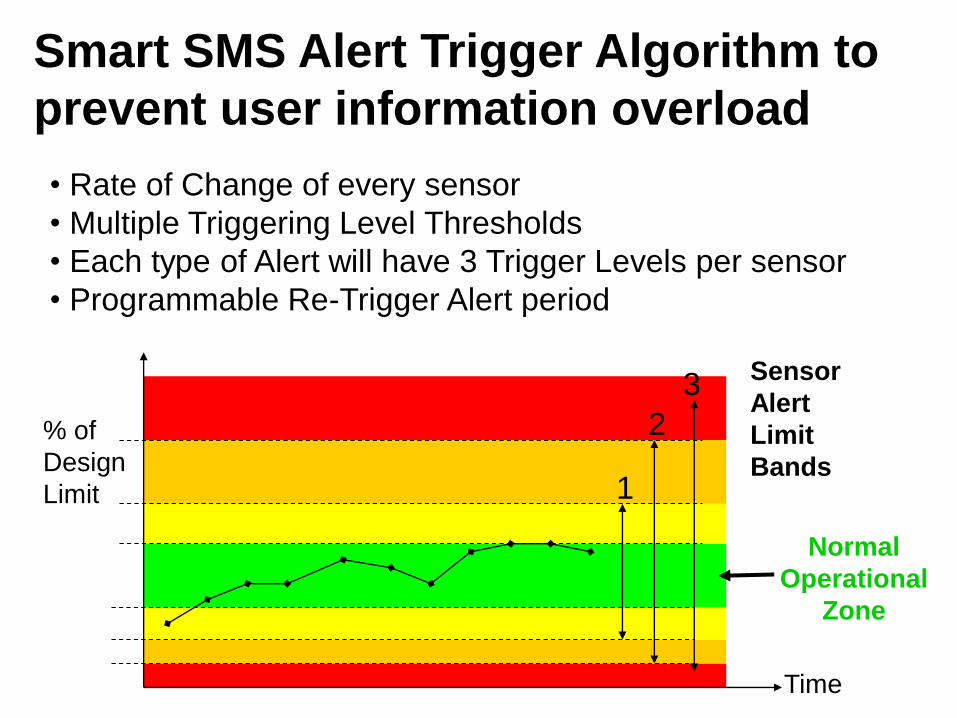
Smart SMS Alert Trigger Algorithm to
prevent user information overload
• Rate of Change of every sensor
• Multiple Triggering Level Thresholds
• Each type of Alert will have 3 Trigger Levels per sensor
• Programmable Re-Trigger Alert period

Site Layout Design Consideration
Consideration factors
• Maximum signal cable length– Reduce noise pickup possibility
• Cable installation– Avoid noise source
– Avoid wielding cable and power generator cable crossing
• Max numbers of channels per logger
• Cluster design– Easy to view sensors info at Real Time monitoring & Alert
System
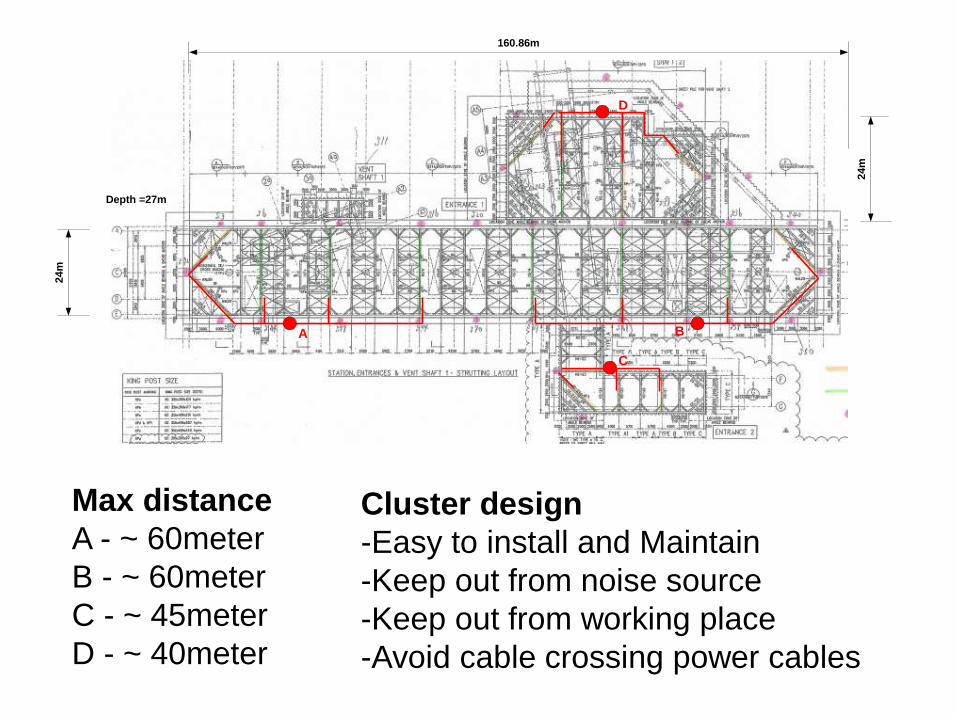
160.86m
24m
24m
Depth =27m
A B
C
D
Max distance
A - ~ 60meter
B - ~ 60meter
C - ~ 45meter
D - ~ 40meter
Cluster design
-Easy to install and Maintain
-Keep out from noise source
-Keep out from working place
-Avoid cable crossing power cables
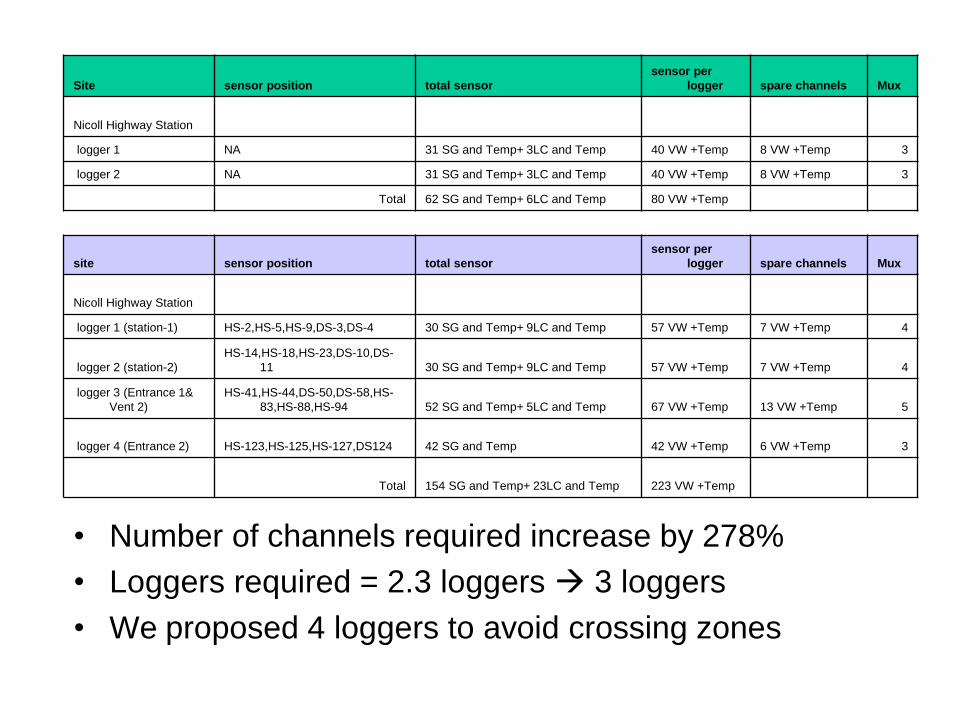
Site sensor position total sensor
sensor per
logger spare channels Mux
Nicoll Highway Station
logger 1 NA 31 SG and Temp+ 3LC and Temp 40 VW +Temp 8 VW +Temp 3
logger 2 NA 31 SG and Temp+ 3LC and Temp 40 VW +Temp 8 VW +Temp 3
Total 62 SG and Temp+ 6LC and Temp 80 VW +Temp
site sensor position total sensor
sensor per
logger spare channels Mux
Nicoll Highway Station
logger 1 (station-1) HS-2,HS-5,HS-9,DS-3,DS-4 30 SG and Temp+ 9LC and Temp 57 VW +Temp 7 VW +Temp 4
logger 2 (station-2)
HS-14,HS-18,HS-23,DS-10,DS-
11 30 SG and Temp+ 9LC and Temp 57 VW +Temp 7 VW +Temp 4
logger 3 (Entrance 1&
Vent 2)
HS-41,HS-44,DS-50,DS-58,HS-
83,HS-88,HS-94 52 SG and Temp+ 5LC and Temp 67 VW +Temp 13 VW +Temp 5
logger 4 (Entrance 2) HS-123,HS-125,HS-127,DS124 42 SG and Temp 42 VW +Temp 6 VW +Temp 3
Total 154 SG and Temp+ 23LC and Temp 223 VW +Temp
• Number of channels required increase by 278%
• Loggers required = 2.3 loggers 3 loggers
• We proposed 4 loggers to avoid crossing zones

Quality Plan for VWSG
Sensor Installation Checks
And
EMI Noise Spectrum Checks

Instrumentation Planning Guidelines1. Shorten the cable lengths (~ 500 m) from the VWSG to the multiplexer
even though the VWSG can function up to 1,000 m. Under ideal condition,
data logger will get idea readings.
2. Lay VWSG cables 5 m away from Power cables as high currents with
pulsing currents, such as welding or motor currents, will cause cross
induced magnetic cross coupling interference.
3. Ground the cables from VWSG sensors, data loggers, chassis to a
signal ground. Differentiate Earth Lightning Protection CP33 ground
(GREEN wire to protect human lives) from signal ground.
4. Design a grounding discharge wiring topography and not a wiring
diagram as the CP33 is for electronic equipment protection code NOT for
noise grounding.
5. Perform signal site survey with EMI Spectrum Analyzer with EMI
readings as datum levels
6. Provide voltage surge protection at mains inlet, DC power supply inlet,
sensor and multiplexer inputs with discharge ground wires.
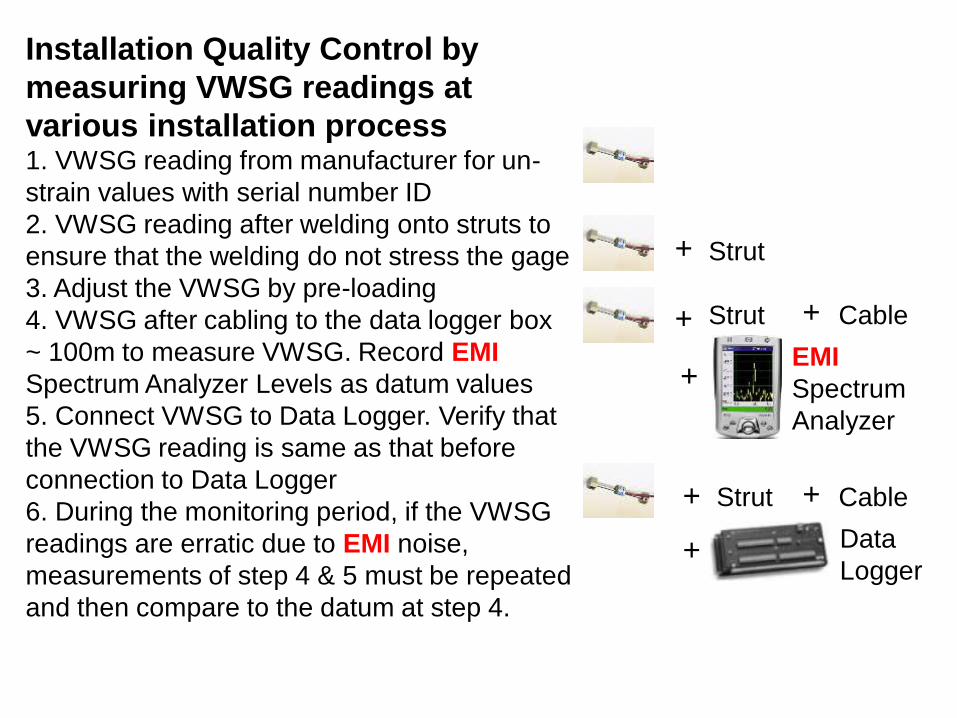
Installation Quality Control by
measuring VWSG readings at
various installation process1. VWSG reading from manufacturer for un-
strain values with serial number ID
2. VWSG reading after welding onto struts to
ensure that the welding do not stress the gage
3. Adjust the VWSG by pre-loading
4. VWSG after cabling to the data logger box
~ 100m to measure VWSG. Record EMI
Spectrum Analyzer Levels as datum values
5. Connect VWSG to Data Logger. Verify that
the VWSG reading is same as that before
connection to Data Logger
6. During the monitoring period, if the VWSG
readings are erratic due to EMI noise,
measurements of step 4 & 5 must be repeated
and then compare to the datum at step 4.
+ Strut
+ Strut + Cable
+
Strut Cable+ +
Data
Logger
+EMI
Spectrum
Analyzer
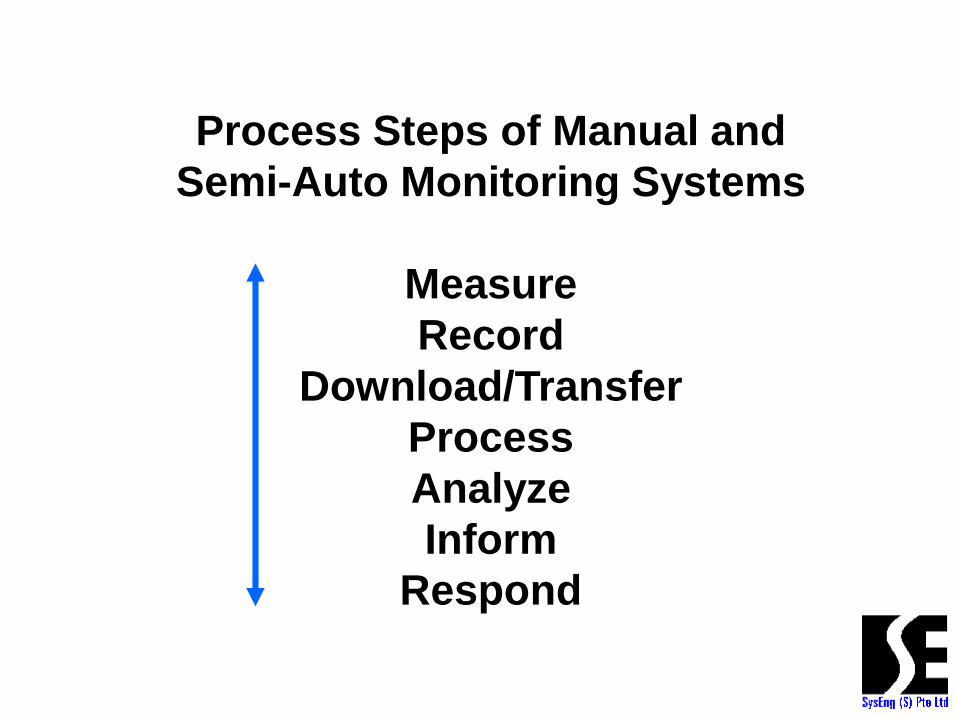
Process Steps of Manual and
Semi-Auto Monitoring Systems
Measure
Record
Download/Transfer
Process
Analyze
Inform
Respond

The Challenge to
maintain
Data Quality
Data Reliability
&
Data Timeliness
Real Time Monitoring
Using
Machine to Machine (M2M)
Technology
Applied to
Manual Data Collection
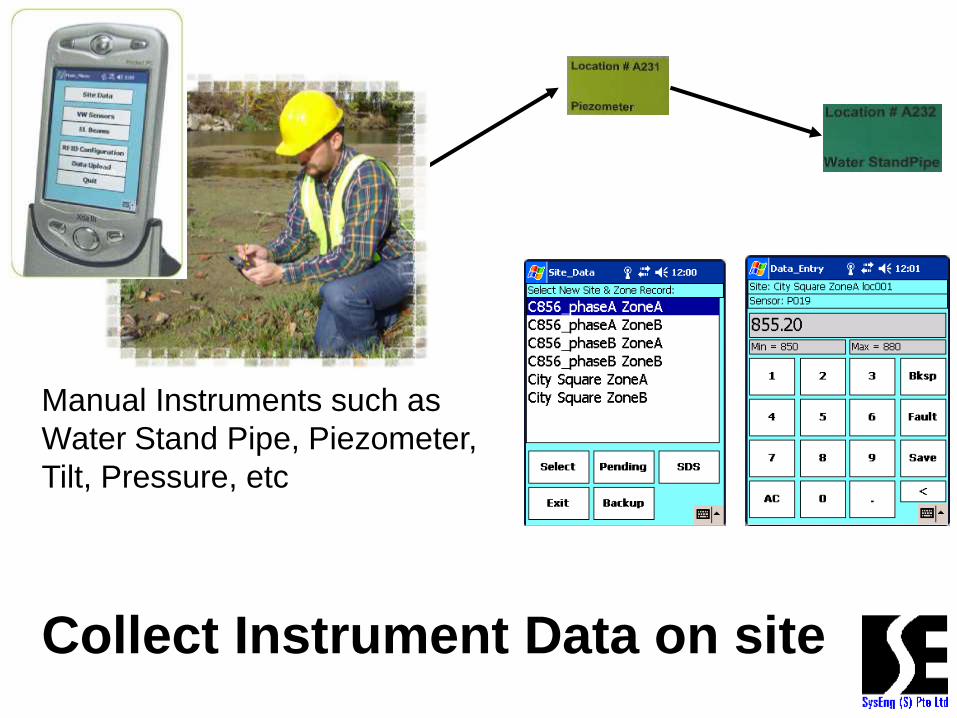
Manual Instruments such as
Water Stand Pipe, Piezometer,
Tilt, Pressure, etc
Collect Instrument Data on site
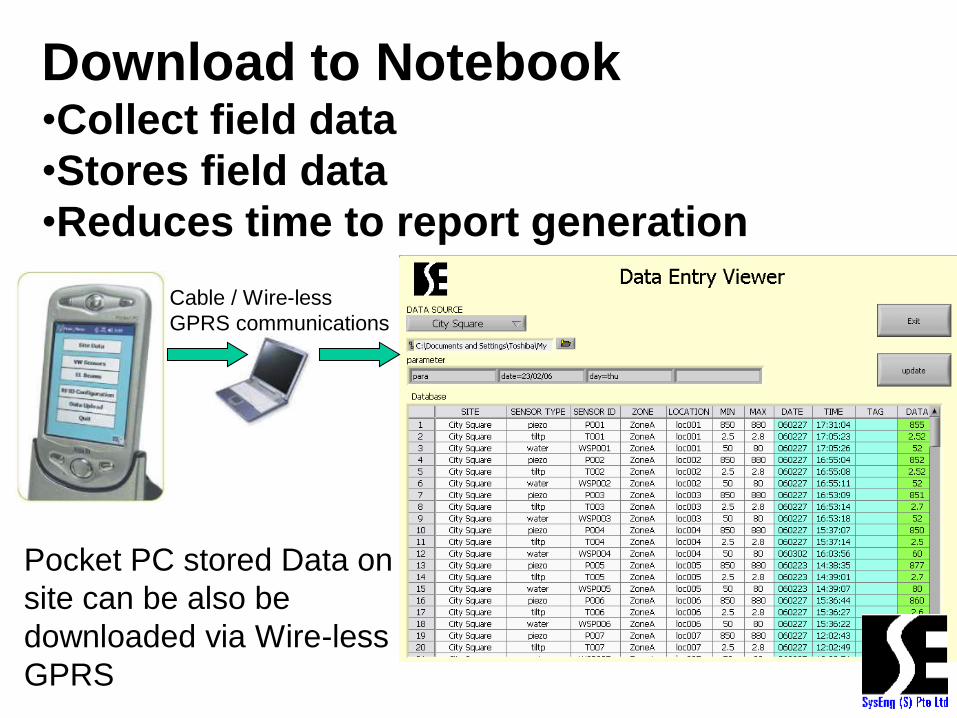
Download to Notebook•Collect field data
•Stores field data
•Reduces time to report generation
Pocket PC stored Data on
site can be also be
downloaded via Wire-less
GPRS
Cable / Wire-less
GPRS communications
Real Time Monitoring
Using
Machine to Machine (M2M)
Technology
Applied to
Semi-Automatic Data Collection
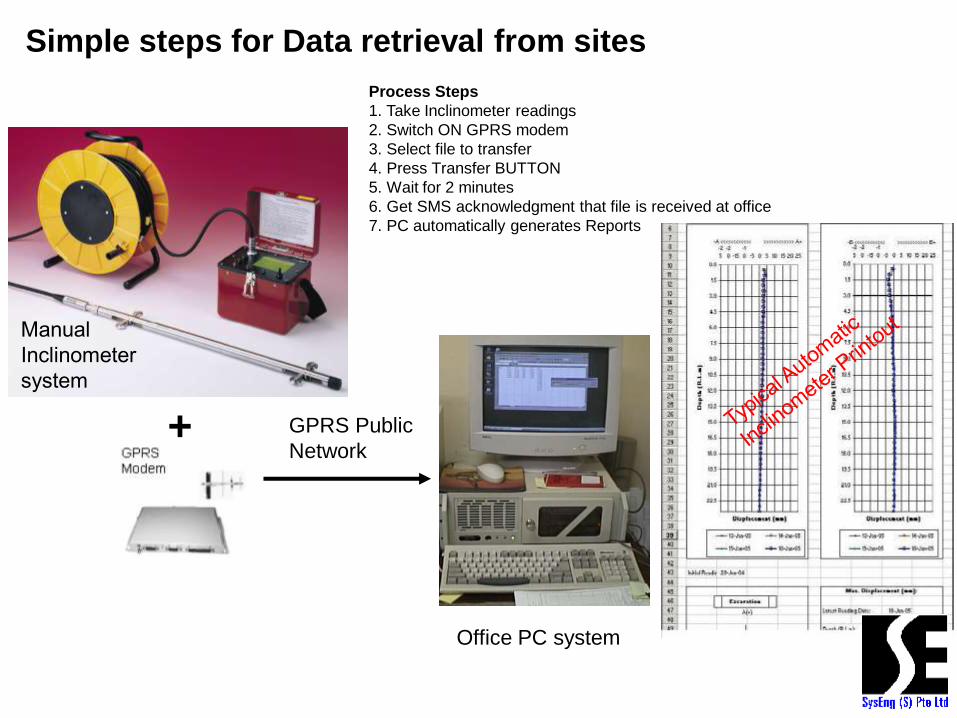
+ GPRS Public
Network
Office PC system
Simple steps for Data retrieval from sites
Process Steps
1. Take Inclinometer readings
2. Switch ON GPRS modem
3. Select file to transfer
4. Press Transfer BUTTON
5. Wait for 2 minutes
6. Get SMS acknowledgment that file is received at office
7. PC automatically generates Reports
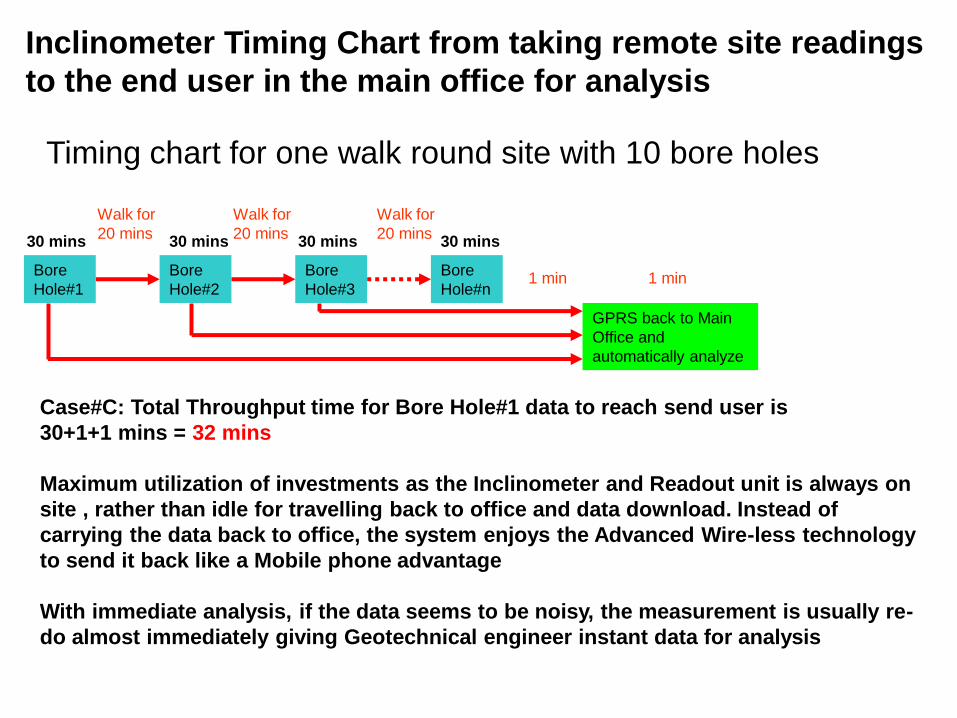
30 mins
Bore
Hole#1
Timing chart for one walk round site with 10 bore holes
Walk for
20 mins
Inclinometer Timing Chart from taking remote site readings
to the end user in the main office for analysis
Bore
Hole#2
Bore
Hole#3
Walk for
20 mins
Walk for
20 mins
Bore
Hole#n
30 mins 30 mins 30 mins
GPRS back to Main
Office and
automatically analyze
Case#C: Total Throughput time for Bore Hole#1 data to reach send user is
30+1+1 mins = 32 mins
Maximum utilization of investments as the Inclinometer and Readout unit is always on
site , rather than idle for travelling back to office and data download. Instead of
carrying the data back to office, the system enjoys the Advanced Wire-less technology
to send it back like a Mobile phone advantage
With immediate analysis, if the data seems to be noisy, the measurement is usually re-
do almost immediately giving Geotechnical engineer instant data for analysis
1 min1 min
Automated Real Time
Tunnel Monitoring System
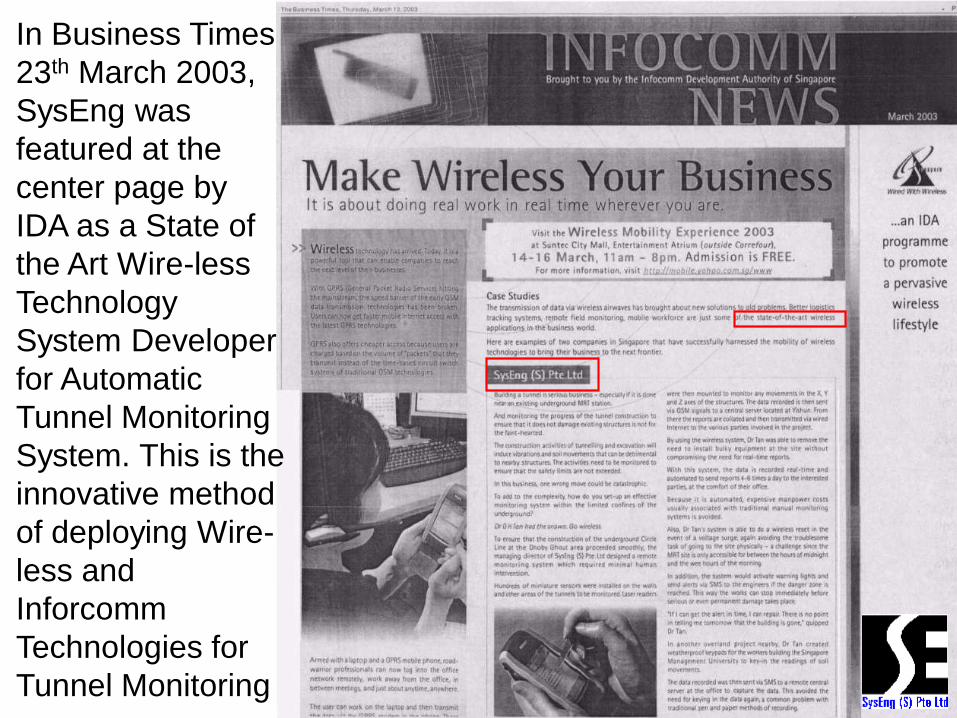
In Business Times
23th March 2003,
SysEng was
featured at the
center page by
IDA as a State of
the Art Wire-less
Technology
System Developer
for Automatic
Tunnel Monitoring
System. This is the
innovative method
of deploying Wire-
less and
Inforcomm
Technologies for
Tunnel Monitoring
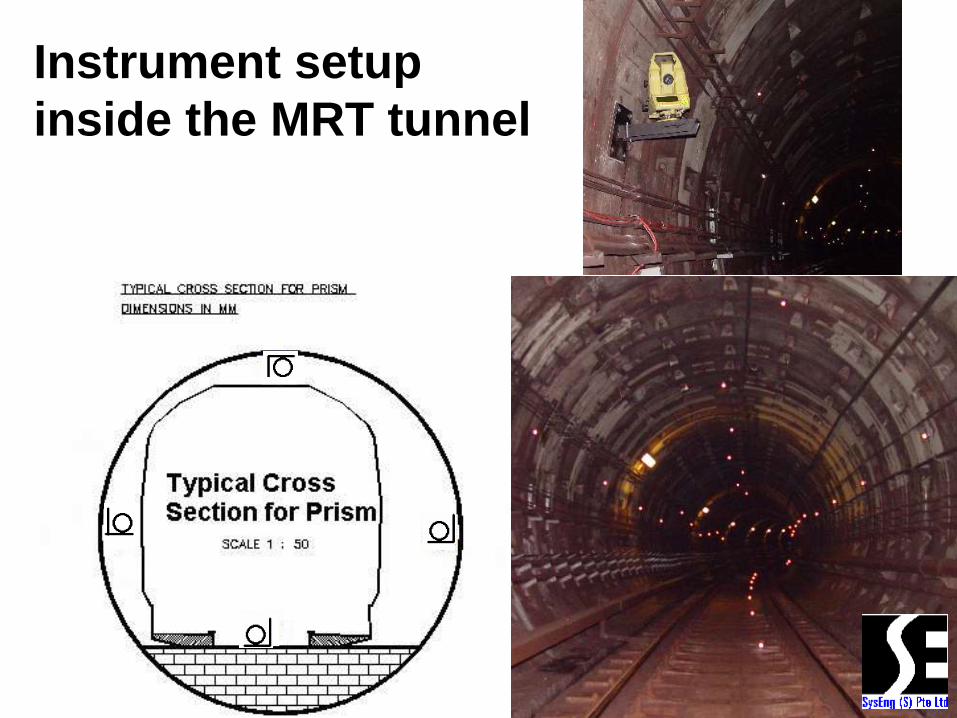
Instrument setup
inside the MRT tunnel
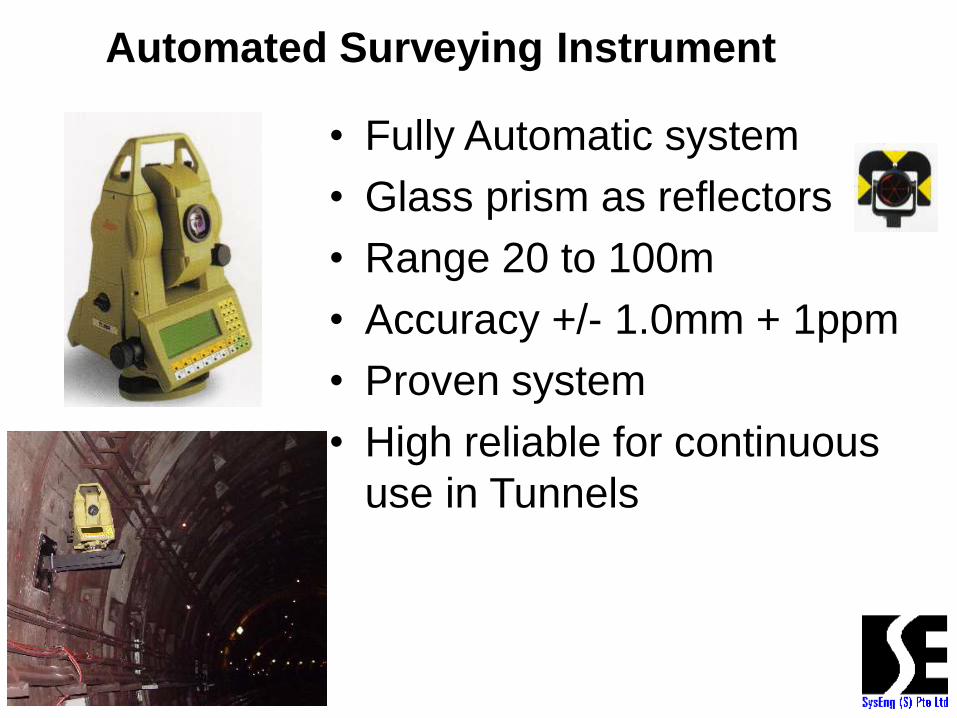
• Fully Automatic system
• Glass prism as reflectors
• Range 20 to 100m
• Accuracy +/- 1.0mm + 1ppm
• Proven system
• High reliable for continuous
use in Tunnels
Automated Surveying Instrument
The Solution for
Real Time Monitoring &
Alert System
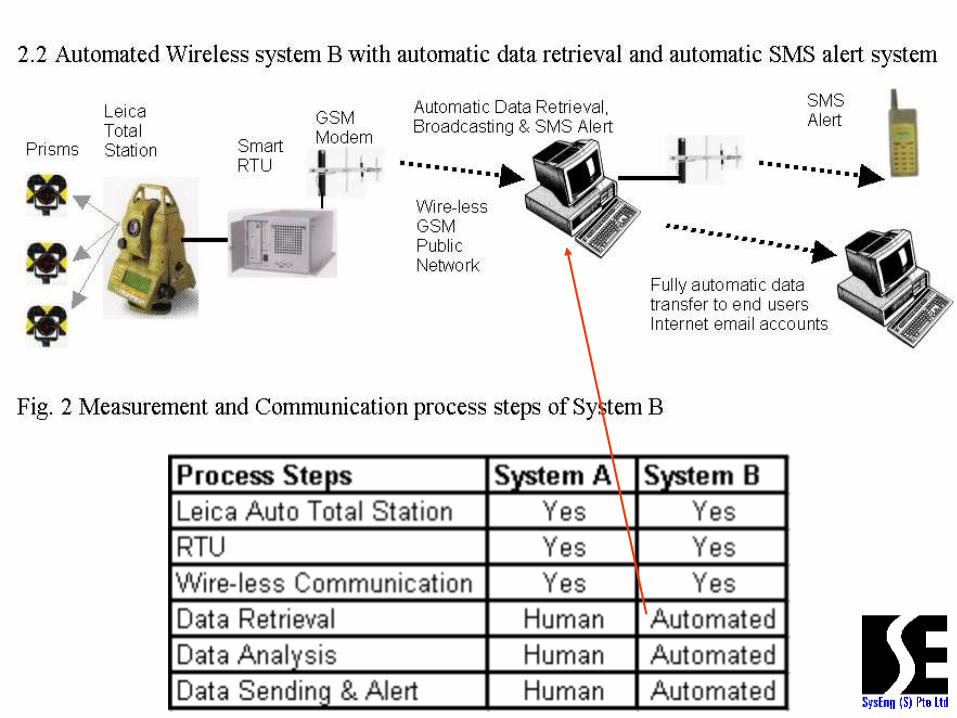
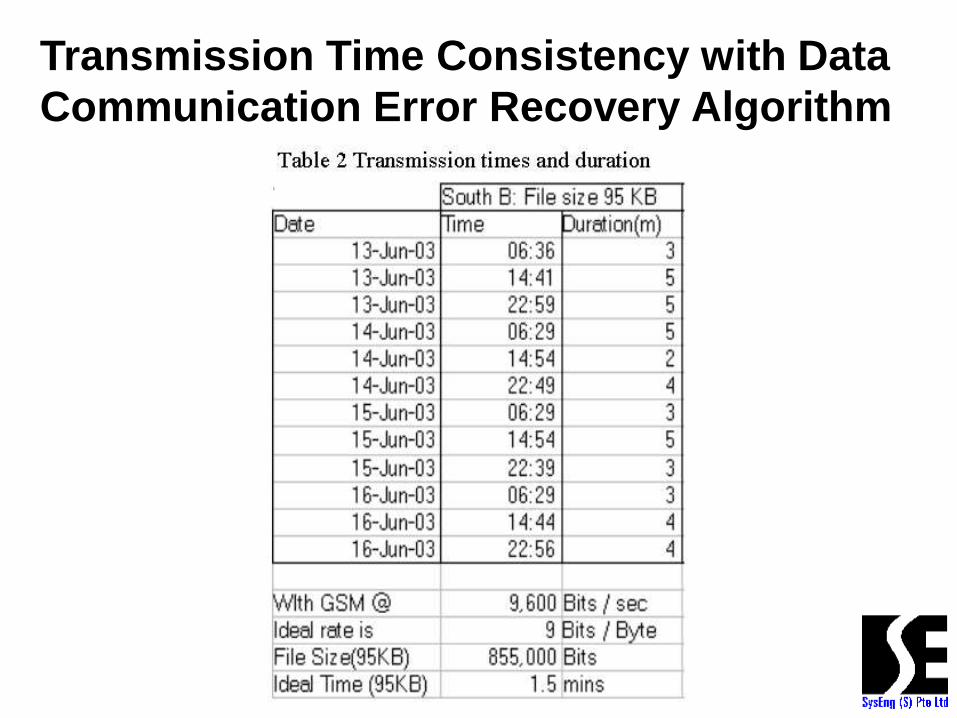
Transmission Time Consistency with Data
Communication Error Recovery Algorithm
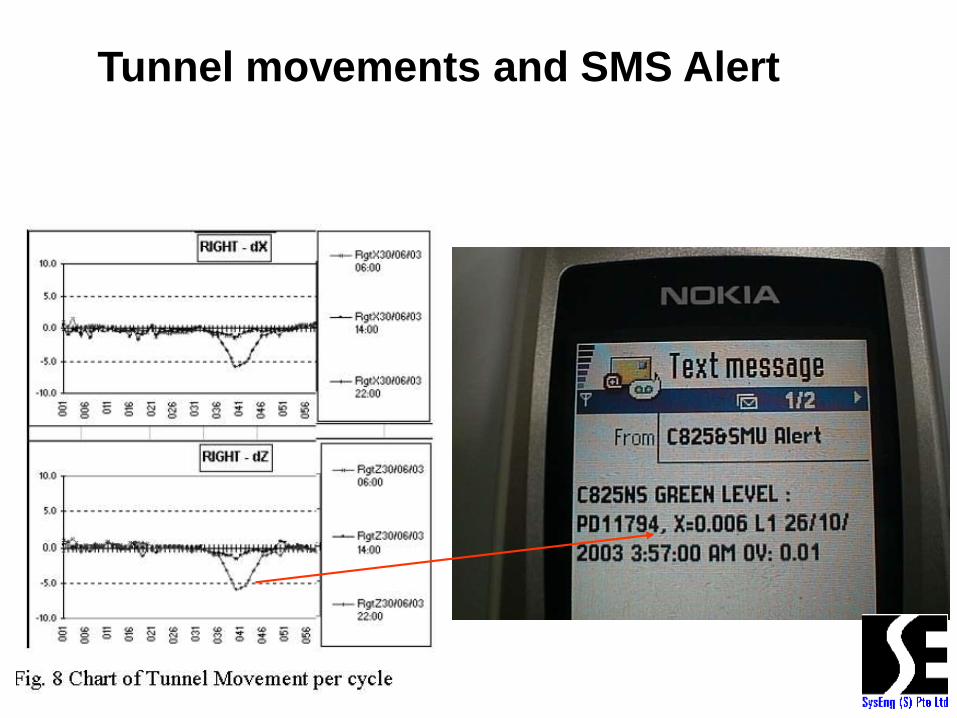
Tunnel movements and SMS Alert
Smarter structural geometric
cross checking algorithms will be
introduced to avoid overloading
and False SMS alerts. The
proposed algorithm will deploy
more 3D numerical checks for the
following: -

Within the same segment
Movements in the 4 prisms shifting
in space
Vertical Movements in the Crown
and Track for vertical loading
Horizontal Movements in the Left
and Right for horizontal loading
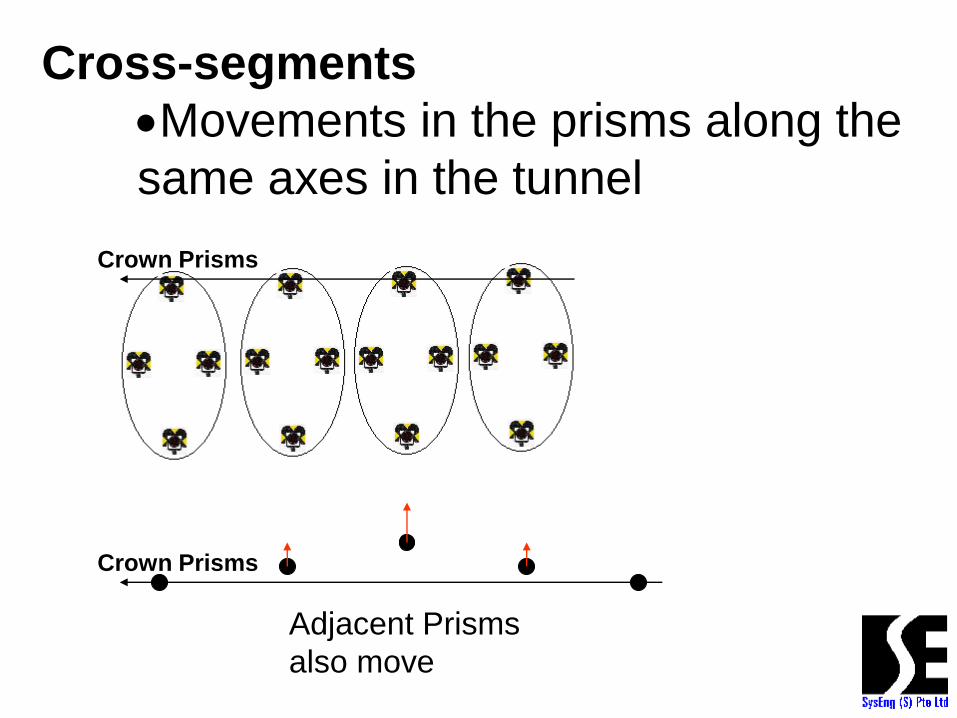
Cross-segments
Movements in the prisms along the
same axes in the tunnel
Adjacent Prisms
also move
Crown Prisms
Crown Prisms

Thank You