Embed Size (px)
Citation preview
ANNALS OF CLINICAL AND LABORATORY SCIENCE, Vol. 26, No. 1 Copyright © 1996, Institute for Clinical Science, Inc.
Hemoglobin Interference with Urinary Bence Jones Protein Analysis on Electrophoresis*GREGORY A. HOBBS, Ph.D.,t and STANLEY S. LEVINSON, Ph.D.tt
fDepartment of Pathology, University o f Louisville,Louisville, KY 40206
andtLaboratory Service,
Department of Veteran Affairs Medical CenterLouisville, KY 40206
ABSTRACTTwo cases are described which show that on urine protein electropho
resis a paraprotein owing to hemoglobin cannot be distinguished from a Bence Jones protein. A simple method is described for confirming the presence of hemoglobin: a densitometric scan of the electrophoretogram at 415 nm, in which hemoglobin absorbs in a band coincident with the restriction. Furthermore, it is shown that other serum proteins, elevated levels of bilirubin, and Bence Jones protein do not interfere with this detection system.
IntroductionIn patients w ith hem oglobinuria,
hemoglobin can be mistaken for a paraprotein in urinary protein electrophoresis. Since hemoglobin normally migrates in the a2 to ^-region, it may be thought to be a Bence Jones protein. In such cases, negative reactions on analysis with antisera against k and X light chains by iramu- nofixation electrophoresis (IFE) usually rules out the paraprotein as a Bence Jones protein.1 However, it is desirable to identify the exact nature of a paraprotein because antisera against monoclonal immunoglobulins, and especially free
* Send reprint requests to Stanley S. Levinson, Ph.D., Laboratory Service, Department of Veterans Affairs Medical Center, 800 Zorn Avenue, Louisville, KY 40206-1466.
light chains, may react peculiarly with abnormal immunoglobulins.1’2,3’4,5 In the unusual case, insufficient reaction may cause a monoclonal immunoglobulin to escape detection.5 To avoid this type of error, many laboratories maintain supplies of antisera from more than one commercial source for testing suspect sera.5,6
In urine, low concentrations of hemoglobin may not be obvious on visual inspection. Since most laboratories do not keep antisera against hemoglobin, IFE cannot be used to rule out this type of interference. Furthermore, the migration distance may vary depending on type o f h em oglob in and the ion ic strength and pH of the urine. Here, it is shown that on electrophoresis of urine a hemoglobin band can be confirmed simply by densitometric scanning of the gel at 415 nm.
710091-7370/96/0100-0071 $00.90 © Institute for Clinical Science, Inc.
72 HOBBS AND LEV IN SO N
Case Reports
globin was initially thought to be a Bence Jones protein.
Case 1
Two cases are reported in which hemo- o §E £
A 62-year-old, black male with multiple medical problem s, including chronic renal failure, insulin dependent diabetes, chronic pancreatitis, congestive heart failure, and chronic obstructive pulmonary disease, was admitted to the hospital because of shortness of breath and chest pain. Myocardial infarction was ruled out by serial electrocardiography, creatine kinase, and lactate dehydrogenase determ inations. C linical and radiological evaluation indicated pneumonia, and the patient improved after treatment with antibiotics.
Abnormal values, with reference ranges in parentheses, were as follows: hemoglobin = 73 g/L (120- 160), albumin = 28 g/L (35—48), calcium = 0.069 g/L (0.084-0.117, phosphorus = 0.084 g/L (0.024-0.044).), glucose 1.86 g/L (0.7-1.1), chloride of 113 mmol/L (101—111), and carbon dioxide 11 mmoI/L (24—31). Urea nitrogen and creatinine were 0.58 g/L (0.05—.25), and 0.056 g/L (0.005-0.014), respectively, which were the patient’s usual base line values. Urinalysis revealed elevated protein, trace blood with 2 to 4 red blood cells per high power field, and 1 to 3 white blood cells.
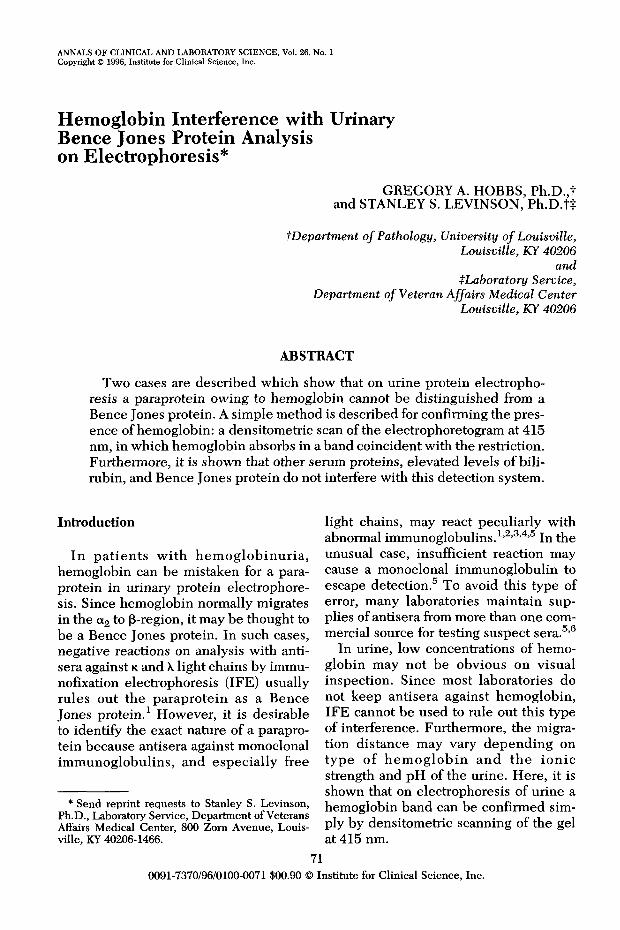
Urine protein electrophoresis resulted in a pattern indicating glomerular failure, with a paraprotein migrating in the (3-region (figure 1). Imrauno- fixation with antibody for IgG, IgA, \ and k chains showed only polyclonal patterns in the 7-region. On retrospective examination, the urine was red. The paraprotein in the p-region was confirmed as hemoglobin by densitometric scanning at 415 nm, in which a peak migrated coincidentally with the paraprotein (figure 1).
Case 2A 61-year-old, white male with a history of alco
holism entered the hospital because of hemateme- sis. The patient presented with ascites and edema of the extremities.
Abnormal laboratory results were as follows: Heme positive stool, hemoglobin of 73 g/L (120- 160), a typical cirrhotic testing profile, with albumin = 20 g/L (35-48), total b ilirubin = 0.029 g/L (0.003-0.016) 55% of which was conjugated, alanine transaminase/aspartate transaminase = 0.45, and prothrombin time = 14.5 seconds (11-13 seconds). The patient, also, appeared to be in renal failure with a urea nitrogen of 0.98 g/L (0.05-.25), a creatinine o f0.054 g/L (0.005-0.014), uric acid of 0.14 g/L (0.03—0.07) and a phosphorus of 0.077 g/L (0.024—0.044). Urinalysis showed hematuria, 0-5 white blood cells, and trace protein.
CL
<1 O
Bence Jones Protein
F IG U R E 1. Urinary protein elec trophoresis (UPE) and immunofixation electrophoresis for immunoglobulins showing the migration of hemoglobin in Patient 1. Top scan shows the absorbance profile at 415 nm. Antisera against IgG (G), IgA (A), k and \ chains were used for fixation. The bottom strip shows the migration of a Bence Jones protein for comparison purposes. The bands representing hemoglobin and albumin are indicated.
Serum protein electrophorese revealed a cirrhotic type profile with a p-'y-bridge, and a superimposed low concentration (<10 g/L) M-component. The UPE showed a pattern that indicated a glomerular lesion, but with a paraprotein migrating in the P-region (Figure 2). Immunofixation with antibody for IgG, IgA, \ and k chains showed only polyclonal
H E M O G L O B IN IN T E R F E R E N C E W ITH URINARY B E N C E JO N ES PR O TEIN
PATIENT
I I0.4 g/L
0.2 g/L
0.1 g/L
< ------------------MIGRATION
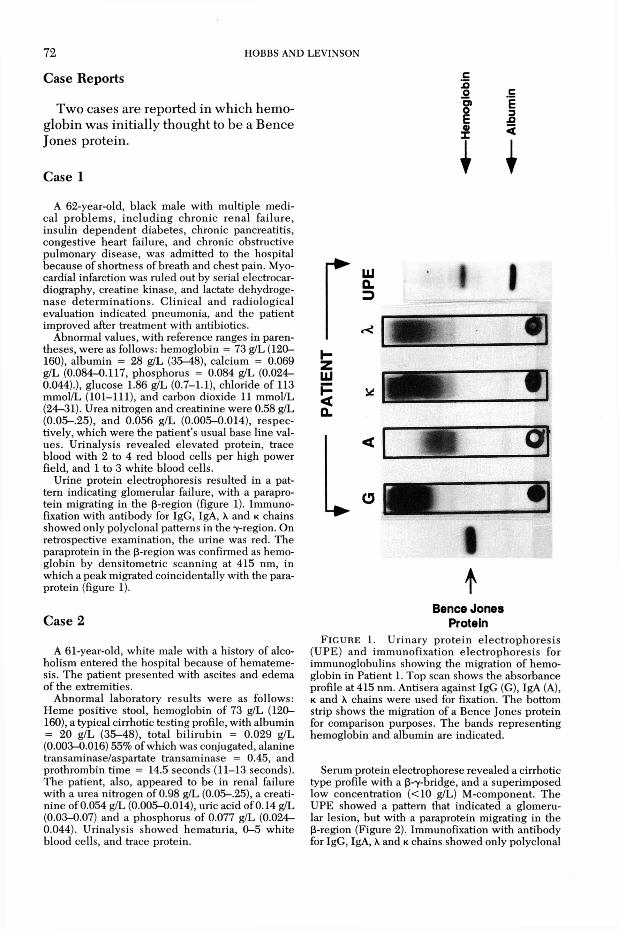
FIGURE 2. Urinary protein electrophoresis (UPE) showing the absorbance profile at 415 nm and banding pattern after staining for Patient 2, and for various levels of hemoglobin. The bands representing hemoglobin and albumin are indicated.
patterns in the -y-region. On retrospective examination, the urine displayed questionable hematuria. The paraprotein in the (3-region was confirmed as hemoglobin by densitometric scanning at 415 nm, with an absorbance peak co-migrating with the paraprotein restriction (figure 2).
Materials and MethodsUrine specimens were collected over
24 hours w ithout the use of preservatives.
73Specimens w ere either stored refrigerated and assayed w ithin one week, or they w ere stored frozen at -7 0 °C and thaw ed just before being assayed later. Prior to protein electrophoresis and IF E , urine samples were concentrated approximately 80 to 100 fold using gravity-flow concentrators.* Protein electrophoresist for serum and u rin e was p e rfo rm ed according to the manufacturer’s instructions. Proteins were detected by staining with amido blackt or by densitom etryt performed at 415 nm on unstained gels, as previously described.§ IF E (8,9) on serum was performed according to the m anufac tu rer’s in struc tions.11 A ntisera supplied with the kit were specific for IgG, IgA, free and bound kappa and lambda chains.
Free hemoglobin was derived from a whole blood specimen as follows: erythrocytes were pelleted by centrifugation (1000 X g, 10 minutes) and the plasma p o u red off. T he red cell p e l le t was washed twice with normal saline, then resuspended in double-distilled w ater equal to the original volume of plasma. This solution was stored overnight at4°C, th e n c e n trifu g ed to rem ove c e llu la r debris. The concentration of hem oglobin was m easured by transmittance at 525 nm after conversion to a cyanide containing pigment.K This solution was d ilu ted 100 fold with double distilled water. Additional dilutions were made with urine to g ive h em o g lo b in c o n c e n tra tio n s of approximately 1.6, 0.8, 0.4, 0.2, 0.1 g/L. This material was stored for one w eek at 4°C while experiments w ere being per
* Minicon-B15, Amicon, Danvers, MA 01923.t Universal II Agarose Film/12, Ciba Corning
Diagnostics Corp. Palo Alto, CA 94306.t edc densitometer (Helena, Laboratories, Beau
mont, TX 77704)§ Glycated hemoglobin by Rapid Electrophoresis
(REP), also Helena 11 Titan Gel Immunofix, also Helena.H Coulter Counter STKR, Coulter Corporation,
Healeah, FL 33010-2428.
74 HOBBS AND LEV IN SO N
formed. Urine samples w ere evaluated by electrophoresis both before and after concentrating them 80-100 fold.
Controls consisted of two sera, randomly selected, and a urine containing a prom inent Bence Jones protein. One of these sera contained a protein concentration of 76 g/L, with an electrophoretic 3-7 bridge consistent with cirrhosis of the liver, an elevated im munoglobulin concentration of 30 g/L (7—16), and an elevated bilirubin concentration of 0.027 g/L (0.003—0.016). T he o th e r serum sam ple con tained 74 g/L p ro tein and appeared normal.
ResultsIn figure 1 are shown the protein elec
trophoresis and IF E patterns, along with the absorbance profile at 415 nm for the urine from Patient 1. A pattern from a patient with a Bence Jones protein in the urine is shown for comparison purposes. Hemoglobin appeared similar to a Bence Jones protein in stained gels.
In figure 2 is shown the stained electrophoretic pattern along with companion absorbance profiles for the urine from Patient 2. Also shown are electrophoresis and absorbance profiles of urine specim ens containing indicated hem oglobin dilutions prior to concentration. A paraprotein at 0.2 g/L hem oglobin was found to be detectible after staining. Below 0.2 g/L a parapro tein was not detectib le . Similarly, the absorbance profile at 415 nm dem onstrated a co-migrating peak at 0.2 g/L but no peak at lower concentrations. W hen the unconcentrated specim ens w ere assayed at 415 nm a peak could be observed at 0.8 g/L hemoglobin, but not at lower concentrations.
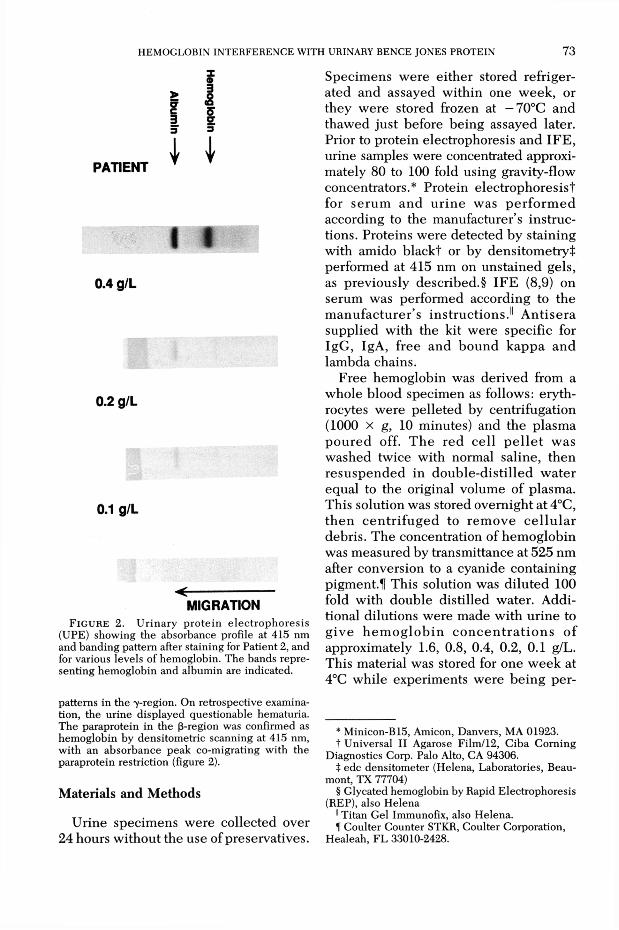
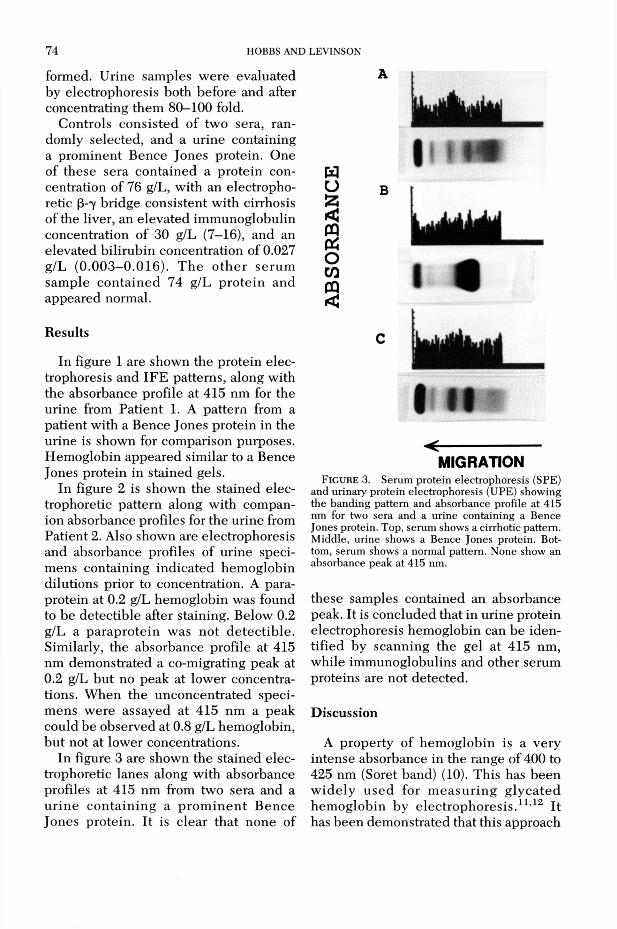
In figure 3 are shown the stained electrophoretic lanes along with absorbance profiles at 415 nm from two sera and a u rin e con ta in ing a p ro m in en t B ence Jones protein. It is clear that none of
I « «
I II< ----------------------
MIGRATIONFIGURE 3. Serum protein electrophoresis (SPE)
and urinary protein electrophoresis (UPE) showing the banding pattern and absorbance profile at 415 nm for two sera and a urine containing a Bence Jones protein. Top, serum shows a cirrhotic pattern. Middle, urine shows a Bence Jones protein. Bottom, serum shows a normal pattern. None show an absorbance peak at 415 nm.
these samples contained an absorbance peak. It is concluded that in urine protein electrophoresis hemoglobin can be identified by scanning the gel at 415 nm, while immunoglobulins and other serum proteins are not detected.
DiscussionA property of hem oglobin is a very
intense absorbance in the range of 400 to 425 nm (Soret band) (10). This has been w ide ly used for m easu rin g g lycated hem oglobin by elec trophoresis.11,12 It has been dem onstrated that this approach
HEM OGLOBIN IN TERFEREN CE W ITH URINARY BENCE JONES PROTEIN 7 5
can be used for identifying an electrophoretic paraprotein restriction in a patient’s urine (figure 1 and figure 2) in which hemoglobin might be mistakenly suspected to be a Bence Jones protein.
Although in most cases hemoglobinuria will be expected because the urine will have a red tint, this is not always the case. Hemoglobin concentrations of 0.1 to 0.3 g/L are difficult to see in urine, especially if the urine is dense. Hemoglobin in unconcentrated specim ens could not be detected below 0.8 g/L, which is clearly v isib le to the eye. However, urine samples are routinely concentrated 100 to 600 fold prior to electrophoresis;13,14 in these samples (figure 2), a stained band was detectible at much less than 0.8 g/L hemoglobin. Most clinical laboratories do not keep antisera against hemoglobin for use in confirming a suspect band by immuno- electrophoresis; besides, the present approach is a simpler and cheaper alternative to immunoelectrophoresis.
It was also demonstrated that no absorbance peak was detected when two sera and a urine containing a prominent Bence Jones protein were scanned at 415 nm (figure 3). Thus, non-hemoglobin serum proteins did not interfere with the method. Bilirubin absorbs maximally at 454 nm, and absorbs light into the Soret band. Nevertheless, no interference was observed in two sera which contained elevated levels of bilirubin (figure 1 and figure 2), nor in the urine from one of these patients (figure 1). This would be expected because conjugated bilirubin does not migrate with the serum proteins on e lec tr o p h o re s is . A lthough not observed in this study, it is possible that very high unconjugated bilirubin concentrations could interfere by absorbing at 415 nm. However, this compound should co-migrate electrophoretically with albumin, and thus not be easily confused with a Bence Jones protein.
AcknowledgmentThis work was supported in part by funding from
the Department of Veteran Affairs.
References1. Levinson SS, Keren DF. Free light chains of
immunoglobulins: clinical laboratory analysis. Clin Chem 1994;40:1869-78.
2. Levinson S.S. Studies of Bence Jones Proteins by Immunonephelometry. Ann Clin Lab Sci 1992;22:100-9.
3. Bush D, Keren DF. Over—and underestimation of monoclonal gammopathies by quantitation of k—and \ —containing im m unoglobulins in serum. Clin Chem 1992;38:315-6.
4. Monos DS, Bina M, Kahn SN. Evaluation and optimization of variables in immunofixation electrophoresis for the detection of IgG paraproteins. Clin Biochem 1989;22:369-71.
5. Su L, Keren DF, Warren JS. Failure of anti- Lambda immunofixation reagent mimics alpha heavy-chain d isease. C lin Chem 1995;41: 121-3.
6 . Pascali E. Bence jones proteins identified by imm unofixation electrophoresis of concentrated urine. Clin Chem 1994;40:945-6.
7. Cox T, Hess PP, Thompson GD, Levinson SS. Interference w ith glycated hem oglobin by hemoglobin F may be greater than is generally assumed. Am J Clin Pathol 1993;99:137-41.
8 . Ritchie RF, Smith R. Immunofixation. III. Application to the study of monoclonal proteins. Clin Chem 1976;22:1982-5.
9. Cawley LP, Minard BJ, Tourtellotte, Ma BI, C helle C. Im m unofixation elec trophore tic techniques applied to identification of proteins in serum and cerebrospinal fluid. Clin Chem 1976;22:1262-8.
10. Roughton FJW, Kendrew JC, editors. Haemoglobin. Butterworths Scientific Publications, London, 1949.
11. Allen RC, Stastny M, H allett D, Simmoms MAA. Comparison of isoelectric focusing and electochromatography for the separation and quantitation of hemoglobin Ale. In: Radola BJ, editor. E lectrophoresis. New York: W alter deGruyter; 1979:663—70.
12. Menard L, Dempsey ME, Blankstein LA, Ale- yassine H, Wacks M, Soeldner JS. Quantitative determination of glycated hemoglobin A1 by agar gel electrophoresis. Clin Chem 1980;26: 1598-1602.
13. Pascalli E. Urine collection for the detection of Bence Jones proteinuria. Am J Clin Pathol 1991;95:266-270.
14. Bridgden ML, Neal ED, McNeely MDD, Hoag GN. The optimum urine collections and monitoring of Bence-Jones proteinuria. Am J Clin Path 1990;93:689-93.