Embed Size (px)
Citation preview
Lorain County Community CollegeIntegrated Pre-Feasibility Assessment Campus Strategic Energy Master Plan
Preliminary RecommendationsBoard of Trustees Workshop
Elyria, OH5th December 2008
Garforth International llcEnergy Productivity Solutions

© Garforth International llc
Campus Strategic Energy Plan Core Team Structure
Global Perspective – Local ExpertiseGlobal Perspective – Local Expertise
Garforth International llcEnergy Productivity Solutions

© Garforth International llc
New Global Energy RealitiesGrowing Impacts on USA
Highest energy prices in history Sustained volatility with upward trend Globalizing prices
Dependence on imports US – Oil (70%) and natural gas (16%) EU – more than 50% of all energy
Concern over climate change Global regulatory framework emerging Lieberman-Warner Climate Bill narrowly defeated – 2009? Uncertainty over compliance costs or opportunities
Underinvested North American energy infrastructure Electricity grid Rail for coal transport Natural gas terminals
China and India major new energy customers Major impacts on primary fuel prices
Trigger events – blackouts, hurricanes, tornados ….Fundamentally different from pastFundamentally different from past
© Garforth International llc
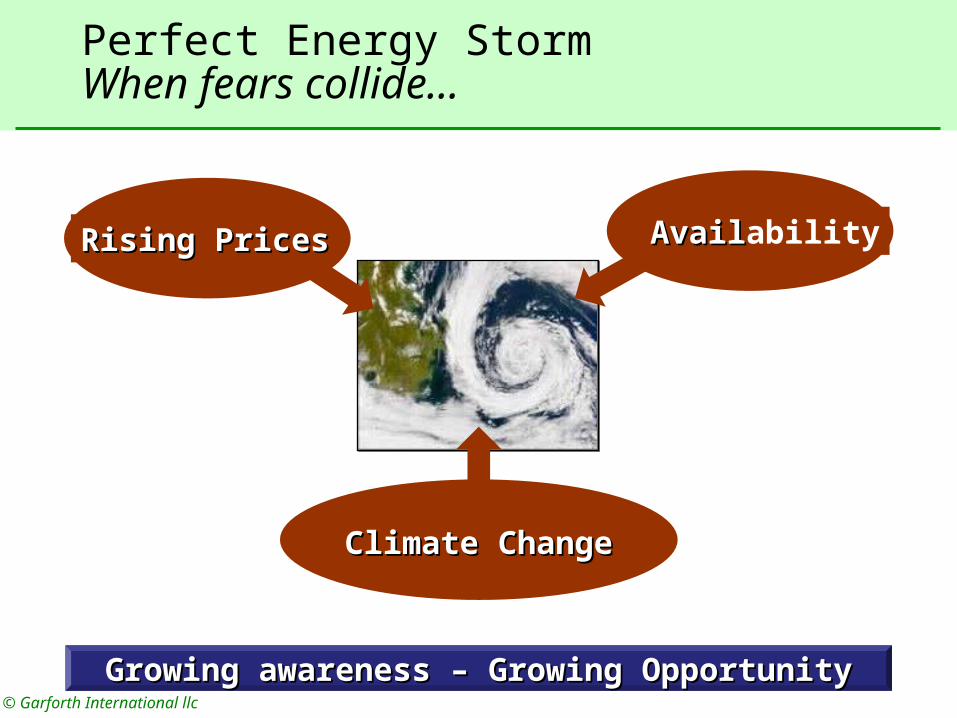
Perfect Energy Storm When fears collide…
Growing awareness – Growing OpportunityGrowing awareness – Growing Opportunity
Rising PricesRising Prices AvailAvailability
Climate ChangeClimate Change

© Garforth International llc
What we pay for What we pay for Gas, Electricity,Gas, Electricity,
Petrol....Petrol....
Energy weEnergy weuseuse
Energy weEnergy wewastewaste
11% of World GDP11% of World GDP
Global Cost of Energy
$ 7.0 Trillion$ 7.0 Trillion
USA about $2.0 Tn (14% of GDP)

© Garforth International llc
Energy ProductivityUS Total Energy Costs ~ $2 Trillion
*Various US/EU Sources – 2006 sources
Key to Competitiveness Key to Competitiveness and and SecuritySecurity
Region Population GDP Energy Energy/Capita
Energy/GDP
USA 4.6% 25.9% 20.5% 100 100EU 7.5% 31.1% 15.9% 47 65
Japan 1.9% 8.1% 4.6% 54 72China 20.0% 6.1% 15.0% 17 312India 17.1% 2.0% 4.7% 6 291World 100% 100% 100% 22 81

© Garforth International llc
Total US Energy Use
Source: US DoE EIA
Buildings38.7%
Industry33.25%
Transport27.79%
Coal
Gas
Domestic Oil
Import Oil
Uranium
Renewable
Homes
Commercial
Industry
Transportation
Buildings largest energy consumerBuildings largest energy consumer

© Garforth International llc
Effectiveness by SectorHow well do we use our energy?
Most energy lost in range of inefficiencies Only 5% to 15% used productively
Major potential for efficiency gains!Major potential for efficiency gains!*Indicative ratio of US average to global best practice
Sector EnergyShare
Energy Use IndexUSA/EU
Industry 33% 1.2
Buildings* 39% USA 2.5CALIF 1.8
Transportation* 28% 1.4

© Garforth International llc
Lorain County Community CollegeCampus Strategic Energy Plan
Improve energy efficiency Reduce impact of future energy pricing Improve energy supply reliability Flexibility to grow with the anticipated build-out Flexibility to add new technologies as they emerge Minimise direct and indirect greenhouse gas creation Role model for Students, Community and Ohio Exceed requirements of Ohio House Bill 251 Long-term horizon through 2030 Final report & presentations within agreed timeline Potential new academic programmes based on
energy productivity and climate change mitigation
Wider perspective than HB 251Wider perspective than HB 251
Agreed ObjectivesAgreed Objectives

© Garforth International llc
Campus Strategic Energy PlanRecommendations vs Working Goals
Energy efficiency gain Working target 30% Preliminary Recommendation 37%%
50% Greenhouse gas reduction Working target 50% Preliminary Recommendation 39%
Internal Rate of Return Working target >15% Conservative Price Scenario 7.6% Climate Risk Price Scenario 14.7%
2007 Energy Costs $ 1,717K2007 Energy Costs $ 1,717KCarbon FootprintCarbon Footprint~ 19,600 MT Campus Ops~ 19,600 MT Campus Ops
Culture of Continuous ImprovementCulture of Continuous Improvement

© Garforth International llc
Lorain County Community College2007 vs 2004 Energy Overview
2007 relative to 2004 Electricity use 9.1% higher Gas use 6.3% lower Electricity cost 18% higher Gas cost 20% higher Total indexed energy use 2.3 % lower
First Energy price freeze ends 2008
Utility used 2004$K
2004kWhe
2007$K
2007kWhe
2014kWhe Target
Gas $ 507 20,609,535 $ 609 19,330,432 NA
Electricity $ 947 12,635,513 $ 1,108 13,821,165 NA
Total $ 1,454 33,245,048 $ 1,717 33,151,597 NA
Index / ISO $17.33/m2 384 kWhe/m2 $19.37 /m2 375 kWhe/m2 307 kWhe/m2
Index / US $1.61/ft2 125,561 Btu/ft2 $1.80/ft2 118,865 Btu/ft2 100,449 Btu/ft2
Carbon Footprint 19,600 Metric TonsCarbon Footprint 19,600 Metric Tons

© Garforth International llc
LCCC Energy Use BenchmarksAustrian and Ohio Colleges
LCCC total energy index 375 kWhe/m2/year 79% higher than Austria average
Terra Community College 285 kWhe/m2/year 24% less than LCCC
Lakeland Community College 377 kWhe/m2/year 1% higher than LCCC
Owens Community College 438 kWhe/m2/year 17% higher than LCCC
Substantial Energy Efficiency PotentialSubstantial Energy Efficiency Potential
Lorain County CC
ElectricityHeat
Average

© Garforth International llc
Campus Strategic Energy Plan FrameworkFrom Application to Fuel
Questions “How much energy do I need?” “Which renewable energy choices are viable?’” “Is on-site cogeneration a good choice?” “How can I team with the existing grid?” “What is best balance of investment in efficiency and
supply?” “How might these choices change in the future?” “What is impact of possible greenhouse gas regulation?”
Application Buildings Distribution Conversion Fuel
Decision Basis for Integrated Energy PlanDecision Basis for Integrated Energy Plan
© Garforth International llc
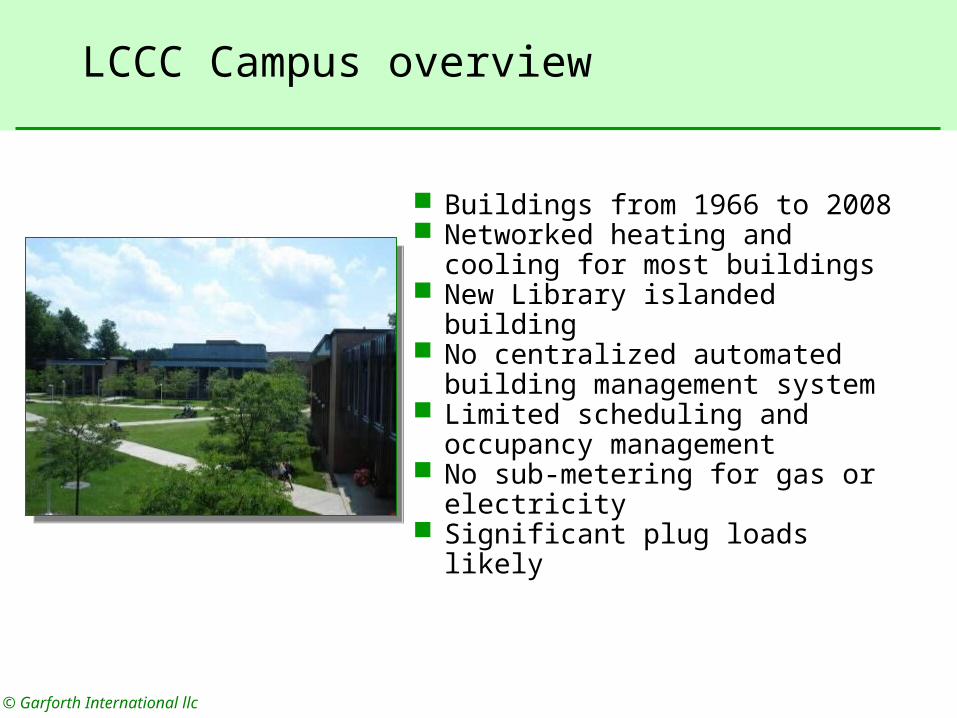
LCCC Campus overview
Buildings from 1966 to 2008 Networked heating and cooling
for most buildings New Library islanded building No centralized automated
building management system Limited scheduling and
occupancy management No sub-metering for gas or
electricity Significant plug loads likely

© Garforth International llc
Building Management System and MeteringGain Campus-wide Control
Recommend immediate installation in 2009 Integrates all Control Systems
Heating, cooling, air handling, lighting etc Systematic energy optimization Sub-metering across entire campus Extensive reporting capability Schedule and weather management
Transparency of energy use Communication and data basis to engage
staff, students and faculty
Prerequisite for all other optionsPrerequisite for all other options

© Garforth International llc
Evaluating energy needsEight Buildings Modeled in Detail

© Garforth International llc
Current BuildingsIdentifying Efficiency Opportunities
Base year 2007 Base & Efficient cases done for key buildings
AT – Nord Advanced Technology Center BU – Business Building PE – Physical Education Building LR – Multipurpose Center SC – C. Paul Stocker Humanities & Fine Arts Center SP – John A. Spitzer Conference Center UC – University Center PS – Physical Sciences Building
Other Buildings prorated by type/age/use Recommendations
Efficiency retrofits Efficiency investments Energy performance standards for new buildings

© Garforth International llc
Building EfficiencyMany Opportunities Identified
Building operation Heat and cool areas only when needed Pre-condition areas according to weather Night and low-occupancy set back of thermostats Only light occupied areas Utilize daylighting wherever feasible Manage exterior lighting for real usage patterns Reducing miscellaneous electrical loads
Building Structure Roof insulation Reduction of thermal bridges Selective window replacements Reduce unwanted air infiltration
Improved control and metering is a MustImproved control and metering is a Must

© Garforth International llc
Typical Efficiency Measures Examples from multiple buildings
Upgrade roof insulation to at least R25 Eliminate thermal shorts in roof
structure and window sills Selectively replace windows Install occupancy sensors Implement daylighting control in
atrium, corridors, classrooms, labs… Realign and repair doors to reduce
infiltration Selectively add vestibules to high
usage doors Reduce plug load with staff/student
awareness program Manage heating, cooling and lighting
according to scheduled needs
Behavioral and Investment BasedBehavioral and Investment Based

© Garforth International llc
Establish BaselineExample – University Center
Develop Energy End-Use Profiles Develop Energy End-Use Profiles
End UsesEnd UsesNeedsNeeds
SeasonalSeasonalPatternsPatterns
Spot anomaliesSpot anomaliese.g. high plug loadse.g. high plug loads
EnergyEnergyIndexesIndexes

© Garforth International llc
Base-to-Efficient Case ComparisonEnergy End-Use
Energy efficiency increased by 37% Energy efficiency increased by 37%
Seasonal DemandSeasonal Demand
Base CaseBase Case Efficient CaseEfficient Case
BaseLine Case: Campus Consumption Simulated
0
500000
1000000
1500000
2000000
2500000
3000000
3500000
4000000
4500000
5000000
Jan Feb Mar Apr May Jun Jul Aug Sep Oct Nov Dec
Months
kWhr
equ
ival
ent
Hot WaterSpace Heat Nat GasArea LightsTask LightsMisc. Equip.Pumps & Aux.Vent. FansSpace Heat ElectricHeat Reject.Space Cool
Energy Efficient Case: Campus Consumption Simulated
0
500000
1000000
1500000
2000000
2500000
3000000
3500000
4000000
4500000
5000000
Jan Feb Mar Apr May Jun Jul Aug Sep Oct Nov Dec
Months
kWhr
equ
ival
ent
Hot WaterSpace Heat Nat GasArea LightsTask LightsMisc. Equip.Pumps & Aux.Vent. FansSpace Heat ElectricHeat Reject.Space Cool

© Garforth International llc
New Buildings and ExpansionsMinimum Energy Efficiency Standards
Recommended Building Code Equal or better than California Title 24 (2005) Similar to EU 2001 Energy Efficiency in Buildings Directive
Typical energy performance 150 kWhe/m2/year ~ 47,566 Btu/ft2/year 60% over baseline
Typical heating demand 75 kWhe/m2/year ~ 23,783 Btu/ft2
66% over baseline ~ 40% over efficient case Typical electrical demand
75 kWhe/m2/year ~ 23,783 Btu/ft2
38% over baseline ~ 16% over efficient case
Aim should be to exceed these levels Aim should be to exceed these levels

© Garforth International llc
Energy Supply and DistributionMultiple Choices Evaluated
Energy Distribution Steam only Islanded buildings Upgrade heating network
Steam to hot water Extend to new buildings and
LC and SP Upgraded cooling
On-Campus Generation Combined heat and power
Engines Turbine
Existing gas boilers Biomass heating Solar Photovoltaic Wind energy

© Garforth International llc
Energy DistributionPossible Expansion and Conversion to Hot Water

© Garforth International llc
Steam to Heat Conversion Efficient and Simple
Why convert? Reduced heat losses Reduced maintenance costs Enables use of higher efficiency heat generation including
combined heat and power generation Installation alternatives
Heat pipes in the tunnel Heat pipes buried directly in the ground - preferred
Other Additional Measures Heat exchangers on existing boilers for mid and peak load New Substations in individual mechanical rooms Replacement of steam to air pre-heaters - acceleration of
planned measures Installation of gas-fired engine (CHP) in the boiler house

© Garforth International llc
Options Assessed and Rejected
Wind power generation Poor wind quality Low economic returns Include for educational or outreach reasons
(engineering already planning small unit) Solar Photovoltaic
Poor sun quality Very low economic returns Could include for educational or outreach reasons
Extensive Wall Re-insulation Unacceptable returns
Geothermal Heating and Cooling Not cost effective on existing buildings Could be integrated in future to campus heating
Ice Storage Unattractive due to current low electricity costs Supplementary peaking chiller for Spitzer/Stocker
recommended
Should be regularly reassessed Should be regularly reassessed

© Garforth International llc
Scenarios evaluatedInvestments in $ 000’s
BMS / Meters implemented in 2009 Upgrades of College Center included in Base Case except Roof Building Efficiency measures phased from 2009 to 2013 CHP / Biomass plus Steam implemented in 2010 CHP / Biomass plus Hot Water implemented 2012 Scenarios 7-9 include $250K for additional steam to hot water coil
conversion
# Scenario BMS Meters Efficiency DH Net CHP Biomass Totals
1 Base Case
2 Gain Control 1,485 270 $1,755
3 Add Efficiency 1,485 270 6,400 $8,155
4 Turbine + Steam 1,485 270 6,400 1,100 $9,255
5 Biomass + Steam 1,485 270 6,400 1,890 $10,045
6 Biomass/Abs + Steam 1,485 270 6,400 2,080 $10,235
7 CHP Engine + HW 1,485 270 6,650 1,170 840 $10.415
8 Biomass + HW 1,485 270 6,650 1,170 1,760 $11,335
9 Biomass/Abs + HW 1,485 270 6,650 1,170 1,985 $11,560

© Garforth International llc
Analysis ResultsConservative Scenario
3 to 9 meet HB 251 efficiency requirements None meet 15% IRR Hurdle 5 through 9 approach greenhouse gas goals
Is there another picture? Is there another picture?
# Scenario Invest$M
NPV$M
IRR%
CO2 MT
CO2 % reduce
1 Base Case 19,600
2 Gain Control $1.755 $1.14 9.8% 16,800 20%
3 Add Efficiency $8.155 $2.08 7.9% 13,900 28%
4 Turbine + Steam $9.255 $0.62 6.0% 13,600 29%
5 Biomass + Steam $10.045 $0.99 6.5% 11,700 40%
6 Biomass/Abs + Steam $10.235 ($0.32) 4.8% 11,400 42%
7 CHP Engine + HW $10.415 $2.43 7.6% 12,000 39%
8 Biomass + HW $11.335 $0.07 5.3% 11,500 41%
9 Biomass/Abs + HW $11.560 ($1.52) 3.7% 11,200 43%

© Garforth International llc
Assumptions for Financial Assessment “Climate Risk” Scenario
Electricity gains 10%in 2009 then 8 % per year Gas increases by 7% per year CO2 allowances (NAIM Mid-Estimates)
2009 $ 8.00 2012 $ 32.22 2030 $143.95
Biomass Zero carbon fuel of choice – hits $20/MWh in 2009 Price increases by 10% per year
CHP electricity is net metered Follows electricity retail pricing
Discount rate remains 5.25%
Many anticipate even greater impactsMany anticipate even greater impacts

© Garforth International llc
Analysis ResultsClimate Risk Scenario
3 to 9 meet HB 251 efficiency requirements 2,3 and 7 approach 15% IRR Hurdle 7 has attractive returns and greenhouse gas reductions
Recommendation Basis Recommendation Basis
# Scenario Invest$M
NPV$M
IRR%
CO2 MT
CO2 % reduce
1 Status quo 19,600
2 Gain Control $1.755 $5.05 18.5% 16,800 20%
3 Add Efficiency $8.155 $9.37 14.2% 13,900 28%
4 Turbine + Steam $9.255 $10.03 13.6% 13,600 29%
5 Biomass + Steam $10.045 $10.57 13.8% 11,700 40%
6 Biomass/Abs + Steam $10.235 $9.08 12.7% 11,400 42%
7 CHP Engine + HW $10.415 $13.89 14.7% 12,000 39%
8 Biomass + HW $11.335 $10.00 12.5% 11,500 41%
9 Biomass/Abs + HW $11.560 $8.40 11.4% 11,200 43%
© Garforth International llc
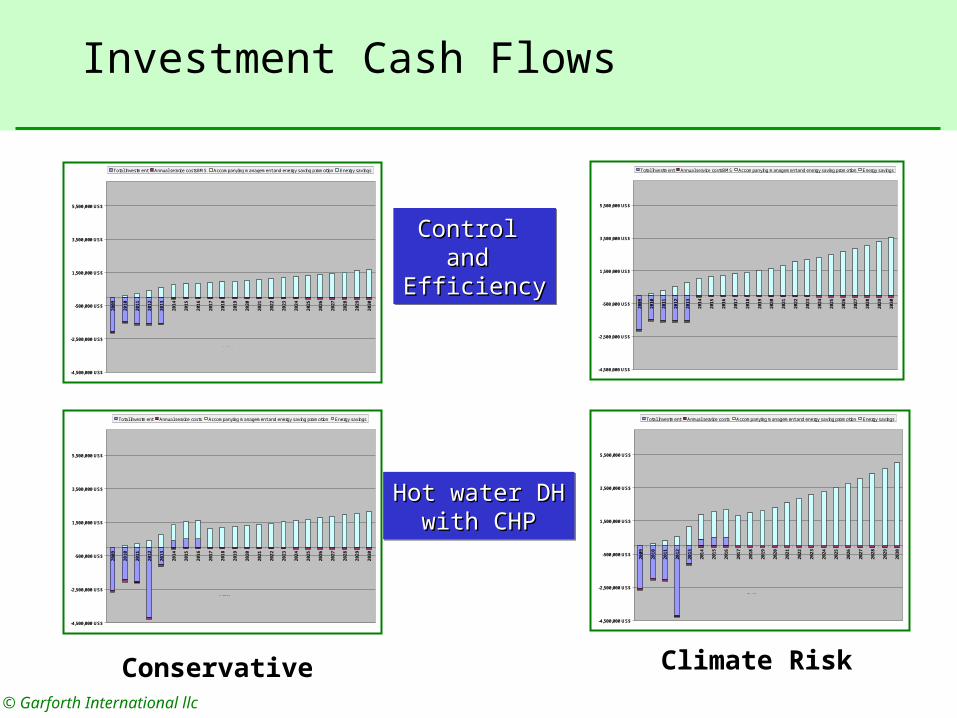
Investment Cash Flows
Conservative Climate Risk
Control Control and and
EfficiencyEfficiency
Hot water DHHot water DHwith CHPwith CHP
-4,500,000 US$
-2,500,000 US$
-500,000 US$
1,500,000 US$
3,500,000 US$
5,500,000 US$
2009
2010
2011
2012
2013
2014
2015
2016
2017
2018
2019
2020
2021
2022
2023
2024
2025
2026
2027
2028
2029
2030
Total Investment Annual service costsBMS Accompanying management and energy saving promotion Energy savings
IRRNPV $2,080,000
7.9%
-4,500,000 US$
-2,500,000 US$
-500,000 US$
1,500,000 US$
3,500,000 US$
5,500,000 US$
2009
2010
2011
2012
2013
2014
2015
2016
2017
2018
2019
2020
2021
2022
2023
2024
2025
2026
2027
2028
2029
2030
Total Investment Annual service costsBMS Accompanying management and energy saving promotion Energy savings
IRRNPV $9,370,000
14.2
-4,500,000 US$
-2,500,000 US$
-500,000 US$
1,500,000 US$
3,500,000 US$
5,500,000 US$
2009
2010
2011
2012
2013
2014
2015
2016
2017
2018
2019
2020
2021
2022
2023
2024
2025
2026
2027
2028
2029
2030
Total Investment Annual service costs Accompanying management and energy saving promotion Energy savings
7.6%IRRNPV $2,430,000
-4,500,000 US$
-2,500,000 US$
-500,000 US$
1,500,000 US$
3,500,000 US$
5,500,000 US$
2009
2010
2011
2012
2013
2014
2015
2016
2017
2018
2019
2020
2021
2022
2023
2024
2025
2026
2027
2028
2029
2030
Total Investment Annual service costs Accompanying management and energy saving promotion Energy savings
14.7IRRNPV $13,890,000

© Garforth International llc
Creating an Energy Efficient Culture
Establish Staff-Student Energy Programs Very low cost efficiency opportunity Basis for continuous improvement Examples to reduce energy use
Personal space heaters, refrigerators and fans Vending machines Computer lab equipment Turning off lights! Using available daylight Plan schedules with energy use in mind Commuting …..
Extend to include recycling?Additional 5% to 10% Efficiency Gain!Additional 5% to 10% Efficiency Gain!

© Garforth International llc
Preliminary RecommendationsEnergy and Climate
Total Investment - $10.4 M from 2009 to 2013 BMS, Meters and Building Measures Convert Steam network to hot water Extend to Spitzer Conference Center and new buildings Install 2 x 300kW CHP engines Mothball / eliminate one steam boiler
Active energy management Scheduling and occupancy Weather predictive management Staff/Student engagement Visible, frequent communication and reporting
Recognize educational opportunity Design installations with outreach in mind Add visible elements to initial budget Consider LED street lighting and signage Explore changed curriculum
Prepare for Climate Legislation Register 2004 - 2007 baseline with The Climate Registry
© Garforth International llc
Campus Strategic Energy Plan2014 Indications Exceed HB 251
Efficiency and Financial Indications Energy efficiency gain ~ 37% Greenhouse gas reductions ~ 39% Internal Rate of Return (IRR) ~ 8% to 15%
Basis for new academic programs Potential for wider community engagement
Culture of Continuous ImprovementCulture of Continuous Improvement

© Garforth International llc
Thank you!


![LCCC CARE Team Handbook March 2016[2]](https://img.dokumen.tips/doc/110x75/58a2ccf51a28abf8698b5e9b/lccc-care-team-handbook-march-20162.jpg)


