Embed Size (px)
Citation preview

Evaluation of the reliability for L2 speech rating in discourse completion test
Yusuke Kondo and Yutaka Ishii
Prediction method used in automated scoring system for L2
1
0
01
Item x
Item x
PredictorsSpeech ratePitch rangeMean length of utterance
2

Predictor examination
01 01
Inde
x A
Index BIn
dex
CIndex D
Good predictors Bad predictors
When we try to predict scores using two indices …,
3

Unreliable rating
= 0= 1
Inde
x A
Index B
The first rating The second rating
Inde
x A
Index B
4

Ishii and Kondo (2015)
5
.27 .57
Our own ratings Ratings in Narita (2013)

Agreement of automated scoring with raters
Group Correlation % ExactAgreement
% AdjacentAgreement Kappa Weighted
Kappa
Naïve .77 41 89 .27 .75
Untrained .61 31 73 .16 .59
Certificated (Average) .92 70 99 .62 .91
Certificated (Exemplary) .95 80 100 .76 .94
Powers, Escoffery, and Duchnowski (2015) Applied Measurement in Education
Untrained < Naïve < Certificated (Average) < Certificated (Exemplary)
6

Comes as no surprise
• Reliable rating is absolutely essential for the construction of automated scoring system.
7

Then,
• how do we evaluate reliability in L2 performance?• What index should be used?
8

Outline• Reliability indices in L2
performance assessment• Reliability indices in
psychometrics• Observation of reliability indices• Some comments and suggestions
9

Language Testing 30-32• Reliability indices used
1. Cronbach’s Alpha2. Percentage of agreements3. Cohen’s kappa4. Spearman rank correlation coefficient5. Pearson correlation coefficient6. Infit and Outfit measures (IRT)7. Root-mean-square deviation
10

Alpha in rating data• Bachman (2004) “coefficient
alpha should be used”• Bachman’s recommendation is
introduced in Carr (2011) and Sawaki (2013).
11

Journals on psychometrics• Reliability indices discussed
1. Polychoric correlation coefficient2. McDonald’s omega3. Intraclass correlation coefficient4. Standard deviation of correlation coefficients5. Means of correlation coefficients
12

Next,
• we will be looking at how the reliability indices behave in our rating data.
13

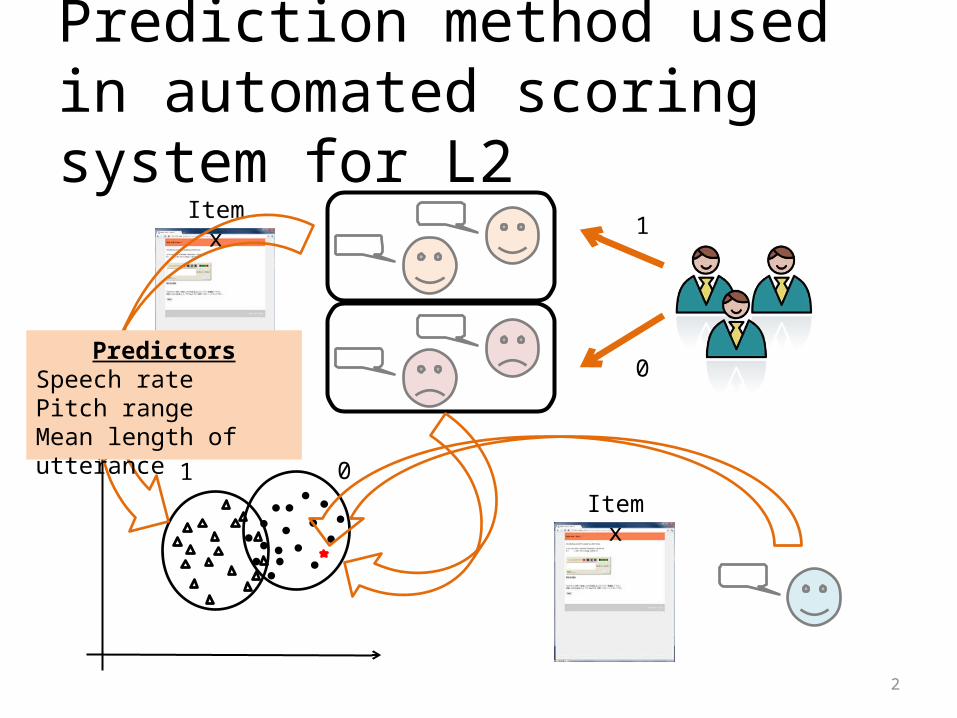
Data• 30 different discourse completion
task completed by 44-60 university students.• Each utterance was rated by
different three raters
14
ExampleWhen you (A) want to ask your friend about their weekend, what would you say in the conversation below? A: ( )B: We went shopping.
15

Rating criteriaScore Description
3 Can understand the speaker’s intention. Natural pronunciation and Intonation. Almost no foreign accentedness.
2 Can understand the speaker’s intention, but can find some foreign accents.
1 Can’t understand the speakers’ intention because of strong foreign accents
0 Can’t catch the utterance because of low voice or noise.
16

Target indices• Cronbach’s alpha– Kendall– Spearman– Pearson– Polychoric
• McDonald’s omega• Mean of correlation
coefficients
• Fleiss’ kappa• Percentage of exact and
adjacent agreement
17

Data frameα_k α_spe α_pea α_pol . . . κ %
Item 1 .47 .53 .48 .74 . . . .22 .75
Item 2 .56 .55 .55 .67 . . . .25 .80
Item 3 .62 .67 .64 .59 . . . .30 .90
. . . . . . . . . .
. . . . . . . . . .
. . . . . . . . . .
Item 30 .66 .86 .67 .92 . . . .47 .66
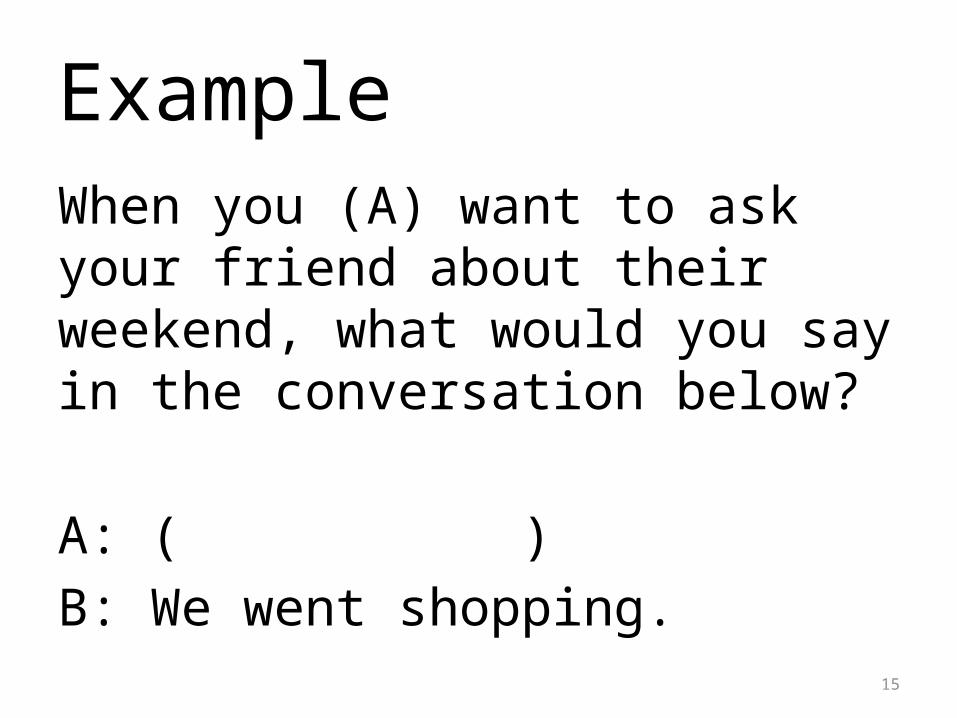
18
Much the same.Mean of correlation
coefficients
Cronbach’s alpha McDonald’s omega
19
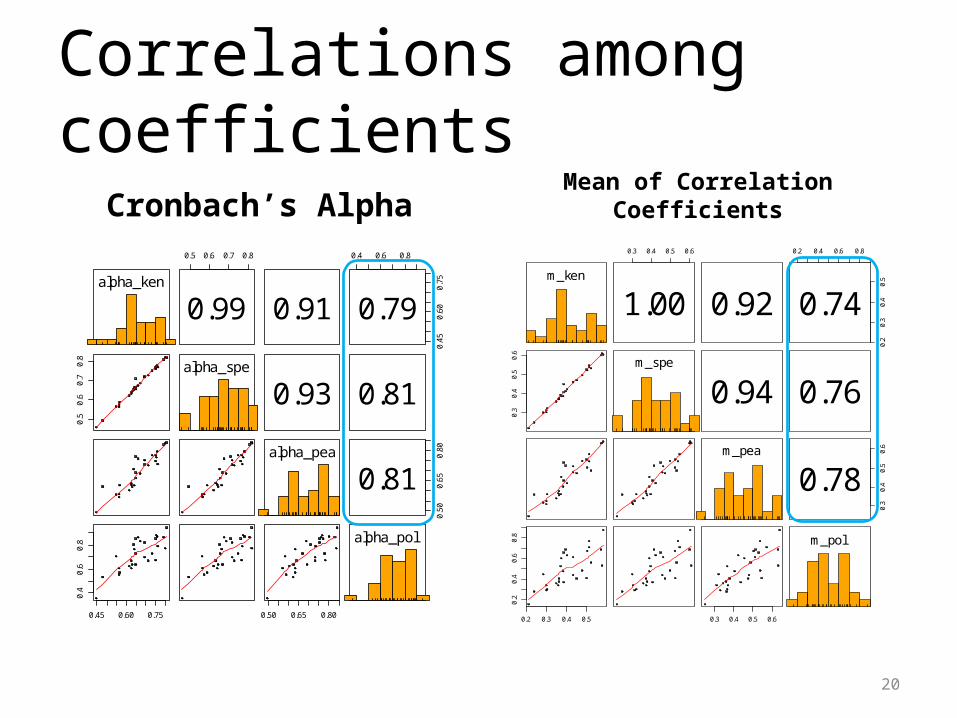
Correlations among coefficients
Cronbach’s Alpha
alpha_ken
0.5 0.6 0.7 0.8
0.99 0.91
0.4 0.6 0.8
0.45
0.60
0.75
0.79
0.5
0.6
0.7
0.8
alpha_spe
0.93 0.81
alpha_pea0.50
0.65
0.80
0.81
0.45 0.60 0.75
0.4
0.6
0.8
0.50 0.65 0.80
alpha_pol
Mean of Correlation Coefficients
m_ken
0.3 0.4 0.5 0.6
1.00 0.92
0.2 0.4 0.6 0.8
0.2
0.3
0.4
0.5
0.74
0.3
0.4
0.5
0.6
m_spe
0.94 0.76
m_pea
0.3
0.4
0.5
0.6
0.78
0.2 0.3 0.4 0.5
0.2
0.4
0.6
0.8
0.3 0.4 0.5 0.6
m_pol
20

Correlations among coefficients
McDonald’s omega
omegah_ken
0.50 0.60 0.70 0.80
0.97 0.86
0.3 0.5 0.7 0.9
0.50
0.60
0.70
0.80
0.69
0.50
0.60
0.70
0.80 omegah_spe
0.91 0.73
omegah_pea0.55
0.65
0.75
0.85
0.67
0.50 0.60 0.70 0.80
0.3
0.5
0.7
0.9
0.55 0.65 0.75 0.85
omegah_pol
21
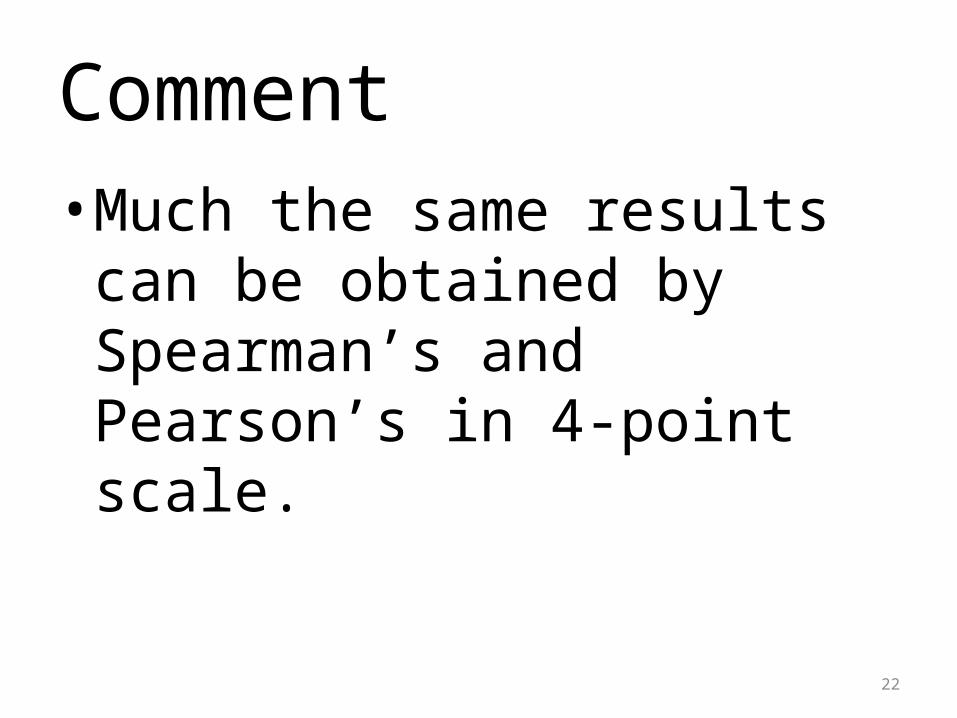
Comment• Much the same results can be
obtained by Spearman’s and Pearson’s in 4-point scale.
22
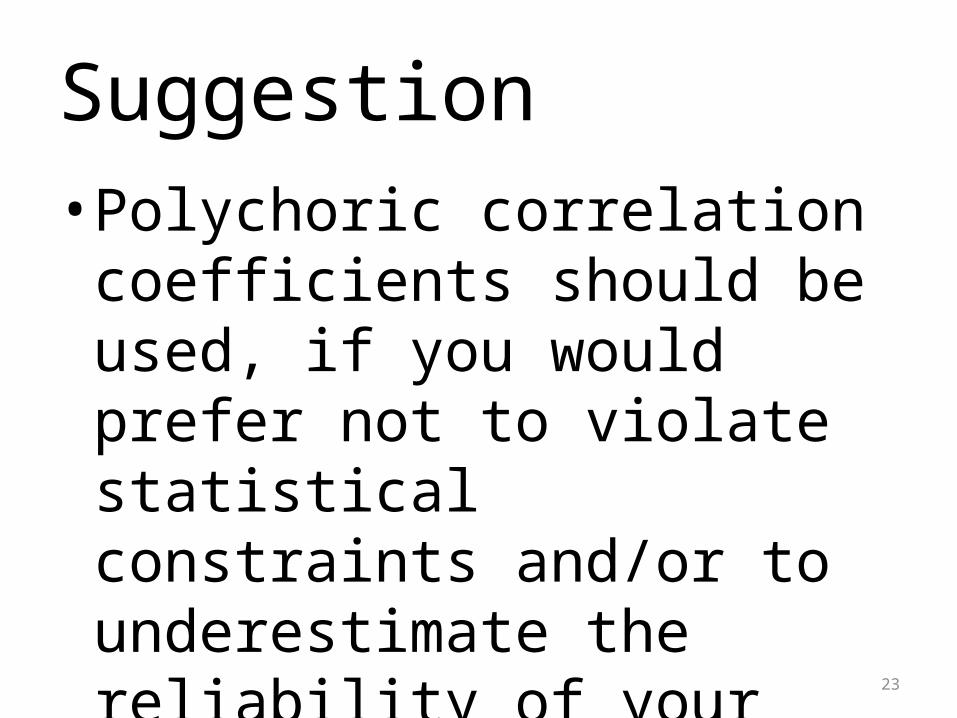
Suggestion• Polychoric correlation coefficients
should be used, if you would prefer not to violate statistical constraints and/or to underestimate the reliability of your data.
23

Reason• Pearson’s should not be used for
rating data.• Use Spearman’s instead.• But, their correlation is extremely
high.• They might share their construct.
24

Correlation among indicesKendall’s based indices
m_ken
0.45 0.55 0.65 0.75
0.99
0.2
0.3
0.4
0.5
0.97
0.45
0.55
0.65
0.75 alpha_ken
0.97
0.2 0.3 0.4 0.5 0.50 0.60 0.70 0.80
0.50
0.60
0.70
0.80
omegah_ken
Spearman’s-based indices
m_spe
0.5 0.6 0.7 0.8
0.99
0.3
0.4
0.5
0.6
0.96
0.5
0.6
0.7
0.8
alpha_spe
0.97
0.3 0.4 0.5 0.6 0.50 0.60 0.70 0.80
0.50
0.60
0.70
0.80
omegah_spe
25

Correlation among indicesPearson’s-based indices
m_pea
0.50 0.60 0.70 0.80
0.99
0.3
0.4
0.5
0.6
0.95
0.50
0.60
0.70
0.80 alpha_pea
0.95
0.3 0.4 0.5 0.6 0.55 0.65 0.75 0.85
0.55
0.65
0.75
0.85
omegah_pea
Polychoric-based indices
alpha_pol
0.3 0.4 0.5 0.6 0.7 0.8 0.9
0.94
0.4
0.5
0.6
0.7
0.8
0.9
0.98
0.3
0.4
0.5
0.6
0.7
0.8
0.9
omegah_pol
0.88
0.4 0.5 0.6 0.7 0.8 0.9 0.2 0.3 0.4 0.5 0.6 0.7 0.8 0.9
0.20.30.40.50.60.70.80.9
m_pol
26

Suggestion• Mean of correlation coefficients,
Cronbach’s alpha, and McDonald’s omega, you can use any of them.
27

ICC, Kappa, and %α M of r ω ICC κ %
α 1 .98 .94 .75 .54 .53
M of r .98 1 .88 .72 .54 .44
ω .94 .88 1 .74 .48 .58
ICC .75 .72 .74 1 .81 .72
κ .54 .54 .48 .81 1 .61
% .53 .44 .58 .72 .61 1
α : α using polychoric correlation coefficientsM of r : Mean of polychoric correlation coefficientsω : ω using polychoric correlation coefficientsICC : Intraclass correlation coefficientsκ : Fleiss’ kappa% : Percentage of exact and adjacent agreements
28

Comment• “Agreement” may be a construct
different from “reliability.”
29
Rater A Rater B
↑True score
Agreement↓

• One more thing, we have found
30

A feature of alphaA B C D E
A 1
B .7 1
C .7 .7 1
D .7 .7 .7 1
E .7 .7 .7 .7 1
F G H I J
F 1
G .9 1
H .9 .9 1
I .5 .5 .5 1
J .6 .6 .6 .9 1
Table 1: Item A Table 2: Item B
𝛼=.92 𝛼=.92
The tables were created, based on Schmitt (1996) Psychological Assessment
To show the difference, SD of correlation coefficients is recommended to be reported.
31

In our dataK L M
K 1
L .80 1
M .45 .90 1
0.05
0.10
0.15
0.20
0.4 0.6 0.8
Alpha
SD
N O P
N 1
O .95 1
P .92 .76 1
32

Comments• Even if we obtain much the same
alphas, the correlations among raters are different in two items.
33

Another feature of alphaQ R S
Q 1
R .7 1
S .7 .7 1
T U V X Y Z
T 1
U .7 1
V .7 .7 1
X .7 .7 .7 1
Y .7 .7 .7 .7 1
Z .7 .7 .7 .7 .7 1
𝛼=.87
𝛼=.93a b c d e f
a 1
b .5 1
c .5 .5 1
d .5 .5 .5 1
e .5 .5 .5 .5 1
f .5 .5 .5 .5 .5 1 𝛼=.8634

Final suggestions• When you report on the
reliability in the rating data with more than two raters,– Polychoric correlation coefficients should be used.– SD of correlation coefficients among raters is
recommended to be reported.– Mean of correlation coefficients might be used
instead of alpha (, which might be more comprehensible than alpha).
35

Outline• Reliability indices in L2
performance assessment• Reliability indices in
psychometrics• Observation of reliability indices• Some comments and suggestions
36