Embed Size (px)
Citation preview
Detection of Eye Disorders Through
Retinal Image AnalysisBlood Vessel Segmentation, Optic Disc
Segmentationand Fuzzy Logic Image Processing
ByRahul Dey
2
Overview of the Presentation
Common Eye Disorders
Blood and Optic disk Segmentation Literature Survey Algorithm Simulation
Fuzzy Logic Image Processing Introduction Fuzzy Inference System Implementation on Edges
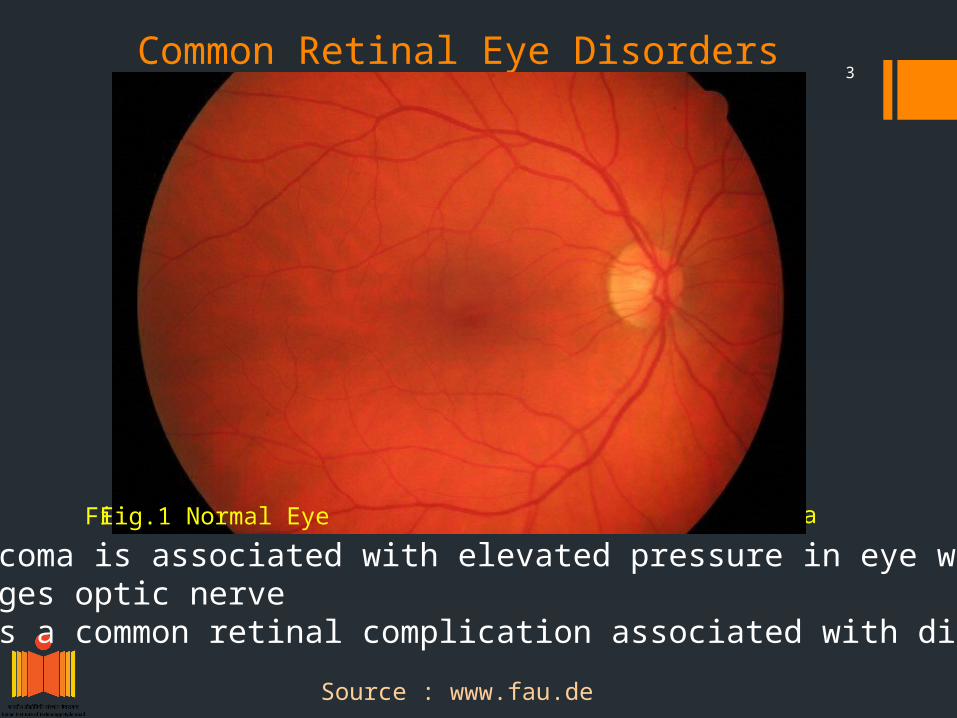
3Common Retinal Eye Disorders
Fig .2 GlaucomaFig.3 Diabetic Retinopathy
Source : www.fau.de
• Glaucoma is associated with elevated pressure in eye which damages optic nerve
• DR is a common retinal complication associated with diabetes
Fig.1 Normal Eye
4
Literature Survey For Optic Disk Segmentation
Extraction of optic disk, fovea, and blood vessel are used for comprehensive analysis and grading of diabetic retinopathy
Other symptoms which can be detected are cotton wool spot, Microaneurysms and haemorrages.
Methods : Circular hough transformation for detection optic disk Curvlet transformation Artificial neural network
Source : www.fau.de
5
Literature Survey For Blood Vessel Segmentation
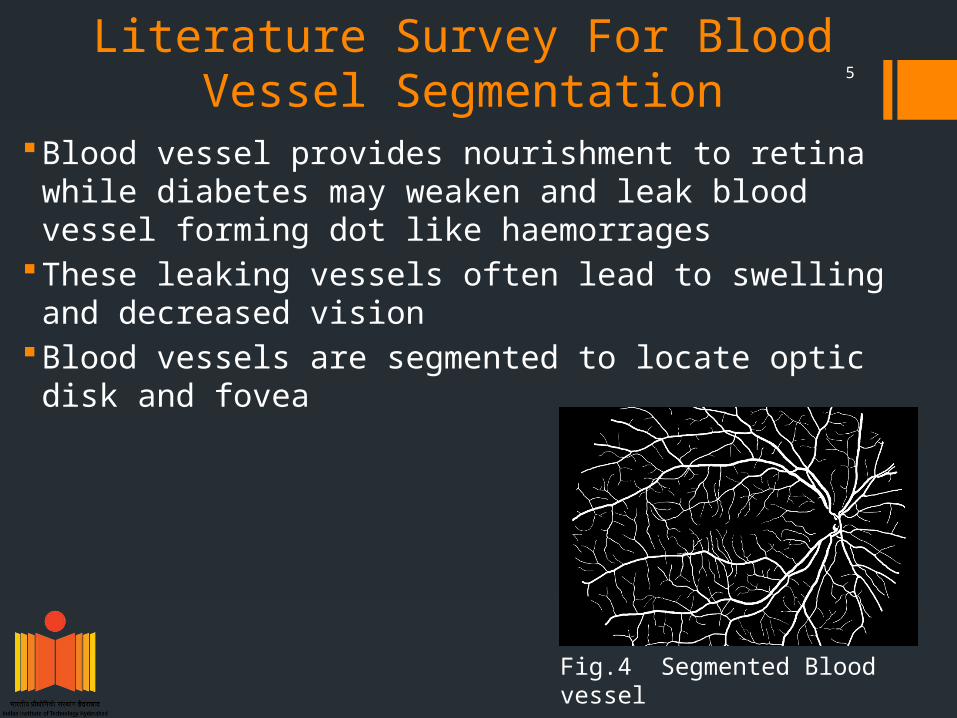
Blood vessel provides nourishment to retina while diabetes may weaken and leak blood vessel forming dot like haemorrages
These leaking vessels often lead to swelling and decreased vision
Blood vessels are segmented to locate optic disk and fovea
Fig.4 Segmented Blood vessel
6Algorithm
Read image & set threshold for , blood vessel segmentation and optic disk dilating window
Blood vessel segmentation starts Resize image to 576 576 Read green channel because green channel has the highest
contrast Performing morphological operation to highlight blood vessel
having size 1 to 6 Adaptive histogram equalization Gaussian filtering ( Median filtering having kernel size 2 x 2 Binarization with user defined threshold
7Algorithm (contd..) Thinning operation Median filtering having kernel size 2 x 2 Filling and dilation
End of blood vessel segmentation
Optic disk segmentation starts Read image Extract red plane Extract green plane Read template of user defined size Extract red plane of the template Do normalize correlation
8Algorithm (contd..)
If Correlation co-efficient is > user defined threshold then extract
optic disk Dilate extracted optic disk with square window of 3 x 3 to 4 x 4 Take mean value of the dilated image as threshold Binarize the image Median filter of size 3 x 3 to 4 x 4 Open by taking kernel size of 4 x 4 Fill the image Perform close operation on the image with disk shape kernel of
radius 2 to 3 pixel Show image Canny edge detection
Else Display error message
End of Optic disk segmentation
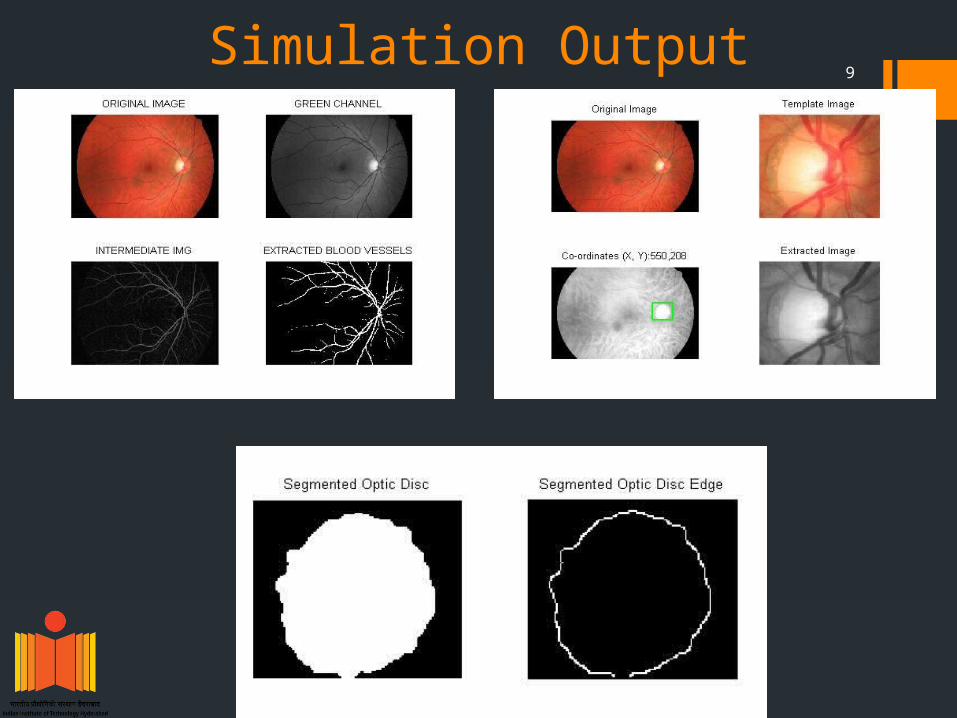
9Simulation Output
10
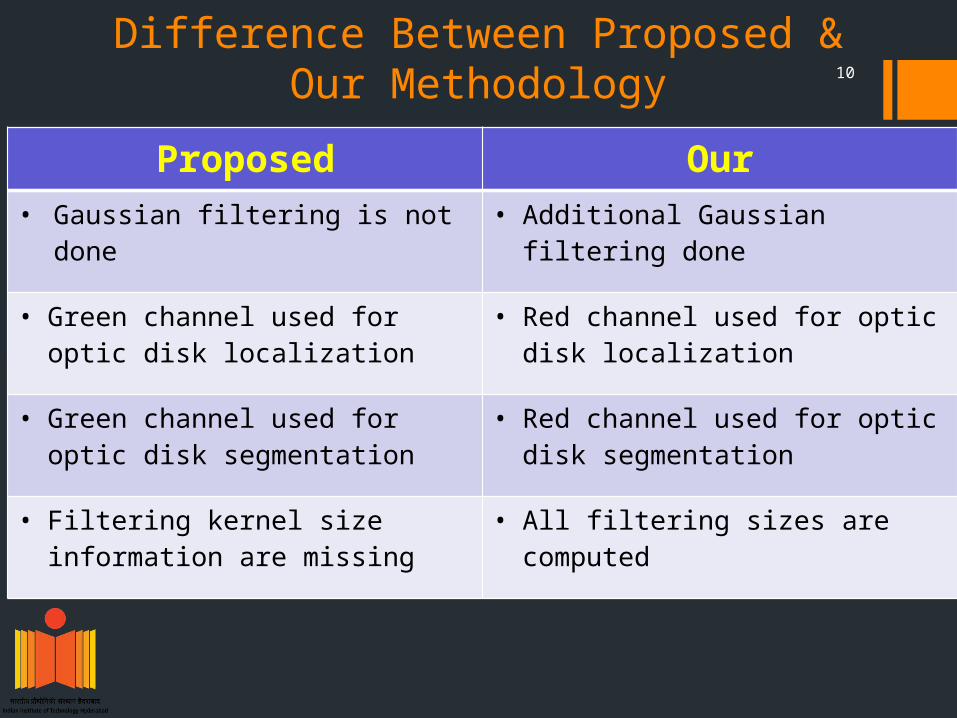
Difference Between Proposed & Our Methodology
Proposed Our• Gaussian filtering is not done • Additional Gaussian filtering
done
• Green channel used for optic disk localization
• Red channel used for optic disk localization
• Green channel used for optic disk segmentation
• Red channel used for optic disk segmentation
• Filtering kernel size information are missing
• All filtering sizes are computed
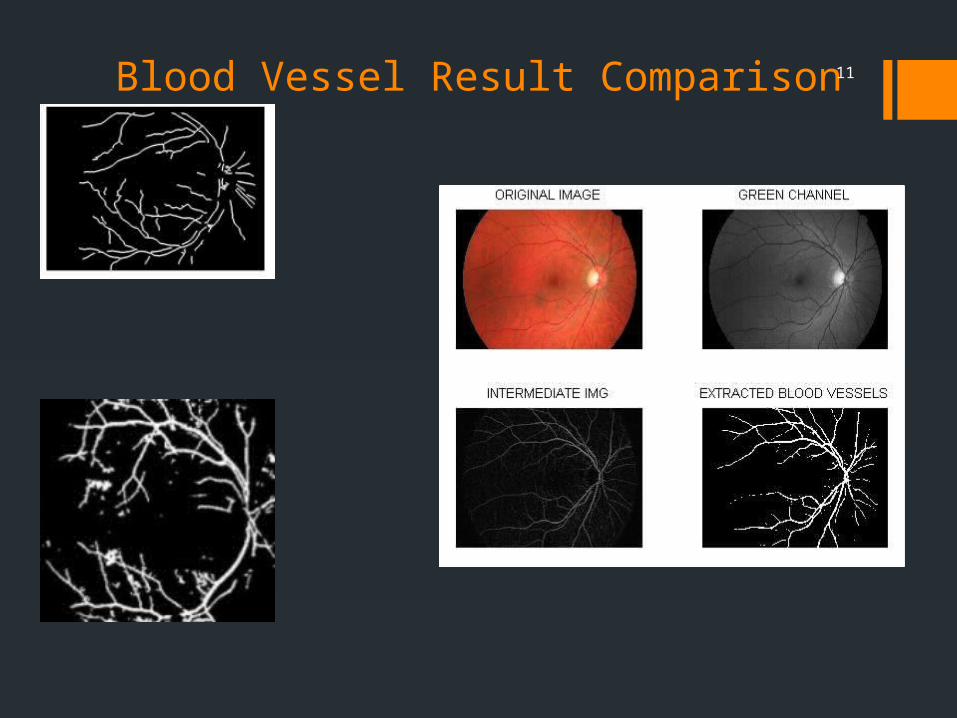
11Blood Vessel Result Comparison
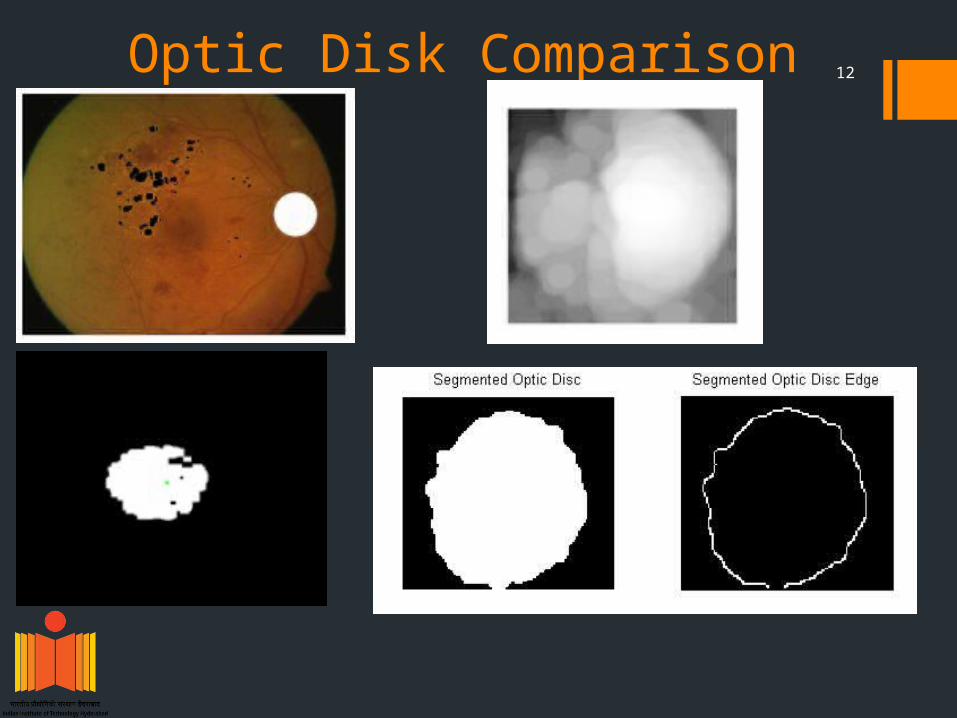
12Optic Disk Comparison
13
Fuzzy Logic Image Processing(FLIP)
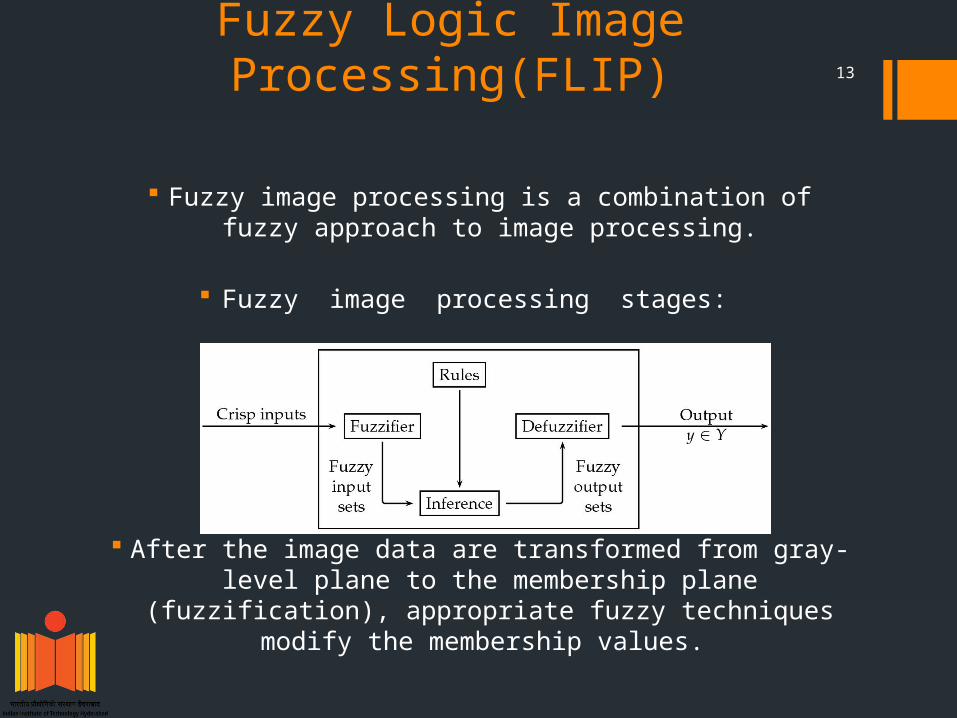
Fuzzy image processing is a combination of fuzzy approach to image processing.
Fuzzy image processing stages:
After the image data are transformed from gray-level plane to the membership plane (fuzzification),
appropriate fuzzy techniques modify the membership values.
14Applications of Fuzzy Logic Image Processing
Contrast Enhancement
Edge Detection
Noise Detection and Removal
Segmentation
Geometric measurement
Scene analysis (Region Labelling)
15Retinal Image Analysis using Fuzzy Logic
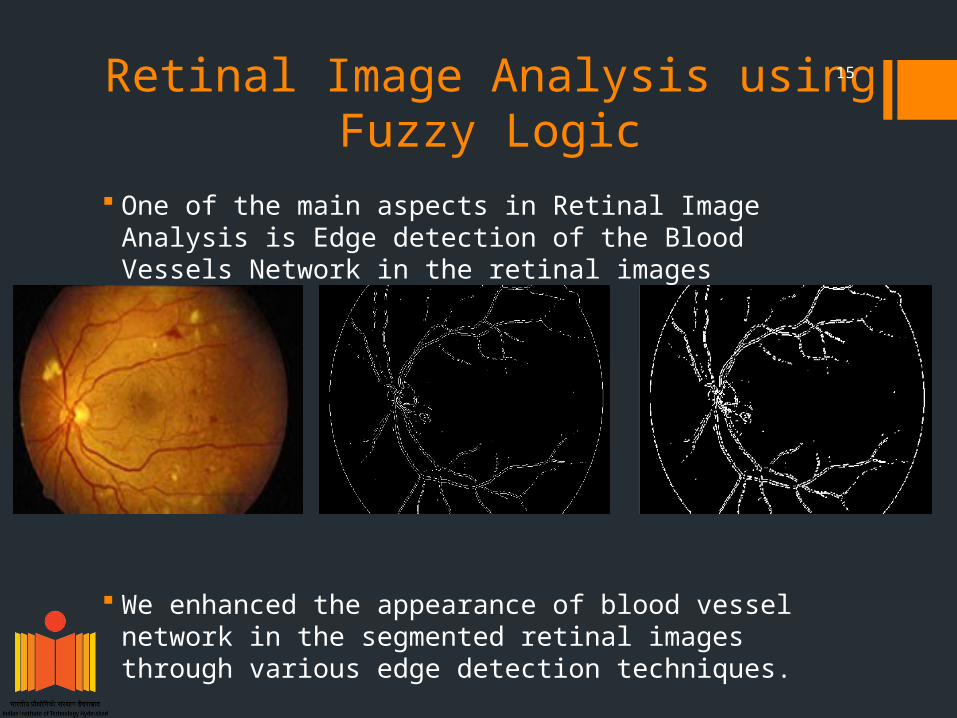
One of the main aspects in Retinal Image Analysis is Edge detection of the Blood Vessels Network in the retinal images
We enhanced the appearance of blood vessel network in the segmented retinal images through various edge detection techniques.
16
Fuzzy Inference System Fuzzy inference is the process of formulating the
mapping from a given input to an output using fuzzy logic.
In order to compute the output of a given FIS from the inputs, these five steps should be done:o Fuzzifying InputsoApplying Fuzzy OperatorsoApplying Implication MethodsoAggregating all outputsoDefuzzifying
17
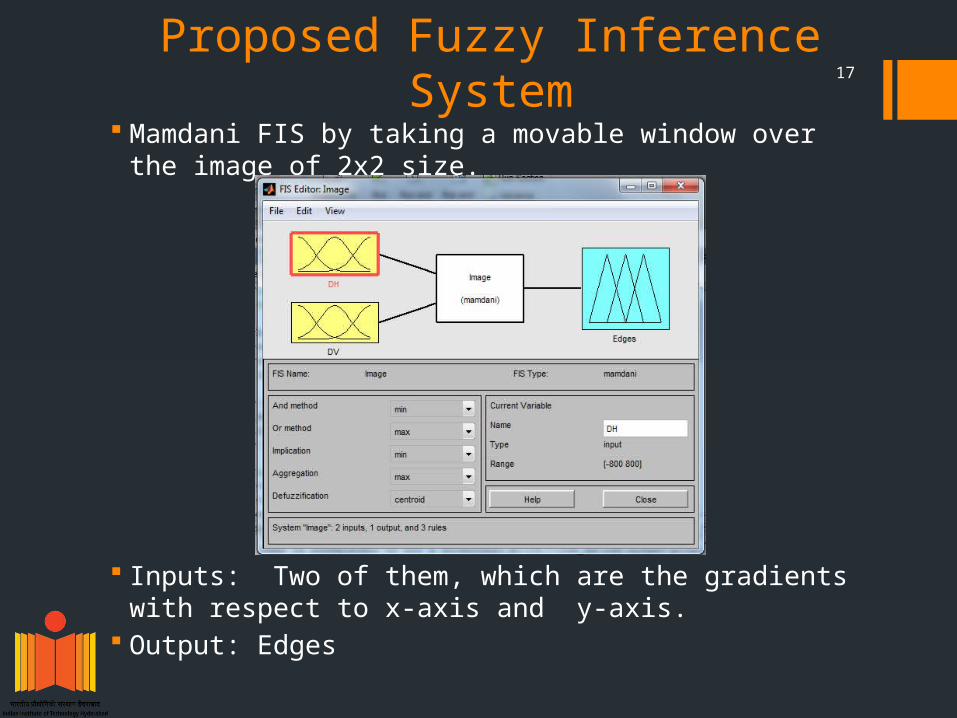
Proposed Fuzzy Inference System
Mamdani FIS by taking a movable window over the image of 2x2 size.
Inputs: Two of them, which are the gradients with respect to x-axis and y-axis.
Output: Edges
18
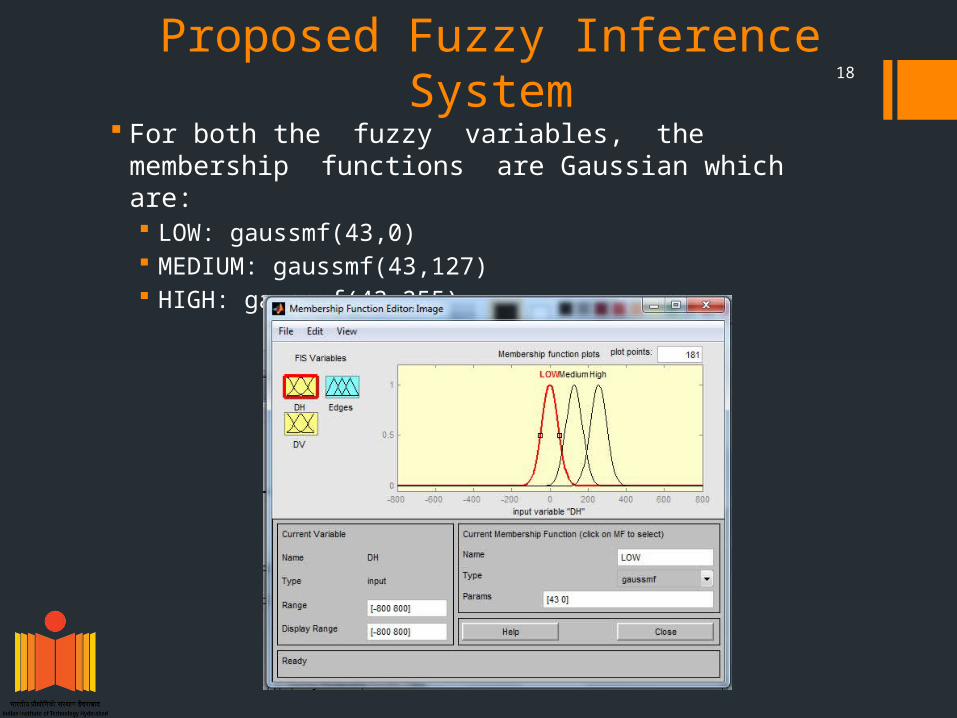
Proposed Fuzzy Inference System
For both the fuzzy variables, the membership functions are Gaussian which are: LOW: gaussmf(43,0) MEDIUM: gaussmf(43,127) HIGH: gaussmf(43,255)
19
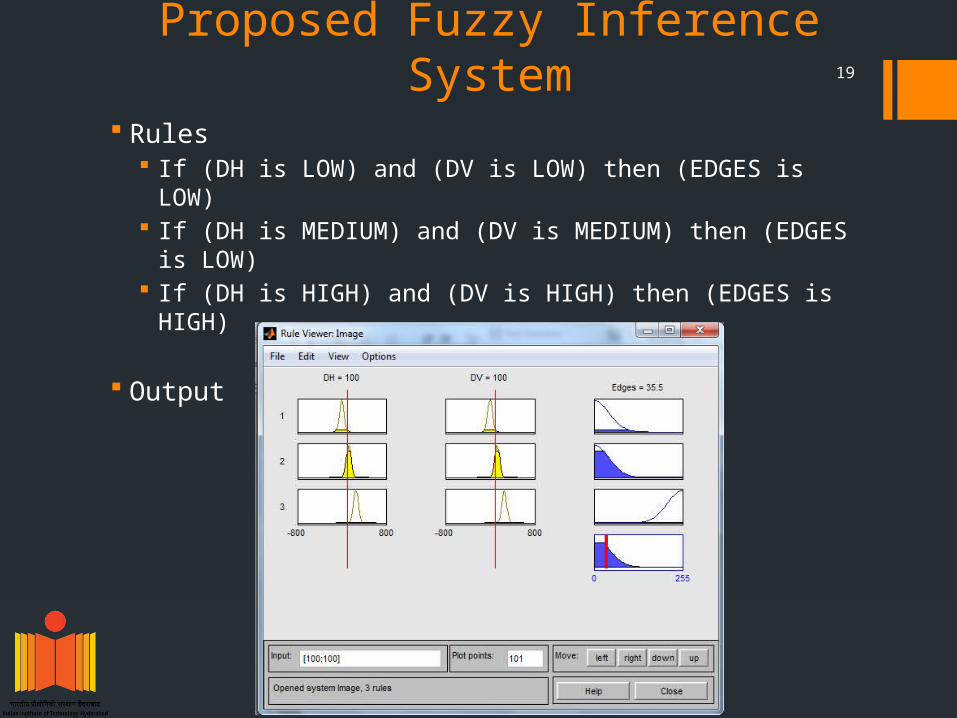
Proposed Fuzzy Inference System
Rules If (DH is LOW) and (DV is LOW) then (EDGES is LOW) If (DH is MEDIUM) and (DV is MEDIUM) then (EDGES is
LOW) If (DH is HIGH) and (DV is HIGH) then (EDGES is HIGH)
Output
20
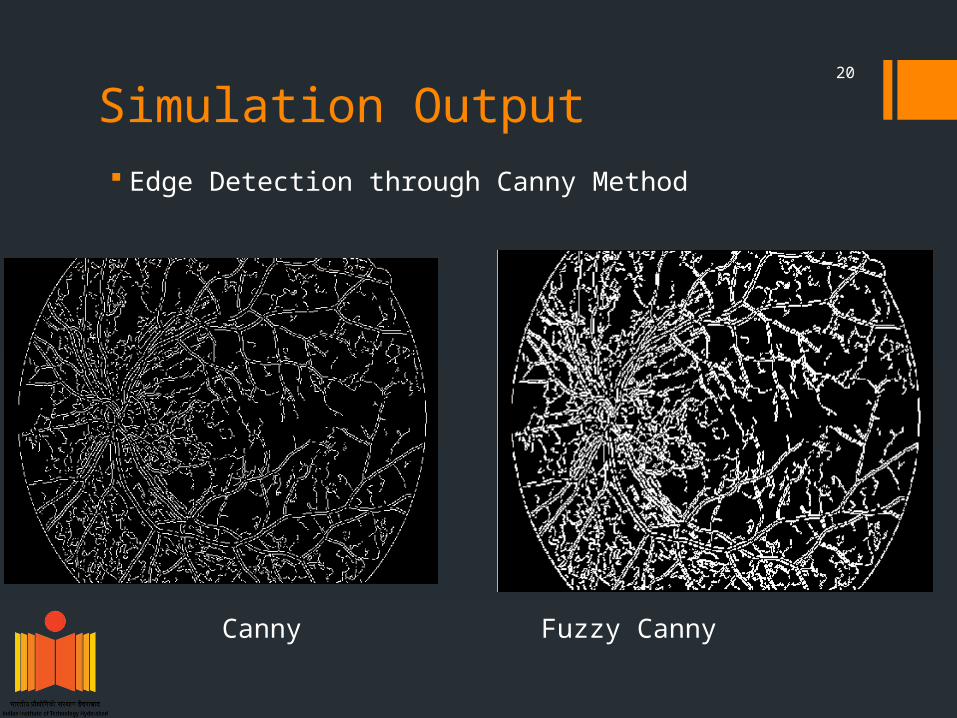
Simulation Output Edge Detection through Canny Method
Canny Fuzzy Canny
21
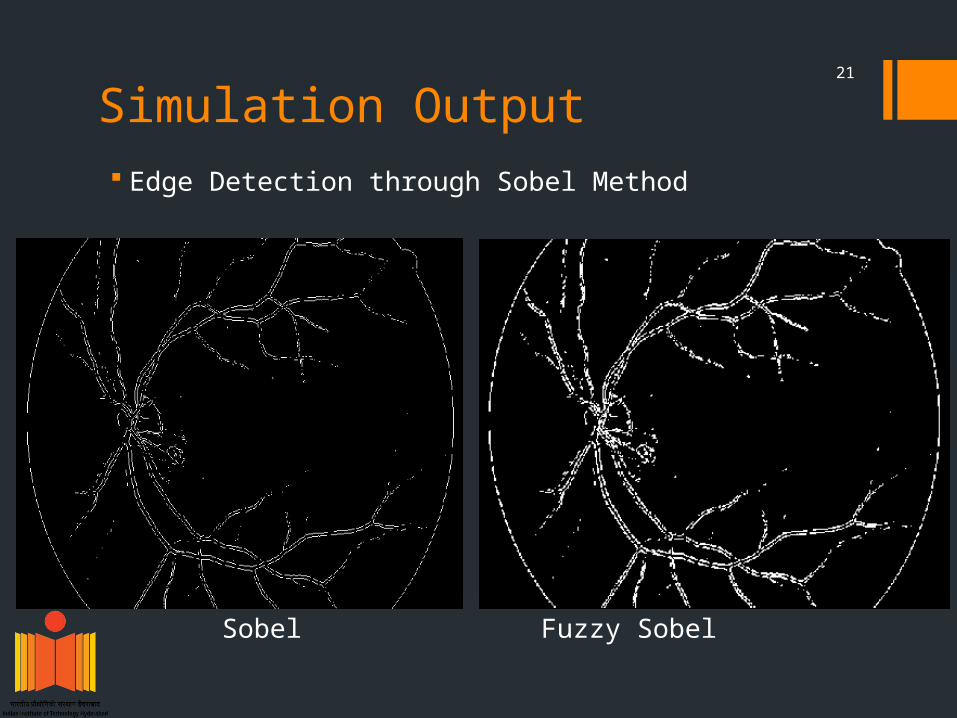
Simulation Output Edge Detection through Sobel Method
Sobel Fuzzy Sobel
22
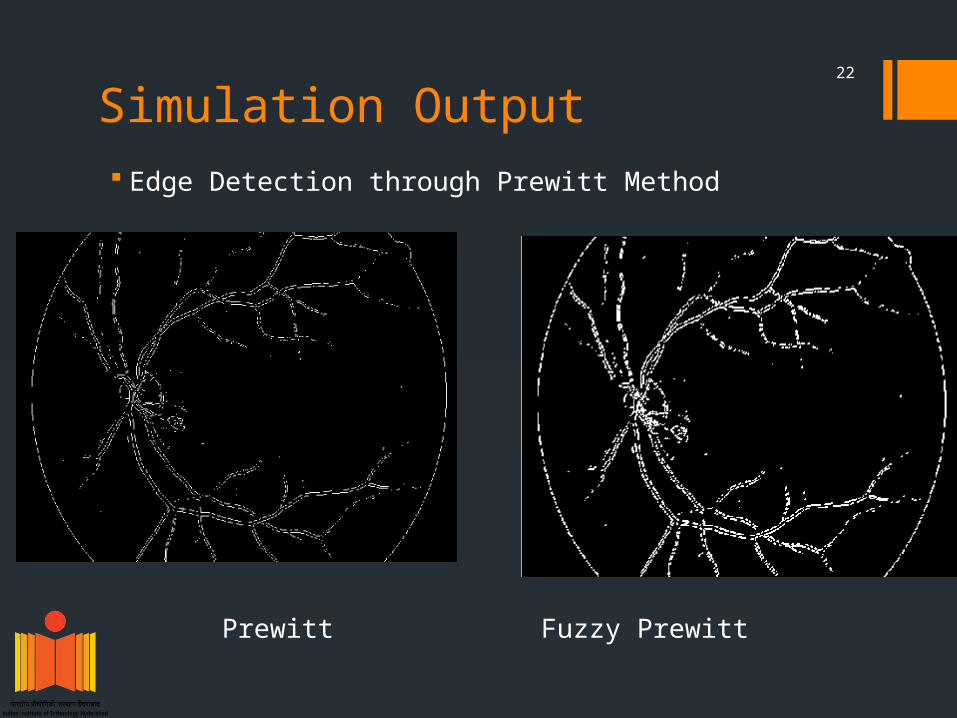
Simulation Output Edge Detection through Prewitt Method
Prewitt Fuzzy Prewitt
23
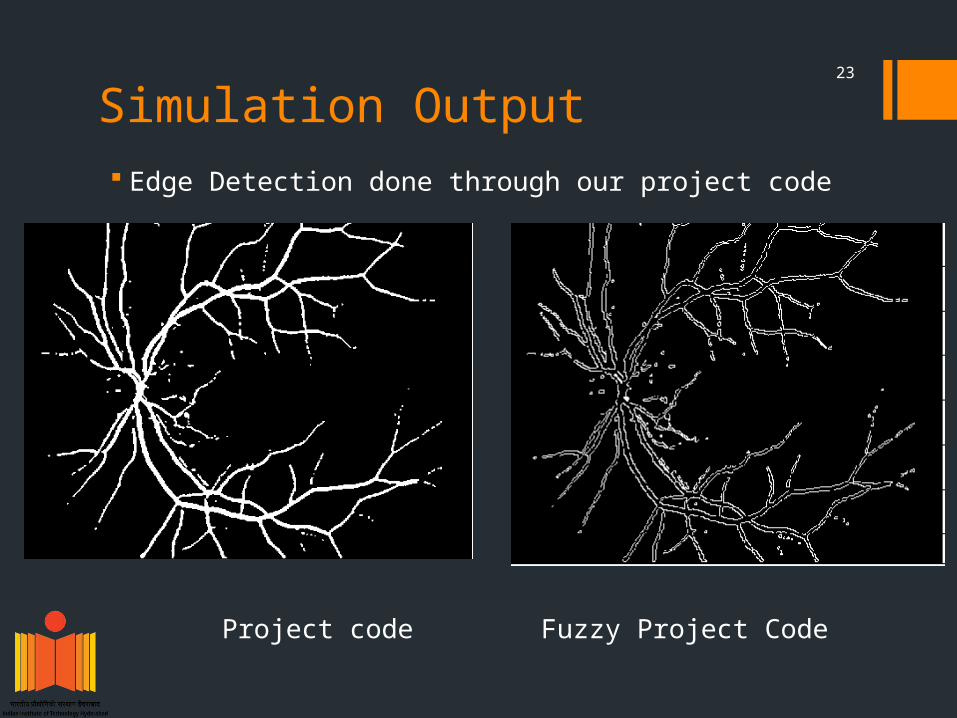
Simulation Output Edge Detection done through our project code
Project code Fuzzy Project Code

24