Embed Size (px)
Citation preview
Sampling and Sampling Distributions
Aims of Sampling Probability Distributions Sampling Distributions The Central Limit Theorem Types of Samples
Aims of sampling
Reduces cost of research (e.g. political polls)
Generalize about a larger population (e.g., benefits of sampling city r/t neighborhood)
In some cases (e.g. industrial production) analysis may be destructive, so sampling is needed
Probability
Probability: what is the chance that a given event will occur?
Probability is expressed in numbers between 0 and 1. Probability = 0 means the event never happens; probability = 1 means it always happens.
The total probability of all possible event always sums to 1.
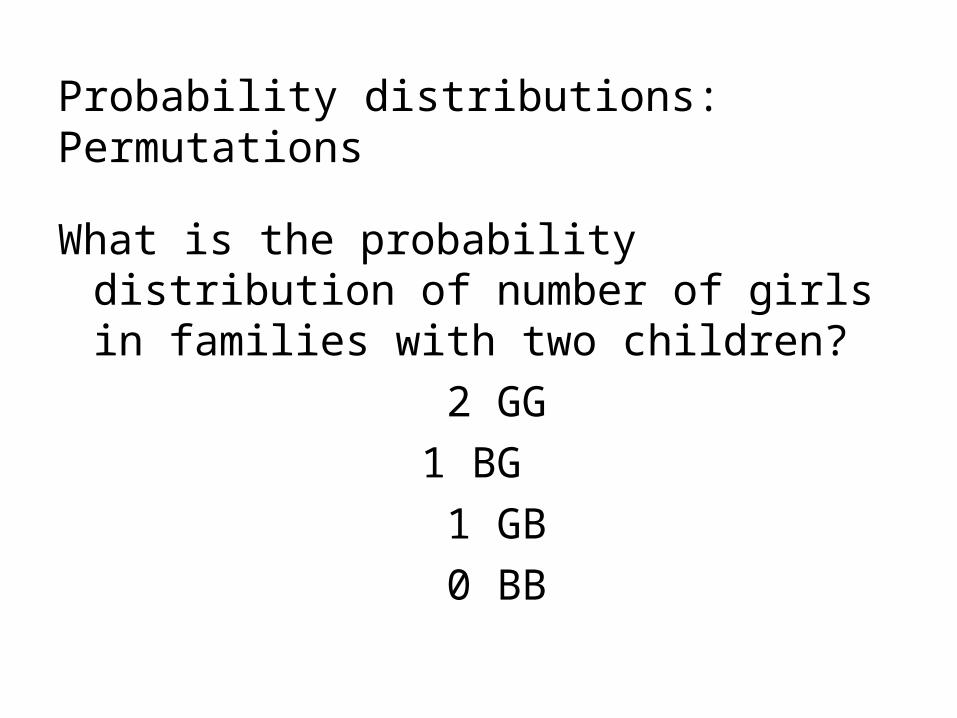
Probability distributions: Permutations
What is the probability distribution of number of girls in families with two children?
2 GG1 BG 1 GB0 BB
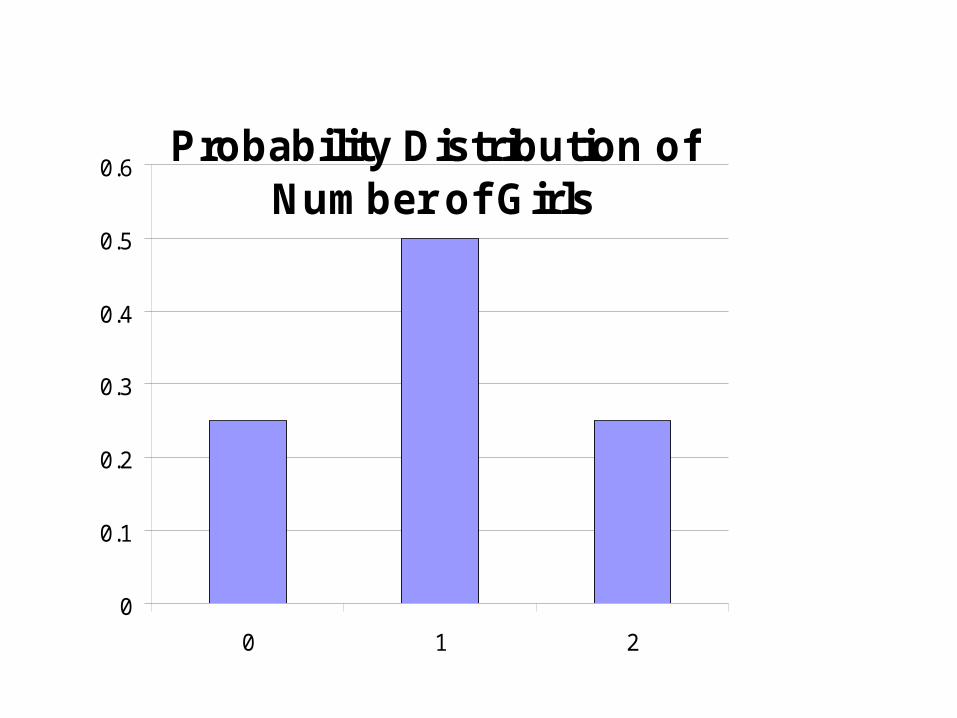
Probability Distribution of Number of Girls
0
0.1
0.2
0.3
0.4
0.5
0.6
0 1 2

How about family of three?Num. Girls child #1 child #2 child #3
0 B B B1 B B G1 B G B1 G B B2 B G G2 G B G2 G G B3 G G G
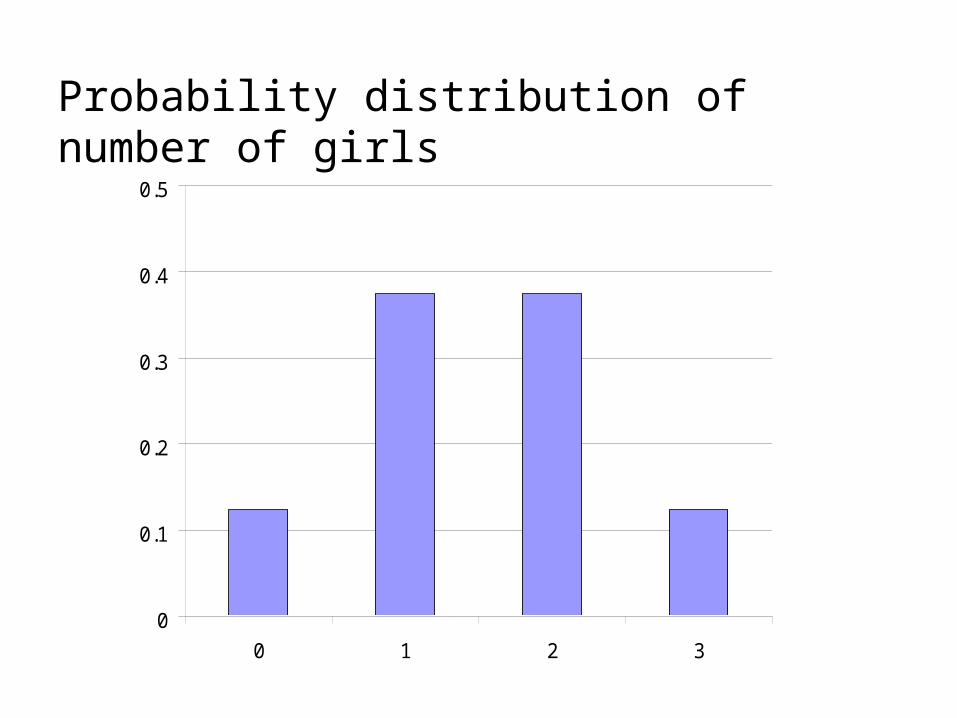
Probability distribution of number of girls
0
0.1
0.2
0.3
0.4
0.5
0 1 2 3
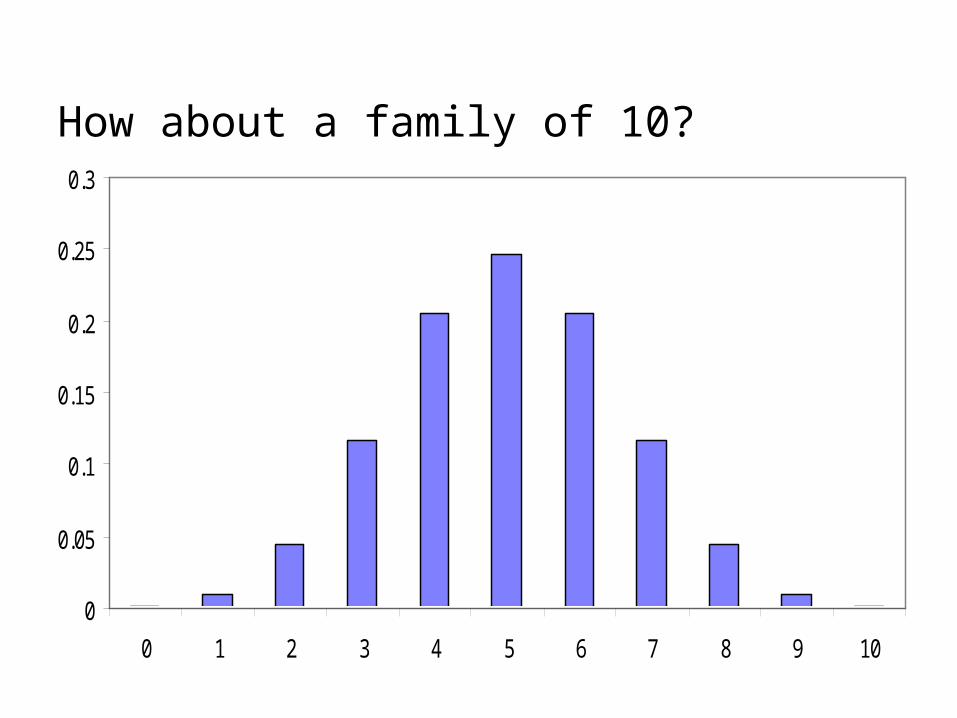
How about a family of 10?
0
0.05
0.1
0.15
0.2
0.25
0.3
0 1 2 3 4 5 6 7 8 9 10
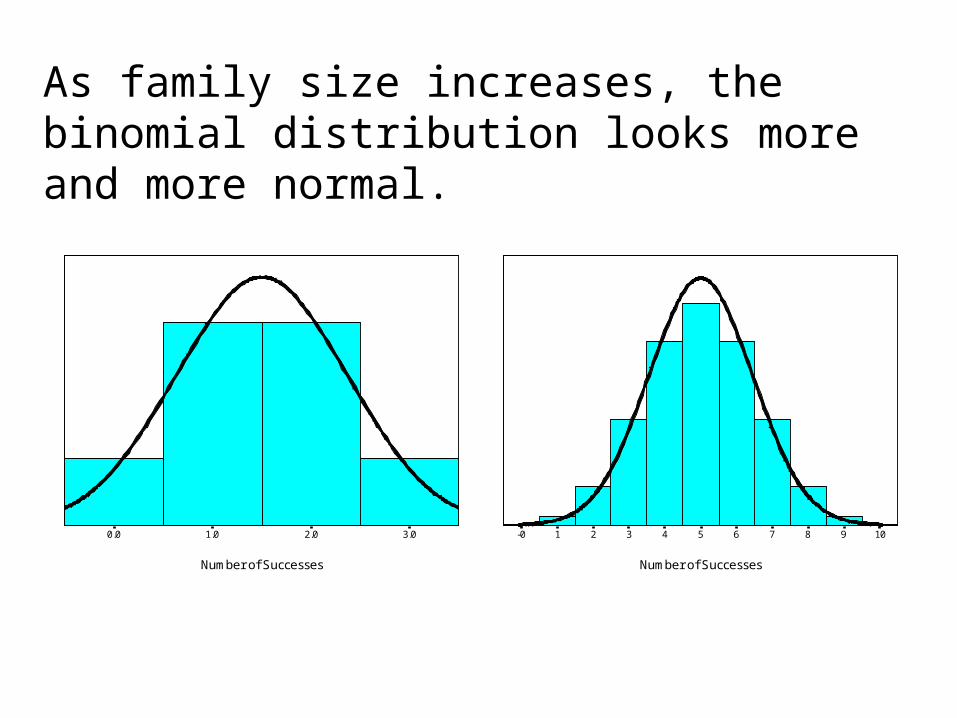
As family size increases, the binomial distribution looks more and more normal.
Number of Successes
3.02.01.00.0
Number of Successes
10987654321-0
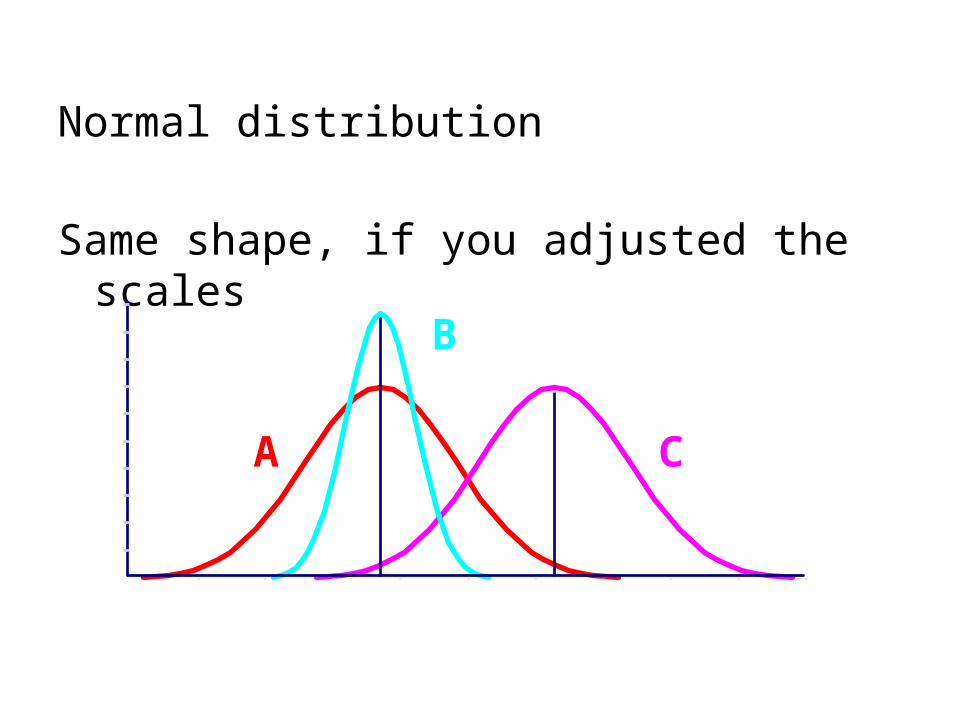
Normal distribution
Same shape, if you adjusted the scales
CA
B
Coin toss
Toss a coin 30 times Tabulate results
Coin toss
Suppose this were 12 randomly selected families, and heads were girls
If you did it enough times distribution would approximate “Normal” distribution
Think of the coin tosses as samples of all possible coin tosses
Sampling distribution
Sampling distribution of the mean – A theoretical probability distribution of sample means that would be obtained by drawing from the population all possible samples of the same size.
Central Limit Theorem
No matter what we are measuring, the distribution of any measure across all possible samples we could take approximates a normal distribution, as long as the number of cases in each sample is about 30 or larger.
Central Limit Theorem
If we repeatedly drew samples from a population and calculated the mean of a variable or a percentage or, those sample means or percentages would be normally distributed.
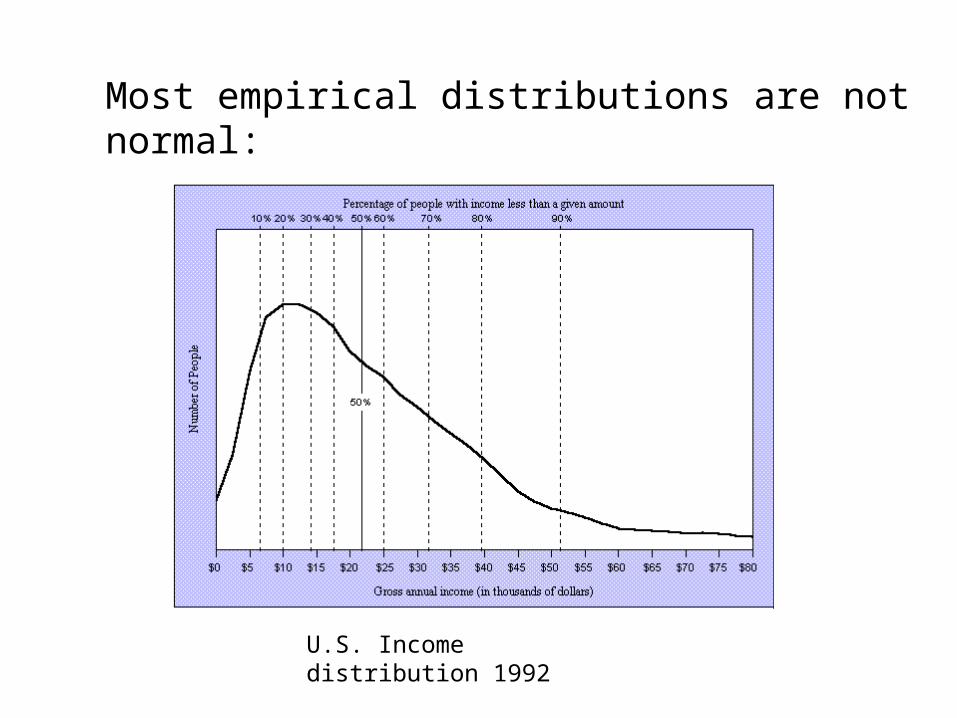
Most empirical distributions are not normal:
U.S. Income distribution 1992
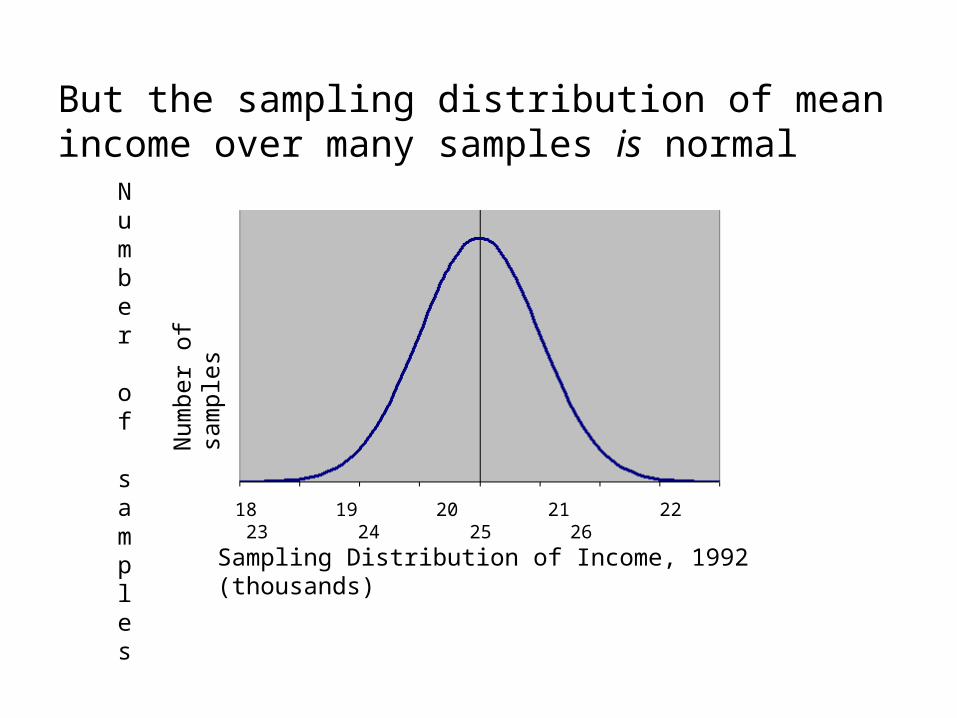
But the sampling distribution of mean income over many samples is normal
Sampling Distribution of Income, 1992 (thousands)
18 19 20 21 22 23 24 25 26
Number of samples
Num
ber o
f sa
mpl
es
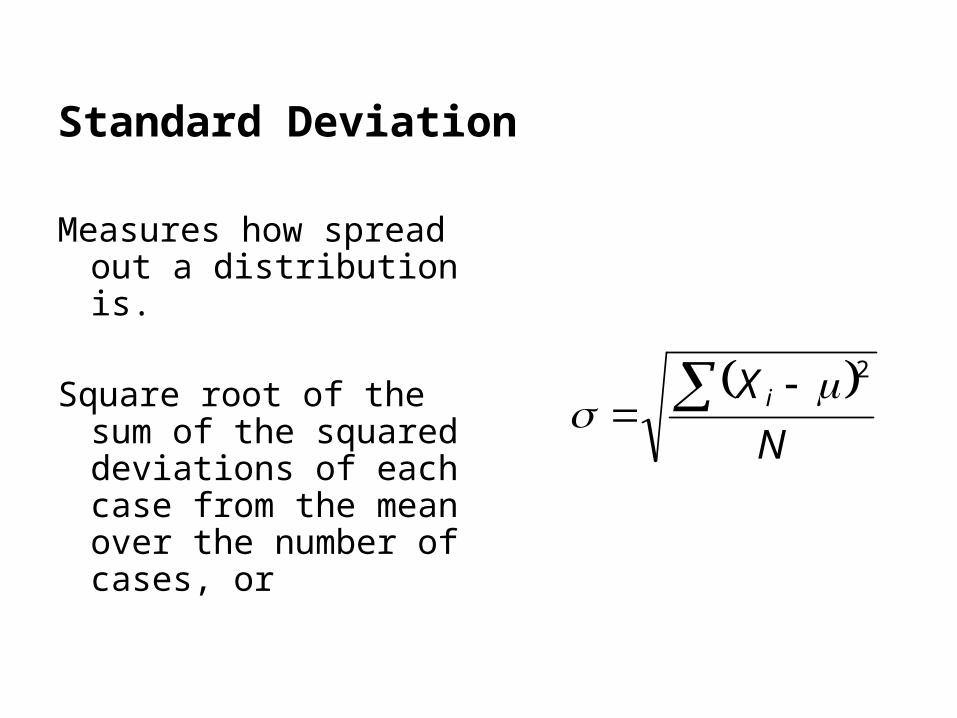
Standard Deviation
Measures how spread out a distribution is.
Square root of the sum of the squared deviations of each case from the mean over the number of cases, or
NX i
2
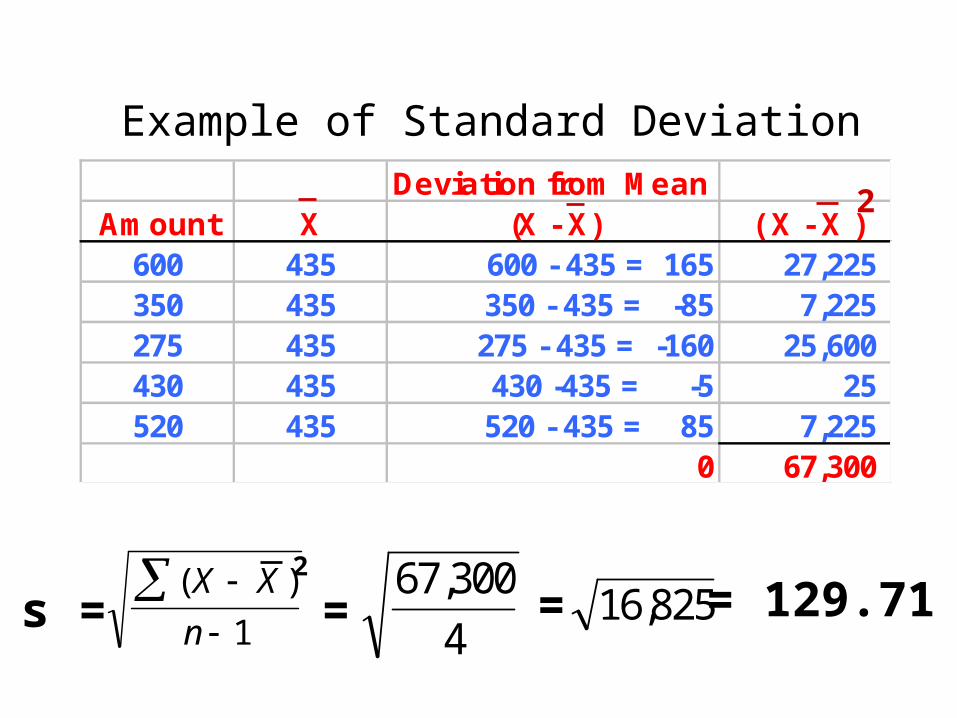
Deviation from MeanAmount X (X - X) ( X - X )
600 435 600 - 435 = 165 27,225 350 435 350 - 435 = -85 7,225 275 435 275 - 435 = -160 25,600 430 435 430 -435 = -5 25 520 435 520 - 435 = 85 7,225
0 67,300
( )X Xn
1s = = = = 129.7167 300
4, 16 825,
2
2
Example of Standard Deviation
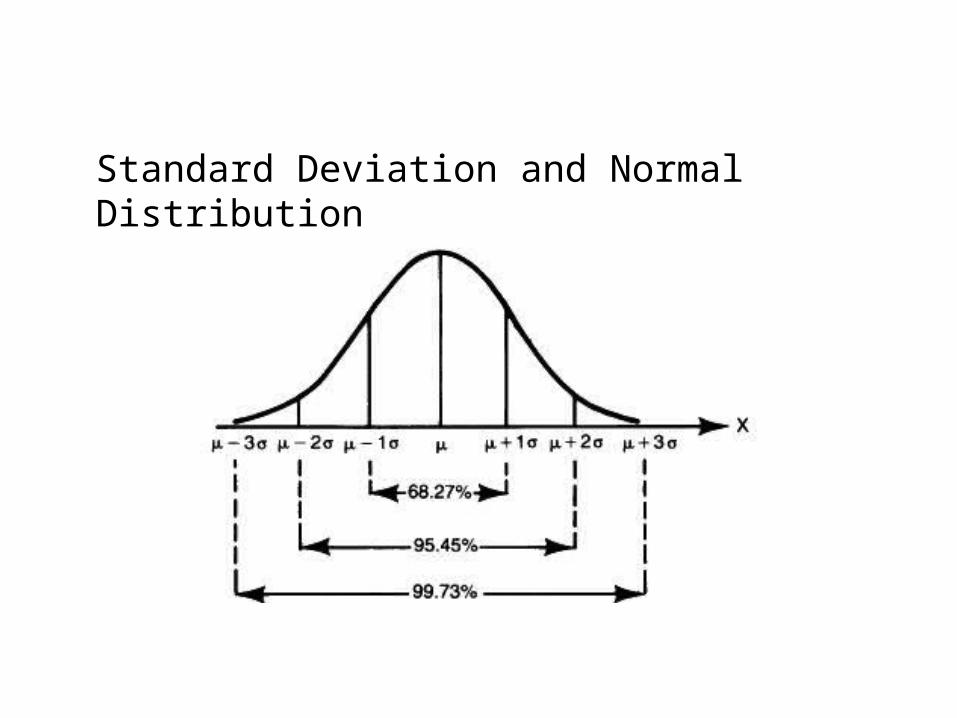
Standard Deviation and Normal Distribution
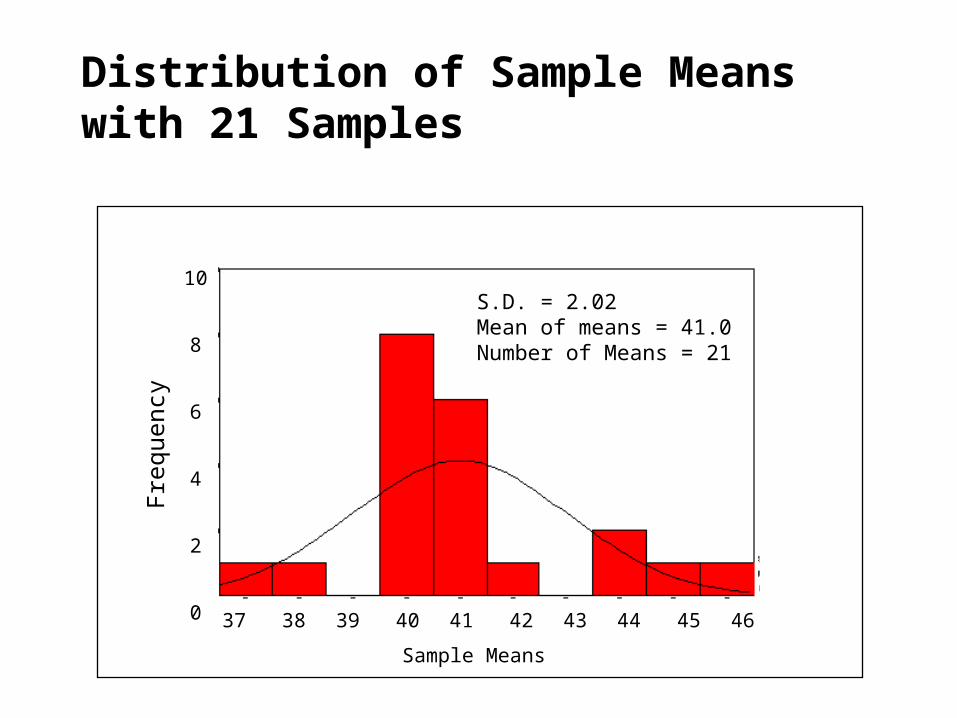
10
8
6
4
2
0 37 38 39 40 41 42 43 44 45 46
Sample Means
S.D. = 2.02Mean of means = 41.0Number of Means = 21
Distribution of Sample Means with 21 Samples
Freq
uenc
y
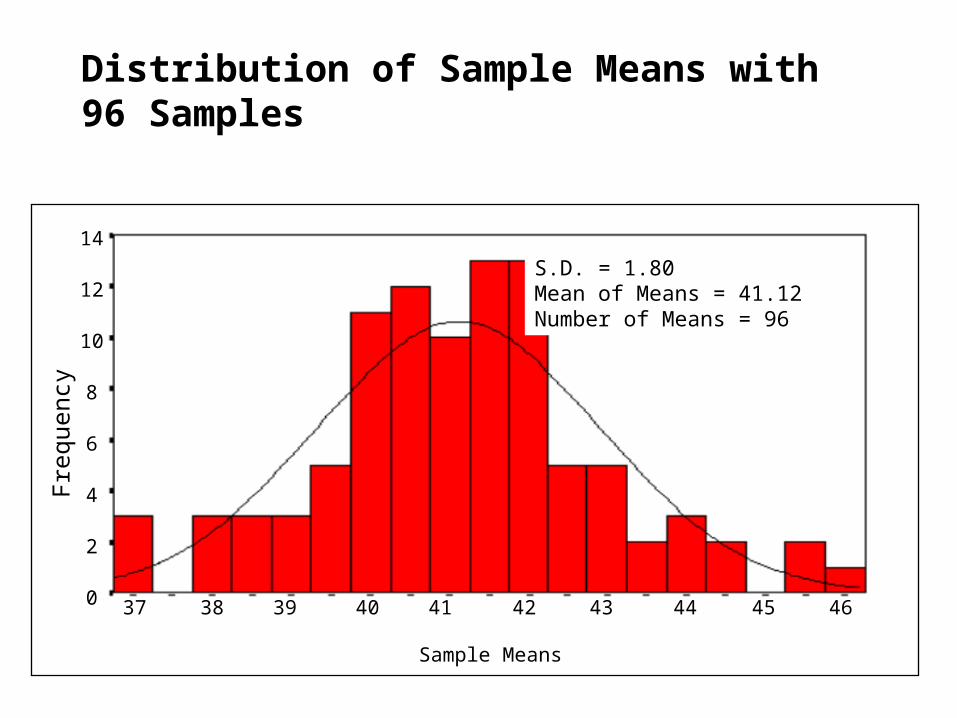
Freq
uenc
y
14
12
10
8
6
4
2
0 37 38 39 40 41 42 43 44 45 46
Sample Means
Distribution of Sample Means with 96 Samples
S.D. = 1.80Mean of Means = 41.12Number of Means = 96
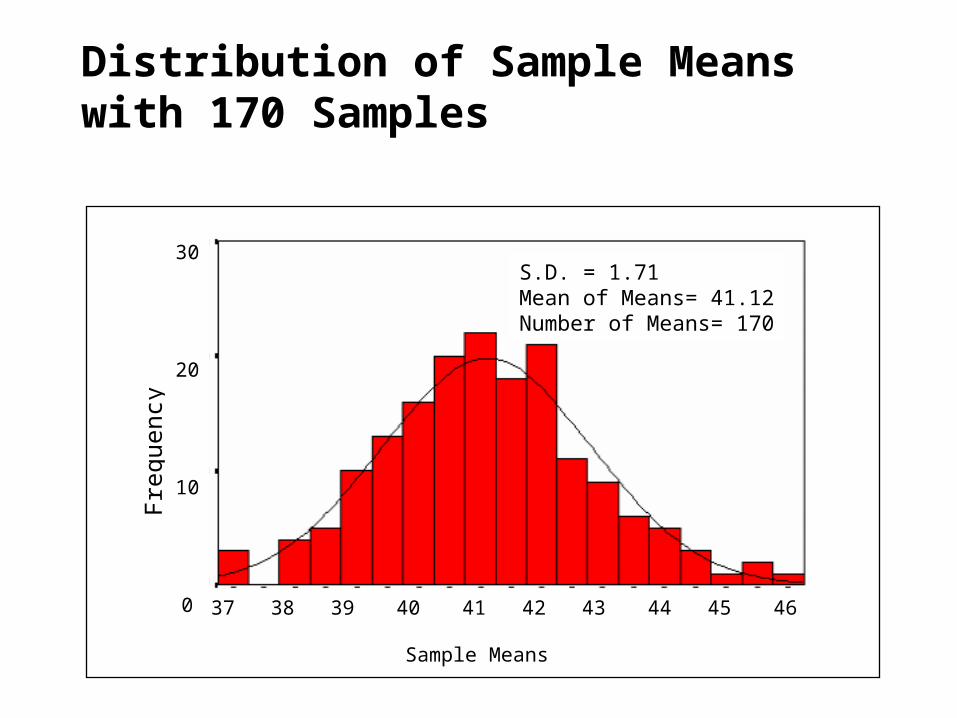
Distribution of Sample Means with 170 Samples
Freq
uenc
y
30
20
10
0 37 38 39 40 41 42 43 44 45 46
Sample Means
S.D. = 1.71Mean of Means= 41.12Number of Means= 170
The standard deviation of the sampling distribution is called the standard error
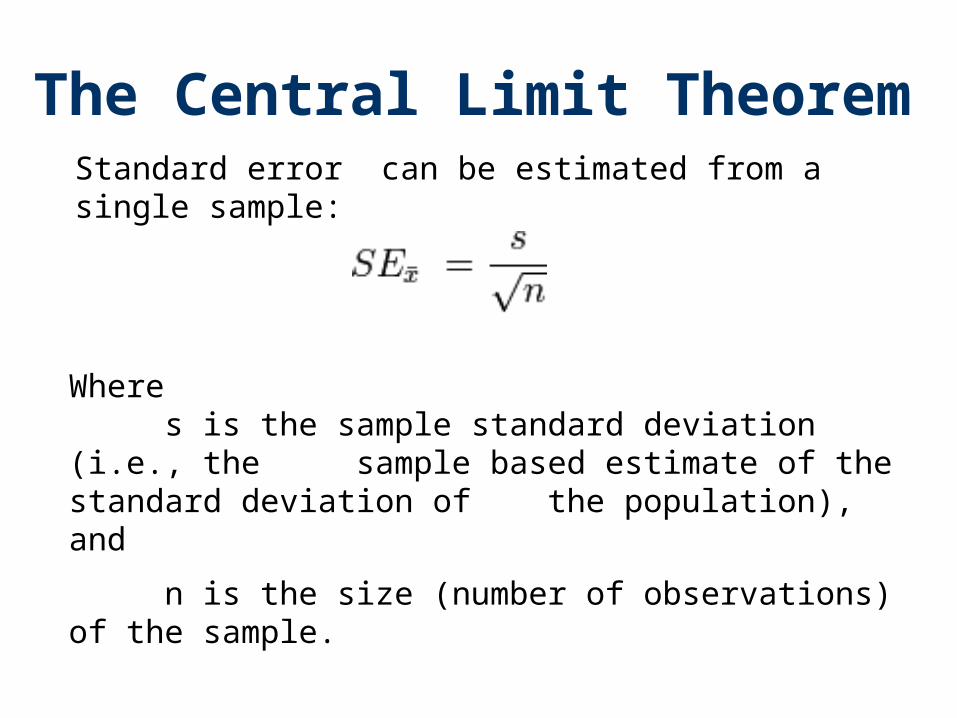
Standard error can be estimated from a single sample:
The Central Limit Theorem
Where s is the sample standard deviation (i.e., the
sample based estimate of the standard deviation of the population), and
n is the size (number of observations) of the sample.
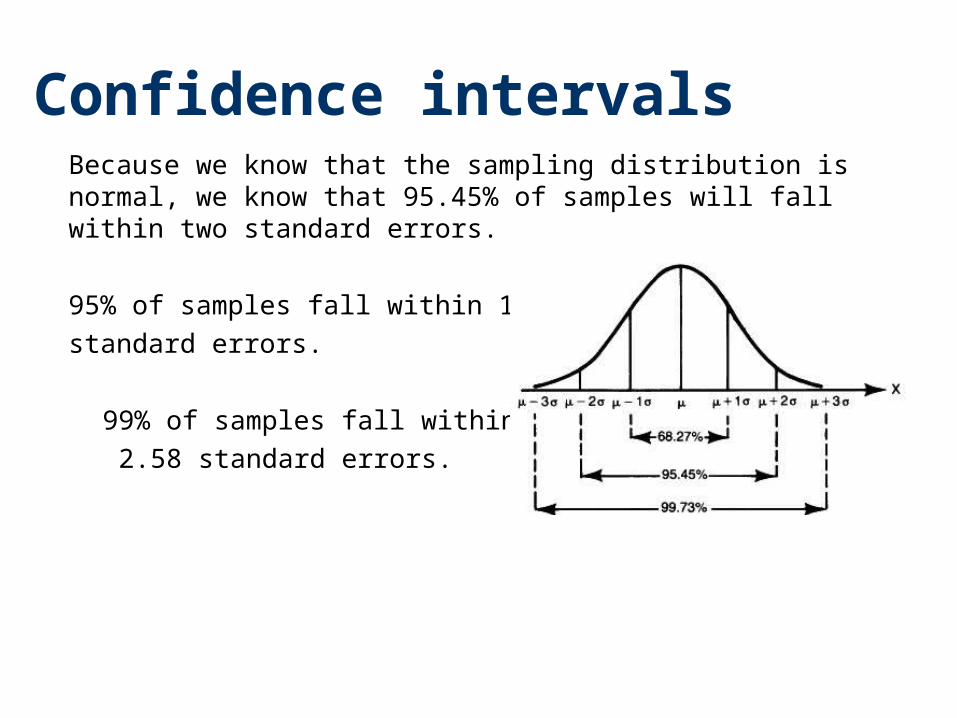
Because we know that the sampling distribution is normal, we know that 95.45% of samples will fall within two standard errors.
95% of samples fall within 1.96standard errors.
99% of samples fall within 2.58 standard errors.
Confidence intervals
Sampling Population – A group that includes all the
cases (individuals, objects, or groups) in which the researcher is interested.
Sample – A relatively small subset from a population.
Random Sampling Simple Random Sample – A sample
designed in such a way as to ensure that (1) every member of the population has an equal chance of being chosen and (2) every combination of N members has an equal chance of being chosen.
This can be done using a computer, calculator, or a table of random numbers
Population inferences can be made...
...by selecting a representative sample from the population
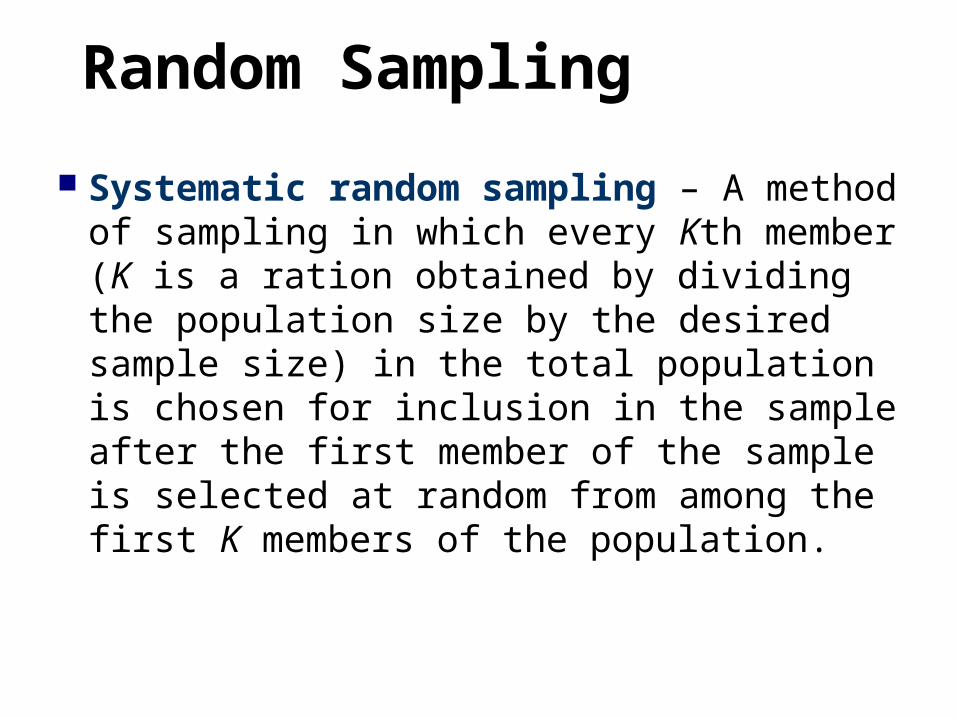
Random Sampling Systematic random sampling – A method
of sampling in which every Kth member (K is a ration obtained by dividing the population size by the desired sample size) in the total population is chosen for inclusion in the sample after the first member of the sample is selected at random from among the first K members of the population.
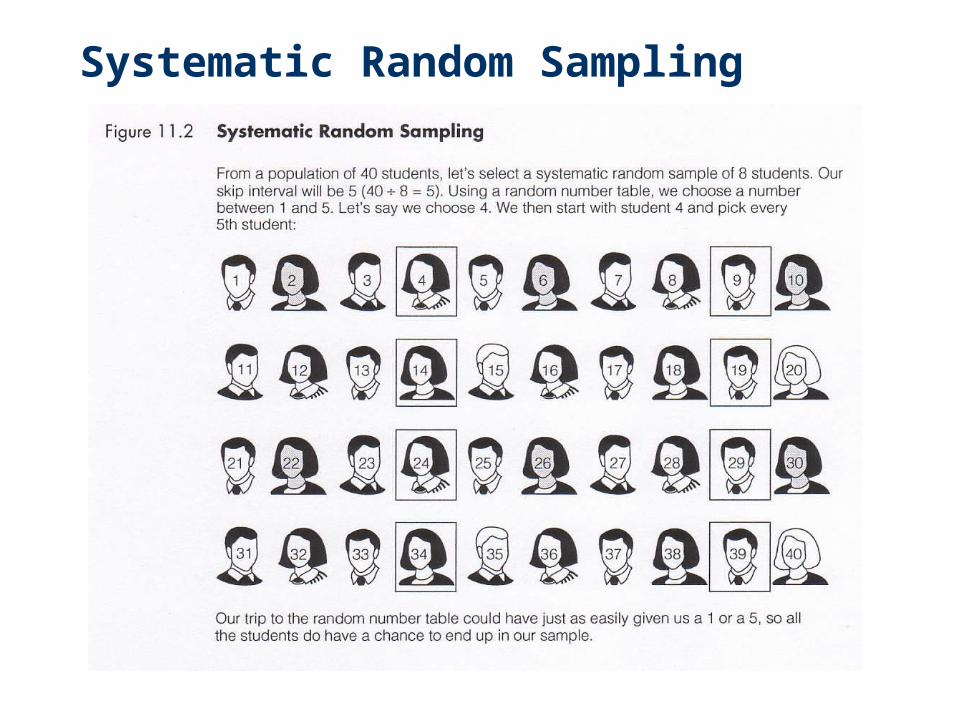
Systematic Random Sampling
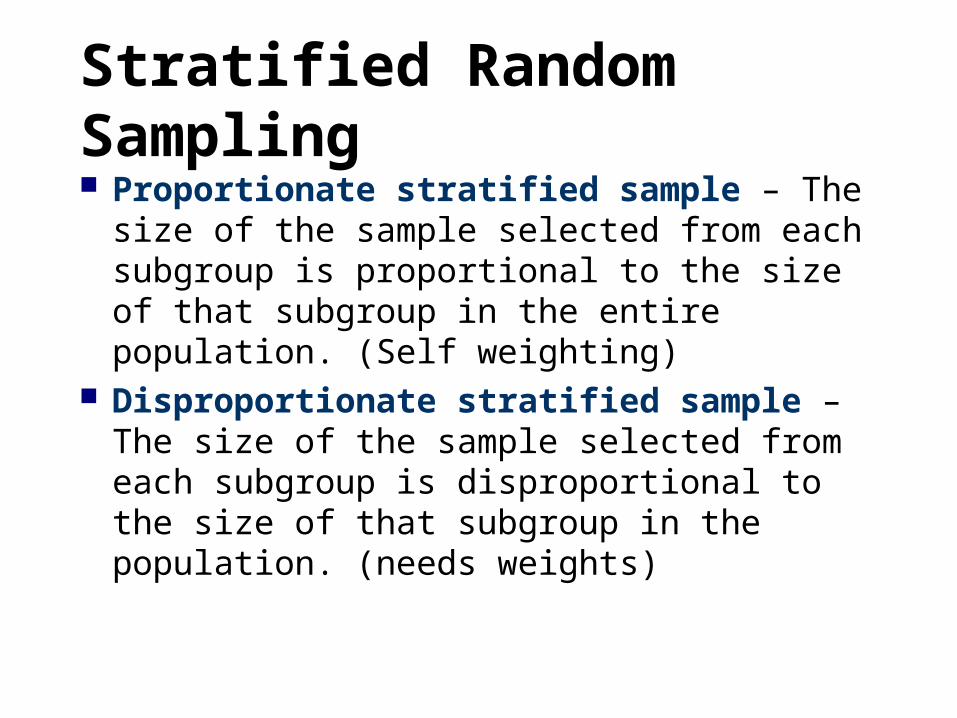
Stratified Random Sampling Proportionate stratified sample – The size
of the sample selected from each subgroup is proportional to the size of that subgroup in the entire population. (Self weighting)
Disproportionate stratified sample – The size of the sample selected from each subgroup is disproportional to the size of that subgroup in the population. (needs weights)
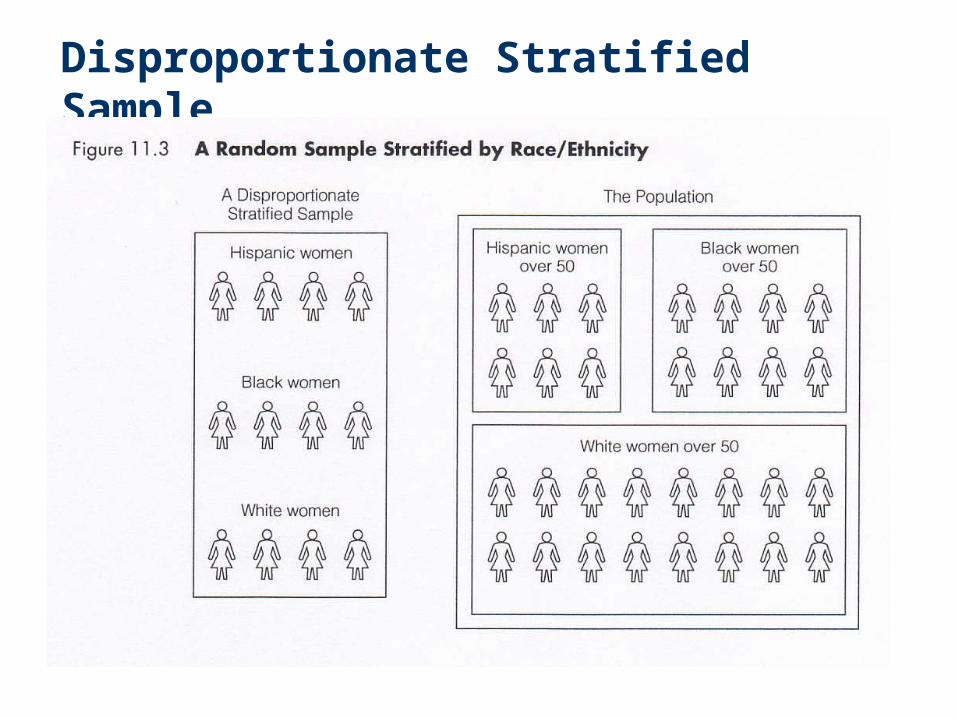
Disproportionate Stratified Sample
Stratified Random Sampling
Stratified random sample – A method of sampling obtained by (1) dividing the population into subgroups based on one or more variables central to our analysis and (2) then drawing a simple random sample from each of the subgroups


![International Business Environments and Operationsyunus.hacettepe.edu.tr/~canand/chp11-12_inteco_2014.pdf · Title: Microsoft PowerPoint - chp11-12 [Uyumluluk Modu] Author: win7 Created](https://img.dokumen.tips/doc/110x75/5a9d4eae7f8b9abd058bacb9/international-business-environments-and-canandchp11-12inteco2014pdftitle-microsoft.jpg)