Embed Size (px)
Citation preview
Department of Civil EngineeringINDIAN INSTITUTE OF SCIENCE
BANGALORE
STRUCTURAL MASONRY:PROPERTIES AND BEHAVIOUR
K S Nanjunda Rao
Research Team Publications
1.K S Jagadish
2.B V Venkatarama Reddy
3.G Sarangapani
4.S Raghunath
5.K S Gumaste
6.S M Manjunath
7.K S Nanjunda Rao
1.Materials & Structures (Rilem)
2.Masonry International3.Jl of Materials in Civil
Engg. (ASCE)4.Jl of Structural Engg.5.National & International
conferences
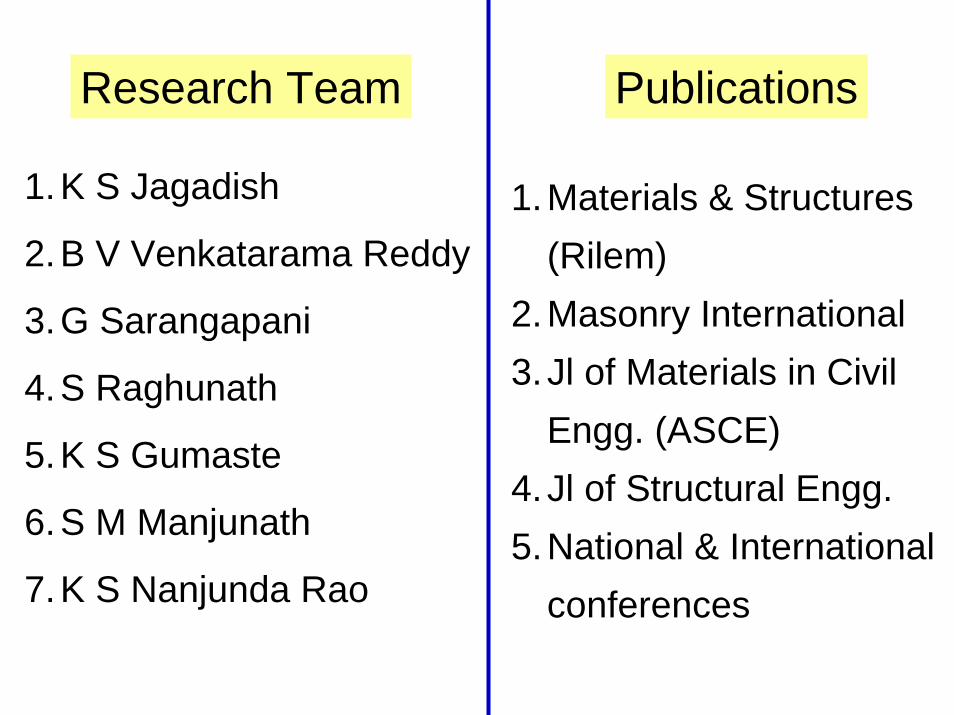
ConcreteGood in compression &
weak in tension,Brittle, Uni-modulus
Coarse and fine aggregates
and binder
Random, Isotropic
MasonryGood in compression
& weak in tension,Brittle, Bi-modulus
Masonry units and mortar
Orderly, Orthotropic
Behaviour
Composition
Distribution ofthe component
materials
Comparison of concrete and masonry
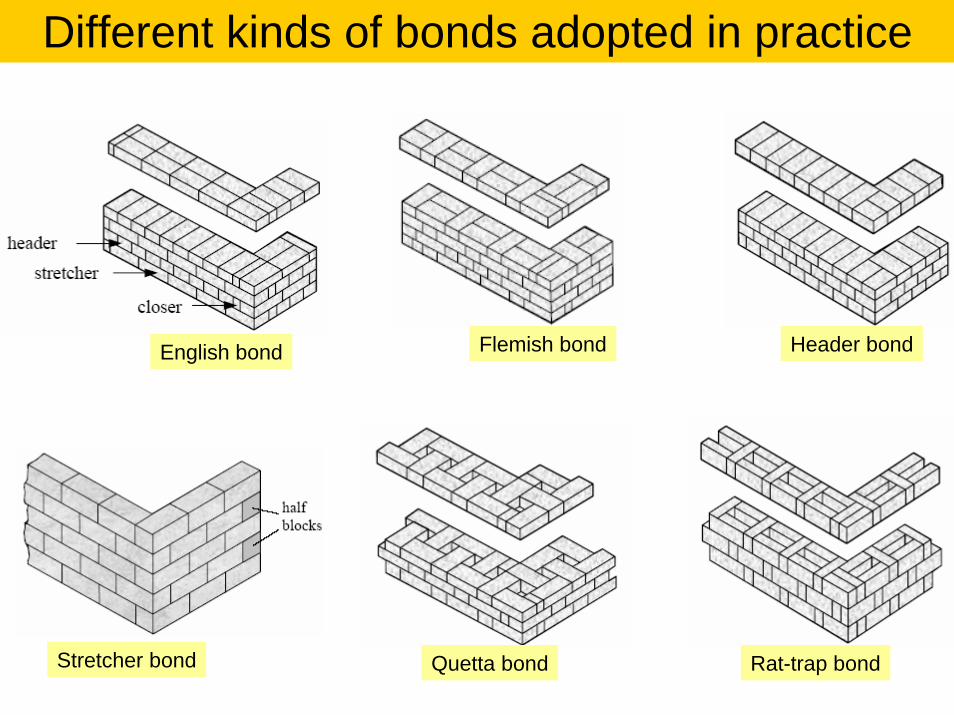
English bond Flemish bond Header bond
Stretcher bond Quetta bond Rat-trap bond
Different kinds of bonds adopted in practice
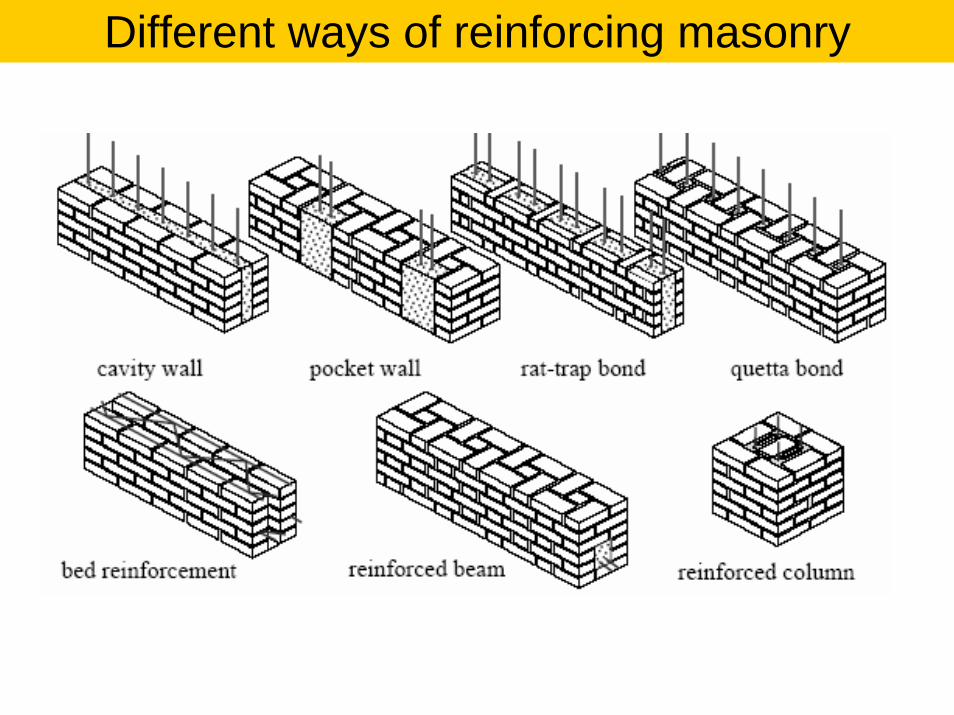
Different ways of reinforcing masonry
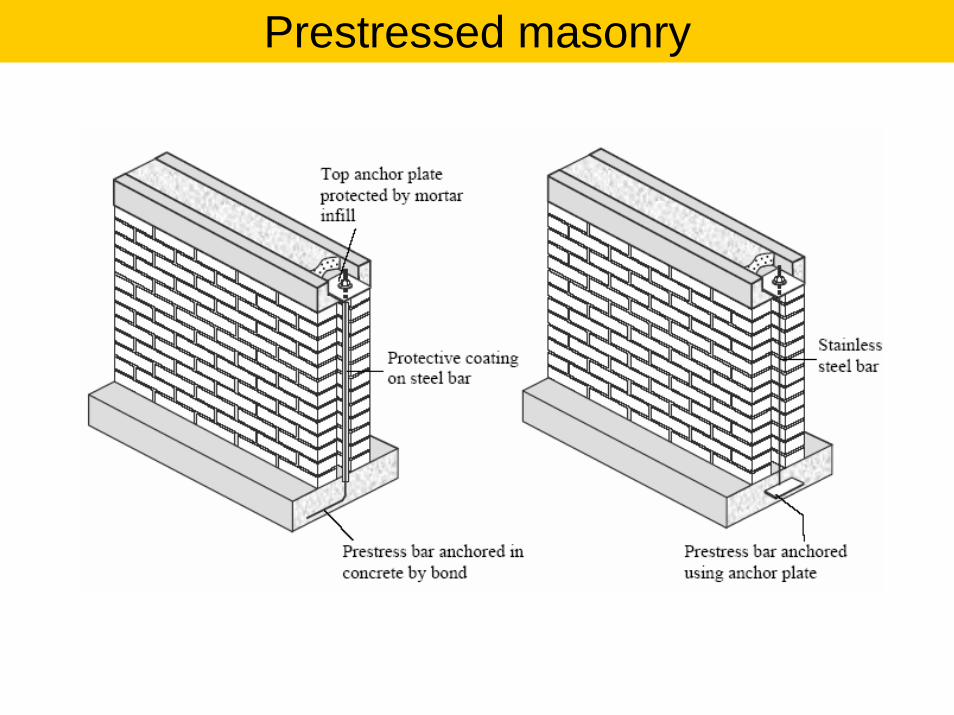
Prestressed masonry
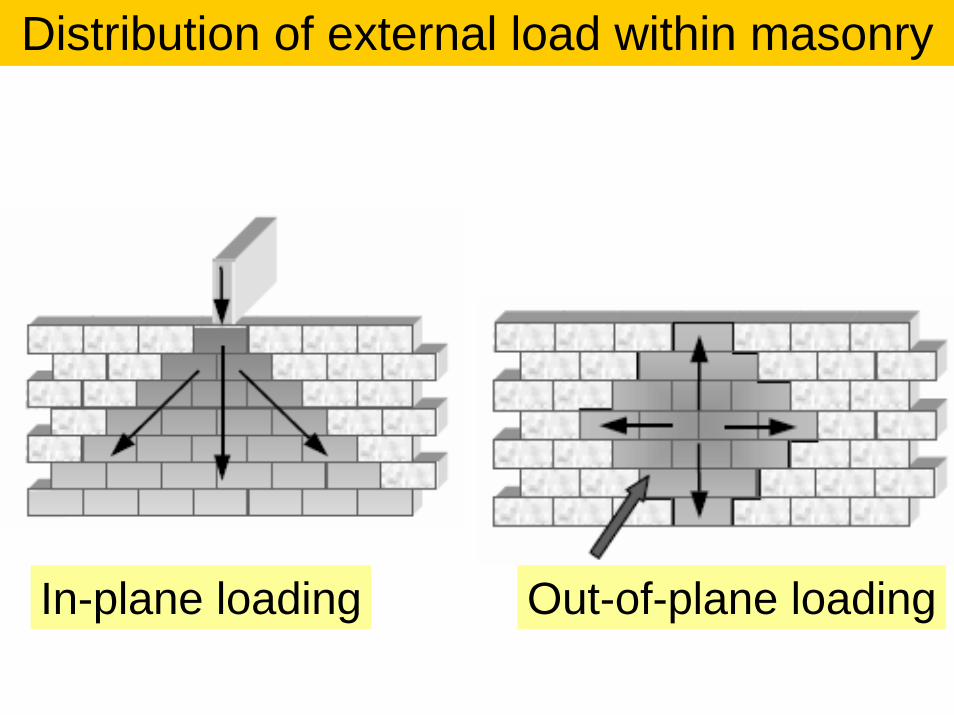
Distribution of external load within masonry
In-plane loading Out-of-plane loading
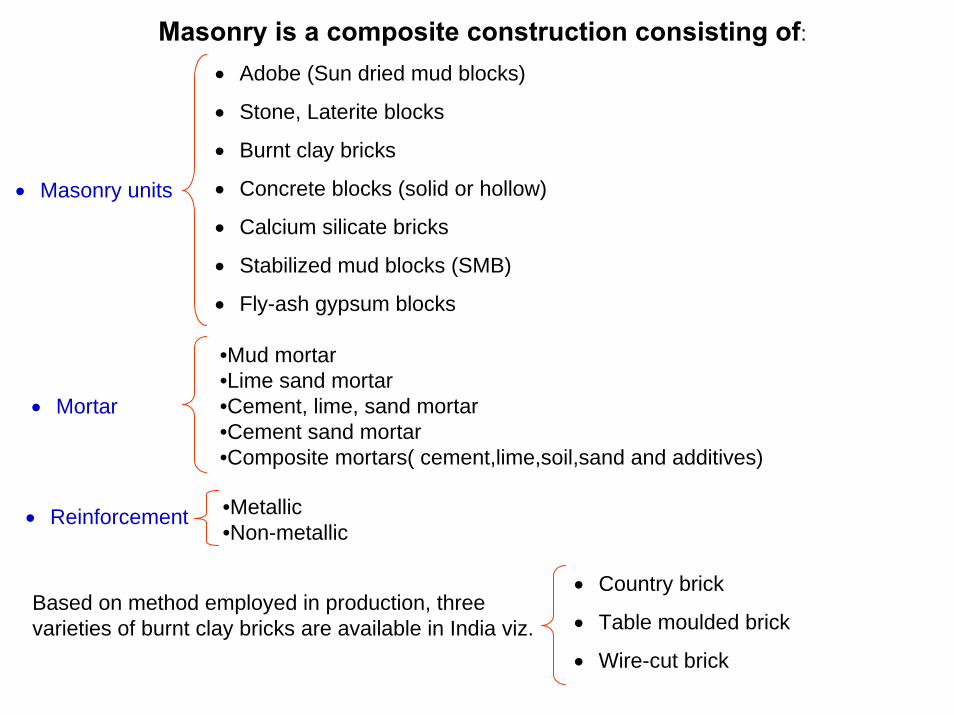
Masonry is a composite construction consisting of:
• Masonry units
• Adobe (Sun dried mud blocks)
• Stone, Laterite blocks
• Burnt clay bricks
• Concrete blocks (solid or hollow)
• Calcium silicate bricks
• Stabilized mud blocks (SMB)
• Fly-ash gypsum blocks
• Mortar
•Mud mortar•Lime sand mortar•Cement, lime, sand mortar•Cement sand mortar•Composite mortars( cement,lime,soil,sand and additives)
• Reinforcement •Metallic•Non-metallic
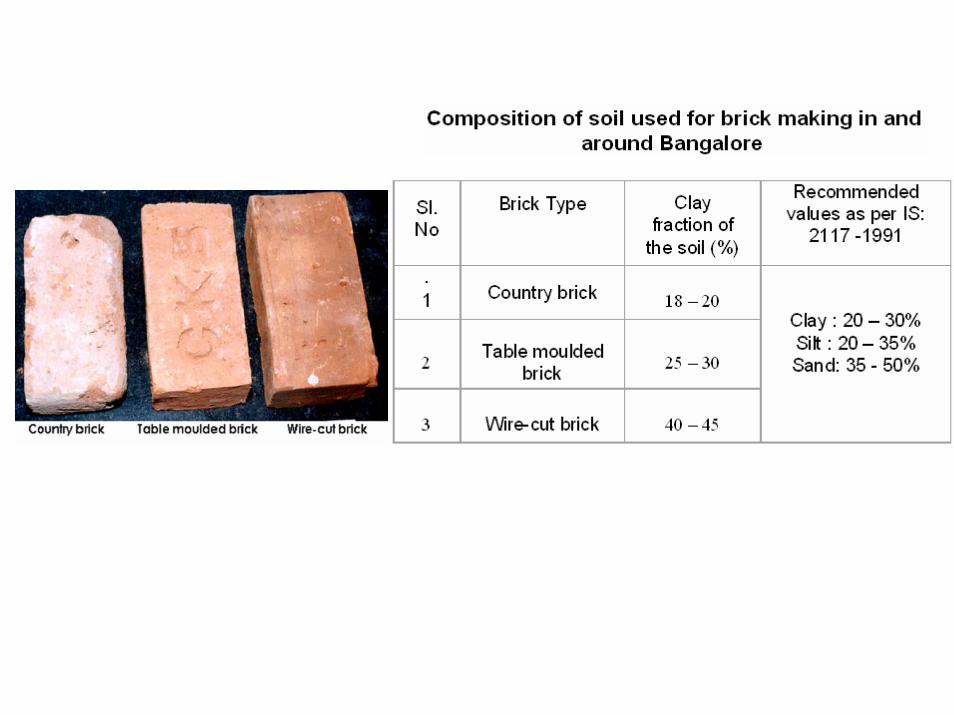
Based on method employed in production, three varieties of burnt clay bricks are available in India viz.
• Country brick
• Table moulded brick
• Wire-cut brick
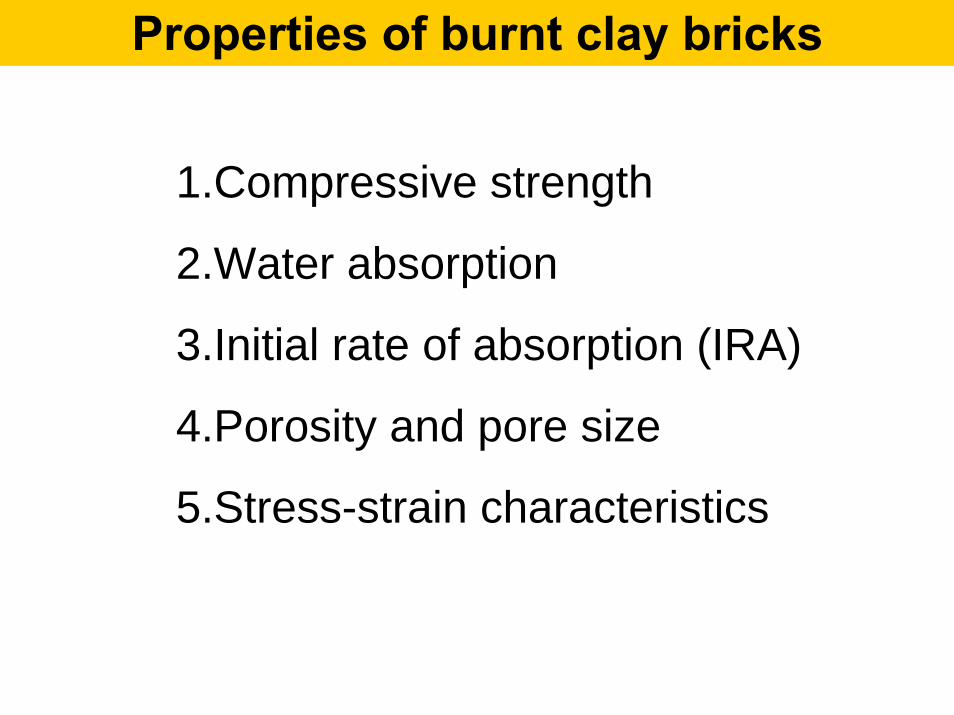
Properties of burnt clay bricks
1.Compressive strength
2.Water absorption
3.Initial rate of absorption (IRA)
4.Porosity and pore size
5.Stress-strain characteristics
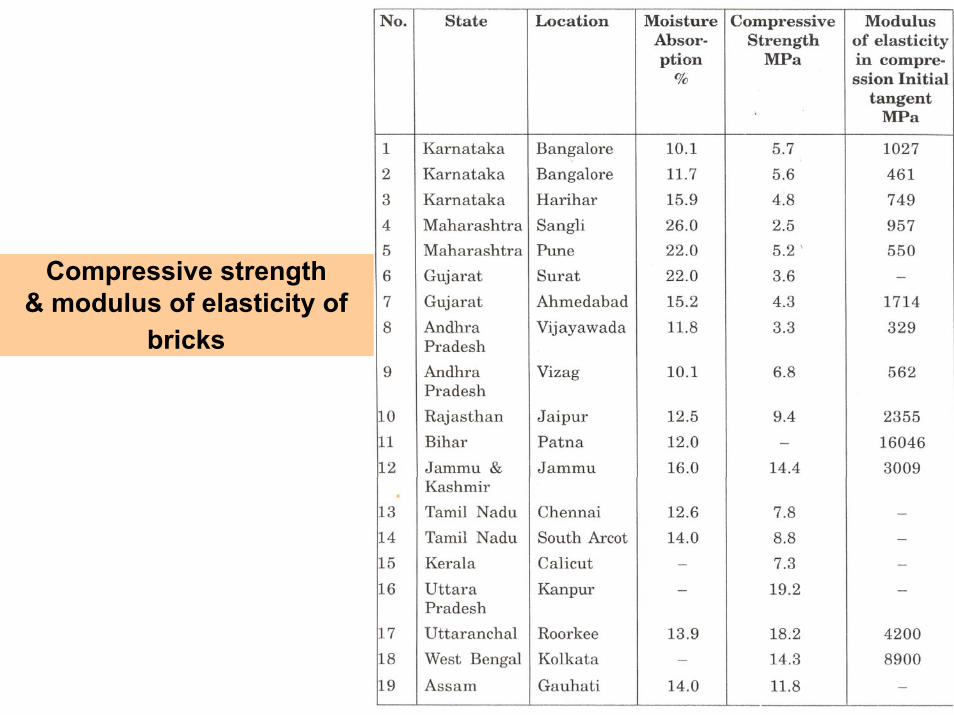
Compressive strength& modulus of elasticity of
bricks
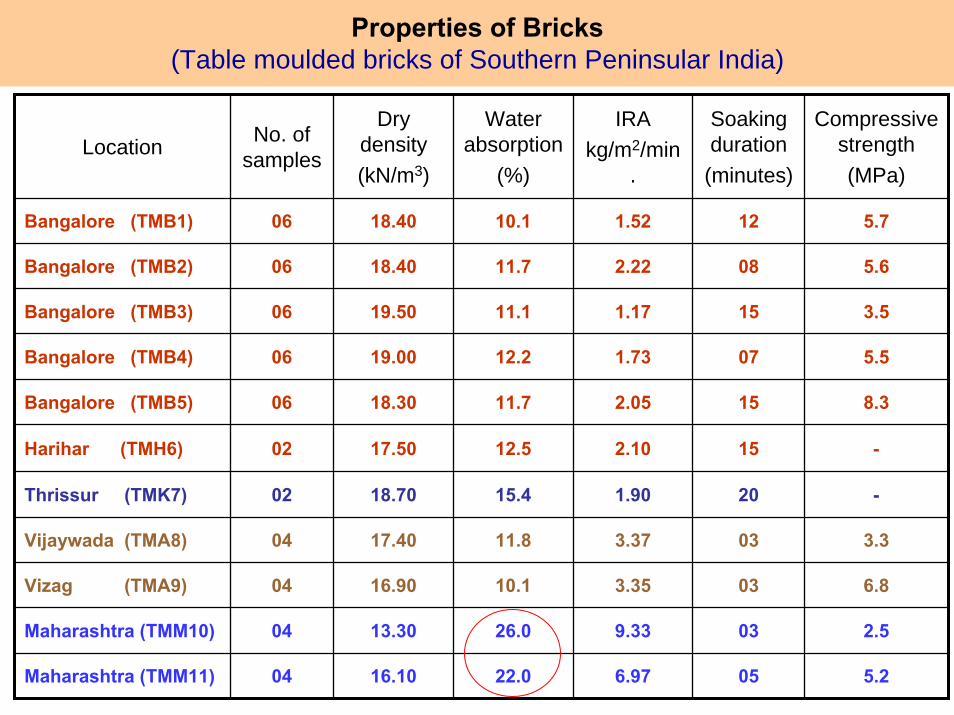
Properties of Bricks(Table moulded bricks of Southern Peninsular India)
Location No. of samples
Dry density(kN/m3)
Water absorption
(%)
IRAkg/m2/min
.
Soaking duration(minutes)
Compressive strength (MPa)
Bangalore (TMB1) 06 18.40 10.1 1.52 12 5.7
Bangalore (TMB2) 06 18.40 11.7 2.22 08 5.6
Bangalore (TMB3) 06 19.50 11.1 1.17 15 3.5
Bangalore (TMB4) 06 19.00 12.2 1.73 07 5.5
Bangalore (TMB5) 06 18.30 11.7 2.05 15 8.3
Harihar (TMH6) 02 17.50 12.5 2.10 15 -
Thrissur (TMK7) 02 18.70 15.4 1.90 20 -
Vijaywada (TMA8) 04 17.40 11.8 3.37 03 3.3
Vizag (TMA9) 04 16.90 10.1 3.35 03 6.8
Maharashtra (TMM10) 04 13.30 26.0 9.33 03 2.5
Maharashtra (TMM11) 04 16.10 22.0 6.97 05 5.2
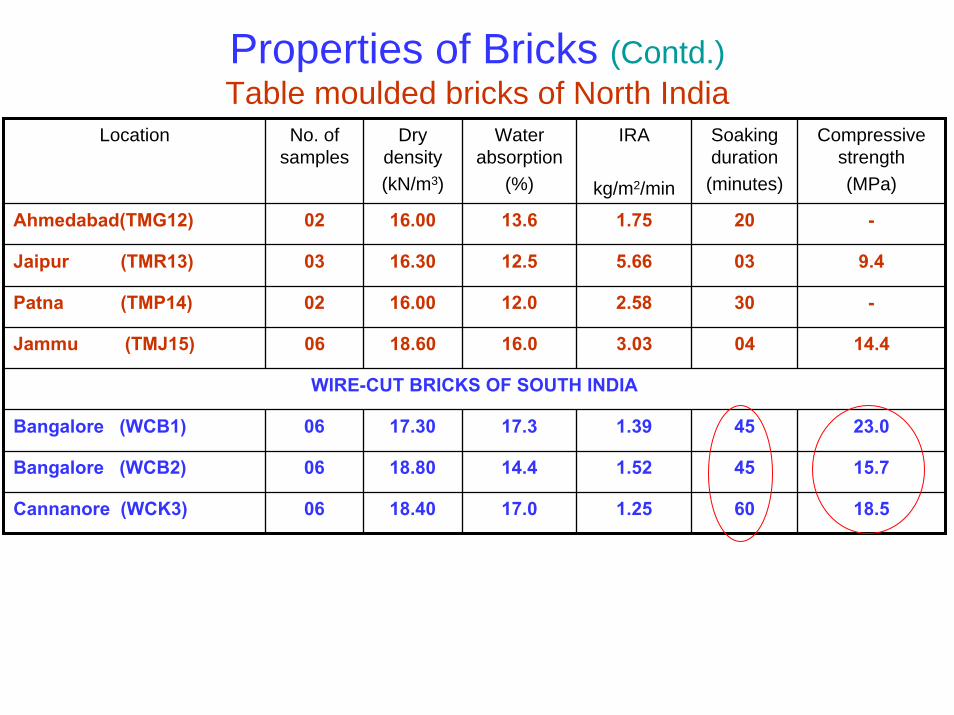
Properties of Bricks (Contd.)Table moulded bricks of North India
Location No. of samples
Dry density(kN/m3)
Water absorption
(%)
IRA
kg/m2/min
Soaking duration
(minutes)
Compressive strength (MPa)
Ahmedabad(TMG12) 02 16.00 13.6 1.75 20 -
Jaipur (TMR13) 03 16.30 12.5 5.66 03 9.4
Patna (TMP14) 02 16.00 12.0 2.58 30 -
Jammu (TMJ15) 06 18.60 16.0 3.03 04 14.4
WIRE-CUT BRICKS OF SOUTH INDIA
Bangalore (WCB1) 06 17.30 17.3 1.39 45 23.0
Bangalore (WCB2) 06 18.80 14.4 1.52 45 15.7
Cannanore (WCK3) 06 18.40 17.0 1.25 60 18.5
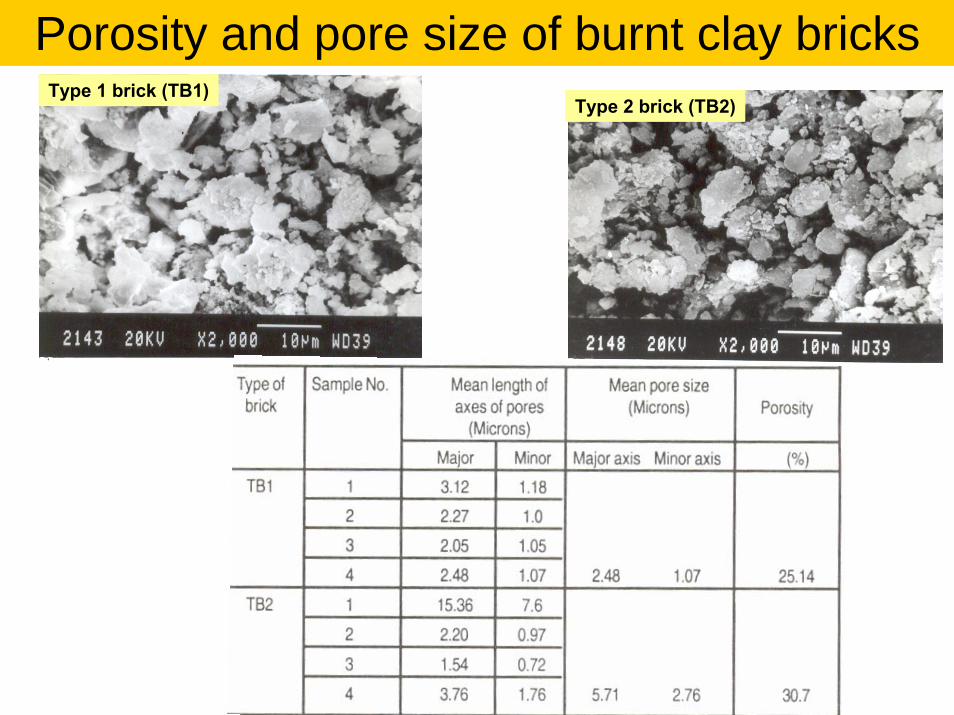
Type 1 brick (TB1)Type 2 brick (TB2)
Porosity and pore size of burnt clay bricks
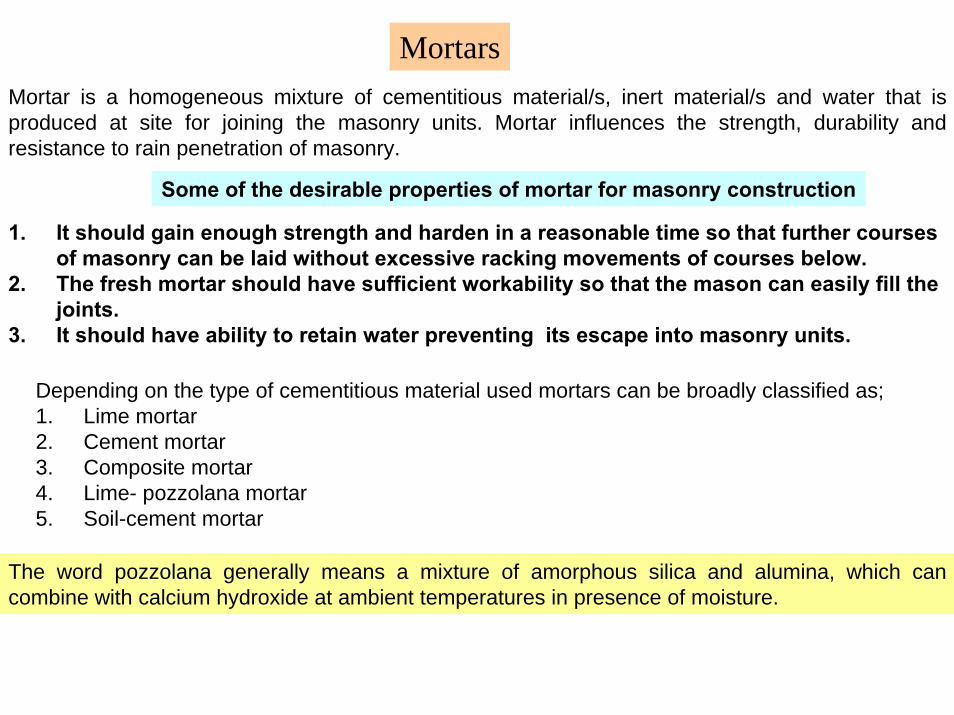
MortarsMortar is a homogeneous mixture of cementitious material/s, inert material/s and water that is produced at site for joining the masonry units. Mortar influences the strength, durability and resistance to rain penetration of masonry.
Some of the desirable properties of mortar for masonry construction
1. It should gain enough strength and harden in a reasonable time so that further courses of masonry can be laid without excessive racking movements of courses below.
2. The fresh mortar should have sufficient workability so that the mason can easily fill the joints.
3. It should have ability to retain water preventing its escape into masonry units.
Depending on the type of cementitious material used mortars can be broadly classified as;1. Lime mortar2. Cement mortar3. Composite mortar4. Lime- pozzolana mortar5. Soil-cement mortar
The word pozzolana generally means a mixture of amorphous silica and alumina, which can combine with calcium hydroxide at ambient temperatures in presence of moisture.
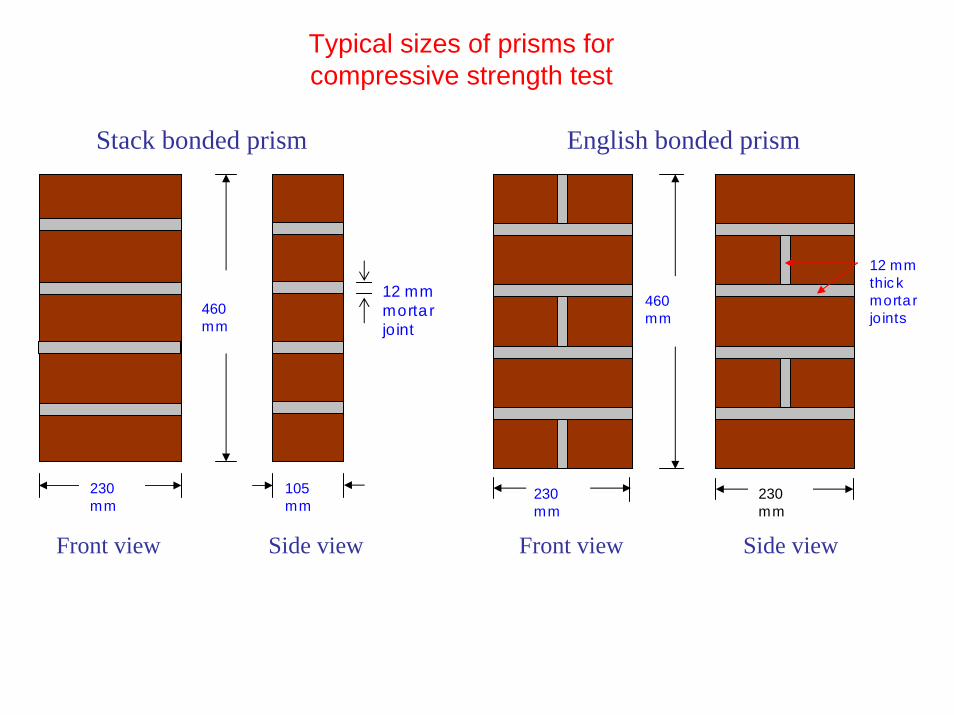
Typical sizes of prisms for compressive strength test
Stack bonded prism English bonded prism
Front view Side view Front view Side view
230 mm
460 mm
105 mm
12 mmmortar joint
230 mm
460 mm
230 mm
12 mm thick mortar joints
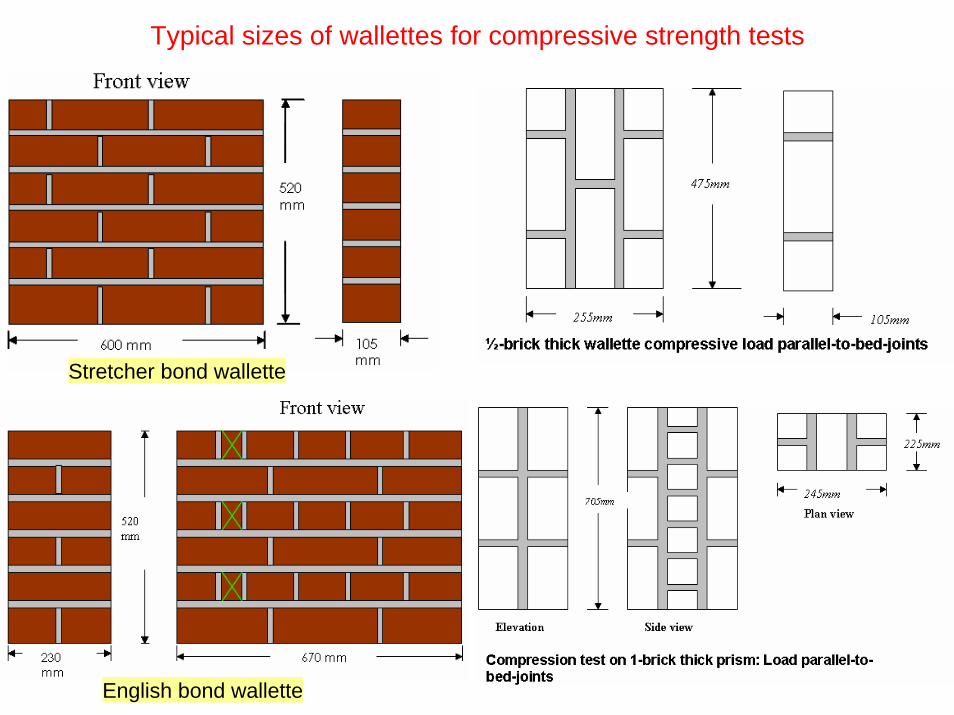
Typical sizes of wallettes for compressive strength tests
Stretcher bond wallette
English bond wallette
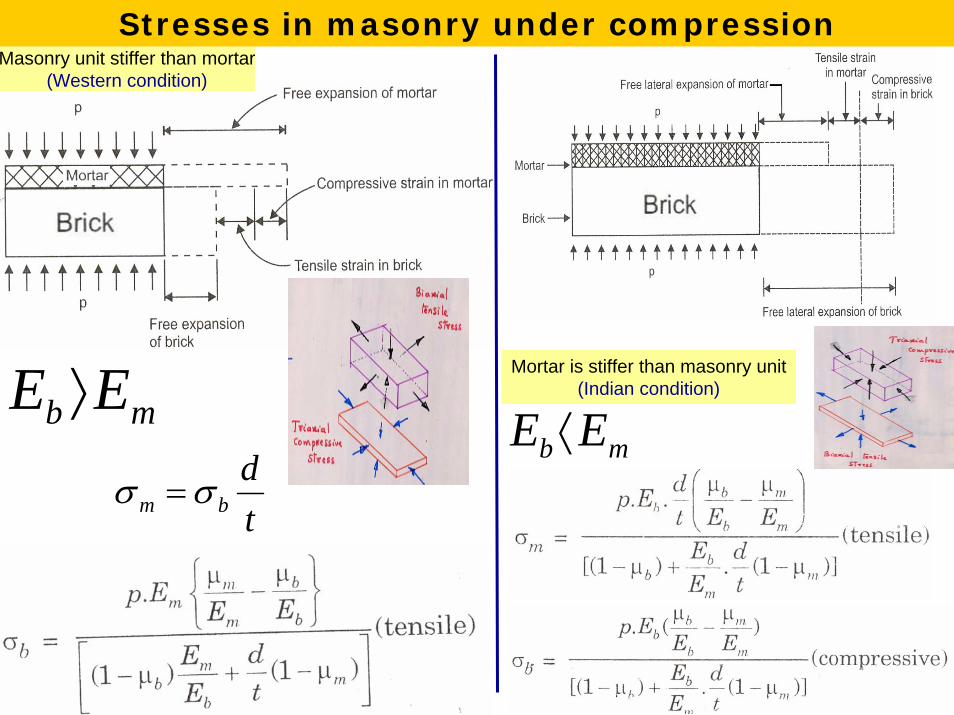
Mortar is stiffer than masonry unit(Indian condition)
mb EE ⟨mb EE ⟩
Masonry unit stiffer than mortar(Western condition)
Stresses in masonry under compression
td
bm σσ =
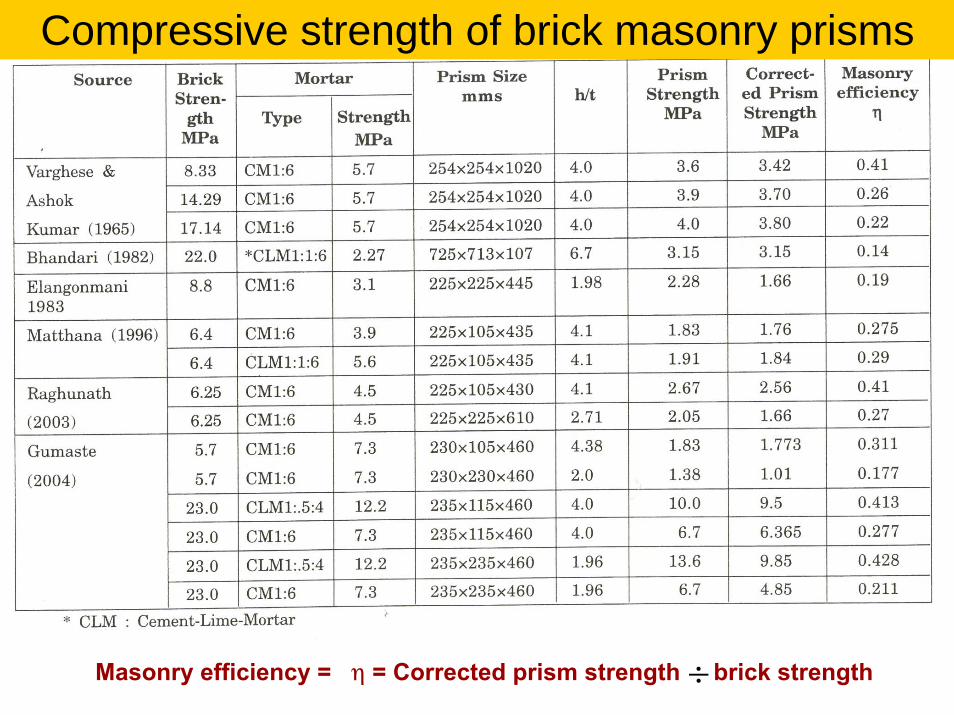
Masonry efficiency = η = Corrected prism strength brick strength
Compressive strength of brick masonry prisms
÷
Prism types (no. of prisms tested = 4)
Einitial tangent (MPa)
Esecant at 25 % σult (MPa)
σult(MPa)
Strain at σult
Masonry efficiency
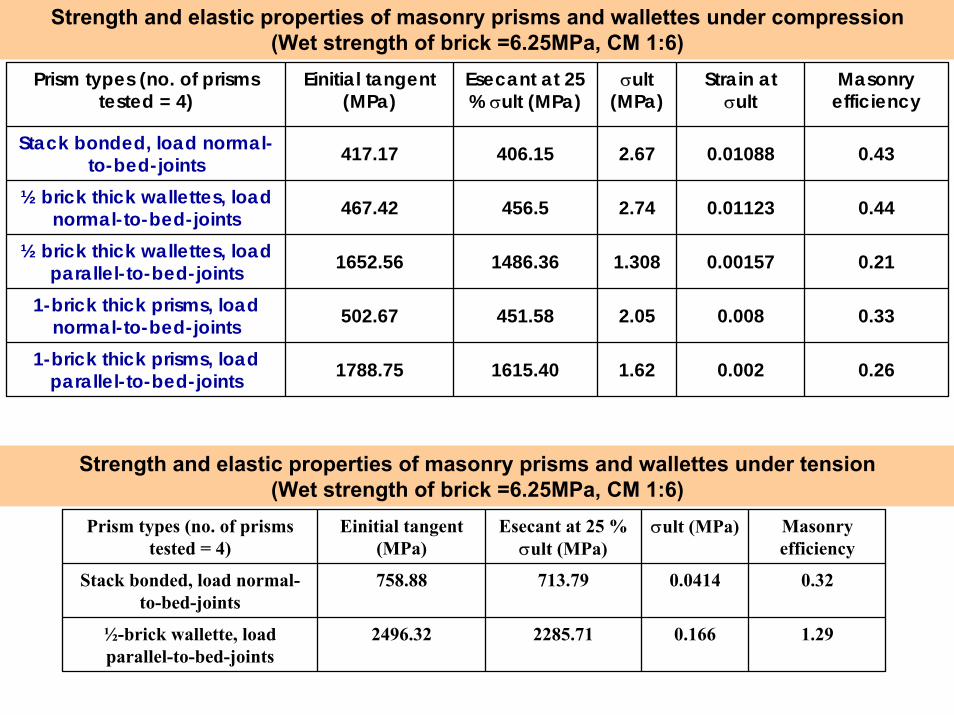
Stack bonded, load normal-to-bed-joints 417.17 406.15 2.67 0.01088 0.43
½ brick thick wallettes, load normal-to-bed-joints 467.42 456.5 2.74 0.01123 0.44
½ brick thick wallettes, load parallel-to-bed-joints 1652.56 1486.36 1.308 0.00157 0.21
1-brick thick prisms, load normal-to-bed-joints 502.67 451.58 2.05 0.008 0.33
1-brick thick prisms, load parallel-to-bed-joints 1788.75 1615.40 1.62 0.002 0.26
Strength and elastic properties of masonry prisms and wallettes under compression(Wet strength of brick =6.25MPa, CM 1:6)
Strength and elastic properties of masonry prisms and wallettes under tension(Wet strength of brick =6.25MPa, CM 1:6)
Prism types (no. of prisms tested = 4)
Einitial tangent (MPa)
Esecant at 25 % σult (MPa)
σult (MPa) Masonry efficiency
Stack bonded, load normal-to-bed-joints
758.88 713.79 0.0414 0.32
½-brick wallette, load parallel-to-bed-joints
2496.32 2285.71 0.166 1.29
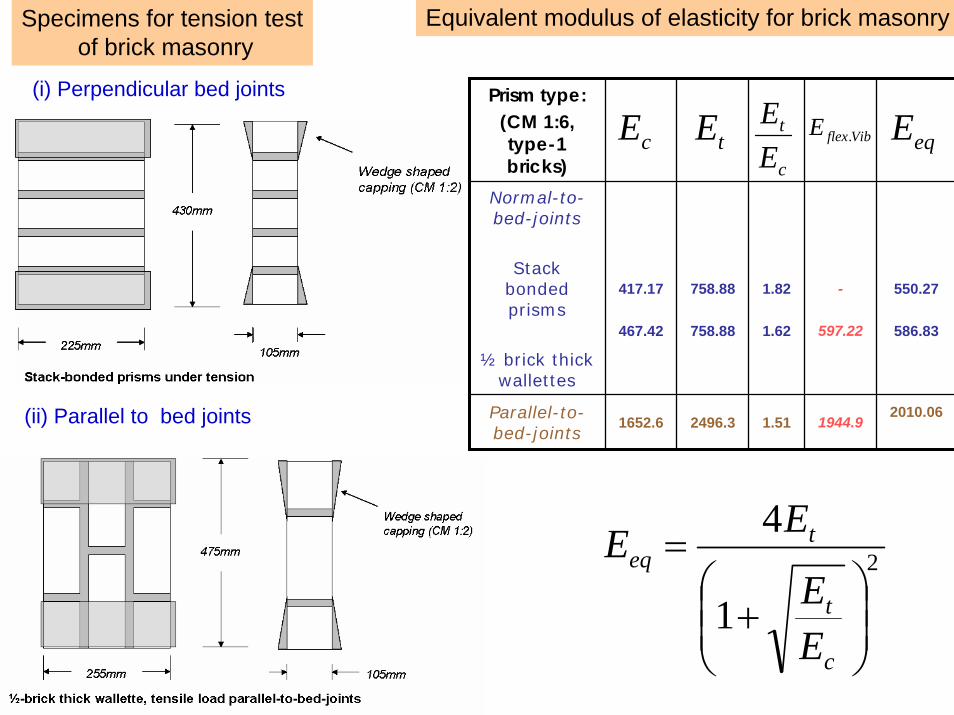
Specimens for tension testof brick masonry
Equivalent modulus of elasticity for brick masonry
(i) Perpendicular bed joints Prism type: (CM 1:6, type-1 bricks)
Normal-to-bed-joints
Stack bonded prisms
½ brick thick wallettes
417.17
467.42
758.88
758.88
1.82
1.62
-
597.22
550.27
586.83
Parallel-to-bed-joints
1652.6 2496.3 1.51 1944.92010.06
tEcEc
t
EE
VibflexE . eqE
(ii) Parallel to bed joints
2
1
4
⎟⎟⎠
⎞⎜⎜⎝
⎛+
=
c
t
teq
EE
EE
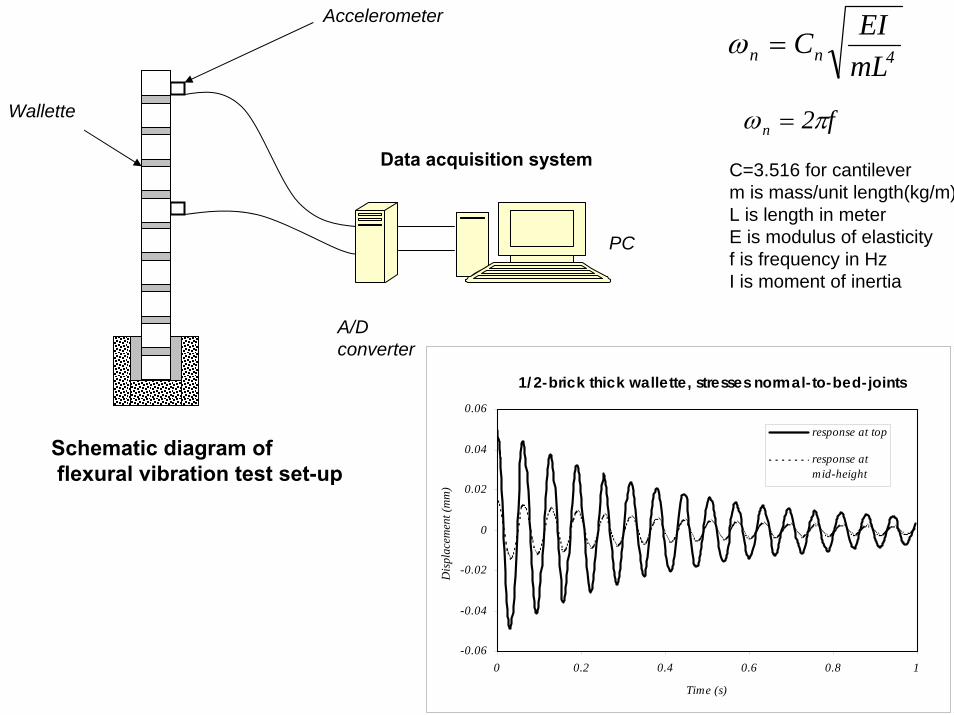
Schematic diagram offlexural vibration test set-up
Data acquisition system
A/D converter
PC
Accelerometer
Wallette
1/2-brick thick wallette, stresses normal-to-bed-joints
-0.06
-0.04
-0.02
0
0.02
0.04
0.06
0 0.2 0.4 0.6 0.8 1
Time (s)
Dis
plac
emen
t (m
m)
response at top
response atmid-height
4nn mLEIC=ω
f2n πω =
C=3.516 for cantileverm is mass/unit length(kg/m)L is length in meterE is modulus of elasticityf is frequency in HzI is moment of inertia
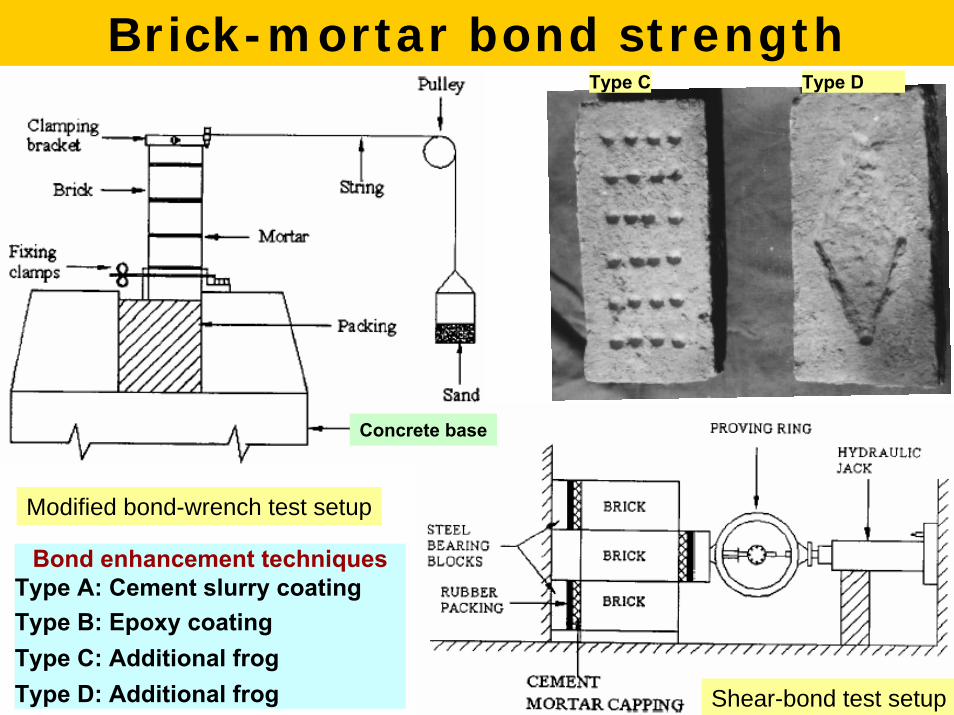
Brick-mortar bond strength
Modified bond-wrench test setup
Shear-bond test setup
Bond enhancement techniquesType A: Cement slurry coatingType B: Epoxy coatingType C: Additional frogType D: Additional frog
Type C Type D
Concrete base
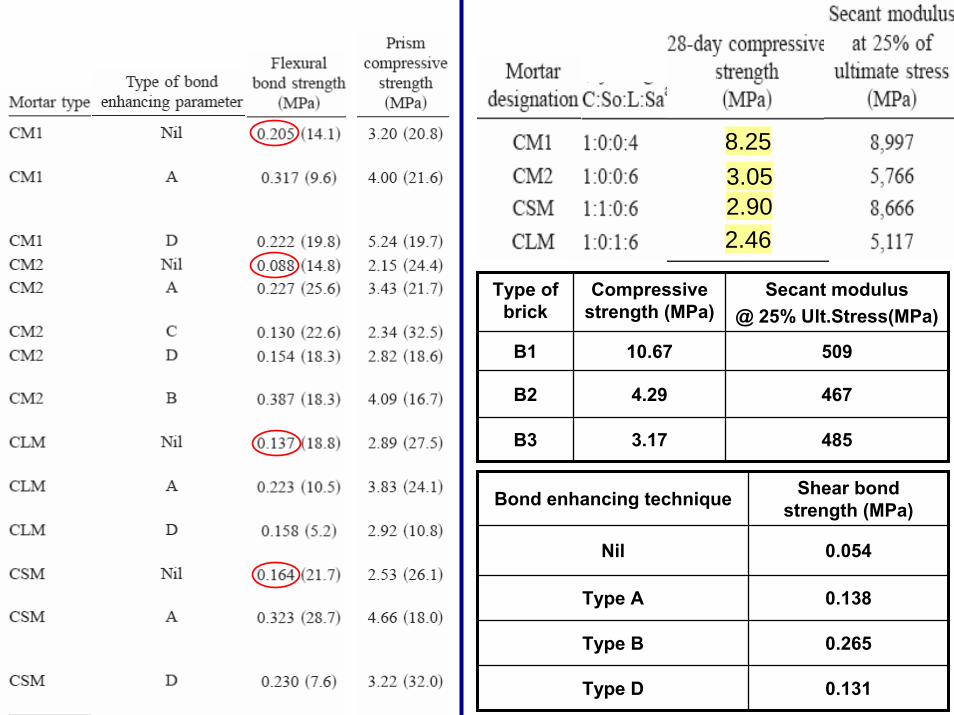
3.058.25
2.902.46
Type of brick
Compressive strength (MPa)
Secant modulus@ 25% Ult.Stress(MPa)
B1 10.67 509
B2 4.29 467
B3 3.17 485
Bond enhancing technique Shear bond strength (MPa)
Nil 0.054
Type A 0.138
Type B 0.265
Type D 0.131
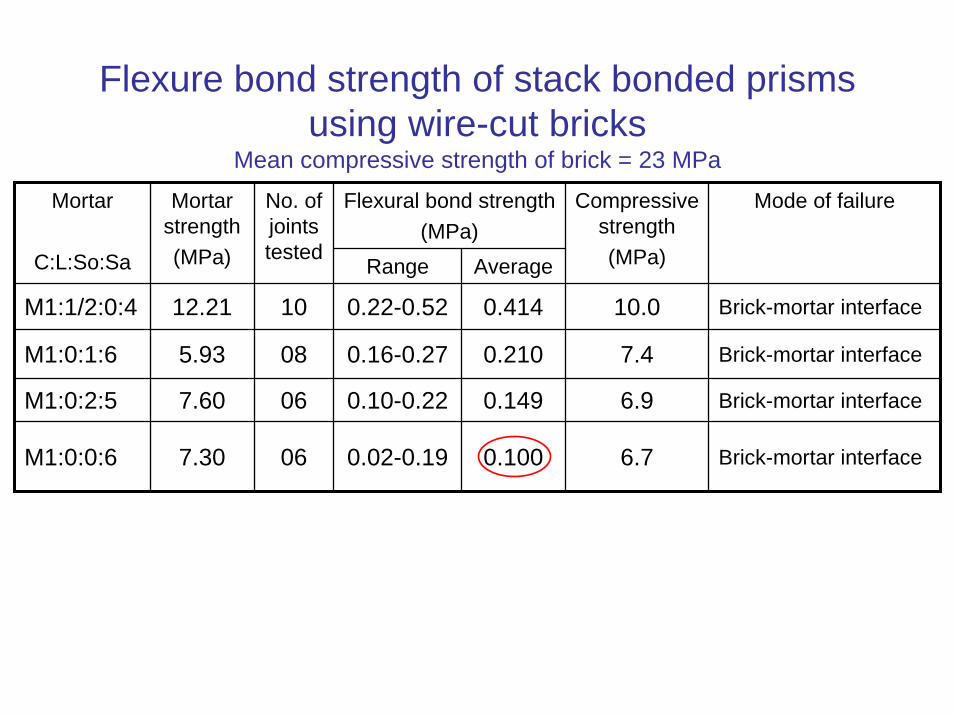
Flexure bond strength of stack bonded prisms using wire-cut bricks
Mean compressive strength of brick = 23 MPa
Flexural bond strength(MPa)
Mortar
C:L:So:Sa
Mortar strength(MPa)
No. of joints tested
Range Average
Compressive strength(MPa)
Mode of failure
M1:1/2:0:4 12.21 10 0.22-0.52 0.414 10.0 Brick-mortar interface
M1:0:1:6 5.93 08 0.16-0.27 0.210 7.4 Brick-mortar interface
M1:0:2:5 7.60 06 0.10-0.22 0.149 6.9 Brick-mortar interface
M1:0:0:6 7.30 06 0.02-0.19 0.100 6.7 Brick-mortar interface
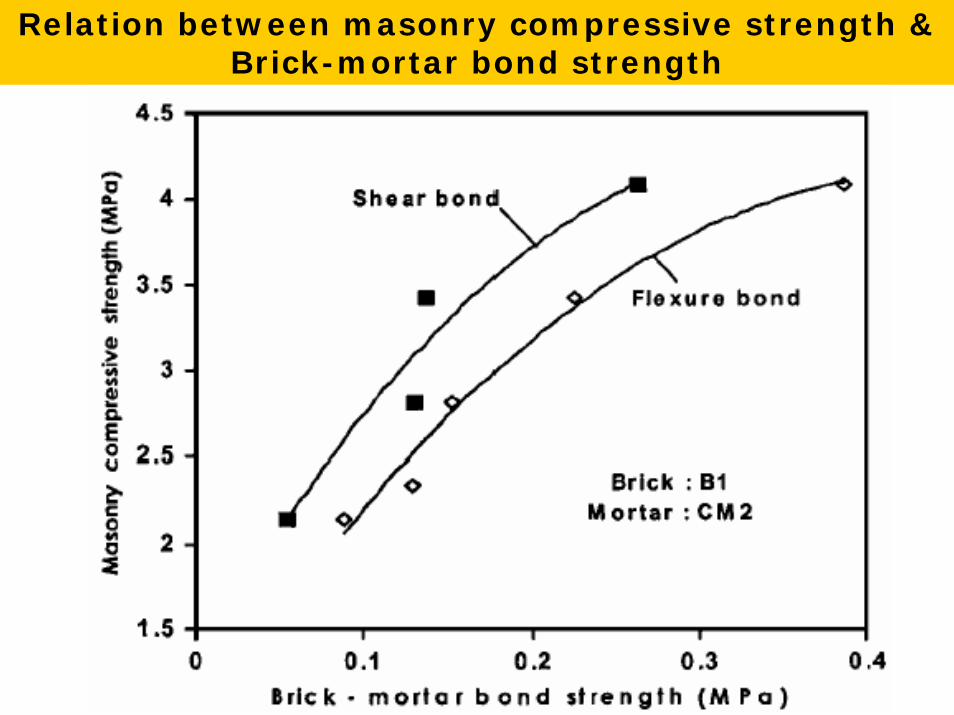
Relation between masonry compressive strength & Brick-mortar bond strength
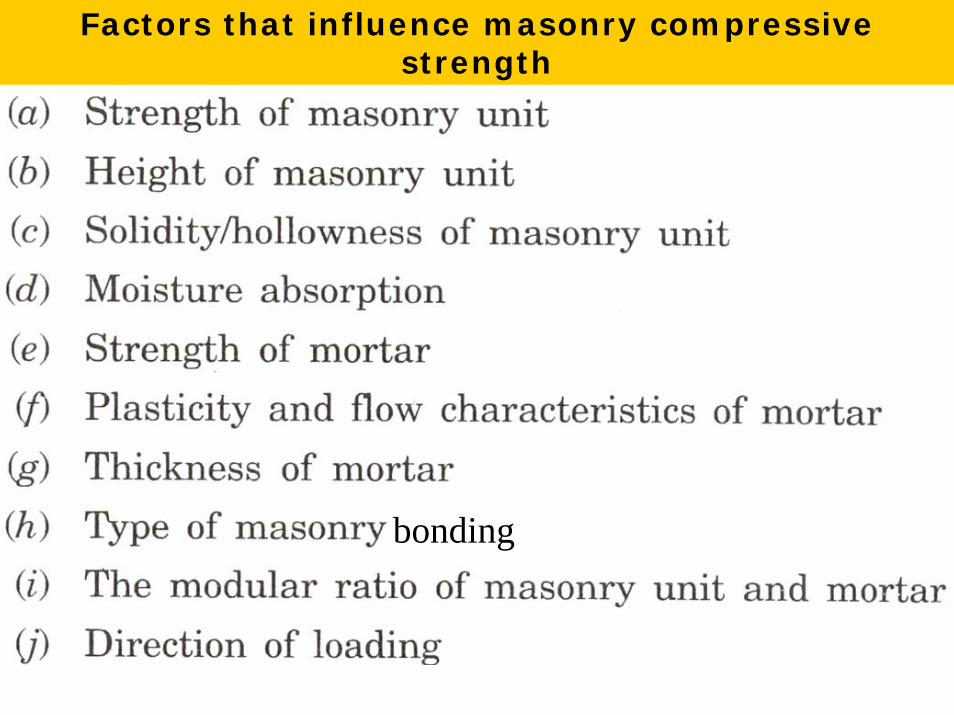
Factors that influence masonry compressive strength
bonding
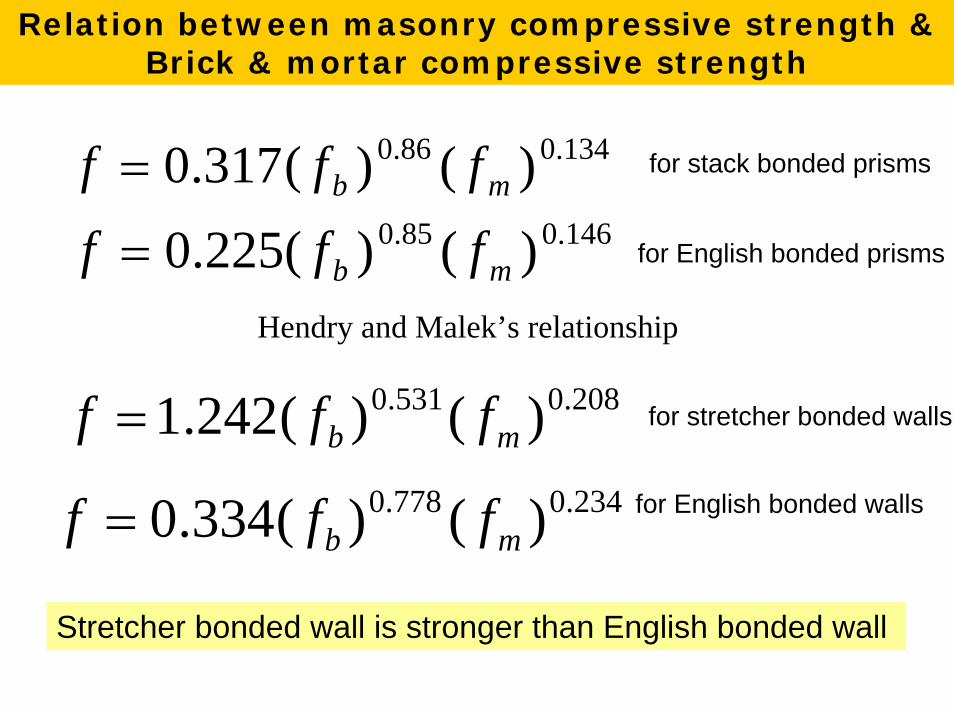
234.0778.0 )()(334.0 mb fff =
Hendry and Malek’s relationship
208.0531.0 )()(242.1 mb fff = for stretcher bonded walls
for English bonded walls
146.085.0 )()(225.0 mb fff =
134.086.0 )()(317.0 mb fff = for stack bonded prisms
for English bonded prisms
Stretcher bonded wall is stronger than English bonded wall
Relation between masonry compressive strength & Brick & mortar compressive strength
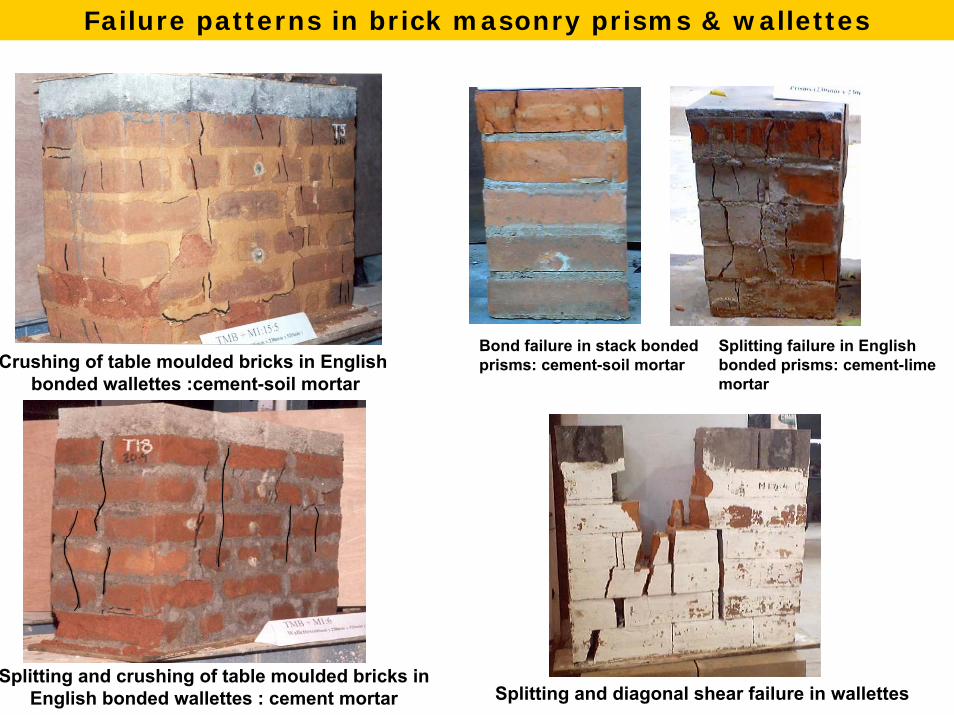
Crushing of table moulded bricks in English bonded wallettes :cement-soil mortar
Splitting and crushing of table moulded bricks inEnglish bonded wallettes : cement mortar
Bond failure in stack bonded Splitting failure in Englishprisms: cement-soil mortar bonded prisms: cement-lime
mortar
Splitting and diagonal shear failure in wallettes
Failure patterns in brick masonry prisms & wallettes
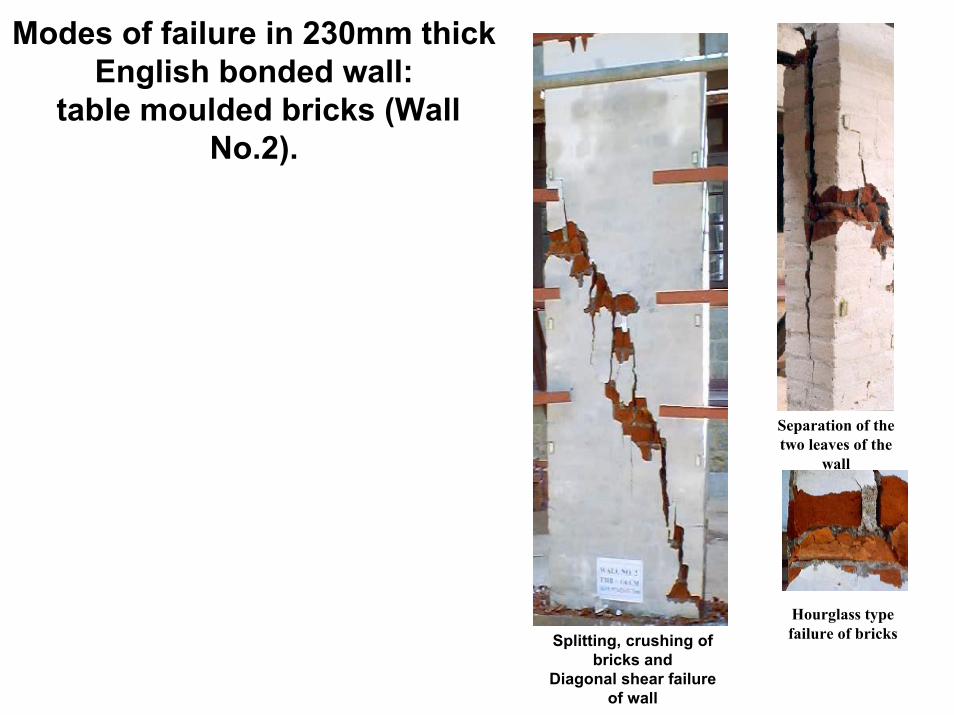
Modes of failure in 230mm thick English bonded wall:
table moulded bricks (Wall No.2).
Splitting, crushing of bricks and
Diagonal shear failure of wall
Hourglass type failure of bricks
Separation of the two leaves of the
wall
Back Face of the wall
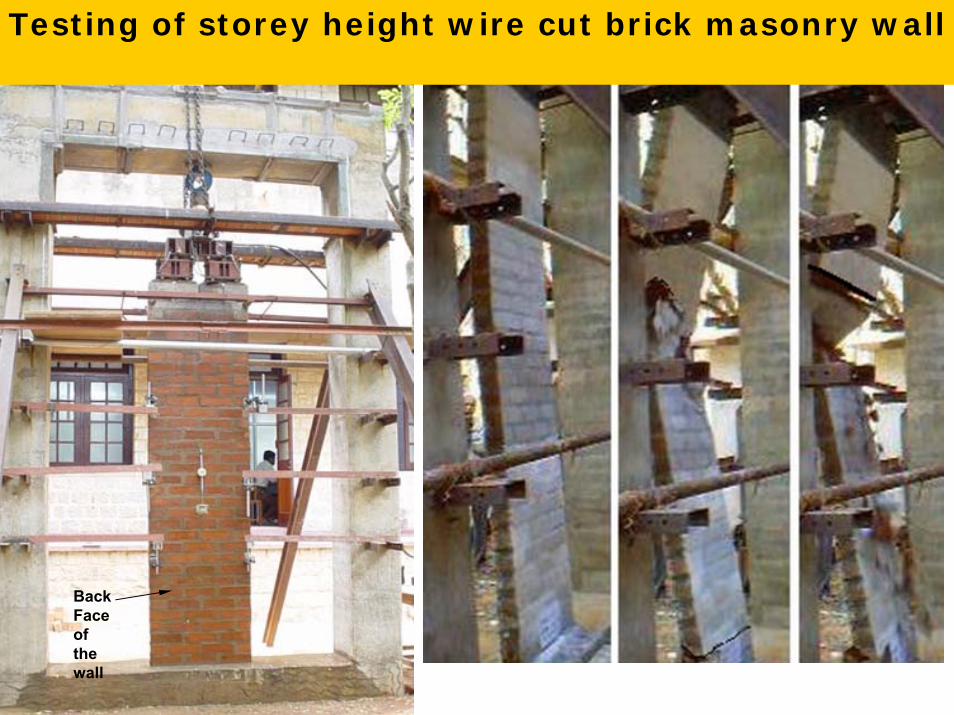
Testing of storey height wire cut brick masonry wall
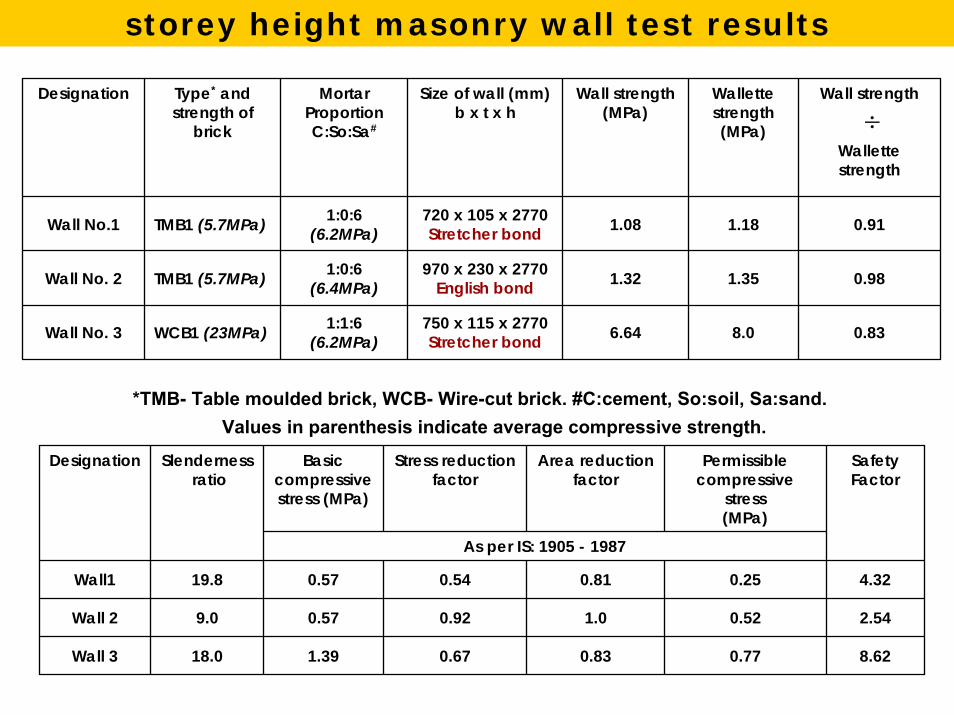
Designation Type* and strength of
brick
Mortar ProportionC:So:Sa#
Size of wall (mm)b x t x h
Wall strength(MPa)
Wallettestrength (MPa)
Wall strength
Wallettestrength
Wall No.1 TMB1 (5.7MPa) 1:0:6 (6.2MPa)
720 x 105 x 2770Stretcher bond 1.08 1.18 0.91
Wall No. 2 TMB1 (5.7MPa) 1:0:6 (6.4MPa)
970 x 230 x 2770English bond 1.32 1.35 0.98
Wall No. 3 WCB1 (23MPa) 1:1:6 (6.2MPa)
750 x 115 x 2770Stretcher bond 6.64 8.0 0.83
*TMB- Table moulded brick, WCB- Wire-cut brick. #C:cement, So:soil, Sa:sand. Values in parenthesis indicate average compressive strength.
÷
storey height masonry wall test results
Basic compressive stress (MPa)
Stress reduction factor
Area reduction factor
Permissible compressive
stress (MPa)
As per IS: 1905 - 1987
Safety Factor
Wall1 19.8 0.57 0.54 0.81 0.25 4.32
Wall 2 9.0 0.57 0.92 1.0 0.52 2.54
Wall 3 18.0 1.39 0.67 0.83 0.77 8.62
Designation Slendernessratio
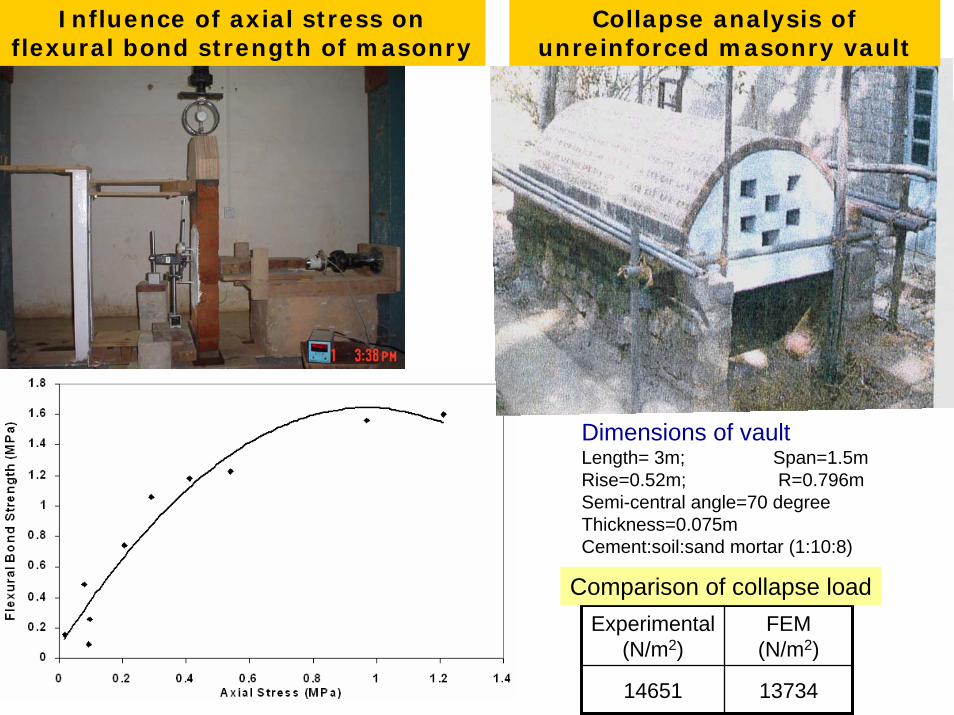
Influence of axial stress on flexural bond strength of masonry
Collapse analysis of unreinforced masonry vault
Dimensions of vaultLength= 3m; Span=1.5mRise=0.52m; R=0.796mSemi-central angle=70 degreeThickness=0.075mCement:soil:sand mortar (1:10:8)
Experimental (N/m2)
FEM (N/m2)
14651 13734
Comparison of collapse load
Performance of Masonry Buildings during Earthquakes&
Earthquake Resistant Design Concepts for Masonry Buildings
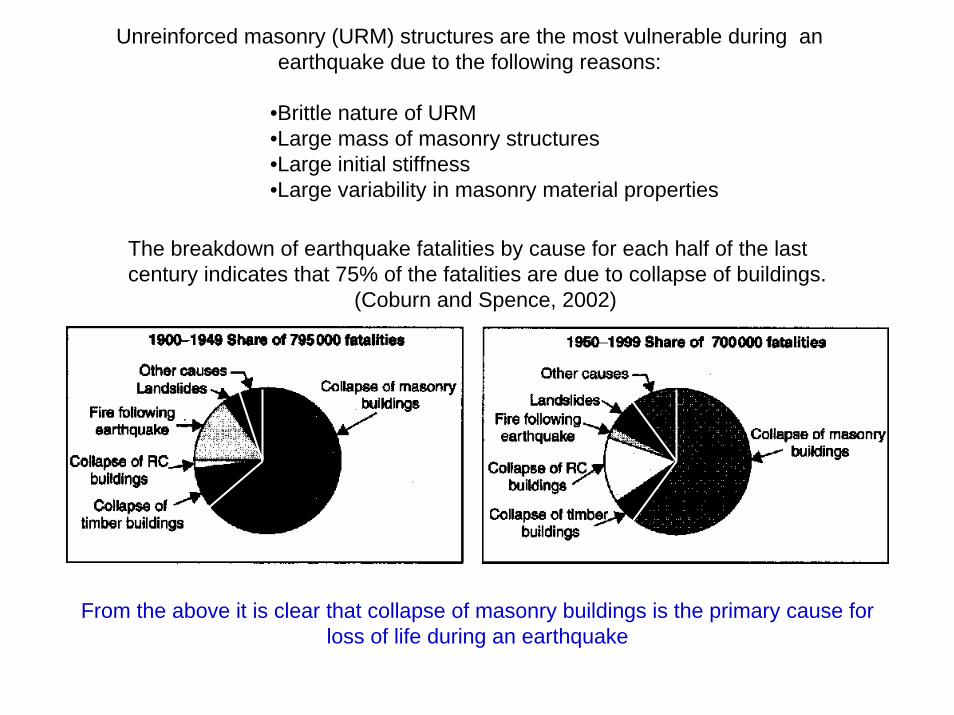
Unreinforced masonry (URM) structures are the most vulnerable during an earthquake due to the following reasons:
•Brittle nature of URM•Large mass of masonry structures•Large initial stiffness•Large variability in masonry material properties
The breakdown of earthquake fatalities by cause for each half of the last century indicates that 75% of the fatalities are due to collapse of buildings.
(Coburn and Spence, 2002)
From the above it is clear that collapse of masonry buildings is the primary cause for loss of life during an earthquake
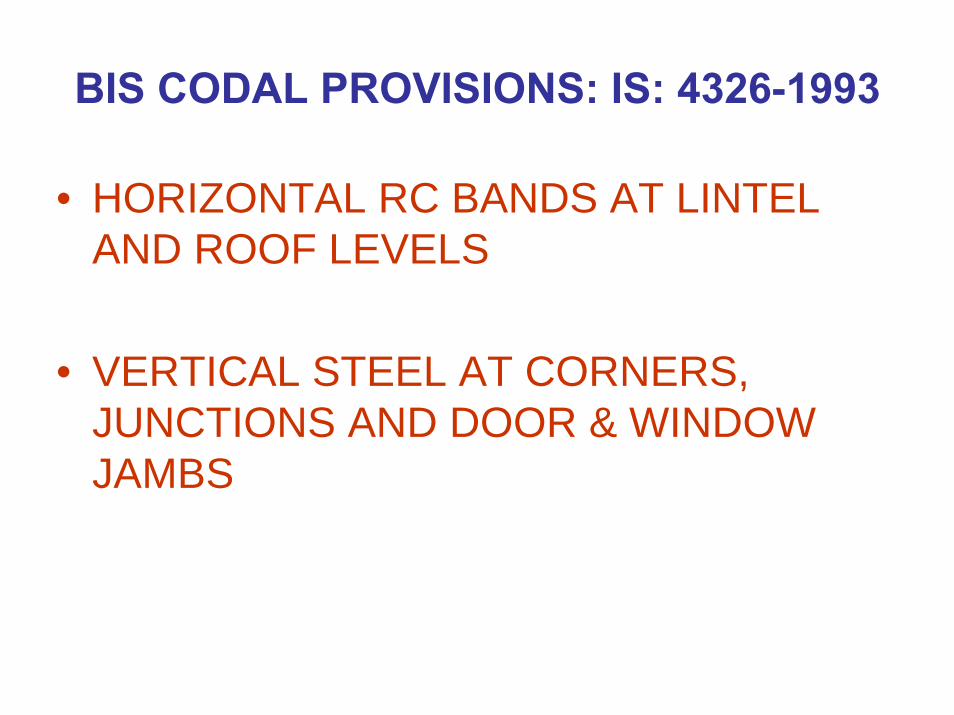
BIS CODAL PROVISIONS: IS: 4326-1993
• HORIZONTAL RC BANDS AT LINTEL AND ROOF LEVELS
• VERTICAL STEEL AT CORNERS, JUNCTIONS AND DOOR & WINDOW JAMBS
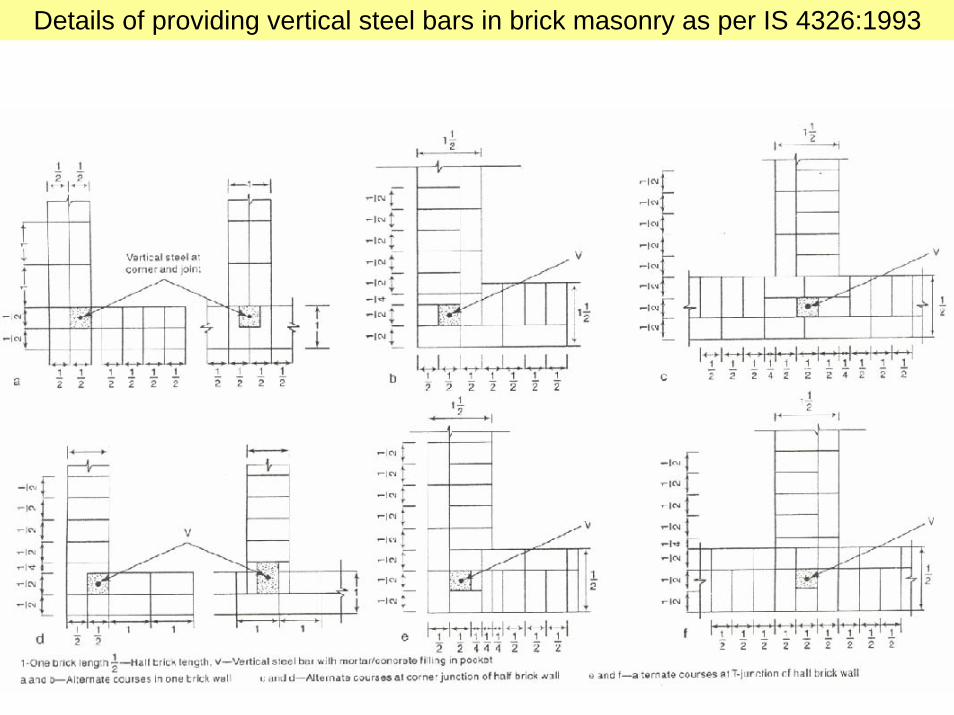
Details of providing vertical steel bars in brick masonry as per IS 4326:1993
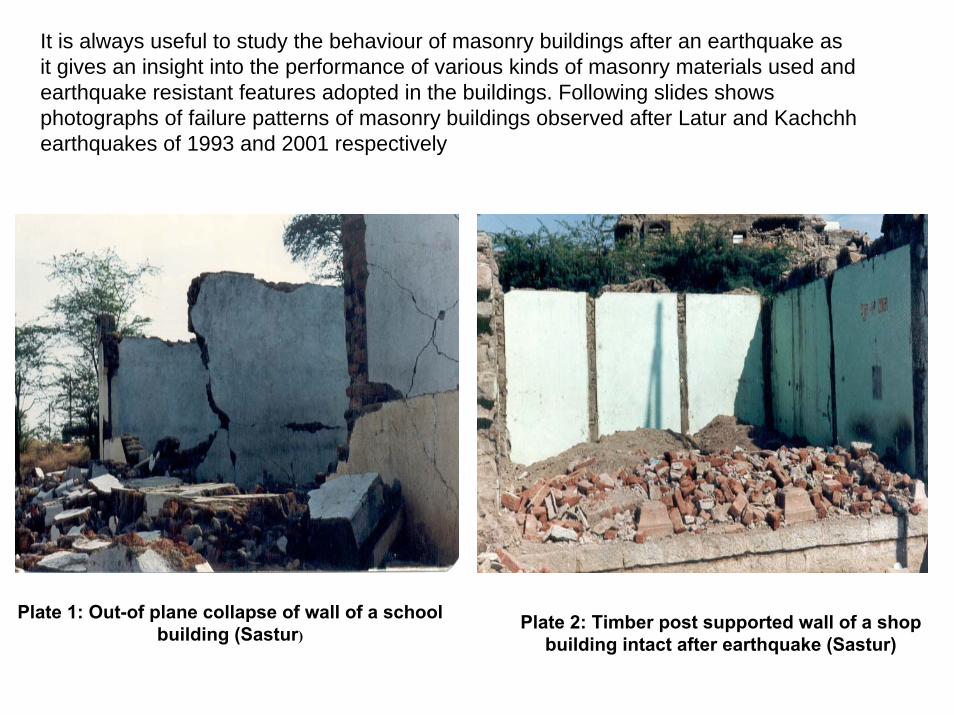
It is always useful to study the behaviour of masonry buildings after an earthquake as it gives an insight into the performance of various kinds of masonry materials used and earthquake resistant features adopted in the buildings. Following slides shows photographs of failure patterns of masonry buildings observed after Latur and Kachchhearthquakes of 1993 and 2001 respectively
Plate 1: Out-of plane collapse of wall of a school building (Sastur)
Plate 2: Timber post supported wall of a shop building intact after earthquake (Sastur)
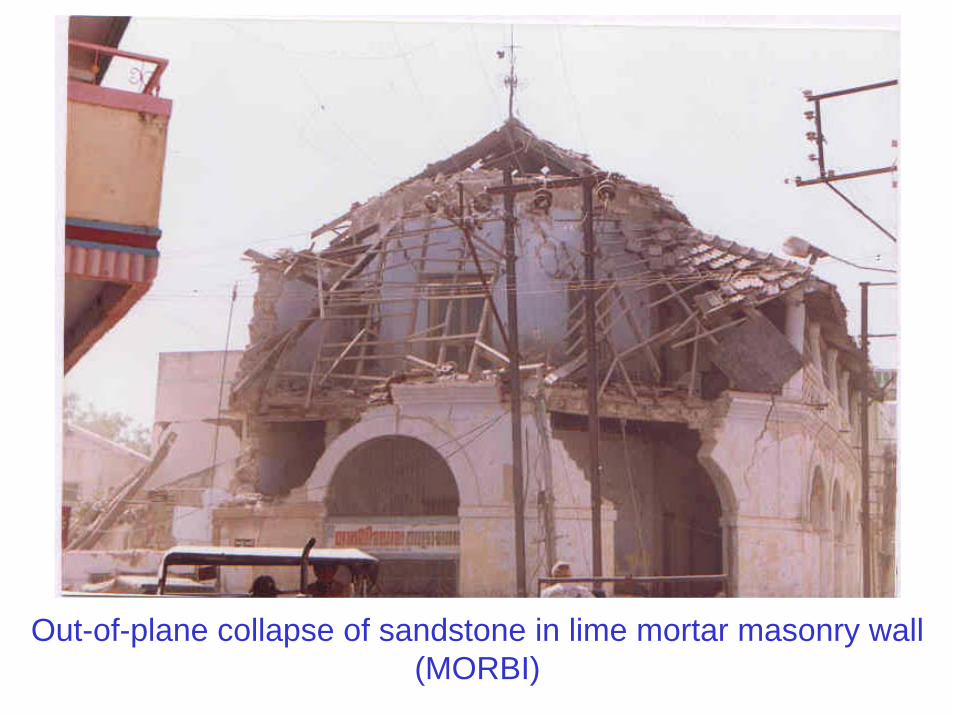
Out-of-plane collapse of sandstone in lime mortar masonry wall (MORBI)
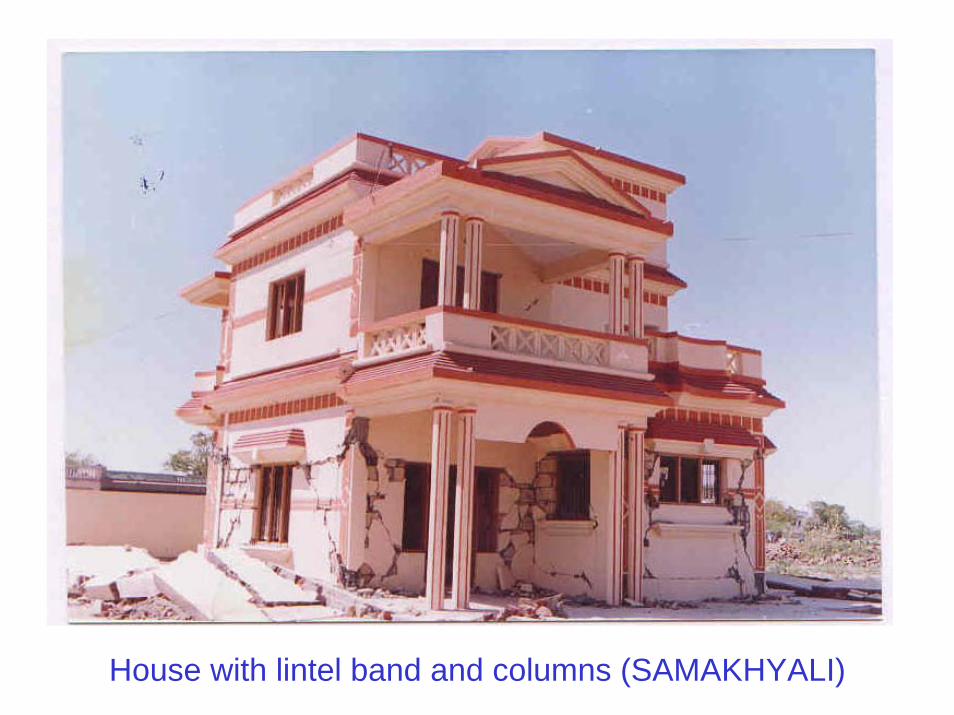
House with lintel band and columns (SAMAKHYALI)
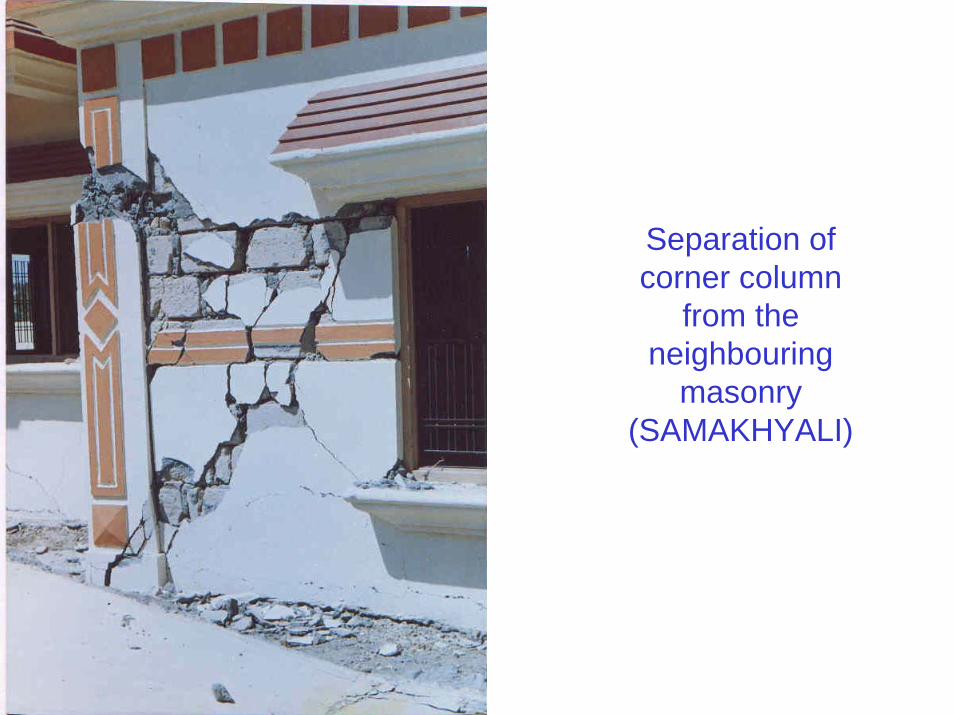
Separation of corner column
from the neighbouring
masonry (SAMAKHYALI)
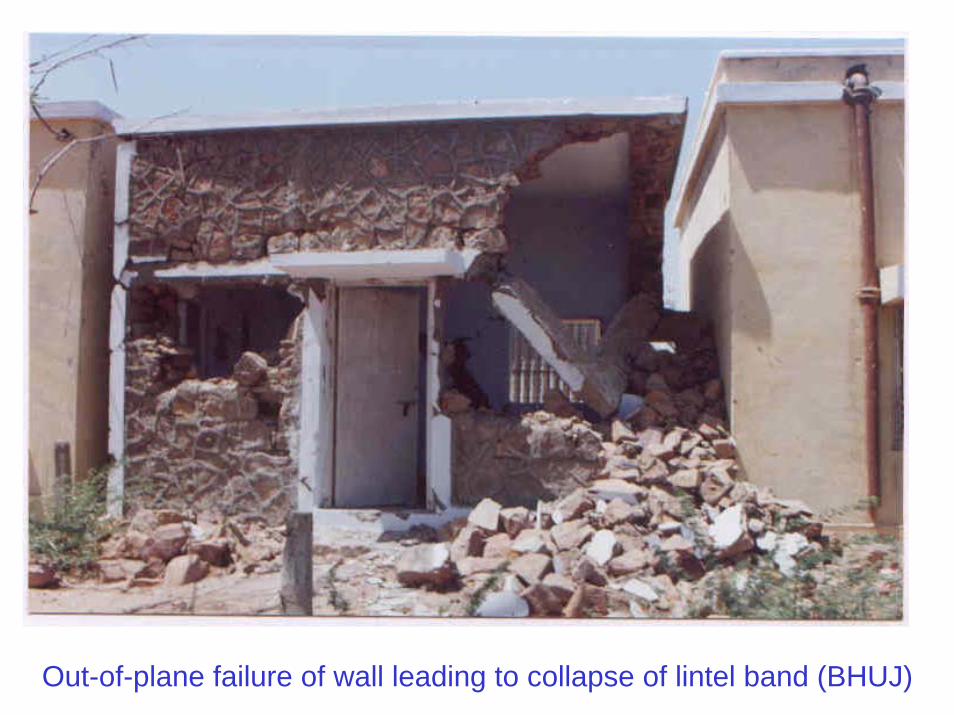
Out-of-plane failure of wall leading to collapse of lintel band (BHUJ)
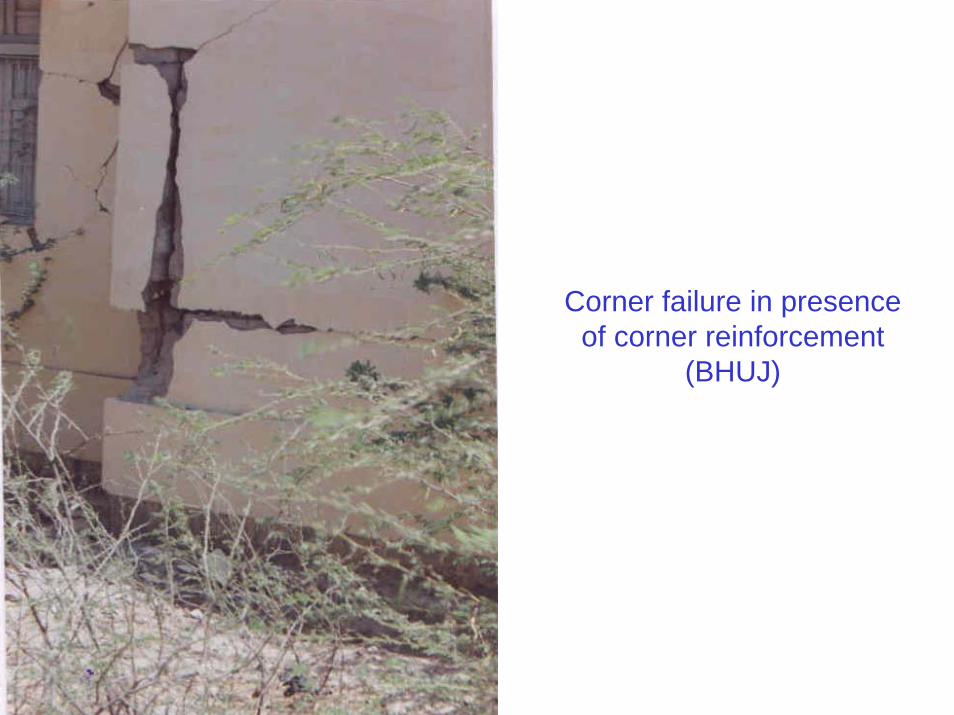
Corner failure in presence of corner reinforcement
(BHUJ)
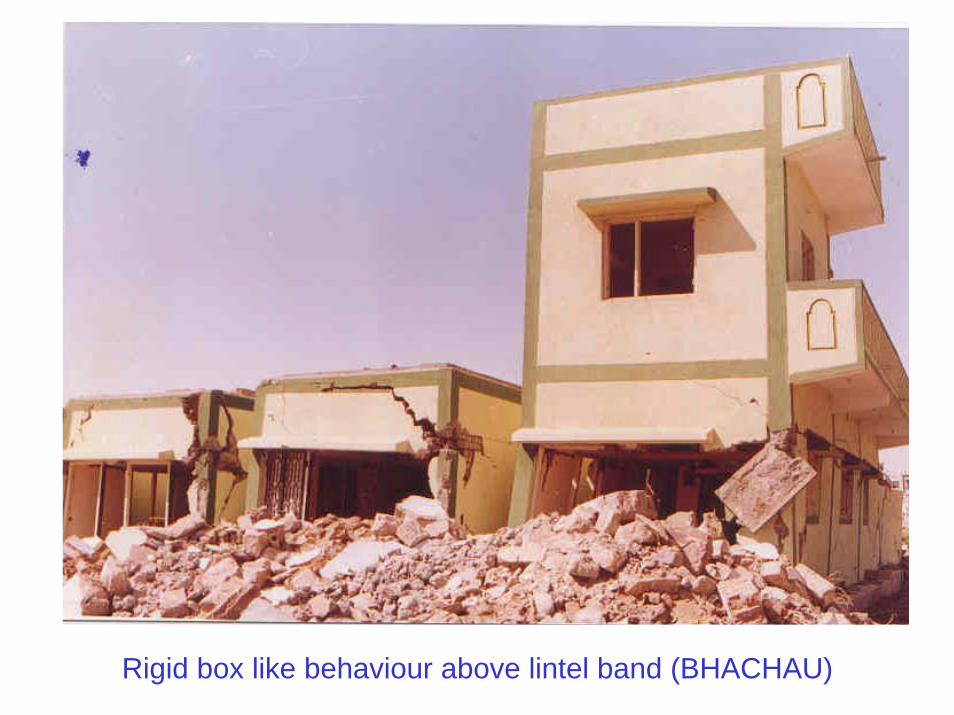
Rigid box like behaviour above lintel band (BHACHAU)
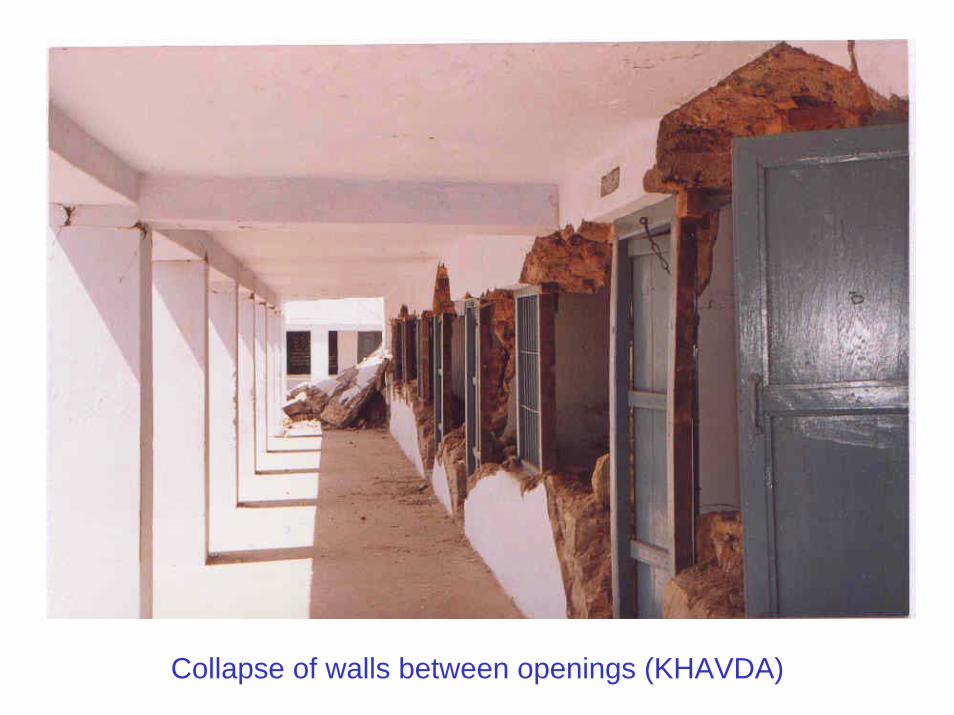
Collapse of walls between openings (KHAVDA)
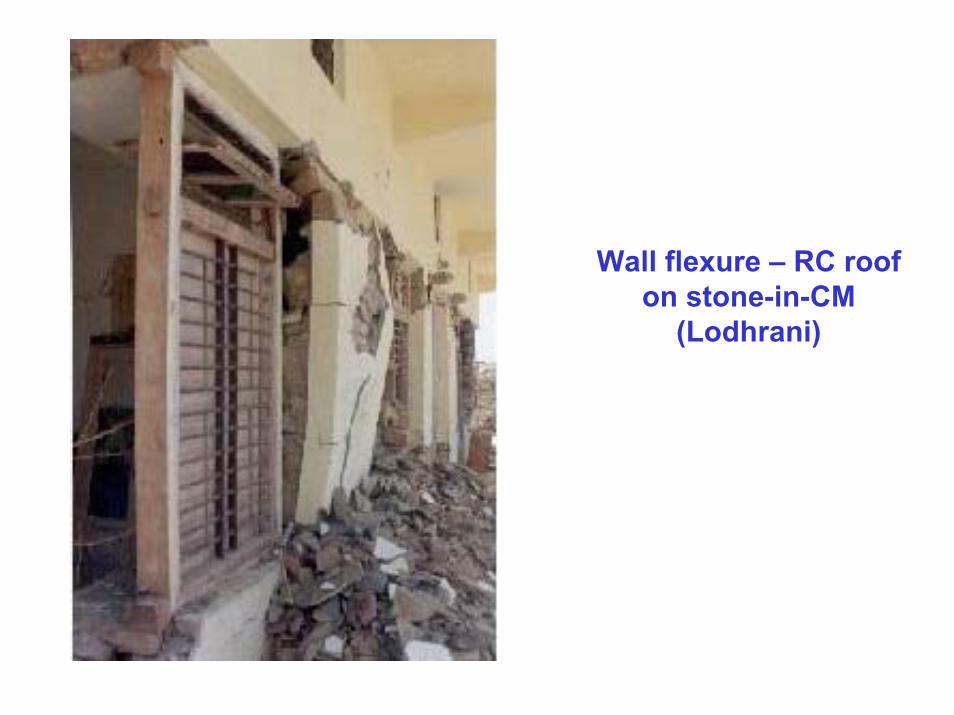
Wall flexure – RC roof on stone-in-CM
(Lodhrani)
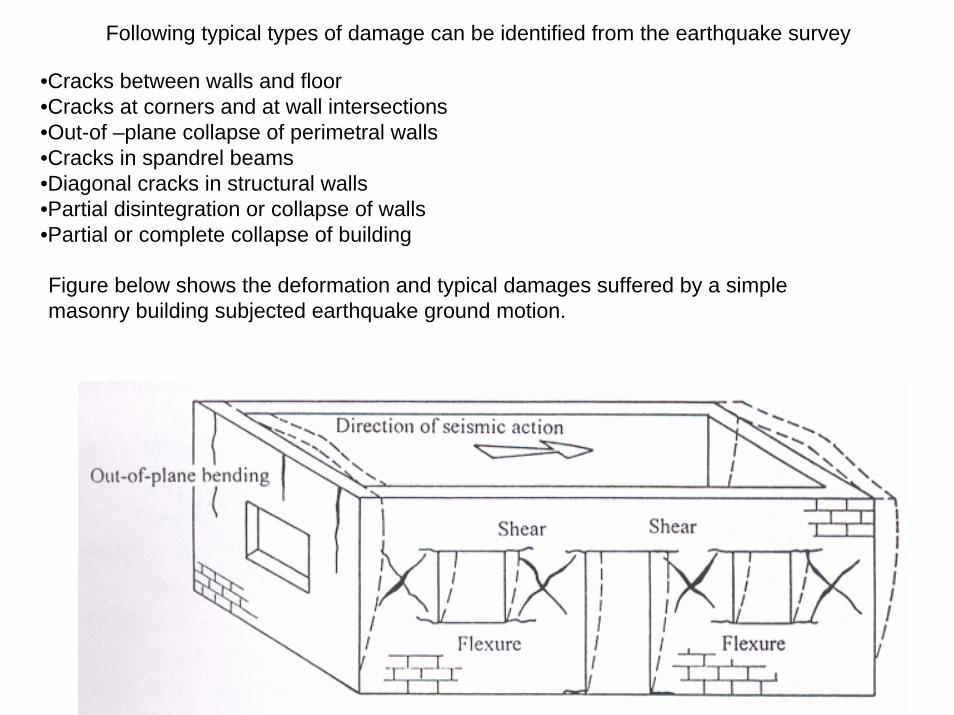
Following typical types of damage can be identified from the earthquake survey
•Cracks between walls and floor•Cracks at corners and at wall intersections•Out-of –plane collapse of perimetral walls•Cracks in spandrel beams•Diagonal cracks in structural walls•Partial disintegration or collapse of walls•Partial or complete collapse of building
Figure below shows the deformation and typical damages suffered by a simple masonry building subjected earthquake ground motion.
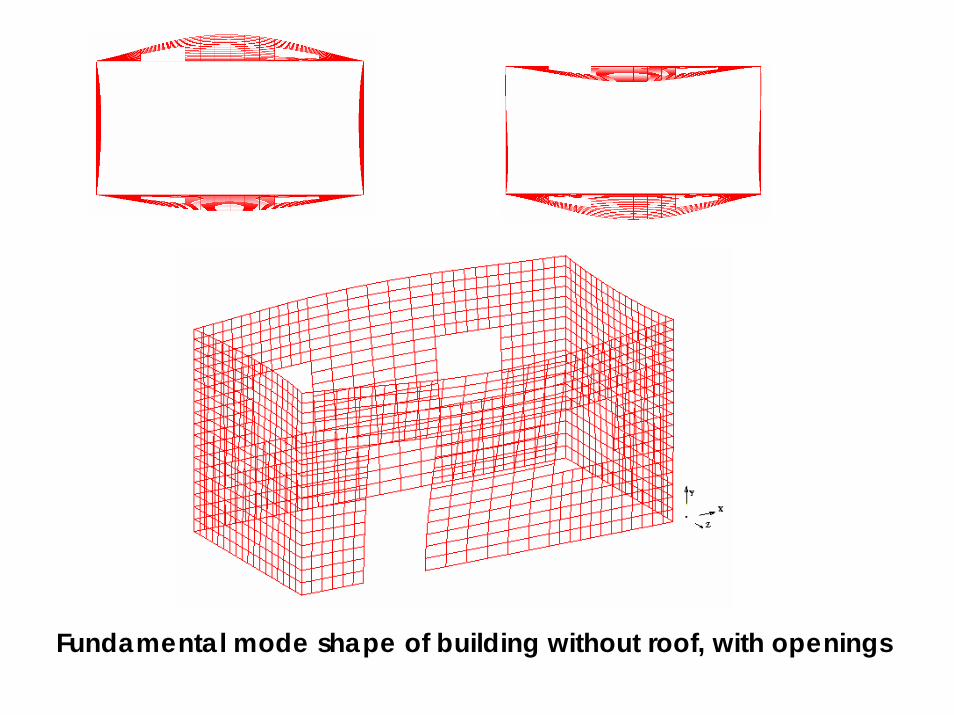
Fundamental mode shape of building without roof, with openings
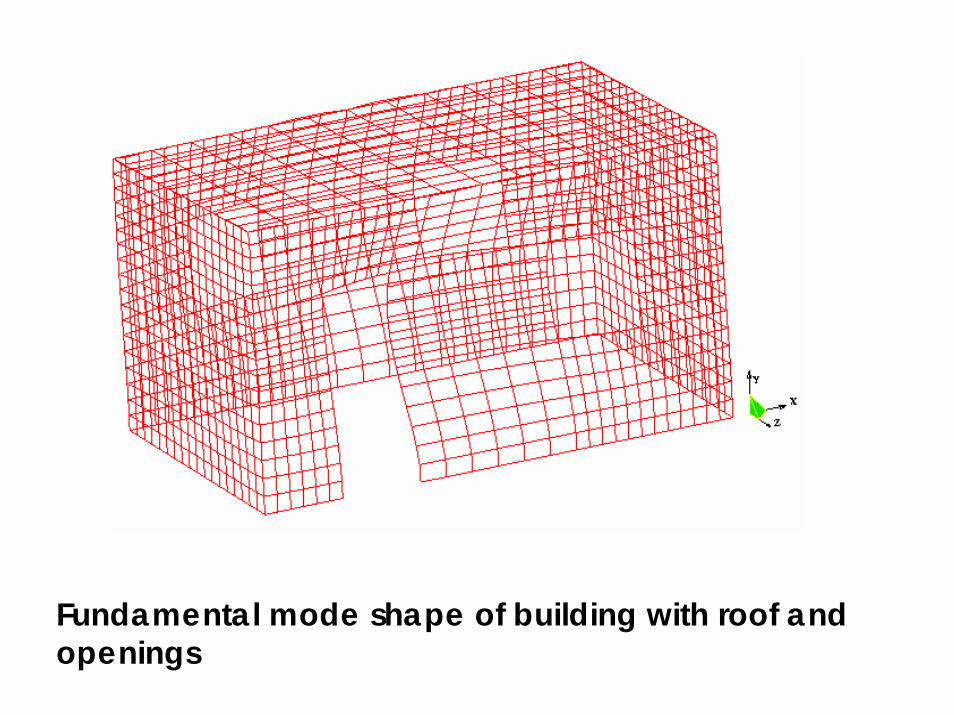
Fundamental mode shape of building with roof and openings
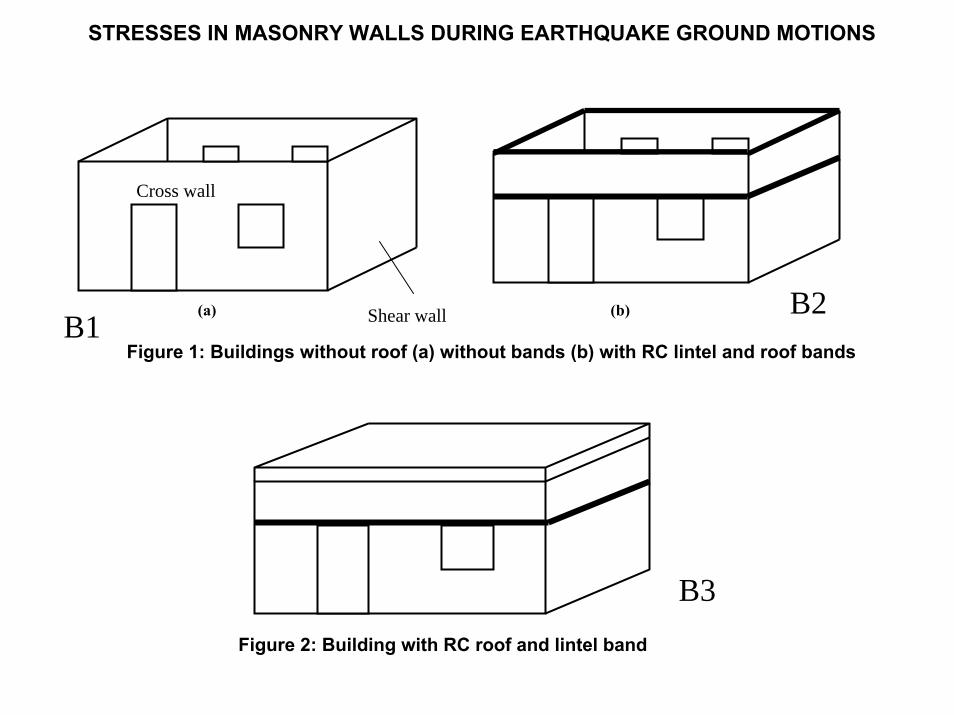
STRESSES IN MASONRY WALLS DURING EARTHQUAKE GROUND MOTIONS
Figure 1: Buildings without roof (a) without bands (b) with RC lintel and roof bands
(a) (b)
Figure 2: Building with RC roof and lintel band
Cross wall
Shear wallB1B2
B3
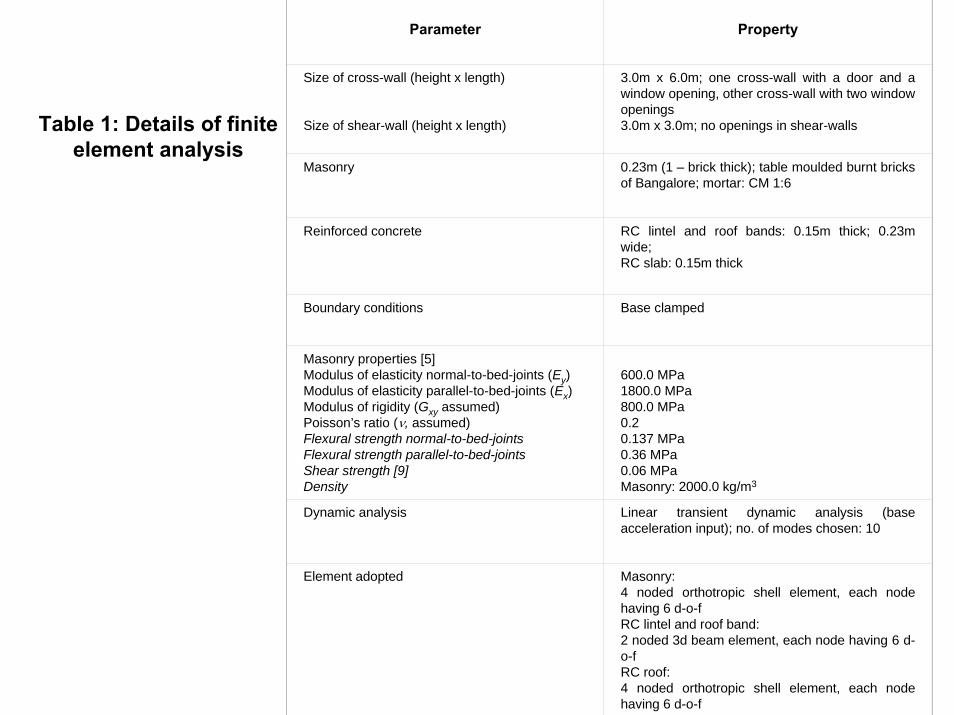
Table 1: Details of finite element analysis
Parameter Property
Size of cross-wall (height x length)
Size of shear-wall (height x length)
3.0m x 6.0m; one cross-wall with a door and a window opening, other cross-wall with two window openings3.0m x 3.0m; no openings in shear-walls
Masonry 0.23m (1 – brick thick); table moulded burnt bricks of Bangalore; mortar: CM 1:6
Reinforced concrete RC lintel and roof bands: 0.15m thick; 0.23m wide; RC slab: 0.15m thick
Boundary conditions Base clamped
Masonry properties [5]Modulus of elasticity normal-to-bed-joints (Ey)Modulus of elasticity parallel-to-bed-joints (Ex)Modulus of rigidity (Gxy assumed)Poisson’s ratio (ν, assumed)Flexural strength normal-to-bed-jointsFlexural strength parallel-to-bed-jointsShear strength [9]Density
600.0 MPa1800.0 MPa800.0 MPa0.20.137 MPa0.36 MPa0.06 MPaMasonry: 2000.0 kg/m3
Dynamic analysis Linear transient dynamic analysis (base acceleration input); no. of modes chosen: 10
Element adopted Masonry:4 noded orthotropic shell element, each node having 6 d-o-fRC lintel and roof band:2 noded 3d beam element, each node having 6 d-o-fRC roof:4 noded orthotropic shell element, each node having 6 d-o-f
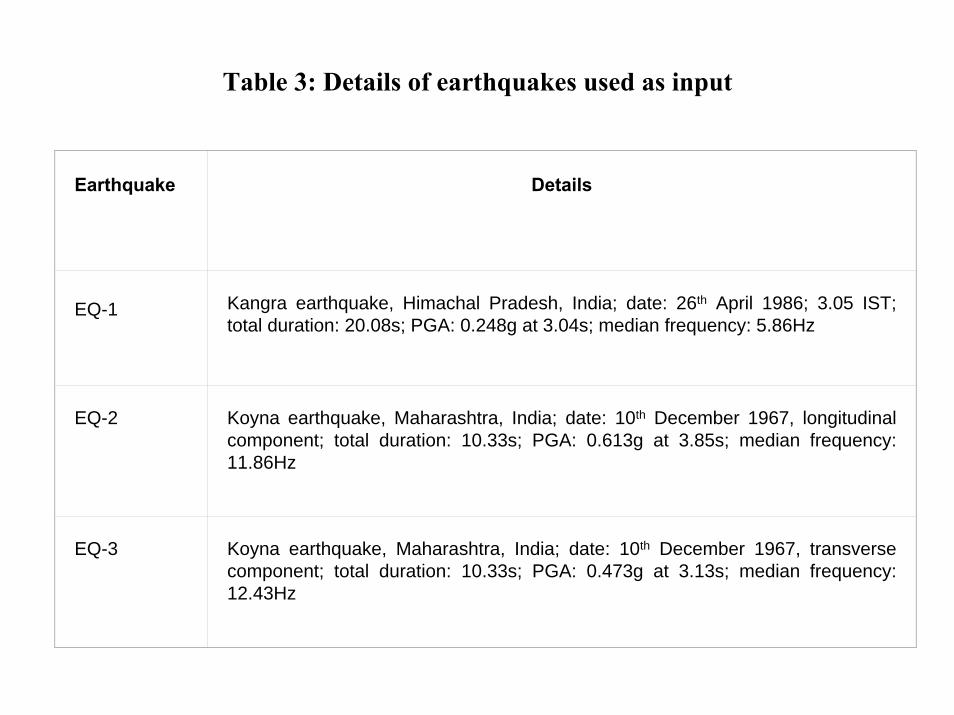
Table 3: Details of earthquakes used as input
Earthquake Details
EQ-1 Kangra earthquake, Himachal Pradesh, India; date: 26th April 1986; 3.05 IST; total duration: 20.08s; PGA: 0.248g at 3.04s; median frequency: 5.86Hz
EQ-2 Koyna earthquake, Maharashtra, India; date: 10th December 1967, longitudinal component; total duration: 10.33s; PGA: 0.613g at 3.85s; median frequency: 11.86Hz
EQ-3 Koyna earthquake, Maharashtra, India; date: 10th December 1967, transverse component; total duration: 10.33s; PGA: 0.473g at 3.13s; median frequency: 12.43Hz
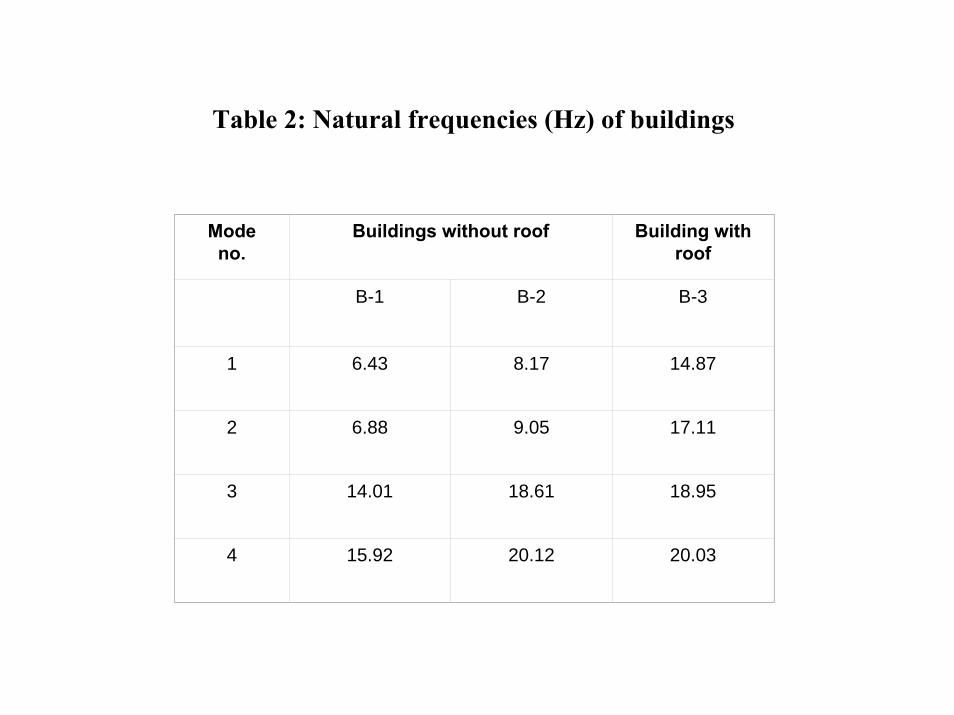
Table 2: Natural frequencies (Hz) of buildings
Mode no.
Buildings without roof Building with roof
B-1 B-2 B-3
1 6.43 8.17 14.87
2 6.88 9.05 17.11
3 14.01 18.61 18.95
4 15.92 20.12 20.03
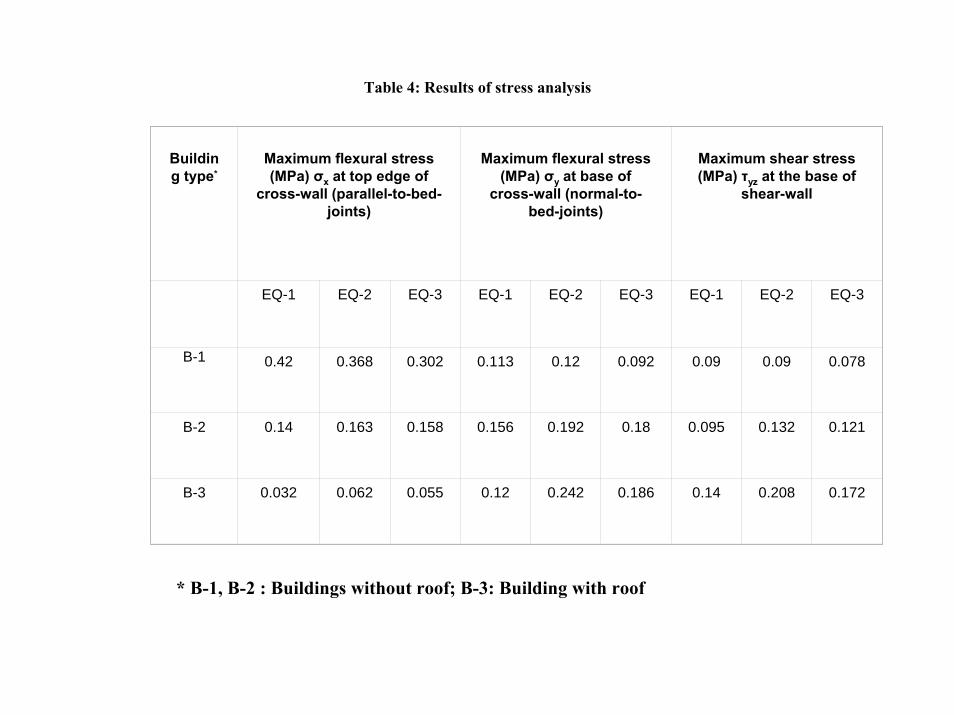
Table 4: Results of stress analysis
Building type*
Maximum flexural stress (MPa) σx at top edge of
cross-wall (parallel-to-bed-joints)
Maximum flexural stress (MPa) σy at base of
cross-wall (normal-to-bed-joints)
Maximum shear stress (MPa) τyz at the base of
shear-wall
EQ-1 EQ-2 EQ-3 EQ-1 EQ-2 EQ-3 EQ-1 EQ-2 EQ-3
B-1 0.42 0.368 0.302 0.113 0.12 0.092 0.09 0.09 0.078
B-2 0.14 0.163 0.158 0.156 0.192 0.18 0.095 0.132 0.121
B-3 0.032 0.062 0.055 0.12 0.242 0.186 0.14 0.208 0.172
* B-1, B-2 : Buildings without roof; B-3: Building with roof
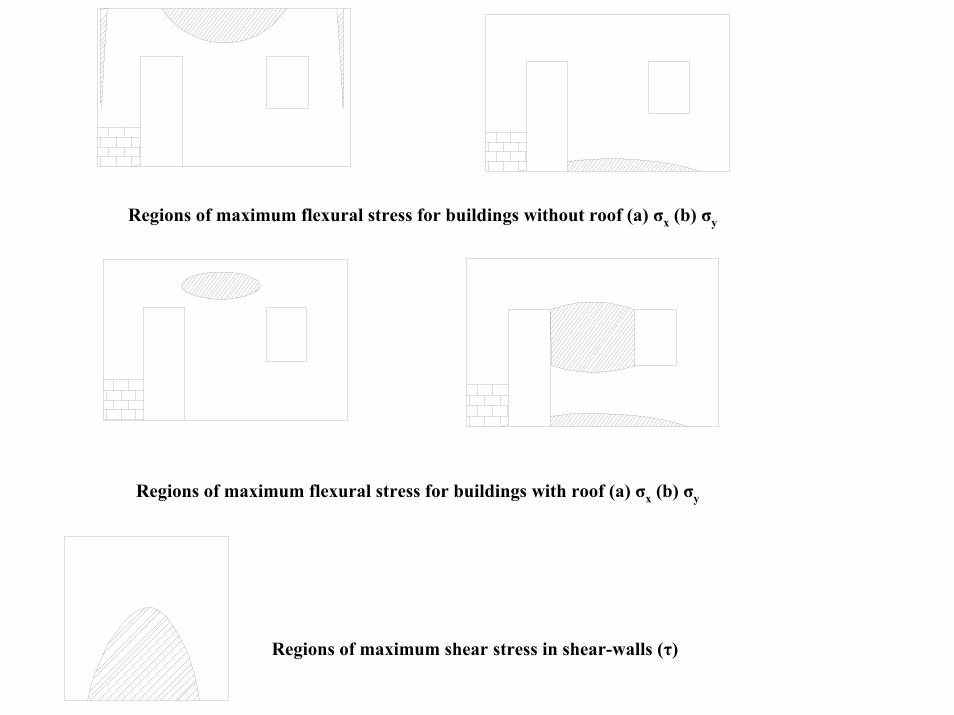
Regions of maximum flexural stress for buildings without roof (a) σx (b) σy
Regions of maximum flexural stress for buildings with roof (a) σx (b) σy
Regions of maximum shear stress in shear-walls (τ)
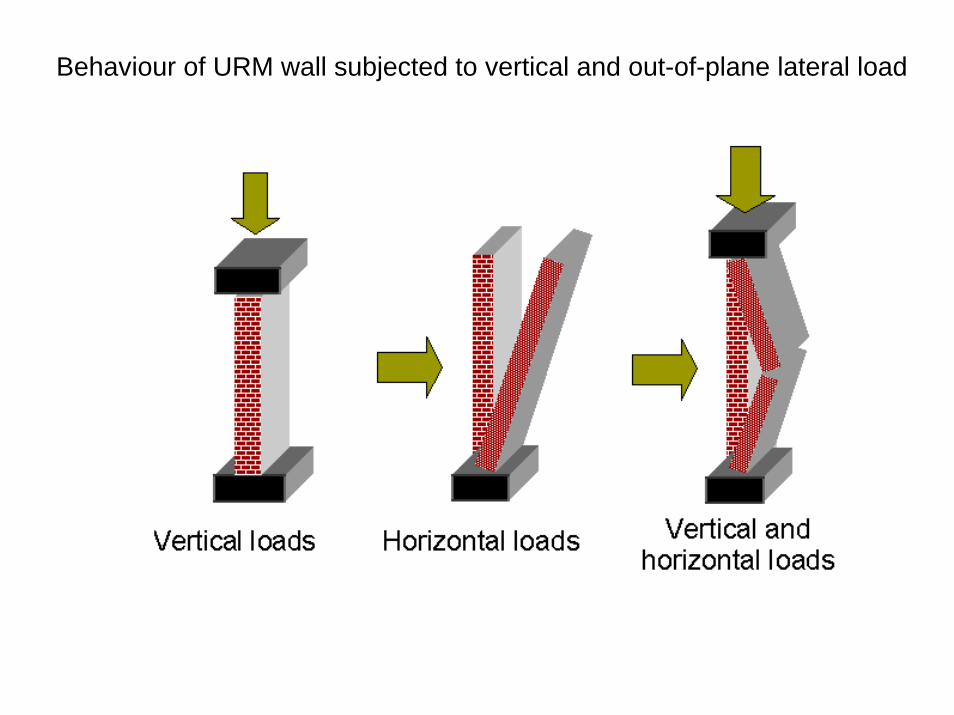
Behaviour of URM wall subjected to vertical and out-of-plane lateral load
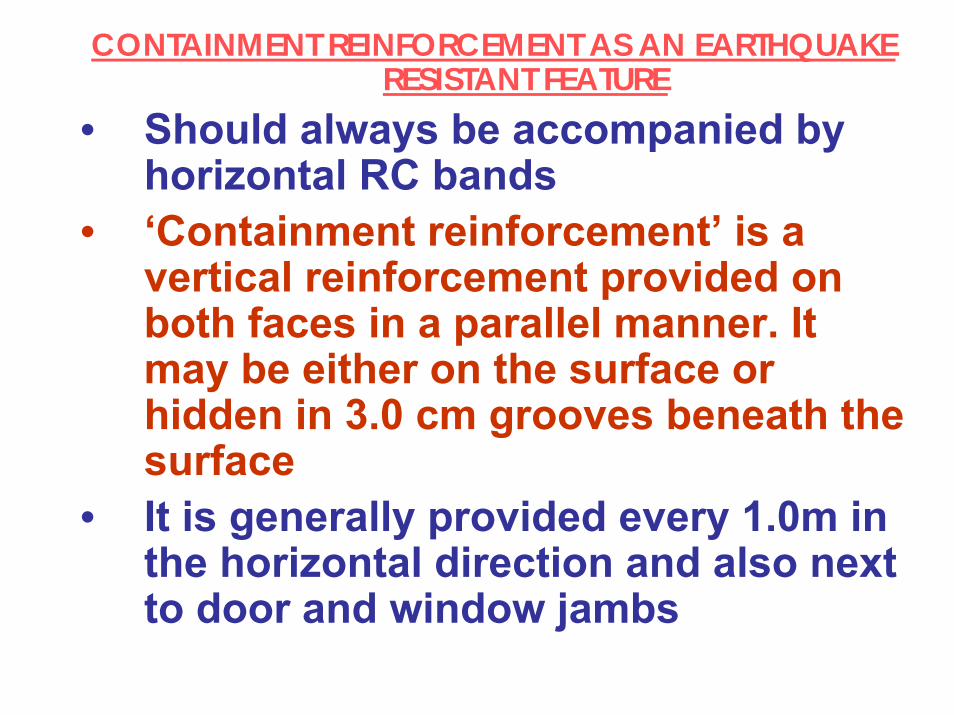
CONTAINMENT REINFORCEMENT AS AN EARTHQUAKE RESISTANT FEATURE
• Should always be accompanied by horizontal RC bands
• ‘Containment reinforcement’ is a vertical reinforcement provided on both faces in a parallel manner. It may be either on the surface or hidden in 3.0 cm grooves beneath the surface
• It is generally provided every 1.0m in the horizontal direction and also next to door and window jambs
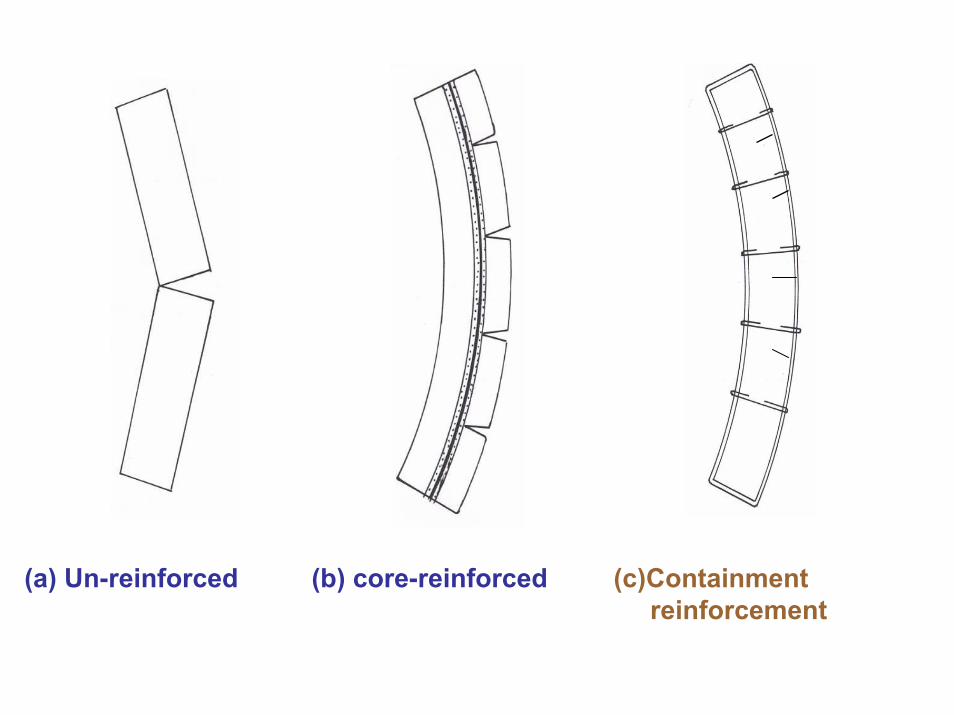
(a) Un-reinforced (b) core-reinforced (c)Containment reinforcement
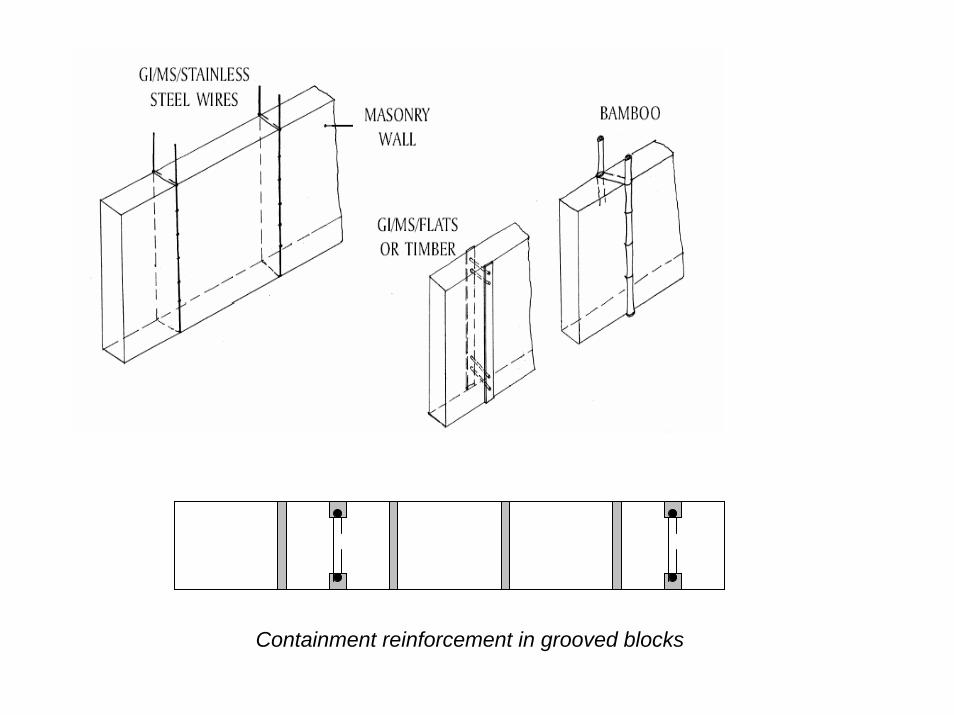
Containment reinforcement in grooved blocks
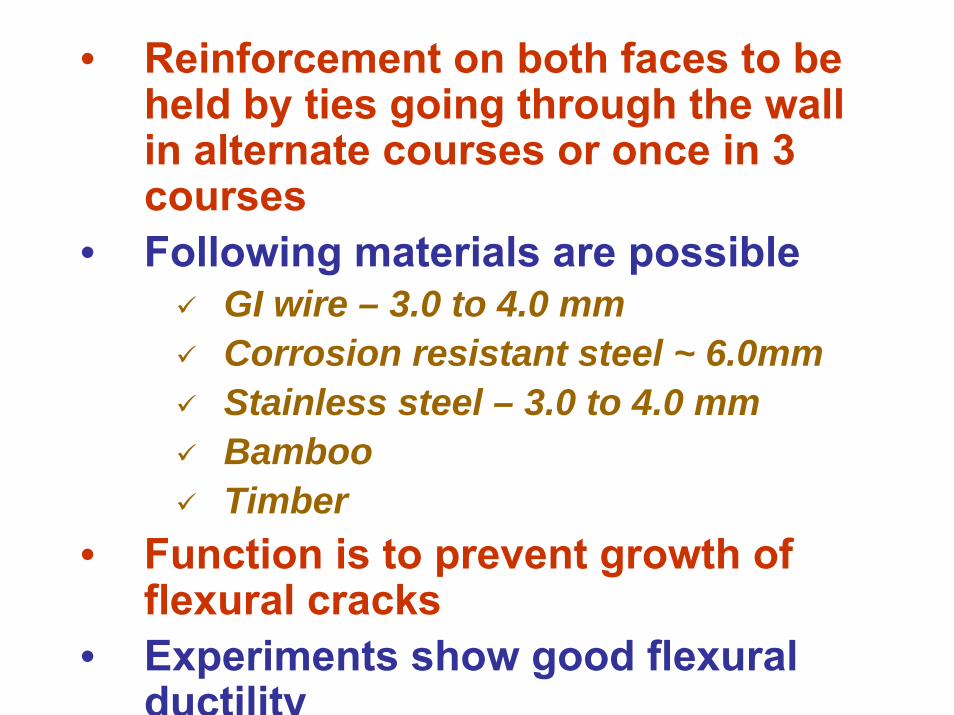
• Reinforcement on both faces to be held by ties going through the wall in alternate courses or once in 3 courses
• Following materials are possibleGI wire – 3.0 to 4.0 mmCorrosion resistant steel ~ 6.0mmStainless steel – 3.0 to 4.0 mmBambooTimber
• Function is to prevent growth of flexural cracks
• Experiments show good flexural ductility
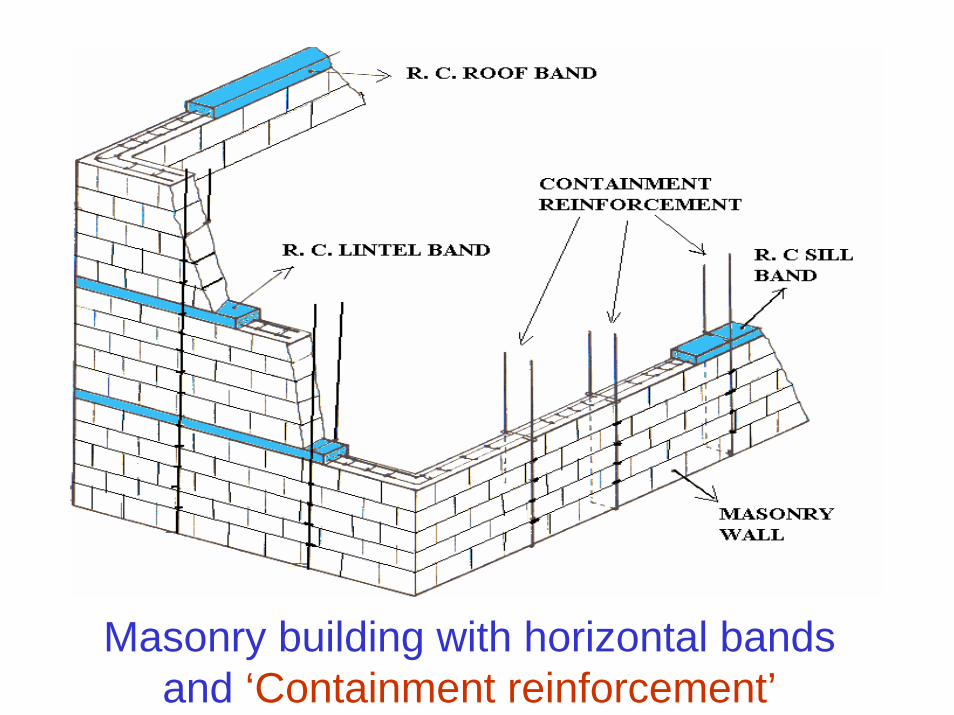
Masonry building with horizontal bands and ‘Containment reinforcement’
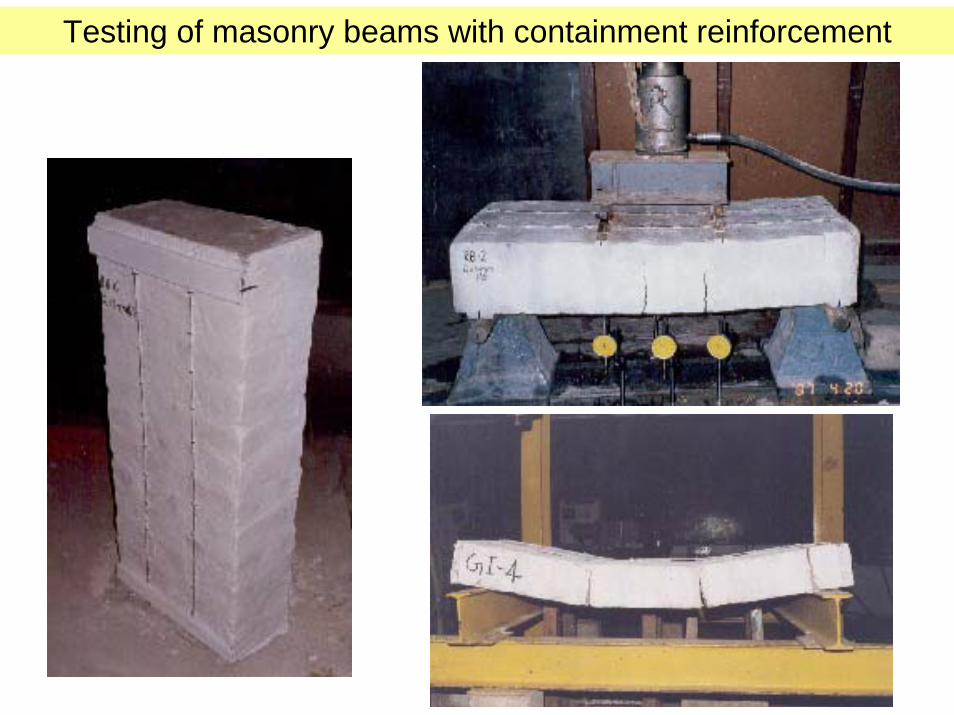
Testing of masonry beams with containment reinforcement
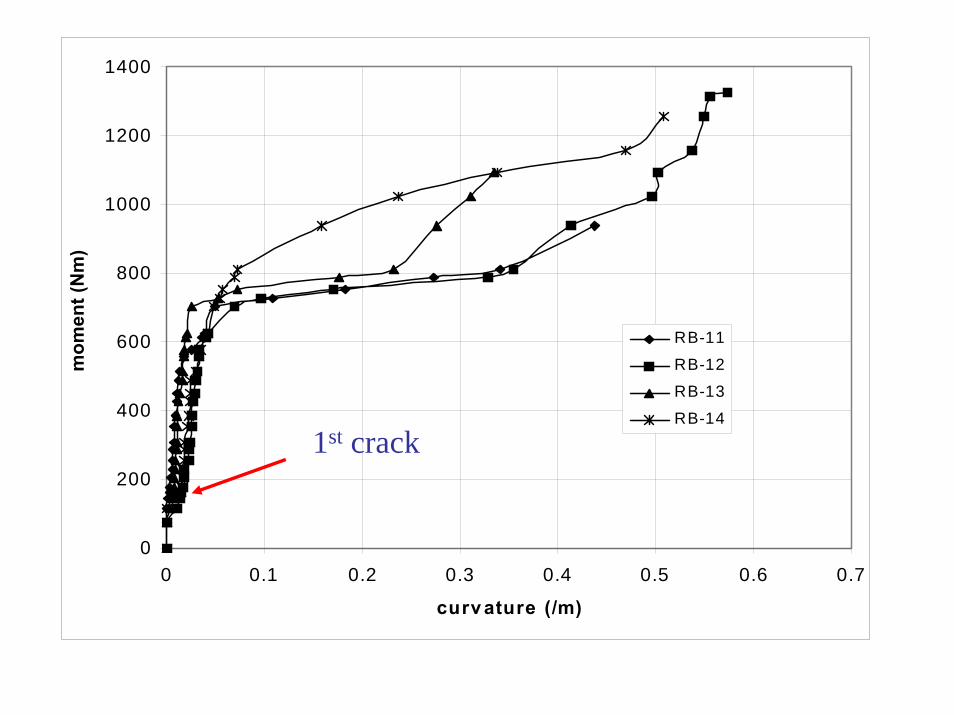
0
200
400
600
800
1000
1200
1400
0 0.1 0.2 0.3 0.4 0.5 0.6 0.7
curv ature (/m)
mom
ent (
Nm
)
RB-11
RB-12RB-13
RB-14
1st crack
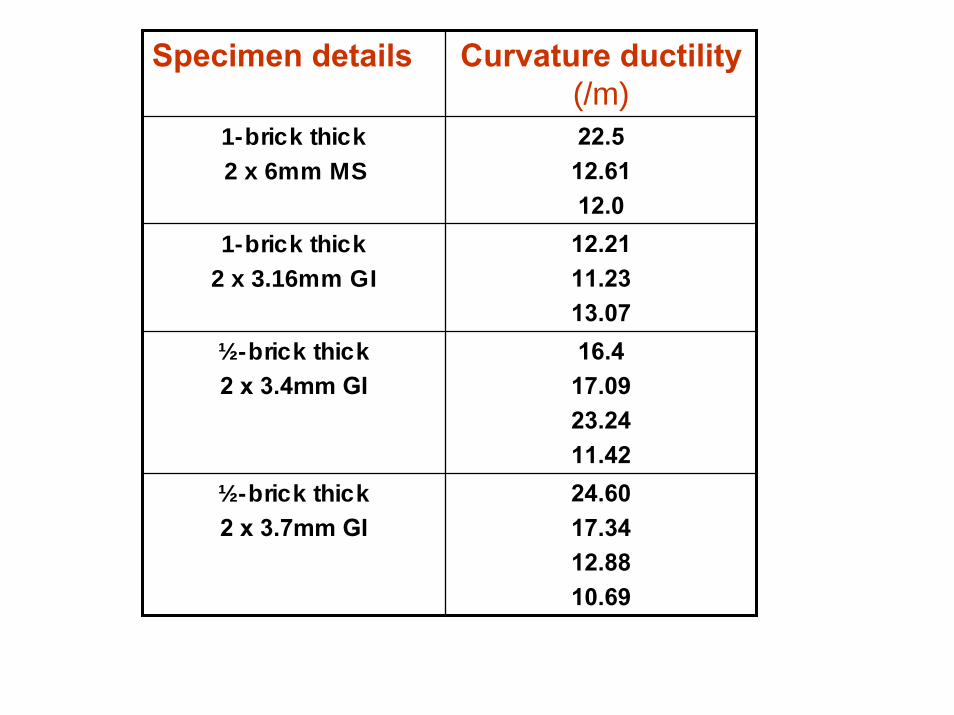
Specimen details Curvature ductility(/m)
1-brick thick2 x 6mm MS
22.512.6112.0
1-brick thick2 x 3.16mm GI
12.2111.2313.0716.4
17.0923.2411.4224.6017.3412.8810.69
½-brick thick2 x 3.4mm GI
½-brick thick2 x 3.7mm GI
Shock table testing
• Quick evaluation of earthquake resistant features using simple impacts
• Developed in 1956 at Roorkee, used at Omerga/Latur for model testing
• Pendulum impact method also developed at I.I.Sc
• Tests at I.I.Sc, Bhuj, BMS College of Engg.
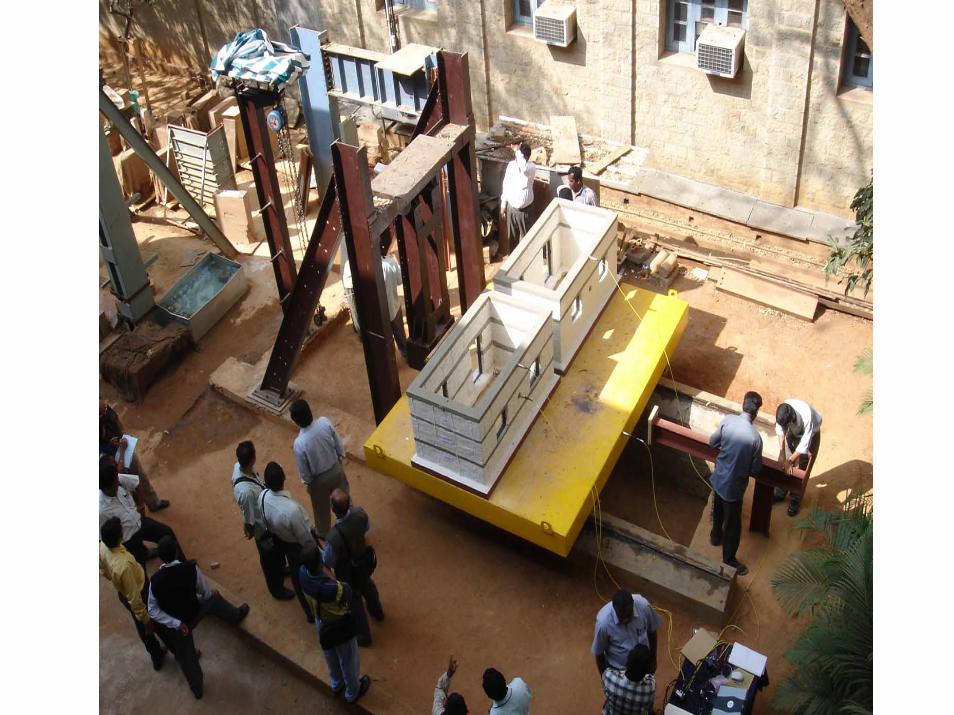
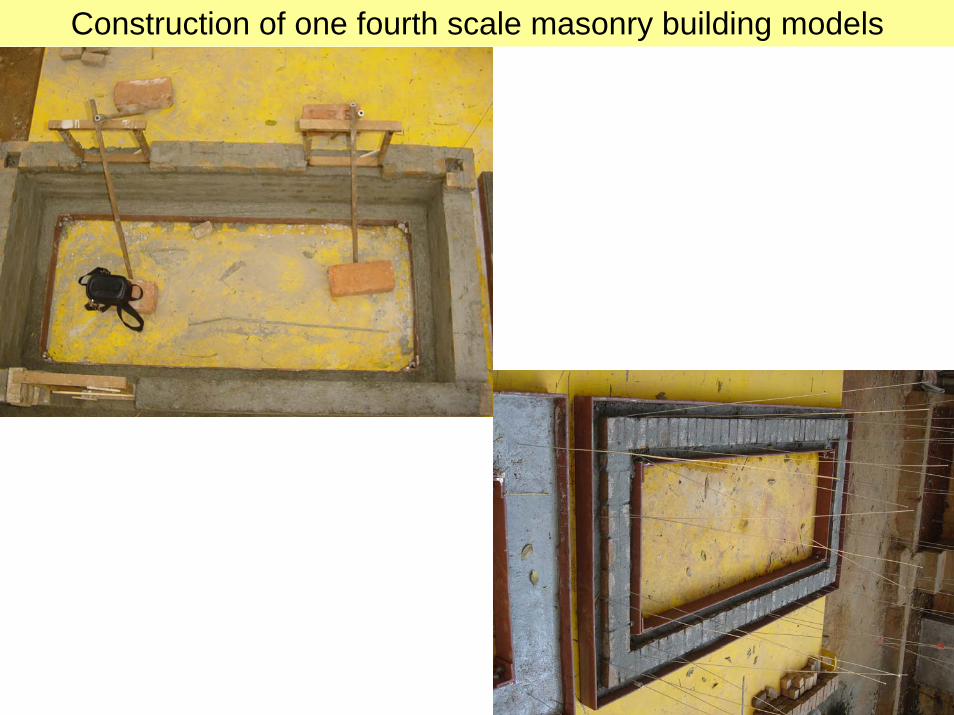
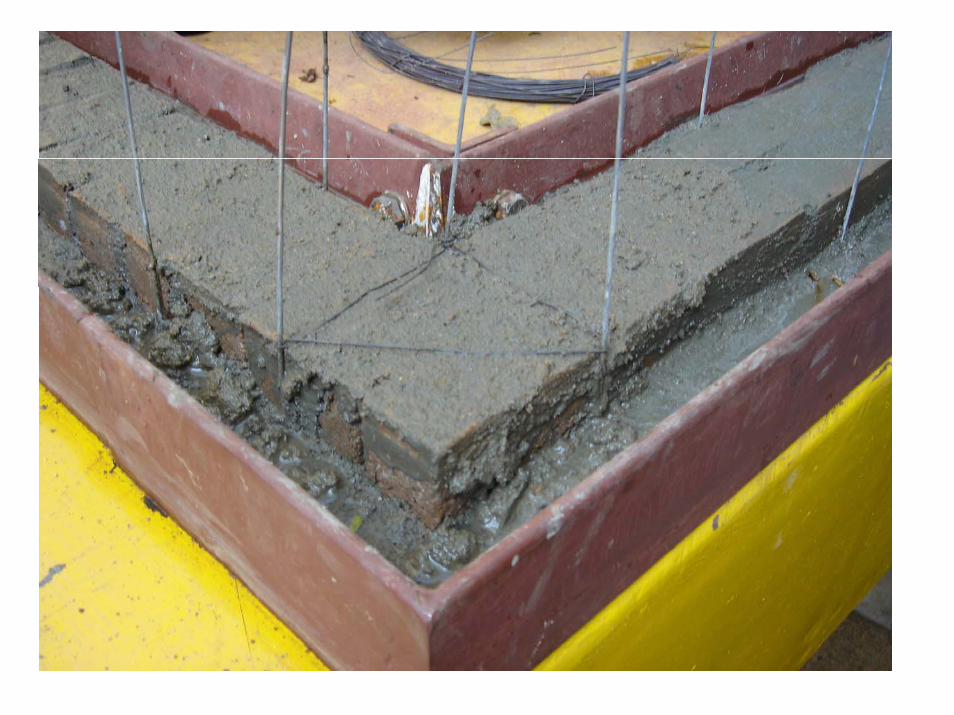
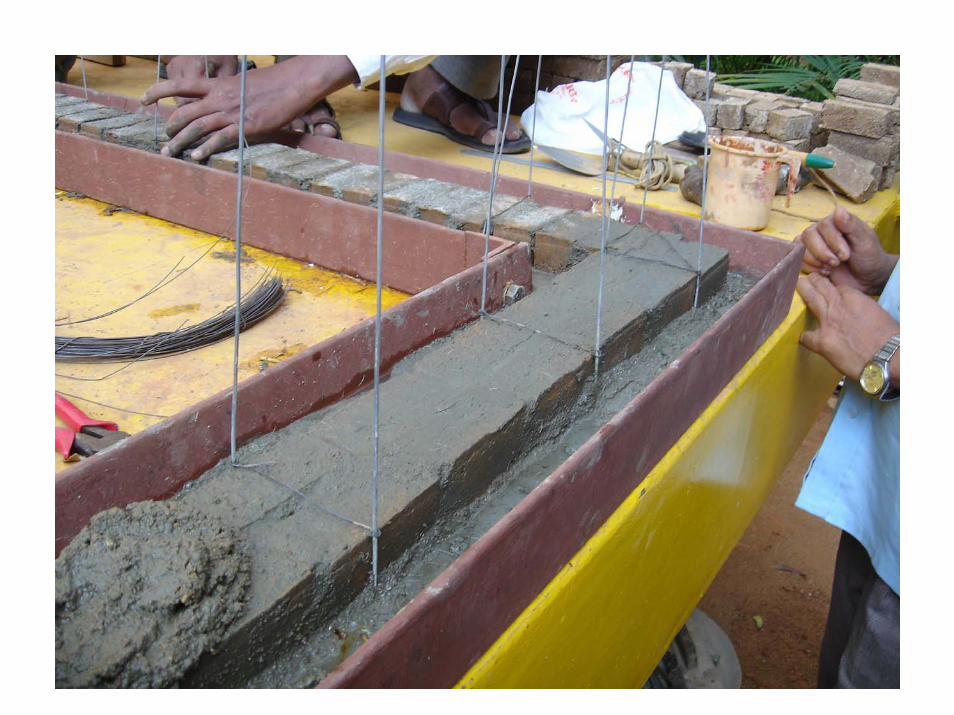
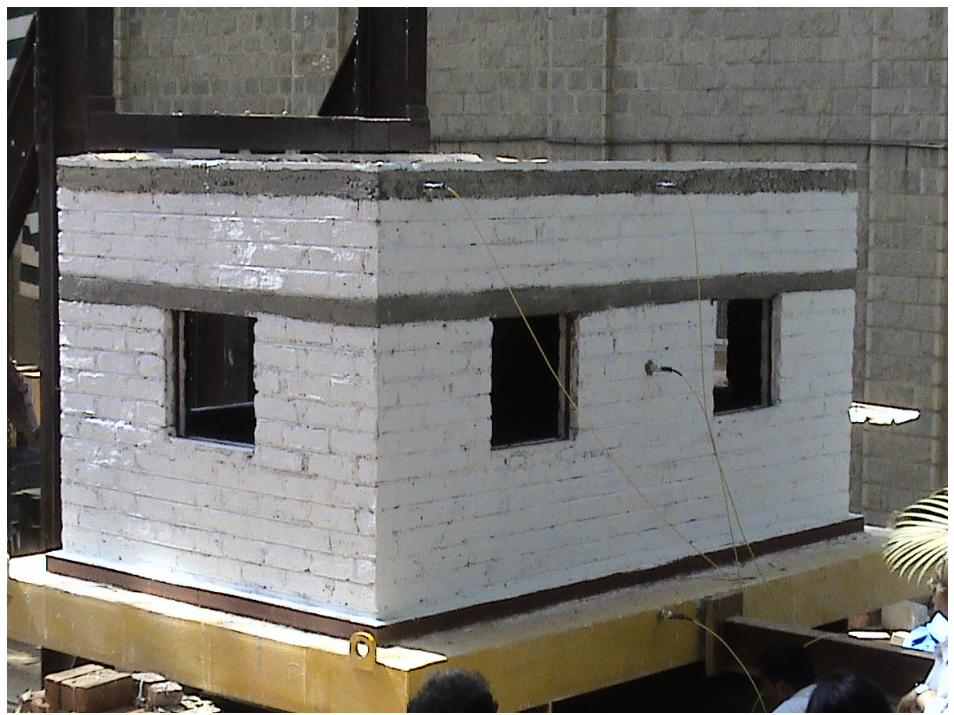
Construction of one fourth scale masonry building models
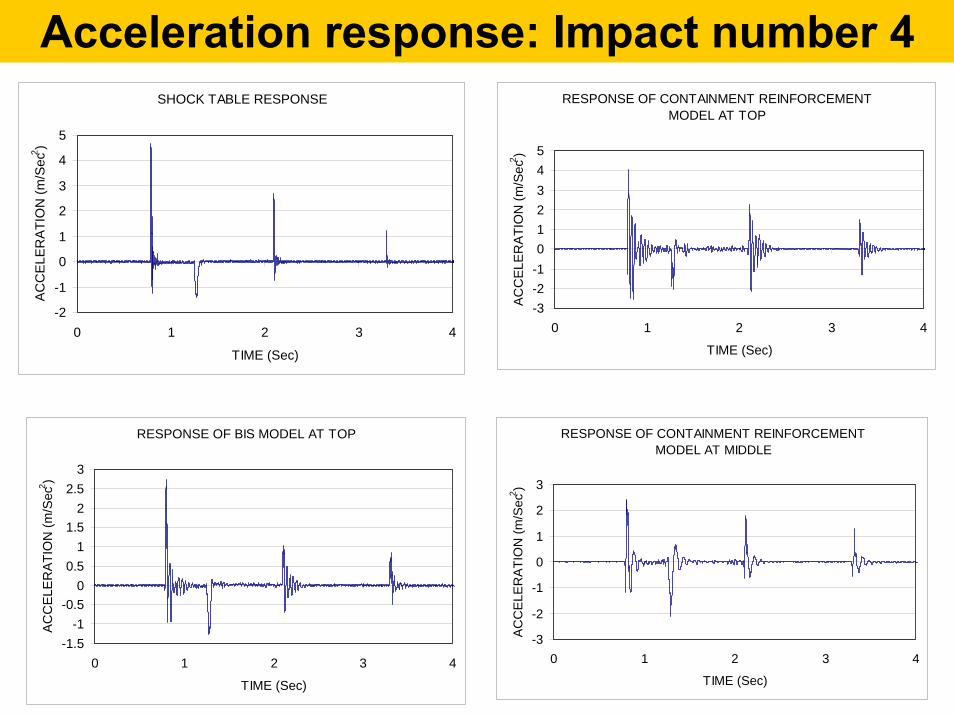
Acceleration response: Impact number 4SHOCK TABLE RESPONSE
-2
-1
0
1
2
3
4
5
0 1 2 3 4
TIME (Sec)
AC
CE
LER
ATI
ON
(m/S
ec2 )
RESPONSE OF CONTAINMENT REINFORCEMENT MODEL AT TOP
-3-2-1012345
0 1 2 3 4
TIME (Sec)
ACC
ELER
ATI
ON
(m/S
ec2 )
RESPONSE OF BIS MODEL AT TOP
-1.5-1
-0.50
0.51
1.52
2.53
0 1 2 3 4
TIME (Sec)
AC
CEL
ER
ATIO
N (m
/Sec
2 )
RESPONSE OF CONTAINMENT REINFORCEMENT MODEL AT MIDDLE
-3
-2
-1
0
1
2
3
0 1 2 3 4
TIME (Sec)
AC
CE
LER
ATI
ON
(m/S
ec2 )
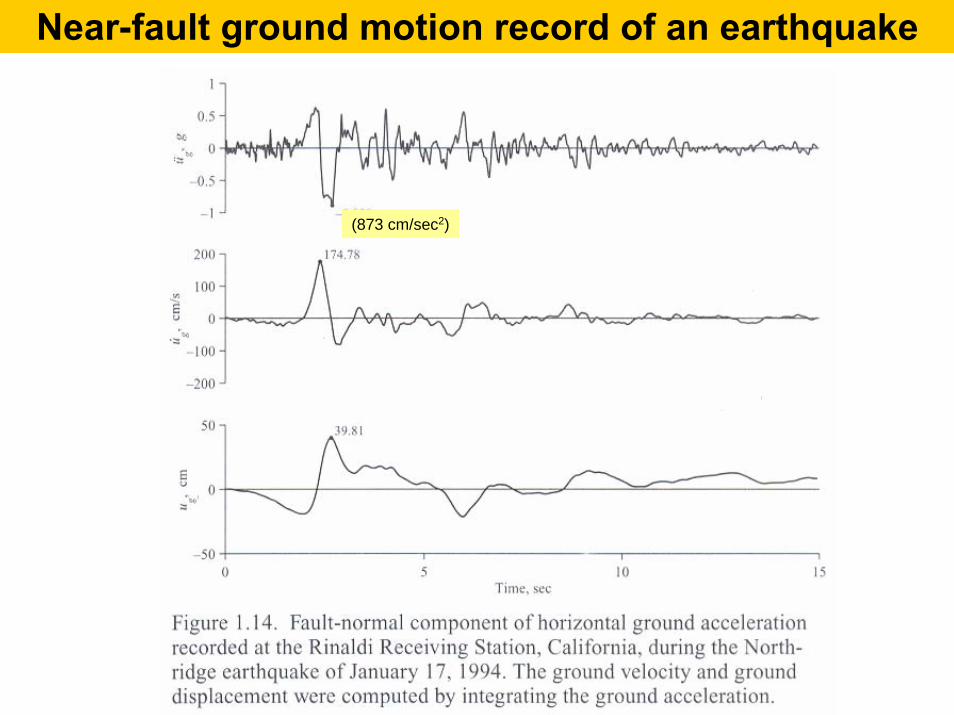
(873 cm/sec2)
Near-fault ground motion record of an earthquake
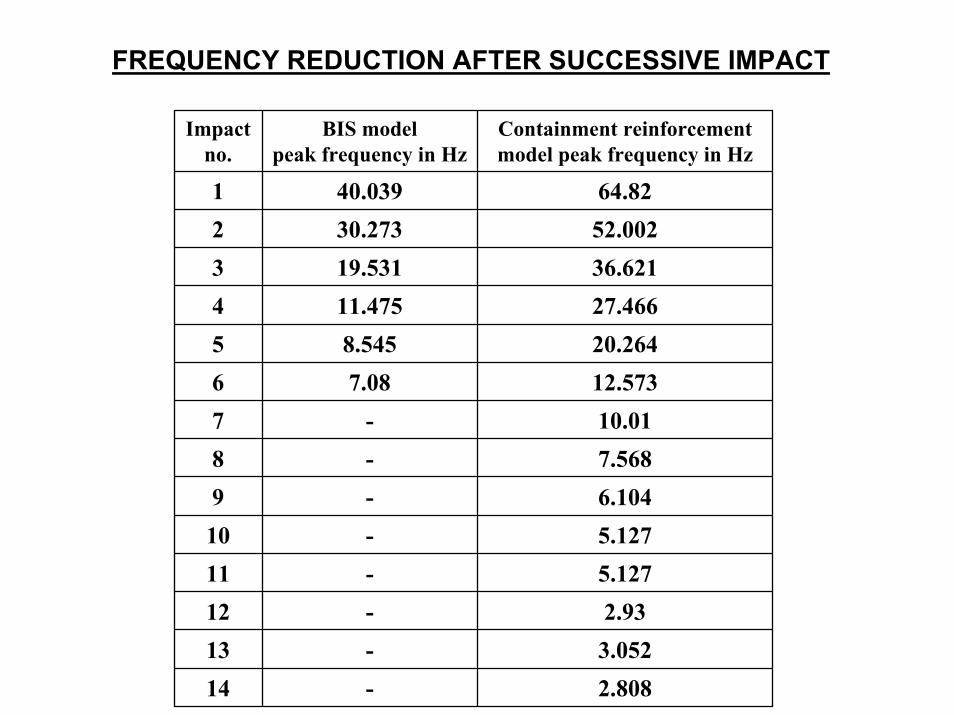
FREQUENCY REDUCTION AFTER SUCCESSIVE IMPACT
Impact no.
BIS modelpeak frequency in Hz
Containment reinforcement model peak frequency in Hz
1 40.039 64.822 30.273 52.0023 19.531 36.6214 11.475 27.4665 8.545 20.2646 7.08 12.5737 - 10.018 - 7.5689 - 6.10410 - 5.12711 - 5.12712 - 2.9313 - 3.05214 - 2.808
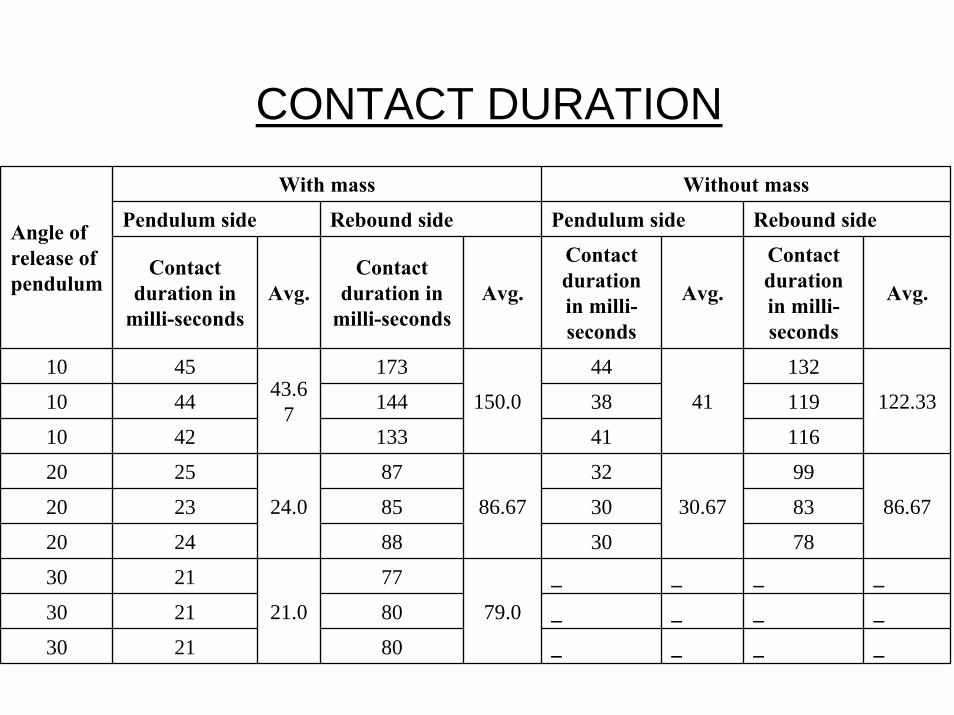
CONTACT DURATIONWith mass Without mass
Pendulum side Rebound side Pendulum side Rebound side
Contact duration in
milli-secondsAvg.
Contact duration in
milli-secondsAvg.
Contact duration in milli-seconds
Avg.
Contact duration in milli-seconds
Avg.
10 45 173 44 132
10 44 144 38 119
10 42 133 41 116
20 25 87 32 99
20 23 85 30 83
20 24 88 30 78
30 21 77 _ _ _ _
30 21 80 _ _ _ _
30 21 80 _ _ _ _
79.021.0
86.6730.6786.6724.0
122.3341150.043.67
Angle of release of pendulum
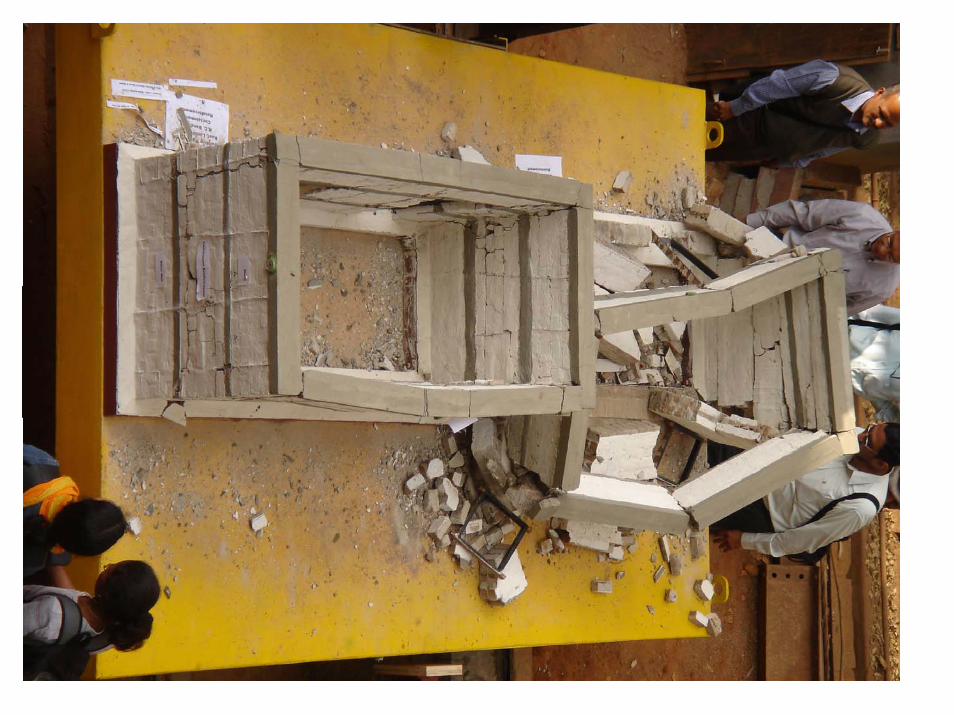
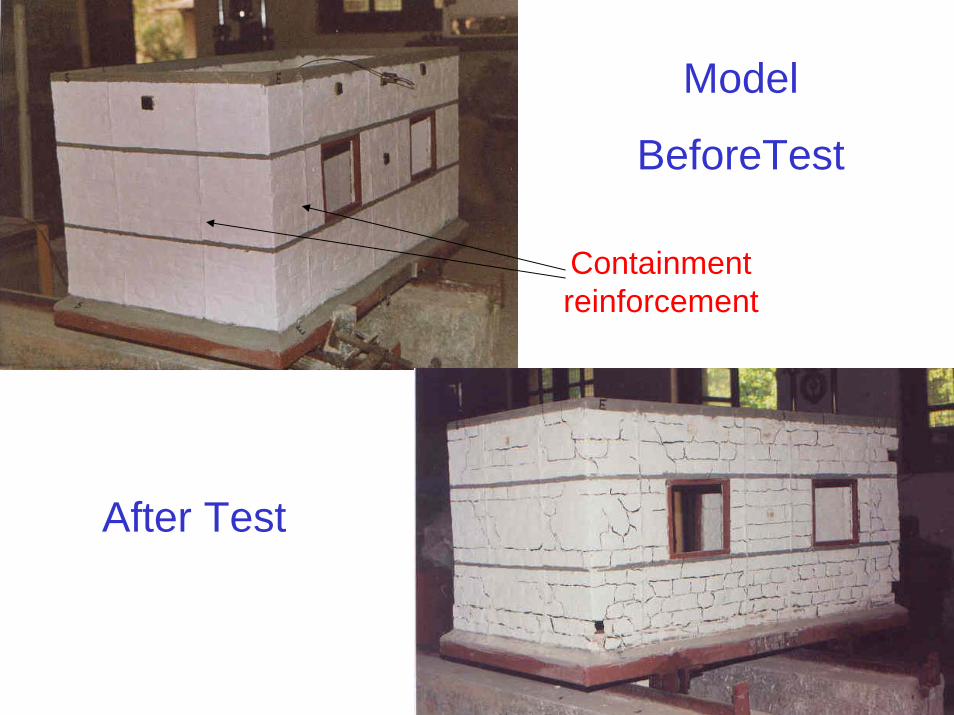
Model
BeforeTest
Containment reinforcement
After Test
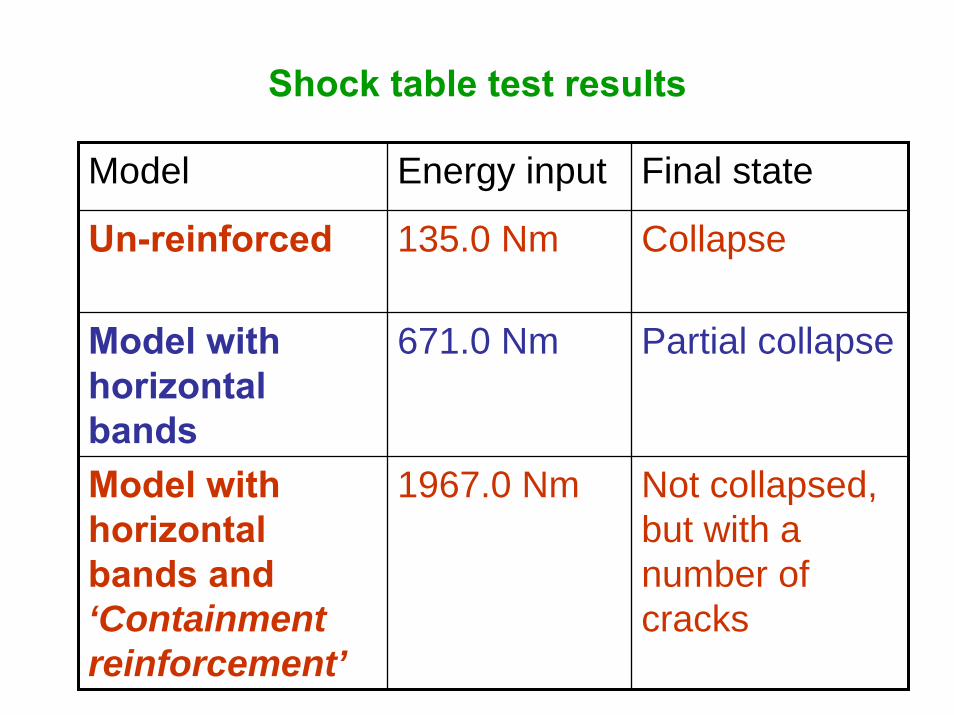
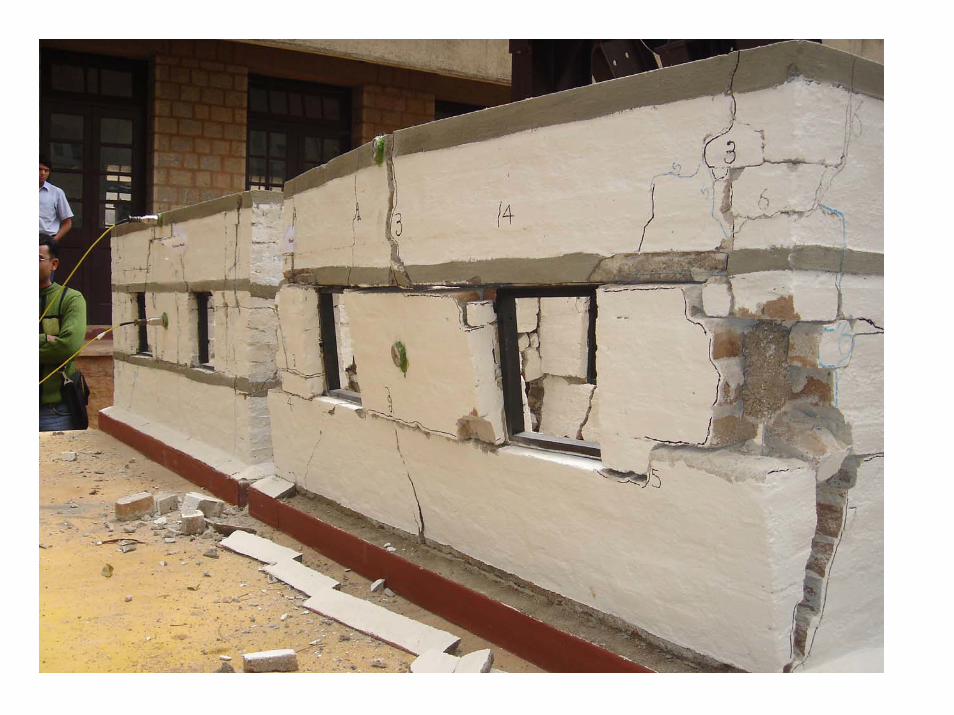
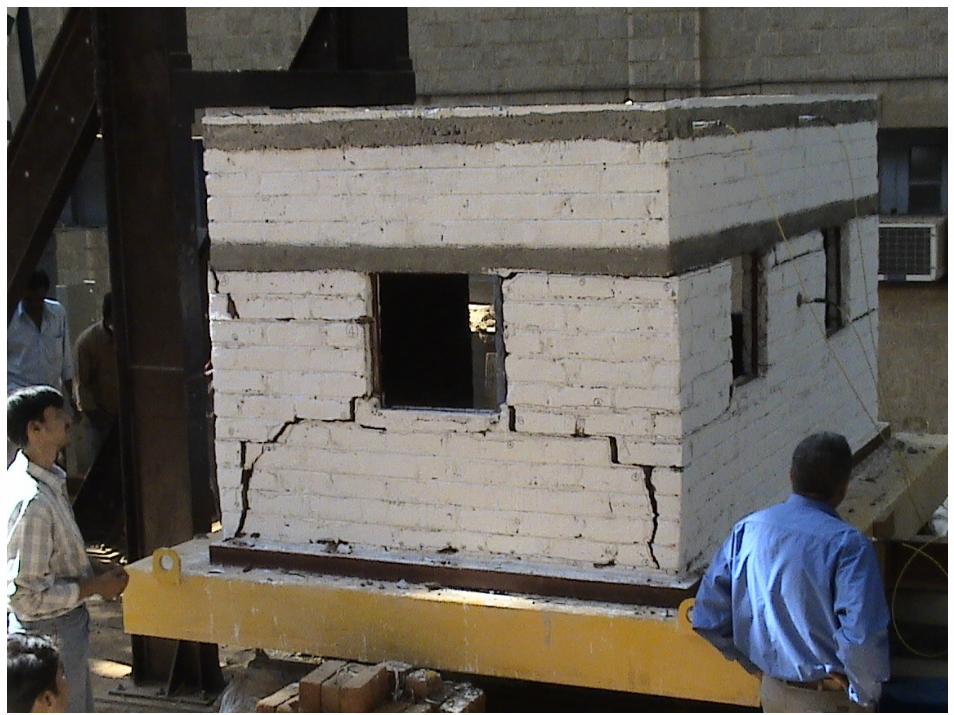
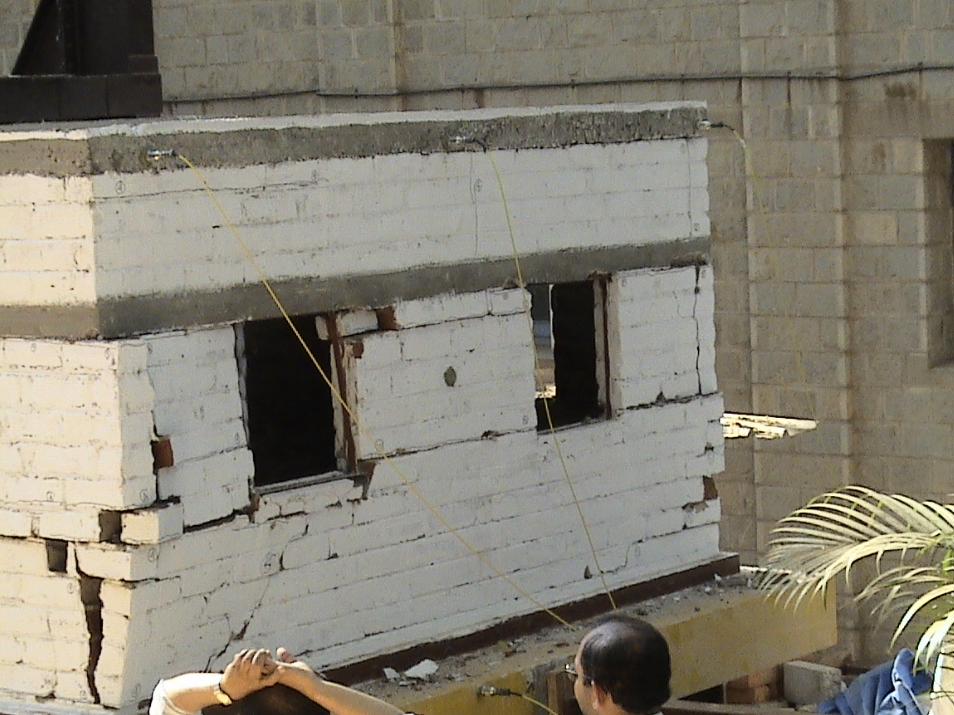
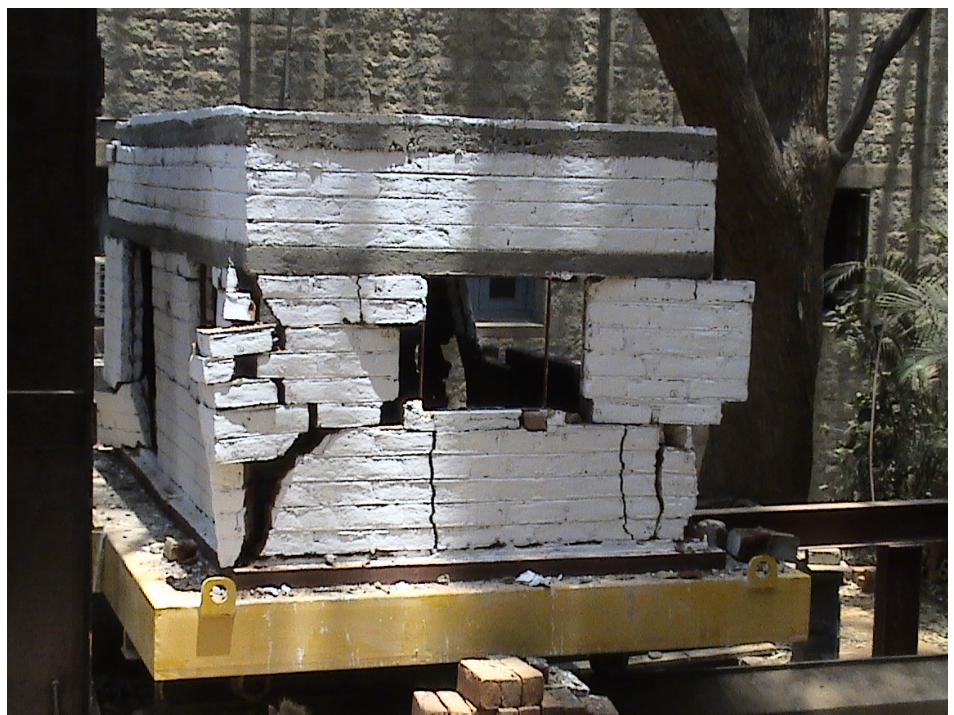
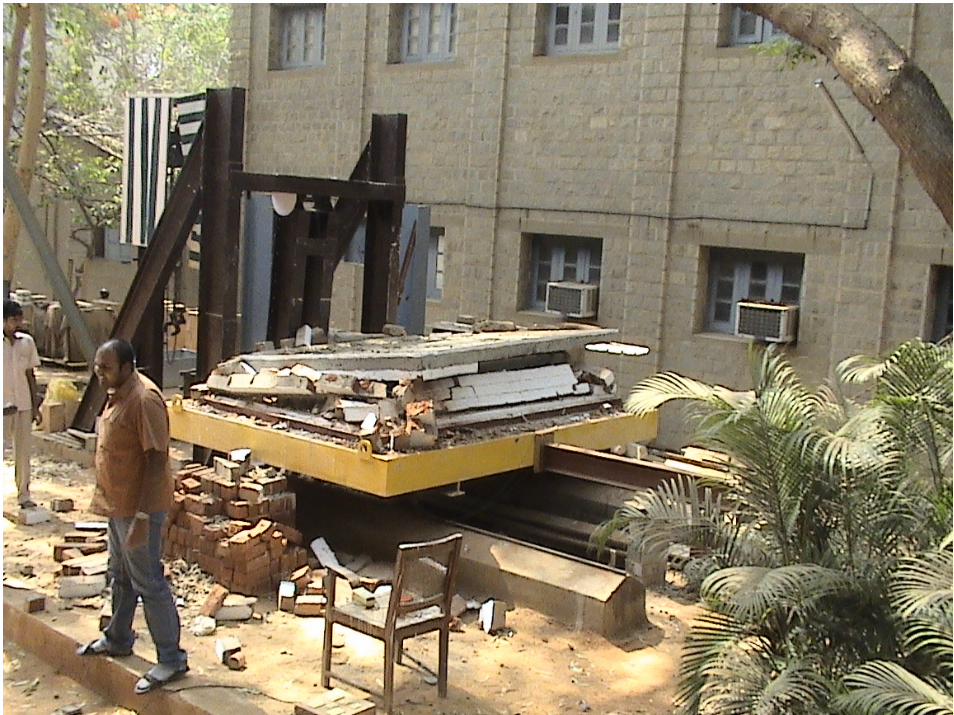
Shock table test results
Model Energy input Final state
Un-reinforced 135.0 Nm Collapse
Model with horizontal bands
671.0 Nm Partial collapse
Model with horizontal bands and ‘Containment reinforcement’
1967.0 Nm Not collapsed, but with a number of cracks
Our sincere thanks to
1.Shanthakumar2.Arogiaswamy3.Vasudevan4.Sagairaju5.Raghavendra6.Muniraju
and all others who have directly or indirectly helped us in conducting the experimental
investigations

THANK YOU