Embed Size (px)
Citation preview


Conclusion
Rich become richer
Why?
Because r>g

Rate of return vs. growth rate at the world level, from Antiquity until 2100
The rate of return to capital (pre-tax) has always been higher than the world output growth rate.

Example
The Pure Return on University Endowments
From tens of millions to tens of billions:
-Harvard about $30 billion, Yale $20 billion;
-North Iowa Community College $11.5 million.
US universities owned nearly $400 billion worth of
assets (this is less than 1 % of the total private wealth
of US households).
*US universities publish regular, reliable, and detailed reports on their endowments

*Between 1980 and 2010, U.S. universities earned an average real return of 8.2 % on theircapital endowments, and all the more so for higher endowments. All returns reported hereare net of inflation (2.4% per year between 1980 and 2010) and of all administrative costsand financial fees .
The pure return on universities endowments

Example The Pure Return on University Endowments
For the top trio (Harvard, Yale, and Princeton), which has not
changed since 1980, the yield was 10.2 % in 1980–2010 (and
10.0 % in 1990–2010), twice as much as the less well-endowed
institutions
For the 60 universities with endowments of more than
$1 billion, the average return was 8.8 % in 1980–2010 (and
7.8 % in 1990–2010)
For the 500 of 850 universities whose endowment was less
than $100million, the average return was 6.2 % in 1980–2010
(and 5.1 % in 1990–2010)

Why?
Because of
“Alternative investment strategies”

What is it? Alternative investment strategies is
very high yield investments such as shares in private equity funds and unlisted foreign stocks (which require great expertise), hedge funds, derivatives, real estate, and raw materials, including energy, natural resources, and related products.
Government bonds, especially US Treasuries, which do not pay
well (3-4%), account for less than 10 percent of all these
portfolios and are almost totally absent from the largest
endowments.

Example Alternative investments in portfolios:
1. Endowments less than 50 million euros: 10%
2. Between 50 and 100 million euros: 25%
3. Between 100 and 500 million euros: 35%
4. Between 500 million and 1 billion euros: 45%
5. Above 1 billion euros: more than 60%
Alternative investment strategy allows obtain real returns of close
to 10 percent per year for the very largest endowments, while
smaller endowments can have only 5 percent.
*Harvard spends nearly $100 million a year to pay a team of top-notch portfolio
managers capable of identifying the best investment opportunities around the world.
So…
These results illustrate clear and concrete way how large initial endowments can give rise to
better returns and thus to substantial inequalities in returns
on capital.
What Is the Effect of Inflation on Inequality of Returns to Capital?
Some people think wrongly, that inflation reduces the average
return on capital.

Why wrongly?
Because of
“Pile of money + inflation = 0”
But“Capital + inflation = Capital”

Example
When inflation exists, anyone who is content to perch
on a pile of banknotes will see that pile melt away
before his eyes, leaving him with nothing even if wealth
is untaxed.

But It is enough to invest one’s wealth in real assets, such as
real estate or shares of stock, in order to escape the
inflation tax entirely.
Why? Because if we imagine that the average return on capital is 5
percent (r = 5%) and inflation in this country increases from 0 to 2
percent a year. Is it really true that the average return on capital will
then decrease from 5 percent to 3? Obviously not.
If consumer prices rise by 2 percent a year, then it is probable that
asset prices will also increase by 2 percent a year on average. There
will be no capital gains or losses, and the return on capital will still
be 5 percent.

Sovereign Wealth Fund (SWF) A Sovereign Wealth Fund (SWF) is a state-owned investment fund investing in real and financial assets such as stocks, bonds, real estate, precious metals, or in alternative investments such as private equity fund or hedge funds.
Sovereign wealth funds invest globally.
SWFs are typically created when governments have budgetary surpluses and have little or no international debt especially in the case when a nation depends on raw material exports like oil, copper or diamonds.
There are two types of funds: saving funds and stabilization funds. Savings SWFs build up savings for future generations. One such fund is the Government Pension Fund of Norway.
*http://www.swfinstitute.org/sovereign-wealth-fund/

There are several reasons why the growth of Sovereign Wealth Funds is attracting close attention.
Some countries worry that foreign investment by SWFs raises national security concerns because the purpose of the investment might be to secure control of strategically important industries for political rather than financial gain.From the start of 2008 till the end of 2012, Sovereign Wealth Fund assets grew by 59.1% to a record $5.78 trillion.
*About $3.2 trillion belongs to the funds of petroleum exporting states (including
the smaller funds of Dubai, Libya, Kazakhstan, Algeria, Iran, Azerbaijan, Brunei, Oman, and many others), and approximately $2.1 trillion to funds of non-petroleum states (primarily China, Hong Kong, Singapore, and many smaller funds)
**Billionaires today own roughly 1.5 %of the world’s total private wealth, and sovereign wealth funds own another 1.5 %

Sovereign Wealth Fund Rankings
*http://www.swfinstitute.org/fund-rankings/
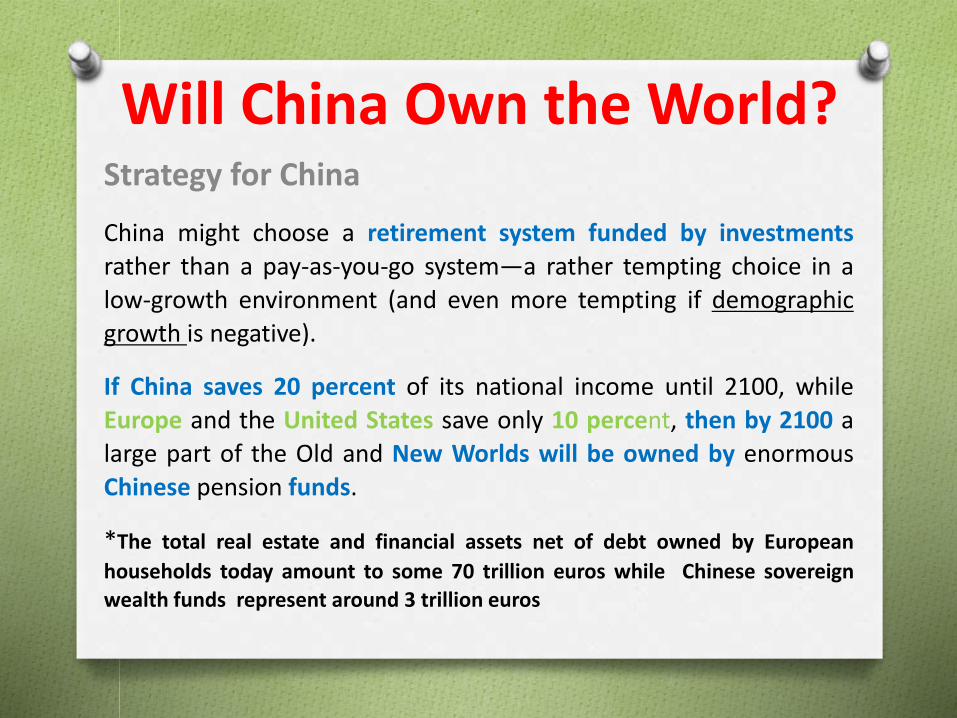
Will China Own the World? Strategy for China
China might choose a retirement system funded by investments
rather than a pay-as-you-go system—a rather tempting choice in a
low-growth environment (and even more tempting if demographic
growth is negative).
If China saves 20 percent of its national income until 2100, while
Europe and the United States save only 10 percent, then by 2100 a
large part of the Old and New Worlds will be owned by enormous
Chinese pension funds.
*The total real estate and financial assets net of debt owned by European
households today amount to some 70 trillion euros while Chinese sovereign
wealth funds represent around 3 trillion euros

The distribution of world capital 1870-2100

Addition information The net foreign asset positions of rich countries
*Unregistered financial assets held in tax havens are higher than the official net foreign debt of rich countries
It seems, in other words, that Earth must be owned by Mars
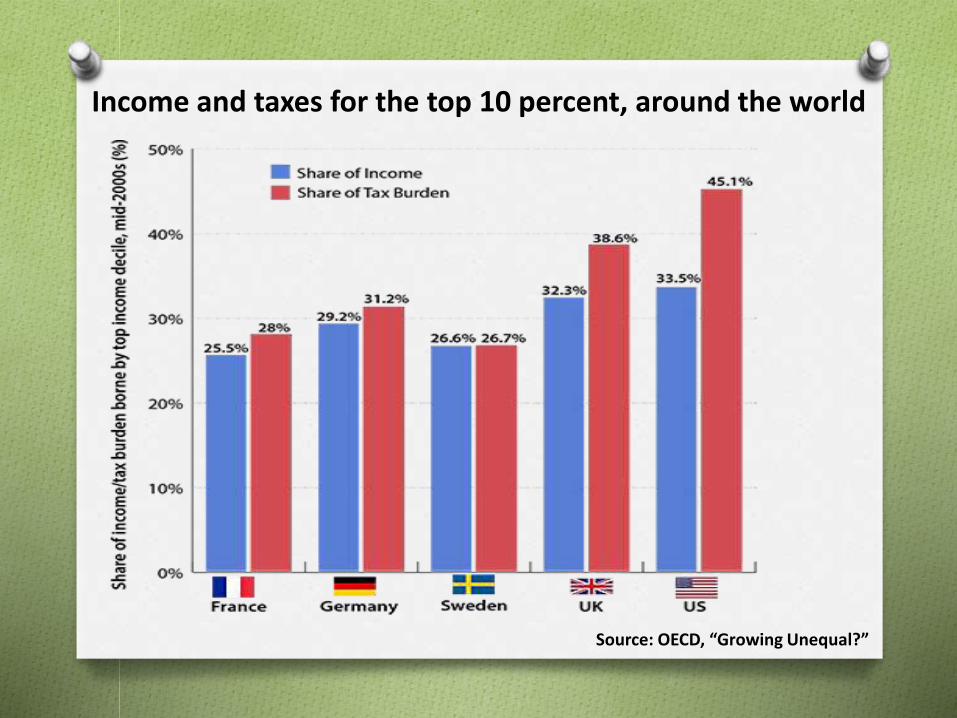
Income and taxes for the top 10 percent, around the world
Source: OECD, “Growing Unequal?”

Reduction in inequality due to taxes and transfers
Source: OECD, “Growing Unequal?”

ConclusionsThe history of income and wealth inequality is always
political, chaotic and unpredictable; it involves national
identities and sharp reversals; nobody can predict the
reversals of the future.
The ideal solution: progressive wealth tax at the global
scale, based upon automatic exchange of bank
information.
Other solutions involve authoritarian political & capital
controls (China, Russia..), or perpetual population
growth (US), or inflation, or some mix of all.


![⃝thomas piketty] l'economie des inegalites](https://img.dokumen.tips/doc/110x75/568caa371a28ab186da0aee2/thomas-piketty-leconomie-des-inegalites-5705f532a9015.jpg)


