Embed Size (px)
DESCRIPTION
The purpose of this study is to provide an overview of fiscal policies and PFM reforms in 7 countries in the Western Balkans and 12 countries in the CIS, including major macroeconomic and poverty trends, fiscal policy, the size and role of the public sector, public expenditure management and its linkage to policy development, the organization of budget processes on the central and local levels, the role of various actors and tools in PFM, including civil society and the international donor community. The period of 2003-2007 was characterized by an extraordinary high rate of economic growth, both worldwide and in the CEE/CIS region. This created macroeconomic room for meeting numerous development challenges: reducing poverty and inequality, improving the quality and coverage of public services, upgrading infrastructure, and advancing various reforms, including those related to PFM. However, the economic situation deteriorated dramatically in 2008 as a result of the global financial crisis, with deep recession hitting most of the countries in 2009 and bleak perspectives for subsequent years. It remains to be seen whether the crisis situation will force governments to speed up necessary reforms. In the PFM area major tasks concern lengthening fiscal planning horizon and gradual movement toward performance oriented budgeting (the measure which can allow better expenditure targeting and decrease volatility in expenditure allocation), increasing budget transparency and creating real room for civil society involvement into a budget process. However, the reforms must also involve a broadly defined governance sphere, i.e. improving transparency and accountability of government, modernization of civil service, decentralization, including building a genuine system of local and regional self-government, and other similar measures to improve quality of public services and social policy interventions. Authored by: Branka Andjelkovic, Alexander Chubrik, Marek Dabrowski, Roman Mogilevsky, Irina Sinitsina, Przemyslaw Wozniak Published in 2010 Published 2010
Citation preview


The views and opinions expressed here reflect the authors’ point of view and not necessarily those of CASE Network.
The study has been prepared under the Agreement SSA/SWZK/2008/00000732-2 between the UNICEF Regional Office for CEE/CIS and CASE and is going to serve as a practical guide for UNICEF's engagement in the region. It is published in CASE Network Report series with permission of UNICEF.
Publication was financed from the CASE Academic Excellence Program.
Keywords: public finance management, fiscal policy, Central and Eastern Europe, Western Balkans, Commonwealth of Independent States, social poli-cies, social services, children and families
JEL codes: H51, H52, H53, H61, H62, H63, H77, P36 © CASE – Center for Social and Economic Research, Warsaw, 2010 Graphic Design: Agnieszka Natalia Bury ISBN 9788371785115 Publisher: CASE-Center for Social and Economic Research on behalf of CASE Network 12 Sienkiewicza, 00-010 Warsaw, Poland tel.: (48 22) 622 66 27, fax: (48 22) 828 60 69 e-mail: [email protected] http://www.case-research.eu

The CASE Network is a group of economic and social research centers in Po-land, Kyrgyzstan, Ukraine, Georgia, Moldova, and Belarus. Organizations in the network regularly conduct joint research and advisory projects. The research cov-ers a wide spectrum of economic and social issues, including economic effects of the European integration process, economic relations between the EU and CIS, monetary policy and euro-accession, innovation and competitiveness, and labour markets and social policy. The network aims to increase the range and quality of economic research and information available to policy-makers and civil society, and takes an active role in on-going debates on how to meet the economic chal-lenges facing the EU, post-transition countries and the global economy.
The CASE network consists of:
• CASE – Center for Social and Economic Research, Warsaw, est. 1991, www.case-research.eu
• CASE – Center for Social and Economic Research – Kyrgyzstan,
est. 1998, www.case.elcat.kg
• Center for Social and Economic Research – CASE Ukraine, est. 1999, www.case-ukraine.kiev.ua
• CASE –Transcaucasus Center for Social and Economic Research,
est. 2000, www.case-transcaucasus.org.ge
• Foundation for Social and Economic Research CASE Moldova, est. 2003, www.case.com.md
• CASE Belarus – Center for Social and Economic Research Belarus,
est. 2007.

Marek Dabrowski (Ed.), Roman Mogilevskiy (Ed.)
CASE Network Reports No. 92 4
Contents
1. Introductory Remarks .................................................................................... 23
2. Basic Characteristics of the Region and Criteria for Country Grouping .. 27 2.1. Geographical location............................................................................... 27 2.2. Resource endowment................................................................................ 28 2.3. Institutional heritage ................................................................................. 28 2.4. Armed conflicts and internal unrest.......................................................... 30 2.5. Transition progress and political systems................................................. 30 2.6. Income grouping and level of human development ................................. 31 2.7. Linkages between groups ......................................................................... 33 2.8. Potential influence of the relations with the EU....................................... 34 2.9. Conclusions .............................................................................................. 35
3. Macroeconomic and Structural Determinants of Public Finance............... 37 3.1. Recent growth performance and growth perspectives.............................. 37 3.2. Poverty and income inequality ................................................................. 39 3.3. Inflation .................................................................................................... 43 3.4. Fiscal deficit and its financing.................................................................. 44 3.5. Public debt ................................................................................................ 47 3.6. Levels and dynamics of total public revenues and expenditures.............. 48 3.7. Structure of public revenues ..................................................................... 50 3.8. Oil and gas related revenues ..................................................................... 55
4. Structure and Dynamics of Public Expenditures ......................................... 58 4.1. Structure of expenditures by sector .......................................................... 58 4.2. Public spending on education, health, social protection, water and utilities and intra-sectoral expenditure structure ............................................................ 63
4.2.1. Health ................................................................................................ 63 4.2.2. Education .......................................................................................... 68 4.2.3. Intra-sector structure of expenditures (education and healthcare) .... 71 4.2.4. Social protection ............................................................................... 73 4.2.5. Public spending on water and utilities .............................................. 76
4.3. Social spending vs. service coverage and quality indicators .................... 77 4.3.1. Literature findings on the efficiency and effectiveness of spending. 77 4.3.2. Assessing the sufficiency and effectiveness of public spending....... 79 4.3.3. Achieving Millennium Development Goals ..................................... 83
5. Budget Systems ................................................................................................ 85 5.1. Organization of government budgets........................................................ 85 5.2. Central government budget ...................................................................... 86 5.3. Local government budgets........................................................................ 90 5.4. Quasi-Fiscal Operations of Governments................................................. 95

CHALLENGES AND TRAJECTORIES OF FISCAL POLICY AND PFM REFORM…
CASE Network Reports No. 92 5
5.5. Budget processes .......................................................................................97 5.6. Policy frameworks...................................................................................105 5.7. Budget reporting systems and transparency ............................................111 5.8. Participation of civil society in national budget processes......................113
6. Donors’ Instruments in PFM Reforms.........................................................117 6.1. Overview of Key Donor Instruments ......................................................117 6.2. Direct Budget Support.............................................................................119 6.3. Debt Relief Operations ............................................................................122 6.4. Investment Operations.............................................................................124 6.5. PFM-Related Conditionality ...................................................................127 6.6. Technical Assistance in PFM Issues .......................................................130 6.7. Donor Coordination in the PFM Sphere..................................................133
7. Concluding remarks.......................................................................................136
References ...........................................................................................................143
Statistical Annex .................................................................................................149

Marek Dabrowski (Ed.), Roman Mogilevskiy (Ed.)
CASE Network Reports No. 92 6
List of Tables, Figures and Boxes
Table 2.1. Natural resource endowment ................................................................ 29 Table 2.2. Market reforms and political systems................................................... 31 Table 2.3. Level of development ........................................................................... 32 Table 2.4. Western Balkans (subject to the Stabilization and Association process) .............................................................................................. 34 Table 2.5. ENP countries ....................................................................................... 35 Table 3.1. GDP at constant prices (national currency), annual percent changes... 37 Figure 3.1. Inequality indicators............................................................................ 42 Table 3.2. Consumer price index, annual growth rate, end of period.................... 43 Table 3.3. GG cash surplus/deficit, per cent of GDP (GFS data).......................... 45 Figure 3.2. GG budget balance, % of GDP (sources other than GFS) .................. 46 Figure 3.3. Total gross public debt, in % of GDP ................................................. 47 Figure 3.4. GG expenditures and revenues (2006), % of GDP ............................. 49 Figure 3.5. GG expenditure as % of GDP (sources other than GFS) .................... 49 Table 3.4. Structure of GG revenue (on the basis of government operations) ...... 51 Table 3.5. Structure of tax revenues in per cent of GDP (latest year available).... 52 Table 3.6. Labor Taxes in CIS and Western Balkans, 2006.................................. 53 Box 3.1. Examples of social security reforms ....................................................... 54 Table 3.7. Oil exporters: GG oil revenue, % of GDP and total revenue. GG non-oil fiscal balance (% of non-oil GDP) ..................................................... 56 Box 4.1. Data constraints in expenditure analysis ................................................. 59 Table 4.1. Total and GG expenditures on health ................................................... 64 Table 4.2. Per capita total expenditure on health (PPP international dollars) ....... 66 Table 4.3. Expenditures on health, rates of growth (in %) .................................... 66 Table 4.4. Public expenditure on education........................................................... 69 Table 4.5. Student-teacher ratio in primary and secondary general education ...... 70 Box 4.2. Definition of major healthcare services .................................................. 72 Table 4.6. GG expenditure structure of social benefits (% of the total) ................ 73 Figure 5.1. Organization of government budgets .................................................. 86 Figure 5.2. Structure of central government revenues, 2006................................. 87

CHALLENGES AND TRAJECTORIES OF FISCAL POLICY AND PFM REFORM…
CASE Network Reports No. 92 7
Figure 5.3. Structure of GG budget expenditures in selected countries of the region, 2006................................................................................................. 88 Table 5.1. Shares of central government in GG expenditures in 2006, %............. 88 Figure 5.4. Shares of extra-budgetary funds in central government expenditures, 2006................................................................................................. 89 Figure 5.5. Structure of local budget revenues in some countries of the region ... 91 Figure 5.6. Types of intergovernmental grants...................................................... 92 Table 5.2. Quasi-fiscal activities in electricity and gas sectors in 2002, % GDP.. 96 Figure 5.7. Steps in medium-term budget system ............................................... 100 Figure 5.8. Elements of a performance-oriented budgeting system .................... 103 Table 5.3. Poverty reduction strategy papers and national development strategies ........................................................................................ 106 Table 6.1. The World Bank’s income and lending categories............................. 120 Table 6.2. WB DPOs in two last cycles of country programming ...................... 120 Table 6.3. Sector policy support programs.......................................................... 122 Table 6.4. Debt relief received from the Paris Club............................................ 123 Box 6.1. Concessional terms of debt relief.......................................................... 124 Table 6.5. EC support (investment operations, budget support and technical assistance) ............................................................................................ 125 Table 6.6. MCC programs in the region (as of end 2008)................................... 126 Table 6.7. IMF Programs..................................................................................... 128 Table 6.8. PEFA assessment status as of 29 August 2008 .................................. 132 Table 6.9. Selected Paris Declaration indicators for some countries, 2006......... 134 Table A.2.1. Location characteristics .................................................................. 149 Table A.2.2. Institutional heritage ....................................................................... 149 Table A.2.3. Countries affected by armed conflicts and internal unrest ............. 150 Table A.2.4. Correlation between variables ........................................................ 151 Table A.3.1. Poverty under USD 1.25 a day poverty line ................................... 152 Table A.3.2. Poverty at USD 2.15 a day poverty line ......................................... 152 Table A.3.3. Poverty at USD 4.30 a day poverty line ......................................... 153 Table A.3.4. Inequality........................................................................................ 154 Table A.3.5. GG budget balance, % of GDP (sources other than GFS).............. 155 Table A.3.6. Institutional sources of balancing GG net cash flows, % of GDP.. 155 Table A.4.1 GG expenditures by economic type, % GDP .................................. 158 Table A.4.2. GG expenditures by function, % GDP ........................................... 159

Marek Dabrowski (Ed.), Roman Mogilevskiy (Ed.)
CASE Network Reports No. 92 8
Table A.4.3. GG expenditures structure by economic type, % of total expenditures................................................................................................. 161 Table A.4.4. GG expenditures structure by function, % of total expenditures.... 161 Table A.4.5. Components of health care funding ................................................ 162 Table A.4.6. Aid to education.............................................................................. 163 Table A.4.7. Public expenditure per student by level of education, PPP USD ... 165 Table A.4.8. Public expenditures on education, economic classification, % of total ............................................................................................................. 166 Table A.4.9. Structure of health and education expenditures (based on functional classification), in% .............................................................................................. 168 Table A.4.10. Progress towards achievement of Millennium Development Goals - notes.................................................................................. 169 Table A.4.10. Progress towards achievement of Millennium Development Goals ............................................................................................. 170 Figure A.5.1. Shares of different government levels in GG expenditures, 2006. 171 Table A.5.1. PEFA ratings................................................................................... 173 Table A.6.1. PFM-related indicators and targets of the Paris Declaration .......... 176 Table A.6.2. Investment operations of the World Bank, mil. USD..................... 177
CHALLENGES AND TRAJECTORIES OF FISCAL POLICY AND PFM REFORM…
CASE Network Reports No. 92 9
Abbreviations
ADB Asian Development Bank B&H Bosnia and Herzegovina CA Central Asia CAS Country Assistance Strategy CCA Caucasus and Central Asia CDS Country Development Strategy (Kyrgyzstan) CEE Central and Eastern Europe CIS Commonwealth of Independent States CPIA Country Policy and Institutional Assessment CPS Country Partnership Strategy CSO Civil Society Organization(s) DAC Development Assistance Committee DCI Development Cooperation Instrument DFID Department For International Development of the UK DG ECFIN Directorate-General for Economic and Financial Affairs (Euro-
pean Commission) DPO Development Policy Operation DPRS Development And Poverty Reduction Strategy (Montenegro) EBRD European Bank for Reconstruction and Development EC European Commission ECA Europe and Central Asia EDPRP Economic Development and Poverty Reduction Program (Geor-
gia) EFF Extended Fund Facility ENP European Neighborhood Policy ENPI European Neighborhood and Partnership Instrument ESF Exogenous Shocks Facility EU European Union EUR Euro EUROSTAT The Statistical office of the European Communities FBH Federation of Bosnia and Herzegovina FDI Foreign Direct Investment FSP Food Security Program FSRY Federal Socialist Republic of Yugoslavia FSU Former Soviet Union FY Fiscal Year GDP Gross Domestic Project GFS Government Finance Statistics GFSM Government Finance Statistics Manual GG General Government GIR Global Integrity Report

Marek Dabrowski (Ed.), Roman Mogilevskiy (Ed.)
CASE Network Reports No. 92 10
GMR (Education for All) Global Monitoring Report GNI Gross National Income HBS Household Budget Survey HDI Human Development Index HIPC Heavily Indebted Poor Countries HIV/AIDS Human Immunodeficiency Virus/ Acquire Immune Deficiency
Syndrome IBRD International Bank for Reconstruction and Development IDA International Development Association IFI International Financial Institution ILO International Labor Organization IMF International Monetary Fund IPA Instrument for Pre-accession Assistance IRAI IDA Resource Allocation Index LDC Less Developed Country LSMS Living Standards Measurement Study MCC Millennium Challenge Corporation MDG Millennium Development Goals MDRI Multilateral Debt Relief Initiative MFA Macro-Financial Assistance MOF Ministry of Finance MTB Medium Term Budget MTBF Medium Term Budget Framework MTEF Medium Term Expenditure Framework NDS National Development Strategy (Moldova) NGO Non-Governmental Organization MNS New Member States of the EU NSDI National Strategy for Development and Integration (Albania) NYP National Youth Policy (Armenia) OBI Open Budget Index OSCE Organization for Security and Cooperation in Europe ODA Official Development Assistance OECD Organization for Economic Cooperation and Development PAYG Pay As You Go (pension system) PCA Partnership and Cooperation Agreement PEFA Public Expenditure and Financial Accountability PEMPAL Public Expenditure Management Peer-Assisted Learning PFM Public Finance Management PIP Public Investment Program PIT Personal Income Tax PIU Project Implementation Unit POB Performance Oriented Budgeting PPM Participatory Performance Monitoring PPP Purchasing Power Parity

CHALLENGES AND TRAJECTORIES OF FISCAL POLICY AND PFM REFORM…
CASE Network Reports No. 92 11
PRGF Poverty Reduction and Growth Facility PRS Poverty Reduction Strategy PRSP Poverty Reduction Strategy Paper QFA Quasi-Fiscal Activity R&D Research and Development ROSC Report on the Observance of Standards and Codes RSD Serbian Dinar SAA Stabilization and Association Agreement SAC Structural Adjustment Credit SDP Sustainable Development Program (Armenia) SEE South Eastern Europe SHI Social Health Insurance SIGMA Support for Improvement in Governance and Management in Cen-
tral and Eastern European Countries SMP Staff-Monitored Program SNA System of National Accounts SOE State-Owned Enterprises SPG Squared Poverty Gap SPPRED State Program on Poverty Reduction and Economic Development
(Azerbaijan) SPSP Sector Policy Support Program SWAp Sector-Wide Approach TA Technical Assistance TB Tuberculosis ToR Terms of Reference UK United Kingdom UNDP United Nations Development Program UNECE United Nations Economic Commission for Europe UNESCO United Nations Educational, Scientific and Cultural Organization UNICEF United Nations Children’s Fund UNCTAD United Nations Conference for Trade and Development US United States of America USAID The US Agency for International Development USD United States Dollar USSR Union of Soviet Socialist Republics (Soviet Union) VAT Value Added Tax WB World Bank WDI World Development Indicators WDR World Development Report WGI World Governance Indicators WHO World Health Organization WIS Welfare Improvement Strategy (Uzbekistan) WTO World Trade Organization

Marek Dabrowski (Ed.), Roman Mogilevskiy (Ed.)
CASE Network Reports No. 92 12
The authors Branka Andjelkovic is a CASE associate. She has long experience in policy-
oriented research and in provision of policy support to high level policy panels organized by UNDP and government. She has an extensive project management and team leading experience for UNDP and European Commission. She advised the Government of Serbia on Poverty Reduction Strategy Paper, Social Welfare Reform Strategy, National Action Plan for Persons with Disabilities.
Alexander Chubrik is the Vice President of CASE-Belarus, CASE Fellow and
an economist at the IPM-CASE Research Center in Minsk where he is the co-editor of several publications including Belarusian Economic Outlook and Belaru-sian Monthly Economic Review. His research interests include economic growth, social and economic status of households, labor markets, macroeconomic model-ing, applied econometrics and transition economic development. He holds an hon-ors degree in economic theory from the Belarusian State University.
Marek Dabrowski, Professor of Economics, President of CASE - Center for
Social and Economic Research in Warsaw, former Chairman of the Supervisory Board of CASE-Ukraine in Kiev, Member of the Board of Trustees of the Institute for the Economy in Transition in Moscow. Former First Deputy Minister of Fi-nance (1989-1990), Member of Parliament (1991-1993) and Member of the Mone-tary Policy Council of the National Bank of Poland (1998-2004). From the end of 1980s he has been involved in policy advising and policy research in Azerbaijan, Belarus, Bulgaria, Egypt, Georgia, Iraq, Kazakhstan, Kyrgyzstan, Macedonia, Moldova, Mongolia, Poland, Romania, Russia, Serbia, Syria, Turkmenistan, Ukraine, Uzbekistan and Yemen, as well as in a number of international research projects related to monetary and fiscal policies, currency crises, international fi-nancial architecture, EU and EMU enlargement, perspectives of European integra-tion, European Neighborhood Policy and political economy of transition. World Bank and UNDP Consultant. Author of several academic and policy papers, and editor of several book publications.
Roman Mogilevsky is Executive Director of the Center for Social and Eco-
nomic Research CASE-Kyrgyzstan and CASE Fellow. He works on various prob-lems in the CIS countries, including fiscal and social policy, international trade and foreign aid, macroeconomics, labor market and labor migration. He has exten-

CHALLENGES AND TRAJECTORIES OF FISCAL POLICY AND PFM REFORM…
CASE Network Reports No. 92 13
sive experience in providing advice and training to governments and civil society organizations in the majority of CIS countries.
Irina Sinitsina is a CASE Fellow and leading researcher at the Institute of
Economics, Russian Academy of Sciences (Moscow, Russia) and CASE's perma-nent representative in Russia. She specializes in the analysis of social policy, in-cluding social security systems, social services, labor market, income and em-ployment policies in Russia, Poland, Georgia, Ukraine and other FSU and CEE countries. She has also carried out extensive comparative macroeconomic studies of the economies in transition in these countries. She has participated in many international advisory projects on fiscal and social policy in Georgia and Ukraine. Since 1992, she has advised Russian ministries, governmental agencies, and the Central Bank of the Russian Federation on various social and employment policy issues.
Przemyslaw Wozniak is CASE Fellow and Member of CASE Supervisory
Council. His research interests concentrate on issues related to macroeconomics, monetary policy and inflation as well as economic transition of Central European and Balkan countries. He has led and worked in numerous international research projects as well as technical assistance projects in Montenegro, Serbia and Bosnia and Herzegovina. He obtained an MA (1997) and a PhD (2002) in economics from Warsaw University.

Marek Dabrowski (Ed.), Roman Mogilevskiy (Ed.)
CASE Network Reports No. 92 14
Abstract The purpose of this study is to provide an overview of fiscal policies and PFM
reforms in 7 countries in the Western Balkans and 12 countries in the CIS, includ-ing major macroeconomic and poverty trends, fiscal policy, the size and role of the public sector, public expenditure management and its linkage to policy develop-ment, the organization of budget processes on the central and local levels, the role of various actors and tools in PFM, including civil society and the international donor community.
The period of 2003-2007 was characterized by an extraordinary high rate of economic growth, both worldwide and in the CEE/CIS region. This created mac-roeconomic room for meeting numerous development challenges: reducing pov-erty and inequality, improving the quality and coverage of public services, upgrad-ing infrastructure, and advancing various reforms, including those related to PFM. However, the economic situation deteriorated dramatically in 2008 as a result of the global financial crisis, with deep recession hitting most of the countries in 2009 and bleak perspectives for subsequent years.
It remains to be seen whether the crisis situation will force governments to speed up necessary reforms. In the PFM area major tasks concern lengthening fiscal planning horizon and gradual movement toward performance oriented budg-eting (the measure which can allow better expenditure targeting and decrease vola-tility in expenditure allocation), increasing budget transparency and creating real room for civil society involvement into a budget process. However, the reforms must also involve a broadly defined governance sphere, i.e. improving transpar-ency and accountability of government, modernization of civil service, decentrali-zation, including building a genuine system of local and regional self-government, and other similar measures to improve quality of public services and social policy interventions.

CHALLENGES AND TRAJECTORIES OF FISCAL POLICY AND PFM REFORM…
CASE Network Reports No. 92 15
Executive Summary
i. The purpose of this study is to provide an overview of fiscal policies and PFM reforms in the CEE/CIS region, including in 7 countries in the Western Balkans and 12 countries in the CIS. In this study the, PFM agenda is understood in rather broad terms, including major macroeconomic and poverty trends, fiscal policy, the size and role of the public sector, public expenditure management and its link-age to policy development, the organization of budget processes on the central and local levels, the role of various actors and tools in PFM, including civil soci-ety and the international donor community.
ii. The analytical approach used in this study is that of a cross-country compara-tive analysis which focuses, by its definition, on similarities and differences across individual countries and sub-regions. This approach allows us to present major trends in fiscal policy and PFM in the entire analyzed region, the factors which determine these trends. It also allows us to see the relationship between the reforms (or their absence) and the quality of PFM, including those elements of PFM which are important for fulfilling UNICEF’s statutory mission. The com-parative analysis also offers a natural benchmark for individual country analysis and assessment, i.e. whether countries differ from their neighbors, how much and why?
iii. The analyzed group of countries is very heterogeneous in terms of their economic, social and geopolitical characteristics. The main dividing line goes between the Western Balkan and CIS sub-regions with differences related to historical and institutional legacies (former Yugoslavia vs. former USSR), geographical location and geopolitical interest (Western Balkans being closer to Western Europe and having an EU membership perspective), and level of economic and social devel-opment. However, both sub-regions are also internally heterogeneous in almost every major characteristic– level of development, geography, history, institutional tradition or even chance for EU membership in case of Western Balkan subgroup. Generally, the intra-sub-regional differentiation is much deeper in the CIS than in the Western Balkans. If one looks at various specific characteristics, indicators and processes, the picture becomes even more blurred with various ad hoc group-ings going across sub-regional boundaries.
iv. The period covered by the analysis (2003-2007) was characterized by an extraor-dinary high rate of economic growth, both worldwide and in the CEE/CIS region. This period and the preceding years created macroeconomic room for meeting numerous development challenges: reducing poverty and inequality, improving the quality and coverage of public services, upgrading infrastructure, and advanc-

Marek Dabrowski (Ed.), Roman Mogilevskiy (Ed.)
CASE Network Reports No. 92 16
ing various reforms, including those related to PFM. Individual countries used these opportunities to a various degree. For example, extreme poverty was re-duced everywhere but remained a problem in Central Asia and other low-income CIS countries. Although the zone of economic and social vulnerability, i.e. the number of people that are just above the poverty line, decreased somewhat during the period of study (especially in the European part of CIS), it remained large in almost all of the countries in the region. Income inequalities did not diminish.
v. However, the favorable economic situation started to change dramatically in 2008 as a result of the global financial crisis, with recession forecasted for almost all countries in 2009 and bleak perspectives for subsequent years. Due to the struc-tural characteristics and existing vulnerabilities, the economies of the region have been affected through many contagion channels such as weaker global demand (trade channel), a fall in commodity prices, the global liquidity squeeze (credit channel), the troubles of “mother” financial institutions in developed countries, increasing risk aversion, increased exchange rate volatility and decreasing de-mand for labor migrants. More troubles like the necessity to rescue national fi-nancial industries that have been weakened by both the recession and the conse-quences of currency depreciation may come in the near future. As a result, sub-stantial part of the gains in poverty reduction recorded until 2008 may easily be reversed, especially in the countries most seriously affected by recession and high inflation.
vi. The economic boom helped improve fiscal balances by increasing government revenues. The public debt to GDP ratios declined everywhere as a result of the improved primary fiscal balances, rapid economic growth, appreciation of na-tional currencies, low interest rates and debt reduction in low-income countries. Oil-exporting countries accumulated substantial reserve funds. However, the eco-nomic and financial crisis has already deteriorated fiscal balances in all countries and reversed the previous favorable trend in debt-to-GDP ratios (sometimes dra-matically as in the case of Ukraine).
vii. High revenues until mid 2008 also allowed for the increase in public expenditures (in nominal and real terms) in many sectors, including healthcare, education, wa-ter supply and other basic infrastructure, and social assistance. However, higher expenditures have not been automatically translated into better outcomes of indi-vidual policies as both the targeting of public resources and the quality of govern-ance in these sectors have remained unsatisfactory. On the contrary, the available indicators of public health, coverage and quality of education, access to improved water sources and sanitation, etc. demonstrate little visible improvement if any.
viii. In most countries, expenditure policies have been driven by inertia and the inter-ests of powerful lobbies (such as the rapidly growing group of relatively young

CHALLENGES AND TRAJECTORIES OF FISCAL POLICY AND PFM REFORM…
CASE Network Reports No. 92 17
pensioners or public sector employees and management). The truly poor, children and youth have been largely neglected. The majority of the increased spending for public services is helping to continue the status quo rather than for reforms aimed at the rationalization of existing networks, increasing the quality of services, se-curing equal access to public services for the poor, etc. Social policy expenditures are dominated by continuously increasing transfers to the public PAYG pension system and financing poorly targeted social entitlements to broad categories of the population (not necessarily the most socially vulnerable). It is unclear yet how the revenue shortfall caused by the financial crisis and the recession will affect ex-penditure priorities. However, even if the crisis pushes governments to accelerate public sector and social policy reforms, their result will come with considerable time lag.
ix. In addition, post-Yugoslav countries and the European part of the former USSR (especially Belarus and Ukraine) represent a very high level of public expendi-tures (mostly social transfers) in relation to GDP, comparable with the highest-spending countries of Western Europe, in spite of their significantly lower GDP-per-capita levels. This may lead to the phenomenon of a premature and ineffective post-communist welfare state in the region which may be harmful for economic growth in the longer term (the same risk, by the way, relates to the EU NMS).
x. So far reforms aimed at improving the targeting of spending and the efficiency of public services brought limited results. Even if initiated, they remained often in-complete and inconsistent, subject to easy reversal and capture by special interest groups. Thus, insufficient prioritization and targeting remain a major unsolved problem of both public social services (like health and education) and social pol-icy. They are also responsible, among other factors, for only a modest contribu-tion of economic growth to poverty reduction and had no impact on reducing in-come inequalities.
xi. The quality of PFM depends a great deal on the organization of budget systems, i.e., (1) the division of responsibilities and government resources between differ-ent levels and types of government bodies, (2) the system of budget planning and execution, (3) the availability of a clear policy framework for budget-related deci-sion-making, and (4) the institutional setup of PFM systems, and (5) budget transparency and civil society involvement into budget processes.
xii. In the analyzed region, the central government controls more than half of the General Government (GG) budget with a median share equal to 73%. This high share may have many explanations both of an economic and political character. The first group of factors includes (1) high government spending on social secu-rity, defense, public order and safety and some other functions, which are mostly/ exclusively implemented by central governments; (ii) the small population of

Marek Dabrowski (Ed.), Roman Mogilevskiy (Ed.)
CASE Network Reports No. 92 18
many countries, which does not require the decentralization of those government functions (e.g., many components of education and health), which are usually delegated to the local level in larger countries, (iii) the prevalence of indirect taxes (usually collected by the central government) in revenue structure.
xiii. As for political factors explaining the centralization bias, one could mention an administrative tradition left over from the Soviet period (particularly in the case of the former USSR) and fears of territorial/ethnic disintegration. The conse-quences of this bias represent a challenge for the quality of public services and social policy, citizen participation, and government accountability and transpar-ency, which can be executed easier at the local level than at the national level.
xiv. In many countries of the region, substantial central government resources (some-times more than 30%) continue to be channeled through extra-budgetary funds. Pension funds are the largest extra-budgetary units (in terms of resources). In some countries considerable resources are also concentrated in medical insurance funds. The insurance nature of payments from these funds is the main rationale to keep them separate. In practice, however, this rationale is often questionable as a majority of pension and other social security schemes have significant redistribu-tion mechanisms, so they do not differ much from a regular budget. Another ra-tionale for the creation of extra-budgetary funds is the intention to earmark some revenues for particular priority purposes (road construction, regional development etc.). However, the existence of extra-budgetary funds complicates the fiscal sys-tem and makes it less transparent and inhibits the efficient redistribution of re-sources within a GG budget.
xv. Most countries continue various kinds of QFAs (in the range of 2-4% of GDP), with setting tariffs for electricity and gas below their cost-recovery level being the most frequent practice. Generally, QFAs decrease the transparency of fiscal pol-icy and PFM and blur the government’s accountability in this sphere. Fiscal diffi-culties and social vulnerabilities associated with the period of economic downturn may push governments to intensify QFAs again.
xvi. Basic PFM reforms include establishing: (1) complete budget classification, (2) complete budget coverage and capital budget integration, (3) consolidated treas-ury single accounts, and (4) adequate budget controls. Most of analyzed countries introduced the full classification of government revenues and expenditures by economic, functional, organizational, program and funding codes. Progress in consolidating various types of government resources (extra-budgetary funds, PIP and QFA) into budget documentation going through legislative scrutiny and the introduction of single treasury accounts is also visible. However, more should be done in this area. In particular, the operations of the majority of extra-budgetary units and even some operations included into the government budgets (especially
CHALLENGES AND TRAJECTORIES OF FISCAL POLICY AND PFM REFORM…
CASE Network Reports No. 92 19
PIP-related) are not reflected on treasury accounts. The predictability and regular-ity of payments has improved in comparison with the 1990s but remains far from ideal and may deteriorate again as a result of the current crisis. The same concerns expenditure sequestration and payment arrears which may return as a conse-quence of revenue shortfall.
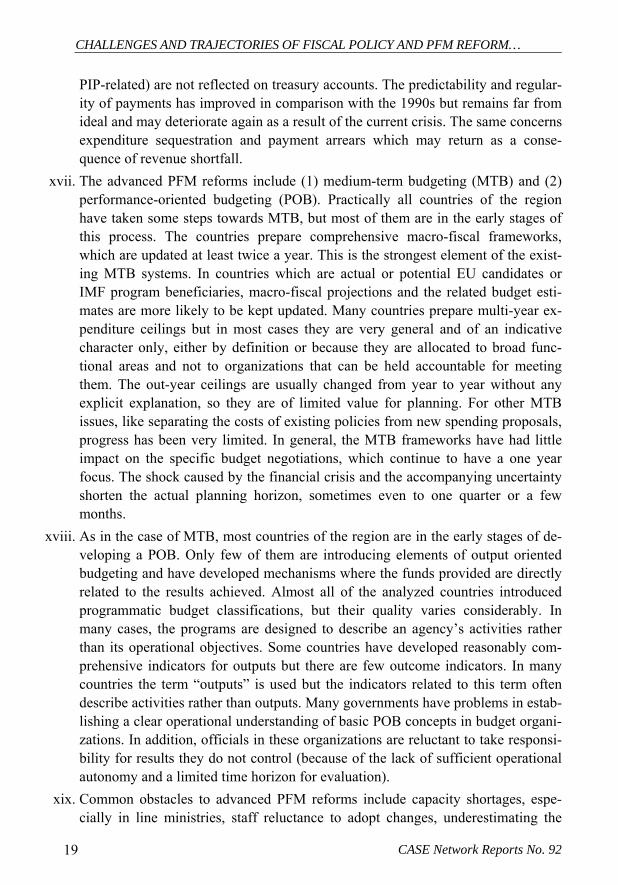
xvii. The advanced PFM reforms include (1) medium-term budgeting (MTB) and (2) performance-oriented budgeting (POB). Practically all countries of the region have taken some steps towards MTB, but most of them are in the early stages of this process. The countries prepare comprehensive macro-fiscal frameworks, which are updated at least twice a year. This is the strongest element of the exist-ing MTB systems. In countries which are actual or potential EU candidates or IMF program beneficiaries, macro-fiscal projections and the related budget esti-mates are more likely to be kept updated. Many countries prepare multi-year ex-penditure ceilings but in most cases they are very general and of an indicative character only, either by definition or because they are allocated to broad func-tional areas and not to organizations that can be held accountable for meeting them. The out-year ceilings are usually changed from year to year without any explicit explanation, so they are of limited value for planning. For other MTB issues, like separating the costs of existing policies from new spending proposals, progress has been very limited. In general, the MTB frameworks have had little impact on the specific budget negotiations, which continue to have a one year focus. The shock caused by the financial crisis and the accompanying uncertainty shorten the actual planning horizon, sometimes even to one quarter or a few months.
xviii. As in the case of MTB, most countries of the region are in the early stages of de-veloping a POB. Only few of them are introducing elements of output oriented budgeting and have developed mechanisms where the funds provided are directly related to the results achieved. Almost all of the analyzed countries introduced programmatic budget classifications, but their quality varies considerably. In many cases, the programs are designed to describe an agency’s activities rather than its operational objectives. Some countries have developed reasonably com-prehensive indicators for outputs but there are few outcome indicators. In many countries the term “outputs” is used but the indicators related to this term often describe activities rather than outputs. Many governments have problems in estab-lishing a clear operational understanding of basic POB concepts in budget organi-zations. In addition, officials in these organizations are reluctant to take responsi-bility for results they do not control (because of the lack of sufficient operational autonomy and a limited time horizon for evaluation).
xix. Common obstacles to advanced PFM reforms include capacity shortages, espe-cially in line ministries, staff reluctance to adopt changes, underestimating the

Marek Dabrowski (Ed.), Roman Mogilevskiy (Ed.)
CASE Network Reports No. 92 20
amount of time and resources required, and in many cases, the existence of more pressing priorities or more basic reforms to be put in place. The advanced PFM reforms also require the availability of a consistent national medium-term policy framework.
xx. Since the end of the 1990s/early 2000s, the WB, IMF and other international de-velopment organizations have been promoting medium-term strategic planning in the form of Poverty Reduction Strategy Papers (PRSP). The majority of the coun-tries of the region prepared PRSPs with the support of their development partners. In the second part of the 2000s, many of them began feeling that the focus on poverty implied by the very title of PRSP did not match their actual/aspired status of middle-income countries and too narrowly defined their development priori-ties. So, the second generation of medium-term strategies often does not mention poverty reduction as such, but refers to a broader development agenda, while es-sentially keeping key PRSP features. In most cases, PRSPs refer to medium-term country development strategies for 3-5 years but some refer to strategies with ho-rizons as long as 13-15 years. However, the financial crisis may outdate many of these policy frameworks which have been built on too optimistic macroeconomic assumptions.
xxi. The review of a dozen PRSP documents suggests that the effectiveness of na-tional strategies in setting development goals and targeting children’s needs in particular is limited. The relatively open and broad-ranging form of these docu-ments has both advantages (countries can take approaches that best fit their spe-cific situation) and disadvantages (because they can omit sensitive issues or avoid making concrete commitments). In the case when specific commitments are made, they are usually very hard to verify, either because PRSP progress reports are irregular or because they fail to provide sufficiently detailed information.
xxii. As for the transparency and openness of the budget process, governments often fail to give systematic budget information to both the legislature and general pub-lic. In most countries, the budget proposal or series of proposals do not provide a comprehensive picture of the government’s fiscal position during the forthcoming year(s). The documents do not lay out the government’s policy goals and explain how the planned spending will assist in achieving them. Also many governments do not disclose detailed information on expected revenues, plans to borrow, pay-ments arrears, etc. Ex-post information in annual budget reports is often incom-plete. The same concerns mid-year reports when they are delivered to parlia-ments. Very little is released to the general public. In most countries, governments do not make information publicly available that is produced for internal use or for donors. Only a few countries hold public hearings regarding budget issues. Gen-erally, the role of civil society in the budget process is limited and very dependent on the nature of the political system in individual countries. In several countries,

CHALLENGES AND TRAJECTORIES OF FISCAL POLICY AND PFM REFORM…
CASE Network Reports No. 92 21
even the role of the legislature in the budget process is limited, for example, by granting parliament too little time for discussing a government budget proposal.
xxiii. Almost all countries received substantial donor assistance during the transition period of the 1990s and 2000s. The assistance helped support a broad program of reforms related to virtually all aspects of the economic, social and political devel-opment of these countries, including fiscal policy and PFM. Donor interventions in the area of fiscal policy and PFM can be grouped into three categories: (1) di-rect provision of resources for public expenditures through loans, grants and debt relief to governments; (2) policy conditionality accompanying financial aid to support required reforms; (3) technical assistance to governments in the imple-mentation of PFM reforms. In spite of many problems in the sphere of aid deliv-ery (such as the insufficient coordination of donor effort, country ownership of donor initiated programs, principal-agency problems in delivery of technical as-sistance, etc.), the donor effort has had a positive impact on advancing PFM re-forms especially in more technical and less politically sensitive spheres such as budget classification, reporting, consolidating government accounts, lengthening of the planning horizon, etc. The positive impact on aid programs and their condi-tionality has been especially felt by countries which are actual or potential EU candidates (Western Balkans) or are dependent on aid resources in the long-term (several low-income countries).
xxiv. The analyzed countries still face a substantial agenda of policy reforms in the forthcoming years which would guarantee them long-term fiscal sustainability and upgrade their PFM system, including better quality of public services and better prioritization and targeting of social programs. While being aware of all administrative difficulties related to the effective functioning of the addressed social assistance based on means testing the authors of this study believe this is the best strategy to concentrate scarce public resources (which has become even more scarce as result of the crisis) in the social policy area on support to the poor-est households. Reforming wasteful public pension systems and elimination of various kinds of subsidies, quasi-subsidies, and broad based benefits in kind can create a fiscal room for more effective system of social assistance, including in-terventions related to family and children basic needs.
xxv. In the PFM area the key although uneasy reform tasks concern lengthening fiscal planning horizon and gradual movement toward POB (the measure which can allow better expenditure targeting and decrease volatility in expenditure alloca-tion), increasing budget transparency and creating real room for civil society in-volvement into a budget process.
xxvi. However, the reforms cannot be limited to the narrowly defined fiscal, PFM and social spheres but they must involve a broadly defined governance sphere. The

Marek Dabrowski (Ed.), Roman Mogilevskiy (Ed.)
CASE Network Reports No. 92 22
support to governance reform should also become a priority task of an interna-tional donor community (including UNICEF). Without improving transparency and accountability of government, modernization of civil service, decentraliza-tion, including building a genuine system of local and regional self-government, and other similar measures it will be hardly to improve quality of public services and social policy interventions. Only such reforms can help in sustainable poverty eradication and help the most economically vulnerable (and at the same time usu-ally the most politically powerless) groups of the population, including children and youth from poor families.
xxvii. It remains to be seen whether the crisis situation and end of the era of rapid eco-nomic growth (associated with an even more rapid inflow of government reve-nues) will force governments to speed up necessary reforms. In the meantime the questions analyzed in this study require further analytical and diagnostic work both on regional and individual countries levels.

CHALLENGES AND TRAJECTORIES OF FISCAL POLICY AND PFM REFORM…
CASE Network Reports No. 92 23
1. Introductory Remarks
1. The purpose of the study is to provide the UNICEF in Central and Eastern Europe (CEE) and the Commonwealth of Independent States (CIS) with a comprehensive analysis on the progress in the area of fiscal policy and Public Financial Manage-ment (PFM) reforms in the region. The study can help UNICEF to upgrade its institutional capacity in conducting more effective and better-targeted interven-tions related to their statutory child related goals based on the staff’s improved knowledge and understanding of PFM issues. It can be also useful for UNICEF’s programmatic work, for advocacy purposes and as a reference for PFM issues. It should help UNICEF offices to maintain informed dialogue with other key play-ers in the PFM area, i.e., governments, international financial and development institutions, the European Commission, and bilateral donors.
2. The PFM agenda is understood in this study in rather broad terms, including major macroeconomic and poverty trends, fiscal policy, the size and role of the public sector in the economy, public expenditure management and its link to pol-icy development, the organization of budget processes at the central and local lev-els of government, the roles of various actors and tools in the PFM process, in-cluding civil society and the international donor community. A special emphasis is given to the analysis of those public expenditure components which are critical to the welfare of children and families in sectors such as education, health, social protection, water and utilities. The study also tries to elaborate on the issues that are critical for the UNICEF agenda such as poverty alleviation, the sustainability of social expenditures, intergovernmental fiscal relations and fiscal decentraliza-tion, budgetary frameworks for possible institutional change in social service de-livery, etc.
3. The study covers the entire CEE/CIS region and the three sub-regions, i.e. the Western Balkans, the countries covered by the ENP (Eastern Europe), and Central Asia. The first group, i.e. the Western Balkans includes Albania, Bosnia and Her-zegovina, Croatia, Kosovo1, Macedonia2, Montenegro, and Serbia. The second
1 Under UN Security Council Resolution 1244. 2 For the purposes of this study we apply hereinafter the commonly used geographic names of the analyzed countries rather than their official names, i.e. Macedonia instead of the Former Yugoslav Republic of Macedonia (FYROM), Russia instead of the Russian Fed-

Marek Dabrowski (Ed.), Roman Mogilevskiy (Ed.)
CASE Network Reports No. 92 24
and largest group includes Armenia, Azerbaijan, Belarus, Georgia, Moldova, Russia, and Ukraine. Finally, the third group includes the five countries of post-Soviet Central Asia: Kazakhstan, Kyrgyzstan, Tajikistan, Turkmenistan, and Uz-bekistan. A total of 19 countries are subjected to comparative analysis in this study3.
4. For various analytical purposes, we also apply other country groupings according to the principle of “variable geometry” and use criteria such as GDP per capita, level of human development, demographic and ethnic factors, resource endow-ment, institutional background and heritage, the role and interest of EU, and the progress in economic and political reforms. As a result, we often subdivide the former Soviet Union into three sub-regions: Eastern Europe (sometimes called Western CIS), the Caucasus and Central Asia. Sometimes we merge the two latter into Caucasus and Central Asia (CCA) as they share many common socio-economic characteristics.
5. The limited size of the study and the limited labor input planned in the ToR required searching for the most economic and efficient way of accomplishing the project’s ambitious objectives. Thus we used a cross-country comparative analysis which focuses, by definition, on finding similarities and differences across individual countries and sub-regions. This approach also helped us to pre-sent major trends in fiscal policy and PFM in the analyzed region (CEE/CIS) and its three sub-regions. The approach allowed us to identify the factors which de-termine these trends, and recognize the relationship between the reforms (or their absence) and the quality of PFM, including those elements of PFM which are im-portant for fulfilling UNICEF’s statutory mission. The comparative analysis also offers a somewhat natural benchmark for individual country analysis and assess-ment: in order to see how countries differ from their neighbors, how much and why? There would no be such benchmarking possibility if the analysis was based only on a collection of individual country case studies. Thus, the cross-country comparative approach adopted in this study can be justified not only by economy of time and limited resources devoted to this project but also, and most impor-tantly, by its analytical convenience and effectiveness.
6. However, the decision to use a cross-country comparative approach has various consequences for the study’s general design, structure, content, data sources and methodology. It requires a top-down analytical approach where the main focus is put on the cross-country and cross-sub-regional comparison instead of presenting
eration, Kyrgyzstan instead of the Kyrgyz Republic, Armenia instead of the Republic of Armenia, etc. 3 Turkey being part of UNICEF CEE/CIS region was not included in the study because of data comparability problem.

CHALLENGES AND TRAJECTORIES OF FISCAL POLICY AND PFM REFORM…
CASE Network Reports No. 92 25
individual country stories (with all their historical and factual nuances). Neverthe-less, individual countries’ developments do not disappear from the analysis com-pletely: they are analyzed either as an illustration of a common trend or as an ex-ample of divergence from this trend. We also highlight the cases of outstanding results in PFM reform and best practices in PFM on the one hand, and the absence of reforms or major failures in their implementation, on the other.
7. The comparative cross-country analysis also requires some up-front work on data standardization, quantifying some qualitative characteristics and finding a simple way of presenting some of the more complex processes and developments. On the other hand, the thematic range and depth of cross-country comparative analysis has been in many cases limited by the availability or insufficient quality of com-parative statistical data (or other information). In such cases we either present an incomplete comparison limited to countries where data sources/information are available or, if this is not excluded by methodological considerations, we try to find substitute data sources (usually from country reports/studies conducted by the IMF, World Bank or other international organizations). Sometimes we use both approaches simultaneously. Whenever necessary we provide information on existing data problems and the ways in which we have tried to solve them.
8. The period covered by the analysis (2003-2007 as required by the ToR) was characterized by an extraordinary high rate of economic growth, both worldwide and in the CEE/CIS region. This situation started to change dramatically in 2008 as a result of the global financial crisis. An economic recession (sometimes quite deep) was forecasted for almost all countries in 2009 and bleak perspectives for the near future. While it is too early to assess potential macroeconomic, fiscal and social consequences of both the financial crisis and the recession, we try to make some comments on their potential impact, especially in chapters 3 and 4.
9. In preparing this study, we have used the available cross-country statistical data-bases and various rankings such as the IMF World Economic Outlook Database, IMF International Financial Statistics, IMF Government Finance Statistics, World Development Indicators and World Governance Indicators of the WB, UNICEF TransMONEE database, EBRD economic and transition indicators, UNECE and UNCTAD statistical databases, EUROSTAT and European Commission statisti-cal publications, Asian Development Bank data sources (a very useful source for the CCA sub-region), Freedom House Nation in Transit study (in respect to civic participation and transparency issues), Open Budget Index and Global Integrity Report, etc. Apart from these cross-country comparative databases and rankings, we have also made review of various kinds of analytical, programmatic, lending and policy documents such as IMF Country Reports, Poverty Reduction and Growth Facility lending programs, World Bank lending programs, Public Expen-diture Reviews, Public Expenditure Tracking Surveys, PEFA assessments, re-

Marek Dabrowski (Ed.), Roman Mogilevskiy (Ed.)
CASE Network Reports No. 92 26
gional and country reports of the European Commission (for the candidate and neighboring countries), DFID, ADB and other donors, PRSP, MTEF and other national strategic, analytical and legislative documents.
10. We also drew from our own personal and CASE network institutional experience in similar regional or sub-regional studies. Among others, we made use of the database for all transition and EU economies built under the Specific Targeted Research Project on “EU Eastern Neighborhood: Economic Potential and Future Development (ENEPO)” funded under the EU Sixth Framework Program, Prior-ity 7 - Workpackage 1.
11. The authors would like to express their gratitude to Boris Najman and Irena Topinska who helped to conceptualize this study in its early stages and collect information and statistics related to chapters 4 and 5. Pasquale d’Apice and Luigi Della Sala provided administrative and logistical support in the implementation of this project at CASE. Paulina Szyrmer helped in editing the final version of this study.
12. The study greatly benefited from comments provided by peer reviewers, the staff of UNICEF CEE/CIS Regional Office in Geneva, participants of the UNICEF CEE/CIS Regional Child Well-being Workshop held at Issyk-kul area in Kyr-gyzstan on April 21-23, 2009 and the UNICEF CEE/CIS Regional Workshop on “Governance, Public Finance Management and Social Policy for Better Outcomes for Children” held in Istanbul, May 25-26, 2009. However, the authors of this study assume full responsibility for its content, opinions and conclusions which are their own personal views and not necessarily those of UNICEF, CASE or any other institutions.
13. The study analyzes major aspects and components of fiscal policy and PFM in CEE/CIS and is structured as follows: Chapter 2 presents basic characteristics of the CEE/CIS region and groups the analyzed countries according to various eco-nomic, social, political, geographic and institutional criteria. Chapter 3 contains an overview of the macroeconomic and fiscal performance of the analyzed coun-tries and Chapter 4 continues this topic providing an in-depth analysis of public expenditure policies with special attention given to social policy and social ser-vice expenditures and their effectiveness. Chapter 5 addresses the institutional and instrumental side of PFM systems: the degree of fiscal decentralization and inter-governmental fiscal relations, quasi-fiscal operations, major characteristics of the budget planning and execution system, the role of strategic framework docu-ments, budget reporting, transparency and accountability, internal and external control, and the role of various institutional actors, including civil society. Chap-ter 6 analyzes the role of international donors in PFM reforms. Chapter 7 presents a summary of findings and both policy and analytical recommendations.
CHALLENGES AND TRAJECTORIES OF FISCAL POLICY AND PFM REFORM…
CASE Network Reports No. 92 27
2. Basic Characteristics of the Region and Criteria for Country Grouping
14. The purpose of this chapter is to provide basic characteristics of the analyzed region and understand its degree of heterogeneity. The criteria used for these characteristics and subsequent country grouping according to the principle of variable geometry include:
• Geographical location: proximity to Western Europe and access to sea; • Resource endowment; • Institutional heritage; • Exposure to armed conflicts; • Transition progress and contemporary political systems; • Categorization according to income grouping and level of human devel-
opment; • Direction of development (potential influence of relations with the EU).
For most of the characteristics, we implement principal components analysis, and take the first principal component which explains the largest variation in the ana-lyzed indicators for ranking the countries. This gives a first approximation of the various possible criteria of country groupings, subject to subsequent qualitative analysis in this and the following chapters.
2.1. Geographical location
15. In earlier studies, countries of the region were distinguished based on their proximity to ‘thriving market economies’ (De Melo et al., 1997). This proximity was associated with an incentive for EU accession and, hence, ‘imports’ of mar-ket institutions and better access to EU markets. Only six analyzed countries – Albania, Bosnia and Herzegovina, Croatia, Macedonia, Montenegro and Russia – have borders (land or sea) with Western Europe, i.e. EU old member states. How-

Marek Dabrowski (Ed.), Roman Mogilevskiy (Ed.)
CASE Network Reports No. 92 28
ever, after the EU Eastern enlargement, this criterion can be reinterpreted in terms of neighboring with the EU, which added Belarus, Georgia, Moldova, Ukraine, and all Western Balkans to the list of ‘proximate’ countries (see Table A.2.1 in the Statistical Annex).
16. Another feature that may influence country’s development is whether or not it is landlocked. Half of the region is landlocked (see Table A.2.1). At the same time, a difference should exist between countries ‘locked’ in the EU and in Asia. Thus, the countries can be grouped based on three location attributes: proximity to the Western Europe, proximity to the EU, and access to the sea. Results based on the principal components analysis are presented in Table 2.1 (principal component ‘location’ explains 67.1% of variables’ variation).
17. In terms of locations, the region can be divided into three groups: • Countries close to the EU with access to the sea (exception –Macedonia,
which is landlocked). This group can be divided into two sub-groups: neighbors of Western Europe and non-neighbors);
• Countries bordering the EU and landlocked (Belarus and Serbia); • The landlocked countries of Caucasus and Central Asia.
2.2. Resource endowment
18. Resource endowment is another important attribute which determines develop-ment. According to this criterion, we distinguish three groups of countries: rich (all the countries which have large supplies of natural gas and oil), moderate (en-dowed with other natural resources like metal ores), and poor (De Melo et al., 1997). Country groups are presented in Table 2.1.
2.3. Institutional heritage
19. Institutional heritage is characterized by ‘market memory’ (number of years under central planning), and experience of being an independent state (De Melo et al., 1997). The first ‘variable’ distinguishes West Balkan countries (less than 50 years

CHALLENGES AND TRAJECTORIES OF FISCAL POLICY AND PFM REFORM…
CASE Network Reports No. 92 29
under central planning4) and former Soviet Union, FSU (70 years and more) with one exception (Moldova, 51 years of central planning). The same difference is true for another variable: most countries analyzed in this study were part of larger sovereign entities (Soviet Union and Socialist Federal Republic of Yugoslavia) and only one country from the region (Albania) was independent prior to 1989; The Western Balkans were part of the federal and quite decentralized state of Yugoslavia, so for the purposes of this study they could be treated as partially independent before 1989. Russia is treated as independent, as it was a core repub-lic in the former Soviet Union, and has a status a successor state of the Soviet Un-ion; all other FSU countries are considered non-independent before 1989.
Table 2.1. Natural resource endowment
Poor (0) Moderate (1) Rich (2) Albania Georgia Azerbaijan Armenia Ukraine Kazakhstan Belarus Uzbekistan Russia Bosnia & Herzegovina Turkmenistan Croatia Macedonia Kyrgyzstan Moldova Montenegro Serbia Tajikistan
Source: De Melo et al. (1997).
20. As a result, the principal components analysis (Table A.2.2 in the Statistical Annex; principal component ‘institutional heritage’ explains 88.5% of variables’ variance) reveals two major groups (independent or partially independent coun-tries with better ‘market memory’ vs. FSU states) and one ‘transitional’ group which includes Russia (a core FSU country) and Moldova (a country with some market memory).
4 Actually post-Yugoslav countries were only subject to the classical central planning for a few years (between 1945 and early 1950s). Through the remaining time (almost 40 years), they experimented with various elements of the so-called labor self-government and mar-ket socialism.

Marek Dabrowski (Ed.), Roman Mogilevskiy (Ed.)
CASE Network Reports No. 92 30
2.4. Armed conflicts and internal unrest
21. Almost all countries of the region have suffered from armed conflicts and internal unrest. This relates to Russia (North Ossetia, Ingushetia, and Chechnya), Southern Caucasus (Armenia, Azerbaijan, Georgia), almost all Central Asian countries (ex-cept Kazakhstan and Turkmenistan), and all former Yugoslav countries except Montenegro (see Table A.2.3 in the Statistical Annex).
2.5. Transition progress and political systems
22. Measuring transition progress involves two dimensions: (i) the economic transi-tion from a planned to market economy (using EBRD transition indicators) and (ii) the political transition from authoritarian to democratic political systems (us-ing Freedom House democratization indexes).
23. In terms of the economic reform, countries can be divided based on the EBRD reform index (a simple average of nine transition indicators). There are those which exceeded 3 in 2008 (8 countries), those with an EBRD reform index be-tween 3- and 3 (5 countries), and with EBRD reform index below 3- (5 countries). In the first group, Croatia is closest to the new EU members in terms of progress in market reforms (its progress even exceeds that of Bulgaria and Romania). In the least reformed group, three countries out of five – Tajikistan, Turkmenistan, and Belarus – have an EBRD reform index of less than 2+ (see Table 2.2).
24. Another important characteristic is the speed of economic transition. It can be measured as years with close-to-market economy (EBRD reform index of 3 and higher). Croatia is the leader here, having spent 12 years with an EBRD index of 3 or more. Croatia is followed by Macedonia (5 years), Armenia and Georgia (4 years each), Kazakhstan and Russia (3 years), Ukraine (2 years) and Albania (1 year).
25. In terms of democratization, the countries in the region represent all types of political regimes except ‘consolidated democracies’ according to Freedom House classification. In 2008, six countries of the region (Central Asia + Belarus) were rated by Freedom House as ‘consolidated authoritarian regimes’. Five countries (Western Balkans minus Bosnia and Herzegovina) were deemed ‘semi-consolidated democracies’. Three countries have hybrid regimes, and the remain-ing four are ‘semi-consolidated authoritarian regimes’ (Table 2.2).

CHALLENGES AND TRAJECTORIES OF FISCAL POLICY AND PFM REFORM…
CASE Network Reports No. 92 31
Table 2.2. Market reforms and political systems
Country FH democrati-zation score*
EBRD reform index**
Principal com-ponent ‘Re-
forms’
Years under market econ-
omy*** Croatia 3.64 3.52 2.00 12 Macedonia 3.86 3.18 1.38 5 Albania 3.82 3.04 1.19 1 Ukraine 4.25 3.07 0.98 2 Serbia 3.79 2.85 0.94 0 Montenegro 3.79 2.82 0.89 0 Georgia 4.79 3.07 0.66 4 Bosnia & Herze-govina 4.11 2.78 0.64 0
Armenia 5.21 3.18 0.56 4 Moldova 5.00 3.00 0.42 0 Russia 5.96 3.04 -0.11 3 Kyrgyzstan 5.93 2.93 -0.25 0 Kazakhstan 6.39 3.00 -0.42 3 Azerbaijan 6.00 2.63 -0.72 0 Tajikistan 6.07 2.37 -1.14 0 Uzbekistan 6.86 2.15 -1.94 0 Belarus 6.71 2.00 -2.07 0 Turkmenistan 6.93 1.44 -3.01 0
Note. * 3–4 – semi-consolidated democracy, 4–5 – hybrid regime; 5–6 – semi-consolidated authoritarian regime, 6–7 – consolidated authoritarian regime; ** countries are ranked from 1 (planned economy) to 4+ (standards of developed industrial economy); *** years spent with EBRD reform index of 3 and higher. Source: http://www.freedomhouse.org/template.cfm?page=438&year=2008, http://www.ebrd.com/country/sector/econo/stats/tis.xls, own estimates.
26. Political and economic reforms usually go together. The correlation coefficient
between these two variables for the analyzed region is -0.69, i.e. the closer a country is to being a market economy, the lower the Freedom House democratiza-tion index.
2.6. Income grouping and level of human development
27. According to the World Bank Atlas method (2008 data) countries of the region include low-income countries (3) which have a per capita Gross National Income (GNI) that is less than USD 935 (measured in current international dollars or PPP-based), lower-middle income countries (9) which have a per capita GNI between

Marek Dabrowski (Ed.), Roman Mogilevskiy (Ed.)
CASE Network Reports No. 92 32
USD 936 and 3705, and upper-middle income countries (6) which have a per cap-ita GNI between USD 3706 and 11455. However, respective dummy variables do not reflect the intra-group dispersion of incomes, so it can be helpful to use the size of per capita GDP to group countries by income level.
Table 2.3. Level of development
Country In-
come level*
GDP per capita, PPP
based HDI
Principal com-ponent ‘devel-opment 1’**
Principle com-ponent ‘devel-opment 2’***
Croatia 3 14318 0.862 2.08 2.73 Montenegro 3 8909 0.822 1.51 1.11 Serbia 3 9141 0.821 1.50 1.14 Belarus 3 9759 0.817 1.44 1.20 Kazakhstan 3 9779 0.807 1.30 1.06 Russia 3 13182 0.806 1.29 1.72 Macedonia 2 7899 0.808 0.29 0.71 Albania 2 5815 0.807 0.27 0.29 Bosnia & Her-zegovina 2 6501 0.802 0.20 0.35
Ukraine 2 6269 0.786 -0.02 0.08 Armenia 2 4328 0.777 -0.15 -0.43 Georgia 2 4038 0.763 -0.35 -0.68 Azerbaijan 2 6061 0.758 -0.42 -0.36 Turkmenistan 2 4585 0.728 -0.85 -1.07 Moldova 2 2713 0.719 -0.98 -1.57 Uzbekistan 1 2155 0.701 -2.26 -1.93 Kyrgyzstan 1 1820 0.694 -2.36 -2.10 Tajikistan 1 1675 0.684 -2.50 -2.27
Notes. * 3 is for upper-middle income countries, 2 is for lower-middle income countries, and 1 is for low income countries; ** calculated based on income level and HDI; *** cal-culated based on per capita GDP and HDI. Source: http://siteresources.worldbank.org/DATASTATISTICS/Resources/CLASS.XLS, http://www.imf.org/external/pubs/ft/weo/2008/02/weodata/WEOOct2008all.xls, http://hdr.undp.org/en/media/HDI2008Tables.xls, own estimates.
28. Another measure of development level is the UNDP Human Development Index
(HDI). According to this index, countries of the region are divided into two groups: there are 9 countries with a high level of human development (HDI of 0.80 and higher) and another 9 countries with a medium level of human develop-ment (HDI between 0.50 and 0.799. Evidently, the second group is too broad to be used for country classification, but in combination with the income level it can show better results.

CHALLENGES AND TRAJECTORIES OF FISCAL POLICY AND PFM REFORM…
CASE Network Reports No. 92 33
29. As shown in Table 2.3, the following groups can be distinguished on the basis of principal component analysis (principal components ‘development 1’ and ‘devel-opment 2’ explain 92.9 and 94.1% of variance of the respective variables):
• Upper-middle income countries with a high level of human develop-ment;
• Lower-middle income countries with a high level of human develop-ment;
• Lower-middle income countries with a medium level of human devel-opment;
• Low income countries with a medium level of human development.
2.7. Linkages between groups
30. All principal components and country groups from sections 2.1 – 2.6 are interest-ing in terms of their impact on development. In order to evaluate this impact and to look at the possible interrelationship between its determinants, we estimate cor-relations between all variables (principle components and dummies for armed conflicts and natural resource endowment). The results are presented in Table A.2.4 in the Statistical Annex.
31. The level of development (measured as ‘development 2’) is influenced by the following variables:
• Location (neighboring with the EU and access to the sea) is positively correlated with development level;
• Institutional heritage (a smaller number of years under a centrally planned economy and a tradition of independence) is positively corre-lated with development level;
• Reforms and the speed of reforms (measured as years under a market economy) are positively correlated with development level.
32. Other significant correlations involve: • Institutional heritage and natural resource endowment - countries poorly
endowed with natural resources are less likely to be captured by authori-tarian regimes. Also, an abundance of natural resources delays reforms – but this correlation has arisen because of the political reforms compo-nent, while resource endowment and economic reforms seem to be un-correlated;

Marek Dabrowski (Ed.), Roman Mogilevskiy (Ed.)
CASE Network Reports No. 92 34
• Institutional heritage and location, which reflects the difference between the FSU and CEE;
• Reforms and location – countries with better geographical position (in term of proximity to the EU) tend to have a better reform record.
33. Summing up, the Western Balkan countries have a better chance of being more developed than European CIS countries and even more than Central Asian coun-tries.
2.8. Potential influence of the relations with the EU
34. Countries of the region may benefit from different instruments of cooperation with the EU. Additionally, the Western Balkan countries are treated by the EU as candidates or potential candidates for accession (see Table 2.4). EU accession negotiations boost political and economic reforms, and, consequently, the devel-opment of the accessing countries.
Table 2.4. Western Balkans (subject to the Stabilization and Association process)
Country Perspective of the EU accession Forecasted EU joining date
Albania Potential candidate country (SAA signed on June 2006) 2016
Bosnia & Herzegovina Negotiating on SAA 2018
Croatia Recognized candidate (SAA signed in 2001, applied for membership in 2003) 2011
Macedonia Recognized candidate (SAA signed in 2001, applied for membership in 2004) 2014
Montenegro SAA signed on October 2007, applied for membership on December 2008 2017
Serbia SAA signed on April 2007 2018 Source: http://en.wikipedia.org/wiki/Future_enlargement_of_the_European_Union.
35. Six FSU countries in Eastern Europe and Caucasus region are subject to the
European Neighborhood Policy (ENP) while Russia has a similar arrangement with the EU called four Common Spaces between EU and Russia. Among the ENP countries, Belarus does not have a bilateral action plan with the EU yet. In all active ENP countries but Azerbaijan, one can find a clear relationship between
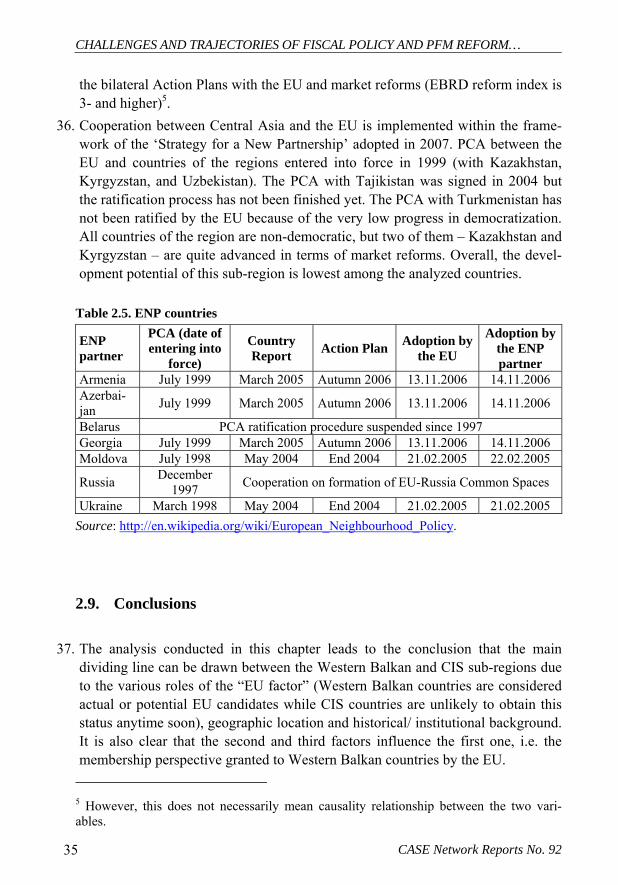
CHALLENGES AND TRAJECTORIES OF FISCAL POLICY AND PFM REFORM…
CASE Network Reports No. 92 35
the bilateral Action Plans with the EU and market reforms (EBRD reform index is 3- and higher)5.
36. Cooperation between Central Asia and the EU is implemented within the frame-work of the ‘Strategy for a New Partnership’ adopted in 2007. PCA between the EU and countries of the regions entered into force in 1999 (with Kazakhstan, Kyrgyzstan, and Uzbekistan). The PCA with Tajikistan was signed in 2004 but the ratification process has not been finished yet. The PCA with Turkmenistan has not been ratified by the EU because of the very low progress in democratization. All countries of the region are non-democratic, but two of them – Kazakhstan and Kyrgyzstan – are quite advanced in terms of market reforms. Overall, the devel-opment potential of this sub-region is lowest among the analyzed countries.
Table 2.5. ENP countries
ENP partner
PCA (date of entering into
force)
Country Report Action Plan Adoption by
the EU
Adoption by the ENP partner
Armenia July 1999 March 2005 Autumn 2006 13.11.2006 14.11.2006 Azerbai-jan July 1999 March 2005 Autumn 2006 13.11.2006 14.11.2006
Belarus PCA ratification procedure suspended since 1997 Georgia July 1999 March 2005 Autumn 2006 13.11.2006 14.11.2006 Moldova July 1998 May 2004 End 2004 21.02.2005 22.02.2005
Russia December 1997 Cooperation on formation of EU-Russia Common Spaces
Ukraine March 1998 May 2004 End 2004 21.02.2005 21.02.2005 Source: http://en.wikipedia.org/wiki/European_Neighbourhood_Policy.
2.9. Conclusions
37. The analysis conducted in this chapter leads to the conclusion that the main dividing line can be drawn between the Western Balkan and CIS sub-regions due to the various roles of the “EU factor” (Western Balkan countries are considered actual or potential EU candidates while CIS countries are unlikely to obtain this status anytime soon), geographic location and historical/ institutional background. It is also clear that the second and third factors influence the first one, i.e. the membership perspective granted to Western Balkan countries by the EU. 5 However, this does not necessarily mean causality relationship between the two vari-ables.

Marek Dabrowski (Ed.), Roman Mogilevskiy (Ed.)
CASE Network Reports No. 92 36
38. However, both major sub-regions are not internally homogenous in terms of development levels, availability of natural resources, geographical location, po-litical regimes, reform progress, relations with the EU and other factors. The in-tra-sub-regional differentiation is even deeper in the CIS than in the Western Bal-kans and appears more complex, i.e. using various criteria may suggest various internal country groupings. For example, when grouped according to geographic location and “depth” of potential relations with the EU (i.e. eligibility to become a participant of the ENP framework or equivalent), the European part of the CIS (including the Southern Caucasus) can be distinguished from Central Asia. Grouping according to other criteria breaks across this geographic/ geopolitical criterion. If one uses various detail indicators related to economic, social and in-stitutional development s/he may obtain many common characteristics for the Caucasus and Central Asia (CCA), sometimes also including Moldova6. Thus, in the following chapters we will use variable grouping criteria, especially in respect to the CIS sub-region, depending on the nature and specifics of the analyzed topic.
6 In the early 2000s, international donors used the concept of CIS-7, which included the three low-income countries of Central Asia (Kyrgyzstan, Tajikistan and Uzbekistan), all three Caucasus countries and Moldova. However, this grouping also appears outdated now, with Azerbaijan enjoying the effects of the oil boom. Other factors also make this group less homogeneous than before.

CHALLENGES AND TRAJECTORIES OF FISCAL POLICY AND PFM REFORM…
CASE Network Reports No. 92 37
3. Macroeconomic and Structural Determinants of Public Finance
39. The purpose of this chapter is to present the macroeconomic and structural factors which determine the fiscal performance of the analyzed countries and, therefore, their fiscal potential to address policy goals related to families and children.
3.1. Recent growth performance and growth perspectives
40. As shown in Table 3.1, the countries of the analyzed region demonstrated high rates of growth throughout the 2000s. Until 2008, European CIS remained the second fastest growing region in the world, after emerging Asia. Oil and gas ex-porting economies demonstrated the highest growth rates, followed by other CIS countries, the Western Balkans and the new EU member states.
Table 3.1. GDP at constant prices (national currency), annual percent changes Economy 2003 2004 2005 2006 2007 2008
Western Balkans* Albania 5.8 5.7 5.8 5.5 6.3 6.8 Bosnia & Herzegovina 3.5 6.3 3.9 6.9 6.8 5.5 Croatia 5.0 4.3 4.2 4.7 5.5 2.4 Macedonia 2.8 4.1 4.1 4.0 5.9 5.0 Montenegro 2.5 4.4 4.2 8.6 10.7 7.5 Serbia 2.4 8.3 5.6 5.2 6.9 5.4
CIS oil and gas exporters* Azerbaijan 10.5 10.4 24.3 30.6 23.4 11.6 Kazakhstan 9.3 9.6 9.7 10.7 8.9 3.2 Russia 7.3 7.2 6.4 7.7 8.1 5.6 Turkmenistan 17.1 14.7 13.0 11.4 11.6 9.8
CIS Europe Non-natural resource exporters* Armenia 14.0 10.5 14.0 13.2 13.8 6.8 Belarus 7.0 11.5 9.4 10.0 8.6 10.0 Georgia 11.1 5.9 9.6 9.4 12.4 2.0 Moldova 6.6 7.4 7.5 4.8 4.0 7.2 Ukraine 9.6 12.1 2.7 7.3 7.9 2.1

Marek Dabrowski (Ed.), Roman Mogilevskiy (Ed.)
CASE Network Reports No. 92 38
Economy 2003 2004 2005 2006 2007 2008 CIS Central Asia Non-natural resource exporters*
Kyrgyzstan 7.0 7.0 -0.2 3.1 8.5 7.6 Tajikistan 10.2 10.6 6.7 7.0 7.8 7.9 Uzbekistan 4.2 7.7 7.0 7.3 9.5 9.0
Memorandum items European Union 1.5 2.6 2.2 3.4 3.1 1.1 Central and Eastern Europe 4.9 7.3 6.0 6.6 5.4 2.9 CIS and Mongolia 7.8 8.2 6.7 8.4 8.6 5.5
Note. Yellow field - IMF staff estimates. Source: International Monetary Fund, World Economic Outlook Database, April 2009.
41. The record-high growth rates resulted from several overlapping factors, some of
which had a one-off character. After a period of severe transition-related output decline in the 1990s (which was magnified in many countries by the conse-quences of civil wars and armed conflicts with their neighbors), the post-communist economies entered a period of rapid output recovery and catching-up growth. This was thanks to governments employing simple efficiency reserves, an increasing demand for money balances, efficiency gains brought on by the eco-nomic reforms of the 1990s and a favorable external environment. It is worth re-membering that almost all emerging market economies benefited from a global boom at that time. The boom was a result of market-oriented transition and policy reforms conducted in many important developing countries and regions (China, India, South East Asia, Latin America, part of Africa), global trade liberalization as well as the expansionary monetary policies of the US and other major central banks. The latter led to the building up of large global imbalances and the creation of numerous assets bubbles, which caused a financial crisis on a scale hardly seen in the last 60 years.
42. When the global boom came to an end in 2007 and the assets bubbles burst, nearly the entire world entered a phase of recession, with post-communist econo-mies being among the most heavily affected, although not immediately (with a time lag from six months to one year after the US and Western Europe). As seen in Table 3.1, some countries have already recorded a considerable growth decel-eration in 2008 (for example Croatia, Kazakhstan, Georgia and Ukraine). In the first quarter of 2009, most of the transition economies recorded a GDP decline (which was sometimes quite substantial as in the case of Ukraine) and they are expected to record negative growth rates for all of 2009. Numerous vulnerabilities related to structural distortions (such as export monoculture based on basic com-modities), low competitiveness, weak institutions, a poor business climate, deeply rooted corruption, and unfinished reforms which were well masked in the pros-

CHALLENGES AND TRAJECTORIES OF FISCAL POLICY AND PFM REFORM…
CASE Network Reports No. 92 39
perity era come back again as the key challenges to be addressed by economic policy in the near future.
43. While the length and ultimately, the depth of the current recession are hard to predict there is no doubt that for many analyzed countries it will mean at least a partial reversal of the development gains accomplished in the last decade. In addi-tion, it remains quite clear that both the global economy and the analyzed group of countries will not return to their previous rapid growth paths any time soon.
3.2. Poverty and income inequality
44. A cross-country comparison of poverty levels is not a methodologically easy task. National (relative) poverty lines are useless, reflecting radically different ap-proaches to the composition of consumer baskets and poverty definitions. Com-monly used international poverty indicators (such as the percentage of the popula-tion living on less than USD 1 a day)7 do not say too much in middle-income economies because they relate to small shares of the population (see Table A.3.1 in the Statistical Annex). However, using an absolute – as opposed to a relative – poverty line allows us to focus on those who are deprived of the most basic needs, rather than those who may be deprived relative to their better off fellow citizens. It also allows us to determine time trends and compare across countries, both of which would be difficult if we were using a relative notion of poverty.
45. The World Bank (2000) argued that a higher poverty line is needed in the Europe and Central Asia (ECA) region, given its cooler climate which necessitates addi-tional expenditures on heating, winter clothing and food. A line of USD 2.15 a day was therefore decided upon and subsequently used as a closer approximation for basic material needs in ECA (WB, 2000). A higher threshold of USD 4.30 a day was also used to capture the “economically vulnerable”, i.e. to measure the proportion of the population that is not suffering absolute material deprivation but which could become vulnerable in the event of an economic downturn (WB, 2005a).
46. For the purpose of this study we used indicators from PovcalNet, a product of the World Bank's Development Research Group8. The recently updated poverty esti-
7 The "USD 1 a day" poverty line has been historically based on the poverty lines com-monly used in low-income countries. The latest line is USD 1.25 a day in 2005 prices, which is the mean of the national poverty lines in the poorest 15 countries. 8 http://go.worldbank.org/A8URN8FWB0.
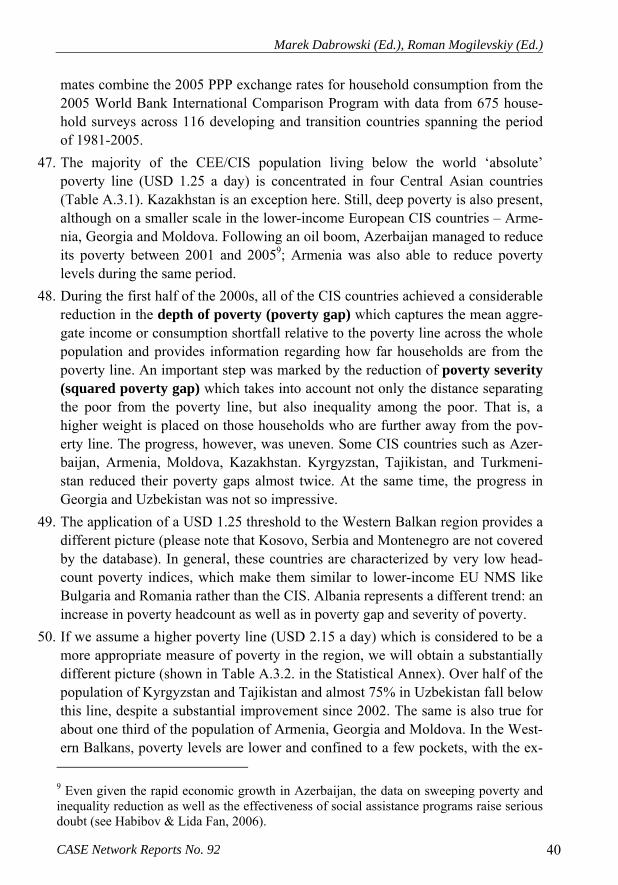
Marek Dabrowski (Ed.), Roman Mogilevskiy (Ed.)
CASE Network Reports No. 92 40
mates combine the 2005 PPP exchange rates for household consumption from the 2005 World Bank International Comparison Program with data from 675 house-hold surveys across 116 developing and transition countries spanning the period of 1981-2005.
47. The majority of the CEE/CIS population living below the world ‘absolute’ poverty line (USD 1.25 a day) is concentrated in four Central Asian countries (Table A.3.1). Kazakhstan is an exception here. Still, deep poverty is also present, although on a smaller scale in the lower-income European CIS countries – Arme-nia, Georgia and Moldova. Following an oil boom, Azerbaijan managed to reduce its poverty between 2001 and 20059; Armenia was also able to reduce poverty levels during the same period.
48. During the first half of the 2000s, all of the CIS countries achieved a considerable reduction in the depth of poverty (poverty gap) which captures the mean aggre-gate income or consumption shortfall relative to the poverty line across the whole population and provides information regarding how far households are from the poverty line. An important step was marked by the reduction of poverty severity (squared poverty gap) which takes into account not only the distance separating the poor from the poverty line, but also inequality among the poor. That is, a higher weight is placed on those households who are further away from the pov-erty line. The progress, however, was uneven. Some CIS countries such as Azer-baijan, Armenia, Moldova, Kazakhstan. Kyrgyzstan, Tajikistan, and Turkmeni-stan reduced their poverty gaps almost twice. At the same time, the progress in Georgia and Uzbekistan was not so impressive.
49. The application of a USD 1.25 threshold to the Western Balkan region provides a different picture (please note that Kosovo, Serbia and Montenegro are not covered by the database). In general, these countries are characterized by very low head-count poverty indices, which make them similar to lower-income EU NMS like Bulgaria and Romania rather than the CIS. Albania represents a different trend: an increase in poverty headcount as well as in poverty gap and severity of poverty.
50. If we assume a higher poverty line (USD 2.15 a day) which is considered to be a more appropriate measure of poverty in the region, we will obtain a substantially different picture (shown in Table A.3.2. in the Statistical Annex). Over half of the population of Kyrgyzstan and Tajikistan and almost 75% in Uzbekistan fall below this line, despite a substantial improvement since 2002. The same is also true for about one third of the population of Armenia, Georgia and Moldova. In the West-ern Balkans, poverty levels are lower and confined to a few pockets, with the ex- 9 Even given the rapid economic growth in Azerbaijan, the data on sweeping poverty and inequality reduction as well as the effectiveness of social assistance programs raise serious doubt (see Habibov & Lida Fan, 2006).

CHALLENGES AND TRAJECTORIES OF FISCAL POLICY AND PFM REFORM…
CASE Network Reports No. 92 41
ception of Albania and, to some extent, Bosnia and Herzegovina, where poverty has even expanded in 2000s. The headcount poverty indicators in Ukraine, Bela-rus, and Bosnia and Herzegovina look similar to those in Slovakia and Poland, while poverty levels in Russia and Macedonia are close to the indicator observed in Bulgaria.
51. This poverty line allows for a better illustration of cross-country differences in the depth and severity of poverty. Poverty in Russia, Ukraine, Belarus, Croatia, Ma-cedonia and (as of recently) in Azerbaijan is quite shallow, while in Armenia, Georgia, Moldova, and Central Asia (except Kazakhstan) it is deep and severe. This means more resources will be required to normalize the situation and to fi-nance the social measures needed for poverty reduction. In fact, the decade of 2000s demonstrates that high growth rates in the region have resulted in an across-the-board substantial reduction of poverty; still, in the countries with se-vere and deep poverty (the low-income CIS economies) the progress was slower.
52. Table A.3.3 in the Statistical Annex demonstrates that a reduction in the number of people living below the absolute poverty line was not always accompanied by a similar trend related to those living between USD 2.15 and 4.30 per day. In Bos-nia and Herzegovina, the number of economically vulnerable increased markedly; in Armenia, Azerbaijan, Georgia, Moldova and Kazakhstan the reduction was much less substantial than in the case of absolute poverty. By contrast, higher-income countries of the region – Croatia, Belarus, Russia and Ukraine - reduced economic vulnerability substantially. It is worth mentioning the fact that the rap-idly growing oil-exporting economies – Russia, Kazakhstan, and Azerbaijan – have low or moderate absolute poverty at USD 2.15 a day, but very sizable pov-erty at USD 4.30 a day. The high prevalence of poverty at USD 4.30 level in these countries is a reflection of their high vulnerability to economic downturns, which, as the 1998 financial crisis in Russia has shown, could easily lead to a doubling of absolute poverty during a given year (WB, 2005a). The same may happen as a result of the recent financial crisis and recession, which is quite heavily hitting countries such as Ukraine or Russia.
53. Figure 3.1 and Table A.3.4 in the Statistical Annex demonstrate that inequality is highly interrelated with poverty persistence. Countries with high and persistent poverty rates have at the same time high inequality in income/ consumption dis-tribution (Georgia, Moldova, Central Asia with the exception of Kazakhstan). This is demonstrated by two indicators – the Gini coefficient and income/ con-sumption distribution between the lowest and the highest income deciles –whose high values indicate a large gap between the poor (extremely poor) and non-poor.
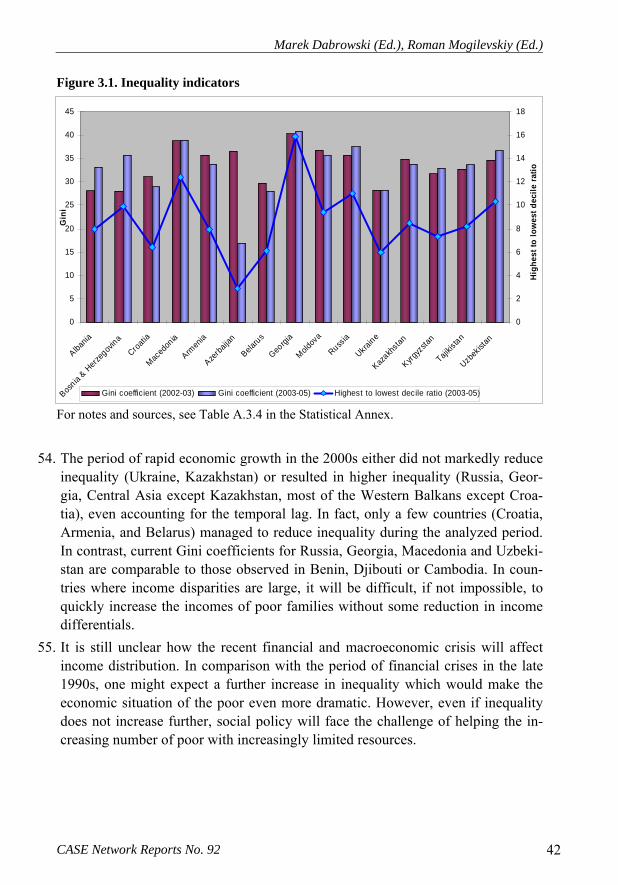
Marek Dabrowski (Ed.), Roman Mogilevskiy (Ed.)
CASE Network Reports No. 92 42
Figure 3.1. Inequality indicators
0
5
10
15
20
25
30
35
40
45
Albania
Bosnia
& Herz
egov
ina
Croatia
Maced
onia
Armen
ia
Azerba
ijan
Belarus
Georgi
a
Moldov
a
Russia
Ukraine
Kazakh
stan
Kyrgyz
stan
Tajikis
tan
Uzbek
istan
Gin
i
0
2
4
6
8
10
12
14
16
18
Hig
hest
to lo
wes
t dec
ile ra
tio
Gini coefficient (2002-03) Gini coefficient (2003-05) Highest to lowest decile ratio (2003-05)
For notes and sources, see Table A.3.4 in the Statistical Annex.
54. The period of rapid economic growth in the 2000s either did not markedly reduce
inequality (Ukraine, Kazakhstan) or resulted in higher inequality (Russia, Geor-gia, Central Asia except Kazakhstan, most of the Western Balkans except Croa-tia), even accounting for the temporal lag. In fact, only a few countries (Croatia, Armenia, and Belarus) managed to reduce inequality during the analyzed period. In contrast, current Gini coefficients for Russia, Georgia, Macedonia and Uzbeki-stan are comparable to those observed in Benin, Djibouti or Cambodia. In coun-tries where income disparities are large, it will be difficult, if not impossible, to quickly increase the incomes of poor families without some reduction in income differentials.
55. It is still unclear how the recent financial and macroeconomic crisis will affect income distribution. In comparison with the period of financial crises in the late 1990s, one might expect a further increase in inequality which would make the economic situation of the poor even more dramatic. However, even if inequality does not increase further, social policy will face the challenge of helping the in-creasing number of poor with increasingly limited resources.

CHALLENGES AND TRAJECTORIES OF FISCAL POLICY AND PFM REFORM…
CASE Network Reports No. 92 43
3.3. Inflation
56. Most transition countries experienced high inflation or even hyperinflation in the early 1990s. In the 2000s, inflation has not been a big problem in the Western Balkans (except Serbia) but it has not reached a sustainable one-digit level in the CIS (except Armenia) - see Table 3.2.
Table 3.2. Consumer price index, annual growth rate, end of period Economy 2003 2004 2005 2006 2007 2008
Western Balkans Albania 3.3 2.2 2.0 2.5 3.1 2.2 Bosnia & Herzegovina 0.5 0.6 4.3 4.6 4.9 3.8 Croatia 1.7 2.7 3.6 2.0 5.8 5.8 Kosovo 10.4 0.5 Macedonia 2.7 -2.1 1.6 3.0 6.7 4.1 Montenegro 6.2 4.2 1.8 2.0 6.3 7.2 Serbia 7.8 13.7 17.7 6.6 11.0 8.6
CIS (Europe) Armenia 8.6 2.0 -0.2 5.2 6.6 5.2 Azerbaijan 3.6 10.4 5.5 11.4 19.5 15.4 Belarus 25.4 14.4 7.9 6.6 12.1 13.3 Georgia 7.0 7.5 6.2 8.8 11.0 5.5 Moldova 15.7 12.6 10.1 14.1 13.1 7.3 Russia 12.0 11.7 10.9 9.0 11.9 13.3 Ukraine 8.2 12.2 10.3 11.6 16.6 22.3
CIS (Central Asia) Kazakhstan 6.8 6.7 7.5 8.4 18.8 9.5 Kyrgyzstan 5.6 2.8 4.9 5.1 20.1 20.1 Tajikistan 13.7 5.7 7.1 12.5 19.8 11.8 Turkmenistan 3.1 9.0 10.4 7.1 8.6 12.0 Uzbekistan 7.8 9.1 12.3 11.4 11.9 14.4
Source: IMF World Economic Outlook Database, April 2009. Data for Kosovo: IMF (2009).
57. The relative disinflation success of Western Balkan countries originated from their
currency pegs to the Euro (or directly using the Euro as a national currency in Mon-tenegro and Kosovo), which gained strength in the analyzed period of 2003-2007. On the contrary, most of the CIS currencies followed the weakening US dollar which resulted in importing inflation (together with the effect of high international commodity prices and capital inflows). The two countries which went against their sub-regional monetary policy patterns (Serbia and Armenia) indirectly confirm the above finding. Serbia chose the flexible exchange rate regime in order to run a more accommodative monetary policy and to be able to devalue its currency (dinar) and,
Marek Dabrowski (Ed.), Roman Mogilevskiy (Ed.)
CASE Network Reports No. 92 44
as a result, recorded higher inflation compared to its neighbors. Armenia moved to partial floating in order to follow a direct inflation targeting and keep (successfully) inflation on a lower level than other CIS countries.
58. The surge of commodity prices between 2006 and mid-2008 reversed the previous disinflation trend in almost the entire region but with more serious inflationary consequences for the CIS than the Western Balkans. The culmination of this trend was recorded in the summer of 2008 when commodity prices reached their high-est levels and the USD/EUR exchange rate hit bottom. In some CIS countries (Ukraine, Azerbaijan and Kyrgyzstan) the annual inflation approached the level of 30% in the summer months of 2008.
59. The global financial crisis, worldwide recession and strengthening US dollar contributed to easing inflationary pressure in the region, starting from the fourth quarter of 2008. However, an individual country inflation record depends very much on its exchange rate policy. In countries which accepted a devaluation/ de-preciation of their currencies, the disinflation path is much slower than in those continuing previous pegs to the EUR or USD.
3.4. Fiscal deficit and its financing
60. A complete and fully comparable fiscal dataset for all analyzed countries does not exist10. In this situation we present two tables – one that is comparable but incom-plete based on GFS statistics (Table 3.3) and another based on various secondary sources (Table 3.4), which is complete but is not fully comparable across coun-tries. As both tables reflect approximately the same trends, they allow us to draw some conclusions regarding fiscal deficits and their dynamics.
61. The size of general government (GG) balances has been determined by several factors, including:
• Rapid GDP growth (see Section 3.1); Gray et al. (2007) found that an improvement in the fiscal balance of 1 percentage point of GDP is asso-ciated, on average, with a 0.4–0.5 percentage point increase in the rate of GDP growth, or a compounded gain over 10 years of about 4.6 percent-age points of GDP;
• High oil and gas prices in the case of major exporters (see Section 3.8); 10 The IMF Government Financial Statistics (GFS) database covers only 11 countries while the World Bank World Development Indicators database – 12. In both cases data series are not complete.

CHALLENGES AND TRAJECTORIES OF FISCAL POLICY AND PFM REFORM…
CASE Network Reports No. 92 45
• Size of official external assistance for the poorer countries and debt ser-vicing.
62. As seen in Figure 3.2, the fiscal position in many of the analyzed countries was better than the average figures for the EU and EU NMS, which could be attributed to their rapid economic growth in the 2000s. However, the global financial crisis has dramatically reversed this favorable cyclical tendency, reducing revenues and forcing governments to increase expenditures.
63. By 2007, 11 countries, including major oil and gas producers (Russia, Kazakh-stan, Azerbaijan, Uzbekistan and Turkmenistan), generated sizeable GG surpluses that helped in debt reduction and, in the case of energy exporters, in the accumu-lation of oil stabilization funds (sizable in the cases of Kazakhstan and Russia, smaller in Azerbaijan and Belarus). Other countries, however, ran GG deficits, which were sizable in the cases of Albania, Croatia, Armenia, Georgia, Tajikistan and Ukraine, Kyrgyzstan and, to a certain extent Croatia. These countries achieved substantial progress in deficit reduction at the end of the analyzed period but their overall balance still remains negative. Tajikistan and, to smaller extent, Moldova recorded a substantial deterioration of their fiscal balances (see Figure 3.2 and Table A.3.5 in the Statistical Annex). In Moldova, the scale of this dete-rioration amounted to 2 percentage points of GDP over the period of 2003 – 2007 and it reflected an increase in debt servicing payments to official creditors follow-ing the Paris Club agreement in May 2007 (DG ECFIN, 2007a).
Table 3.3. GG cash surplus/deficit, per cent of GDP (GFS data) Country 2002 2003 2004 2005 2006 2007
Western Balkans Albania .. .. .. -3.50 -3.33 -3.52 Croatia -3.14 -3.85 -3.89 -2.80 -1.80 -1.12
CIS Europe Armenia .. -0.65 -0.79 -0.72 -0.26 .. Belarus .. -0.60 0.59 0.19 1.69 .. Georgia .. -0.88 0.80 1.40 1.70 0.31 Moldova 0.53 2.42 0.34 1.39 -0.46 -0.17 Russia 1.24 1.72 5.22 10.21 8.67 .. Ukraine 0.53 0.01 -3.41 -1.33 -1.01 -0.25
CIS Central Asia Kazakhstan 0.18 -0.49 -0.02 2.11 1.87 1.66 Kyrgyzstan .. .. .. .. -0.49 .. Tajikistan .. -10.49 -13.28 .. .. ..
Note. Data in italics indicates that data are preliminary or provisional. Source: IMF Government Finance Statistics Online.

Marek Dabrowski (Ed.), Roman Mogilevskiy (Ed.)
CASE Network Reports No. 92 46
Figure 3.2. GG budget balance, % of GDP (sources other than GFS)
-8
-6
-4
-2
0
2
4
6
8
10
Albania
Bosnia & Herzegovin
aCroatia
Kosovo
Macedonia
Montenegro
Serbia
Armenia
(Central G
ov)
Azerbaijan
Belarus (Centra
l Gov)
Georgia
Moldova
Russia (C
entral Gov)
Ukraine
Kazakhstan
Kyrgyzsta
n
Tajikista
n
Turkmenistan
Uzbekistan EU
EU NMS
% G
DP
2003 2007
For notes and sources, see Table A.3.5 in the Statistical Annex.
64. Due to their limited access to international borrowing markets, the analyzed
countries use mostly domestic financing (see Table A.3.6 in the Statistical An-nex)11. However, foreign borrowing played an important role in Ukraine (prior to the 2008 crisis), Moldova (loans from international organizations in 2007), Geor-gia (foreign government credit), and Armenia (international organizations in 2006). In the Western Balkans, foreign sources are not as significant as in the European CIS. With the financial crisis hitting emerging markets, the external sources of private financing are drying up. On the other hand, the IMF and World Bank obtained additional resources to support emerging market economies in dis-tress12 (see Chapter 6 on the role of both institutions).
11 Comparable time series on the structure and sources of general government deficit fi-nancing can be derived from the governments’ “Statements on sources and uses of cash” (contained in the GFS database) but they cover only a part of the sample countries. Thus, to identify sources of deficit financing, we used the GFS database, identifying net cash inflow from financial activities and subdividing it by domestic and foreign inflows. In addition, GFS data allowed exploring the roles of various institutional agents, both domes-tic and foreign, in balancing general government net cash flows. 12 As of June 30, 2009, 7 countries were subject to IMF programs: Armenia, Belarus, Geor-gia, Kyrgyzstan, Serbia, Tajikistan and Ukraine – see http://www.imf.org/external/np/fin/tad/extarr11.aspx?memberKey1=ZZZZ&date1key=2020-02-28.
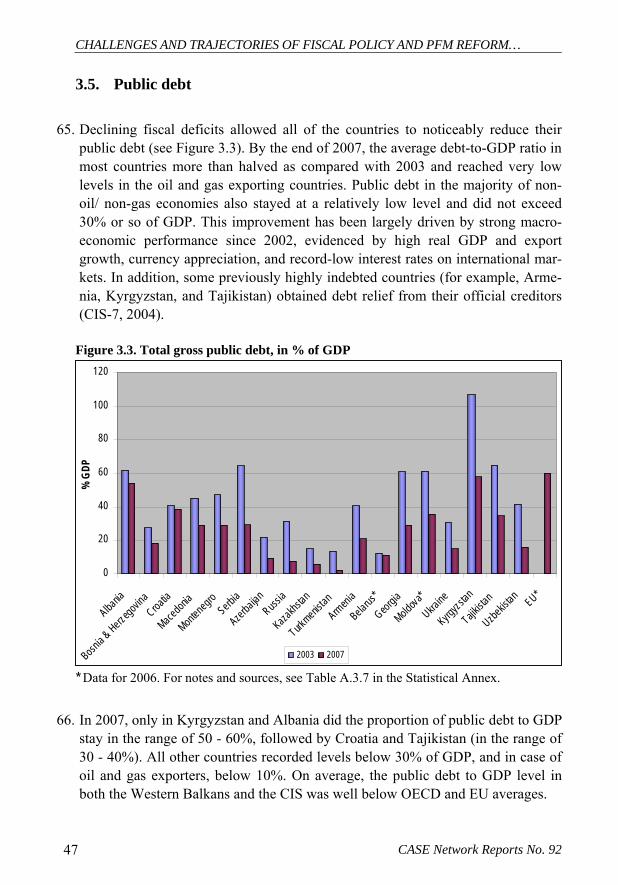
CHALLENGES AND TRAJECTORIES OF FISCAL POLICY AND PFM REFORM…
CASE Network Reports No. 92 47
3.5. Public debt
65. Declining fiscal deficits allowed all of the countries to noticeably reduce their public debt (see Figure 3.3). By the end of 2007, the average debt-to-GDP ratio in most countries more than halved as compared with 2003 and reached very low levels in the oil and gas exporting countries. Public debt in the majority of non-oil/ non-gas economies also stayed at a relatively low level and did not exceed 30% or so of GDP. This improvement has been largely driven by strong macro-economic performance since 2002, evidenced by high real GDP and export growth, currency appreciation, and record-low interest rates on international mar-kets. In addition, some previously highly indebted countries (for example, Arme-nia, Kyrgyzstan, and Tajikistan) obtained debt relief from their official creditors (CIS-7, 2004).
Figure 3.3. Total gross public debt, in % of GDP
0
20
40
60
80
100
120
Albania
Bosnia & Herzegovina
Croatia
Macedonia
MontenegroSerbia
AzerbaijanRussi
a
Kazakhstan
Turkmenis
tanArm
enia
Belarus*
Georgia
Moldova*
Ukraine
Kyrgyzsta
n
Tajikista
n
Uzbekistan EU*
% G
DP
2003 2007
* Data for 2006. For notes and sources, see Table A.3.7 in the Statistical Annex.
66. In 2007, only in Kyrgyzstan and Albania did the proportion of public debt to GDP stay in the range of 50 - 60%, followed by Croatia and Tajikistan (in the range of 30 - 40%). All other countries recorded levels below 30% of GDP, and in case of oil and gas exporters, below 10%. On average, the public debt to GDP level in both the Western Balkans and the CIS was well below OECD and EU averages.

Marek Dabrowski (Ed.), Roman Mogilevskiy (Ed.)
CASE Network Reports No. 92 48
67. The sovereign debt market was easily accessible in the early and mid 2000s due to excessive global liquidity, low international interest rates, and low risk premia. However, this changed quite dramatically in the second half of 2008 when the global financial crisis hit emerging market economies. This caused sudden capital outflows, higher risk premia and a higher cost of borrowing, a fall in commodity prices, a diminishing inflow of remittances and a depreciation of most currencies in CEE/CIS. As a result, debt-to-GDP ratios in many countries are expected to increase dramatically in 2009-2010, reversing most of the previous gains. For ex-ample, in Ukraine, this ratio is expected to increase from 15% in 2007 to over 40% in 2009. Some countries may be unable not only to finance new deficit but also to rollover existing debt obligations. Even when the current crisis ends it is unlikely that the era of abundant liquidity and easy deficit financing will come back soon.
3.6. Levels and dynamics of total public revenues and expenditures
68. As seen in Figure 3.4,13 the shares of both GG revenues and expenditures in GDP were either stable or even increased (Georgia, Moldova, Ukraine and, to a lesser extent, Belarus). This occurred despite extraordinarily high rates of economic growth, which meant very expansionary fiscal policies and an increasing size of government (but also improved administrative capacity for collecting revenue in comparison with the 1990s). Russia was the only exception: the total GG expendi-tures declined by some 16 percentage points of GDP between 2002 and 2006.
69. The size of public spending varies across the analyzed countries and is positively correlated with (1) per capita income and (2) proximity to Europe (Gray et al., 2007). A worldwide pattern is that the share of primary GG expenditures in GDP is positively correlated with per capita GDP (measured in PPP terms) – the so-called Wagner law. Figure 3.5 provides a more complete cross-country picture of total GG expenditure based on sources other than IMF GFS data.
70. Total public expenditures during the observed period ranged from almost one-half of GDP in Croatia (and other post-Yugoslav countries like Bosnia and Herzego-vina, Serbia and Macedonia) to less than one fourth of GDP in Armenia, Kazakh-stan, and Tajikistan. The latter figures are not only far below what is common in EU countries (generally above 40% of GDP), but even in Russia (30-35%).
13 A comparable dataset on public revenue and expenditure is incomplete. The best source, i.e. the IMF GFS contains data (sometimes incomplete) for only 11 countries.

CHALLENGES AND TRAJECTORIES OF FISCAL POLICY AND PFM REFORM…
CASE Network Reports No. 92 49
Figure 3.4. GG expenditures and revenues (2006), % of GDP
0
10
20
30
40
50
60
Albania Croatia Armenia Belarus Georgia Moldov a Russia Ukraine Kazakhstan Ky rgy zstan Tajikistan*
GG Ex penditures 2003 GG Rev enues 2003 GG Ex penditures 2006 GG Rev enues 2006
* Data for 2003 and 2004. Source: IMF Government Finance Statistics Online. Figure 3.5. GG expenditure as % of GDP (sources other than GFS)
0
10
20
30
40
50
60
70
Albania
Bosnia &
Herzegovin
aCroatia
Kosovo
Montene
groSerb
ia
Macedonia
Belarus
Moldova
Russia
Ukraine
Armenia
Azerbaijan
Georgia
Kazakhs
tan
Kyrgyzs
tan
Tajikista
n
Turkmeni
stan
Uzbekis
tan
% G
DP
1999 2002 2006
Source: All countries except Kosovo: WHO online database (http://www.who.int/nha/country/en/), and own computations. Kosovo: World Bank (2008), Kosovo. Health Financing Reform Study, Tables 2.1 and 4.2 adjusted to WHO tables; GDP & budget 2000-2003: Fact Sheet Kosovo (May 2003), www.unmikonline.org, and own computations.

Marek Dabrowski (Ed.), Roman Mogilevskiy (Ed.)
CASE Network Reports No. 92 50
71. Overall, however, governments in the analyzed countries tend to be large by international standards. With the exception of the low-income CIS countries, the average size of public sector spending in the region is above that of other coun-tries at similar levels of per capita income, and well above the high-growth coun-tries outside the region. According to Gray et al. (2007), most of the Western Bal-kan and middle-income CIS countries lie above the international trend line, and only the low-income CIS countries lie below it.
72. The large size of governments partly reflects socialist legacies, especially a history of state-sponsored provision of welfare security throughout the life cycle (see Chapter 4). On the other hand, in countries where post-communist social safety nets collapsed in early the years of transition (as result of armed conflicts or hyperinflations), social spending increased again in recent years, partly due to population ageing that put pressure on higher spending for pensions and health. In Western Balkan countries, more generous social protection schemes tend to mir-ror those in higher-income EU countries rather than the more modest programs in the CIS middle-income countries (Gray et al., 2007).
3.7. Structure of public revenues
73. Total GG revenues, including grants, ranged from approximately 48% of GDP in Belarus to about 19% of GDP in Armenia in 2006-2007 (Table 3.4)14. On aver-age, total GG revenues are higher in the Western Balkans (where their percentage in GDP is close to many of the EU member states) than in the European CIS countries. In most countries analyzed, the share of total GG revenues in GDP tends to grow overtime due to a broadening tax base (including resource-based taxes) and improvements in tax collection.
74. There is also considerable variation within sub-regions (by a factor of two): in the Western Balkans it ranges from 46% of GDP in Croatia to 25.6% of GDP in Al-bania; in the middle-income CIS it ranges from 21.8% of GDP in Kazakhstan to 48% of GDP in Belarus; while in the low-income CIS countries the range is from 19.9% of GDP in Armenia to 41.8% of GDP in Moldova.
75. The share of tax revenues in total revenues is generally lower in comparison with EU countries (see Table 3.4), varying from 53.6% in Ukraine to 82.0% in Kazakh-stan. The share of tax revenues relative to GDP is substantially smaller compared to the EU average (39.6% in 2005), especially in Albania, Armenia, Georgia, Kazakh- 14 IMF GFS database provides comparable cross-country data for 13 countries only.

CHALLENGES AND TRAJECTORIES OF FISCAL POLICY AND PFM REFORM…
CASE Network Reports No. 92 51
stan, Kyrgyzstan, and Tajikistan. In most countries, non-tax revenues and grants (from foreign donors) account for a considerable part of GG revenues.
Table 3.4. Structure of GG revenue (on the basis of government operations)
% GDP % of total revenues
Economy Year Total reve-nue
Taxes
Social con-
tribu-tions
GrantsOther reve-nue
Taxes
Social con-
tribu-tions
Grants Other reve-nue
Western Balkans 2005 24.9 17.7 4.4 0.8 2.0 71.2 17.6 3.0 8.1 Albania 2007 25.8 18.9 4.2 0.1 2.5 73.2 16.5 0.5 9.8 2005 42.1 23.6 12.4 0.4 5.6 56.2 29.5 1.0 13.3 Bosnia & Her-
zegovina** 2007 45.4 25.6 13.4 0.2 6.2 56.3 29.6 0.4 13.7 2003 45.0 27.1 13.8 0.0 4.1 60.3 30.7 0.0 9.0 Croatia 2007 46.1 26.7 13.5 0.2 5.7 57.9 29.4 0.4 12.4
Serbia & Mon-tenegro 2002 43.2 28.2 11.0 1.0 3.1 65.1 25.4 2.2 7.3
CIS Europe 2003* 21.7 14.4 2.8 3.2 1.3 66.6 12.7 14.6 6.2 Armenia 2006 19.9 14.8 2.3 0.6 2.2 74.4 11.3 3.2 11.2 2003 45.8 33.8 10.6 0.0 1.4 73.8 23.2 0.0 3.0 Belarus 2006 48.2 34.0 11.7 0.0 2.5 70.5 24.3 0.0 5.2 2004 23.1 15.6 4.1 1.3 2.1 67.5 17.7 5.5 9.3 Georgia 2007 29.3 21.6 4.2 0.6 2.8 73.8 14.5 2.1 9.6 2003 34.1 20.7 7.2 0.0 6.2 60.8 21.0 0.0 18.2 Moldova 2007 41.8 25.7 9.6 1.8 4.7 61.4 23.0 4.3 11.4
2003** 40.1 22.5 8.4 0.0 9.2 56.2 20.8 0.0 23.0 Russia 2006 40.4 26.5 5.6 0.0 8.2 65.7 13.9 0.0 20.4 2003 38.0 20.5 11.2 0.1 6.3 53.8 29.4 0.2 16.5 Ukraine 2007 42.2 22.7 13.1 0.0 6.5 53.6 31.0 0.0 15.3
CIS Central Asia 2003 21.5 20.5 0.0 0.0 1.0 95.5 0.0 0.0 4.5 Kazakhstan 2007 21.8 17.9 0.0 0.0 3.9 82.0 0.0 0.0 17.9
Kyrgyzstan 2006 21.9 16.6 0.0 0.2 5.0 75.9 0.0 1.1 23.0 2003 17.3 12.8 1.7 0.3 2.5 74.1 9.7 1.8 14.4 Tajikistan 2004 17.9 12.7 1.8 0.7 2.8 70.7 9.8 3.7 15.8
Note. Revenues are reported on the cash basis of reporting unless indicated otherwise, * Data are provisional or preliminary, ** Accrual basis of reporting. Sources: Revenue data - from IMF Government Finance Statistics Online; GDP data - from IMF World Economic Outlook database.
76. The proportion of indirect taxation15 to GDP is relatively high by international standards and close to the EU average (ca. 14% GDP) in Albania, Georgia, Kyr-gyzstan, Russia, and Ukraine (see Table 3.5). Only a few countries remain below
15 Taxes on goods and services and taxes on international trade and transactions (codes 114+115).
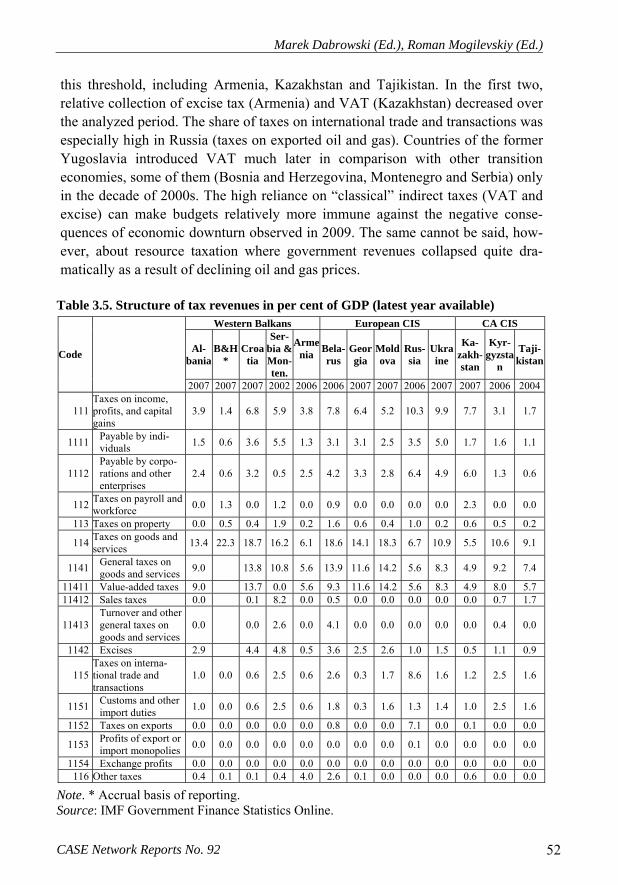
Marek Dabrowski (Ed.), Roman Mogilevskiy (Ed.)
CASE Network Reports No. 92 52
this threshold, including Armenia, Kazakhstan and Tajikistan. In the first two, relative collection of excise tax (Armenia) and VAT (Kazakhstan) decreased over the analyzed period. The share of taxes on international trade and transactions was especially high in Russia (taxes on exported oil and gas). Countries of the former Yugoslavia introduced VAT much later in comparison with other transition economies, some of them (Bosnia and Herzegovina, Montenegro and Serbia) only in the decade of 2000s. The high reliance on “classical” indirect taxes (VAT and excise) can make budgets relatively more immune against the negative conse-quences of economic downturn observed in 2009. The same cannot be said, how-ever, about resource taxation where government revenues collapsed quite dra-matically as a result of declining oil and gas prices.
Table 3.5. Structure of tax revenues in per cent of GDP (latest year available)
Western Balkans European CIS CA CIS
Al-bania
B&H*
Croatia
Ser-bia & Mon-ten.
Armenia Bela-
rus Georgia
Moldova
Rus-sia
Ukraine
Ka-zakh-stan
Kyr-gyzsta
n
Taji-kistan Code
2007 2007 2007 2002 2006 2006 2007 2007 2006 2007 2007 2006 2004
111 Taxes on income, profits, and capital gains
3.9 1.4 6.8 5.9 3.8 7.8 6.4 5.2 10.3 9.9 7.7 3.1 1.7
1111 Payable by indi-viduals 1.5 0.6 3.6 5.5 1.3 3.1 3.1 2.5 3.5 5.0 1.7 1.6 1.1
1112 Payable by corpo-rations and other enterprises
2.4 0.6 3.2 0.5 2.5 4.2 3.3 2.8 6.4 4.9 6.0 1.3 0.6
112 Taxes on payroll and workforce 0.0 1.3 0.0 1.2 0.0 0.9 0.0 0.0 0.0 0.0 2.3 0.0 0.0
113 Taxes on property 0.0 0.5 0.4 1.9 0.2 1.6 0.6 0.4 1.0 0.2 0.6 0.5 0.2
114 Taxes on goods and services 13.4 22.3 18.7 16.2 6.1 18.6 14.1 18.3 6.7 10.9 5.5 10.6 9.1
1141 General taxes on goods and services 9.0 13.8 10.8 5.6 13.9 11.6 14.2 5.6 8.3 4.9 9.2 7.4
11411 Value-added taxes 9.0 13.7 0.0 5.6 9.3 11.6 14.2 5.6 8.3 4.9 8.0 5.7 11412 Sales taxes 0.0 0.1 8.2 0.0 0.5 0.0 0.0 0.0 0.0 0.0 0.7 1.7
11413 Turnover and other general taxes on goods and services
0.0 0.0 2.6 0.0 4.1 0.0 0.0 0.0 0.0 0.0 0.4 0.0
1142 Excises 2.9 4.4 4.8 0.5 3.6 2.5 2.6 1.0 1.5 0.5 1.1 0.9
115 Taxes on interna-tional trade and transactions
1.0 0.0 0.6 2.5 0.6 2.6 0.3 1.7 8.6 1.6 1.2 2.5 1.6
1151 Customs and other import duties 1.0 0.0 0.6 2.5 0.6 1.8 0.3 1.6 1.3 1.4 1.0 2.5 1.6
1152 Taxes on exports 0.0 0.0 0.0 0.0 0.0 0.8 0.0 0.0 7.1 0.0 0.1 0.0 0.0
1153 Profits of export or import monopolies 0.0 0.0 0.0 0.0 0.0 0.0 0.0 0.0 0.1 0.0 0.0 0.0 0.0
1154 Exchange profits 0.0 0.0 0.0 0.0 0.0 0.0 0.0 0.0 0.0 0.0 0.0 0.0 0.0 116 Other taxes 0.4 0.1 0.1 0.4 4.0 2.6 0.1 0.0 0.0 0.0 0.6 0.0 0.0
Note. * Accrual basis of reporting. Source: IMF Government Finance Statistics Online.

CHALLENGES AND TRAJECTORIES OF FISCAL POLICY AND PFM REFORM…
CASE Network Reports No. 92 53
77. Direct tax collection was relatively high in middle-income CIS countries, as well
as in Croatia, Serbia and Montenegro, although in none of these countries did it reach the EU average (ca. 13% of GDP). In all other countries, it remained at a low level and ranged from 1.8% of GDP in Tajikistan to 7% of GDP in Georgia.
78. Social security contributions are particularly important as a source of GG reve-nues in the Western Balkans (in Bosnia and Herzegovina, Croatia and Serbia) as well as in several middle-income CIS countries such as Belarus and Ukraine, where respective shares in GDP recently attained the EU average (ca. 12% of GDP). In Moldova, these shares also grew recently, approaching the European level. In the remaining countries, these percentages are extremely low or non-existent, while Russia recently recorded a decrease.
Table 3.6. Labor Taxes in CIS and Western Balkans, 2006
Social security contributions Economy Tax wedge Employer’s part Employee’s part
Personal income tax
Western Balkans Albania 33.4 30.4 11.5 1.6 Bosnia and Herzegovina (FBH) 34.9 14.5 25.5 0.0
Croatia 40.3 17.2 20.0 10.0 Macedonia 41.4 47.1 0.0 13.8 Serbia & Montenegro (Serbia) 42.2 17.9 17.9 14.0
CIS Europe Armenia 38.5 22.0 15.0 10.0 Azerbaijan 29.8 22.0 4.0 10.4 Belarus 35.5 39.6 1.0 9.0 Georgia 26.7 20.0 0.0 12.0 Moldova 32.4 28.0 5.0 8.5 Russia 31.0 26.0 0.0 13.0 Ukraine 39.2 38.0 3.5 12.5
CIS Central Asia Kazakhstan 28.2 17.0 10.0 6.0 Kyrgyzstan 31.6 21.0 8.0 9.2 Tajikistan 29.6 27.0 1.0 9.6 Uzbekistan 38.0 25.0 2.5 20.0
Note. FBH = Federation of Bosnia and Herzegovina, which is one of two entities that con-stitute Bosnia and Herzegovina. The other entity, Republika Srpska, is not covered in this table as data are not available. a Data refer to effective rates on average wage. Source: Gray et al. (2007).

Marek Dabrowski (Ed.), Roman Mogilevskiy (Ed.)
CASE Network Reports No. 92 54
79. Social security contributions added to the personal income tax creating a so-called tax wedge, presented as a percentage of total labor cost16. The size of the tax wedge determines labor market flexibility and influences, indirectly, the size of the informal economy. According to Table 3.6, it is the highest in Western Balkan countries, especially in Serbia, Macedonia and Croatia and quite high in Armenia, Ukraine and Uzbekistan. On the other end, in Georgia, Kazakhstan and Tajikistan its size is below 30% of total labor costs.
80. In recent years, many CIS and SEE countries have undertaken reforms of their social security systems with the explicit aim of reducing the tax wedge on labor and improving labor market incentives. Their examples are presented in Box 3.1.
Box 3.1. Examples of social security reforms Albania. In 2006, Albania reduced social security contributions by 9 percentage points, including a 6 percentage point reduction in pension contributions (to 23.5%) and a 3 per-centage point reduction in unemployment insurance (to 2%). The cut in contributions was coupled with a substantial rise in pensions (20% for rural and 5% for urban pensions). The government is prepared to cover any emerging deficit, which will mean a partial switch from a contribution financed - to general revenue - financed system. Armenia. Like in many low-income countries, Armenia suffers from ineffective revenue collection due to poor administrative capacity. To address this problem contribution col-lection was moved from the social security system to general tax administration. The effect of this change was significant: in 2005, when the reform was implemented, social security payments increased by 34% (compared with growth in nominal GDP of 18%). Croatia. Croatia has gradually reduced the tax wedge on labor through a substantial re-duction in both social security contributions and PIT rates. Social security contributions paid by the employer were reduced to 17.2% in 2004, whereas those paid by the em-ployee to 20% in 2004. Simultaneously, the effective PIT rate (for a worker with the av-erage wage) was cut to 10% in 2004. In 2004 the pension contribution accounted for 20% of worker gross wage and was paid only by the employee. A further 2.5 percentage point reduction in social security contributions was achieved by moving the child benefit out of the social insurance system and switching to general tax financing. There has been no reduction in the health insurance contribution rate (15% of gross wage), although cur-rently it is paid only by the employer. Similarly, unemployment insurance (1.7%) was not reduced, but it is currently paid only by the employer, with the total rate unchanged. Overall, Croatia has maintained a roughly even split between the employer and employee shares in social security contributions, in contrast to other countries where social security contributions are still largely paid by the employer. Georgia. In 2004, Georgia simplified and consolidated its social security system and in-troduced a unified 20% social security contribution paid only by the employer. The re-form entailed a 3 percentage point reduction in the total social security contribution (in-cluding the elimination of a 1% unemployment insurance contribution paid by the
16 Defined as gross wage plus employer’s social security contributions; gross wage is the net wage plus the employee's social security contributions and the personal income tax.

CHALLENGES AND TRAJECTORIES OF FISCAL POLICY AND PFM REFORM…
CASE Network Reports No. 92 55
employee) and a consolidation of various contributions (pension, health, unemployment) into a single one. Reduction in the contribution rate was coupled with measures to im-prove the system’s efficiency. Nonetheless, the social security system requires budgetary transfers to cover the gap between expenditures and revenues. In addition to lower tax rates, a substantial liberalization of the labor code, which went into effect in 2006, en-ticed many firms to move from the informal to the formal sector. As a result, social secu-rity revenues have increased. Kyrgyzstan. In 2005, Kyrgyzstan moved away from contribution financing to general tax financing of unemployment and other social security benefits (but not pensions). The Employment Fund and the Social Insurance Fund were eliminated, and the responsibility for paying the relevant benefits was taken over by the government budget. This allowed the government to lower the rate of social security contributions paid by the employer from 25 to 23%. The rate paid by the employee remained unchanged at 8%.
Source: Gray et al. (2007).
81. In the mid-2000s, other revenues, i.e. revenues from government services17 and from state-owned enterprises18 ranged from 0.97% of GDP (Kazakhstan, 2007) to 8.24% of GDP (Russia, 2006). They were also high in Ukraine, Bosnia and Herze-govina, Croatia, and Moldova. In the decade of 2000s, dependence on foreign grants as a source of government revenues decreased radically in the region. In 2007 their proportion to GDP stayed below 1% everywhere but Moldova (1.79%)19.
3.8. Oil and gas related revenues
82. Oil and natural gas production and export play very important roles in the eco-nomic development of at least four CIS economies: Azerbaijan, Kazakhstan, Rus-sia and Turkmenistan. The share of revenues from fossil fuel exports in GG reve-nues in Russia, Azerbaijan and Kazakhstan remained high throughout the whole analyzed period and tended to grow in line with the improvements in the terms of trade until mid-2008 (see Table 3.7).
17 This includes sales by market establishments, administrative fees, incidental sales by non-market establishments, and imputed sales of goods and services covering, but is not limited to revenues from government services (GFS Manual, 2001). 18 This item incorporates income received when a unit places a financial asset or a tangible nonproduced asset that it owns at the disposal of another unit, and includes types of prop-erty income such as interest, dividends, withdrawals from income of quasi-corporations, property income attributed to insurance policyholders, and rent (GFS Manual, 2001). 19 The available database does not cover Kosovo, where the importance of foreign grants is probably still higher.

Marek Dabrowski (Ed.), Roman Mogilevskiy (Ed.)
CASE Network Reports No. 92 56
Table 3.7. Oil exporters: GG oil revenue, % of GDP and total revenue. GG non-oil fiscal balance (% of non-oil GDP) Russia Azerbaijan¹ Kazakhstan Turkmenistan
% GDP 6.5 10.1 7 .. % General govt revenue 21.3 37.8 28.6 .. 2004 General govt non-oil fiscal balance -2.9 -13.2 -6.5 -9.9
% GDP 10.4 9.8 10.6 .. % General govt revenue 31.1 39 37.7 .. 2005 General govt non-oil fiscal balance -5.1 -12.9 -7.4 -12.3
% GDP 11.3 14.2 10.2 .. % General govt revenue 32.7 50.8 37.1 .. 2006 General govt non-oil fiscal balance -4.5 -31.3 -4.3 -7.4
% GDP 9.2* 15.8* 9.5 .. % General govt revenue 26.6 53.4* 32.1 .. 2007 General govt non-oil fiscal balance -5.5*² -31.7* -6.6* -6.4*
Note. * Preliminary estimates; ¹ Central government revenue. Includes SOCAR tax credits for energy subsidies; excludes VAT and excise taxes on oil and gas; ² Excludes on-off tax receipts from Yukos. Sources: Data on GG non-oil fiscal balance are from REO-MECA (2008), IMF (2007; 2008a, 2008b, 2008c).
83. By comparing the data on government non-oil fiscal balances of oil and gas
exporting countries (Table 3.7) with GG budget balances presented in section 3.5, we can clearly see that their budget surpluses were predominantly oil-driven. Rus-sia’s strong headline fiscal surplus was achieved on the back of high energy prices, and in spite of the fiscal expansion before the 2007-2008 electoral cycle. At the same time, Russia’s non-oil deficit widened in 2006 to nearly 7% of GDP, from less than 6% in 2005. Azerbaijan, the second major energy exporter, contin-ued its fiscal expansion until 2008. The GG surplus increased further in 2006 (to more than 3% of GDP), but this result was achieved at a time when fiscal revenue increased by 88%! Also, the assets of the Azerbaijan State Oil Fund, where part of the oil windfall was accumulated, rose much slower than nominal GDP and, at the end of 2006, its size in relation to GDP amounted to 7%, down from about 11% the year before. At the same time, a similar oil fund in Russia increased at a much faster pace and exceeded 9% of GDP (DG ECFIN, 2007a). In Belarus, the government saved most of the fiscal windfall generated by exports of refined oil products in its own stabilization fund (called the National Development Fund), in view of the expected (and confirmed) end of the special arrangements with Russia on exports of oil products.

CHALLENGES AND TRAJECTORIES OF FISCAL POLICY AND PFM REFORM…
CASE Network Reports No. 92 57
84. The collapse of international oil prices in the third quarter of 2008 radically changed the fiscal outlook of oil producing countries. REO-EU (2009, Table 2, p. 8) estimates and forecasts Russia’s GG balance is going to change from +4.3% in 2008 (already down from +6.8% in 2007) to – 6.2% in 2009. In the case of Ka-zakhstan, the GG surplus already went down from +7.2% in 2006 to +1.1% in 2008 and is expected to deteriorate further to -2.0% in 2009. In Azerbaijan a cen-tral government (CG) surplus of 22.4% of GDP in 2008 will be replaced by a deficit of 1.5% of GDP. In Turkmenistan, the CG surplus will deteriorate from +11% to 5% of GDP (REO-MECA, 2009, Table 6, p. 41). So far Russia seems to be the most seriously affected among the four analyzed countries, and the Oil Stabilization Fund it accumulated in the 2000s may have to be totally spent in 2009-2010.

Marek Dabrowski (Ed.), Roman Mogilevskiy (Ed.)
CASE Network Reports No. 92 58
4. Structure and Dynamics of Public Expenditures
85. This chapter contains an analysis of how a government’s resources are spent, and answered questions such as: What are the sectoral and intra-sectoral priorities? To what extent can they help to reduce poverty? Do they help reduce or increase ine-quality? Do they target those who are truly in need? Do they address the sources of poverty and inequality or only their symptoms? Which population groups are preferred? What is the political economy of public expenditure policies?
4.1. Structure of expenditures by sector
86. The structure of government expenditure can be analyzed using either an eco-nomic or functional classification. The first classification identifies the types of expenses incurred for the production (or purchase from a third party) of goods and services and their distribution (or cash transfer) to households so they can pur-chase the goods and services directly. These include the compensation of employ-ees, the use of goods and services, and the consumption of fixed capital, all of which relate to the costs of production undertaken by the government itself. They also include subsidies, grants, social benefits, and other miscellaneous expenses related to transfers in cash or in kind and purchases of goods and services from third parties for delivery to other units (see Tables A.4.1 and A.4.3 in the Statisti-cal Annex). The functional classification provides information about the purpose for which expenses are incurred (Tables A.4.2 and A.4.4 in the Statistical Annex). Box 4.1 provides comments on data constraints in this type of analysis.
87. Both the economic and functional breakdown of expenditures clearly demon-strates that social benefits are the major spending item in most countries under review. They are defined as transfers in cash or in kind to protect the entire popu-lation or specific segments from various social risks. The examples include un-employment compensation or publicly financed pensions. They are classified ac-cording to the type of scheme governing their payment, which are: social security, social assistance, and employment social insurance schemes. As a rule, the larger
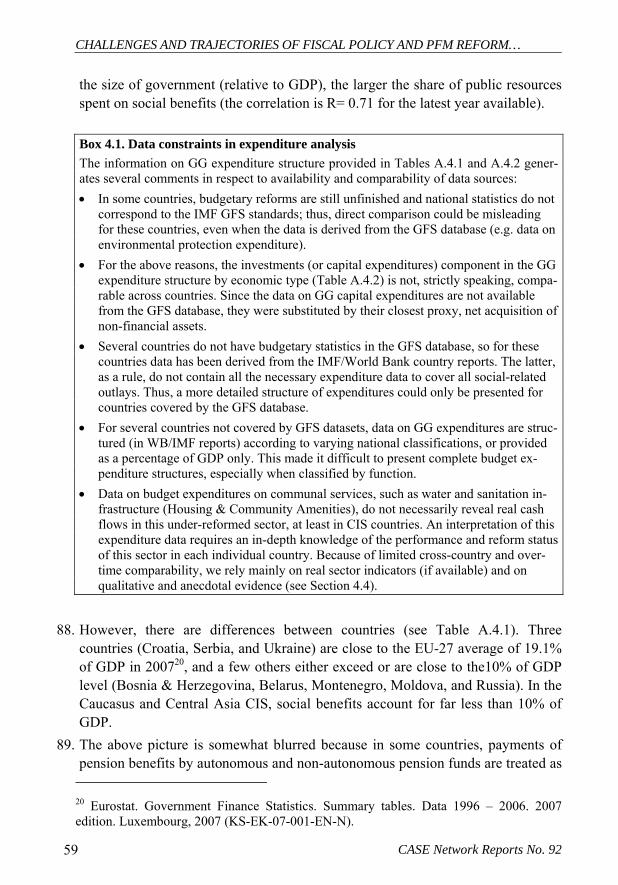
CHALLENGES AND TRAJECTORIES OF FISCAL POLICY AND PFM REFORM…
CASE Network Reports No. 92 59
the size of government (relative to GDP), the larger the share of public resources spent on social benefits (the correlation is R= 0.71 for the latest year available).
Box 4.1. Data constraints in expenditure analysis The information on GG expenditure structure provided in Tables A.4.1 and A.4.2 gener-ates several comments in respect to availability and comparability of data sources: • In some countries, budgetary reforms are still unfinished and national statistics do not
correspond to the IMF GFS standards; thus, direct comparison could be misleading for these countries, even when the data is derived from the GFS database (e.g. data on environmental protection expenditure).
• For the above reasons, the investments (or capital expenditures) component in the GG expenditure structure by economic type (Table A.4.2) is not, strictly speaking, compa-rable across countries. Since the data on GG capital expenditures are not available from the GFS database, they were substituted by their closest proxy, net acquisition of non-financial assets.
• Several countries do not have budgetary statistics in the GFS database, so for these countries data has been derived from the IMF/World Bank country reports. The latter, as a rule, do not contain all the necessary expenditure data to cover all social-related outlays. Thus, a more detailed structure of expenditures could only be presented for countries covered by the GFS database.
• For several countries not covered by GFS datasets, data on GG expenditures are struc-tured (in WB/IMF reports) according to varying national classifications, or provided as a percentage of GDP only. This made it difficult to present complete budget ex-penditure structures, especially when classified by function.
• Data on budget expenditures on communal services, such as water and sanitation in-frastructure (Housing & Community Amenities), do not necessarily reveal real cash flows in this under-reformed sector, at least in CIS countries. An interpretation of this expenditure data requires an in-depth knowledge of the performance and reform status of this sector in each individual country. Because of limited cross-country and over-time comparability, we rely mainly on real sector indicators (if available) and on qualitative and anecdotal evidence (see Section 4.4).
88. However, there are differences between countries (see Table A.4.1). Three
countries (Croatia, Serbia, and Ukraine) are close to the EU-27 average of 19.1% of GDP in 200720, and a few others either exceed or are close to the10% of GDP level (Bosnia & Herzegovina, Belarus, Montenegro, Moldova, and Russia). In the Caucasus and Central Asia CIS, social benefits account for far less than 10% of GDP.
89. The above picture is somewhat blurred because in some countries, payments of pension benefits by autonomous and non-autonomous pension funds are treated as 20 Eurostat. Government Finance Statistics. Summary tables. Data 1996 – 2006. 2007 edition. Luxembourg, 2007 (KS-EK-07-001-EN-N).

Marek Dabrowski (Ed.), Roman Mogilevskiy (Ed.)
CASE Network Reports No. 92 60
transfer payments and thus are not recorded as “Social benefits”. Correspond-ingly, within “Employer social benefits”, outlays on pensions and other retirement benefits are in some cases treated as reductions in liabilities rather than social benefits expenses. This is the case, for example, for “Social security benefits” in Albania and Bosnia & Herzegovina, and for “Employer social benefits” in Arme-nia, Georgia, Belarus, Kazakhstan and Kyrgyzstan.
90. The second largest expenditure item is compensation of employees, including employers’ social contributions (actual and imputed). Table A.4.1 suggests that this item is highly correlated with the total government size (R=0.81). The highest share is recorded in Montenegro (12.7% of GDP), followed closely by Serbia (12.1%), Bosnia & Herzegovina (11.7%), Croatia (11.3%), Ukraine (10.4%), and Belarus (10.4%), which are all close to the EU-27 average (10.7% of GDP in 2006). At the other end of the analyzed spectrum, are the Caucasus countries, Ka-zakhstan and Tajikistan, where compensation of employees does not exceed 4% of GDP.
91. Use of goods and services (referred to in EU government finance statistics as “Intermediate consumption”) is the third most important category of government expenditure. In the EU-27, it accounted for 14% of total government expenditure and 6.4% of GDP in 2006. As Table A.4.1 suggests, in more than half of the ana-lyzed countries, this share exceeds the EU 27 average, while the corresponding proportion to total government expenditure is higher than the EU average in al-most all countries for which information is available, except Albania and Croatia (Table A.4.3).
92. The high share of subsidies in the overall budget expenditures reflects the slow progress in budgetary reform and sectoral reforms, for example, the slow privati-zation of infrastructural sectors (like housing and communal services). This is the case in Russia and Belarus, where the share of subsidies in GDP amounted to 4.7% of GDP and 8.1% of GDP respectively. They do not exceed 3% of GDP in Georgia, Bosnia & Herzegovina, Tajikistan, Croatia, Serbia, and Ukraine. They less than 1% of GDP (which is an average EU-27 indicator) in Albania, Azerbai-jan, Armenia, Montenegro, Kazakhstan, Kyrgyzstan and Macedonia.
93. The share of net acquisitions of fixed assets (acquisitions less disposals) in the total government expenditures in all analyzed countries (except Ukraine) is much higher than the EU-27 average for the gross capital formation item (5.4% of total expenditure in 2006). The possible explanation can relate to the specific role of the state budget in the process of acquisitions, disposals, and consumption of fixed capital in transition countries. The similarly high proportion of this item can be observed in Romania, the Baltic countries and the Czech Republic (more than

CHALLENGES AND TRAJECTORIES OF FISCAL POLICY AND PFM REFORM…
CASE Network Reports No. 92 61
11%), while the old EU members record much lower levels – below 4% in Aus-tria, Germany, Belgium and Denmark (Paternoster et al., 2006).
94. The functional breakdown of government expenditures provides an additional dimension of comparative analysis. Tables A.4.2 and A.4.4 reveal high shares of expenditures on social protection21 in Ukraine (in the range of 19-20% of GDP) followed by Croatia, Serbia, Bosnia & Herzegovina, Belarus and Moldova. With the exception of Ukraine, all of the above countries are close to the EU-27 aver-age (18.8 % of GDP in 2004) 22. The remaining countries record lower propor-tions, with Azerbaijan, Kyrgyzstan and Kazakhstan staying in the range of 2-4% of GDP.
95. Compared to the EU-25 (3.7% of GDP in 2004; see Trends, 2006), all European CIS countries except Ukraine record high expenditures on general public ser-vices23. Moreover, in the mid 2000s, this item further increased. The remaining countries demonstrated a low level of these expenditures and/or a considerable decrease during the analyzed period.
96. In 2007, expenditures on defense (military and civil defense, as well as foreign military aid and defense R&D) varied from 8.8% of GDP (over 30% of the total government expenditure) in Georgia to 0.5% GDP (1.2% of total government spending) in Moldova. Compared with the EU-25 average (1.6% of GDP in 2004), substantially higher levels were recorded in Russia (2.6% GDP and 8.0% of total expenditure) and the Caucasus countries.
97. Expenditures on public order and safety encompass mainly police and fire services, law courts and prisons. In the EU-15, they accounted for 1.7% of GDP in 2004. Most of the countries analyzed in this report demonstrate higher levels of this expenditure.
98. Expenditures on economic affairs include, for example, various support pro-grams to industry or agriculture, subsidies and public infrastructure spending in the mining, manufacturing, agricultural, energy, construction, transport, commu-nication and other service industries. In the EU-25, they amounted to 3.9% of GDP in 2004. As was mentioned above, due to the unfinished reform process, the CEE/CIS countries record much a higher level of these expenditures. This con-
21 This item includes outlays on sickness and disability, old age, survivors, family and children, unemployment, housing, other forms of social exclusion, and R&D on social protection 22 Europe in figures — Eurostat yearbook 2008 (KS-CD-07-001-EN-C). 23 Expenses related to executive and legislative bodies, financial and fiscal affairs, external affairs, foreign economic aid, general services, basic research, and expenses related to debt.

Marek Dabrowski (Ed.), Roman Mogilevskiy (Ed.)
CASE Network Reports No. 92 62
cerns especially Albania, Croatia and Serbia in the Westerns Balkans region, and Belarus, Moldova, Ukraine and Azerbaijan in the CIS.
99. Health and education constitute the second and third most important items, after social protection, in total GG expenditures. Contrary to the EU-25 average where health expenditures are the second most important item (6.4% of GDP in 2004), in the majority of the CEE/CIS countries, education expenditures represent a higher share of GDP than health. Public expenditures on health remain higher compared to those on education only in Bosnia & Herzegovina, Croatia, and Rus-sia (see Tables A.4.2 and A.4.4). Health related outlays24 in all of the analyzed countries are considerably lower (relative to GDP) than the EU average. In gen-eral, the Western Balkan countries (Bosnia & Herzegovina, Croatia and Serbia) are characterized by relatively higher shares of health expenditures; in the Euro-pean CIS countries they are lower; and even much lower in the Caucasus and Central Asia (below 3% of GDP).
100. Expenditures on education (pre-primary, primary, secondary, post-secondary non-tertiary, tertiary, R&D related to education) are also considerably lower in most of the analyzed countries than in the EU-25 (5.3% of GDP in 2004). Only Belarus, Moldova, Ukraine, Bosnia & Herzegovina, Kyrgyzstan and Croatia re-cord somewhat higher levels.
101. Expenditures on housing and community amenities include housing and community development, water supply and street lighting. In general, the ana-lyzed countries demonstrate high levels of outlays relative to GDP in this cate-gory, which far exceed the average EU-25 level (1.0% of GDP in 2004), with the exception of Armenia and Azerbaijan.
102. Expenditures on environmental protection cover waste management (including waste water), pollution abatement, protection of biodiversity and landscapes, as well as associated R&D expenditure. This item is the smallest one in all countries for which data are available, below the EU-25 average (which was 0.7% of GDP in 2004). However, the recorded amounts are probably underestimated for meth-odological reasons.
103. In the majority of the analyzed countries, government spending on recreation, culture and religion are lower or close to the average of the EU-25 level (ca. 1% of GDP). Only Croatia and Belarus record higher levels of financing.
24 This includes government spending on medical products, medical appliances and equipment, outpatient services, hospital services, public health services and R&D in health.

CHALLENGES AND TRAJECTORIES OF FISCAL POLICY AND PFM REFORM…
CASE Network Reports No. 92 63
4.2. Public spending on education, health, social protection, water and utilities and intra-sectoral expenditure structure
104. The analyzed set of countries is diverse in terms of proportions of government
spending on social protection, health and education. Several groups can be sin-gled out:
• Countries with a high overall level of government expenditures and a relatively high level of social expenditures as a proportion of GDP (West Balkans excluding Albania, Moldova, Belarus and Ukraine). This is also true for health and education expenditures.
• Countries with low government expenditures, which have, at the same time, low proportions of social protection, health and education expendi-tures in GDP (Caucasus, Kazakhstan and Kyrgyzstan).
• Albania and Russia, which represent an intermediate position.
4.2.1. Health
105. As discussed in Section 4.1, public expenditures on health vary between ca. 6% of GDP in Croatia and Montenegro and less than 1% of GDP in Azerbaijan.25 Gray et al.(2007) confirm that public spending on health is closely associated with per capita income and is more stable over time than education spending: i.e. richer countries allocate a larger proportion of GDP while poorer countries tend to spend less. The age structure of the population (proportion of population of 65+) and some institutional characteristics (for example, a higher ratio of inpatient care spending) are also positively correlated with the share of health spending in GDP.
106. In most of the countries where government expenditures on health are low, they are supplemented with private sources of financing, which increase the overall level of health expenditure, sometimes even close to the EU-27 average (8.2% of GDP in 200626) as in the case of most West Balkan countries.
107. In the European CIS countries, private resources allowed for an increase in total health expenditures by 30-50%. However, only Georgia managed to reach EU levels of health expenditures as a percentage of GDP, due to the considerable pri-
25 In this section, when analyzing health spending, we rely mostly on WHO data, which are harmonized for international comparability. Official national statistics may use alternative methods of data computation. 26 WHO National Health Accounts (June 2008). More information at http://www.who.int/nha/country/en/
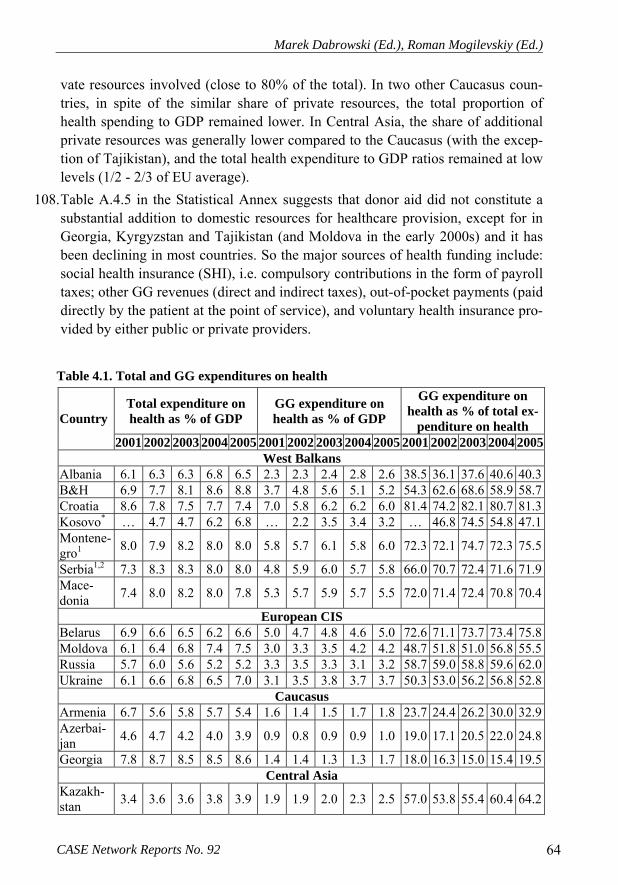
Marek Dabrowski (Ed.), Roman Mogilevskiy (Ed.)
CASE Network Reports No. 92 64
vate resources involved (close to 80% of the total). In two other Caucasus coun-tries, in spite of the similar share of private resources, the total proportion of health spending to GDP remained lower. In Central Asia, the share of additional private resources was generally lower compared to the Caucasus (with the excep-tion of Tajikistan), and the total health expenditure to GDP ratios remained at low levels (1/2 - 2/3 of EU average).
108. Table A.4.5 in the Statistical Annex suggests that donor aid did not constitute a substantial addition to domestic resources for healthcare provision, except for in Georgia, Kyrgyzstan and Tajikistan (and Moldova in the early 2000s) and it has been declining in most countries. So the major sources of health funding include: social health insurance (SHI), i.e. compulsory contributions in the form of payroll taxes; other GG revenues (direct and indirect taxes), out-of-pocket payments (paid directly by the patient at the point of service), and voluntary health insurance pro-vided by either public or private providers.
Table 4.1. Total and GG expenditures on health
Total expenditure on health as % of GDP
GG expenditure on health as % of GDP
GG expenditure on health as % of total ex-
penditure on health Country
2001 2002 2003 2004 2005 2001 2002 2003 2004 2005 2001 2002 2003 2004 2005 West Balkans
Albania 6.1 6.3 6.3 6.8 6.5 2.3 2.3 2.4 2.8 2.6 38.5 36.1 37.6 40.6 40.3 B&H 6.9 7.7 8.1 8.6 8.8 3.7 4.8 5.6 5.1 5.2 54.3 62.6 68.6 58.9 58.7 Croatia 8.6 7.8 7.5 7.7 7.4 7.0 5.8 6.2 6.2 6.0 81.4 74.2 82.1 80.7 81.3 Kosovo* … 4.7 4.7 6.2 6.8 … 2.2 3.5 3.4 3.2 … 46.8 74.5 54.8 47.1 Montene-gro1 8.0 7.9 8.2 8.0 8.0 5.8 5.7 6.1 5.8 6.0 72.3 72.1 74.7 72.3 75.5
Serbia1,2 7.3 8.3 8.3 8.0 8.0 4.8 5.9 6.0 5.7 5.8 66.0 70.7 72.4 71.6 71.9 Mace-donia 7.4 8.0 8.2 8.0 7.8 5.3 5.7 5.9 5.7 5.5 72.0 71.4 72.4 70.8 70.4
European CIS Belarus 6.9 6.6 6.5 6.2 6.6 5.0 4.7 4.8 4.6 5.0 72.6 71.1 73.7 73.4 75.8 Moldova 6.1 6.4 6.8 7.4 7.5 3.0 3.3 3.5 4.2 4.2 48.7 51.8 51.0 56.8 55.5 Russia 5.7 6.0 5.6 5.2 5.2 3.3 3.5 3.3 3.1 3.2 58.7 59.0 58.8 59.6 62.0 Ukraine 6.1 6.6 6.8 6.5 7.0 3.1 3.5 3.8 3.7 3.7 50.3 53.0 56.2 56.8 52.8
Caucasus Armenia 6.7 5.6 5.8 5.7 5.4 1.6 1.4 1.5 1.7 1.8 23.7 24.4 26.2 30.0 32.9 Azerbai-jan 4.6 4.7 4.2 4.0 3.9 0.9 0.8 0.9 0.9 1.0 19.0 17.1 20.5 22.0 24.8
Georgia 7.8 8.7 8.5 8.5 8.6 1.4 1.4 1.3 1.3 1.7 18.0 16.3 15.0 15.4 19.5 Central Asia
Kazakh-stan 3.4 3.6 3.6 3.8 3.9 1.9 1.9 2.0 2.3 2.5 57.0 53.8 55.4 60.4 64.2

CHALLENGES AND TRAJECTORIES OF FISCAL POLICY AND PFM REFORM…
CASE Network Reports No. 92 65
Total expenditure on health as % of GDP
GG expenditure on health as % of GDP
GG expenditure on health as % of total ex-
penditure on health Country
2001 2002 2003 2004 2005 2001 2002 2003 2004 2005 2001 2002 2003 2004 2005 Kyr-gyzstan 4.8 5.4 5.4 5.7 6.0 2.0 2.1 2.0 2.3 2.4 41.1 39.6 37.9 39.7 39.5
Tajikistan 4.6 4.5 4.5 4.4 5.0 1.0 0.9 0.9 0.9 1.1 20.7 20.2 20.4 21.4 22.8 Turk-menistan 4.5 4.0 4.4 4.5 4.8 3.3 2.7 3.1 3.0 3.2 72.3 67.9 69.6 66.6 66.7
Uzbeki-stan 5.7 5.6 5.3 4.9 5.0 2.6 2.5 2.4 2.3 2.4 45.0 44.7 44.8 46.1 47.7
Notes. 1 After Montenegro’s Declaration of Independence on 3 June 2006, health expendi-tures previously reported for the Confederation of Serbia and Montenegro have been parti-tioned accordingly between two countries. 2 The estimates do not include Kosovo. * Kos-ovo: Total expenditure on health = Public + Private-out-of-pocket + Donors. Sources: Calculated based on WHO online database (http://www.who.int/whosis/database). Data for Kosovo are from WB (2008d); GDP & budget for 2002-2004: Fact Sheet Kosovo (May 2003), www.unmikonline.org.
109. Budget remains the major official source of health care financing in Ukraine, with
80% coming from local budgets and the remaining 20% from the state (central) budget. Most other countries fall into the SHI group. However, in low-income countries this mechanism failed to protect the system from considerable shortages in funding and, for example, in Albania, Georgia and Kyrgyzstan, out-of-pocket spending remains the major source of financing, long after the introduction of SHI.
110. Out-of-pocket expenditures are in the form of either co-payments or co-insurance paid for services partially covered by mandatory health insurance and designed to discourage unnecessary health care consumption, or in the form of full cash pay-ments paid by the uninsured or for services that lie outside the benefit package. Co-payments can help improve the efficiency of health care; on the other hand, excessive reliance on out-of-pocket spending limits access to health services for the poor and may deter poverty reduction. This has happened in the Caucasus re-gion which represents the highest proportion of out-of-pocket expenditures.
111. In addition to the officially recognized out-of-pocket expenditures, one must add the informal payments to providers of public health care, for example, payment for admission to public hospital (in spite of legal guarantees of availability of hospital services for free). Informal payments, which are actually a form of cor-ruption, generate an incentive for providers to discriminate among patients based on their ability to pay which undermines the quality of and access to health care for those who cannot pay the expected bribe.
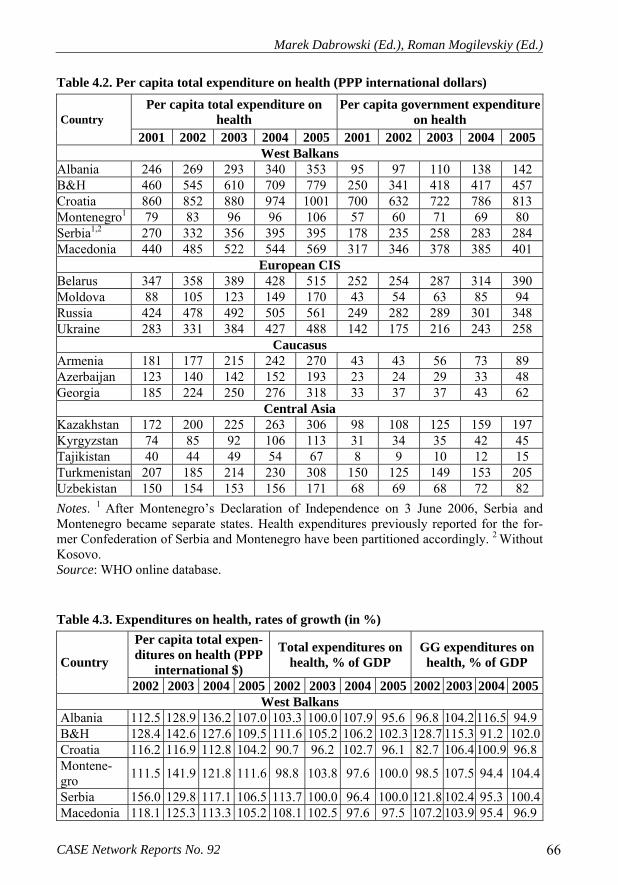
Marek Dabrowski (Ed.), Roman Mogilevskiy (Ed.)
CASE Network Reports No. 92 66
Table 4.2. Per capita total expenditure on health (PPP international dollars)
Per capita total expenditure on health
Per capita government expenditure on health Country
2001 2002 2003 2004 2005 2001 2002 2003 2004 2005 West Balkans
Albania 246 269 293 340 353 95 97 110 138 142 B&H 460 545 610 709 779 250 341 418 417 457 Croatia 860 852 880 974 1001 700 632 722 786 813 Montenegro1 79 83 96 96 106 57 60 71 69 80 Serbia1,2 270 332 356 395 395 178 235 258 283 284 Macedonia 440 485 522 544 569 317 346 378 385 401
European CIS Belarus 347 358 389 428 515 252 254 287 314 390 Moldova 88 105 123 149 170 43 54 63 85 94 Russia 424 478 492 505 561 249 282 289 301 348 Ukraine 283 331 384 427 488 142 175 216 243 258
Caucasus Armenia 181 177 215 242 270 43 43 56 73 89 Azerbaijan 123 140 142 152 193 23 24 29 33 48 Georgia 185 224 250 276 318 33 37 37 43 62
Central Asia Kazakhstan 172 200 225 263 306 98 108 125 159 197 Kyrgyzstan 74 85 92 106 113 31 34 35 42 45 Tajikistan 40 44 49 54 67 8 9 10 12 15 Turkmenistan 207 185 214 230 308 150 125 149 153 205 Uzbekistan 150 154 153 156 171 68 69 68 72 82 Notes. 1 After Montenegro’s Declaration of Independence on 3 June 2006, Serbia and Montenegro became separate states. Health expenditures previously reported for the for-mer Confederation of Serbia and Montenegro have been partitioned accordingly. 2 Without Kosovo. Source: WHO online database. Table 4.3. Expenditures on health, rates of growth (in %)
Per capita total expen-ditures on health (PPP
international $)
Total expenditures on health, % of GDP
GG expenditures on health, % of GDP Country
2002 2003 2004 2005 2002 2003 2004 2005 2002 2003 2004 2005 West Balkans
Albania 112.5 128.9 136.2 107.0 103.3 100.0 107.9 95.6 96.8 104.2 116.5 94.9 B&H 128.4 142.6 127.6 109.5 111.6 105.2 106.2 102.3 128.7 115.3 91.2 102.0 Croatia 116.2 116.9 112.8 104.2 90.7 96.2 102.7 96.1 82.7 106.4 100.9 96.8 Montene-gro 111.5 141.9 121.8 111.6 98.8 103.8 97.6 100.0 98.5 107.5 94.4 104.4
Serbia 156.0 129.8 117.1 106.5 113.7 100.0 96.4 100.0 121.8 102.4 95.3 100.4 Macedonia 118.1 125.3 113.3 105.2 108.1 102.5 97.6 97.5 107.2 103.9 95.4 96.9

CHALLENGES AND TRAJECTORIES OF FISCAL POLICY AND PFM REFORM…
CASE Network Reports No. 92 67
Per capita total expen-ditures on health (PPP
international $)
Total expenditures on health, % of GDP
GG expenditures on health, % of GDP Country
2002 2003 2004 2005 2002 2003 2004 2005 2002 2003 2004 2005 European CIS
Belarus 114.1 121.6 124.6 138.8 95.7 98.5 95.4 106.5 93.7 102.1 95.0 109.9 Republic of Moldova 122.7 125.9 144.1 118.4 104.9 106.3 108.8 101.4 111.6 104.6 121.2 99.0
Russia 119.5 117.7 127.7 130.7 105.3 93.3 92.9 100.0 105.8 93.0 94.1 104.0 Ukraine 122.9 122.0 123.6 143.8 108.2 103.0 95.6 107.7 114.0 109.3 96.6 100.1
Caucasus Armenia 93.5 123.3 128.3 129.4 83.6 103.6 98.3 94.7 86.1 111.2 112.5 103.9 Azerbaijan 109.4 105.7 113.5 147.6 102.2 89.4 95.2 97.5 92.0 107.1 102.2 109.9 Georgia 118.5 115.6 131.1 126.8 111.5 97.7 100.0 101.2 101.0 89.9 102.7 128.1
Central Asia Kazakhstan 115.7 127.1 145.3 135.8 105.9 100.0 105.6 102.6 99.9 103.0 115.1 109.1 Kyrgyzstan 113.3 117.6 125.0 112.0 112.5 100.0 105.6 105.3 108.4 95.7 110.6 104.7 Tajikistan 112.5 122.2 127.3 128.6 97.8 100.0 97.8 113.6 95.5 101.0 102.6 121.1 Turkmeni-stan 113.6 134.7 114.9 134.5 88.9 110.0 102.3 106.7 83.5 112.8 97.9 106.8
Uzbekistan 80.8 95.2 115.0 113.0 98.2 94.6 92.5 102.0 97.6 94.9 95.1 105.6 Source: WHO online database.
112. Voluntary health insurance, as data in table 4.2 indicates, plays a less important
role in healthcare financing. Only in Russia it is offered as an alternative to man-datory SHI and is significant for at least a part of population. In other cases, this source of financing can be either complementary, and cover the cost of co-payments for specific population groups, or be supplementary, and cover health care services not included in the standard benefits package.
113. Disparities in financing can be best seen when comparing per capita expenditure on health (see Table 4.2). They range from 1,001 USD in PPP terms in Croatia, which is still only half of the EU-27 average (PPP USD 2,261 in 2006), to 67 USD in Tajikistan, which amounts to less than 3% of the EU average. Apart from Croatia, only in three countries does per capita expenditure exceed 25% of the average in the EU-27 (Bosnia & Herzegovina, Macedonia, and Russia). These figures are lower than in Bulgaria, but correspond to those of Romania and Esto-nia. Two more countries (Belarus and Ukraine) exceed the 20% of EU average by 20%. Six countries fall into the range of 12 - 18% (Serbia, Albania, Georgia, Turkmenistan, Kazakhstan, and Armenia), while others do not exceed 10% of the EU-27 average. Geographically, the Western Balkans and European countries (except Moldova and Montenegro) as well as Kazakhstan and Turkmenistan are characterized by relatively higher values of per capita expenditures compared to the Caucasus and the remaining Central Asian countries.

Marek Dabrowski (Ed.), Roman Mogilevskiy (Ed.)
CASE Network Reports No. 92 68
114. Table 4.3 demonstrates that the rates of health expenditure growth exceeded the record- high rates of GDP growth not only in low income Central Asian countries but also in Georgia, Belarus, Moldova, Ukraine and Bosnia & Herzegovina. It remains to be seen how health expenditures will react to the expected GDP de-cline in 2009. Even if they do not follow output decline proportionally (as a result of spending inertia and existing legal commitments), they will stop growing and their actual structure may deteriorate as a result of ad hoc budget sequestrations.
4.2.2. Education
115. The available UNESCO data allows us to conclude that trends and levels of public education spending as a % of GDP vary widely both within analyzed group of countries (see Section 4.1) and from year to year (see Table 4.4)27. In 2001-2006, the lowest education expenditures relative to GDP were recorded in Geor-gia and Armenia. Albania, Serbia and Macedonia were very close to this mini-mum. Surprisingly, major oil exporters (Russia, Kazakhstan and Azerbaijan) also demonstrated modest levels of spending. On the contrary, the highest figures were recorded in Belarus and Ukraine.
116. Table 4.4 suggests that Belarus, Ukraine, Kyrgyzstan and Tajikistan have demonstrated a considerable increase in public expenditures on education in the analyzed years, surpassing GDP growth rates. In Central Asia, however, the demographic factor (a growing share of younger population) could play an impor-tant role here. Similarly to health expenditure, it is unclear at the moment to what extent they will follow GDP and GG revenue decline during the economic down-turn.
117. In some lower-income countries, resources directed to the education sector have been supplemented with substantial donor financing28. Table A.4.6 in the Statisti-cal Annex suggests that donor aid accounted for 10% (Moldova, 2006) to nearly 20% (Georgia, 2006) of the total expenditures on education. The raw data on aid in constant 2006 USD also suggest that foreign aid could play a significant role in Macedonia, Azerbaijan and Tajikistan. In most countries, donor aid goes mostly to post-secondary education. This is particularly true for the Western Balkans (excluding Albania in 2006), European CIS (excluding Moldova in 2006) and the
27 Data coverage on the education sector is more limited in comparison to health (see GMR, 2008). In particular, this relates to private expenditures on education. 28 Unfortunately, due to data limitations, we can provide only a few examples of the rela-tive importance of this source.

CHALLENGES AND TRAJECTORIES OF FISCAL POLICY AND PFM REFORM…
CASE Network Reports No. 92 69
Caucasus (excluding Azerbaijan in 2005). On the contrary, Central Asia received a higher proportion of donor aid directed to basic and secondary education.
118. Table A.4.7 in the Statistical Annex shows cross-country disparities in expendi-ture per student at current USD in PPP terms. There is a trend for catching-up to the average (all-level education) financing but this has not necessarily been trans-mitted down to every education level in each country. In Croatia, Belarus, Ka-zakhstan and Tajikistan, public expenditures per student in tertiary education de-creased, perhaps being substituted by household expenses. On the other hand, in most countries, tertiary education absorbs more public resources than basic and secondary levels. In Albania, the proportion between tertiary education and aver-age expenditure (for all levels) is approximately 3:1. However, in Moldova, spending rates per student are nearly the same across all level of education; the reverse proportion (lower spending for tertiary education) is true for Kazakhstan.
Table 4.4. Public expenditure on education
As per cent of GDP Growth rates, % to previous year Country 2000 2001 2002 2003 2004 2005 2006 2001 2002 2003 2004 2005 2006 West Balkans
Albania 3.1 3.1 2.8 3.0 3.2 3.2 3.0 101.0 89.2 108.7 104.5 100.0 93.8 B&H - - - - - - - Croatia - 4.5 4.4 4.5 4.5 - - 97.8 102.3 100.0 Kosovo - - - - - - 3.5 Montenegro - - - - - - - Serbia 3.4 3.4 3.8 3.5 3.5 3.4 3.5 100.0 111.8 92.1 100.9 95.6 103.7 Macedonia 3.2 3.1 3.3 3.3 2.4 3.0 2.9 97.2 105.2 101.7 71.6 126.9 96.4
East European CIS Belarus 6.2 6.5 6.6 6.5 5.2 5.4 5.5 105.0 102.9 98.5 80.1 103.5 101.2 Moldova 4.5 5.0 5.7 5.6 5.4 5.8 - 111.3 114.3 97.6 96.8 107.6 Russia 2.9 3.1 3.8 3.7 3.5 3.8 - 106.9 122.6 97.4 94.6 108.6 Ukraine 4.2 4.7 5.4 5.6 5.3 6.3 6.3 112.3 116.1 103.1 94.8 118.9 99.6
Caucasus Armenia 2.6 2.3 1.9 2.1 2.5 2.7 2.7 88.1 83.8 110.3 115.8 109.1 100.1 Azerbaijan 3.9 3.5 3.2 3.3 3.4 3.0 2.7 90.9 90.0 104.2 104.9 86.3 89.3 Georgia 2.2 2.5 2.2 2.1 2.9 2.5 3.0 114.5 90.3 92.8 142.5 84.4 121.0
Central Asia Kazakhstan 3.3 3.1 3.0 3.0 2.3 2.3 - 93.9 96.8 100.0 76.7 100.0 Kyrgyzstan 3.0 3.4 3.9 3.9 4.0 4.2 4.7 111.6 114.1 101.4 101.3 106.8 110.8 Tajikistan 2.3 2.4 2.6 2.4 2.8 3.5 3.4 104.8 107.7 91.6 119.1 124.6 96.9 Turkmenistan 6.5 5.6 4.9 5.1 5.4 5.3 - 87.1 86.1 104.7 105.7 99.6 Uzbekistan 6.7 6.8 6.7 6.3 - - - 101.5 98.7 94.1
Sources: All countries except Kosovo: TransMONEE 2008 database, www.unicef-irc.org. Data on Kosovo: Kosovo Quarterly Economic Briefing, World Bank, October-December 2007, p 2.

Marek Dabrowski (Ed.), Roman Mogilevskiy (Ed.)
CASE Network Reports No. 92 70
119. In all countries for which comparable data are available (see Table A.4.8 in the
Statistical Annex), current expenditures, mostly salaries, dominate all other items. Interestingly, the share of salaries tends to grow over time in all countries and all levels of education. In Croatia, this is done at the cost of capital expenditures, while in Belarus at the cost of other current expenditures. In both countries, the share of capital expenditures is rather low. On the contrary, lower-income coun-tries (e.g. Moldova and Kazakhstan) tend to maintain (or even increase) the pro-portion of capital investments. This may partly reflect differences in demographic trends (an increasing number of students in lower-income countries). As concerns tertiary education, the picture is mixed: only Croatia demonstrated a sharp reduc-tion of capital expenditures whereas other countries maintained or increased them.
Table 4.5. Student-teacher ratio in primary and secondary general education
Primary education (ISCED 1) Secondary general education (ISCED levels 2 and 3A) Country
2000/01 2006/07 2000/01 2006/07 Western Balkans
Croatia 18.3 16.4 12.6 10.2 Kosovo ... ... 12.6 10.2 Serbia 19.9 17.0 16.7 13.4 Macedonia 21.9 18.4 16.4 13.2
European CIS Belarus 17.7 16.1 9.4 8.0 Moldova 20.5 16.3 14.0 11.8 Russia 17.3 17.1 11.7 8.8 Ukraine ... ... 10.6 8.7
Caucasus Armenia 14.0 ... 9.2 ... Azerbaijan 17.7 12.0 8.8 8.5 Georgia 16.8 ... 8.4 ...
Central Asia Kazakhstan 18.7 16.5 11.6 10.2 Kyrgyzstan ... 24.3 ... 16.6 Tajikistan 21.8 21.6 17.4 17.0 Uzbekistan 21.7 18.2 11.7 11.8
Source: TransMONEE 2008 database, www.unicef-irc.org.
120. One of the possible reasons why salaries dominate expenditures in primary and
secondary education is the small number of students per one teacher as compared to other countries with similar per capita incomes (Table 4.5). In 2000, the aver-age student-teacher ratio amounted to 40 in low income countries, 22 in middle income countries, and 21 in upper middle income countries (WB, 2005b). Exces-
CHALLENGES AND TRAJECTORIES OF FISCAL POLICY AND PFM REFORM…
CASE Network Reports No. 92 71
sive employment of teachers is also evident when one compares CEE/CIS figures with the EU-25 average numbers of students per teacher, which was 15 in 2003 (with the highest value in UK, 20.0 pupils per teacher, followed by France and Slovakia at 19.4)29. As the literature suggests, these quantitative indicators are in line with the quality of schooling results and reflect, to a certain extent, the inade-quate qualifications of teachers who experience difficulties in teaching multiple subjects at the early levels of schooling. This is the case of many low-income countries. Among others, it was observed by the WB (2005b) in Kosovo, where in 2003, 22.2% of teachers in primary schools were underqualified, and 28.1% of teachers in secondary schools. There are also other reasons for excessive em-ployment related e.g. to dispersed types of settlements, especially in distant rural areas and the slow pace of rationalizing school networks.
4.2.3. Intra-sector structure of expenditures (education and healthcare)
121. The aggregate expenditure data in education and healthcare tell us very little about the level and quality of service delivery and actual policies carried out in these sectors. To deepen our analysis we try to analyze the intra-sector structure of spending in this sub-section30.
122. The available breakdown of public expenditures between major healthcare services (outpatient services, hospital services, and public health services – see Box 4.2 for detailed definitions) does not provide a clear picture in respect to the prevailing policies. Data presented in Table A.4.9 of the Statistical Annex cover only a few countries and selected years, and seem to suffer from methodological problems related to healthcare institutional reforms. For example, moving towards the SHI model caused a statistical shift towards a third category, i.e. public health services, at the cost of two others. Furthermore, the available data disaggregation cannot give us any specific insight into meeting child healthcare needs. Neverthe-less, even the scarce data available plus numerous country studies suggest that hospital services continue to absorb most of the available public resources for healthcare, at least in the former USSR where the hospital network has been his-torically over-extended and largely ineffective. This means that outpatient ser-vices and public health programs (many of which target children) remain dis-criminated against in allocation decisions. Poor families with large numbers of
29 Eurostat Yearbook 2005. 30 Due to data constraints, the analysis of intra-sector expenditure structure is limited to health and education.

Marek Dabrowski (Ed.), Roman Mogilevskiy (Ed.)
CASE Network Reports No. 92 72
children also suffer from the necessity to pay for (very often unofficially) elemen-tary health services.
123. In the education sector, public funds seem to equally support the poor and non-poor but there can be large disparities in the quality of schooling depending on the population’s income level and residence (large cities vs. countryside) not covered by the available statistics. As Table A.4.9 in the Statistical Annex suggests, a con-siderable share of public education spending in most countries is directed to pri-mary and secondary education which hypothetically could help improve basic indicators of education attainment. However, the cross-country variation in this respect is great. Kazakhstan and Russia display a prevalence of primary education in the structure of public education expenditures, whereas in Belarus, Moldova and Ukraine, spending on secondary education is relatively more significant. Pub-lic subsidies to tertiary education remained at relatively high levels in most of the countries but they have not noticeably increased since 2002. This is in line with the data on public spending per student (as discussed in Section 4.2.2) which sug-gest that resource allocation is still biased against primary and lower secondary education in many countries (Thomas et al, 2000).
Box 4.2. Definition of major healthcare services Outpatient services include medical, dental and paramedical services delivered by practi-tioners and auxiliaries. The services may be delivered at home, in individual or group consulting facilities, dispensaries or the outpatient clinics of hospitals and the like. Outpa-tient services include the medicaments, prostheses, medical appliances and equipment and other health-related products supplied directly to outpatients by practitioners and auxiliaries. Hospital services: Hospitalization is defined as occurring when a patient is accommo-dated in a hospital for the duration of the treatment. Hospital day-care and home-based hospital treatment are included, as are hospices for terminally ill persons. Public health services include services delivered by special teams to groups of clients, most of whom are in good health, at workplaces, schools or other non-medical settings, public health services not connected with a hospital, clinic or practitioner, public health services not delivered by medically qualified doctors, or public health service laborato-ries. Expenditures on public health services constitute the sum of provision of public health services, administration, inspection, operation or support of public health services such as blood-bank operation (collecting, processing, storing, shipping), disease detection (cancer, tuberculosis, venereal disease), prevention (immunization, inoculation), monitor-ing (infant nutrition, child health), epidemiological data collection, family planning ser-vices etc., preparation and dissemination of public health information.
124. The World Bank report on reforms in higher education financing in CEE (Can-
ning et al., 2006) documented that after the transition began, participation rates in tertiary education began to rise immediately, fueled by evidence that a university

CHALLENGES AND TRAJECTORIES OF FISCAL POLICY AND PFM REFORM…
CASE Network Reports No. 92 73
degree offered a greater chance of employment in an increasingly uncertain labor market. At the same time, public outlays for tertiary education remained mostly at previous levels or even decreased. As a result, private provision of higher educa-tion services expanded in most countries. A greater reliance on private financing of tertiary education can help free up the needed public funding for primary and secondary education.
125. In many analyzed countries, fiscal constraints force governments to attract additional resources to solve the problem of maintaining the desired level of edu-cation by adopting various strategies – e.g. charging tuition fees in public educa-tion and encouraging the development of private schools. Fees can increase edu-cational spending per student enrolled and improve equity by targeting public subsidies to students from poor families. Selective charges on some learning in-puts can increase the effectiveness of service delivery. However, the literature suggests that in practice the poor remain disadvantaged. Public expenditures on health and education are usually captured by non-poor households (WDR, 2004), leaving aside the needs of poor families with children that constitute a consider-able proportion of poverty profile in the countries under review. Thus considera-tion of children’s interests in the intra-sector reallocation of public expenditures is closely related to the effectiveness of the pro-poor targeting of these services.
4.2.4. Social protection
126. Most of the analyzed countries - apart from Albania, Kosovo, Azerbaijan, and Central Asia – suffer from negative growth and ageing populations, which will result in growing public expenditures on health and social security, which are al-ready quite substantial. Only a small proportion of resources is allocated to social assistance (see Table 4.6 and Section 4.3).
Table 4.6. GG expenditure structure of social benefits (% of the total)
Country Year Social security benefits
Social assistance benefits
Employer social benefits
Western Balkans 2005 0.00 91.05 8.95 2006 0.00 93.20 6.80 Albania 2007 0.00 93.95 6.05 2005 0.00 99.58 0.42 2006 0.00 99.79 0.21 B&H 2007 0.00 99.73 0.27 2003 80.09 18.45 1.46 2004 70.94 28.16 0.90 Croatia 2005 70.36 29.01 0.64

Marek Dabrowski (Ed.), Roman Mogilevskiy (Ed.)
CASE Network Reports No. 92 74
Country Year Social security benefits
Social assistance benefits
Employer social benefits
2006 69.77 29.92 0.31 Croatia 2007 70.12 29.45 0.44 Serbia 2007 71.28 28.72 0.00
European CIS 2003 89.54 1.77 8.68 2004 89.78 10.22 0.00 2005 91.40 8.60 0.00 2006 92.65 7.35 0.00
Belarus
2007 91.57 8.43 0.00 2004 0.00 100.00 0.00 2005 4.70 95.30 0.00 2006 6.05 93.95 0.00 Moldova
2007 97.10 1.79 1.11 2003 80.33 19.67 0.00 2004 79.41 20.59 0.00 2005 74.43 18.92 6.64 2006 67.44 26.70 5.86
Russia
2007 65.32 29.40 5.28 European CIS (continued)
2003 87.91 11.81 0.28 2004 83.01 16.99 0.00 2005 89.56 10.44 0.00 2006 93.08 6.92 0.00
Ukraine
2007 90.96 9.03 0.00 Caucasus
2003 99.94 0.06 0.00 2004 80.00 20.00 0.00 2005 75.32 24.68 0.00 2006 81.15 18.85 0.00
Armenia
2007 81.03 18.97 0.00 2003 53.50 30.87 15.63 2004 60.37 39.63 0.00 2005 72.96 27.04 0.00 2006 69.16 30.84 0.00
Georgia
2007 47.92 52.08 0.00 Central Asia
2003 65.32 34.68 0.00 2004 66.54 33.46 0.00 2005 64.60 35.40 0.00 2006 64.29 35.71 0.00
Kazakhstan
2007 61.77 38.23 0.00 Kyrgyzstan 2006 42.24 57.76 0.00 Tajikistan 2003 92.31 7.69 0.00
Note. Russia - accrual basis, all other countries – cash basis. Source: Own calculations based on IMF GFS database.

CHALLENGES AND TRAJECTORIES OF FISCAL POLICY AND PFM REFORM…
CASE Network Reports No. 92 75
127. Overall, the analysis of HBS and LSMS data shows that public social transfers
have limited impact on child poverty reduction; however, pensions do have an impact in many countries, reducing child poverty by up to 10 percentage points, while the effect of social assistance is generally negligible, as a result of too nar-row targeting and small size of social benefits. Simulations based on microdata point to the potential child benefits have in reducing child poverty rates and gaps with even modest amounts providing substantial returns (Bradshaw et al., 2008; Chzhen, 2009).
128. The most common approach of targeting social benefits applies proxy means tests based on very narrow eligibility criteria and high requirements to applicants in providing documentation. The objective is generally to bring the extremely poor up to the food poverty line. The consequence is low coverage of the poor while the administration of benefits is costly and puts high demands on staff capacity.
129. To be effective in reducing child poverty and fostering social inclusion, benefits need to achieve good coverage of poor populations, be adequate to make a differ-ence in living standards, be accessible for eligible persons and easy to administer. These arguments speak in favor of universal child benefits. They are, however, fiscally costly and mean spending limited budget resources also for support of middle-and higher-income families. This is also the case of other broad based so-cial benefits scheme such as public pension systems, disability or unemployment benefits.
130. Limiting child benefits to those groups of families who are at a higher than average poverty risk (depending on national child poverty profiles) may decrease somewhat scale of expenditure mistargeting. However, implementation of selec-tive child benefit schemes may encounter the similar problems of limited adminis-trative capacity as in the case of targeted social assistance.
131. Generally, targeting remains the weakest point of public transfer allocation, and the main focus of debates around social protection reforms, especially in the European CIS countries (Russia, Belarus and Ukraine). The demand for better targeting increases dramatically as result of the ongoing economic and financial crisis: fiscal space for social support schemes becomes even more limited, while demand for social assistance grows rapidly. The question is how targeting mecha-nisms can be simplified, ensure good coverage and therefore become more effec-tive in reaching poor and vulnerable populations.

Marek Dabrowski (Ed.), Roman Mogilevskiy (Ed.)
CASE Network Reports No. 92 76
4.2.5. Public spending on water and utilities31
132. In the decade of rapid economic growth, social sector expenditures (on social security, health and education) increased faster relative to other productive spend-ing (i.e. infrastructure, agriculture) as documented by case country and regional studies (Wilhelm & Fiestas, 2005). These changes were partially provoked by recent policy initiatives (PRS launched by the World Bank and IMF) that have encouraged countries to identify and track expenditures that are pro-poor, often concentrating attention on social spending. The MDG also encouraged social sec-tor spending by broadening anti-poverty objectives (Leipziger et al., 2003).
133. Former centrally planned economies inherited more infrastructure stocks than typical for countries at similar levels of per capita income. The results of policy reforms designed to enhance the operational efficiency, financial sustainability and commercial orientation of the infrastructural sector have generally been better in the CEE countries than in the SEE or low-income CIS countries (with the ex-ception of Armenia, which has followed some good practices in this sphere). In the 2000s, many countries have outgrown their infrastructure capacities, espe-cially in power generation, transmission and distribution. In addition, the outdated technical design and years of under-maintenance, including neglect of environ-mental impact now require large-scale rehabilitation and investment projects. However, their financing is beyond the capacities of public authorities alone (es-pecially during the economic downturn).
134. The responsibility for managing most types of social infrastructure was trans-ferred to municipal governments. However, it is unclear whether municipalities have the capacity to enforce financial and operational discipline and to provide appropriate levels of financial support. Creditworthy municipal governments are beginning to look for opportunities to borrow on domestic or international capital markets for water and other infrastructure investments, provided that basic utility performance is satisfactory (Gray et al., 2007).
135. Financial constraints of public authorities and management efficiency considera-tions call for greater private sector participation in infrastructure, which has grown rather slowly. In the analyzed countries, privately owned and operated wa-ter systems are the exception rather than the rule. A water concession is under way in one city in Albania. Management contracts32 are more common and have been used in Albania, Armenia, and Ukraine. The Armenian (Yerevan) experi- 31 Similarly to many other cases described above, we faced a lack of comparable detail data on public spending on water, utilities. Thus, we can rely on literature sources only. 32 Under a management contract the private operator receives a fee with incentives for achieving good performance, but does not finance investment.

CHALLENGES AND TRAJECTORIES OF FISCAL POLICY AND PFM REFORM…
CASE Network Reports No. 92 77
ence has been so good that the government has decided to make a lease for the subsequent arrangement, implying broader responsibility for the private partner (Gray et al., 2007). However, private sector participation is unlikely to materialize and succeed unless the policy framework ensures financial viability and promotes fair competition. In any case, the private sector is unlikely to provide all of the necessary funding and the provision of infrastructure services will remain an im-portant responsibility of the public budget.
136. Privatization of assets can partly free the public sector from investment responsi-bilities but this requires introducing market-oriented tariffs. However, in many countries infrastructure tariffs remain state-regulated and very often set below a cost-recovery level for social reasons. This requires, in turn, allocating budget resources to subsidize tariffs and investments, predominantly at the local govern-ment level. Significant hidden costs or implicit subsidies remain in most CIS countries, especially in the electricity and, to a lesser extent, in the water sector, and they create contingent liabilities for the government budget (see Section 5.4 on quasi-fiscal operations). The total hidden subsidies to water supply declined in Georgia between 2001 and 2005 from 1.62% to 0.57% of GDP, but increased in Ukraine from 0.11% of GDP in 2000 to 0.32% of GDP in 2003. In Armenia, it first increased from 0.88% of GDP in 2001 to 1.59% in 2003 but then decreased to 0.69% of GDP in 2005. In many countries, dealing with unaccounted losses, low collection rates, and tariffs below a cost-recovery level remains a priority for both the sectoral and broader public finance reform agendas.
4.3. Social spending vs. service coverage and quality indicators
4.3.1. Literature findings on the efficiency and effectiveness of spending
137. The literature offers different views on the appropriate level of public spending and its impact on sector outcomes and poverty reduction (Wilhelm & Fiestas, 2005). Generally, empirical studies confirm the Wagner law, i.e. that public spending as a share of GNP increases with higher GDP per capita levels. Herrera & Pang (2004) measured the efficiency of public spending in health and educa-tion using data from 140 countries and concluded that countries with higher ex-penditure levels and large wage bills (as a % of total budget) show lower effi-ciency scores. An earlier study on spending efficiency by Afonso, Schuknecht & Tanzi (2003) exploring public sector performance in 23 OECD countries con-

Marek Dabrowski (Ed.), Roman Mogilevskiy (Ed.)
CASE Network Reports No. 92 78
cluded that countries with small public sectors accomplished the highest overall performance of their spending.
138. Specific country conditions such as urbanization, demography, and regional poverty patterns can also play an important role in the efficiency of public expen-ditures. Herrera and Pang (2004) found that countries with high levels of urbani-zation show higher efficiency scores for public spending, while high HIV/AIDS prevalence and inequality tend to go hand in hand with less efficient spending.
139. Expenditure policy interventions can be complementary across sectors. First, the benefits of higher expenditure on a particular sector may not be fully realized unless expenditure in other sectors is increased. For example, Leipziger et al. (2003) found that better access to basic infrastructure services (water and sanita-tion) played an important role in improving child health outcomes, a finding that we see confirmed in most of the case studies related to the analyzed countries. There is a very close correlation between the percentage of population with access to improved water sources and child mortality rates (for the analyzed group of countries, the correlation coefficients amounted to (-) 0,88 and (-) 0,83 for 2000 and 2006 accordingly; the same concerns other countries)33. Similarly, the con-struction of rural roads is critical for access to education (Van de Walle, 2000) and education investment may enhance the marginal return on irrigation projects (Van de Walle, 1996).
140. The outcomes depend on the sequencing of the spending packages as well. During the analyzed period, an increase in healthcare spending was observed in many countries, while the resources for infrastructure and agriculture mostly remained stable or even declined, detrimentally affecting the performance of the health sec-tor.
141. Spending priorities within individual sectors are also important. WDR (2004) points out the necessity of better targeting of services. Although governments de-vote about a third of their budgets to health and education, relatively little is spent on those services that should reach the poor.
142. Institutional quality (rules and their enforcement) plays an important role in translating public spending (including social expenditures) into social outcomes and service coverage. Dollar & Kraay (2002) show that low-income countries with better governance tend to have faster growth and reduced inequality com-pared to poorly governed countries. High quality public sector institutions (e.g., a professional and results-oriented civil service) go along with improved public-service delivery due to enhanced capacity, better incentives for public service
33 Calculations were done on the basis of the World Bank World Development Indicators database.

CHALLENGES AND TRAJECTORIES OF FISCAL POLICY AND PFM REFORM…
CASE Network Reports No. 92 79
providers, and more accountability. In some countries, transferring responsibili-ties for service delivery to lower tiers of the administration or communities has had a positive impact on public service delivery, but this is not always the case. Poor quality of services, on the other hand, disproportionately hurts the poor and limits their future earning abilities due to lack of skills or health. These considera-tions stress the importance of good understanding of the nature and capacity of existing institutions, which are country and sector specific and, thus, require an equally specific public policy response. Although the analyzed countries are char-acterized by diverse levels of institutional development and various qualities of budgetary procedures (see Chapter 5), in most of them weak governance and budgetary management negatively affect the effectiveness of public resource use, despite private sector provision, both in health and education.
143. Finally, the impact of public expenditures comes with a time lag. While well-targeted transfer schemes usually have a direct and immediate impact on the poor by raising their income, targeted investment in education has a lagged effect via improved educational attainment, thus increasing the chances of the poor to par-ticipate in economic growth in the future. Targeted infrastructure investments can have both a direct immediate effect on income as well as an indirect lagged effect via a human capital formation (Paternostro et al., 2005).
4.3.2. Assessing the sufficiency and effectiveness of public spending
144. It is commonly accepted that assessing the sufficiency, effectiveness, and equity of public social services’ delivery requires looking both at supply-side factors (the overall amount of resources allocated to public social services, and the adminis-trative capacity to spend efficiently), and at demand-side factors (household needs differentiated by income, socio-demographic, national, educational and other characteristics).
145. During the financial crisis and economic downturn, the sustainability of public spending in the social sector depends on the government’s capacity to collect taxes, on donor support, and on improvement in efficiency of current spending. The potential welfare gains associated with the provision of health and education services are very often limited by their poor quality (as evidenced by poor health outcomes and large number of teachers with inappropriate level of skills). In the area of social protection, public social transfers have so far moderate a fairly large impact on poverty reduction. Poverty reduction effects are mostly related to basic pensions which are categorical and cover broad groups of the population, while targeted means-tested social assistance has much more limited impact on poverty

Marek Dabrowski (Ed.), Roman Mogilevskiy (Ed.)
CASE Network Reports No. 92 80
rates (because of its generally marginal role in the actual welfare systems in the analyzed countries).
146. Several EU NMS focused primarily on targeted social assistance. For example, Bulgaria targets 83% of those identified as poor; Romania 85%, and Lithuania 80%. Actually, some Western Balkans and CIS countries also implemented tar-geted social assistance programs as part of the Poverty Reduction Strategy Pro-grams (PRSPs) but the quality of this targeting is regarded as inadequate. For ex-ample, in Bosnia and Herzegovina, it is estimated that barely 30% of the social benefits reach those who need help the most34. In Russia, targeted social assis-tance accounted for only 0.4% of GDP in 2002, while the rest of financing was non-targeted, and over 70% of the population de jure were eligible for social benefits of some kind (Alexandrova & Struyk, 2007). Similarly, the ADB (2007) report on CCA countries stressed the low quality of social assistance targeting. Similarly to Russia, many social benefits in these countries are connected to the status of the person such as being a veteran, or disabled. These include lower prices for utilities, income tax breaks, or free public transport or health services. However, this sort of targeting does not necessarily reach the neediest.
147. Many studies suggest that more public spending on education is not always associated with better educational outcomes and the relationship between public spending for education and measures of educational attainment is weak - see e.g. Flug et al. (1998), Landau (1986), Mingat & Tan (1992; 1998) and Noss (1991). Instead, other variables have been found to be important in explaining education attainment, including per capita income (Flug et al., 1998; Mingat & Tan, 1992), the age distribution of the population, and family background or parental educa-tion (Appleton & Mackinnon, 1996). Using sophisticated meta-analytical tech-niques, Hedges and Greenwald (1996) concluded that per student expenditure, teacher experience, and teacher-student ratio are positively related to student out-comes. They also found that the effect of per student expenditure was large and educationally important.
148. Although many factors other than public money, including family background and peer influence, affect educational outcomes, the level and, particularly, the efficiency of public spending also matter. The analyzed countries vary in their levels of efficiency, with some of them scoring better and others doing much worse. Common problems (for most of the transition economies) include exces-sive numbers of teachers, combined with inflexible rules in respect to teacher salaries and employment (leading to the low remuneration of individual teachers, which de-motivates them). Public spending is often skewed towards salaries and
34 http://go.worldbank.org/9C06KYUV10.
CHALLENGES AND TRAJECTORIES OF FISCAL POLICY AND PFM REFORM…
CASE Network Reports No. 92 81
away from complementary inputs such as books and supplies, and there is a heavy reliance on a relatively expensive technical and vocational education at the secon-dary level, inherited from the communist era while the trend in other countries is to move toward increasing integration of technical and vocational education with the general education streams.
149. The region could benefit from well-designed policy reforms, including a move-ment to financing on a per capita basis to promote the consolidation of underused facilities35, accompanied by a loosening of labor and wage regulations to facilitate the restructuring of expenditures. In some countries this has already been initiated but positive results will not come immediately. Budget constraints also do not help speed up reforms. Public administration reforms have not introduced POB on a wider scale yet (see Chapter 5), and a focus on the quality of service has not reached the education sector. As student performance is not part of the budgeting criteria, school management staff members do not have a strong incentive to pro-vide quality education (ADB, 2007).
150. Taking into consideration additional fiscal constraints caused by the economic downturn, the share of public funds channeled to education cannot be increased easily. In some cases, the decentralization of school financing and management to regional/local governments can promote accountability, although this depends on the quality of governance at various levels of government and the concrete design of the decentralization initiative. A greater reliance on private delivery of educa-tion services and on private financing, particularly at the tertiary level, can also help (Gray et al, 2007). On the other hand, pre-school education is potentially vulnerable, especially in those countries where it is financed predominantly from public funds, as is the case in Kazakhstan36. The most important issue here is to handle the reform of a school system without excluding vulnerable groups from quality education.
151. The excessive healthcare infrastructure (mostly hospitals) inherited from the communist era, which is poorly adjusted to insufficient public financing became a key obstacle to the effective provision of public healthcare services. Similarly to education, the reform initiatives in the healthcare sector aimed to increase the effi- 35 However, sometimes this leads to over-reporting of the number of enrolled students. 36 Kazakhstan made one-year preschool education mandatory and free of charge in the early 2000 as its fiscal situation improved. Before independence, the Central Asian repub-lics had comprehensive child care and kindergarten systems often financed and managed by state enterprises. The disappearance of these enterprises left a huge vacuum in early child care and education: the government had no fiscal capacity, and parents were poor and inexperienced in child care. Therefore, now the majority of children enter primary school unprepared. As a result, the first grade has to serve as preschool, adding unnecessary bur-den to the already overcrowded basic education curriculum (ADB, 2007).

Marek Dabrowski (Ed.), Roman Mogilevskiy (Ed.)
CASE Network Reports No. 92 82
ciency of public spending. However, only a few countries managed to adjust their healthcare systems to the budget constraints without losing the relatively high healthcare standards from the communist period. While it is problematic to provide any single indicator illustrating the cross-country effectiveness of health care ser-vices, some of the West Balkan economies (especially Croatia) seem to perform noticeably better. In some instances this is also true for Belarus, Ukraine, and Russia.
152. The indicators of child mortality worsened or stagnated on a dramatic level, and micronutrient deficiencies that could cause irreversible cognitive damage became prevalent to an alarming degree, especially in CCA. However, as the ADB (2007) report argues, reestablishing the state run system is not the solution, because gov-ernments are neither able to sustain it, nor is such an inflexible system desirable.
153. The WHO also registered a considerable deterioration in fighting communicable diseases, an increased general mortality rate as well as a significantly increase in the incidence of water borne diseases. The latter is caused by the deterioration of water quality in both urban and rural areas. Hence the indicators of access to im-proved sources of drinking water are in fact less of an issue than the quality of the drinking water, especially in Central Asia and Azerbaijan. After many years of intensive farming in arid areas and neglecting infrastructure maintenance, the quality of water does not meet required standards (ADB, 2007).
154. In the low-income countries of CIS and Western Balkans, financial constraints and the widespread neglect of maintenance during the late communist and early transi-tion years has left much of the housing and communal infrastructure stock (includ-ing water and sanitation facilities) in a dismal state (Gray et al, 2007). According to the ADB (2007) report, in many CCA cities central heating systems no longer func-tion. The system maintenance is not affordable for municipalities, and so far it has not been possible to introduce fees for these services. As a result, many families rely on electrical heating in winter, which poses a significant strain on the electrical systems. The capital cities have at least scheduled access to electricity, but rural areas are often left without access to power in winter. Like electricity, gas is often in short supply in winter with services being available mostly in the capital. In smaller cities, the supply of gas is marginal at best; in rural areas it is often not even possible to buy bottled gas for cooking purposes (Gray et al, 2007).
155. In the water sector, problems of access, reduced reliability, and less frequent service have emerged, especially outside capital cities. In Armenia and Georgia, the capital cities are more than twice as likely to have full water service as other urban areas (WB, 2006). However, much progress has been made in recent years in both countries, and continuous water supply was available to more than 50% of the population in 2005. In Central Asia, consumers incur significant time costs

CHALLENGES AND TRAJECTORIES OF FISCAL POLICY AND PFM REFORM…
CASE Network Reports No. 92 83
and inconvenience in coping with poor water and sanitation services; many col-lect water from rivers, irrigation channels, and wells (ADB, 2007).
4.3.3. Achieving Millennium Development Goals
156. To measure progress achieved over time in various socially related subsectors, we have used the latest available Millennium Development Goals (MDG) indicators (see Table A.4.10 in the Statistical Annex). In education sphere, transition economies, including the analyzed group of countries, are doing better compared with other developing countries, but they have a long way to go to match the de-veloped world. In education, universal attainment of primary education was gen-erally achieved during the Soviet period. According to net enrolment ratios in pri-mary education (Target 2.A: “Ensure that, by 2015, children everywhere, boys and girls alike, will be able to complete a full course of primary schooling”), two groups of countries can be distinguished:
• Macedonia, Croatia, Kazakhstan and Tajikistan exceed the average indi-cators for the developed economies, and
• A numerous group (comprising almost all the countries under review) is characterized by indicators that are somewhat lower than the developed countries’ average, with the distance to the chosen benchmark being in most cases minimal.
The only country that falls outside of this range is Azerbaijan where total net en-rolment ratio in primary education is considerably lower as compared to the refer-ence average. According to another indicator characterizing Target 2A (propor-tion of pupils starting grade 1 who reach the last grade of primary education), al-most all countries (except Albania) are also above or approximately at the level of the developed nations’ average.
157. As regards gender equality in education, it varies from country to country, with Tajikistan, Azerbaijan, and Uzbekistan37 having lower attainment levels for girls than for boys, which is the reverse of the situation in other analyzed countries (ADB, 2007).
158. The most alarming situation in the health area concerns child and maternal mortality. Only the Western Balkan countries managed to maintain their values at levels comparable to the developed economies’ averages (in some cases this is also true for Belarus, Ukraine and Russia), whereas other CIS countries (espe-cially CCA) lag well behind. The under-five mortality rate far exceeds the devel-
37 In case of Uzbekistan this relates to upper secondary and tertiary levels of education.

Marek Dabrowski (Ed.), Roman Mogilevskiy (Ed.)
CASE Network Reports No. 92 84
oped nations’ average in almost all countries analyzed, with the exception of Croatia and Belarus: in Ukraine, Armenia, Georgia and Kazakhstan, the corre-sponding indicators are 4-5 times higher than the benchmark; in Kyrgyzstan, Uz-bekistan, and Turkmenistan the difference amounts to between 7 and 9 times; in Tajikistan it is 11 times, and in Azerbaijan, child mortality is 14.6 times higher than in comparison countries.
159. Infant mortality rates (0-1 year) per 1,000 live births are also dramatically high. Rates in Ukraine, Armenia, Georgia and Kazakhstan are 4 - 6 times greater than the developed country average. In Kyrgyzstan, Uzbekistan, and Turkmenistan, it is 7 to 9 times greater, in Tajikistan it is 11 times greater, and in Azerbaijan, the rate is 15 times greater. Maternal mortality ratios per 100,000 live births in Rus-sia, Moldova and Uzbekistan are 2 - 3 times higher than in developed countries, in Georgia, Armenia, Azerbaijan, Albania they are 6 - 9 times, in Turkmenistan, Kazakhstan, Kyrgyzstan, and in Tajikistan they are 13-17 times higher.
160. Among the indicators reflecting progress on Target 6.C (“Have halted by 2015 and begun to reverse the incidence of malaria and other major diseases”), the rise of tuberculosis (TB) cases and related deaths is clearly the most fearsome in CIS countries since their independence. These indicators are considerably higher (as compared to the developed economies) in all the countries reviewed, although in the Western Balkans the situation is less alarming compared to the CIS. Espe-cially high rates of TB are registered in prisons.
161. Still, despite the bleak health picture, most of the analyzed countries maintain special targeted governmental programs which result in high proportions of 1 year-old children being immunized against measles, which in most cases is com-parable with the level achieved in developed countries.
162. Indicators of access to improved drinking water sources and sanitation facilities are generally worse compared to developed countries. The most difficult situations can be observed in Azerbaijan, Tajikistan, Uzbekistan and Kyrgyzstan (in terms of ac-cess to drinking water), and Moldova, Azerbaijan, Russia and Macedonia (in terms of need for improved sanitation). The rural populations in Tajikistan and Azerbaijan have the most difficulty accessing improved drinking water, while the proportion of rural households lacking improved sanitation is the highest in Macedonia, Ukraine, Moldova, Russia, Uzbekistan, Armenia and Azerbaijan.

CHALLENGES AND TRAJECTORIES OF FISCAL POLICY AND PFM REFORM…
CASE Network Reports No. 92 85
5. Budget Systems
163. The quality of public finance management systems in the analyzed countries depends very much on the organization of their budget systems. The following aspects of budget systems seem to be of particular importance for the effective-ness, efficiency and transparency of government operations: (i) division of re-sponsibilities and government resources between different levels and types of government bodies, (ii) system of budget planning and execution, (iii) availability of clear policy framework for budget-related decision-making, (iv) institutional setup of PFM systems, and (v) budget transparency and civil society involvement into budget processes. The organization of governments and government budgets and their inter-relationships is analyzed in sections 5.1-5.4. Section 5.5 is devoted to the issues of policy-budget linkages and the procedures of budget preparation and execution. Section 5.6 provides a summary of strategy/policy frameworks available in the countries of the region. The issues of budget reporting, transpar-ency and participation of civil society are discussed in sections 5.7-5.8.
5.1. Organization of government budgets
164. The analyzed countries, despite their common institutional origins (all but Albania were the part of either the USSR or FSRY), now demonstrate a great va-riety of types of public finance organization. This variety can be explained by the differing country sizes, varying levels of economic development, the extent of heterogeneity in terms of population and administrative-territorial units, govern-ment revenue structure and other factors.
165. Nevertheless, the organization of their budget systems can be illustrated by Figure 5.1. Following definitions provided by the GFS Manual (2001), central govern-ment includes all government units and agencies controlled by a central authority which are covered by or financed through the central budget or extra-budgetary funds at the central level. The term “extra-budgetary funds” generally refers to sets of government units and transactions that are not included in the annual budget presentation.

Marek Dabrowski (Ed.), Roman Mogilevskiy (Ed.)
CASE Network Reports No. 92 86
Figure 5.1. Organization of government budgets
Central bank
Public financial and non-financial
enterprises
Budgetary central government
(ministries, agencies etc.)
Extra-budgetary units
(pension funds, health insurance funds, road and water funds etc.)
Central government
General government
Public sector
Extra-budgetary units (utility funds etc.)
Subnational governments (province/ large city, district/town,
rural municipality)
Source: Authors based on GFS Manual (2001).
166. Sub-national governments include all government units at the level of province
(state, region, oblast’) or at the level of the smallest geographic areas distinguished for administrative and political purposes (district, rayon, urban/rural municipality). Apart from their budgets, sub-national governments may also have their extra-budgetary units (in much fewer cases though). In line with the IMF GFS (2007), sub-national governments are referred to below as local governments38.
167. According to SNA, GG includes all units of central and local governments, all social security funds at each level of government and all extra-budgetary nonmar-ket, and non-profit institutions that are controlled and mainly financed by gov-ernment units. Apart from GG, the public sector in every country includes also the central bank and public financial (e.g., government-owned development banks) and nonfinancial (e.g., energy or utility companies) corporations/enterprises. While, generally speaking, central banks and public corporations are outside of the public finance area, they may have important links with government functions and budgets and may implement so-called quasi-fiscal operations (and therefore also need to be considered in the PFM context).
5.2. Central government budget
168. In all countries, taxes are the main source of central government revenues (from 49% of total revenues in Ukraine to 74% in Armenia) followed by social contri- 38 However, in the case of Bosnia and Herzegovina, the IMF consolidates the finances of the Brčko district, the Federation of Bosnia and Herzegovina and Republika Srpska to-gether with the country’s central government finances.

CHALLENGES AND TRAJECTORIES OF FISCAL POLICY AND PFM REFORM…
CASE Network Reports No. 92 87
butions (from 12% in Armenia to 35% in Ukraine39), other revenues40 (from 0.3% in Moldova to 24% in Russia) and external grants (from 0 in Belarus, Kazakhstan and Russia to 6% in Georgia).
Figure 5.2. Structure of central government revenues, 2006
0% 10% 20% 30% 40% 50% 60% 70% 80% 90% 100%
AlbaniaArmeniaBelarus
Bosnia andCroatiaGeorgia
KazakhstanKyrgyz Republic
MoldovaRussian Federation
Serbia and MontenegroTajikistan
Ukraine
Taxes Social contributions External grants Other Source: IMF GFS (2007).
169. In all countries of the region, the central government controls more than half of the
GG budget (Figure 5.241) with the median share of central government being equal to 73%. This rather large percentage may have many explanations including (i) rela-tively high government spending on social security, defense, public order and safety and some other functions, which are mostly/ exclusively implemented by central governments (see also Table 5.1), (ii) the small population of many countries, which does not require the decentralization of those government functions (e.g., many components of education and health), which are usually delegated to the local level in larger countries42, (iii) the prevalence of indirect taxes (collected by the cen-tral government) in the tax structure of almost all countries (Section 3.7).
39 Social contributions are not separated from taxes in IMF GFS’s data presentation for Kazakhstan and Kyrgyzstan. 40 Different non-tax revenues including government fees, income from property and paid services etc. 41 Here and below, data are provided only for countries covered by the IMF GFS (2007). 42 In the group under consideration, countries with larger populations (Russia, Ukraine, Kazakhstan, Belarus) all have a share of central government below 70%, while smaller countries (with the exemption of Tajikistan) have a share of central government above 70%.
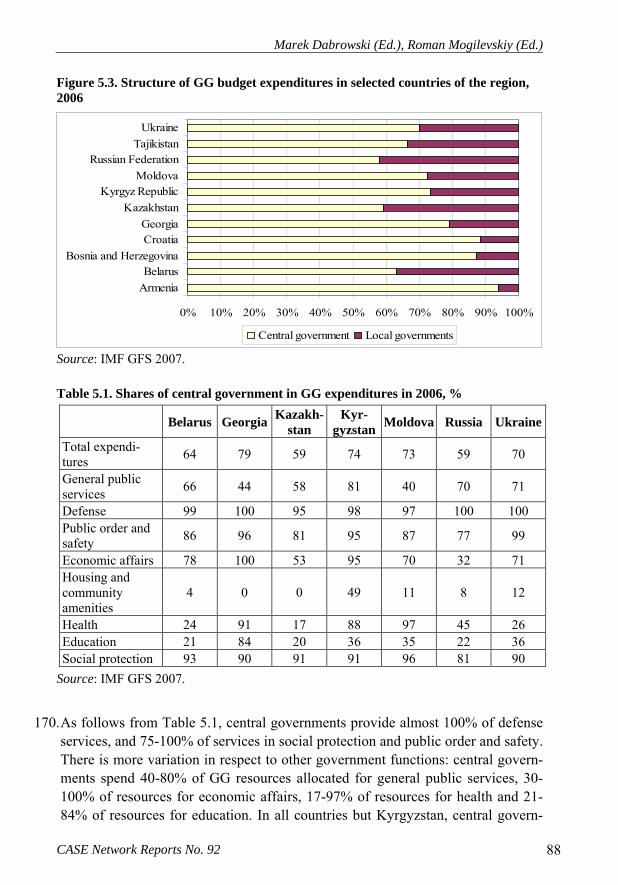
Marek Dabrowski (Ed.), Roman Mogilevskiy (Ed.)
CASE Network Reports No. 92 88
Figure 5.3. Structure of GG budget expenditures in selected countries of the region, 2006
0% 10% 20% 30% 40% 50% 60% 70% 80% 90% 100%
ArmeniaBelarus
Bosnia and HerzegovinaCroatiaGeorgia
KazakhstanKyrgyz Republic
MoldovaRussian Federation
TajikistanUkraine
Central government Local governments
Source: IMF GFS 2007. Table 5.1. Shares of central government in GG expenditures in 2006, %
Belarus Georgia Kazakh-stan
Kyr-gyzstan Moldova Russia Ukraine
Total expendi-tures 64 79 59 74 73 59 70
General public services 66 44 58 81 40 70 71
Defense 99 100 95 98 97 100 100 Public order and safety 86 96 81 95 87 77 99
Economic affairs 78 100 53 95 70 32 71 Housing and community amenities
4 0 0 49 11 8 12
Health 24 91 17 88 97 45 26 Education 21 84 20 36 35 22 36 Social protection 93 90 91 91 96 81 90
Source: IMF GFS 2007.
170. As follows from Table 5.1, central governments provide almost 100% of defense
services, and 75-100% of services in social protection and public order and safety. There is more variation in respect to other government functions: central govern-ments spend 40-80% of GG resources allocated for general public services, 30-100% of resources for economic affairs, 17-97% of resources for health and 21-84% of resources for education. In all countries but Kyrgyzstan, central govern-

CHALLENGES AND TRAJECTORIES OF FISCAL POLICY AND PFM REFORM…
CASE Network Reports No. 92 89
ments play a limited role in providing services in housing and community ameni-ties.
171. Countries receiving significant foreign aid often establish special Public Invest-ment Programs (PIP) where they consolidate aid resources for investment pro-jects. By now PIP have been integrated in most cases into central government budgets; this allows for a more realistic assessment of the fiscal stance and debt sustainability outlook. It also facilitates the comprehensive accounting of both domestic and foreign financed investment expenditures and their prioritization in a general budget framework (Lorie, 2003). Still, PIP are often kept separately from regular budget expenditures and are implemented through different proce-dures in order to provide donors with more control over the utilization of these resources (see Section 6.1).
172. In many countries of the region (Belarus, Bosnia and Herzegovina, Moldova, Ukraine), substantial central government resources (sometimes more than 30%) are channeled through extra-budgetary funds (Figure 5.4). On the other hand, in Georgia, according to the IMF GFS data, all central government resources are consolidated in the budget.
Figure 5.4. Shares of extra-budgetary funds in central government expenditures, 2006
0% 10% 20% 30% 40% 50% 60% 70% 80% 90% 100%
AlbaniaArmeniaBelarus
Bosnia and HerzegovinaCroatiaGeorgia
Kyrgyz RepublicMoldova
Russian FederationTajikistan
Ukraine
Budgetary central government Extra-budgetary funds
Note. For Albania data of 2004. Source: IMF GFS 2007.
173. Extra-budgetary funds usually have dedicated revenue sources43 (in particular,
social contributions) and often have a legal identity, with their budgets separated
43 This does not preclude them from receiving transfers from the central government budget, if dedicated sources are not large enough to cover all of the expenditure needs of these funds.
Marek Dabrowski (Ed.), Roman Mogilevskiy (Ed.)
CASE Network Reports No. 92 90
from the central government budget. Importantly, these funds may not be subject to the same level of scrutiny or accounting standards as the annual government budget. Pension funds are the largest extra-budgetary units (in terms of re-sources). In some countries (e.g., Moldova), considerable resources are also con-centrated in medical insurance funds. The insurance nature of payments from these funds is the main rationale to keep them separate from redistributive budget social expenditures. In practice, however, this rationale is often questionable as the majority of pension and other social security schemes have significant redis-tribution mechanisms (e.g., minimum pension or unemployment benefit paid re-gardless of an individual beneficiary’s contribution to the extra-budgetary fund); so they do not differ much from the regular budget.
174. Another rationale for the creation of extra-budgetary funds is the intention of authorities to earmark some revenues for particular purposes (road construction, regional development etc.) that are considered important. While there could be situations when such earmarking may be useful in providing the right incentives for revenue mobilization (in the case of pension and health funds, in particular), the existence of extra-budgetary funds complicates the fiscal system and makes it less transparent, reduces the fungibility of government resources and inhibits the effi-cient redistribution of resources within a GG budget. Countries of the region had a large number of various extra-budgetary units in the 1990s. In the 2000s, this num-ber has been reduced everywhere, while many such units and funds continue to ex-ist (e.g., in Croatia). For those earmarked extra-budgetary funds which are expected to stay unmerged with budget, the best international practice consists in ensuring that (i) publicly available information on the revenues and expenditures of these funds is comprehensive and transparent, (ii) financial linkages with the budget are clearly identified, and (iii) these funds are fully coordinated with the government budget when formulated, approved by parliament and implemented.
175. The countries which are dependent on oil and gas related revenues (Azerbaijan, Belarus, Kazakhstan, Russia, and Turkmenistan) established the so-called oil sta-bilization funds, which accumulated windfall revenues in the periods of high prices to be spent in the periods when international prices collapse (like at the end of 2008 and 2009 – see Section 3.8).
5.3. Local government budgets
176. Taxes are one of the main sources of revenues of local governments; their share in total local government revenues in the analyzed countries varies from 31% in
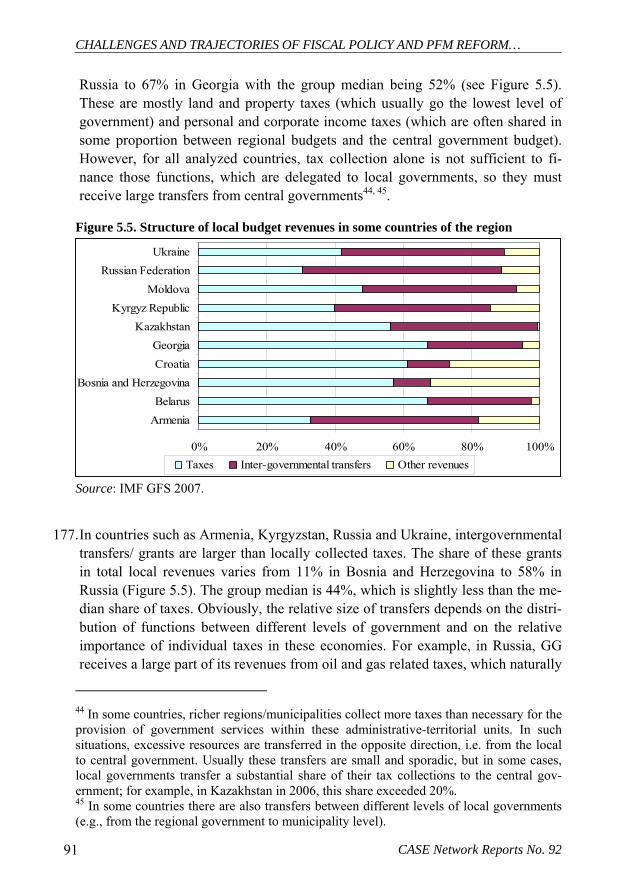
CHALLENGES AND TRAJECTORIES OF FISCAL POLICY AND PFM REFORM…
CASE Network Reports No. 92 91
Russia to 67% in Georgia with the group median being 52% (see Figure 5.5). These are mostly land and property taxes (which usually go the lowest level of government) and personal and corporate income taxes (which are often shared in some proportion between regional budgets and the central government budget). However, for all analyzed countries, tax collection alone is not sufficient to fi-nance those functions, which are delegated to local governments, so they must receive large transfers from central governments44, 45.
Figure 5.5. Structure of local budget revenues in some countries of the region
0% 20% 40% 60% 80% 100%
ArmeniaBelarus
Bosnia and HerzegovinaCroatiaGeorgia
KazakhstanKyrgyz Republic
MoldovaRussian Federation
Ukraine
Taxes Inter-governmental transfers Other revenues
Source: IMF GFS 2007.
177. In countries such as Armenia, Kyrgyzstan, Russia and Ukraine, intergovernmental
transfers/ grants are larger than locally collected taxes. The share of these grants in total local revenues varies from 11% in Bosnia and Herzegovina to 58% in Russia (Figure 5.5). The group median is 44%, which is slightly less than the me-dian share of taxes. Obviously, the relative size of transfers depends on the distri-bution of functions between different levels of government and on the relative importance of individual taxes in these economies. For example, in Russia, GG receives a large part of its revenues from oil and gas related taxes, which naturally
44 In some countries, richer regions/municipalities collect more taxes than necessary for the provision of government services within these administrative-territorial units. In such situations, excessive resources are transferred in the opposite direction, i.e. from the local to central government. Usually these transfers are small and sporadic, but in some cases, local governments transfer a substantial share of their tax collections to the central gov-ernment; for example, in Kazakhstan in 2006, this share exceeded 20%. 45 In some countries there are also transfers between different levels of local governments (e.g., from the regional government to municipality level).

Marek Dabrowski (Ed.), Roman Mogilevskiy (Ed.)
CASE Network Reports No. 92 92
go to the federal budget; at the same time important expenditure responsibilities (in particular, primary and secondary education and housing and community amenities) are delegated to lower levels of government. In such circumstances, massive transfers from central to local budgets are necessary and unavoidable. In an opposite example, in Croatia, where the central government assumes many financing responsibilities in primary and secondary education, housing and other expenditure categories, the need in transfers from central to local budgets is not that large. It is worth noting that any further transfer of functions from central to local governments in the process of decentralizing social services (which is on the agenda of many countries) will have to be accompanied by a corresponding in-crease in local taxes or, more realistically, in intergovernmental grants.
178. There are many types of intergovernmental grants in use (see Figure 5.6)46. Grants can be either earmarked or non-earmarked. An earmarked grant is given under the condition that it can only be used for a specific purpose (e.g., payment of teach-ers’ salaries or some types of social benefits). Non-earmarked grants can be spent similarly to local (non-earmarked) tax revenues.
Figure 5.6. Types of intergovernmental grants
179. Both earmarked and non-earmarked grants can either be mandatory or discretion-
ary. Mandatory grants (entitlements) are legal, rules-based obligations for the central government that issues the grant. This requires that both the size of the grant and the conditions under which it is given be laid down in a law or execu-tive decree and that these conditions are both necessary and sufficient. Most grants that are given to sub-national governments on a regular basis are manda-tory. The size of discretionary grants, and the conditions under which they are
46 Figure 5.6 and thematically associated paragraphs are based on Bergvall et al. (2006).

CHALLENGES AND TRAJECTORIES OF FISCAL POLICY AND PFM REFORM…
CASE Network Reports No. 92 93
given, are not determined by rules but decided on an ad hoc, discretionary basis. Discretionary grants are often temporary in nature and include, for example, grants for specific infrastructural projects or emergency aid to a disaster area.
180. Earmarked mandatory grants can be matching or non-matching. Matching grants complement sub-national contributions. Matching grants are dependent on norma-tive or actual spending for services for which the grants are earmarked or on the local revenue collection related to these services. All mandatory earmarked grants that are not given complementarily to sub-national contributions are non-matching. Note that mandatory earmarked grants may also be dependent on con-tingencies other than sub-national contributions, for instance on local circum-stances or performance indicators. In such cases, the grants are considered non-matching. The decisive question is whether the decrease in sub-national spending will automatically lead to a decrease in the grant.
181. Non-earmarked mandatory transfers can be general purpose or block grants. A block grant is given by the grantor for a specific purpose (or purposes). However, since the grant is not earmarked, the grantee’s actual use of the grant is not con-trolled. Instead, the output could be regulated through, for example, a set of mini-mum standards that the sub-national government would have to provide. In this case, resources are transferred in the form of a grant to the sub-national govern-ments to cover all or part of the cost for certain sub-national services. The criteria used to calculate the level and distribution of the grant are usually connected to the normative cost of providing the goods or services for the sector as a whole, using variables that a specific sub-national government cannot directly control. The rationale for this type of grant is to improve efficiency in the use of resources at the sub-national level, whereas the activity is financed, in part or fully, by the central government. If a sub-national unit is able to perform the activity at lower than normative costs, the grant will not be reduced for that unit as a consequence, thereby giving the sub-national government an incentive to fully explore the ad-vantages of decentralized service provision. This kind of grant can be a means of moving away from earmarked grants.
182. Understanding the mechanics of local government grant financing may be important for the proper design of social service decentralization reforms. For example, the transition from the old system of institutionalized care for children without families (usually financed from the central budget) to community-based services for vulnerable families and children (financed at the sub-national level) is on the agenda of many countries of the region. This implies a resource transfer in the form of a grant from central to local budgets. The important function of child care should have a sound financial basis, so it is desirable to establish such grants as mandatory and not discretionary. This would ensure an uninterrupted flow of resources for these purposes not only in good years (in terms of revenue collec-

Marek Dabrowski (Ed.), Roman Mogilevskiy (Ed.)
CASE Network Reports No. 92 94
tion on a local level), but also during an economic downturn. If the commitment of local governments to deliver this type of services is firm, the grant could be non-earmarked; this would make the system simpler (a big advantage in itself). However, if the local governments suffer from chronic shortages of resources for implementation of nearly all of the functions they are responsible for (as is often the case, especially in low and lower-middle income countries), non-earmarked grant money is at permanent risk of being redirected to other purposes, which are perceived by a local government as having priority in given circumstances. In such a situation, grant earmarking becomes preferable. This solution would re-quire the development of financing norms linked to some verifiable in-put/output/outcome indicators of service delivery and establishing a control sys-tem for this type of expenditures.
183. Local government spending by sector. While local governments control a much smaller part of GG resources than central governments (see set of Figures A.5.1 in the Statistical Annex and Table 5.147), their role is quite important in some coun-tries (especially larger ones, see above) and some sectors. In particular, local gov-ernments play an important role in spending on the social sector. As to be ex-pected, local governments prevail in the provision of services in housing and community amenities (see Figure A.5.1a).
184. The provision of education services is traditionally divided between local governments (pre-primary, primary and secondary education48) and the central government (tertiary education). As the number of students in mandatory primary and secondary education is usually much larger than in tertiary education, spend-ing on primary and secondary education composes a larger part of total education spending (see also Sections 4.2.2 and 4.2.3). So, local governments normally spend more than half of the consolidated education budget (see Figure A.5.1b).
185. The situation is more diverse in the health sector (see Figure A.5.1c). Health services provision is centralized in Georgia and Moldova (with extensive use of extra-budgetary funds). Central government and central extra-budgetary funds play an important role in Russia, while in other countries the most resource-consuming functions of primary and secondary health care are implemented by local governments (see also Sections 4.2.1 and 4.2.3).
186. Finally, in social protection the largest share of resources belongs to pension funds, which are always in the structure of central government either as a part of the central government budget, or, more frequently, as an extra-budgetary fund. Other social protection services (e.g., benefits and social services for vulnerable 47 Shares of local governments in any expenditure category are always 100% minus respec-tive shares of central government shown in this table. 48 In Georgia, education services are mostly provided by central government.

CHALLENGES AND TRAJECTORIES OF FISCAL POLICY AND PFM REFORM…
CASE Network Reports No. 92 95
population groups) are divided in approximately equal proportions between cen-tral and local governments (see Figure A.5.1d).
5.4. Quasi-Fiscal Operations of Governments
187. All government functions consisting of implementing public policy through the provision of nonmarket services and income and wealth redistribution are consid-ered fiscal activities49. Separating these functions from the monetary and com-mercial activities of government helps to establish clear accountability for the conduct of these very different activities and facilitates the assessment of the mac-roeconomic impact of the fiscal activities of government. However, some fiscal activities are carried out by nongovernment public sector agencies whose primary activity is monetary or commercial. Such activities are referred to as being quasi-fiscal to indicate that they are not the primary activities of these agencies and that their fiscal effects are not usually reflected in fiscal reports for the GG (as they would be, for instance, if the commercial or monetary institution were fully com-pensated from the central government budget for undertaking a quasi-fiscal activ-ity). In contrast to explicit fiscal activities, quasi-fiscal activities (QFAs) are often introduced by simple administrative decisions, are not recorded in budgets or budget reports, and typically escape legislative and public scrutiny. They are in-troduced by governments to achieve a variety of objectives, such as promoting certain activities, redistributing income or collecting revenue.
188. The following types of QFAs are usually identified: (i) operations related to the financial system, including subsidized lending to the government and/or private sector, (ii) operations related to the exchange system, including multiple exchange rates, exchange rate guarantees and other arrangements, and (iii) operations re-lated to the commercial enterprise sector including charging below commercial prices for goods and services, the provision of non-commercial services (e.g., so-cial services) by commercial enterprises, pricing for budget revenue purposes and paying higher than commercial prices for inputs to suppliers.
189. The best international practice in this area is to replace QFAs with explicit fiscal operations, e.g., providing subsidies or compensations directly from a government budget. However, if, for political economy reasons, the government can not (or
49 The text in this and next paragraph is based on the GFS Manual (2001).
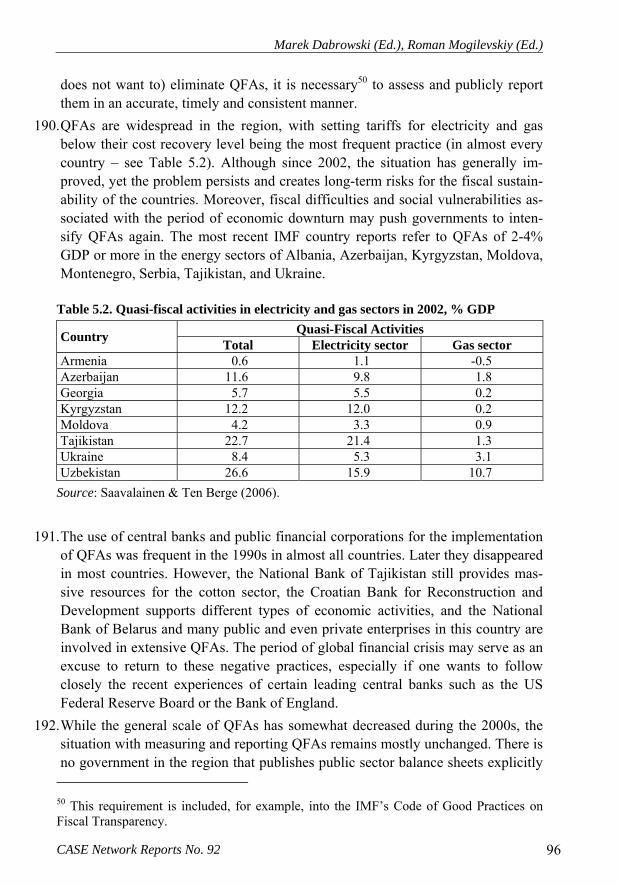
Marek Dabrowski (Ed.), Roman Mogilevskiy (Ed.)
CASE Network Reports No. 92 96
does not want to) eliminate QFAs, it is necessary50 to assess and publicly report them in an accurate, timely and consistent manner.
190. QFAs are widespread in the region, with setting tariffs for electricity and gas below their cost recovery level being the most frequent practice (in almost every country – see Table 5.2). Although since 2002, the situation has generally im-proved, yet the problem persists and creates long-term risks for the fiscal sustain-ability of the countries. Moreover, fiscal difficulties and social vulnerabilities as-sociated with the period of economic downturn may push governments to inten-sify QFAs again. The most recent IMF country reports refer to QFAs of 2-4% GDP or more in the energy sectors of Albania, Azerbaijan, Kyrgyzstan, Moldova, Montenegro, Serbia, Tajikistan, and Ukraine.
Table 5.2. Quasi-fiscal activities in electricity and gas sectors in 2002, % GDP
Quasi-Fiscal Activities Country Total Electricity sector Gas sector Armenia 0.6 1.1 -0.5 Azerbaijan 11.6 9.8 1.8 Georgia 5.7 5.5 0.2 Kyrgyzstan 12.2 12.0 0.2 Moldova 4.2 3.3 0.9 Tajikistan 22.7 21.4 1.3 Ukraine 8.4 5.3 3.1 Uzbekistan 26.6 15.9 10.7
Source: Saavalainen & Ten Berge (2006).
191. The use of central banks and public financial corporations for the implementation of QFAs was frequent in the 1990s in almost all countries. Later they disappeared in most countries. However, the National Bank of Tajikistan still provides mas-sive resources for the cotton sector, the Croatian Bank for Reconstruction and Development supports different types of economic activities, and the National Bank of Belarus and many public and even private enterprises in this country are involved in extensive QFAs. The period of global financial crisis may serve as an excuse to return to these negative practices, especially if one wants to follow closely the recent experiences of certain leading central banks such as the US Federal Reserve Board or the Bank of England.
192. While the general scale of QFAs has somewhat decreased during the 2000s, the situation with measuring and reporting QFAs remains mostly unchanged. There is no government in the region that publishes public sector balance sheets explicitly 50 This requirement is included, for example, into the IMF’s Code of Good Practices on Fiscal Transparency.

CHALLENGES AND TRAJECTORIES OF FISCAL POLICY AND PFM REFORM…
CASE Network Reports No. 92 97
showing QFAs; QFA estimates are never included in budget documentation for parliaments. In many countries, QFA estimates endorsed by both governments and international financial organizations do not exist.
193. Very often the use of QFAs is justified as a measure to protect socially vulnerable populations from utility price increases and as a way to stimulate employment. It should be noted that this way of social support is the least targeted and, therefore, the least effective for the purposes of poverty reduction. The main recipients of QFAs are always high- or middle-income people as they consume larger portions of subsidized electricity, gas and other goods and services and benefit from the support channeled through monetary and financial sector QFAs.
5.5. Budget processes
194. The performance of the PFM system depends, among others, on organizing the budget process. For the majority of the analyzed countries, a transition to a full-fledged national budget process according to the standards used in developed countries proved an uneasy task. While some progress has been accomplished, there are still problems with fully implementing basic PFM reforms. Concerning more advanced reforms, the majority of countries are still in the early stages of their implementation.
195. Basic PFM reforms include establishing: (i) complete budget classification, (ii) complete budget coverage and capital budget integration, (iii) consolidated treas-ury single accounts, and (iv) adequate budget controls.
196. Most of the analyzed countries introduced a full classification of government revenues and expenditures by economic, functional, organizational, program and funding codes. This facilitates the attribution of public finance transactions to in-dividual policy areas and creates conditions for the analysis of the social-economic effects of government revenue collection and spending policies. There are still problems with classification in some countries (e.g., Kosovo, Tajikistan) as PEFA assessments suggest (see Section 6.6 and Table A.5.1 in the Statistical Annex, indicator 5). It is worth noting that the existing classification is often un-able to trace expenditures on many MDG-related issues (e.g., separating child- and mother health-related spending from other health expenditures, primary/basic secondary education spending from general secondary education expenditures) and some other important policy areas.
197. Progress in consolidating various types of government resources (extra-budgetary funds, PIP and QFA) into budget documentation going through legislative scru-

Marek Dabrowski (Ed.), Roman Mogilevskiy (Ed.)
CASE Network Reports No. 92 98
tiny and in introducing single treasury accounts is also visible, however, more should be done in this area (see Sections 5.2 and 5.4 Table A.5.1, indicators 6, 7, 9). In particular, operations of the majority of extra-budgetary units and even some operations included in the government budgets (especially PIP-related) are not reflected in treasury accounts.
198. The improvement in budget control implies the elimination of systematic over-spending or the accumulation of arrears. As PEFA reports and scores indicate, the predictability and regularity of payments has improved in comparison with 1990s but remains far from ideal (see Table A1, indicators 1-4, 16-18); both govern-ments/ministries of finance and line spending units (ministries and agencies) face frequent within- and between-year fluctuations in cash flows, which result in dif-ferent types of inefficiencies. This is partially caused by the limited technical ca-pacity of many ministries/agencies (lack of reliable revenue and expenditure fore-casting techniques) and governance problems (insufficient transparency of re-source allocation) but has partial roots in unstable revenue flows. The sequestra-tion of government expenditure, i.e., proportionally cutting expenditures across all expenditure programs, is not, therefore, an unknown phenomenon. Usually, budget legislation fully exempts some expenditure items such as the wage bill and social benefits from sequestration. However, in conditions where the wage bill comprises a very large part of total government spending, such arrangements sub-stantially reduce the discretion power of governments and their ability to priori-tize expenditure during the time of revenue shortfall (e.g., in time of economic crisis).
199. The advanced PFM reforms include, among others, (i) medium-term budgeting (MTB) and (ii) performance-oriented budgeting51. The potential benefits of MTB are well known. MTB can improve fiscal control, financial discipline, allocative efficiency and the cost-effectiveness of service delivery due to a greater clarity of policy objectives, more predictability in budget allocation, increased comprehen-siveness and the validity of budget information and enhanced accountability and transparency in resource use. In many countries, however, efforts to introduce MTB have ended up as a ritual, resource-consuming effort of little practical value. Very often, medium-term spending proposals are not reconciled with the re-sources available during the budget period. As a result, the spending plans be-come mere wish lists and have a limited impact on annual budget preparation or on medium-term resource allocation. Inefficient coordination with national or sectoral strategies, such as PIP, is another problem.
51 The discussion of these reforms provided below is based on Tandberg & Pavesic-Skerlep (2008).

CHALLENGES AND TRAJECTORIES OF FISCAL POLICY AND PFM REFORM…
CASE Network Reports No. 92 99
200. A complete MTB system includes a number of different steps (see Figure 5.7). Most countries have taken a phased approach to the introduction process, which often takes several years. A medium-term macro-fiscal framework is perhaps the most essential building block for an MTB. To ensure that estimates are realistic, the macro-fiscal framework must be updated regularly and be fully reconciled with budgetary decisions. This is extremely difficult in the time of global finan-cial crisis characterized by a far-reaching uncertainty in respect to fundamental macroeconomic trends.
201. The next step is often introducing multi-year expenditure ceilings with the purpose of increasing budget predictability for line ministries, while containing aggregate expenditures at an acceptable level. Initially, expenditure ceilings tend to be related to broad functional categories and are only indicative. In order to meet the objectives of enhancing predictability and fiscal control, the ceilings will need to be related to specific organizational entities, which can be held account-able for not exceeding the limits, and to have a formal status in the budget proc-ess. Unless the MTB ceilings are the starting points for negotiating budgets for the following years, they will tend to have a limited impact. Therefore line minis-tries should be asked to develop medium-term spending plans that fit within the established expenditure ceilings. These spending plans should be based on rele-vant government and sector strategies. They should identify the costs of different programs, policies and activities within the ministry’s area of responsibility, to allow the responsible minister to prioritize among the different policy options within the sector, and the cabinet to choose between proposals for new policies and activities in different sectors. The quality of a sector spending program will generally depend on whether the country has introduced performance-oriented budgeting (see below). To enable a rational MTB discussion, it is essential that sector spending programs separate the costs of existing policies from new spend-ing initiatives. An MTB provides an important basis for the coordination of cur-rent and capital spending. This is a weak spot of many budget systems, and budg-ets often fail to recognize the costs required for the maintenance of existing capi-tal and operational costs for new capital projects.
202. Practically all countries in the region have taken some steps towards MTB, but most of them are at early stages of this process (see Table A.5.1, indicator 12). The majority of countries prepare comprehensive macro-fiscal frameworks, which are updated at least twice a year. This is the strongest element of existing MTB systems. In countries which are actual or potential EU candidates, or IMF pro-gram beneficiaries, macro-fiscal projections and the related budget estimates are more likely to be kept updated.
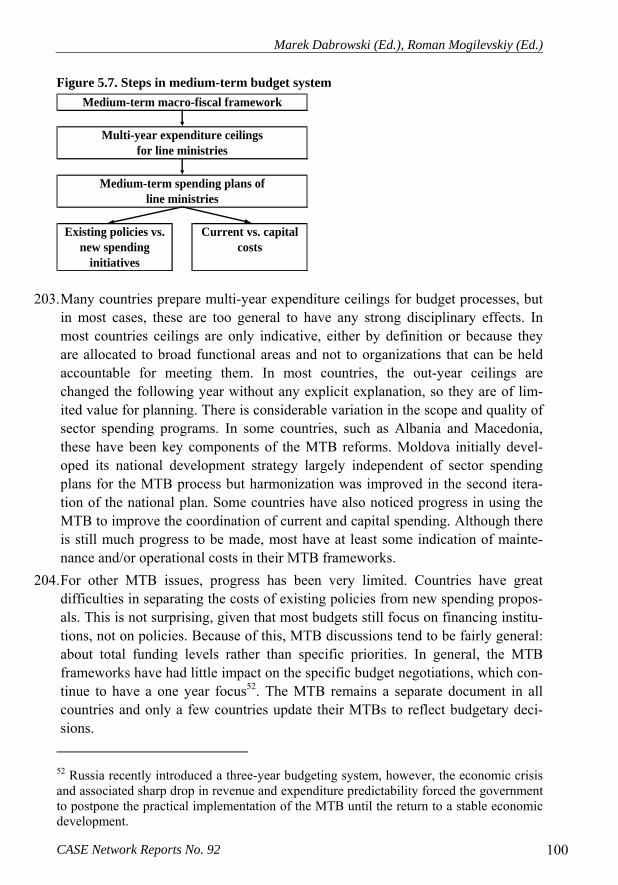
Marek Dabrowski (Ed.), Roman Mogilevskiy (Ed.)
CASE Network Reports No. 92 100
Figure 5.7. Steps in medium-term budget system
Existing policies vs. new spending
initiatives
Current vs. capital costs
Medium-term macro-fiscal framework
Multi-year expenditure ceilings for line ministries
Medium-term spending plans of line ministries
203. Many countries prepare multi-year expenditure ceilings for budget processes, but in most cases, these are too general to have any strong disciplinary effects. In most countries ceilings are only indicative, either by definition or because they are allocated to broad functional areas and not to organizations that can be held accountable for meeting them. In most countries, the out-year ceilings are changed the following year without any explicit explanation, so they are of lim-ited value for planning. There is considerable variation in the scope and quality of sector spending programs. In some countries, such as Albania and Macedonia, these have been key components of the MTB reforms. Moldova initially devel-oped its national development strategy largely independent of sector spending plans for the MTB process but harmonization was improved in the second itera-tion of the national plan. Some countries have also noticed progress in using the MTB to improve the coordination of current and capital spending. Although there is still much progress to be made, most have at least some indication of mainte-nance and/or operational costs in their MTB frameworks.
204. For other MTB issues, progress has been very limited. Countries have great difficulties in separating the costs of existing policies from new spending propos-als. This is not surprising, given that most budgets still focus on financing institu-tions, not on policies. Because of this, MTB discussions tend to be fairly general: about total funding levels rather than specific priorities. In general, the MTB frameworks have had little impact on the specific budget negotiations, which con-tinue to have a one year focus52. The MTB remains a separate document in all countries and only a few countries update their MTBs to reflect budgetary deci-sions. 52 Russia recently introduced a three-year budgeting system, however, the economic crisis and associated sharp drop in revenue and expenditure predictability forced the government to postpone the practical implementation of the MTB until the return to a stable economic development.

CHALLENGES AND TRAJECTORIES OF FISCAL POLICY AND PFM REFORM…
CASE Network Reports No. 92 101
205. The progress in the introduction of MTBs must be seen in light of a government’s objectives. If a country's main objective for introducing MTB is to establish a credible macro-fiscal framework and provide some indicative guidance to the budget process, many of the current MTB systems may be considered reasonably successful. However, if a country is aiming for a more complete system of MTB, in line with the objectives of improved fiscal control, financial discipline, efficient resource allocation and cost-effective service delivery, there is obviously a long way to go. In many countries, there seem to be significant discrepancies between the officially stated objectives and the objectives that are actually pursued. This may be because countries accept certain objectives as a result of pressures from donors and advisors, but then do little to actually implement them. In fact, the efforts to introduce MTB may have taken the focus away from critical weak-nesses in the annual budget process. For example, in many countries, there con-tinue to be significant discrepancies between spending ceilings and subsequent budget requests; budget discussions tend to be very general, have little policy fo-cus, and be repeated from year to year. Without addressing these very basic is-sues, attempts to introduce full-fledge MTBF may appear to be premature.
206. As for MTB, the potential benefits of a performance-oriented budgeting (POB) are well established and well understood. Better information about outcomes and effectiveness helps to allocate budget resources to the programs with the highest potential benefits, and helps to address equity concerns. Monitoring the cost-effectiveness helps to reduce the costs of delivering specific government services and public goods. However, whereas the benefits are well understood, there is still considerable uncertainty about how to implement a POB. Many OECD countries established program classification structures in the late 1960s or early 1970s. A few of them have reached advanced stages of the process. Not surprisingly, ef-forts to introduce POB in transition and developing countries have often met great difficulties.
207. For an advanced POB system to be effective, agencies must be given more freedom in determining how to meet their stated objectives and manage their budgets. For this, good reporting practices as well as appropriate internal control must be in place to prevent and detect fraud and error. In this system, control over the agencies does not relate to inputs used but concentrates on the activities car-ried out and results achieved. It is important to emphasize that more freedom im-plies more responsibility and accountability. Agencies should not be given more authority if there are no appropriate controls and accountability mechanisms.
208. A complete POB system includes a number of different steps (Figure 5.8). In turn, each step brings with it various complexities and challenges, and will depend, in most cases, on a successful completion of more basic reform steps. For instance, it is not possible to develop an effective performance (output or outcome) budget
Marek Dabrowski (Ed.), Roman Mogilevskiy (Ed.)
CASE Network Reports No. 92 102
in the absence of a well-functioning input budget. The first step is usually to in-troduce a programmatic budget classification. The second step is to define indica-tors that describe the inputs to each program and the related activities. Outcome and output indicators should be defined at the beginning of a program and set for the whole duration of the program. For many programs, the focus is on output indicators, since outcomes are usually difficult to measure. There may be long time lags between outputs and outcomes or it may be unclear to what extent an outcome can be attributed to a particular organization. Very often outcomes de-pend on the work of several different organizations and external factors. Interme-diate outcome and output indicators are used for monitoring progress in program implementation, as well as for the revision and adjustment of indicators. Once the program structure and related indicators have been established, it is important to ensure that all activities contribute to the established objectives.
209. Governments will often be involved in a number of activities that have a historical rationale, but limited impact on current program objectives. It is important to re-view such activities to assess whether they should be discontinued or restructured to give a clearer contribution to specific objectives. Once performance informa-tion (i.e., the relationship between input and output/ outcome indicators) is avail-able, it can be used to support management decisions regarding the allocation of funds. At this stage, performance information is usually only one of the factors influencing funding decisions, and there is no one-to-one relationship between performance and funding. In order to use performance information consistently, the budget process should include explicit mechanisms for the collection of esti-mates and results for budget program performance. The final and most advanced step is to create stringent funding decision rules based on performance indicators. Such mechanisms include purchaser-provider systems, where the central govern-ment purchases specific services according to pre-determined prices, for instance health care services, from agencies and other providers. Even such systems are often combined with discretionary funding mechanisms.
210. Most countries in the region are in the early stages of developing a POB. Only a few of them are introducing elements of output-oriented budgeting and have de-veloped mechanisms where the funds provided are directly related to the results achieved (like Kyrgyzstan in the health sector). Almost all of the analyzed coun-tries have introduced programmatic budget classifications, but their quality varies considerably. In many cases programs are designed to describe an agency’s ac-tivities rather than its operational objectives. As a result, there is often a signifi-cant overlap between programmatic and organization classification. In addition, all the countries have developed some activity and input indicators. This is fairly easy to do because programs tend to be based on organizations. Accordingly, many activity and input indicators primarily describe the traditional activities of

CHALLENGES AND TRAJECTORIES OF FISCAL POLICY AND PFM REFORM…
CASE Network Reports No. 92 103
these agencies. Some countries (e.g., Macedonia) have developed reasonably comprehensive indicators for outputs but there are few outcome indicators. In many countries the term “outputs” is used but the indicators related to this term often describe activities rather than outputs.
Figure 5.8. Elements of a performance-oriented budgeting system
211. Due to the lack of well-defined output and outcome objectives and the organiza-tional focus of the budget programs, a realignment between the different elements in the result chain is often lacking or unclear. It is often difficult to see whether and how current activities contribute to stated objectives. Even in countries with comprehensive program structures, some programs lack clearly stated objectives and indicators. Where objectives are defined, it may still be very unclear how the different activities contribute to achieving them. The lack of a clear result chain, with missing elements and unclear relationships, makes it difficult to define effi-ciency indicators and to systematically assess program efficiency. There is anec-dotal evidence that performance information may have some impact on decisions in a few countries. Line ministries are in principle required to include perform-ance information in their budget submissions and justifications, but the obser-
Introduction of program-matic budget classification
Internal control and
audit
Input and output/ out-come indica-
tors
System to measure
budget pro-gram per-formance
Stringent funding
decision rules based on
indicators
Well-functioning
input budget
Performance-oriented
budgeting

Marek Dabrowski (Ed.), Roman Mogilevskiy (Ed.)
CASE Network Reports No. 92 104
vance and enforcement of such provisions is rather weak. Even when some in-formation is available, it is in many cases ignored at the time of decision-making.
212. Common obstacles include capacity shortages (especially in line ministries), staff reluctance to adopt changes, underestimating time and resources required, and in many cases, the existence of more pressing priorities or more basic reforms to be put in place. As for MTB, there is considerable uncertainty about the purpose of the POB reforms in many countries. Often, this is very much an ad-hoc effort, sometimes driven by vague notions that POB is a desirable feature of a budget system. In many ways, the POB reforms themselves suffer from the same weak-nesses as the budget programs that are to be defined through these reforms: un-clear objectives, excessive activity focus and unclear result chains.
213. Many governments have problems in establishing a clear operational understand-ing of basic POB concepts in budget organizations. As mentioned before, it is very common that outputs are confused with activities. It seems even more diffi-cult to establish a clear and agreed upon understanding of concepts related to out-comes and efficiency. For budget systems with a strong input and activity focus, shifting to an outcome focus represents a dramatic change in administrative cul-ture and priorities. One generic challenge for POB systems is that officials are reluctant to take responsibility for results they do not control. It is important to establish a clear understanding of how and to what extent managers will be held accountable for results. For instance, while outcome indicators are useful for measuring the progress of a government program in the longer term, it is gener-ally too crude a measure to use directly for the annual performance evaluation of a manager. The outcome indicators will have to be supplemented with indicators related to other parts of the result chain, to get a clear sense of the effectiveness of the organization and its manager. This performance management framework should also recognize that managers need to take risks in some areas, and that in some cases these risks will lead to negative results.
214. Some countries have attempted to strengthen output control while retaining traditional input controls. It is very difficult for managers to improve their effi-ciency or effectiveness, if they do not have the authority to take decisions regard-ing the allocation of resources or deployment of staff, and consequently they will be reluctant to accept any increased responsibility for the performance of their organizations. Effective mechanisms for accountability and control are also criti-cal. When managers are given increased autonomy, it is essential to have well-functioning accounting and reporting mechanisms, to ensure that they are held accountable for their results and for abiding by regulatory provisions, in a trans-parent fashion.
CHALLENGES AND TRAJECTORIES OF FISCAL POLICY AND PFM REFORM…
CASE Network Reports No. 92 105
215. It follows from the above discussion that many countries have embarked on POB reforms prematurely. Performance budgeting is difficult, much more so than tra-ditional input budgeting. An absolute minimum requirement for introducing ele-ments of output or outcome budgeting should therefore be the existence of a well-functioning input budget system.
5.6. Policy frameworks
216. As mentioned above, modern budgeting systems which aim to increase the effectiveness and efficiency of government policies require the availability of a consistent national medium-term policy framework. Such a framework in the form of a national development strategy/ plan is expected to determine a coherent set of national development goals, tasks and policies, establish clear priorities and incorporate sectoral strategies ensuring their complementarily and excluding con-tradictory and duplicating policy actions. An operational framework of this type is necessary for the introduction of the MTB, the POB and other innovations in the budget process.
217. At the end of the 1990s/early 2000s, the World Bank, the IMF and other interna-tional development organizations began promoting medium-term strategic plan-ning in partner countries in the form of Poverty Reduction Strategy Papers (PRSP). The majority of the countries of the region prepared PRSPs with the sup-port of their development partners. In the second part of the 2000s, many of them began to feel that the focus on poverty implied by the very title of PRSP did not match their actual/aspired status of middle-income countries and too narrowly defined their development priorities. So, the second generation of medium-term strategies often does not mention poverty reduction as such, but refers to a broader development agenda, while essentially keeping key featured of the PRSP. In most cases, PRSPs refer to medium-term country development strategies for 3-5 years but some refer to strategies with horizons as long as 13-15 years. For ex-ample, longer-term plans are the basis of Armenia’s (2008-2021) and Georgia’s (2003-2015) PRSPs. However, the financial crisis may outdate many of these pol-icy frameworks which have been built on too optimistic macroeconomic assump-tions.
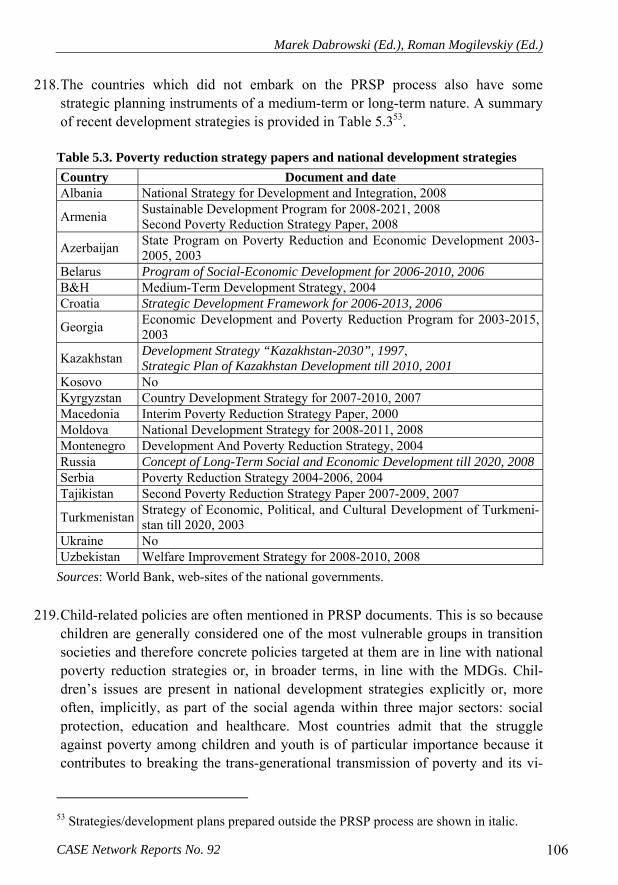
Marek Dabrowski (Ed.), Roman Mogilevskiy (Ed.)
CASE Network Reports No. 92 106
218. The countries which did not embark on the PRSP process also have some strategic planning instruments of a medium-term or long-term nature. A summary of recent development strategies is provided in Table 5.353.
Table 5.3. Poverty reduction strategy papers and national development strategies Country Document and date Albania National Strategy for Development and Integration, 2008
Armenia Sustainable Development Program for 2008-2021, 2008 Second Poverty Reduction Strategy Paper, 2008
Azerbaijan State Program on Poverty Reduction and Economic Development 2003-2005, 2003
Belarus Program of Social-Economic Development for 2006-2010, 2006 B&H Medium-Term Development Strategy, 2004 Croatia Strategic Development Framework for 2006-2013, 2006
Georgia Economic Development and Poverty Reduction Program for 2003-2015, 2003
Kazakhstan Development Strategy “Kazakhstan-2030”, 1997, Strategic Plan of Kazakhstan Development till 2010, 2001
Kosovo No Kyrgyzstan Country Development Strategy for 2007-2010, 2007 Macedonia Interim Poverty Reduction Strategy Paper, 2000 Moldova National Development Strategy for 2008-2011, 2008 Montenegro Development And Poverty Reduction Strategy, 2004 Russia Concept of Long-Term Social and Economic Development till 2020, 2008 Serbia Poverty Reduction Strategy 2004-2006, 2004 Tajikistan Second Poverty Reduction Strategy Paper 2007-2009, 2007
Turkmenistan Strategy of Economic, Political, and Cultural Development of Turkmeni-stan till 2020, 2003
Ukraine No Uzbekistan Welfare Improvement Strategy for 2008-2010, 2008
Sources: World Bank, web-sites of the national governments.
219. Child-related policies are often mentioned in PRSP documents. This is so because children are generally considered one of the most vulnerable groups in transition societies and therefore concrete policies targeted at them are in line with national poverty reduction strategies or, in broader terms, in line with the MDGs. Chil-dren’s issues are present in national development strategies explicitly or, more often, implicitly, as part of the social agenda within three major sectors: social protection, education and healthcare. Most countries admit that the struggle against poverty among children and youth is of particular importance because it contributes to breaking the trans-generational transmission of poverty and its vi-
53 Strategies/development plans prepared outside the PRSP process are shown in italic.

CHALLENGES AND TRAJECTORIES OF FISCAL POLICY AND PFM REFORM…
CASE Network Reports No. 92 107
cious cycle among some parts of the population (Serbia and Montenegro PRSP, 2004).
220. The cases in which child-related issues are dealt with explicitly include the Albanian PRSP, which contains the National Child Strategy referring to various aspects of children’s well-being with special attention to actions against child poverty, proper treatment of children in courts and penal institutions and educa-tional and health issues. Georgia included the National Action Plan for Children for 2003-2007 in its PRSP (2003), with priority directions in the educational, so-cial and cultural spheres. Uzbekistan devoted a special section to children’s issues recognizing the fact that children under the age of 15 make up nearly 41% of the total population. Therefore it puts a special emphasis on the implementation of the document “A World Fit for Children” which aims to strengthen the interaction between the different institutions involved in child-related processes, and the de-velopment of local initiatives and the participation of local organizations.
221. Several countries have devoted substantial parts of their PRSPs to cross-cutting issues relating to children without explicitly referring to special institutions, strategies or systematic action plans. For example, Serbia put together a section on various issues related to poverty reduction among children and youth as well as Roma (with emphasis on education and health). The document also identifies main problem areas and recommendations of actions (including concrete ones, such as setting pilot projects). Similar issues are taken up in Montenegro’s Devel-opment and Poverty Reduction Strategy (PRSP, 2004).
222. The sections on children and youth policies, either within a formalized plan or strategy or as a collection of policies such as those mentioned above, are gener-ally not linked to any concrete financial commitments on the part of the Govern-ment. They rely on future budgeting in sectors such as health, education, culture and sports or social protection. Therefore, they present general intentions and pri-orities rather than any concrete action plan and timeframe. As such they are not likely to be binding for governments, especially since most proposals are defined in a rather vague manner making it impossible to monitor their progress and ac-complishment.
223. Policies targeting children and youth are more accountable when they are part of national strategies for specific sectors such as education, health and social secu-rity. While expenditures in these sectors do not finance only children’s needs, they may include some specific spending items targeting directly them. Moreover, public funding of education is usually dominated by the needs of primary and secondary education (see Section 4.2.3), both of which directly benefit children and youth. On the other hand, even if specific child-targeted policies cannot be singled out from total spending on health care or social protection (which is often

Marek Dabrowski (Ed.), Roman Mogilevskiy (Ed.)
CASE Network Reports No. 92 108
the case of national strategies) one may correlate attention given to these sectors (in terms of additional funds and reforms) with the improvement of children’s well-being.
224. Most strategic documents include so-called policy matrixes which present the detailed activities envisaged for their implementation in specific sectors such as energy, industry, education or waste management. The matrix contains a brief description of activities along with the timeframe and cost estimates of their im-plementation. Together these actions constitute the national strategy. Sometimes they are already ongoing, in other cases - they are new. Some countries treat the total cost of these policies as the actual budget lines fully corresponding to budget expenditures (e.g. the cost of all education policies add up to total budget expen-ditures on education). In this case national strategies look like the equivalent of future budget plans – however, whether they are going to be implemented remains an open issue. More often the total cost is an addition to the previously existing budget framework amounting to a fraction of the total budget (e.g. Serbia’s PRSP 2004-2006 or Georgia’s EDPRP 2001-2003). However, there are countries that estimate the total cost of policies above the actual expenditures and thus seek ad-ditional funding for their implementation (e.g. Albania’s NSDI in 2010-2013).
225. Most PRSP documents disaggregate the cost of national strategies into several parts according to the source of financing, i.e. the central government budget, the local budget, the public sector and external funding. A government’s spending commitments are generally formulated with regard to the total costs of strategies, although only public resources are controlled by public authorities while other sources may be significantly less predictable. Therefore the concrete amount pledged, as well as targets in terms of GDP have to be treated with caution, espe-cially when the PRSP indicates that sources other than the state budget are in-volved in financing.
226. It is very difficult to verify whether the commitments set in national strat-egy/PRSP documents were actually implemented. PRSP progress reports (if avail-able) are intended to monitor the indicators selected to reflect progress in specific sectors rather than prove whether financial commitments for certain areas have been met. This approach is reasonable taking into account that it is not spending as such that generates positive change but rather a coherent combination of well planned and implemented reforms, enhancing the efficiency of spending and proper incentive schemes as well as careful targeting of recipients of assistance. On the other hand, using actual ex-post expenditure data collected by the WHO or UNICEF to verify spending commitments may not be entirely accurate due to potentially different approaches adopted by governments and the aforementioned institutions in compiling data.
CHALLENGES AND TRAJECTORIES OF FISCAL POLICY AND PFM REFORM…
CASE Network Reports No. 92 109
227. In spite of these problems we can attempt to verify how binding the PRSP commitments for governments were and look at countries’ actual spending and achievements. For example, Armenia’s Second PRSP (2008) included a useful overview of spending commitments set in the first PRSP (2003) along with actual achievements in the areas of health and education measured by standard PRSP indicators. The document clearly indicated that the country had done better on poverty reduction over 2004-2006 in terms of school enrolment rates and child and mother mortality rates compared to its first PRSP commitments and actually spent less than planned (0.2-0.4% of GDP less on education in 2004-2006 and 0.7-1.1% of GDP less on health).
228. Tajikistan’s experience was less encouraging. Both progress reports (2004 and 2006) indicated that most targets set in its 2002 PRSP were not met. Secondary school attendance rates fell to 88% in 2004. Poverty was the most frequently cited barrier to continuing education with 65% of families whose children failed to at-tend school regularly experiencing financial difficulties (PRSP Progress Report 2006). This happened in spite of the increase in official spending from 2.1% of GDP in 1999 to 2.6% in 2002 and 2.7% in 2004. Health sector statistics painted a mixed picture. While between 2001 and 2004 both infant mortality and maternal mortality decreased by 6.4 and 24.1%, respectively, PRSP progress reports admit-ted that these rates might not appropriately reflect the situation, as they did not include unregistered births. Official health sector spending remained stagnant at around 0.9% of GDP during 2000-2004 down from 1.1% in 1999.
229. Georgia made firm commitments in its 2003 PRSP to increase spending on health care, education and child and family allowances. Progress reports published in 2005 and 2006 allowed for the verification of some of the pledges made for 2004 and 2005. The EDPRS predicted that the state budget would cover 65% and 22% of all expenditures related to health and education programs, respectively, over the period of 2003-2005, with the rest financed by local authorities, external fi-nancing and the private sector (in various proportions). Actual state spending in 2004 and 2005 was on average higher than planned in the health sector (by 39.6%) and slightly lower than planned in education (-5.7%). Spending was seri-ously under-executed in 2004 when it fell short of EDPRS commitments by -11.5% jointly for both sectors but was increased in 2005, resulting in expenditures nearly 50% higher than planned. While the assessment of the Government’s commitments were not clear-cut, one has to acknowledge that faced with signifi-cant under-spending on health and education in 2004, the authorities tried to make up for it with spending more in the following year which made it possible to pay accrued arrears and accelerate some programs. This may be cautiously taken as evidence of the disciplining role of spending commitments made in the EDPRS.
Marek Dabrowski (Ed.), Roman Mogilevskiy (Ed.)
CASE Network Reports No. 92 110
230. Serbia pledged to spend more on education in its 2003 PRSP, setting a goal of 4% of GDP in the medium term and specific goals for 2003-2005 at 3.8% of GDP. As the PRSP Progress Report (2006) suggests, actual spending fell short of these goals, reaching 3.5% or less during 2003-2005.
231. Azerbaijan committed to keeping spending on education constant at 3.5% of GDP during 2003-2005, however, spending fell to 3% in 2005 and then further to 2.7% in 200654. The country was more successful in raising expenditures on health from 0.8% in 2002 to 1% in 2005 - just 0.2 percentage point short of the PRSP commitment. Georgia fully met its PRSP target of raising spending on health (to 1.7% in 2005) but spent significantly less than pledged on education (see Section 4.2.2).
232. Sub-regional differences in how PRSPs treat children’s policies are not significant and result mainly from the different development level of the two sub-regions (see Table 2.6 in Section 2.6) The countries of the Western Balkans, which have on average a substantially higher level of GDP per capita when compared with the CIS, are trying to increase their otherwise relatively high school enrollment ratios or continue reducing child and maternal mortality rates by implementing more advanced programs not much different from those introduced in EU. On the other hand, CIS countries, in particular Central Asian ones, are choosing methods of improving health care and education coverage more appropriate to their develop-ment level via programs focusing mostly on poverty reduction. One common component of all Western Balkan PRSPs relates to reducing the economic and social vulnerability of the Roma population and children and improving their ac-cess to education and health care.
233. Generally, the review of a dozen PRSP documents suggests that the effectiveness of national strategies in targeting children’s needs and providing a sound back-ground for POB is limited. On the one hand, they allow governments to elaborate their strategies in detail with references to various aspects of child wellbeing – poverty, education, health but also culture, sports, social empowerment and many others. The relatively open and broad-ranging form of those documents has both advantages (countries can take approaches that fit their specific situation best) and disadvantages (because it allows for omitting sensitive issues, or avoiding con-crete commitments). Instead governments themselves decide on the final selection of issues to be tackled and measures to be taken. Consequently children’s issues are present in national PRSPs to very different extents with some countries com-
54 However, one must remember that GDP grew at a record-high pace in this period: by 24.3% in 2005 and by 30.6% in 2006. So both nominal and real spending for education increased, although slower than GDP. A similar situation could take place in some other countries recording very high growth rates (see Section 3.1 and Table 3.1).
CHALLENGES AND TRAJECTORIES OF FISCAL POLICY AND PFM REFORM…
CASE Network Reports No. 92 111
mitting to specific spending levels on concrete programs (providing detailed out-lines of the programs and responsible institutions) with others merely expressing intentions to improving the wellbeing of children and youth at a very high level of generality. In he case when specific commitments are made they are usually very hard to verify, either because PRSP progress reports are irregular or because they fail to provide sufficiently detailed information.
234. Summing up, while PRSPs potentially constitute a very good instrument for governments to express more interest and commitment to child welfare, in prac-tice this opportunity has not been used very efficiently. In our view, the effective-ness of the PRSPs in targeting children would be greatly improved if they were followed by obligatory progress reports published at regular intervals. They could be built into the PRSP process as an integral systemic part with a clear structure facilitating the monitoring of progress and verification of commitments made in the main document.
5.7. Budget reporting systems and transparency
235. Sound budgeting and financial management must be based on a broad set of comprehensive and transparent information. Providing timely and accurate report-ing on budget revenues and expenditures, including donors’ annual and multi-annual aid flows, is important to underpin sound planning and budgeting as well as to allow governments to be fully accountable to their parliaments and citizens on the use of domestic and external resources. Transparency rules include norms and regulations that establish the conditions under which budgets are prepared and presented to civil society.
236. Key dimensions of sound budgeting include: policy-based budgeting, comprehen-siveness of budget coverage, transparency of fiscal and budget information, budget credibility (i.e., being realistic and implemented as planned), predictability and control of the use of public funds (internal audit) and external audit (for ex-ample, by the legislature).
237. One of the most important budget documents is the government’s budget proposal (other documents include the pre-budget statement, enacted budget, mid-year re-ports, end-of-year report, audit reports). This document is a government’s declara-tion of the policies that are to be pursued during the upcoming budget year. The parliament’s approval of the government’s proposal suggests its concurrence with the executive’s chosen priorities (OBI, 2006).

Marek Dabrowski (Ed.), Roman Mogilevskiy (Ed.)
CASE Network Reports No. 92 112
238. According to OBI (2006), Croatia and Russia are the lead countries in the region in informing the public on the budget proposal, with 59 and 58 out of 100 scores. They are followed closely by Ukraine, Macedonia, Georgia, Serbia, and Bosnia and Herzegovina. In these countries, citizens are informed through the media and press on budget proposals. In Montenegro, Albania, Armenia, Azerbaijan, Moldova, Kazakhstan and Kyrgyzstan, “some” information on the budget pro-posal is released to the public. In Tajikistan, Uzbekistan, Turkmenistan and Bela-rus, only minimal budget information is provided to citizens and these countries perform rather poorly in terms of budget transparency. Data is not available for Kosovo.
239. Furthermore, governments often fail to give systematic budget information to the legislature. In most countries, even in top performing ones like Croatia, Russia and Ukraine, the proposal (or series of proposals forming the document) did not provide a comprehensive picture of the government’s fiscal position during the forthcoming year(s). The documents do not lay out the government’s policy goals and explain how the planned spending will assist in achieving them. Also the gov-ernments do not disclose detailed information on the expected revenues, plans to borrow, payments arrears, etc. (OBI, 2006). Summing up, the budget process is still not satisfactory enough throughout the region. Russia and Croatia are the top performers in the region, followed by Ukraine and the Western Balkan countries. Moldova. Georgia, Armenia, Kazakhstan and Azerbaijan are next in line. Kyr-gyzstan lags behind. For countries like Tajikistan, Uzbekistan, Turkmenistan, Bel-arus, government accountability scores are very low while the data are not avail-able for Kosovo (GIR, 2007, OBI, 2006).
240. The governments of Armenia, Croatia, Bosnia and Herzegovina, Georgia, Russia, Serbia, Montenegro and Ukraine issued pre-budget statements to disclose the overall spending and revenue levels during the budget formulation, prior to sub-mission to the parliament. The pre-budget statement is presented and approved by the legislature, strengthening legislative oversight (OBI, 2006).
241. Mid-year reports on the budget execution are provided regularly to the parlia-ments of Armenia, Albania, Croatia, Russia, Kazakhstan, Ukraine, Macedonia, Serbia, Bosnia & Herzegovina, and Moldova but even there they are usually ap-proved without sufficient parliamentary discussion. Their timely availability al-lows CSO and parliaments to raise important questions on the divergence from the policies approved in the budget. None of the analyzed countries provides a mid-year report to public (OBI, 2006).
242. An annual budget report should be issued by the government at the end of the year and it should be more then a mere financial statement. Rather it should serve as the government’s principle accountability report to its citizens providing an

CHALLENGES AND TRAJECTORIES OF FISCAL POLICY AND PFM REFORM…
CASE Network Reports No. 92 113
update on progress in achieving policy goals and improvements in outcomes that were laid out at the beginning of the year. Most countries provide only partial in-formation in their annual reports, while reporting in Croatia, Bosnia and Herzego-vina, and Russia is more detailed (OBI, 2006). There is no data on Tajikistan, Uz-bekistan, Turkmenistan, Belarus and Kosovo.
243. In most countries, governments do not make information publicly available that is already produced for its internal use or for donors (OBI, 2006). Only in Georgia and Ukraine are attempts made to provide budget information in a form that a non-expert could easily grasp. Itemized budget spending is not usually accessible to the wider public (GIR, 2007).
244. In a few countries only, namely in Georgia, Albania, and Kazakhstan, parliaments hold public hearings regarding budget formulation. In Armenia, Bosnia & Herze-govina, Kyrgyzstan, Moldova, Montenegro, Ukraine, Russia, and Croatia, citizens and CSO submit their proposals to their respective parliaments but these initia-tives yield no results. In the remaining countries, the public has a very limited role in providing input to the budget formulation process.
245. Unless there is a strong demand for accountability, most PFM reforms will not be sustainable in the long run. Parliaments can play a critical role here as they ap-prove budget allocations, oversee budget execution and control budget perform-ance. They can mitigate the risk of excessive budgetary discretion by the execu-tive power by reinforcing the countervailing mechanisms of government account-ability and legislative scrutiny. They can also exert pressure on the executive to improve fiscal performance (Ackerman, 2005). In most countries, the legislature has formal power to amend the budget and oversee its implementation (GIR, 2007).
246. The amount of time that the government gives legislature to work on a budget proposal determines the parliament’s ability to conduct the oversight function. Experience suggests that three months is the minimum time for a meaningful par-liamentary budget process. In fact, many countries do not meet this criterion, ex-cept for Russia and Kazakhstan (OBI, 2006).
5.8. Participation of civil society in national budget processes
247. The Western Balkan countries, Ukraine and Moldova have achieved notable progress in their relationships with civil society. Also, a number of advocacy groups that perform a watchdog function occasionally defy the government. On the other hand, in Belarus, Uzbekistan and Turkmenistan, trade unions remain

Marek Dabrowski (Ed.), Roman Mogilevskiy (Ed.)
CASE Network Reports No. 92 114
under state control; restrictions persist on civic engagement, so very few CSOs exist. Poor legal protection has left NGOs vulnerable to control and censorship by state authorities (WB, 2004). Russian NGOs still operate largely outside main-stream society. In Central Asia, with the exception of Kyrgyzstan, freedoms of expression and association are still limited. Nevertheless, civic engagement is widely practiced at the community level in Central Asia. Some regional CSOs are building on resurgent traditional organizations, such as guilds, artisans’ associa-tions, and religious foundations that maintain shrines, schools, and public welfare, often with government support. While strong traditional ties in rural areas may promote civil society initiatives, high levels of corruption and bureaucratization could undermine their effectiveness (Novikova, 2007).
248. As discussed in Section 5.7, access to budget information, participation in the formulation of national and local budgets and their monitoring remain weak across the region despite increased public interest stemming from concerns re-lated to endemic corruption, ineffective public service delivery, and slow com-munity-led development. CSOs may participate in the budget process in four phases: (i) budget preparation and formulation, (ii) budget analysis, i.e. evaluation of whether documents prepared during the first stage of budget cycle correctly address social development concerns, (iii) expenditure tracking, i.e. verifying whether the funds allocated for particular programs have indeed been spent on these programs and (iv) performance monitoring when CSOs rate the final outputs of government agencies.
249. Accountability means the obligation of power holders to account for or take responsibility for their actions. It relies on civic engagement while the depth of involvement is frequently related to the level of institutionalization of relations between government and civil society. Accurate, timely, and comprehensive in-formation is required during each stage of the budget cycle to ensure the account-ability of government to citizens. Most countries in the world do not meet this standard (OBI, 2006).
250. The lack of independent media and of timely and accurate information about public policy offers limited incentives and resources for citizens to monitor and assess their government’s performance in spending or development initiatives (WB, 2004). Many countries recently introduced the practice of make budget documents available to the public through the Internet but in most of the analyzed countries, access to this communication channel remains limited and unequal. According to the World Factbook of the US Central Intelligence Agency (CIA), 12% of the population in Albania uses the internet, 6% in Armenia, 13% in Azer-baijan, 25% in Bosnia & Herzegovina, 70% in Belarus, 9% in Georgia, 13% in Kazakhstan, 15% in Kyrgyzstan, 35% in Macedonia, 18% in Moldova, 40% in Montenegro, 20% in Serbia, 21% in Russia, 0.3% in Tajikistan, 8% in Uzbeki-

CHALLENGES AND TRAJECTORIES OF FISCAL POLICY AND PFM REFORM…
CASE Network Reports No. 92 115
stan, 22% in Ukraine, 1.5% in Turkmenistan and 44% in Croatia. There is no data available for Kosovo.
251. “Right to information” laws have been introduced in many countries of the region: Albania, Azerbaijan, Armenia, Croatia, Montenegro, Bosnia, Macedonia, Moldova, Serbia, Bosnia & Herzegovina, Georgia, while Ukraine stands out as a particularly good case. Constitutional guarantees exist in Kazakhstan, Russia and Tajikistan but actual access to information is restricted. Kyrgyz citizens have no right to appeal if access is denied. In Montenegro and Russia, there is no institu-tional mechanism through which citizens can request public records. Generally, the laws appear adequate but, despite some improvement across the region, citi-zens and CSOs face multiple difficulties in ensuring their implementation.
252. A number of countries improved their legislation to reflect citizens’ demands and interest in topics of their concern. The interest in improved service delivery means increased pressure to provide citizens with highly detailed information, such as expenditures in their local school districts or health centers (which is not included in a country’s budget information). Clearly, defining the procedures for ensuring the simultaneous release of public documents and information to interested parties is an important first step in maintaining sound financial management.
253. Most CSOs from the reviewed countries report a lack of commitment on the side of the executive (government) and legislature (parliament) to make full use of opportunities to engage and inform the public on the budget. For example, many parliaments fail to hold committee hearings on the budget.
254. CSO control functions remain weak. Budget documents consolidate a wide range of economic and financial information. However, CSOs in the region have rarely commissioned Participatory Public Expenditure Reviews, Expenditure Tracking Studies, report cards (surveys that focus on poor people’s experiences with public services). Participatory performance monitoring (PPM) thus remains well under-utilized across the region, partly because of the lack of capacity and the fact that PPM is expensive for both local governments and CSOs. However, independent budget monitoring, according to the World Bank stocktaking exercise (Novikova, 2007), is becoming increasingly popular and is likely to increase further. Some good examples include: “Increasing Budget for Education” in Albania, “Open Budget” in Kazakhstan, financing of NGOs by governments in Macedonia and Serbia, CSO monitoring of the government pro-poor policies in relation to spe-cific vulnerable groups in Serbia. The latter have been integrated into the annual PRSP progress reports.
255. Good examples of CSO engagement mainly relate to their participation in the formulation and monitoring of local government budgets. They include budget hearings and civic participation in budget formulation and monitoring of expendi-

Marek Dabrowski (Ed.), Roman Mogilevskiy (Ed.)
CASE Network Reports No. 92 116
tures in relation to social welfare, health, education and allocations for CSO ac-tivities at the local level. Budget transparency initiatives have been going on for years in Georgia, Armenia, Albania, Serbia, Bosnia, Russia and this is still the work in progress. The city of Obninsk in Russia has been one of the pioneers in the area. According to the OSCE (2007) survey, 14% of local budgets in Bosnia & Herzegovina are formulated with citizens’ input. Local budgeting processes and CSO inclusion have led to the increased activity of northern Azerbaijan mu-nicipalities (Public Expenditure Management Seminars for Municipalities and Municipal Budget Transparency) to seek subsidiary funding for important public services. The Service Improvement Action Plan and Improving Local Self-Governance in Central Asia and Local Budget Transparency and Accountability of Local Self-Government in Kyrgyzstan are two related programs. Others in-clude: Budget Transparency Program in Georgia, Participatory Budgeting in the Municipality of Elbasan (Albania), Open Municipality Budget (Macedonia), Monitoring of Municipal Councils (parliaments)/B&H Local Governance Pro-gram, Participatory Budgeting at Municipal Level (Bosnia and Herzegovina). Budget execution activities primarily focus on public education to improve budget literacy, transparency portals, budget hearings, public expenditure tracking surveys, and social audits.
256. There are less examples of national level activities. The Economic Research Center in Azerbaijan regularly publishes brochures about the ongoing budget and releases brochures with information on specific areas of public expenditure (edu-cation, social welfare). It also publishes budget related calendars, and ensures budget analysis for parliamentarians. In 2006, nine NGOs in Azerbaijan estab-lished the National Budget Group to implement the permanent monitoring of the budget execution (Novikova, 2007). The Croatian Institute of Public Finance has been increasing the transparency of the budget execution through its Newsletter.
257. The anti-corruption initiatives in the budget monitoring process include: the Kyrgyz Parliamentarians Against Corruption in Kyrgyzstan, the Extractive Agency Transparency Initiative in Kazakhstan, Public Opinion Survey of Corrup-tion in Tajikistan, Grant Programs Monitoring and Public Expenditure Monitoring Programs in Georgia. Budget Analysis Project in Armenia, Increasing Budget for Education National Revenue and Expenditure Analysis projects in Albania. Sub-national initiatives are often used as an introduction into testing national policy proposals such as the Budget Dialogue Initiative in Kyrgyzstan and the support to NGOs initiative in Macedonia (Novikova, 2007).

CHALLENGES AND TRAJECTORIES OF FISCAL POLICY AND PFM REFORM…
CASE Network Reports No. 92 117
6. Donors’ Instruments in PFM Reforms
6.1. Overview of Key Donor Instruments
258. An absolute majority of the countries in the region have received substantial donor assistance during the transition period in the 1990s and 2000s. Donors sup-ported a broad program of reforms related to virtually all aspects of the economic, social and political development of these countries. The recipient governments played a decisive role in the design and implementation of these reforms. Gov-ernment budgets and other components of public finance (e.g., extra-budgetary funds, SOE resources) were key instruments for reform. Therefore, donors need to pay a lot of attention to the PFM.
259. Donors aim to support recipient countries in their progress towards reaching MDGs, reducing poverty and achieving sustainable development. An effective and efficient PFM is an important pre-requisite for reaching these goals. For Western Balkan countries preparing for EU accession, an important donor goal is to support the process of harmonizing the countries’ national PFM systems with the acquis communautaire.
260. All donor interventions in the area of PFM can be grouped into three categories: (i) direct provision of resources for public expenditures through loans, grants and debt relief to governments; (ii) policy conditionality accompanying financial aid to support required reforms; (iii) technical assistance to governments in imple-menting PFM reforms. On the other hand, donors have now realized that they also have to do their part in assisting with the development of an effective PFM in the recipient countries by aligning donor financing modalities and practices with re-cipient country systems (see more on that in Section 6.7).
261. An important task of donor interventions is to support and not undermine domestic revenue mobilization for the purposes of a country’s social and eco-nomic development. Donor resources have to augment government resources di-rected to priority sectors and/or reforms and not replace domestic resources allo-cated for these purposes. Therefore, additionality (support for actions which would not have taken place in the absence of donor resources) is a required fea-ture of any donor intervention.

Marek Dabrowski (Ed.), Roman Mogilevskiy (Ed.)
CASE Network Reports No. 92 118
262. Frequently used modalities of handling donor resources include: (i) general budget support, in which the recipient government has nearly full discretion in managing donor money, as very loose or no restrictions on the allocation of these resources exist; (ii) sectoral budget support, in which the recipient government manages these resources but commits itself to spend them only/mostly within pre-determined sector(s); an important form of sector budget support is the so-called Sector-Wide Approach (SWAp); (iii) direct donor control of spending, i.e. project implementation through PIUs, mostly used for investment and TA projects.
263. Different donors have different roles in and approaches to PFM reforms. The IMF is a key source of conditionality; its resources are not usually used for the direct financing of public expenditures (they go to central banks to increase their inter-national reserves rather than to the government budget). The IMF is also a major source of expertise on PFM issues. The World Bank (and ADB for CCA coun-tries) provides many kinds of support: resources for budgets, conditionality, in-vestment loans, and technical assistance. The EC is a very important source of investments, technical assistance and budget support for Western Balkan coun-tries and, to a somewhat lesser extent, to other countries of the region. For indi-vidual country groups, the EC uses different instruments such as the Instrument for Pre-accession Assistance (IPA) for actual and potential EU candidates, the European Neighborhood and Partnership Instrument (ENPI) for the Western CIS and Caucasus countries, a separate arrangement (four cooperation spaces) for Russia (sometimes also considered in the ENPI framework), and the Development Cooperation Instrument (DCI) for Central Asian countries. Bilateral donors (the US, the UK, Netherlands, Japan, Switzerland and others) provide direct budget support, investment resources and technical assistance. Bilateral (especially smaller) donors often pool resources together with each other and larger players (e.g., provide resources for a Trust Fund managed by the World Bank, UNDP or other UN agencies).
264. Recently new donors—China and Russia—emerged in the region; they also strongly influence the public finance situations in some of the smaller CIS coun-tries. They provide these countries with resources for public investments on IDA-comparable terms (e.g., Chinese loans to Tajikistan for automobile road rehabili-tation and energy projects or Russian loans to Kyrgyzstan for the construction of a hydropower station), direct budget support (e.g., Russian support to Armenia, Belarus and Kyrgyzstan) or debt restructuring on conditions close to those of IFIs (e.g., Russian debt-for-equity swaps with several CIS countries). The modalities of their support may differ from those of OECD countries (less or no policy con-ditionality, but explicit or implicit political conditionality). These donors are not

CHALLENGES AND TRAJECTORIES OF FISCAL POLICY AND PFM REFORM…
CASE Network Reports No. 92 119
active in the area of technical assistance in PFM issues. At the same time, Rus-sia55 serves as a source of technical expertise in many areas including PFM for many smaller countries of the region due to the common institutional and cultural background, similar incentive structures of the political elite, and therefore, ease of copying Russian policies and institutional arrangements. Apart from official donors (countries and international organizations), non-governmental donors are also important in some of the region’s countries. For example, the Armenian di-aspora in Armenia and the Aga-Khan Development Network in Tajikistan and Kyrgyzstan provide substantial funds for public investment projects, which are complimentary to government activities and obviously indirectly affect govern-ment budget allocations (e.g., no need for government to allocate resources for school rehabilitation in a village, if the diaspora takes care of this).
6.2. Direct Budget Support
265. The WB and ADB provide direct budget support in the form of Development Policy Operations (DPO) and similar instruments56 aimed to mitigate transition costs of structural reforms in targeted sectors. DPOs are usually accompanied by policy conditionality, which often includes conditions related to many sectors (in-cluding the social sector) and cross-cutting issues. DPO conditionality can be used by reformers to overcome resistance against reforms.
266. Borrowing conditions from the WB group depend on a country’s income per capita status (see Section 2.6 and Table 6.1). Middle-income countries can borrow from the International Bank of Reconstruction and Development (IBRD), which provides non-concessional loans. Low income countries are eligible for loans from the International Development Association (IDA)57, which are deeply con-cessional—interest-free loans and grants for programs aimed at boosting eco-nomic growth and improving living conditions. Some countries belong to the low income group and are eligible for IDA loans, but due to their financial creditwor-thiness, they are also eligible for IBRD loans (blend group). The ADB has a sys-tem similar to that of the WB.
55 Also China, although to a much lesser extent 56 In low income countries with PRSPs, DPOs may also be called Poverty Reduction Sup-port Credits (PRSCs). Previously, this type of operation was known as Structural Adjust-ment Credits (SAC). 57 Currently IDA countries are those that had a per capita income in 2007 of less than USD 1,095 and lack the financial ability to borrow from IBRD.

Marek Dabrowski (Ed.), Roman Mogilevskiy (Ed.)
CASE Network Reports No. 92 120
267. Information on recent and planned WB DPOs is provided in Table 6.2. In the previous CAS/CPS cycle 10 out of 19 countries received direct budget support from the WB. In the current planning cycle this number has been reduced to 8 and the absolute value of the WB budget support was also reduced. While circum-stances determining a government’s demand for/WB’s supply of budget support are individual for every country, it is possible to notice that the probability of DPO implementation is increased by two factors:
• relative natural resource scarcity and low share of windfall revenues in government budgets, and
• willingness/ability of the government to comply with policies promoted by the WB, which is higher for EU candidate and potential candidate countries and lower in post-conflict countries and countries with authori-tarian regimes.
Table 6.1. The World Bank’s income and lending categories Country Income group Lending category Albania Lower middle income IBRD Armenia Lower middle income Blend Azerbaijan Lower middle income Blend Belarus Upper middle income IBRD Bosnia & Herzegovina Lower middle income Blend Croatia Upper middle income IBRD Georgia Lower middle income Blend Kazakhstan Upper middle income IBRD Kyrgyzstan Low income IDA Macedonia Lower middle income IBRD Moldova Lower middle income IDA Montenegro Upper middle income IBRD Russia Upper middle income IBRD Serbia Upper middle income IBRD Tajikistan Low income IDA Turkmenistan Lower middle income IBRD Ukraine Lower middle income IBRD Uzbekistan Low income Blend
Source: World Bank.
Table 6.2. WB DPOs in two last cycles of country programming
Latest completed CAS/CPS Current CAS/CPS DPOs DPOs Country Period Mil.
USD% of total
WB lending Period Mil. USD
(planned)% of total
WB lending Albania 2002-2004 40 24 2005-2008 60 35 Armenia 2003-2005 28 18 2006-2009 35 19

CHALLENGES AND TRAJECTORIES OF FISCAL POLICY AND PFM REFORM…
CASE Network Reports No. 92 121
Latest completed CAS/CPS Current CAS/CPS DPOs DPOs Country Period Mil.
USD% of total
WB lending Period Mil. USD
(planned)% of total
WB lending Azerbaijan 2003-2005 20 11 2007-2010 0 0 Belarus 2002-2004 0 0 2008-2011 0 0 Bosnia & Herzego-vina
2005-2007 0 0 2008-2011 0 0
Croatia 2005-2008 382 39 2009-2012 Some58 Some Georgia 1998-2005 130 24 2006-2009 63 44 Kazakhstan 2001-2003 0 0 2004-2007 0 0 Kosovo 2006-2007 0 0 2008 0 0 Kyrgyzstan 2003-2006 20 13 2007-2010 0 0 Macedonia 2004-2006 60 36 2007-2010 75 34 Moldova 2002-2004 0 0 2005-2008 0 0 Montenegro 2005-2006 18 56 2007-2010 0 0 Russia 2003-2006 0 0 2007-2009 0 0 Serbia 2005-2007 102 27 2008-2011 100 29 Tajikistan 2002-2004 0 0 2006-2009 20 17 Turkmeni-stan No WB lending No WB lending
Ukraine 2004-2007 500 44 2008-2011 600 24 Uzbekistan 2005-2007 0 0 2008-2011 0 0
Source: World Bank.
268. The EC provides another significant source of budget support in the form of
grants through the Sector Policy Support Programs (SPSP), which were previ-ously called Food Security Programs (FSPs). FSPs evolved during the last decade from financing selected expenditure items, deemed to be critical for poverty re-duction (the so-called expenditure targeting), towards general and sector budget support, which is expected to provide more sustainable results. In their current form, apart from budget support, SPSPs also include policy conditionality and technical assistance resources. In some cases, FSP/SPSP also incorporate NGO-support programs (e.g., in Tajikistan). Typically, SPSP policy conditionality has a component related to PFM reform (very often this refers to the implementation of IMF programs in the country) and a component of structural reforms for a se-lected sector (see SPSP-supported sectors and budget allocations in Table 6.3). The sector concentration of this conditionality is important as the SPSP resources are not very large in comparison with total government expenditures of the recipi-ent countries. 58 To be determined in the process of CPS implementation.
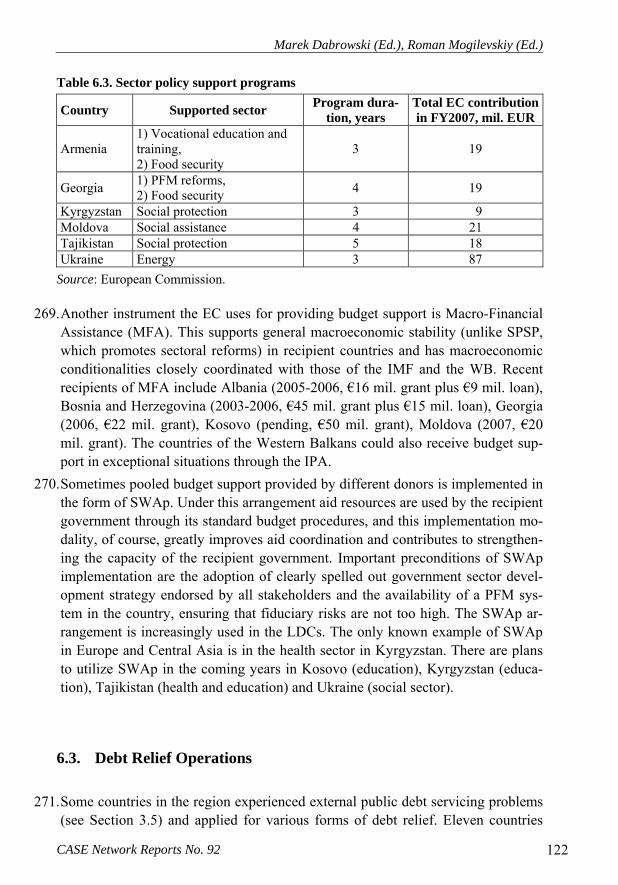
Marek Dabrowski (Ed.), Roman Mogilevskiy (Ed.)
CASE Network Reports No. 92 122
Table 6.3. Sector policy support programs
Country Supported sector Program dura-tion, years
Total EC contribution in FY2007, mil. EUR
Armenia 1) Vocational education and training, 2) Food security
3 19
Georgia 1) PFM reforms, 2) Food security 4 19
Kyrgyzstan Social protection 3 9 Moldova Social assistance 4 21 Tajikistan Social protection 5 18 Ukraine Energy 3 87
Source: European Commission.
269. Another instrument the EC uses for providing budget support is Macro-Financial Assistance (MFA). This supports general macroeconomic stability (unlike SPSP, which promotes sectoral reforms) in recipient countries and has macroeconomic conditionalities closely coordinated with those of the IMF and the WB. Recent recipients of MFA include Albania (2005-2006, €16 mil. grant plus €9 mil. loan), Bosnia and Herzegovina (2003-2006, €45 mil. grant plus €15 mil. loan), Georgia (2006, €22 mil. grant), Kosovo (pending, €50 mil. grant), Moldova (2007, €20 mil. grant). The countries of the Western Balkans could also receive budget sup-port in exceptional situations through the IPA.
270. Sometimes pooled budget support provided by different donors is implemented in the form of SWAp. Under this arrangement aid resources are used by the recipient government through its standard budget procedures, and this implementation mo-dality, of course, greatly improves aid coordination and contributes to strengthen-ing the capacity of the recipient government. Important preconditions of SWAp implementation are the adoption of clearly spelled out government sector devel-opment strategy endorsed by all stakeholders and the availability of a PFM sys-tem in the country, ensuring that fiduciary risks are not too high. The SWAp ar-rangement is increasingly used in the LDCs. The only known example of SWAp in Europe and Central Asia is in the health sector in Kyrgyzstan. There are plans to utilize SWAp in the coming years in Kosovo (education), Kyrgyzstan (educa-tion), Tajikistan (health and education) and Ukraine (social sector).
6.3. Debt Relief Operations
271. Some countries in the region experienced external public debt servicing problems (see Section 3.5) and applied for various forms of debt relief. Eleven countries
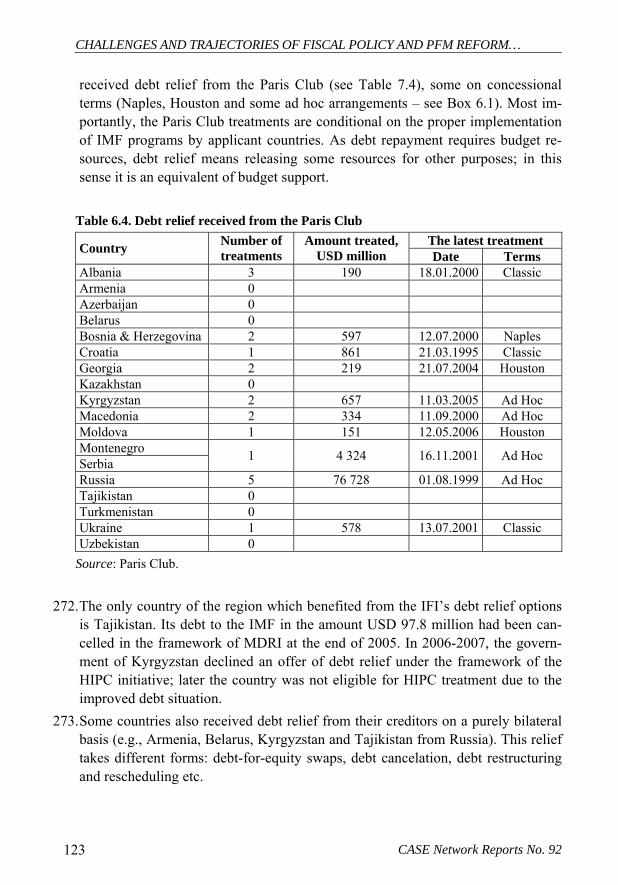
CHALLENGES AND TRAJECTORIES OF FISCAL POLICY AND PFM REFORM…
CASE Network Reports No. 92 123
received debt relief from the Paris Club (see Table 7.4), some on concessional terms (Naples, Houston and some ad hoc arrangements – see Box 6.1). Most im-portantly, the Paris Club treatments are conditional on the proper implementation of IMF programs by applicant countries. As debt repayment requires budget re-sources, debt relief means releasing some resources for other purposes; in this sense it is an equivalent of budget support.
Table 6.4. Debt relief received from the Paris Club
The latest treatment Country Number of treatments
Amount treated, USD million Date Terms
Albania 3 190 18.01.2000 Classic Armenia 0 Azerbaijan 0 Belarus 0 Bosnia & Herzegovina 2 597 12.07.2000 Naples Croatia 1 861 21.03.1995 Classic Georgia 2 219 21.07.2004 Houston Kazakhstan 0 Kyrgyzstan 2 657 11.03.2005 Ad Hoc Macedonia 2 334 11.09.2000 Ad Hoc Moldova 1 151 12.05.2006 Houston Montenegro Serbia 1 4 324 16.11.2001 Ad Hoc
Russia 5 76 728 01.08.1999 Ad Hoc Tajikistan 0 Turkmenistan 0 Ukraine 1 578 13.07.2001 Classic Uzbekistan 0
Source: Paris Club.
272. The only country of the region which benefited from the IFI’s debt relief options is Tajikistan. Its debt to the IMF in the amount USD 97.8 million had been can-celled in the framework of MDRI at the end of 2005. In 2006-2007, the govern-ment of Kyrgyzstan declined an offer of debt relief under the framework of the HIPC initiative; later the country was not eligible for HIPC treatment due to the improved debt situation.
273. Some countries also received debt relief from their creditors on a purely bilateral basis (e.g., Armenia, Belarus, Kyrgyzstan and Tajikistan from Russia). This relief takes different forms: debt-for-equity swaps, debt cancelation, debt restructuring and rescheduling etc.

Marek Dabrowski (Ed.), Roman Mogilevskiy (Ed.)
CASE Network Reports No. 92 124
Box 6.1. Concessional terms of debt relief Naples terms are only applicable to IDA countries. They imply a debt cancellation of 67% eligible non-ODA credits; the remaining 33% are to be rescheduled (23 year repay-ment period with a 6-year grace period and progressive payment) at the appropriate mar-ket interest rate. ODA credits are to be rescheduled (40 year repayment period with a 16-year grace period and progressive payment) at the original or a more favourable interest rate. The Naples terms also include the possibility for creditor countries to conduct, on a bilateral and voluntary basis, debt swaps with the debtor country. Houston terms are designed for lower-income countries (with a GDP per capita of less than USD 2,995) with high level of indebtedness (e.g., a debt to GDP ratio higher than 50%) and with a large share of public debt (stock of official bilateral debt of at least 150% of private debt). Non-ODA credits are rescheduled at the appropriate market rate over around 15 years with a 2-3 year grace and progressive payments increasing year by year. ODA credits are to be rescheduled (20 year repayment period with a maximum 10-year grace period and progressive payment) at the original or more favourable interest rate. Houston terms also include the possibility for creditor countries to conduct, on a bilateral and voluntary basis, debt swaps with the debtor country. Ad hoc arrangements specially designed for the debtor country are usually less conces-sional than the Naples terms, but more favourable than classic (non-concessional) terms.
6.4. Investment Operations
274. Lending to governments for PIP is the largest part of ODA. Development banks are major sources of concessional investment loans. Bilateral donors also provide resources for investment loans on conditions that are usually similar to those of development banks. The investment operations of the WB are summarized in Ta-ble A.6.2 in the Statistical Annex. It shows that investment projects compose a larger part of total WB lending; almost every country in the region (apart from Turkmenistan) has borrowed resources for this purpose. Demand for WB invest-ment lending has increased recently: 10 out of 19 countries expect to receive more (on a per annum basis) investment resources under current CAS/CPS than under previous one.
275. While a larger part of investment loans goes to the financing of production infrastructure projects (energy, roads, telecommunications etc.), social investment projects also compose a significant portion of donor investment loans. Their share in total investment lending of the WB (Table A.6.2) varies greatly by country and by period from 0% for Kazakhstan (the only country without social infrastructure projects) to 100% in Belarus and Uzbekistan in the previous planning cycle. Dur-ing these two planning cycles, 14 countries borrowed/ planned to borrow to sup-port education projects, 13 countries for water and utilities projects, 12 countries

CHALLENGES AND TRAJECTORIES OF FISCAL POLICY AND PFM REFORM…
CASE Network Reports No. 92 125
for health projects, and 8 countries for social protection projects. There seems to be no general trend in absolute amounts of social investment lending. Some coun-tries are increasing their borrowing and other countries are reducing it. However, in terms of the share of social projects in total WB investment lending, one can see a definite downward trend. In 10 out of 15 countries for which data are avail-able, this share is smaller under the current CAS/CPS than under previous one. So, additional WB resources seem to go mostly to sectors other than the social sector.
Table 6.5. EC support (investment operations, budget support and technical assistance)
Support amount Country Instru-
ment Period Total, EUR mn
Annual per capita, EUR
Albania IPA 2007-2012 498.0 26.1 Armenia ENPI 2007-2010 98.4 8.2 Azerbaijan ENPI 2007-2010 92.0 2.7 Belarus ENPI 2007-2010 20.0 0.5 Bosnia & Herzegovina IPA 2007-2012 550.3 24.3 Croatia IPA 2007-2012 910.2 34.2 Georgia ENPI 2007-2010 120.4 6.8 Kazakhstan DCI 2007-2010 44.0 0.7 Kosovo IPA 2007-2012 565.1 49.6 Kyrgyzstan DCI 2007-2010 55.0 2.6 Macedonia IPA 2007-2012 507.3 41.5 Moldova ENPI 2007-2010 209.7 13.8 Montenegro IPA 2007-2012 201.4 55.9 Russia ENPI 2007-2010 120.0 0.2 Serbia IPA 2007-2012 1183.6 26.7 Tajikistan DCI 2007-2010 66.0 2.4 Turkmenistan DCI 2007-2010 22.0 1.1 Ukraine ENPI 2007-2010 494.0 2.7 Uzbekistan DCI 2007-2010 32.8 0.3 Central Asia: regional coop-eration programs DCI 2007-2010 94.2 0.4
Regional program – East ENPI 2007-2010 223.5 0.3 Western Balkans: regional & horizontal programs IPA 2007-2012 887.4 6.3
Source: European Commission.
276. The analyzed countries inherited a relatively well developed social infrastructure
from the communist era (see Chapter 2 and 4). Therefore, for many of them, unlike in the majority of developing countries, the key problem is not building new physical infrastructure and human resources out of scratch but sustaining the

Marek Dabrowski (Ed.), Roman Mogilevskiy (Ed.)
CASE Network Reports No. 92 126
effective management of inherited resources in conditions of market economy and the disintegration of the previously uniform social systems of the Soviet Union and Yugoslavia. This makes institutional change and the retraining of human re-sources the main areas of activities rather than investments into fixed capital. Therefore, donor investment projects in social sectors are similar to development policy operations.
277. The European Commission is one of the largest donors for the region (Table 6.5). EC support is split between country programs (70-90% of total funding) and re-gional ones, which are separate for Western Balkans, ENPI-eligible countries and Central Asia. There is great variation of allocations by country: for EU candidate and potential candidates the EC provides 30-60 Euro per capita per annum (in-cluding regional programmes in the Western Balkans), while for ENPI countries and Central Asia, the EC funding is limited to 0.5-14 and 0.7-3 Euro per capita per annum correspondingly. This difference reflects the difference in structure of the EC support: the share of investment projects in the Western Balkan countries is much higher than in the other two sub-regions where EC aid is mostly com-prised of technical assistance and budget support.
278. The US is another large donor for the region. It has different support channels; a large portion of official aid (especially technical assistance) goes through USAID. The Millennium Challenge Corporation (MCC) is a special facility endowed by the US government with significant resources to help eligible countries in the imple-mentation of large development projects (see Table 6.6). The eligibility criteria for MCC funding are rather tough and require the demonstrated commitment of appli-cant governments to the values of democracy and market economy. Eligible coun-tries can conclude a multi-year compact with the MCC. For countries, which are not eligible for full funding yet, there is the so-called threshold program which supports institutional reforms, typically in the areas of governance and anti-corruption.
Table 6.6. MCC programs in the region (as of end 2008) Country Status USD mn Key components
Albania Threshold 13.85 Reduction of corruption and increase in transparency in tax policy and administration, government pro-curement and business entry and registration
Armenia Compact 235.65 Rural road rehabilitation improved irrigation
Georgia Compact 295.30 Regional infrastructure rehabilitation, enterprise de-velopment
Kyr-gyzstan Threshold 16.00 Judiciary and law enforcement reform
Moldova Threshold 24.70 Anti-corruption initiatives Ukraine Threshold 45.00 Anti-corruption in public sector
Source: Millennium Challenge Corporation.

CHALLENGES AND TRAJECTORIES OF FISCAL POLICY AND PFM REFORM…
CASE Network Reports No. 92 127
279. Unlike DPOs, which support regular budget expenditures, investment loans are intended to cover specific expenditures related to a given project only. This cre-ates an incentive and the possibility to channel investment loans through PIP in-stead of the regular budget (see Chapter 5). Keeping these resources outside the main body of expenditures and managing them via the Project Implementation Unit (PIU), which is jointly staffed by donors and governments, allow donors to have tighter control over the implementation of these multi-year, often expensive, projects and be more confident in producing intended outputs. However, the PIU-based modality of project implementation weakens national PFM systems as it implies the existence of parallel expenditure management, procurement and moni-toring systems. This makes the entire public finance system less transparent and accountable (see Section 5.7).
6.5. PFM-Related Conditionality
280. The provision of different types of donor resources for public expenditures is usually accompanied by policy conditions related to macroeconomic and struc-tural policies with the aim of promoting reforms in recipient countries. As a large share of aid resources is channeled through the government budget, a substantial part of conditionality is related to PFM.
281. Very often the donors’ support to the budget is seen as a “carrot” which helps encourage domestic stakeholders to implement the required reforms and ensure concordance with conditions. This implies there are risks for the implementation of these reforms in absence of the “carrot” which are related to the existence of influential counter-reform-minded stakeholders. Therefore, conditionality is usu-ally the most controversial component of donor aid.
282. Among all types of donor conditionality, those imposed by the IMF are the very significant. They usually involve the key issues of monetary and fiscal policies and PFM. A country’s compliance with IMF conditionality signals to other donors (e.g., the EC or Paris Club) that the recipient government is prepared to manage donor resources with a reasonable degree of prudence. Therefore, the resource impact of IMF programs far exceeds the size of their resources as they often act as catalysts for the allocation of much larger funds provided by other donors.
283. During the transition period, almost all countries of the region implemented IMF programs (see Table 6.7). In fact, only Montenegro (during the very short period of its independence) and Turkmenistan never had such a program. 13 out of 18 countries had three or more IMF programs between 1992 and 2008. Nine coun-

Marek Dabrowski (Ed.), Roman Mogilevskiy (Ed.)
CASE Network Reports No. 92 128
tries have IMF programs active as of 31 December 2008. Five smaller countries (Albania, Armenia, Georgia, Kyrgyzstan, and Moldova) spent more than ten years under IMF programs. This may be seen as an indicator of the heavy reliance of these countries on foreign aid (not necessarily of the IMF), for which IMF pro-grams often (but not always) serve as an important pre-condition. Interestingly, Croatia had five arrangements with IMF and for the last three, the government did not draw a penny from the agreed upon credit line; some other countries also demonstrated similar behavior. On the other hand, resource-rich countries (Ka-zakhstan, Russia, Turkmenistan, and Uzbekistan) tended to minimize the use of IMF programs and repaid old IMF loans as soon as possible.
Table 6.7. IMF Programs
All programs in 1992-2008 Latest program
Country Num-ber
Years under the pro-grams
Type Approval date
Expiration date
Active program as of 31.12.08
Albania 5 14 EFF/PRGF 01.02.2006 31.01.2009 Yes
Armenia 5 11 PRGF 18.11.2008 17.11.2011 Yes Azerbaijan 3 8 PRGF 06.07.2001 04.07.2005 No Belarus 2 1 Stand-by 31.12.2008 31.03.2010 Yes Bosnia and Herzegovina 2 5 Stand-by 02.08.2002 29.02.2004 No
Croatia 5 9 Stand-by 04.08.2004 15.11.2006 No Georgia 5 11 Stand-by 15.09.2008 31.03.2010 Yes Kazakhstan 4 8 EFF 13.12.1999 19.03.2002 No Kyrgyz Re-public 6 14 ESF 10.12.2008 09.06.2010 Yes
Macedonia, FYR 5 9 Stand-by 31.08.2005 30.08.2008 No
Moldova 5 12 PRGF 05.05.2006 04.05.2009 Yes Montenegro 0 0 … No Russian Fed-eration 4 6 Stand-by 28.07.1999 27.12.2000 No
Serbia 3 5 Stand-by 17.11.2008 16.02.2010 Yes Tajikistan 4 8 SMP59 01.06.2008 31.12.2008 Yes Turkmenistan 0 0 … No Ukraine 6 8 Stand-by 05.11.2008 04.11.2010 Yes Uzbekistan 1 1 Stand-by 18.12.1995 17.03.1997 No
Source: IMF.
59 The Government of Tajikistan has already expressed its intention to have a new PRGF arrangement after the completion of the Staff-Monitored Program.

CHALLENGES AND TRAJECTORIES OF FISCAL POLICY AND PFM REFORM…
CASE Network Reports No. 92 129
284. IMF conditionality consists of (i) quantitative targets and (ii) structural perform-ance criteria and benchmarks. These conditions are always country- and time-specific, but a substantial number of them relate to fiscal policy and PFM. Quanti-tative targets, which are typical for the latest IMF programs in the region, estab-lish ceilings/floors for:
• central/consolidated government budget deficit (ceiling), • contracting or guaranteeing new non-concessional external debt by gov-
ernment and/or public enterprises (usually zero ceiling), • external arrears (usually zero ceiling), • tax revenues (floor).
285. In countries with weaker PFM systems, quantitative targets also impose limita-tions on the domestic arrears of the central government, revenues and/or the ar-rears of off-budget social security funds, the wage bill of the central government and the tax arrears of state-owned enterprises.
286. The structural performance criteria and benchmarks in the recent IMF programs are diverse but typically deal with tax policy and revenue administration, the quasi-fiscal operations of the government, extra-budgetary funds and the finances of public enterprises. Often, these structural conditions tend to provide a detailed regulation of PFM systems addressing tax structure, tax base definitions and tax rates, utility tariffs etc., going as far as trying to regulate government procurement systems, markets of government securities, the composition of civil servant sala-ries, reduction in public employment and even the introduction of targeted social assistance systems, i.e., areas which are not usually seen as part of the IMF agenda. Obviously, the power of IMF conditionality creates incentives for other donors to press the IMF for the inclusion of issues from their agendas as condi-tions into the IMF programs. Expectedly, however, these attempts at micro-management by the IMF often cause discontent among governments.
287. Conditionalities set by other donors are mostly related to the implementation of structural reforms. These type of conditions also have numerous PFM implica-tions. One area in which many donors are active is the establishment of better linkages between policies and government budgets. The introduction of MTEF, elements of POB, and new budget classifications are often included into the con-ditionalities accompanying loans and grants of the WB, EC and other donors. New modalities of government service delivery promoted by donors have impor-tant implications for the redistribution of responsibilities and resources from cen-tral to local governments; therefore, intergovernmental fiscal relations are another major area of donor PFM-related conditionality.
288. Many sector policy reforms, in particular those in education, health and social protection, imply changes in financing mechanisms (e.g., transition to per capita

Marek Dabrowski (Ed.), Roman Mogilevskiy (Ed.)
CASE Network Reports No. 92 130
financing of services replacing traditional input-based methods), which are ad-dressed by donor conditions accompanying structural adjustment and/or invest-ment lending. The introduction of new PFM institutions (treasury, internal and external audit, integrated financial management systems etc.) is also frequently included in aid conditionality. All of these issues are very sensitive for the recipi-ent governments. For them, meeting donor conditions is often associated with substantial domestic political costs. So, non- or partial compliance with the condi-tionalities (for example, imitating the requested reforms), even at the expense of losing part of funds committed by donors (for example, in the case of the Social Sector Structural Adjustment Credit II and the Economic Management Structural Adjustment Credit in Bosnia and Herzegovina or the Consolidated Structural Ad-justment Credit in Kyrgyzstan) is not a rare phenomenon.
6.6. Technical Assistance in PFM Issues
289. Countries of the region have received massive technical support for reforming their PFM systems. Major sources of technical expertise and technical assistance funding in the PFM area come from multilateral institutions (IMF, WB, ADB, OECD, EC) as well as bilateral donors such as USAID or DFID. Core areas of PFM receiving donor support are: the development of fiscal policy, tax policy and tax administration, debt management, fiscal decentralization, public enterprise finance and public-private partnerships, pension systems, budget formulation and execution, cash management, internal controls, accounting, auditing, legislative oversight, and fiscal transparency.
290. Donors employ a variety of TA activities directed at strengthening recipient government capacity in PFM. Typical activities include: diagnostics of the PFM situation and the identification of key problem areas to be addressed by govern-ments, identification of international best practices and their implementation, sup-port for the development of appropriate legislation and regulations governing PFM systems, support in designing and equipping PFM systems with modern methodologies and computer software and hardware, on-the-job training of gov-ernment officials responsible for PFM issues, support in establishing transparent and accountable PFM systems with appropriate participation of parliaments and civil society etc.
291. Various international organizations codify international best practices in PFM. For example, the IMF and the WB developed standards and codes in the area of policy transparency (in respect to statistical data, fiscal, monetary and financial

CHALLENGES AND TRAJECTORIES OF FISCAL POLICY AND PFM REFORM…
CASE Network Reports No. 92 131
policy), financial sector regulation and supervision and market integrity; they regularly publish country reports on the observance of standards and codes (ROSCs) in different PFM areas. These reports serve as an important diagnostic tool and source of advice for governments in improving their PFM systems.
292. In order to expose governments to best practices, donors support the participation of relevant government bodies in international professional organizations. These include, for example, the International Organization of Supreme Audit Institutions or International Federation of Accountants. Donors also support peer-learning initiatives like the Public Expenditure Management Peer-Assisted Learning pro-ject, which unites PFM professionals from many countries of the region and is coordinated by Slovenia’s Center of Excellence in Finance. This initiative serves for peer learning and benchmarking in four communities of practice (treasury/IT directors, external auditors, internal auditors, budget practitioners).
293. SIGMA — the Support for Improvement in Governance and Management in Central and Eastern European Countries is another example of an initiative spe-cially designed to upgrade governance, including PFM systems. It is a joint initia-tive of the OECD and the EC funded by the EC. SIGMA currently serves actual and potential EU candidates and is expanding its activities to Eastern EU neighbor countries. SIGMA offers beneficiary countries access to a network of experienced public administrators, comparative information, and technical knowl-edge connected with the Public Management Service. SIGMA aims to assist beneficiary countries in their search for good governance to improve administra-tive efficiency and promote the adherence of public sector staff to democratic values, ethics and respect for the rule of law; help build up indigenous capacities at the central government level to face the challenges of internationalization and of EU integration; and support initiatives of the European Union and other donors to assist beneficiary countries in public administration reform and contribute to the coordination of donor activities. SIGMA currently works in five technical ar-eas: Public Administration Development Strategies; Policymaking, Coordination and Regulation; Budgeting and Resource Allocation; Public Service Manage-ment; and Audit and Financial Control. In addition, the Information Services Unit disseminates published and online materials on public management topics. One example is the book “Managing Public Expenditure. A Reference Book for Tran-sition Countries” prepared jointly by SIGMA and the ADB.
294. PFM diagnostics is an important technical assistance area for donors. There is a number of different international budget indicators (CPIA, Open Budget Index, Global Integrity Report, etc.) which use different dimensions, samples and meth-odologies. The Public Expenditure and Financial Accountability (PEFA) Program is a recently developed PFM diagnostics tool. It started in December, 2001 and it is jointly financed by the WB's Development Grant Facility, the EC, DFID, the

Marek Dabrowski (Ed.), Roman Mogilevskiy (Ed.)
CASE Network Reports No. 92 132
Swiss State Secretariat for Economic Affairs, the Royal Norwegian Ministry of Foreign Affairs, the French Ministry of Foreign Affairs and the IMF. The Steer-ing Committee, comprised of members of these agencies, is managing the Pro-gram. The Secretariat implements the PEFA work program and is located in the WB office in Washington, DC. This program produced the PEFA PFM Perform-ance Measurement Framework incorporating a country PFM performance report and a set of qualitative indicators (see below).
295. There are 31 indicators in the PEFA framework covering seven key PFM areas: (i) budget credibility, (ii) transparency and comprehensiveness, (iii) policy-based budgeting, (iv) predictability and control in budget execution, (v) accounting, re-cording and reporting, (vi) external scrutiny and audit, and (vii) donor practices. Some of these indicators have several (up to four) dimensions. Performance on each indicator/dimension is measured by expert assessment on a four-point ordi-nal scale from A (highest score) to D (lowest score).
296. To date, many countries either already went through PEFA assessment or they are in the process of its implementation (see Table 6.8). PEFA assessment reports have been prepared by consultant teams funded by different donors in close col-laboration with the governments.
Table 6.8. PEFA assessment status as of 29 August 2008 Country PEFA status Albania Published, 2006 Armenia Commenced Azerbaijan Finalized Belarus Commenced Bosnia and Herzegovina Planned Croatia No Georgia Commenced Kazakhstan No Kosovo Published, 2007 Kyrgyzstan Published, 2006 Macedonia Published, 2007
Moldova Published, 2006 Update almost completed
Montenegro Commenced Russia No Serbia Published, 2007 Tajikistan Published, 2007 Turkmenistan No Ukraine Published, 2007 Uzbekistan No
Source: www.pefa.org.
CHALLENGES AND TRAJECTORIES OF FISCAL POLICY AND PFM REFORM…
CASE Network Reports No. 92 133
297. The results of the PEFA assessments completed so far are provided in Table A.5.1 in the Statistical Annex. Median scores lie in the range from B to C indicating average quality of PFM systems. While the PEFA methodology has not been de-signed for inter-country comparisons, one can still note that there is a trend of higher PEFA ratings for middle-income countries than for low income countries, i.e., the level of country economic development seems to be positively associated with the quality of PFM systems. A review of the indicators’ median scores re-veals the most typical PFM problem areas in the analyzed countries. The accuracy of aggregate revenue outturn forecasting seems to be generally satisfactory (me-dian score A). The lowest scores (D or D+) have been assigned to “Effectiveness of payroll controls,” “Timeliness of the presentation of audited financial state-ments to the legislature,” “The scope, nature and follow up of external audit re-ports,” “Legislative scrutiny of external audit reports” and all three indicators re-lated to donor practices. These low scores indicate that external scrutiny of budg-ets and (sic!) donor practices are the most problematic areas of PFM.
298. The multiplicity of donors in the PFM area and multiplicity of issues to be reformed simultaneously exert major pressure on recipient governments. As a result, the progress in PFM reforms is often incomparable with the resources allo-cated by donors to promote them. Donor coordination of TA is therefore crucial for effectively reforming PFM systems in the region.
6.7. Donor Coordination in the PFM Sphere
299. A growing understanding of problems in development aid both on the donor and recipient side resulted in the Paris Declaration on Aid Effectiveness adopted at the High Level Forum in Paris in 2005.60 The Declaration covers a broad set of ac-tions aimed at improving the effectiveness of development aid through the promo-tion of:
• Ownership—partner countries exercise effective leadership over their development policies and strategies and co-ordinate development ac-tions;
• Alignment—donors base their support on partner countries’ national de-velopment strategies, institutions and procedures; this, among other things, implies joint donors’ and partner countries’ work on strengthen-ing PFM capacity and national procurement systems;
60 http://www.oecd.org/document/18/0,2340,en_2649_3236398_35401554_1_1_1_1,00.html.

Marek Dabrowski (Ed.), Roman Mogilevskiy (Ed.)
CASE Network Reports No. 92 134
• Harmonization—donors’ actions are better harmonized, transparent and collectively effective;
• Management for results—managing resources and improving decision-making for results;
• Mutual accountability—donors and partners are accountable for devel-opment results.
300. Many countries in the region claimed their adherence to the Declaration. These include Albania, Kyrgyzstan, Moldova, Russia, Serbia, Montenegro, Tajikistan and Ukraine. Almost all donor organizations active in the region also adhered to the Paris Declaration.
301. The Paris Declaration also introduced a set of indicators measuring progress in aid effectiveness on a national level but monitored internationally. There are 12 indicators (one splits into two sub-indicators) with quantified targets on each of them time-bound to 2010. Several of them are directly related to PFM issues (see Table A.6.1 in the Statistical Annex).
302. The OECD organized a survey of three recipient countries in the region to establish baseline values for indicators. Table 6.9 suggests that these countries and donors have yet to go a long way forward to achieve the targets of the Paris Declaration. The distance between actual values and targets is especially striking for use of countries’ PFM and procurement systems (indicators 5a and 5b) and for utilization of program-based approaches (indicator 9).
Table 6.9. Selected Paris Declaration indicators for some countries, 2006
Indicator Albania Kyr-gyzstan
Moldova
3. Government's budget estimates of aid flows as a share of aid disbursed by donors for government sector, % 32 70 70
5a. Aid for government sectors disbursed using country PFM systems as a share of total aid for government sec-tors, %
14 3 25
5b. Aid for government sectors disbursed using country procurement systems as a share of total aid for government sectors, %
6 2 25
6. Number of PIUs parallel to country structures 57 85 43 7. Aid disbursements released according to agreed sched-ules in annual or multiyear frameworks as a share of all donor disbursements recorded by governments, %
49 66 67
8. Untied aid as a share of total bilateral aid as reported to the DAC, % 59 97 81
9. Program-based aid as a share of total aid disbursed, % 5 12 16 Source: OECD Survey.

CHALLENGES AND TRAJECTORIES OF FISCAL POLICY AND PFM REFORM…
CASE Network Reports No. 92 135
303. To implement the Declaration, donors undertake various coordination initiatives including joint programming (e.g., Joint Country Support Strategy in Kyrgyzstan or Tajikistan), joint portfolio reviews (e.g., the WB and ADB), common analyti-cal activities (PEFA), the establishment of a multi-donor trust fund for the imple-mentation of a national development strategy (e.g., in Albania). Yet, the degree of donor coordination is insufficient as suggested by the values of the Paris Declara-tion’s indicators in Table 6.9 and the PEFA ratings on donor practices in Table A.5.1.

Marek Dabrowski (Ed.), Roman Mogilevskiy (Ed.)
CASE Network Reports No. 92 136
7. Concluding Remarks
304. The period covered by this study (2003-2007) can be described as the golden era of rapid economic growth in all the emerging market economies, including the Western Balkan and CIS countries. These years and those preceding them created a macroeconomic room for meeting numerous development challenges: reducing poverty and inequality, improving the quality and coverage of public services, upgrading infrastructure, and advancing more complex and sophisticated reforms, including those in the PFM sphere. Unfortunately, this unique window of oppor-tunity was used by policymakers in the analyzed countries only partly and not always in the most effective way.
305. The extreme poverty (income below poverty line at 1.25 USD a day) was reduced everywhere but it remained substantial in Central Asia (except Kazakhstan) and in some other low-income CIS countries (when a higher poverty threshold below 2.15 USD a day was used). The zone of economic and social vulnerability (be-tween 2.15 and 4.30 USD a day) decreased somewhat in the European part of CIS but remained substantial in all other countries except Croatia and Belarus. Income inequalities, on average, did not decrease.
306. The economic boom also helped to restore basic equilibrium in public finances, mostly by a substantial increase in government revenues. The high fiscal deficits were largely eliminated, and some countries (mostly exporters of hydrocarbon resources) managed to accumulate the sovereign reserve funds serving as a buffer for bad times. Public debt to GDP ratios systematically decreased in all countries as result of low primary fiscal deficits or surpluses, rapid economic growth, ap-preciation of national currencies, low international interest rates and - in some cases - debt reduction.
307. Higher revenue flows also led to an increase in public expenditures (in nominal and real terms) in many sectors, including healthcare, education, social assistance, water supply and other basic infrastructure. Nevertheless, higher expenditures have not been automatically translated into better outcomes for individual poli-cies. The available indicators of public health, coverage and quality of education, access to improved water sources and sanitation, etc. have shown negligible im-provements. This means that both targeting and prioritization of public resources and quality of governance in these sectors remain unsatisfactory. Reforms aimed at improving spending targeting and efficiency of public services have been often

CHALLENGES AND TRAJECTORIES OF FISCAL POLICY AND PFM REFORM…
CASE Network Reports No. 92 137
incomplete and ineffective and therefore easily resisted by powerful interest groups. In political economy terms, the interests of the public sector workers and management dominated those of the clients, especially from low-income groups in the population (as well as in children and youth who do not have a political voice).
308. The same concerns social policy and social transfers. Here most of available public resources have been spent to support the PAYG pillar of the public pension system and satisfy the interests of a growing number of relatively young pension-ers who have benefited from early retirement opportunities and continued em-ployment in an informal sector. Population ageing makes this lobby even more powerful. Another substantial part of the public resources have been absorbed by various social entitlements, both in cash and in in-kind form, granted to broad categories of population. These entitlements are narrowly targeted and provide little economic benefit to the most vulnerable groups of the population. The above distortions can help to explain why rapid economic growth in the region contrib-uted so little to poverty reduction and almost nothing to inequality reduction61.
309. As a result, one may say that the phenomenon of the post-communist welfare state in the Western Balkans and the European part of the CIS (without the Cau-casus) is both premature (given the low level of economic development of these countries) and inefficient because it does not help to reduce poverty and inequal-ity (and sometimes even increases them). It is true that this kind of welfare state was largely inherited from the communist era but very little has been done in the twenty years following the collapse of the previous economical and political re-gime to correct these distortions (often they were even increased by populist poli-cies). In countries which managed to decrease social expenditures this happened spontaneously as a result of high inflation/ hyperinflation in 1990s or in the civil wars and collapse of the government’s capacity to meet social commitments rather than through conscious, well-designed and consequently implemented re-forms.
310. An insufficient level of fiscal decentralization creates another obstacle to improv-ing social assistance targeting and the quality of public services on a local level. Most of the countries analyzed in this study are highly centralized with a limited role of sub-national governments (apart from the Russian Federation and Bosnia & Herzegovina). Even if a country records a relatively high share of sub-national
61 Obviously, social policy (or broadly speaking -public expenditure policy) is not the only factor determining both a degree of poverty and income inequality. Many other economic, social and institutional factors play role here: general level of country’s economic devel-opment, resource endowment, wealth distribution, social stratification, ethnic differences, openness and competitiveness of markets, etc.

Marek Dabrowski (Ed.), Roman Mogilevskiy (Ed.)
CASE Network Reports No. 92 138
budgets in GG (the examples of Belarus and Kazakhstan) it does not mean neces-sarily the actual devolution of power. First of all, in many countries, regional and local authorities are not democratically elected but dependent on personal deci-sions made at the central level of government. Second of all, sub-national budgets have very little autonomy in determining both revenue sources (earmarked discre-tional grants and individually negotiated shares in government taxes) and expen-diture priorities.
311. The “fear of decentralization” has many roots. First of all, there are some economic and technical factors such as the high shares of pension expenditure and revenue from indirect taxation which favor centralization (see Section 5.2 for a detail analysis). Second of all, centralization is a quite obvious by-product of au-thoritarian and semi-authoritarian regimes with strong presidents who are reluc-tant to share power with anybody. Third of all, in the former USSR there is a con-tinuous tradition of a strong “vertical power” scheme with very little room for horizontal cooperation, local/ regional autonomy and initiatives. Fourth of all, in some countries (even in those considered to be democracies) decentralization is suspected as the potential step towards territorial disintegration or ethnic-based separatism. Whatever the reason may be for this fear, its consequences are highly negative for both the quality of public services and social policy, citizen participa-tion, government accountability and transparency, which can be more easily exe-cuted on a local level than on a national level.
312. The decade of the 1990s was marked by rapid changes in the region: economic transition from a centrally planned to a market economy (the first stage of this process was completed in most countries in the early 2000s), political transition from an authoritarian regime to a democracy (not successful everywhere, in sev-eral CIS countries a reversal of early democratic reforms can be observed) and collapse of two multi-ethnic federal states – former USSR and former Yugoslavia (accompanied by numerous ethnic conflicts and wars). The economic and social costs of these changes were quite substantial, especially in the former USSR. So the following almost-decade of rapid economic growth can be considered as a post-transitional recovery and catching-up.
313. On the other hand, the period of rapid economic growth was accompanied by a slowing pace of structural and institutional reforms (as demonstrated, for exam-ple, by EBRD or WGI scores). Many of them had a crucial importance for the quality of public services, social justice and anti-poverty effectiveness of both social policy and public social services. Apart from the well-known phenomenon of reform “fatigue” after the heroic period of the 1990s, the political economy factor must be mentioned again: in good economic times governments have little incentive to undertake reforms and many of them involve quite substantial politi-cal costs. In addition, the centralization drift observed in a substantial part of the

CHALLENGES AND TRAJECTORIES OF FISCAL POLICY AND PFM REFORM…
CASE Network Reports No. 92 139
CIS region has not helped in crucial governance reforms such as building a pro-fessional, stable and merit-based civil service, independent and professional judi-ciary, eliminating systemic roots of corruption, increasing accountability and transparency of government operations, and increasing the role of civil society, etc.
314. The Western Balkans region has been in quite a different situation in this respect: after a politically turbulent decade in the 1990s, the prospects of an EU member-ship (although quite distant for all countries but Croatia) created a strong incen-tive to build and upgrade democratic institutions, protect civil liberties, resolve ethnic conflicts, strengthen the rule of law and start various institutional reforms (even if progress in many spheres like fighting corruption and organized crime remains unsatisfactory). However, the positive impact of EU acquis is limited and many important sectors (such as healthcare, education, social policy, local ser-vices, etc) remain largely beyond the legal and institutional harmonization efforts associated with the EU accession.
315. There is a certain hope that both the European Neighborhood Policy and the Eastern Partnership offered by the EU to European CIS countries (including Cau-casus) may push them in the same direction as their Western Balkan neighbors. However, one may doubt whether the set of incentives offered by these two pol-icy frameworks (largely overlapping each other) can be comparable with that as-sociated with the EU membership prospect.
316. Nevertheless, many countries continued or even initiated new reform measures related to various technical aspects of governance which were not so strongly de-pendent on key political and institutional reform trends. This related, among other things, to the budget process as described in Section 5.5. Several countries of both major sub-regions noticed at least some progress in such important areas as budget classification and statistics, budget reporting standards, consolidation of extra-budgetary funds and PIP into the government budget, limiting QFA, extending the horizon of macroeconomic and budget planning, making a budget process more transparent and open to public discussion and scrutiny. The new reporting standards and information dissemination practices promoted by the IMF after the series of 1990s financial crises and other donor initiatives (like PEFA), technical assistance and aid conditionality played an important role in stimulating this process.
317. Generally, the analyzed group of countries looks very heterogeneous in terms of its economic, social and political/ geopolitical characteristics. The main dividing line seems to be between the Western Balkan and the CIS sub-regions with the differences related to historical and institutional legacies (former Yugoslavia vs. former USSR), geographical location and geopolitical interest (Western Balkans being closer to the economic center of Europe and having the EU membership
Marek Dabrowski (Ed.), Roman Mogilevskiy (Ed.)
CASE Network Reports No. 92 140
prospect), and a higher level of economic and social development. However, both sub-regions are also internally heterogeneous in almost every characteristic men-tioned above – level of development, geography, history, institutional tradition or even the chance for an EU membership in the case of the Western Balkan sub-group (Croatia being close to completing EU membership negotiations, all the other countries facing quite distant prospects of EU accession). Generally, the intra-sub-regional differentiation is much deeper in the case of CIS than the West-ern Balkans.
318. If one looks at various specific characteristics, indicators and processes (like the level of economic development, the degree of poverty, the progress in various institutional reforms, the public health indicators, etc.) as we do in this study, the picture becomes even more blurred with various ad hoc groupings going across sub-regional boundaries. In addition, many tendencies, problems, challenges and institutional obstacles are common for the entire region. Taking into consideration data constraints, all this speaks in favor of regional cross-country analysis rather than the sub-regional approach. The only important element of sub-regional spe-cifics relates to the EU membership prospect in the Western Balkans. However, as mentioned above, this is a factor which has a limited and a rather indirect im-pact on the fiscal policy, PFM, social services and social policy, i.e. the main sub-jects of analysis in this report.
319. As mentioned before, the analysis of this study covers the period of rapid economic growth which ended in the middle of 2008 with a global financial crisis hitting the entire region. Depending on the structural characteristics and existing vulnerabilities, economies of the region have been affected through many conta-gion channels such as weaker global demand (trade channel), fall of commodity prices, global liquidity squeeze (credit channel), troubles of “mother” financial institutions in developed countries, increasing risk aversion, increased exchange rate volatility and decreasing demand for labor migrants.
320. Although data for the fist two quarters of 2009 are preliminary and incomplete, and any macroeconomic forecasts involve a high degree of uncertainty and poten-tial errors, it is quite obvious that the crisis has a very serious character and is go-ing to quite radically change the macroeconomic and social picture presented in this study. While the authors of this study do not pretend to be able to predict the eventual depth and length of the crisis both in the region and in individual coun-tries, some scenarios seem to be more probable than others:
• Most of the analyzed countries can expect a negative growth in 2009 and perhaps also in 2010. In some countries such Ukraine and Russia the ex-pected depth of recession is quite large. Whenever the crisis ends (in
CHALLENGES AND TRAJECTORIES OF FISCAL POLICY AND PFM REFORM…
CASE Network Reports No. 92 141
2009, 2010 or later) the return to high rate of economic growth (of a magnitude recorded before 2008) is unlikely to happen soon.
• Simultaneously with the output decline, several countries will experience a continuously high inflation caused by depreciation of national curren-cies and high international food prices.
• A substantial part of the gains in poverty reduction recorded up until 2008 may be easily reversed, especially in countries most seriously af-fected by the recession and high inflation.
• The fiscal situation in all the countries will deteriorate quite dramati-cally, imposing heavy constraints on various government expenditure programs. Due to political constraints and institutional weaknesses, a re-duction of expenditure can have a mechanical and a quite chaotic charac-ter (across-the-board sequestration, building up payments arrears). Due to huge uncertainties about the future, the horizon of macroeconomic and fiscal planning may be shortened and the previous effort to move to-wards a multi-year fiscal planning may be frozen or reversed.
• The crisis situation may push politicians to restart various abandoned and frozen reforms, including those related to social policy and public services. However, most of these reforms require time to bring about re-sults, so even if they are undertaken they will not help to meet the cur-rent crisis challenges.
321. In the light of new economic and social challenges brought by the financial crisis the old debate on most effective but fiscally affordable social policy instruments (especially those related to family and children wellbeing) must be revisited. While being aware of all administrative difficulties related to the effective func-tioning of the addressed social assistance based on means testing the authors of this study believe this is the best strategy to concentrate scarce public resources on support to the socially most vulnerable households. To make this system work-ing effectively the eligibility criteria for receiving benefits should be in many cases revised and administrative procedures – simplified. The role of civil society and the strength of informal safety nets (family, kinship, and community support structures) is also important.
322. The choice of the specific forms and criteria of social assistance programs should be determined by local conditions, including cultural and socio-economic factors, in-come level and resources available for this purpose. Their effectiveness in alleviat-ing child poverty should be evaluated based on household budget surveys.
323. The international organizations such as the IMF, the World Bank, regional development banks and UN agencies as well as the European Union may play an important role in providing emergency aid to countries of the region and helping

Marek Dabrowski (Ed.), Roman Mogilevskiy (Ed.)
CASE Network Reports No. 92 142
them to work out effective anti-crisis policies. They can also create incentives and provide support to more fundamental economic and institutional reforms assum-ing there is an interest in the recipient countries. The future of bilateral develop-ment aid is less clear as individual developed countries will face increasing fiscal constraints.
324. The potential entry points of UNICEF involvement should not be limited to social policy instruments supporting more or less directly family and children (like child benefits or mean-tested social assistance) or public services such as education, healthcare or water supply. These are important areas and instruments determin-ing family and children well-being but the prospects to improve their functioning depends, to a large extent, on governance and institutional reforms such as greater transparency and accountability of government, modernization of civil service, decentralization, including building a genuine system of local and regional self-government, etc. In the PFM area the key although uneasy reform tasks concern lengthening fiscal planning horizon and gradual movement toward POB (the measures which can allow better expenditure targeting and decrease volatility in expenditure allocation), increasing budget transparency and creating real room for civil society involvement into a budget process. Finally, in the area of expenditure reform limiting a wasteful character of many public pension systems and elimina-tion of various kinds of subsidies, quasi-subsidies, and broad based benefits in kind can create a fiscal room for more effective interventions related to family and children basic needs. All the above questions require further analytical and diagnostic work both on regional and individual countries levels.
325. In summary, the analyzed countries still face a large agenda of policy reforms in the forthcoming years which would guarantee them long-term fiscal sustainability and upgrade their PFM system, including better quality of public services and better prioritization and targeting of social programs. They cannot be limited to a fiscal and PFM sphere defined narrowly but they must involve a broadly defined governance sphere. Only such reforms can help in the sustainable eradication of poverty and helping the most economically vulnerable (and at the same time usu-ally the most politically powerless) groups of the population, including children and youth from poor families.
326. The economic and social shock brought by the financial crisis should be a subject of further analytical monitoring to allow good understanding of new challenges and working out correct policy responses. The same concerns concrete policy in-struments and institutional solutions which can help improve well-being of fami-lies and children.

CHALLENGES AND TRAJECTORIES OF FISCAL POLICY AND PFM REFORM…
CASE Network Reports No. 92 143
References
Ackerman, J.M. (2005): Social Accountability in the Public Sector. A Conceptual
Discussion, Social Development Papers, Participation and Civic Engagement, Paper No. 82, The World Bank, March.
ADB (2007): MDGs in Central Asia and the Southern Caucasus: An Overview, Technical background paper for the ADB-ESCAP-UNDP conference on MDGs in Central Asia and the Caucasus, July 19-20, Bishkek.
Afonso, A., Schuhknecht, L. & Tanzi, V. (2003): Public Sector Efficiency: An International Comparison, Working Paper, No. 242, European Central Bank, Frankfurt.
Alexandrova, A. & Struyk, R. (2007): Reform of in-kind benefits in Russia: high cost for small gain, Journal of European Social Policy, Vol. 17, No. 2, pp. 153-166, http://www.urbaneconomics.ru/publications.php?folder_id=132&mat_id=864.
Appleton, S., & Mackinnon, J. (1996): Enhancing Human Capacities in Africa, in: Ndulu, N. & Van de Walle, N. (eds.): Agenda for Africa’s Economic Renewal, p. 109–49. Washington, DC: Transaction Publishers.
Bergvall, D., Charbit, C., Kraan, D.-J. & Merk, O. (2006): Intergovernmental Transfers and Decentralised Public Spending, Paris: Organization for Eco-nomic Cooperation and Development (OECD).
Bradshaw, J., Chzhen, Y., Gugushvili, D., Hoelscher, P. (2008): Child poverty in Georgia. Contribution to World Bank Poverty Assessment.
Chzhen, Y. (2009): Child poverty in Bosnia and Herzegovina: Analysis of the 2007 Household Budget Survey. A report for UNICEF. University of York.
Canning, M., Godfrey, M & Holzer-Zelazewska, D. (2006): Financing Higher Education, in: Current Issues in Fiscal Reform in Central Europe and the Baltic States 2005, ed. Laursen, T. Washington, DC: The World Bank.
CIS-7 (2004): Recent Policies and Performance of the Low-Income CIS Countries, An Update of the CIS-7 Initiative Prepared jointly by the Europe and Central Asia Region of the World Bank and the Middle East and Central Asia Depart-ment of the IMF. April 23.
De Melo, M., Denizer, C., Gelb, A., and Tenev, S. (1997): Circumstance and Choice: The Role of Initial Conditions and Policies in Transition Economies, World Bank Policy Research Working Paper, No. 1866.

Marek Dabrowski (Ed.), Roman Mogilevskiy (Ed.)
CASE Network Reports No. 92 144
DG ECFIN (2007a): European Neighbourhood Policy: Economic Review of EU Neighbour Countries, European Economy - Occasional papers, No. 30, Euro-pean Commission, Directorate-General for Economic and Financial Affairs, June, ECFIN/D/3 (2007), REP/52860 KC-AH-07-30-EN-C.
DG ECFIN (2007b): Main results of the 2007 fiscal notifications presented by the candidate countries, European Economy Occasional Papers, No. 33, European Commission, Directorate-General for Economic and Financial Affairs, ECFIN/D1/REP53619, June (http://ec.europa.eu/economy_finance/ publica-tions/publication5930_en.pdf).
DG ECFIN (2008): Candidate and Pre-Accession Countries' Economies Quarterly, European Commission, Directorate-General for Economic and Financial Af-fairs, RDG ECFIN Unit D-1, October 8.
Dollar, D. & Kraay, A. (2002): Growth is Good for the Poor, Journal of Economic Growth, vol. 7, p. 195-225.
Economic Trends (2006): Economic Trends in Eastern Europe, No. 1, Kopint-Datorg, Budapest, http://www.kopint-tarki.hu/kiadvanyaink/etrends/ectr_2006_1.pdf
ENP (2008): Implementation of the European Neighborhood Policy in 2007, Sec-toral Progress Report, European Commission, April
Flug, K., Spilimbergo, A. & Wachtenheim, E. (1998): Investment in Education: Do Economic Vo-latility and Credit Constraints Matter?, Journal of Develop-ment Economics, vol. 55(2), pp. 465–81.
GIR (2007): Global Integrity Report, Washington, D.C.: Global Integrity, http://report.globalintegrity.org/
GMR (2008): Education For All: Global Monitoring Report, Oxford University Press, http://www.unesco.org/education/gmr2008/chapter4.pdf
GFS Manual (2001): Government Finance Statistics Manual, Washington, D.C.: International Monetary Fund.
Gray, C., Lane, T. & Varoudakis, A., eds. (2007): Fiscal Policy and Economic Growth. Lessons for Eastern Europe and Central Asia, Washington, D.C.: World Bank.
Habibov N.& Lida Fan (2006): Social assistance and the challenges of poverty and inequality in Azerbaijan, a low-income country in transition, Journal of so-ciology and social welfare, vol. 33, No. 1.
Hedges, L. V. & Greenwald, R. (1996): Have Times Changed? The Relation be-tween School Resources and Student Performance, in: Burtless, G. (ed.): Does Money Matter? The Effect of School Resources on Student Achievement and Adult Success, Washington, DC: Brookings Institution Press.

CHALLENGES AND TRAJECTORIES OF FISCAL POLICY AND PFM REFORM…
CASE Network Reports No. 92 145
Herrera, S. & Pang, G. (2004): Efficiency of Public Spending in Developing Coun-tries: An Efficiency Frontier Approach, mimeo, The World Bank.
IMF (2006a): Serbia and Montenegro: Poverty Reduction Strategy Paper—Progress Reports, IMF Country Report, No. 06/141, April.
IMF (2007): Republic of Kazakhstan: 2007 Article IV Consultation—Staff Report; and Public Information Notice on the Executive Board Discussion, IMF Coun-try Report, No. 07/235, July.
IMF (2008a): Russian Federation: 2008 Article IV Consultation—Staff Report; Staff Statement; and Public Information Notice on the Executive Board Discus-sion, IMF Country Report, No. 08/309, September.
IMF (2008b): Republic of Azerbaijan: 2008 Article IV Consultation—Staff Report; Staff Statement; Public Information Notice on the Executive Board Discussion; and Statement by the Executive Director for Republic of Azerbaijan, IMF Country Report, No. 08/214.
IMF (2008c): Republic of Kazakhstan: 2008 Article IV Consultation—Staff Re-port; Staff Statement; and Public Information Notice on the Executive Board Discussion, IMF Country Report, No. 08/288, August.
IMF (2008d): Republic of Azerbaijan. Statistical Appendix, IMF Country Report, No. 08/216, May.
IMF (2008e): Former Yugoslav Republic of Macedonia: Third Review Under the Stand-By Arrangement and Request for Rephasing of Access—Staff Report; Staff Statement; Press Release on the Executive Board Discussion; and State-ment by the Alternate Executive Director for the former Yugoslav Republic of Macedonia, IMF Country Report, No. 08/107, March.
IMF (2008f): Republic of Armenia: Second Poverty Reduction Strategy Paper, IMF Country Report, No. 08/376, December 2008.
IMF (2008g): Republic of Uzbekistan: 2008 Article IV Consultation—Staff Report; Public Information Notice on the Executive Board Discussion; and Statement by the Executive Director for the Republic of Uzbekistan, IMF Country Report, No. 08/235, July.
IMF (2009): Republic of Kosovo—IMF Staff Visit Concluding Statement, Pristina, June 24, http://www.imf.org/external/np/ms/2009/062409.htm
Landau, D. (1986): Government and Economic Growth in the Less Developed Countries: An Empirical Study for 1960–80, Economic Development and Cul-tural Change, vol. 35(1), pp. 35–75
Leipziger, D., Fay, M., Wodon, Q. & Yepes, T. (2003): Achieving the Millennium Development Goals, The Role of Infrastructure, World Bank Policy Research Paper, No. 3163.

Marek Dabrowski (Ed.), Roman Mogilevskiy (Ed.)
CASE Network Reports No. 92 146
Lorie, H. (2003): Priorities for Further Fiscal Reforms in the Commonwealth of Independent States, IMF Working Paper, WP/03/209.
Mingat, A. & Tan, J-P (1992): Education in Asia: A Comparative Study of Cost and Financing, A World Bank Regional and Sectoral Study, Washington, D.C.: The World Bank.
Mingat, A. & Tan, J-P (1998): The Mechanics of Progress in Education: Evidence from Cross-Country Data, World Bank Policy Research Working Paper, No. 2015.
Noss, A. (1991): Education and Adjustment: A Review of the Literature, Policy Research and External Affairs Working Paper, WPS 701, Washington, D.C.: The World Bank.
Novikova, I. (2007): Stocktaking of Social Accountability Initiatives in Europe and Central Asia, World Bank Institute Working Paper.
OBI (2006): Open Budget Index, Open Budget Initiative, www.openbudgetindex.org
ODI (2007): Tales of the Unexpected, PFM Reforms in Difficult Environments, CAPE Conference 2007, Overseas Development Institute.
OECD (2008a): Report on the Use of Country Systems in Public Financial Man-agement, 3rd High Level Forum on Aid Effectiveness, September 2008, Accra, Ghana, OECD.
OECD (2008b): Fighting Corruption in Eastern Europe and Central Asia: The Istanbul Anti-Corruption Action Plan – Progress and Challenges, OECD
OSCE (2007): Report on Citizens’ Participation and Impact on the 2007 Munici-pal Budgets in Bosnia and Herzegovina, Organization of Security and Coop-eration in Europe (OSCE) Mission in Bosnia & Herzegovina.
Paczynski, W. et al. (2008): The Economic Aspects of the Energy Sector in CIS Countries, European Economy - Economic Papers, No. 328, CASE – Center for Social and Economic Research, European Commission, Directorate-General for Economic and Financial Affairs, June.
Paternoster A., Wozowczyk M. & Lupi A. (2006): General government expendi-ture and revenue in the EU, 2006, Statistics in Focus, No. 23/2008, Economy and Finance (KS-SF-08-023-EN-N).
Paternostro, S., Rajaram, A. & Tiongson, E. R. (2005): How Does the Composi-tion of Public Spending Matters?, World Bank Policy Research Working Pa-per, No. 3555.
REO-EU (2008): Regional Economic Outlook: Europe, Washington, D.C.: Inter-national Monetary Fund, October.
CHALLENGES AND TRAJECTORIES OF FISCAL POLICY AND PFM REFORM…
CASE Network Reports No. 92 147
REO-EU (2009): Regional Economic Outlook: Europe. Addressing the Crisis, Washington, D.C.: International Monetary Fund, May.
REO–MECA (2008): Regional Economic Outlook: Middle East and Central Asia, Washington, D.C.: International Monetary Fund, October.
REO–MECA (2009): Regional Economic Outlook: Middle East and Central Asia, Washington, D.C.: International Monetary Fund, May.
Richardson, D., Hoelscher, P. & Bradshaw, J. (2008): Child well-being in Central and Eastern European Countries (CEE) and the Commonwealth of Independ-ent States (CIS), Child Indicators Research, pp. 1, 3, 211-250.
Saavalainen, T. & Ten Berge, J. (2006): Quasi-Fiscal Deficits and Energy Condi-tionality in Selected CIS Countries, IMF Working Paper, WP/06/43.
Spoor, M. (2003). Inequality, Rural Poverty and Conflict in Transition Economies, Paper presented at the International Conference of the Faculty of Economics Sarajevo (ICES), ‘From Transition to Development: Globalisation and the Po-litical Economy of Development of Transition Economies’, 10-11 October, Sa-rajevo, Bosnia and Herzegovina.
Tandberg, E. & Pavesic-Skerlep, M. (2008): Advanced public financial manage-ment reforms in South East Europe, IMF Working Paper, Draft.
Thomas, V., Dailami, M, Dhareshwar, A, Kaufmann, D., Kishor, N., López, R. & Wang, Y (2000): The Quality of Growth, The World Bank and Oxford Univer-sity Press.
Trends (2006): Trends in government expenditure by function, 2000-2004, Statis-tics in focus, No. 11, Economy and Finance.
Van de Walle, D. (1996): Infrastructure and Poverty in Vietnam, LSMS Study, WP 121, Washington, D.C.: The World Bank.
Van de Walle, D. (2000): Choosing rural road investments to help reduce poverty, World Bank Policy Research Working Paper, No. 2458.
WB (2000): Making Transition Work for Everyone, The World Bank, Oxford: Oxford University Press.
WB (2004): Civic Engagement to Improve Development Effectiveness in the Europe and Central Asia Region, Washington, D.C.: The World Bank.
WB (2005a): Growth, Poverty, and Inequality: Eastern Europe and the Former Soviet Union, Washington, D.C.: World Bank, 2005.
WB (2005b): Kosovo - poverty assessment. Promoting Opportunity, Security, and Participation for All, Report No. 32378-XK, The World Bank.
WB (2005c): Bosnia & Herzegovina: Country Economic Memorandum, WB Re-port No. 29500-BA, World Bank, May.

Marek Dabrowski (Ed.), Roman Mogilevskiy (Ed.)
CASE Network Reports No. 92 148
WB (2006): Infrastructure in the Europe and Central Asia Region: Approaches to Sustainable Services, Report No. 36227-ECA, Infrastructure Department. Washington, DC: World Bank.
WB (2008a): Unleashing Prosperity: Productivity Growth in Eastern Europe and the Former Soviet Union, Washington, D.C.: The World Bank.
WB (2008b): Montenegro. Beyond the Peak: Growth Policies and Fiscal Con-straints (Public Expenditure and Institutional Review), World Bank Report, No. 4660, November 4.
WB (2008c): Croatia. Restructuring Public Finance to Sustain Growth and Im-prove Public Services, World Bank, February 2008;
WB (2008d): Kosovo. Health Financing Reform Study, Washington, D.C.: The World Bank
WDR (2004): Making Services Work for Poor People, World Development Re-port, Washington, D.C.: The World Bank.
Wilhelm, V. & Fiestas, I. (2005): Exploring the Link Between Public Spending and Poverty Reduction: Lessons from the 90’s, Washington, DC: World Bank, 2005.

CHALLENGES AND TRAJECTORIES OF FISCAL POLICY AND PFM REFORM…
CASE Network Reports No. 92 149
Statistical Annex
Table A.2.1. Location characteristics
Country Proximity to the EU*
Proximity to Western
Europe**
Access to the sea***
Principle component ‘Location’
Albania 1 1 1 1.90 Bosnia & Herzego-vina2 1 1 1 1.90
Croatia 1 1 1 1.90 Montenegro 1 1 1 1.90 Russia 1 1 1 1.90 Georgia 1 0 1 0.75 Moldova1 1 0 1 0.75 Ukraine 1 0 1 0.75 Macedonia 1 1 0 0.71 Belarus 1 0 0 -0.44 Serbia 1 0 0 -0.44 Armenia 0 0 0 -1.66 Azerbaijan3 0 0 0 -1.66 Kazakhstan3 0 0 0 -1.66 Kyrgyzstan 0 0 0 -1.66 Tajikistan 0 0 0 -1.66 Turkmenistan3 0 0 0 -1.66 Uzbekistan 0 0 0 -1.66
Note. * 1 – border with the EU; ** 1 – border with Western Europe; *** 1 – existence of access to the sea. 1 Moldova has a very small access to Black Sea with only one small commercial port. 2 Bosnia and Herzegovina has very small access to the Adriatic Sea without any commercial port. 3 Azerbaijan, Kazakhstan and Turkmenistan have access to the Caspian Sea, which is landlocked. Source: De Melo et al. (1997), own estimates. Table A.2.2. Institutional heritage
Country Years under central planning*
Independence ex-perience**
Principal component ‘institutional heritage’
Albania 47 2 2.46 Croatia 46/47 1 1.43 Bosnia & Herze-govina 47 1 1.43

Marek Dabrowski (Ed.), Roman Mogilevskiy (Ed.)
CASE Network Reports No. 92 150
Country Years under central planning*
Independence ex-perience**
Principal component ‘institutional heritage’
Macedonia 47 1 1.43 Montenegro 47 1 1.43 Serbia 47 1 1.43 Moldova 51 0 0.98 Russia 74/72 2 0.17 Azerbaijan 70/72 0 -1.08 Georgia 70/72 0 -1.08 Armenia 71/72 0 -1.08 Kazakhstan 71/72 0 -1.08 Kyrgyzstan 71/72 0 -1.08 Tajikistan 71/72 0 -1.08 Turkmenistan 71/72 0 -1.08 Uzbekistan 71/72 0 -1.08 Belarus 72/72 0 -1.08 Ukraine 74/72 0 -1.08
Note. * Data on the number of years spent under central planning is taken from De Melo et al. (1997), and differences in this indicator between (i) Croatia and other post-Yugoslav countries and (ii) between FSU countries refer to the methodology of the mentioned paper. In order to eliminate differences in principal components, we take the number of years under central planning in Croatia as 47 years, and as 72 years in FSU countries. ** 2 – independent state prior to 1989, 1 – countries of former Yugoslavia and Russia, 0 – new independent states. Source: De Melo et al. (1997), own estimates. Table A.2.3. Countries affected by armed conflicts and internal unrest With armed conflicts/ internal unrest on their territory (1)
Without armed conflicts/ internal unrest on their territory (0)
Albania (1997) Belarus Armenia (1988–1994) Montenegro Azerbaijan (1988–1994) Kazakhstan Bosnia and Herzegovina (1992–1995) Turkmenistan Georgia (1992–1993, 2008) Ukraine Croatia (1991–1995) Macedonia (2001) Kyrgyzstan (1990) Moldova (1992) Russia (1993, 1994–1996, 1997, 1998–2005, 2008)
Serbia (1991-1995, 1998-1999) Tajikistan (1992–1997) Uzbekistan (1989, 2005)
Source: Spoor (2003), http://users.erols.com/mwhite28/warstatx.htm, own observations.
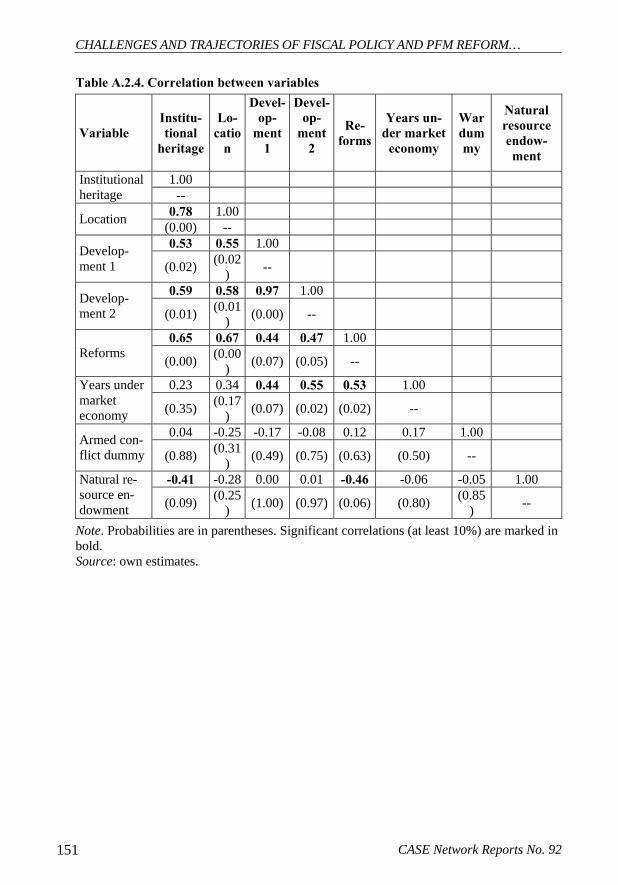
CHALLENGES AND TRAJECTORIES OF FISCAL POLICY AND PFM REFORM…
CASE Network Reports No. 92 151
Table A.2.4. Correlation between variables
Variable Institu-tional
heritage
Lo-catio
n
Devel-op-
ment 1
Devel-op-
ment 2
Re-forms
Years un-der market
economy
War dummy
Natural resource endow-ment
1.00 Institutional heritage --
0.78 1.00 Location (0.00) -- 0.53 0.55 1.00 Develop-
ment 1 (0.02) (0.02) --
0.59 0.58 0.97 1.00 Develop-ment 2 (0.01) (0.01
) (0.00) --
0.65 0.67 0.44 0.47 1.00 Reforms (0.00) (0.00
) (0.07) (0.05) --
0.23 0.34 0.44 0.55 0.53 1.00 Years under market economy (0.35) (0.17
) (0.07) (0.02) (0.02) --
0.04 -0.25 -0.17 -0.08 0.12 0.17 1.00 Armed con-flict dummy (0.88) (0.31
) (0.49) (0.75) (0.63) (0.50) --
-0.41 -0.28 0.00 0.01 -0.46 -0.06 -0.05 1.00 Natural re-source en-dowment (0.09) (0.25
) (1.00) (0.97) (0.06) (0.80) (0.85) --
Note. Probabilities are in parentheses. Significant correlations (at least 10%) are marked in bold. Source: own estimates.

Marek Dabrowski (Ed.), Roman Mogilevskiy (Ed.)
CASE Network Reports No. 92 152
Table A.3.1. Poverty under USD 1.25 a day poverty line
Economy
Survey years: (1) the earliest close to the beginning
of the period analyzed; (2) the latest available
Head-count
(1)
Head-count
(2)
Poverty Gap (1)
Poverty Gap (2)
SPG (1)
SPG (2)
Western Balkans* 0.21 0.29 0.04 0.07 0.02 0.04 Albania 2002 (1); 2005 (2) 0.57 0.85 0.09 0.17 0.03 0.07 Bosnia & Her-zegovina 2001(1); 2004 (2) 0.00 0.16 0.00 0.07 0.00 0.06
Croatia 2001 (1); 2005 (2) 0.00 0.00 0.00 0.00 0.00 0.00 Macedonia 2002 (1); 2003 (3) 0.55 0.30 0.16 0.09 0.09 0.05 CIS (Europe) 1.26 0.61 0.31 0.17 0.13 0.08 Armenia 2002 (1); 2003 (2) 14.97 4.74 3.06 0.88 1.04 0.32 Azerbaijan 2001 (1); 2005 (2) 3.15 0.03 0.54 0.01 0.17 0.01 Belarus 2002 (1); 2005 (2) 0.00 0.00 0.00 0.00 0.00 0.00 Georgia 2002 (1); 2005 (2) 15.1 13.44 4.73 4.36 2.32 2.22 Moldova 2002 (1); 2004 (2) 17.08 8.14 3.99 1.68 1.33 0.59 Russia 2002 (1); 2005 (2) 0.32 0.16 0.06 0.04 0.02 0.02 Ukraine 2002 (1); 2005 (2) 0.51 0.1 0.16 0.04 0.11 0.04 CIS (Centr. Asia) 29.11 23.21 8.15 6.56 3.26 2.69 Kazakhstan 2002 (1);2003 (3) 5.15 1.15 0.89 0.17 0.26 0.05 Kyrgyzstan 2002 (1); 2004 (2) 34.03 21.81 8.77 4.43 3.04 1.21 Tajikistan 2003 (1); 2004 (2) 36.25 21.49 10.33 5.06 4.00 1.74 Turkmenistan 1998 (1); 2003 (2) 18.91 11.72 4.78 2.49 1.71 0.78 Uzbekistan 2002 (1); 2003 (2) 42.33 38.81 12.39 11.79 5.16 5.11
Notes. * Data on Serbia and Montenegro are currently missing in PovcalNet database. Headcount: % of population living in households with consumption or income per person below the poverty line. Poverty Gap: mean distance below the poverty line as a proportion of the poverty line. Squared poverty gap (SPG): mean of the squared distances below the poverty line as a proportion of the poverty line. Source: PovcalNet database (http://go.worldbank.org/A8URN8FWB0). Table A.3.2. Poverty at USD 2.15 a day poverty line
Economy
Survey years: (1) the earliest close to the beginning of the pe-
riod analyzed; (2) the latest available
Headcount
(1)
Headcount
(2)
Pov-erty Gap (1)
Pov-erty Gap (2)
SPG (1)
SPG (2)
Western Balkans* 3.34 3.01 0.61 0.60 0.19 0.20 Albania 2002 (1); 2005 (2) 11.68 10.2 2.01 1.97 0.54 0.61 BIH 2001(1); 2004 (2) 0.00 0.90 0.00 0.22 0.00 0.11 Croatia 2001 (1); 2005 (2) 0.18 0.00 0.07 0.00 0.06 0.00 Macedonia 2002(1);2003(3) 4.00 2.54 0.88 0.52 0.34 0.19 CIS (Europe) 7.41 3.31 1.76 0.81 0.68 0.34 Armenia 2002 (1); 2003 (2) 52.15 34.88 16.07 8.21 6.72 2.85

CHALLENGES AND TRAJECTORIES OF FISCAL POLICY AND PFM REFORM…
CASE Network Reports No. 92 153
Economy
Survey years: (1) the earliest close to the beginning of the pe-
riod analyzed; (2) the latest available
Headcount
(1)
Headcount
(2)
Pov-erty Gap (1)
Pov-erty Gap (2)
SPG (1)
SPG (2)
Azerbaijan 2001 (1); 2005 (2) 22.66 0.46 5.33 0.06 1.84 0.02 Belarus 2002(1); 2005 (2) 1.18 0.59 0.37 0.22 0.25 0.18 Georgia 2002 (1); 2005 (2) 37.86 33.75 13.86 12.39 7.07 6.4 Moldova 2002(1); 2004(2) 44.65 33.22 15.19 9.49 6.86 3.84 Russia 2002(1); 2005(2) 4.95 2.11 0.88 0.37 0.26 0.12 Ukraine 2002(1); 2005(2) 4.67 0.66 0.92 0.15 0.34 0.07 CIS (Central Asia) 60.70 51.48 24.17 19.78 12.18 9.87 Kazakhstan 2002(1);2003(3) 24.81 12.94 6.54 2.68 2.33 0.83 Kyrgyzstan 2002 (1); 2004(2) 71.06 56.8 27.94 19.44 13.77 8.60 Tajikistan 2003(1); 2004(2) 73.17 55.98 29.77 19.31 15.24 8.81 Turkmenistan 1998(1); 2003 (2) 45.94 35.18 16.43 11.16 7.68 4.69 Uzbekistan 2002 (1); 2003 (2) 79.36 74.62 33.83 31.47 17.72 16.57
Notes and sources are the same as in Table A.3.1. Table A.3.3. Poverty at USD 4.30 a day poverty line
Economy
Survey years: (1) the earliest close to the beginning
of the period ana-lyzed; (2) the lat-
est available
Head-count
(1)
Head-count
(2)
Pov-erty Gap (1)
Pov-erty Gap (2)
SPG (1)
SPG (2)
Western Balkans* 18.63 17.66 5.7 5.27 2.42 2.22 Albania 2002 (1); 2005 (2) 58.21 48.47 18.56 15.65 7.86 6.79 BIH 2001 (1); 2004 (2) 3.56 11.64 0.78 2.68 0.34 0.97 Croatia 2001 (1); 2005 (2) 2.41 0.37 0.48 0.14 0.18 0.12 Macedonia 2002 (1); 2003 (3) 23.35 19.32 7.01 5.37 2.99 2.15 CIS (Europe) 35.03 22.51 11.21 6.3 4.95 2.61 Armenia 2002 (1); 2003 (2) 89.33 83.43 46.01 36.25 27.17 18.86 Azerbaijan 2001 (1); 2005 (2) 67.2 56.15 26.14 10.25 12.89 2.6 Belarus 2002 (1); 2005 (2) 13.84 7.25 3.16 1.56 1.21 0.61 Georgia 2002 (1); 2005 (2) 76.01 71.24 36.6 33.32 21.86 19.7 Moldova 2002 (1); 2004 (2) 82.27 77.07 41.16 33.81 24.54 18.33 Russia 2002 (1); 2005 (2) 29.37 19.68 8.66 5.24 3.45 1.99 Ukraine 2002 (1); 2005 (2) 39.71 15.25 10.89 3.05 4.25 0.96 CIS (Central Asia) 87.03 80.32 50.51 44.25 33.29 28.36 Kazakhstan 2002 (1); 2003 (3) 66.98 49.87 27.1 17.13 13.99 7.82 Kyrgyzstan 2002 (1); 2004 (2) 94.86 89.74 57.42 48.58 38.22 29.98 Tajikistan 2003 (1); 2004 (2) 95.32 90.25 58.93 48.64 39.88 29.99 Turkmenistan 1998(1); 2003 (2) 80.71 72.62 41.5 33.81 25.35 19.31 Uzbekistan 2002 (1); 2003 (2) 96.37 95.03 62.46 59.94 43.49 41.2
Notes and sources are the same as in Table A.3.1.

Marek Dabrowski (Ed.), Roman Mogilevskiy (Ed.)
CASE Network Reports No. 92 154
Table A.3.4. Inequality Gini coefficient Income/Consumption distribution: Shares by deciles
Economy
Survey years: (1) the earliest close to
the beginning of the period ana-
lyzed; (2) the latest available
(1) (2)
Income /consumption by the low-est 10% of the popula-
tion (1)
Income/ con-sumption by the highest 10% of the population
(1)
Ratio of column 6
to col-umn 5**
Income /consumptio
n by the lowest 10% of the popu-
lation (2)
Income/ con-sumption by the highest 10% of the
population (2)
Ratio of column 9 to column
8**
Western Balkans* Albania 2002 (1); 2005 (2) 28.15 33.03 3.86 22.38 5.80 3.24 25.87 8.00 BIH 2001 (1); 2004 (2) 28.03 35.78 3.80 22.84 6.00 2.77 27.41 9.90 Croatia 2001 (1); 2005 (2) 31.10 28.99 3.41 24.60 7.20 3.60 23.06 6.40 Macedonia 2002 (1); 2003 (3) 38.75 38.95 2.36 29.25 12.40 2.39 29.53 12.40
CIS (Europe) Armenia 2002 (1); 2003 (2) 35.66 33.80 3.32 29.86 9.00 3.65 28.94 7.90 Azerbaijan 2001 (1); 2005 (2) 36.50 16.83 3.09 29.39 9.50 6.11 17.49 2.90 Belarus 2002 (1); 2005 (2) 29.73 27.92 3.43 23.48 6.80 3.60 22.04 6.10 Georgia 2002 (1); 2005 (2) 40.31 40.78 2.04 30.55 15.00 1.92 30.60 15.90 Moldova 2002 (1); 2004 (2) 36.87 35.60 2.77 28.18 10.20 2.98 28.16 9.40 Russia 2002 (1); 2005 (2) 35.70 37.51 2.74 26.83 9.80 2.57 28.35 11.00 Ukraine 2002 (1); 2005 (2) 28.28 28.21 3.72 22.64 6.10 3.78 22.54 6.00
CIS (Central Asia) Kazakhstan 2002 (1); 2003 (3) 34.95 33.85 2.94 26.81 9.10 3.05 25.85 8.50 Kyrgyzstan 2002 (1); 2004 (2) 31.67 32.93 3.65 25.02 6.90 3.56 25.93 7.30 Tajikistan 2003 (1); 2004 (2) 32.62 33.61 3.37 25.71 7.60 3.21 26.40 8.20 Turkmenistan 1998(1); 2003 (2) 40.77 .. 2.46 31.75 12.90 .. .. .. Uzbekistan 2002 (1); 2003 (2) 34.55 36.72 3.17 28.23 8.90 2.85 29.47 10.30 * Data on Serbia and Montenegro are currently missing in PovcalNet database; ** Ratios of disposable incomes/consumption of the highest decile of the population to those of the lowest decile of the population for corresponding survey years. Source: PovcalNet database (http://go.worldbank.org/A8URN8FWB0).

CHALLENGES AND TRAJECTORIES OF FISCAL POLICY AND PFM REFORM…
CASE Network Reports No. 92 155
Table A.3.5. GG budget balance, % of GDP (sources other than GFS) Country 2003 2004 2005 2006 2007
Western Balkans Albania*** -4.5 -5.1 -3.5 -3.3 -3.5 Bosnia & Herzegovina*** 0.7 1.6 2.4 2.9 1.3 Croatia*** -5.5 -4.1 -3.8 -2.2 -1.8 Kosovo*** 2.1 -4.5 -3.1 2.5 7.2 Macedonia*** -1.1 0.0 0.3 -0.5 0.6 Montenegro*** -2.4 -2.6 -2.3 2.7 7.1 Serbia*** -1.1 0.9 0.7 -1.5 -1.9
CIS Europe Armenia (Central Gov)° -1.1 -1.7 -2.6 -2.3 -2.3 Azerbaijan° -0.8 1.0 2.7 3.1 10 Belarus (Central Gov) -1.4° 0.0° -0.6° 1.4* 0.4* Georgia° -1.6 -0.2 -2.4 -2.3 -2.5 Moldova 0.7° 0.8° 1.5° 0.2* -0.3* Russia (Central Gov) 1.7° 4.2° 7.5° 8.3* 6.8* Ukraine -0.9° -4.4° -2.4° -1.4* -2.0*
CIS Central Asia Kazakhstan** 2.7 2.5 5.8 7.2 4.7 Kyrgyzstan** -4.7 -4.4 -3.4 -2.1 -0.4 Tajikistan** -1.8 -2.4 -2.9 1.7 -6.2 Turkmenistan** -1.3 1.4 0.8 5.3 3.9 Uzbekistan** 0.1 0.6 1.2 5.2 5.1
Memorandum items European Union1 -1.6 -1.0 New EU members1 -3.3 -2.3
Notes. ° Final data for 2003 - 06, estimates for 2007 (DG ECFIN, 2007a). * Final data, GG balance (REO-EU, 2008). ** Final data for 2003 - 06, estimates for 2007 (REO-MECA, 2008). *** Final data: DG ECFIN (2008). 1 Weighted average - GG balance weighted by PPP GDP. Table A.3.6. Institutional sources of balancing GG net cash flows, % of GDP Country/ item 2002 2003 2004 2005 2006 2007
Croatia Net cash inflow from financing activities -3.14 -3.85 -3.89 -2.80 -1.80 -1.12 Domestic -0.42 -0.87 -1.97 -4.58 -3.20 -1.66
GG 0.00 0.00 0.00 0.00 0.00 0.00 Central bank -0.13 0.60 -0.50 0.11 -0.37 -0.07 Other depository corporations 0.55 -0.24 -1.79 -4.87 -2.10 -0.83 Financial corporations not elsewhere classified -0.05 0.20 -0.01 0.00 -0.01 -0.01 Nonfinancial corporations -0.84 -1.58 0.20 0.08 -0.77 -0.78 Households and nonprofit institutions serving households 0.05 0.15 0.11 0.09 0.05 0.03
Foreign -2.72 -2.98 -1.91 1.79 1.40 0.55

Marek Dabrowski (Ed.), Roman Mogilevskiy (Ed.)
CASE Network Reports No. 92 156
Country/ item 2002 2003 2004 2005 2006 2007 GG 0.17 0.17 0.16 0.13 0.19 0.14 International organizations -0.39 -0.38 -0.04 -0.01 -0.42 0.07 Financial corporations other than international organizations -2.49 -2.76 -2.04 1.65 1.63 0.33 Other nonresidents 0.00 0.00 0.00 -0.01 0.00 0.00
Armenia Net cash inflow from financing activities -0.65 -0.79 -0.72 -0.26 Domestic 1.13 0.45 -0.71 0.13
GG 0.00 0.00 0.00 Central bank 1.46 0.28 -1.06 Other depository corporations -0.46 0.03 0.35 Financial corporations not elsewhere classified 0.00 0.00 0.00 Nonfinancial corporations 0.13 0.14 0.00 Households and nonprofit institutions serving households 0.00 0.00 0.00
Foreign -1.79 -1.24 -0.01 -0.39 GG 0.57 0.58 0.37 International organizations -2.74 -1.74 -0.39 Financial corporations other than international organizations 0.00 0.08 0.00 Other nonresidents 0.39 0.00 0.00
Georgia Net cash inflow from financing activities 0.80 1.40 1.70 0.31 Domestic 1.09 1.10 1.30 0.51
GG 0.25 0.01 0.14 0.01 Central bank 0.36 0.60 0.76 0.05 Other depository corporations 0.09 0.28 0.20 0.12 Financial corporations not elsewhere classified 0.00 0.00 0.00 0.00 Nonfinancial corporations 0.38 0.22 0.20 0.33 Households and nonprofit institutions serving households 0.00 0.00 0.00 0.00
Foreign -0.29 0.30 0.40 -0.20 GG 0.00 0.30 0.09 -0.20 International organizations -0.29 0.00 0.30 0.00 Financial corporations other than international organizations 0.00 0.00 0.00 0.00 Other nonresidents 0.00 0.00 0.00 0.00
Moldova Net cash inflow from financing activities 0.34 1.39 -0.46 -0.17 Domestic -1.54 1.25 -0.98 0.03
GG 1.26 1.56 -0.83 0.58 Central bank -1.85 0.00 0.26 0.30 Other depository corporations -0.71 -0.53 -0.41 0.07 Financial corporations not elsewhere classified -0.23 0.21 0.00 0.00 Nonfinancial corporations 0.00 0.00 0.00 -0.91 Households and nonprofit institutions serving households 0.00 0.00 0.00 0.00
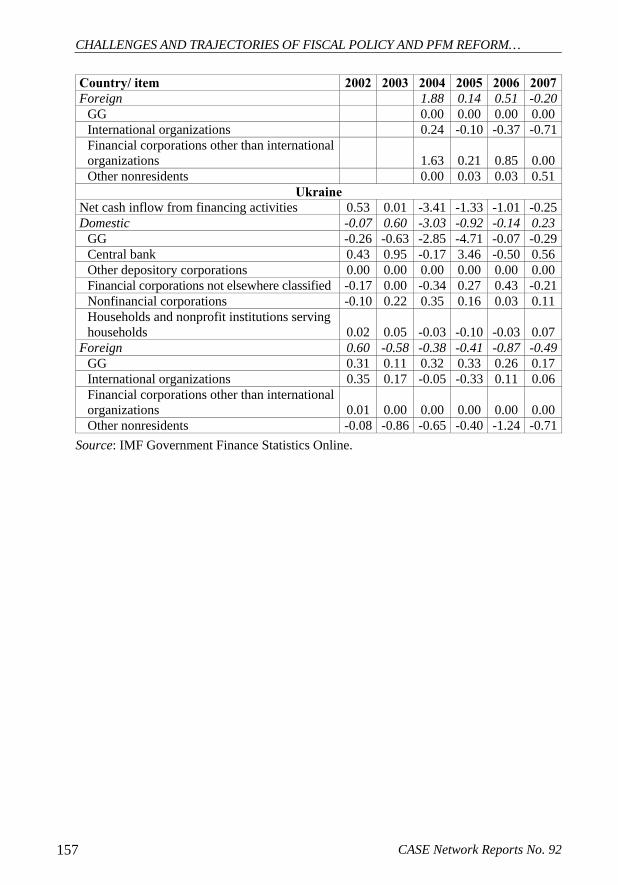
CHALLENGES AND TRAJECTORIES OF FISCAL POLICY AND PFM REFORM…
CASE Network Reports No. 92 157
Country/ item 2002 2003 2004 2005 2006 2007 Foreign 1.88 0.14 0.51 -0.20
GG 0.00 0.00 0.00 0.00 International organizations 0.24 -0.10 -0.37 -0.71 Financial corporations other than international organizations 1.63 0.21 0.85 0.00 Other nonresidents 0.00 0.03 0.03 0.51
Ukraine Net cash inflow from financing activities 0.53 0.01 -3.41 -1.33 -1.01 -0.25 Domestic -0.07 0.60 -3.03 -0.92 -0.14 0.23
GG -0.26 -0.63 -2.85 -4.71 -0.07 -0.29 Central bank 0.43 0.95 -0.17 3.46 -0.50 0.56 Other depository corporations 0.00 0.00 0.00 0.00 0.00 0.00 Financial corporations not elsewhere classified -0.17 0.00 -0.34 0.27 0.43 -0.21 Nonfinancial corporations -0.10 0.22 0.35 0.16 0.03 0.11 Households and nonprofit institutions serving households 0.02 0.05 -0.03 -0.10 -0.03 0.07
Foreign 0.60 -0.58 -0.38 -0.41 -0.87 -0.49 GG 0.31 0.11 0.32 0.33 0.26 0.17 International organizations 0.35 0.17 -0.05 -0.33 0.11 0.06 Financial corporations other than international organizations 0.01 0.00 0.00 0.00 0.00 0.00 Other nonresidents -0.08 -0.86 -0.65 -0.40 -1.24 -0.71
Source: IMF Government Finance Statistics Online.
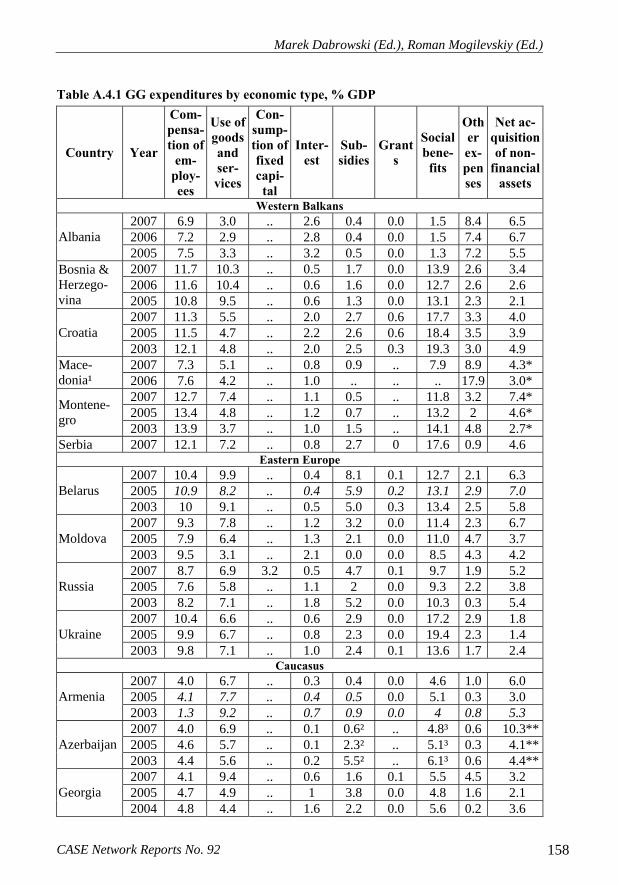
Marek Dabrowski (Ed.), Roman Mogilevskiy (Ed.)
CASE Network Reports No. 92 158
Table A.4.1 GG expenditures by economic type, % GDP
Country Year
Com-pensa-tion of
em-ploy-ees
Use of goods and ser-vices
Con-sump-tion of fixed capi-tal
Inter-est
Sub-sidies
Grants
Social bene-fits
Other ex-penses
Net ac-quisition of non-
financial assets
Western Balkans 2007 6.9 3.0 .. 2.6 0.4 0.0 1.5 8.4 6.5 2006 7.2 2.9 .. 2.8 0.4 0.0 1.5 7.4 6.7 Albania 2005 7.5 3.3 .. 3.2 0.5 0.0 1.3 7.2 5.5 2007 11.7 10.3 .. 0.5 1.7 0.0 13.9 2.6 3.4 2006 11.6 10.4 .. 0.6 1.6 0.0 12.7 2.6 2.6
Bosnia & Herzego-vina 2005 10.8 9.5 .. 0.6 1.3 0.0 13.1 2.3 2.1
2007 11.3 5.5 .. 2.0 2.7 0.6 17.7 3.3 4.0 2005 11.5 4.7 .. 2.2 2.6 0.6 18.4 3.5 3.9 Croatia 2003 12.1 4.8 .. 2.0 2.5 0.3 19.3 3.0 4.9 2007 7.3 5.1 .. 0.8 0.9 .. 7.9 8.9 4.3* Mace-
donia¹ 2006 7.6 4.2 .. 1.0 .. .. .. 17.9 3.0* 2007 12.7 7.4 .. 1.1 0.5 .. 11.8 3.2 7.4* 2005 13.4 4.8 .. 1.2 0.7 .. 13.2 2 4.6* Montene-
gro 2003 13.9 3.7 .. 1.0 1.5 .. 14.1 4.8 2.7* Serbia 2007 12.1 7.2 .. 0.8 2.7 0 17.6 0.9 4.6
Eastern Europe 2007 10.4 9.9 .. 0.4 8.1 0.1 12.7 2.1 6.3 2005 10.9 8.2 .. 0.4 5.9 0.2 13.1 2.9 7.0 Belarus 2003 10 9.1 .. 0.5 5.0 0.3 13.4 2.5 5.8 2007 9.3 7.8 .. 1.2 3.2 0.0 11.4 2.3 6.7 2005 7.9 6.4 .. 1.3 2.1 0.0 11.0 4.7 3.7 Moldova 2003 9.5 3.1 .. 2.1 0.0 0.0 8.5 4.3 4.2 2007 8.7 6.9 3.2 0.5 4.7 0.1 9.7 1.9 5.2 2005 7.6 5.8 .. 1.1 2 0.0 9.3 2.2 3.8 Russia 2003 8.2 7.1 .. 1.8 5.2 0.0 10.3 0.3 5.4 2007 10.4 6.6 .. 0.6 2.9 0.0 17.2 2.9 1.8 2005 9.9 6.7 .. 0.8 2.3 0.0 19.4 2.3 1.4 Ukraine 2003 9.8 7.1 .. 1.0 2.4 0.1 13.6 1.7 2.4
Caucasus 2007 4.0 6.7 .. 0.3 0.4 0.0 4.6 1.0 6.0 2005 4.1 7.7 .. 0.4 0.5 0.0 5.1 0.3 3.0 Armenia 2003 1.3 9.2 .. 0.7 0.9 0.0 4 0.8 5.3 2007 4.0 6.9 .. 0.1 0.6² .. 4.8³ 0.6 10.3** 2005 4.6 5.7 .. 0.1 2.3² .. 5.1³ 0.3 4.1** Azerbaijan 2003 4.4 5.6 .. 0.2 5.5² .. 6.1³ 0.6 4.4** 2007 4.1 9.4 .. 0.6 1.6 0.1 5.5 4.5 3.2 2005 4.7 4.9 .. 1 3.8 0.0 4.8 1.6 2.1 Georgia 2004 4.8 4.4 .. 1.6 2.2 0.0 5.6 0.2 3.6

CHALLENGES AND TRAJECTORIES OF FISCAL POLICY AND PFM REFORM…
CASE Network Reports No. 92 159
Country Year
Com-pensa-tion of
em-ploy-ees
Use of goods and ser-vices
Con-sump-tion of fixed capi-tal
Inter-est
Sub-sidies
Grants
Social bene-fits
Other ex-penses
Net ac-quisition of non-
financial assets
Central Asia 2007 3.4 6.4 .. 0.3 0.5 0.0 3.7 0.9 5.0 2005 3.6 6.3 .. 0.4 0.6 0.0 4.3 5.7 4.2 Kazakhstan 2003 3.7 6.5 .. 0.8 0.5 0.0 4.9 1.5 4.1
Kyrgyzstan 2006 7.8 6.4 .. 0.8 0.6 0.1 2.9 1.4 2.3 2004 3.4 5.6 .. 0.7 2.1 0.0 1.8 5.4 12.2 Tajikistan 2003 3.3 5.3 .. 1.2 2.2 0.0 2.1 2.2 11.6
Notes: ¹ Central government, ² SOCAR energy-related subsidies, ³ Total transfers, * Capital expenditures, ** Investment expenditure, excludes government investment in the Baku-Tbilisi-Ceyhan oil pipeline. Text in italics indicates that data are in whole or in part provisional or preliminary. Sources: Data on Albania, Bosnia & Herzegovina, Croatia, Serbia, Belarus, Moldova, Russian Federation, Ukraine, Armenia, Georgia, Kazakhstan, Kyrgyzstan, Tajikistan: IMF GFS online database (www.imfstatistics.org/gfs/); GDP: IMF WEO database; data on Azerbaijan: IMF (2008d); data on Macedonia: IMF (2008e); data on Montenegro: WB (2008b). Table A.4.2. GG expenditures by function, % GDP
Country Year
Gen-eral
Public Ser-vices
De-fense
Public Order
and Safety
Eco-nomic
Af-fairs
Envi-ron-men-
tal Protec
tion
Hous-ing & Commu-nity
Amenities
He-alth
Rec-rea-tion, Cul-ture &
Relig-ion
Edu-cation
Social Protec
tion
Western Balkans 2007 5.6 1.2 1.6 5.3 0.0 1.3 2.5 0.3 3.2 7.9 2006 6.4 1.3 1.8 4.5 0.0 1.7 2.4 0.4 3.2 7.8 Albania 2005 7.0 1.0 1.7 3.2 0.0 1.7 2.6 0.4 3.2 7.5
Bosnia & Herzegovina 2002 5.5 4.3 4.2 3.0 .. .. 6.1 .. 5.6 15.3
2007 3.7 1.5 2.7 8.0 .. 4.0 5.9 1.7 4.7 14.9 2006 3.3 1.5 2.6 8.0 .. 3.8 6.1 1.5 4.6 15.7 Croatia 2005 2.8 1.5 2.6 7.3 .. 3.8 6.1 1.4 4.7 16.4
Serbia 2007 3.9 2.4 2.5 6.0 0.4 2.0 6.2 1.1 3.8 16.0 Eastern Europe
2007 6.7 1.3 2.1 11.6 0.6 2.2 4.5 1.2 5.8 13.5 2006 3.6 1.3 2.3 10.0 0.6 3.0 4.7 1.6 6.3 13.5 Belarus 2005 4.9 1.1 2.2 9.4 0.6 2.9 4.8 1.5 6.3 13.4

Marek Dabrowski (Ed.), Roman Mogilevskiy (Ed.)
CASE Network Reports No. 92 160
Country Year
Gen-eral
Public Ser-vices
De-fense
Public Order
and Safety
Eco-nomic
Af-fairs
Envi-ron-men-
tal Protec
tion
Hous-ing & Commu-nity
Amenities
He-alth
Rec-rea-tion, Cul-ture &
Relig-ion
Edu-cation
Social Protec
tion
2007 5.2 0.5 2.4 5.6 0.2 1.4 4.9 1.1 8.0 12.6 2006 1.9 0.5 2.7 3.7 0.2 2.3 7.1 1.1 8.2 13.3 Moldova 2005 4.7 0.4 2.3 4.1 0.1 1.9 4.2 0.8 7.3 11.4 2006 4.7 2.6 2.7 2.2 0.1 2.4 4.1 0.7 3.9 8.3 Russia 2005 3.5 2.7 2.9 3.5 0.1 2.2 3.9 0.8 3.6 8.7 2007 3.3 1.3 2.3 5.9 0.3 0.9 4.0 0.8 6.1 18.8 2006 3.7 1.0 2.4 5.1 0.3 1.6 3.9 0.8 6.2 20.2 Ukraine 2005 3.3 1.3 2.3 5.9 0.3 0.9 3.9 0.8 6.1 18.7
Caucasus 2007 4.2 4.5 .. 3.9 .. 1.1 1.5 0.7 3.1 4.8 Armenia 2005 5.0 4.2 .. 2.0 .. 1.4 1.4 0.8 2.7 4.6
2007p 1.7 3.0 1.6 9.3 .. 0.3 1.0 0.4 2.7 2.2 Azerbaijan 2005 1.3 2.3 1.6 4.3 .. 0.3 0.9 0.4 3.0 2.4 2007 0.3 8.8 4.3 2.1 0.5 2.9 1.5 1.0 2.7 4.8 2006 0.9 5.2 2.8 3.4 0.0 3.3 1.6 1.0 3.0 5.0 Georgia 2005 0.9 3.4 2.5 3.3 0.0 2.3 1.8 0.9 2.5 5.4
Central Asia 2007 1.9 1.3 1.9 3.4 0.1 1.6 2.3 1.0 3.5 3.9 2006 4.1 1.0 1.8 2.8 0.1 1.4 2.3 0.8 3.4 4.3 Kazakhstan 2005 7.1 1.0 2.0 2.7 0.1 1.5 2.4 0.8 3.4 4.5
Kyrgyzstan 2006 3.8 1.5 1.7 1.9 0.0 1.2 2.7 0.7 5.6 3.2 2007p 0.6* .. .. 2.4 .. .. .. .. .. 8.1 2005 0.6* .. .. 3.2 .. .. .. .. .. 8.1 Uzbekistan 2003 0.6* .. .. 3.3 .. .. .. .. .. 8.2
Notes: IMF GFS - Cash basis; Croatia - Accrual basis; Azerbaijan: Central Government; * Public authorities and administration. Source: Data on Albania, Serbia, Belarus, Moldova, Russian Federation, Ukraine, Kazakhstan, and Kyrgyzstan: IMF GFS database online, www.imfstatistics.org/gfs/; GDP - IMF WEO database; data on Armenia: IMF (2008f); data on Azerbaijan: IMF (2008d); data on Bosnia & Herzegovina: WB (2005c); data on Croatia: WB (2008c); data on Uzbekistan: IMF (2008g).

CHALLENGES AND TRAJECTORIES OF FISCAL POLICY AND PFM REFORM…
CASE Network Reports No. 92 161
Table A.4.3. GG expenditures structure by economic type, % of total expenditures
Country Year
Com-pensa-tion of
em-ploy-ees
Use of goods and ser-vices
Con-sump-tion of fixed capi-tal
Inter-est
Sub-sidies
Grants
Social bene-fits
Other ex-penses
Net ac-quisition of non-
financial assets
Western Balkans Albania 2007 23.6 10.2 .. 9.0 1.3 0.0 5.0 28.7 22.2 B&H 2007 26.5 23.2 .. 1.2 4.0 0.0 31.5 5.8 7.8 Croatia 2007 24.0 11.7 .. 4.3 5.8 1.3 37.5 6.9 8.5 Serbia 2007 26.3 15.7 .. 1.7 6.0 0.0 38.3 2.1 10
Eastern Europe Belarus 2007 20.8 19.8 .. 0.8 16.2 0.3 25.3 4.3 12.6 Moldova 2007 22.3 18.6 .. 2.8 7.6 0.0 27.2 5.5 16 Russia 2007 21.2 16.9 7.8 1.2 11.5 0.2 23.7 4.6 12.7 Ukraine 2007 24.6 15.6 .. 1.3 6.8 0.1 40.5 6.8 4.3
Caucasus Armenia 2007 17.4 28.9 .. 1.4 1.6 0.1 20.1 4.5 26 Georgia 2007 14.2 32.3 .. 2.0 5.4 0.4 19 15.7 11
Central Asia Kazakh-stan 2007 17 31.6 .. 1.3 2.5 0.1 18.3 4.5 24.7
Kyrgyzstan 2006 34.6 28.8 .. 3.6 2.7 0.3 13.1 6.5 10.4 Tajikistan 2004 10.8 17.9 .. 2.3 6.8 0.0 5.9 17.4 39 Source: IMF GFS Online database. Table A.4.4. GG expenditures structure by function, % of total expenditures
Country Year
Gen-eral
public ser-vices
De-fense
Public order and
safety
Eco-nomic affairs
Envi-ron-ment
protection
Hous-ing and
com-mu-nity
amenities
Health
Rec-rea-tion, cul-ture and
relig-ion
Edu-cation
Social protec
tion
Albania 2007 19.0 4.0 5.3 18.1 0.0 4.4 8.4 1.1 11.1 27.1 Serbia 2007 8.5 5.3 5.4 13.1 0.8 4.4 13.6 2.4 8.2 34.9 Belarus 2007 13.4 2.5 4.3 23.2 1.1 4.5 9.0 2.3 11.5 27.0 Moldova 2007 12.4 1.2 5.7 13.4 0.6 3.4 11.7 2.5 19.1 30.0 Russia 2006 14.6 8.0 8.4 6.8 0.3 7.4 12.7 2.2 12.2 26.0 Ukraine 2007 7.7 3.0 5.2 13.5 0.7 2.0 9.1 1.9 14.0 42.9 Georgia 2007 0.9 30.5 14.7 7.2 1.6 10.1 5.3 3.6 9.3 16.8 Kazakhstan 2007 9.3 6.4 9.3 16.9 0.6 7.7 11.6 4.7 17.6 19.4 Kyrgyzstan 2006 16.9 6.5 7.7 8.5 0.0 5.5 12.0 3.2 24.8 14.2 Source: IMF GFS Online database.

Marek Dabrowski (Ed.), Roman Mogilevskiy (Ed.)
CASE Network Reports No. 92 162
Table A.4.5. Components of health care funding Private expenditure on health as % of total ex-
penditure on health
External resources for health as % of total ex-
penditure on health
Private prepaid plans as % of private expendi-
ture on health
Out-of-pocket expenditure as % of private expenditure
on health
Social security expendi-ture on health as % GG expenditure on health
Country
2001 2002 2003 2004 2005 2001 2002 2003 2004 2005 2001 2002 2003 2004 2005 2001 2002 2003 2004 2005 2001 2002 2003 2004 2005West Balkans
Albania 61.5 63.9 62.4 59.4 59.7 5.2 2.8 3.8 2.4 1.9 0.0 0.0 0.0 0.0 0.0 99.8 99.8 94.3 96.2 97.0 22.0 25.6 26.6 28.1 30.1B&H 45.7 37.4 31.4 41.1 41.3 2.3 1.8 0.7 1.1 0.6 ... ... ... ... ... 100.0 100.0 100.0 100.0 100.0 96.5 97.5 97.8 97.6 97.8Croatia 18.6 25.8 17.9 19.3 18.7 0.4 0.5 0.4 0.1 0.0 24.3 33.0 7.5 6.0 6.4 75.7 67.0 92.5 94.0 93.6 97.7 97.7 98.0 97.9 97.9Kosovo ... 40.4 40.4 40.3 47.8 … 14.9 10.6 4.8 4.4 ... ... ... ... … ... ... ... ... ... ... ... ... ...Montenegro 27.7 27.9 25.3 27.7 24.5 ... ... ... 1.0 1.9 ... ... ... ... ... 100.0 100.0 100.0 100.0 100.0 98.8 98.8 98.8 98.8 98.8Serbia 34.0 29.3 27.6 28.4 28.1 1.2 0.5 0.6 1.3 0.5 ... ... ... ... ... 85.3 85.3 85.3 86.4 86.7 92.4 92.3 87.0 91.5 92.7Macedonia 28.0 28.6 27.6 29.2 29.6 1.0 2.3 0.6 1.4 1.0 ... ... ... ... ... 100.0 100.0 100.0 100.0 100.0 97.3 97.4 97.8 97.5 96.1
European CIS Belarus 27.4 28.9 26.3 26.6 24.2 0.2 0.1 … … … 0.1 0.1 0.1 0.1 0.1 64.3 69.4 69.7 68.3 69.0 5.0 2.9 4.0 2.2 2.4Moldova 51.3 48.2 49.0 43.2 44.5 30.1 7.3 2.7 4.8 2.6 ... 3.6 3.3 1.1 0.8 96.9 92.5 93.4 96.0 96.4 0.0 0.0 1.2 70.2 75.9Russia 41.3 41.0 41.2 40.4 38.0 0.2 0.2 0.2 0.1 0.0 11.3 10.0 10.2 8.7 8.2 73.7 75.2 79.7 82.2 82.4 39.5 40.5 39.6 39.4 42.0Ukraine 49.7 47.0 43.8 43.2 47.2 0.5 0.5 0.5 0.7 0.6 1.1 1.0 1.1 1.2 1.1 90.1 90.6 89.8 90.5 84.8 0.0 0.0 0.5 0.5 0.6
Caucasus Armenia 76.3 75.6 73.8 70.0 67.1 16.6 10.5 11.1 6.7 12.7 0.1 0.2 0.2 0.2 0.1 80.8 88.0 90.1 98.2 89.2 0.0 0.0 0.0 0.0 0.0Azerbaijan 81.0 82.9 79.5 78.0 75.2 3.8 1.5 1.6 1.4 0.4 0.3 0.3 0.4 0.4 0.3 78.5 80.4 80.7 80.8 84.6 0.0 0.0 0.0 0.0 0.0Georgia 82.0 83.7 85.0 84.6 80.5 10.7 14.2 7.8 6.5 5.1 1.1 0.5 0.5 0.9 0.9 88.0 85.0 90.8 91.7 95.6 43.0 46.2 64.1 62.8 45.4
Central Asia Kazakhstan 43.0 46.2 44.6 39.6 35.8 0.6 1.4 0.8 0.9 0.5 ... ... ... ... ... 100.0 100.0 100.0 100.0 100.0 0.0 0.0 0.0 0.0 0.0Kyrgyzstan 58.9 60.4 62.1 60.3 60.5 8.1 16.0 9.1 15.3 7.6 ... ... ... ... ... 90.6 91.0 93.0 94.6 95.0 10.1 11.9 13.4 19.9 16.6Tajikistan 79.3 79.8 79.6 78.6 77.2 7.9 7.8 14.6 9.7 11.8 0.0 0.0 0.0 0.0 0.0 99.2 98.9 97.5 97.2 96.6 0.0 0.0 0.0 0.0 0.0Turkmenistan 27.7 32.1 30.4 33.4 33.3 0.6 0.5 0.6 0.5 0.3 0.0 0.0 0.0 0.0 0.0 100.0 100.0 100.0 100.0 100.0 6.1 6.1 6.1 6.1 6.1Uzbekistan 55.0 55.3 55.2 53.9 52.3 1.2 2.4 4.8 3.1 3.5 0.0 0.0 0.0 0.0 0.0 97.2 97.1 97.1 97.1 97.1 ... ... ... ... ...Notes. For Kosovo, Private expenditure on health = Out of pocket expenditure Source: Calculated based on WHO online database (http://www.who.int/whosis/database). Data for Kosovo are from WB (2008d); GDP & budget for 2002-2004: Fact Sheet Kosovo (May 2003), www.unmikonline.org.

CHALLENGES AND TRAJECTORIES OF FISCAL POLICY AND PFM REFORM…
CASE Network Reports No. 92 163
Table A.4.6. Aid to education
Constant 2006 USD million
Сonstant 2006 USD As % of direct aid to education % As % of GG education expenditures
Country Year Total aid to educa-
tion
Total aid to basic educa-
tion
Total aid to basic
education per pri-
mary school-age
child
Direct aid to basic
educa-tion
Direct aid to secon-dary
educa-tion
Direct aid to post-
secon-dary
educa-tion
Educa-tion level unspeci-
fied
Share of basic
educa-tion in
total aid to educa-
tion
Total aid to educa-
tion
Total aid to basic
educa-tion
Direct aid to educa-
tion
Direct aid to basic
educa-tion
Direct aid to secon-dary
educa-tion
Direct aid to post-
secon-dary
educa-tion
West Balkans 2005 21 4 17 9.5 0.0 71.4 19.0 19 7.8 1.5 7.8 0.7 - 5.5 Albania 2006 42 10 45 16.7 28.6 40.5 14.3 23 14.8 3.5 14.8 2.5 4.2 6.0 2005 34 3 14 2.9 35.3 55.9 5.9 8 Bosnia & Her-
zegovina 2006 31 2 9 3.2 9.7 83.9 3.2 5 2005 13 0 2 0.0 7.7 84.6 7.7 2 Croatia 2006 19 0 1 0.0 0.0 94.7 5.3 1 2005 16 4 37 16.7 0.0 83.3 0.0 26 Macedonia 2006 19 5 50 26.3 5.3 63.2 5.3 28
Eastern Europe 2005 8 1 1 0.0 0.0 87.5 12.5 7 0.4 0.0 0.4 - - 0.3 Belarus 2006 23 0 0 0.0 0.0 100.0 0.0 1 0.9 - 0.9 - - 0.9 2005 10 1 3 0.0 0.0 90.0 10.0 7 4.1 0.4 4.1 - - 3.7 Moldova 2006 30 12 64 39.3 21.4 35.7 3.6 40 10.9 4.4 10.2 4.0 2.2 3.6 2005 31 0 0 0.0 0.0 96.8 3.2 1 0.6 - 0.6 - - 0.5 Ukraine 2006 66 1 0 0.0 0.0 98.5 1.5 1 1.0 0.0 1.0 - - 1.0
Caucasus 2005 7 1 9 0.0 16.7 66.7 16.7 17 Armenia 2006 38 6 47 0.0 27.3 51.5 21.2 16 2005 9 5 8 40.0 0.0 40.0 20.0 52 Azerbaijan 2006 6 0 0 0.0 0.0 100.0 0.0 2

Marek Dabrowski (Ed.), Roman Mogilevskiy (Ed.)
CASE Network Reports No. 92 164
Constant 2006 USD million
Сonstant 2006 USD As % of direct aid to education % As % of GG education expenditures
Country Year Total aid to educa-
tion
Total aid to basic educa-
tion
Total aid to basic
education per pri-
mary school-age
child
Direct aid to basic
educa-tion
Direct aid to secon-dary
educa-tion
Direct aid to post-
secon-dary
educa-tion
Educa-tion level unspeci-
fied
Share of basic
educa-tion in
total aid to educa-
tion
Total aid to educa-
tion
Total aid to basic
educa-tion
Direct aid to educa-
tion
Direct aid to basic
educa-tion
Direct aid to secon-dary
educa-tion
Direct aid to post-
secon-dary
educa-tion
2005 11 4 11 16.7 0.0 66.7 16.7 37 6.3 2.3 3.5 0.6 - 2.3 Georgia 2006 46 12 35 12.5 9.4 71.9 6.3 28 19.7 5.1 13.7 1.7 1.3 9.9 Central Asia
2005 10 3 3 0.0 0.0 50.0 50.0 29 0.5 0.1 0.5 - - 0.2 Kazakhstan 2006 11 1 1 0.0 9.1 72.7 18.2 8 0.4 0.0 0.4 - 0.0 0.3 2005 19 13 29 57.9 0.0 21.1 21.1 69 Kyrgyzstan 2006 21 11 25 28.6 0.0 23.8 47.6 53 13.3 7.0 13.3 3.8 - 3.2 2005 15 10 14 57.1 7.1 21.4 14.3 62 Tajikistan 2006 18 12 18 68.8 25.0 6.3 0.0 67 2005 3 0 1 0.0 0.0 100.0 0.0 11 Turkmenistan 2006 1 0 1 0.0 0.0 100.0 0.0 16 2005 13 2 1 7.7 30.8 38.5 23.1 19 Uzbekistan 2006 26 12 5 38.5 26.9 26.9 7.7 44
Sources: 2009 Education For All Global Monitoring Report. Overcoming inequality: why governance matters. Oxford Univ. Press, 2008 (http://www.unesco.org/education/gmr2009/press/efagmr2009_Annex4_Aidtables.pdf); Own calculations based on public education expenditure data (IMF GFS database), exchange rates and CPI data (IMF WEO database).

CHALLENGES AND TRAJECTORIES OF FISCAL POLICY AND PFM REFORM…
CASE Network Reports No. 92 165
Table A.4.7. Public expenditure per student by level of education, PPP USD Country Year All levels Primary Secondary Tertiary
Western Balkans Albania 2002 532.2 348.6 536.6 1640.1
2002 2663.4 2168.1 2634.9 3615.3 Croatia 2003 2855.4 2275.9 2923.6 3545.7
Macedonia 2002 1460.5 European CIS
2004 1609.6 993.8 1661.6 2000.3 2005 1997.1 1185.3 2117.3 2369.0 2006 2442.1 1401.9 2634.7 2833.9
Belarus
2007 2007.7 2006 1053.1 Moldova 2007 1188.7 1029.0 1254.2 1199.3 2003 1174.2 2004 1164.4 Russia 2005 1493.1 2002 855.7 457.1 665.2 1682.7 2003 975.2 566.3 824.2 1641.8 2004 1104.3 637.0 961.3 1712.9 2005 1330.0 789.9 1276.2 1817.0
Ukraine
2006 1552.5 993.2 1521.5 1954.4 Caucasus and Central Asia
2003 348.8 234.6 410.2 392.8 2005 386.2 274.0 438.5 447.2 2006 436.4 315.8 485.2 539.7
Azerbaijan
2007 855.7 2002 671.9 749.5 617.7 709.4 2004 607.0 745.7 581.7 461.0 Kazakhstan 2005 687.8 856.9 676.5 488.7
Kyrgyzstan 2002 188.0 109.2 205.8 300.1 2002 100.4 81.0 98.7 274.7 2003 96.5 79.6 103.1 152.9 2004 115.4 94.6 129.2 123.6 2005 162.0 134.5 174.6 217.4 2006 186.5
Tajikistan
2007 217.3 Sources: own calculations based on per capita GDP PPP from IMF WEO database.

Marek Dabrowski (Ed.), Roman Mogilevskiy (Ed.)
CASE Network Reports No. 92 166
Table A.4.8. Public expenditures on education, economic classification, % of total Primary, secondary and post-secondary education
(ISCED levels 1-4) Tertiary education (ISCED levels 5-6)
Country Year Capital
Total cur-rent expen-
diture
Other cur-rent expen-
diture Salaries Capital
Total cur-rent expen-
diture
Other cur-rent expen-
diture Salaries
Western Balkans 2002 10.3 89.7 15.1 74.6 8.7 91.3 30.2 61.1 2003 8.5 91.5 17.2 74.3 7.0 93.0 24.6 68.4 Croatia 2004 5.7 94.3 18.1 76.2 2.5 97.5 26.3 71.2
Macedonia 2002 1.1 98.9 9.8 89.1 Eastern Europe
2004 5.1 94.9 27.7 67.3 5.5 94.5 40.1 54.4 2005 5.1 94.9 25.5 69.5 5.8 94.2 38.9 55.3 2006 5.3 94.7 23.9 70.8 11.6 88.4 35.1 53.3
Belarus
2007 8.7 91.3 37.5 53.8 2006 0.0 100.0 33.3 66.7 Moldova 2007 8.3 91.7 12.7 87.3 31.8 55.4
Caucasus 2002 1.4 98.6 30.5 68.1 0.4 99.6 41.8 57.7 2003 0.5 99.5 36.2 63.2 2005 2.8 97.2 27.7 69.6 1.4 98.6 38.2 60.4 2006 2.0 98.0 24.5 73.5 0.6 99.4 40.5 58.9
Azerbaijan
2007 0.9 99.1 46.5 52.6 Central Asia
2002 3.7 96.3 30.2 66.1 20.1 79.9 39.9 40.0 2004 4.4 95.6 31.2 64.5 22.5 77.5 38.9 38.6 Kazakhstan 2005 6.2 93.8 13.7 80.1 17.5 82.5 28.4 54.0

CHALLENGES AND TRAJECTORIES OF FISCAL POLICY AND PFM REFORM…
CASE Network Reports No. 92 167
Primary, secondary and post-secondary education (ISCED levels 1-4) Tertiary education (ISCED levels 5-6)
Country Year
Capital Total cur-
rent expen-diture
Other cur-rent expen-
diture Salaries Capital
Total cur-rent expen-
diture
Other cur-rent expen-
diture Salaries
2006 14.0 86.0 44.4 41.6 Kazakhstan 2007 15.4 84.6 43.3 41.3 2005 6.9 93.1 32.4 60.8 Kyrgyzstan 2006 7.3 92.7 28.5 64.2
Note. Figures in italics are UIS estimates. Source: UNESCO Institute of Statistics database, http://stats.uis.unesco.org/unesco/.

Marek Dabrowski (Ed.), Roman Mogilevskiy (Ed.)
CASE Network Reports No. 92 168
Table A.4.9. Structure of health and education expenditures (based on functional classification), in%
GG health expenditures = 100% GG education expenditures = 100%
Country Year Outpatient services
Hospital services
Public health ser-
vices
Pre-primary and pri-
mary edu-cation
Secondary education
Tertiary education
2005 … … … 0.00 … 11.04 2006 … … 2.69 14.47 54.32 11.39 Belarus 2007 … … 2.50 17.08 61.22 12.01 2002 22.97 60.50 n.a. … … 21.30 2003 0.00 0.00 n.a. … … 0.00 2004 0.21 0.26 99.53 15.81 66.09 18.10 2005 0.29 5.62 94.09 15.57 56.84 27.59 2006 0.35 3.15 96.50 16.80 61.92 21.28
Moldova
2007 0.47 3.01 96.52 18.70 56.72 17.28 2002 … … … 67.94 6.55 17.49 2003 … … … 64.09 6.30 18.49 2004 … … … 66.28 6.04 19.03 2005 … … … 14.71 47.16 22.85
Russia
2006 … … … 14.03 69.57 16.40 2002 9.00 77.44 4.90 … … … 2003 8.87 74.60 5.55 … … … 2004 9.80 70.95 5.28 10.96 38.69 32.31 2005 10.68 74.57 5.25 10.72 41.46 30.08 2006 11.00 74.02 5.38 11.03 41.89 29.86
Ukraine
2007 10.89 72.54 5.01 11.49 42.30 29.36 2002 … 22.90 … 3.20 82.12 9.81 2003 14.75 20.35 64.90 79.03 12.58 8.38 2004 15.25 36.33 48.41 78.84 12.84 8.32 2005 … 31.62 68.38 73.30 11.53 11.48 2006 … 30.62 69.38 73.42 11.93 14.65
Kazakhstan
2007 … 32.73 67.27 72.40 14.24 13.35 Kyrgyzstan 2006 51.97 22.29 6.60 6.61 8.97 17.90
Notes. Russia - accrual basis, all other countries - cash basis. Due to data omissions sums of distinct sub-sector expenditure the shares do not necessarily constitute 100%. Source: Own calculations on the basis of GFS database.

CHALLENGES AND TRAJECTORIES OF FISCAL POLICY AND PFM REFORM…
CASE Network Reports No. 92 169
Table A.4.10. Progress towards achievement of Millennium Development Goals - notes Indicator achieved: Early achievers: the MDG target not yet achieved but is estimated to be achieved at least within two thirds of the remaining period from the last meas-urement until 2015 On track: the MDG target is estimated to be achieved from two thirds of the time remaining to one and one third of the time remaining until 2015 Slow: the time gap for achieving is more than one third of the time remaining after 2015 Regressing: the indicator is moving in the wrong direction No progress, or deterioration since 2000:
Notes. Data for the latest year available, mostly 2006. Averages for "Developed Regions” comprise Europe (except CIS countries), Australia, Canada, Japan, New Zealand and the United States. "Developed Regions" include transition countries in Europe unless the latter are presented separately as “Transition countries of South-Eastern Europe”, which groups includes: Albania, Bosnia and Herzegovina, Bulgaria, Romania, Serbia, Montenegro, and Macedonia * CIS average, ¹ Estimated data, ² Modeled data Source: For all countries, based on own analysis of available time series (1) MDG Database, United Nations Statistics Division (http://data.un.org/Data.aspx); 2) MDG Indicators, http://mdgs.un.org/unsd/mdg/Data.aspx; Regional averages: Statistical Annex: Millennium Development Goals, Targets and Indicators, 2008 (http://mdgs.un.org/unsd/mdg/Resources/Static/Data/Stat%20Annex.pdf); for CCA based on: ADB (2007).

Marek Dabrowski (Ed.), Roman Mogilevskiy (Ed.)
CASE Network Reports No. 92 170
Table A.4.10. Progress towards achievement of Millennium Development Goals Developed
regions average,
2006 Albania
Bosnia & Herze-govina Croatia
FYR Mace-donia
Serbia & Monte-negro
Transition SEE
average, 2006 Belarus Moldova
Russian Federat-
ion Ukraine Armenia Azerbaijan Georgia
CIS Europe average,
2006Kazakh-
stanKyrgyz-
stanTajiki-stan
Turkmeni-stan
Uzbeki-stan
CIS Asia average,
2006
Total net enrolment ratio in primary education 96.4 93.6 98.9 97.2 .. 89.9¹ 90.6 93.7 90.6 90.7 85.4 90.3 92.8 99 93.5 97.3 93.9Proportion of pupils starting grade 1 who reach last grade of primary 97 89.9 99.7 98.2 .. 99.2 97 98.7 98 99.4 97.3 100 96.4 100 98.6 98.7 .. 98.6 100.9
Children under five mortality rate per 1,000 live births¹ 6 17 15 6 17 15 13 19 16 24 24 88 32 17 29 41 68 51 43 47Infant mortality rate (0-1 year) per 1,000 live births¹ 5 15 13 5 15 13 12 16 14 20 21 73 28 15 26 36 56 45 38 40Proportion of 1 year-old children immunized against measles¹ 93 97 90 96 94 88 93 97 96 99 98 92 96 95 99 99 97 87 99 95 95
Maternal mortality ratio per 100,000 live births 9 92² 3 7 10 14 .. 18 22 28 18 76² 82² 66² 51* 140² 150² 170² 130² 24 ..Births attended by skilled health personnel, % .. 99.8 99.6 99.9 99 92.1 98 100 99.5 99.4 99.8 97.8 99.7 99 99 99.8 97.6 83.4 99.5 99.9 97
Contraceptive use among currently married women 15-49 years old, any method, percentage 67.3 75.1 35.7 13.5 58.3 55.3 72.6 67.8 72.8 67.5 53.1 55.4 47.3 63.4 50.7 47.8 37.9 61.8 64.9 54.5Adolescent birth rate, per 1,000 women 23.6 16.1 15.5 13.6 22.2 29 22.1 29.2 28.1 29.5 25.4 44 41.1 28.1 28.6 25.8 27.3¹ 19 25.5¹ 28.9Antenatal care coverage, at least one visit, % .. 97.1 98.9 81 .. 99.4 88.8 93.2 70 94.3 .. 99.9 96.9 77.1 99.1 99 98
People living with HIV, 15-49 years old, percentage¹ 0.3 .. 0.2 0.4 1.1 1.6 0.1 0.2 0.1 1.2 0.1 0.3 0.1 0.1
Number of existing TB cases per 100,000 population (excluding HIV infected)² 15 26.2 57.1 63.9 33.1 44.8 84 70.9 153.7 124.9 113.7 80.5 87.3 84.2 118 142.1 137 298 78.2 144.6 140Number of deaths from TB per 100,000 population (excluding HIV infected)² 2 3.4 7.4 6.4 5 4.9 11 8.2 18.8 17 14.5 10.2 10.3 9.2 15 17.4 17.9 39.2 9.5 16.9 17Patients successfully treated from TB under directly observed treatment short course (DOTS), % 73 76.8 96.5 84.4 89.3 83 73.1 62 28 57.6 72.5 59.1 72.6 59 71.1 84.7 86.2 81.1 80.5 75
Total, percentage 99 97 99 99 100 100 90 97 97 98 78 99 97 96 89 67 88 88 Urban, percentage 100 97 100 100 100 100 96 100 97 99 95 100 99 99 99 93 98 98 Rural, percentage 97 97 98 98 99 99 85 88 97 96 59 97 91 91 83 58 82 79
Total, percentage 99 97 95 99 89 93 79 87 93 91 80 93 88 97 93 92 96 93 Urban, percentage 100 98 99 99 92 91 85 93 97 96 90 94 94 97 94 95 97 95 Rural, percentage 96 97 92 98 81 97 73 70 83 81 70 92 75 98 93 91 85 92
Proportion of population using an improved sanitation facility¹
Target 6.A: Have halted by 2015 and begun to reverse the spread of HIV/AIDS
Target 6.C: Have halted by 2015 and begun to reverse the incidence of malaria and other major diseases
Target 7.C: Halve, by 2015, the proportion of people without sustainable access to safe drinking water and basic sanitationProportion of population using an improved drinking water source¹
Target 2.A: Ensure that, by 2015, children everywhere, boys and girls alike, will be able to complete a full course of primary schooling
Target 4.A: Reduce by two-thirds, between 1990 and 2015, the under-five mortality rate
Target 5.A: Reduce by three quarters, between 1990 and 2015, the maternal mortality ratio
Target 5.B: Achieve, by 2015, universal access to reproductive health

CHALLENGES AND TRAJECTORIES OF FISCAL POLICY AND PFM REFORM…
CASE Network Reports No. 92 171
Figure A.5.1. Shares of different government levels in GG expenditures, 2006 (a) Housing and community amenities
0% 10% 20% 30% 40% 50% 60% 70% 80% 90% 100%
Belarus
Georgia
Kazakhstan
Moldova
Russian Federation
Ukraine
Budgetary central govenrment Central extra-budgetary units Local governments
Source: IMF GFS 2007.
(b) Health
0% 10% 20% 30% 40% 50% 60% 70% 80% 90% 100%
Belarus
Georgia
Kazakhstan
Moldova
Russian Federation
Ukraine
Budgetary central govenrment Central extra-budgetary units Local governments
Source: IMF GFS 2007.

Marek Dabrowski (Ed.), Roman Mogilevskiy (Ed.)
CASE Network Reports No. 92 172
(c) Education
0% 10% 20% 30% 40% 50% 60% 70% 80% 90% 100%
Belarus
Georgia
Kazakhstan
Moldova
Russian Federation
Ukraine
Budgetary central govenrment Central extra-budgetary units Local governments
Source: IMF GFS 2007.
(d) Social protection
0% 10% 20% 30% 40% 50% 60% 70% 80% 90% 100%
Belarus
Georgia
Kazakhstan
Moldova
Russian Federation
Ukraine
Budgetary central govenrment Central extra-budgetary units Local governments
Source: IMF GFS 2007Source: IMF GFS 2007.

CHALLENGES AND TRAJECTORIES OF FISCAL POLICY AND PFM REFORM…
CASE Network Reports No. 92 173
Table A.5.1. PEFA ratings
Indicator \ Country Albania Kosovo Kyr-gyzstan
Mace-donia Moldova Serbia Tajiki-
stan Ukraine Median score
Budget Credibility 1. Aggregate expenditure outturn compared to original approved budget B B D A A A B B B
2. Composition of expenditure outturn com-pared to original approved budget D D A A C C C B C
3. Aggregate revenue outturn compared to original approved budget B A A A A A A A A
4. Stock and monitoring of expenditure pay-ment arrears D D+ D A D+ C+ C+ B+ C
Transparency and Comprehensiveness 5. Classification of the budget A D+ C A C C D A C 6. Comprehensiveness of information in-cluded in budget documentation C C B … A B A A B
7. Extent of unreported government opera-tions including those funded by donors D+ C+ … … B+ B+ C+ D+ C+
8. Transparency of intergovernmental fiscal relations C+ A- C+ … A B+ B B+ B+
9. Oversight of aggregate fiscal risk from other public sector entities C+ C+ D+ … C C C D+ C
10. Public access to key fiscal information B B C … A B D B B Policy-Based Budgeting 11. Orderliness and participation in the an-nual budget process A B+ B … B+ A B B+ B+
12. Multi-year perspective in fiscal planning, expenditure policy and budgeting C D D+ … B+ C D+ C C
Predictability and Control in Budget Execution

Marek Dabrowski (Ed.), Roman Mogilevskiy (Ed.)
CASE Network Reports No. 92 174
Indicator \ Country Albania Kosovo Kyr-gyzstan
Mace-donia Moldova Serbia Tajiki-
stan Ukraine Median score
13. Transparency of taxpayer obligations and liabilities … B+ C … A B C C C+
14. Effectiveness of measures for taxpayer registration and tax assessment … C … … B+ B D+ C C
15. Effectiveness in collection of tax pay-ments … B B+ … B+ D+ … D+ B
16. Effectiveness of cash flow planning, management and monitoring C+ B+ D B+ A C+ D+ D+ C+
17. Recording and management of cash bal-ances, debt and guarantees B A B+ A B B C+ B B
18. Effectiveness of payroll controls B+ D … C+ D+ C+ D+ D+ D+ 19. Competition, value for money and con-trols in procurement D+ C+ C+ D+ B C+ C D+ C
20. Effectiveness of internal controls B C+ D+ B C+ C C+ C+ C+ 21. Effectiveness of internal audit C+ C D C C+ C+ D+ C+ C Accounting, Recording and Reporting 22. Timeliness and regularity of accounts reconciliation B B … A B B+ B A B
23. Availability of information on resources received by service delivery units D D D C B B C B C
24. Timeliness, quality and dissemination of in-year budget execution reports C+ B+ C+ C+ C+ B+ C+ C+ C+
25. Timeliness of the presentation of audited financial statements to the legislature B+ A D C+ D D D+ D+ D+
External Scrutiny and Audit 26. The scope, nature and follow up of exter-nal audit reports C+ D+ D B C+ D D+ D+ D+

CHALLENGES AND TRAJECTORIES OF FISCAL POLICY AND PFM REFORM…
CASE Network Reports No. 92 175
Indicator \ Country Albania Kosovo Kyr-gyzstan
Mace-donia Moldova Serbia Tajiki-
stan Ukraine Median score
27. Legislative scrutiny of the annual budget law B+ B+ D+ B+ B+ C+ C B+ B+
28. Legislative scrutiny of external audit re-ports C+ D D C D+ D D D+ D
Donor Practices D1. Predictability of direct budget support D … C+ D … D D+ … D D2. Financial information provided by do-nors for budgeting and reporting on project and programme aid
C … … C D D+ D+ D D+
D3. Proportion of aid that is managed by use of national procedures D … … D D D D D D
Median score C+ C+ C B B C+ C C+ Source: Country PEFA reports.
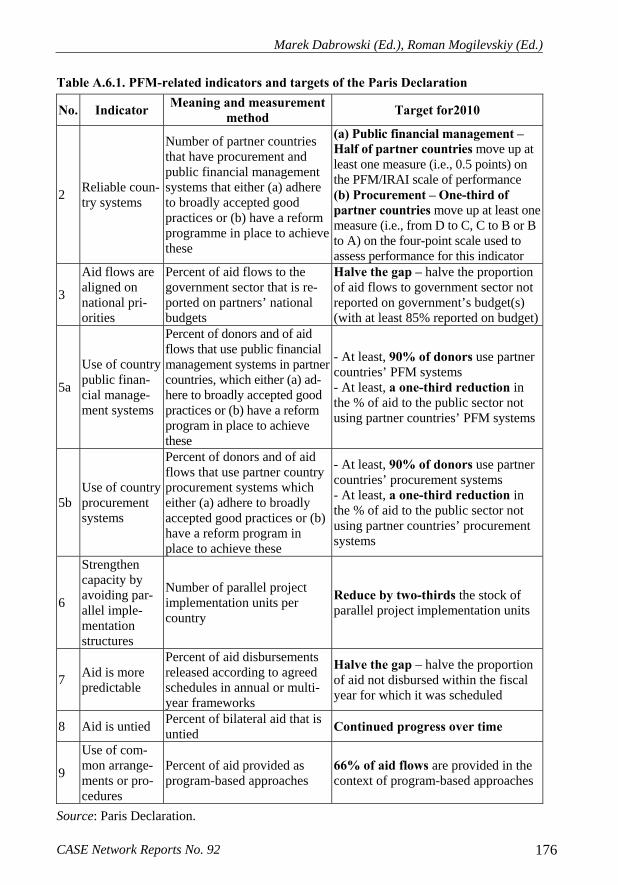
Marek Dabrowski (Ed.), Roman Mogilevskiy (Ed.)
CASE Network Reports No. 92 176
Table A.6.1. PFM-related indicators and targets of the Paris Declaration
No. Indicator Meaning and measurement method Target for2010
2 Reliable coun-try systems
Number of partner countries that have procurement and public financial management systems that either (a) adhere to broadly accepted good practices or (b) have a reform programme in place to achieve these
(a) Public financial management – Half of partner countries move up at least one measure (i.e., 0.5 points) on the PFM/IRAI scale of performance (b) Procurement – One-third of partner countries move up at least one measure (i.e., from D to C, C to B or B to A) on the four-point scale used to assess performance for this indicator
3
Aid flows are aligned on national pri-orities
Percent of aid flows to the government sector that is re-ported on partners’ national budgets
Halve the gap – halve the proportion of aid flows to government sector not reported on government’s budget(s) (with at least 85% reported on budget)
5a
Use of country public finan-cial manage-ment systems
Percent of donors and of aid flows that use public financial management systems in partner countries, which either (a) ad-here to broadly accepted good practices or (b) have a reform program in place to achieve these
- At least, 90% of donors use partner countries’ PFM systems - At least, a one-third reduction in the % of aid to the public sector not using partner countries’ PFM systems
5b Use of country procurement systems
Percent of donors and of aid flows that use partner country procurement systems which either (a) adhere to broadly accepted good practices or (b) have a reform program in place to achieve these
- At least, 90% of donors use partner countries’ procurement systems - At least, a one-third reduction in the % of aid to the public sector not using partner countries’ procurement systems
6
Strengthen capacity by avoiding par-allel imple-mentation structures
Number of parallel project implementation units per country
Reduce by two-thirds the stock of parallel project implementation units
7 Aid is more predictable
Percent of aid disbursements released according to agreed schedules in annual or multi-year frameworks
Halve the gap – halve the proportion of aid not disbursed within the fiscal year for which it was scheduled
8 Aid is untied Percent of bilateral aid that is untied Continued progress over time
9
Use of com-mon arrange-ments or pro-cedures
Percent of aid provided as program-based approaches
66% of aid flows are provided in the context of program-based approaches
Source: Paris Declaration.

CHALLENGES AND TRAJECTORIES OF FISCAL POLICY AND PFM REFORM…
CASE Network Reports No. 92 177
Table A.6.2. Investment operations of the World Bank, mil. USD Latest completed CAS/CPS
Investment operations Social sector Country Period
Total WB
lending Total Total Educa-tion Health
Social protec-
tion
Water and
utilities Albania 2002-2004 164 124 66.2 19 19 5.2 23 Armenia 2003-2005 159 131 15 15 Azerbaijan 2003-2005 183 163 55.9 18 10 27.9 Belarus 2002-2004 8.5 8.5 8.5 BIH 2005-2007 132 132 48 10 16 22 Croatia 2005-2008 990 608 249 85 164 Georgia 1998-2005 533 403 121 26 37 18 Kazakhstan 2001-2003 105 105 Kosovo 2006-2007 21 21 Kyrgyzstan 2003-2006 155 135 30 15 15 Macedonia 2004-2006 166 106 10 10 Moldova 2002-2004 100 100 59 16 11 12 Montenegro 2005-2006 32 14 5 5 Russia 2003-2006 1086 1086 505 100 80 125 200 Serbia 2005-2007 374 272 25 25 Tajikistan 2002-2004 83 83 55 20 35 Turkmenistan No WB lending Ukraine 2004-2007 1140 640 186 87 99 Uzbekistan 2005-2007 55 55 55 15 40 Current CAS/CPS Albania 2005-2008 170 110 55 35 Armenia 2006-2009 186 151 30 15 15 Azerbaijan 2007-2010 1260 1260 515 85 10 420 Belarus 2008-2011 163 163 … … BIH 2008-2011 200 200 … … … … Croatia 2009-2012 630 … 127 100 27 Georgia 2006-2009 143 80 15 15 Kazakhstan 2004-2007 443 443 Kosovo 2008 12 12 10 10 Kyrgyzstan 2007-2010 129 129 25 15 10 Macedonia 2007-2010 220 145 25 25 Moldova 2005-2008 90 90 40 10 10 10 10 Montenegro 2007-2010 69 69 10 Russia 2007-2009 600 600 Serbia 2008-2011 350 250 15 15 Tajikistan 2006-2009 120 100 55 15 25 15 Turkmenistan No WB lending Ukraine 2008-2011 2500 1900 253 113 140 Uzbekistan 2008-2011 373 373 240 25 70 145 Source: World Bank.