1
Strategic Distribution Centre
Techno‐Commercial Feasibility Report
Techno Commercial Feasibility Report Strategic Distribution Centre
2 IL&FS Cluster Development Initiatives Limited
Contents GLOSSARY ................................................................................................................................... 7
1. BACKGROUND ........................................................................................................................ 9
1.1 Status of Agro and Food Industry in India ................................................................................. 9 1.2 Food Processing Industry in India .............................................................................................. 10 1.3 Current Supply Chain and Distribution .................................................................................... 14 1.4 Current Logistics & Warehousing Scenario ............................................................................ 15 1.5 Changing Face of Indian Consumerism: Growth in Retail ................................................ 19 1.6 Changing Role of Warehousing .................................................................................................... 19 1.7 Mega Food Parks ................................................................................................................................ 25
2. OBJECTIVE AND METHODOLOGY ................................................................................... 26
2.1 Objective ....................................................................................................................................................... 26 2.2 Methodology ................................................................................................................................................ 26
3. MODERN DISTRIBUTION INFRASTRUCTURE: INDIAN SCENARIO ........................... 29
3.1 Introduction ................................................................................................................................................ 29 3.2 Analysis of Existing Value/Supply Chain ........................................................................................ 34 3.3 Staple Retailing .......................................................................................................................................... 39 3.4 Processed Food Retailing ...................................................................................................................... 40 3.5 Inefficiencies in Current Supply Chain ............................................................................................ 41 3.6 Challenges and Gaps ................................................................................................................................ 43 4.1 Concept .......................................................................................................................................................... 47 4.2 Potential Users of SDC ............................................................................................................................. 48 4.3 Benefits of SDC ........................................................................................................................................... 49
5. LOCATION ANALYSIS AND IDENTIFICATION ............................................................... 51
5.1 Introduction ................................................................................................................................................ 51 5.2 Comparison of Cities ................................................................................................................................ 52 5.3 Location Advantages of NCR ................................................................................................................ 58
6. PROPOSED SDC – NATIONAL CAPITAL REGION ........................................................... 60
6.1 Identified Sites ............................................................................................................................................ 60 6.2 Categories and Pattern of Food Consumption .............................................................................. 61
7. TECHNICAL DETAILS OF SDC ........................................................................................... 64
7.1 Product Categories ................................................................................................................................... 64 7.2 Operational Processes ............................................................................................................................. 65 7.3 Design of the SDC ...................................................................................................................................... 67 7.4 Modeling the SDC ...................................................................................................................................... 70 7.5 Case Study – A discount Supermarket Chain from the West .................................................. 82 7.6 Summary ....................................................................................................................................................... 86
8. FINANCIAL ANALYSIS ........................................................................................................ 87
Techno Commercial Feasibility Report Strategic Distribution Centre
3 IL&FS Cluster Development Initiatives Limited
8.1 Business Model .......................................................................................................................................... 87 8.2 Project Details ............................................................................................................................................. 90 8.3 Project Cost .................................................................................................................................................. 92 8.4 Means of Finance ....................................................................................................................................... 96 8.5 Analysis of Business Plan....................................................................................................................... 97 8.6 Key Operating Assumptions ................................................................................................................. 98 8.7 Financial Performance .......................................................................................................................... 102 8.8 Sensitivity Analysis ................................................................................................................................ 104
ANNEXURE............................................................................................................................... 105
Annexure I: Scope of Work ......................................................................................................................... 105 Annexure II: Financial Tables .................................................................................................................... 107 Annexure III: SDC Layout ............................................................................................................................ 111 Annexure IV: SDC 3G Layout ..................................................................................................................... 112
Techno Commercial Feasibility Report Strategic Distribution Centre
4 IL&FS Cluster Development Initiatives Limited
Tables Table 1.1: Projected Food Consumption ..................................................................................................... 10 Table 1.2 : Growth Projections of Processed Food ................................................................................. 11 Table 3.1: Comparison between Traditional & Modern Supply Chain ........................................... 39 Table 3.2 Value Chain of Pigeon Pea ............................................................................................................. 40 Table 5.1: Demographics .................................................................................................................................... 53 Table 5.2: Per Capita Income and Percentage of Working Females ................................................ 54 Table 5.3: Salaried and Business/Professional HHs .............................................................................. 54 Table 5.4: Estimated Retail Space .................................................................................................................. 55 Table 5.5: Total Annual Expenditure on Food‐ Based on NSSO Survey‐2005‐06 ..................... 56 Table 5.6: Monthly Per Capita Consumption Expenditures on Food and Non‐Food Items .. 58 Table 6.1: Consumption of Food Items in Urban NCR ........................................................................... 62 Table 7.1: Growth Model of Volumes to be handled by SDC ............................................................... 71 Table 7.2: Parameters for Designing the SDC modules ......................................................................... 71 Table: 8.1: Land Use for SDC ............................................................................................................................. 90 Table 8.2: Details of Technical Infrastructure in the SDC .................................................................... 91 Table 8.3: Non technical facilities in the SDC ............................................................................................ 91 Table 8.4: Component Wise Project Cost of SDC ...................................................................................... 92 Table 8.5: Estimated Area and Construction Cost of SDC .................................................................... 93 Table 8.6: Machinery Cost ................................................................................................................................. 94 Table 8.7: Cost of Miscellaneous Assets and Utilities ............................................................................ 95 Table 8.8: Means of Finance .............................................................................................................................. 97 Table 8.9: Details of Power Load .................................................................................................................... 98 Table 8.10: Details of Manpower Costs ........................................................................................................ 99 Table 8.11: Depreciation Rates used for Assets in SDC ...................................................................... 101 Table:8.12 Rentals Assumption .................................................................................................................... 101 Table 8.13:Year wise Estimated Capacity Utilization of SDC ........................................................... 102 Table 8.14: Income Statement ....................................................................................................................... 102 Table 8.15 : Major Financial Indicators ..................................................................................................... 104 Table 8.16: Sensitivity Analysis of SDC ...................................................................................................... 104
Techno Commercial Feasibility Report Strategic Distribution Centre
5 IL&FS Cluster Development Initiatives Limited
Figures Figure1.1 Market Share of Unorganised Sector in Indian Food Processing Industry 11
Figure 1.2 Targets for Food Processing Industry in India 14
Figure 1.3: Composition of Warehousing in India 16
Figure 1.4 : Composition of Cold Storage Operators in India 17
Figure 1.5: Storage Conditions in Grain Warehouse 17
Figure 1.6: Cost Elements of Logistics in India 18
Figure 1.7: Retail Visibility 22
Figure 2.1 : Methodology Adopted by IL&FS CDI 28
Figure 3.1: Income Pyramid w.r.t. Population in India 31
Figure 3.2: Category wise Expenditure Pattern 32
Figure 3.3: Typical Supply Chain in F&V 35
Figure 3.4: Supply Chain of F&V in Azadpur Mandi 36
Figure 3.5: Supply Chain of Banana from Jalgaon to Azadpur Mandi 36
Figure 3.6: Model I: Procurement through APMC Market Yards 37
Figure 3.7: Model II: Direct Procurement from Growers 37
Figure 3.8 Value Chain of Pea from Jalandhar to Azadpur Mandi 38
Figure 3.9: Typical Supply Chain of Staples 39
Figure 3.10: Supply Chain for Processed Food Products 41
Figure 3.11: Picture of a typical warehouse operations in India 42
Figure 3.12: Explaining India’s High Delivery Costs 44
Figure 5.1: Retail Market Opportunity in India 51
Figure 5.2 : Monthly per capita consumption expenditure on Food and Non-food items in Mumbai 57
Techno Commercial Feasibility Report Strategic Distribution Centre
6 IL&FS Cluster Development Initiatives Limited
Figure 5.3: Monthly per capita consumption expenditure on Food and Non-food items in Delhi 57
Figure 5.4: Food Production and Processing Areas around NCR 59
Figure 6.1: Identified Locations for SDC in NCR 61
Figure 6.2: Consumption Pattern of Food Items in Urban NCR 62
Figure 6.3: Food Categories Consumed in urban NCR 63
Figure 6.4: Temperature Zones of Food Items Sold by Organised Retail in NCR 63
Figure 7.1: Typical Operational Process in Distribution Centers 65
Figure 7.2: Flow through Process in SDC 67
Figure 7.3 - Proposed Modular Building Design of SDC 69
Figure 7.4: Model for a Single Module of the SDC. 72
Figure 7.5: Size and Layout of SDC Module: 73
Figure: 7.6: Ambient Storage Model Parameters of SDC 74
Table: 7.7: Layout of Ambient Area 76
Figure 7.8: Flow Model for F&V Operations in SDC 77
Figure 7.9: Layout of Chill and Frozen Sections Operational Flows 79
Figure 7.10 : Dairy and Chill Operations Module 80
Figure 7.11: Model of Frozen Operations: 81
Figure 7.12: Product types in a Western Supermarket 82
Figure 7.13: Typical Operational flows for a Western Retail Supermarket DC 83
Figure 7.14: Layout of a typical Western Distribution Centre 84
Figure 7.15: Ambient picking operation 84
Techno Commercial Feasibility Report Strategic Distribution Centre
7 IL&FS Cluster Development Initiatives Limited
Glossary 3PL – Third Party Logistics
% - percent
bn - billion
APMC – Agriculture Produce Marketing Committee
BWS – Beer, Wine and Spirits
CA – Commission Agent
CAGR – Compounded Annual Growth Rate
CWC – Central Warehousing Corporation
CNF – Carrying and Forward Agent
DC – Distribution Center
DES - Directorate of Economics and Statistics
DMI – Directorate of Marketing and Inspection, Government of India
DSCR – Debt Service Coverage Ratio
DSD – Direct Store Delivery
F&B – Food & Beverages
FCI – Food Corporation of India
FICCI – Federation of Indian Chambers of Commerce and Industry
FMCG – Fast Moving Consumer Goods
FT – Flow Through
GDP – Gross Domestic Product
HH - Households
IIM – Indian Institute of Management
INR – Indian Rupees
IRR – Internal Rate of Return
Techno Commercial Feasibility Report Strategic Distribution Centre
8 IL&FS Cluster Development Initiatives Limited
KWH – Kilo Watt Hour
LPH – Litre Per Hour
MFP – Mega Food Parks
MFPI/MoFPI – Ministry of Food Processing Industries
MPCE – Monthly Per Capita Consumption Expenditure
MT – Metric Tonnes
NCAER – National Council of Applied Economic Research
NCR – National Capital Region
OGP – Oilseeds, Grains and Pulses
PFCE – Per Capita Private Final Consumption Expenditure
PTC – Price to Consumer
RBI – Reserve Bank of India
RDC – Regional Distribution Center
SEZs – Special Economic Zones
SDC – Strategic Distribution Center
SKU – Stock Keeping Units
SMG – Slow Moving Goods
SPV – Special Purpose Vehicle
SWC – State Warehousing Corporations
Sq ft - Square Feet
UK – United Kingdom
US$ - US Dollars
USA – United State of Amercia
WMS – Warehouse Management System
Techno Commercial Feasibility Report Strategic Distribution Centre
9 IL&FS Cluster Development Initiatives Limited
1. Background Despite India's inherent potential to emerge as a Global Food Basket, the existing supply chain
and distribution network has been the key constraint to this. Absence of infrastructure is causing
the loss of a whopping Rs.33, 000 crore per annum in the forms of wastages and value losses. It
is also a major deterrent for the retail sector to enable them to offer the best quality products at
competitive prices. The changing role of warehousing demands modern logistics and distribution
centres.
1.1 Status of Agro and Food Industry in India
The presence of diverse agro climatic conditions of around 20 agro-climatic regions and nearly
46 out of 60 soil types along with long sunshine hours and day length round the year as also 52
per cent of total cultivable land areas against 11 per cent globally has helped India become one
of the key food producers in the world. Today, India is the largest producer of milk in the world,
and is likely to become the second largest dairy products producer in the coming years, second
largest producer of fruits and vegetables, third largest producer food grains, third largest output
of fish and has the largest number of livestock in the world.
The Indian food market in 2008 is estimated at over US$ 182 billion1 of which the retail food
sector accounted for around US$ 70 billion and the processed food market accounted for 32 per
cent. A McKinsey & Company study suggests that the Indian food market is expected to reach
US$ 344 billion in 2025 at a compound annual growth rate (CAGR) of 4.1 per cent. McKinsey &
Company further estimate that the retail food sector in India is likely to grow from around US$
70 billion in 2008 to US$ 150 billion by 2025 and will account for a large chunk of the world
food industry, which is likely to grow to US$ 400 billion from US$ 175 billion. A survey by
FICCI suggests that India's food and beverages (F&B) sector is expected to touch Rs 4,660-
billion mark by the March 2009, growing at 9% rate.
The outlook of growth of the food consumption in the year 2010 and 2015 is provided in the
table below:
1 'India Food Report 2008' by Research and Markets
Techno Commercial Feasibility Report Strategic Distribution Centre
10 IL&FS Cluster Development Initiatives Limited
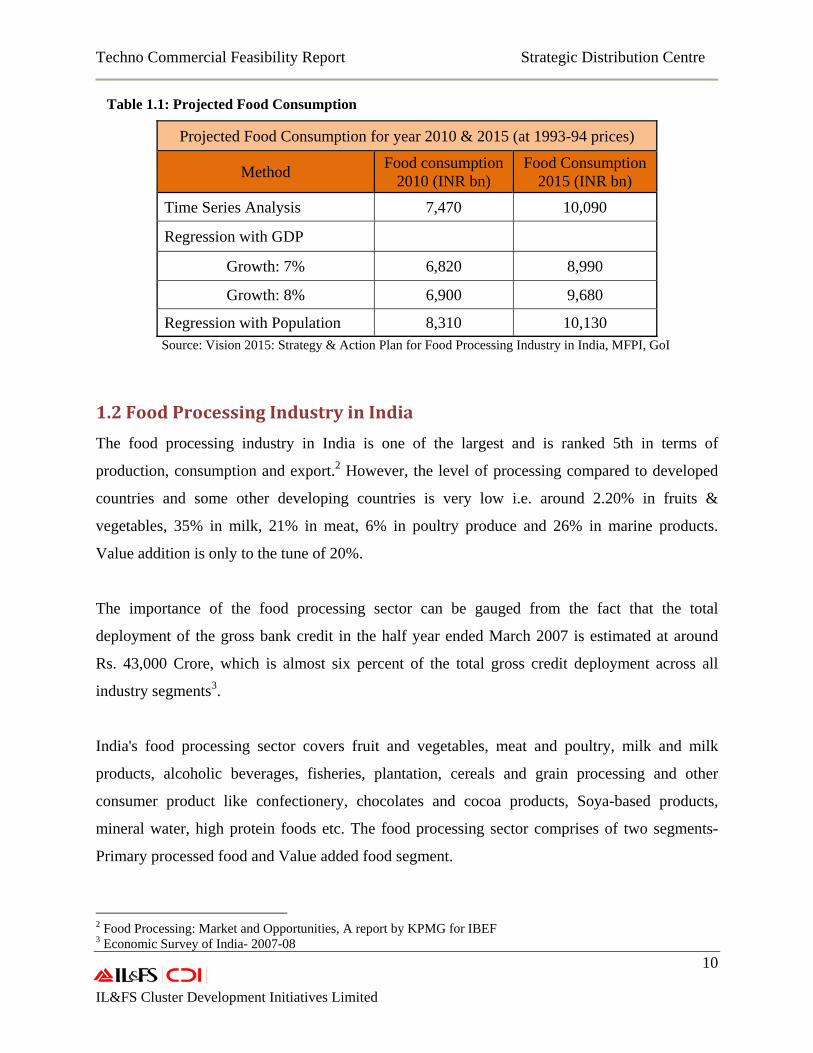
Table 1.1: Projected Food Consumption
Projected Food Consumption for year 2010 & 2015 (at 1993-94 prices)
Method Food consumption2010 (INR bn)
Food Consumption 2015 (INR bn)
Time Series Analysis 7,470 10,090
Regression with GDP Growth: 7% 6,820 8,990
Growth: 8% 6,900 9,680
Regression with Population 8,310 10,130 Source: Vision 2015: Strategy & Action Plan for Food Processing Industry in India, MFPI, GoI
1.2 Food Processing Industry in India The food processing industry in India is one of the largest and is ranked 5th in terms of
production, consumption and export.2 However, the level of processing compared to developed
countries and some other developing countries is very low i.e. around 2.20% in fruits &
vegetables, 35% in milk, 21% in meat, 6% in poultry produce and 26% in marine products.
Value addition is only to the tune of 20%.
The importance of the food processing sector can be gauged from the fact that the total
deployment of the gross bank credit in the half year ended March 2007 is estimated at around
Rs. 43,000 Crore, which is almost six percent of the total gross credit deployment across all
industry segments3.
India's food processing sector covers fruit and vegetables, meat and poultry, milk and milk
products, alcoholic beverages, fisheries, plantation, cereals and grain processing and other
consumer product like confectionery, chocolates and cocoa products, Soya-based products,
mineral water, high protein foods etc. The food processing sector comprises of two segments-
Primary processed food and Value added food segment.
2 Food Processing: Market and Opportunities, A report by KPMG for IBEF 3 Economic Survey of India- 2007-08
Techno Commercial Feasibility Report Strategic Distribution Centre
11 IL&FS Cluster Development Initiatives Limited
At present the food processing sector employs about 13 million people directly and about 35
million people indirectly. As per Index of Industrial production, food products sector grew at 6.8
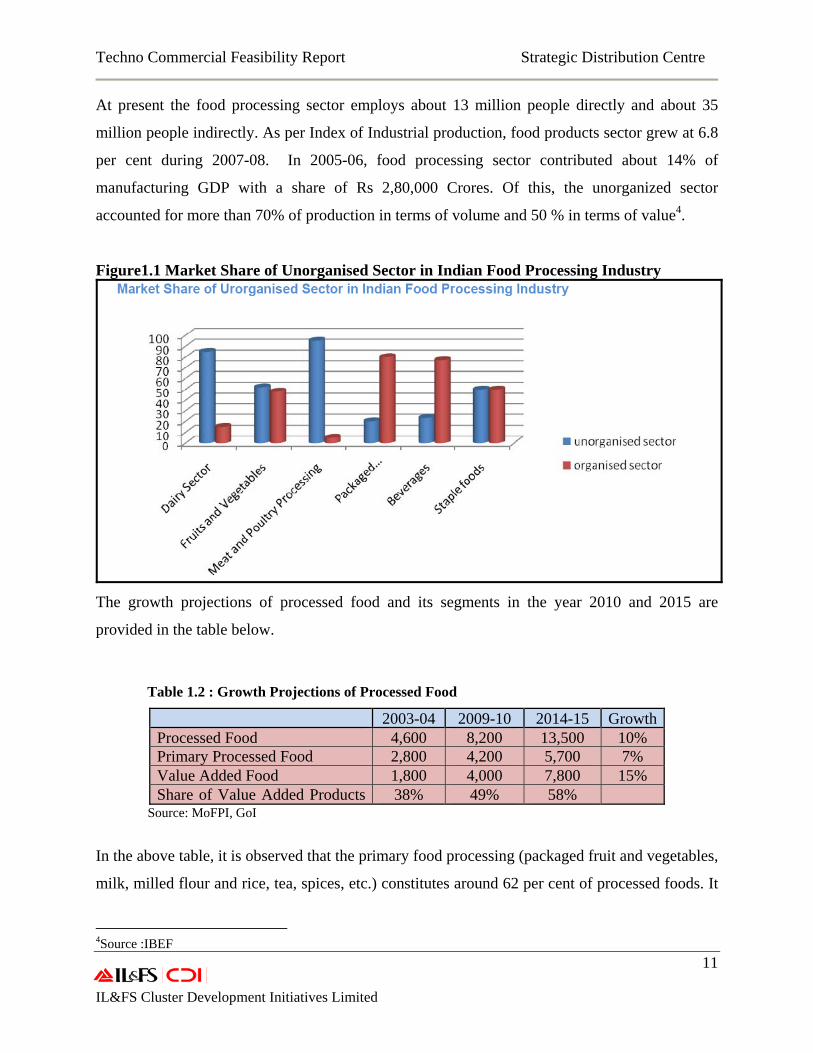
per cent during 2007-08. In 2005-06, food processing sector contributed about 14% of
manufacturing GDP with a share of Rs 2,80,000 Crores. Of this, the unorganized sector
accounted for more than 70% of production in terms of volume and 50 % in terms of value4.
Figure1.1 Market Share of Unorganised Sector in Indian Food Processing Industry
The growth projections of processed food and its segments in the year 2010 and 2015 are
provided in the table below.
Table 1.2 : Growth Projections of Processed Food
2003-04 2009-10 2014-15 GrowthProcessed Food 4,600 8,200 13,500 10% Primary Processed Food 2,800 4,200 5,700 7% Value Added Food 1,800 4,000 7,800 15% Share of Value Added Products 38% 49% 58%
Source: MoFPI, GoI
In the above table, it is observed that the primary food processing (packaged fruit and vegetables,
milk, milled flour and rice, tea, spices, etc.) constitutes around 62 per cent of processed foods. It
4Source :IBEF
Techno Commercial Feasibility Report Strategic Distribution Centre
12 IL&FS Cluster Development Initiatives Limited
has a highly fragmented structure that includes thousands of rice-mills and hullers, flour mills,
pulse mills and oil-seed mills, several thousands of bakeries, traditional food units and fruits,
vegetable and spice processing units in unorganized sector.
Value added segment includes processed fruits and vegetables, juices, jam & jelly, processed
dairy products, value added bakery products, branded edible oil, processed meat & poultry and
confectionary and chocolates etc. The value added segment has around 38 percent share in the
total processed food.
Growth of food processing industry so far has been sub-optimal because of high cost of
production and distribution, lack of competitiveness of Indian products in the global market and
also low level of domestic demand. As per NCAER estimates, food processing grew at a rate of
seven percent during the Ninth Plan. The Ministry of Food Processing Industries estimated that
the industry grew at 18 per cent during 2007-08. Though the domestic demand is now
witnessing an upward trend, it is yet confined to metro and tier I cities. However, with significant
shift in the demographic profile of India and also favourable changes in income and expenditure
pattern of consumers, the food consumption patterns are set to change in favour of processed
food. It is estimated that around 300 mn people from upper and middle class consume processed
food and 200 mn more consumers are estimated to shift to processed food by 2010.
However, the supply side of the food processing sector is not as promising as the demand side of
it. In spite of such large production base, just about two percent of the total fruits and vegetables
produced are processed currently. Supply chain management is a significant priority for food
processing industry. Globally, food processing players like Cargill, Olam and Kraft Foods have
set up the state of the art supply chain and distribution systems which have enabled them to offer
convenience, quality and affordability to their customers across borders. However, in India,
supply chain management activities such as transportation and warehousing have traditionally
been perceived as being low value-added activities which is contrary to other countries where
food processing is highly evolved.
Techno Commercial Feasibility Report Strategic Distribution Centre
13 IL&FS Cluster Development Initiatives Limited
The current structure of the Indian food processing industry itself is a major deterrent for the
growth of the sector. The unorganized sector constitutes for almost two-third of the food
processing units and mostly includes small flour and rice mills, and various small and medium
size units for products like pickles & papads, chutneys, jam, jelly, ketchups, juices etc. However,
this segment suffers from low efficiency due to lack of modern technology, inadequate logistics
and distribution facilities and market linkages for forward distribution and access to credit.
Recently, the sector is gradually seeing the entry of organized players. However, it still accounts
for only 25 percent of the total food processing units.5 The key impediments behind the slow
growth of the size of organized sector has been identified as the lack of processing, storage,
packaging and distribution infrastructure for food items including fresh produce. Lack of such
facilities also results in huge wastages of perishable (including fruits and vegetables) estimated at
about 35 percent, the value of which is a Rs. 33, 000 Crore annually.6 A developed food
processing industry supported by adequate distribution and logistics network would not only
assist to reduce the wastages, but would also fetch increased income to stakeholders including
growers.
As per the estimates by MFPI, India requires an investment of US$ 28 billion to bring the level
of processing to 10-12 per cent by 2012. The Ministry of Food Processing has introduced several
fiscal incentives to strengthen the infrastructure and supply chain integration to promote the food
processing industry. Last but not the least, the food processing sector has immense employment
generation potential. An investment of one million in the food processing sector generates 1.8
direct jobs and 6.4 indirect jobs.
The Vision – 2015 prepared by the Ministry of Food Processing Industries envisages
• increasing processing level of perishables from 6 to 20%,
• increase in value addition from the present level of 20 to 34% and
• increased share in global trade from 1.6 to 3%,
5 FAIDA/MFPI, GoI 6 Working Group Report, XI FYP, MoFPI
Techno Commercial Feasibility Report Strategic Distribution Centre
14 IL&FS Cluster Development Initiatives Limited
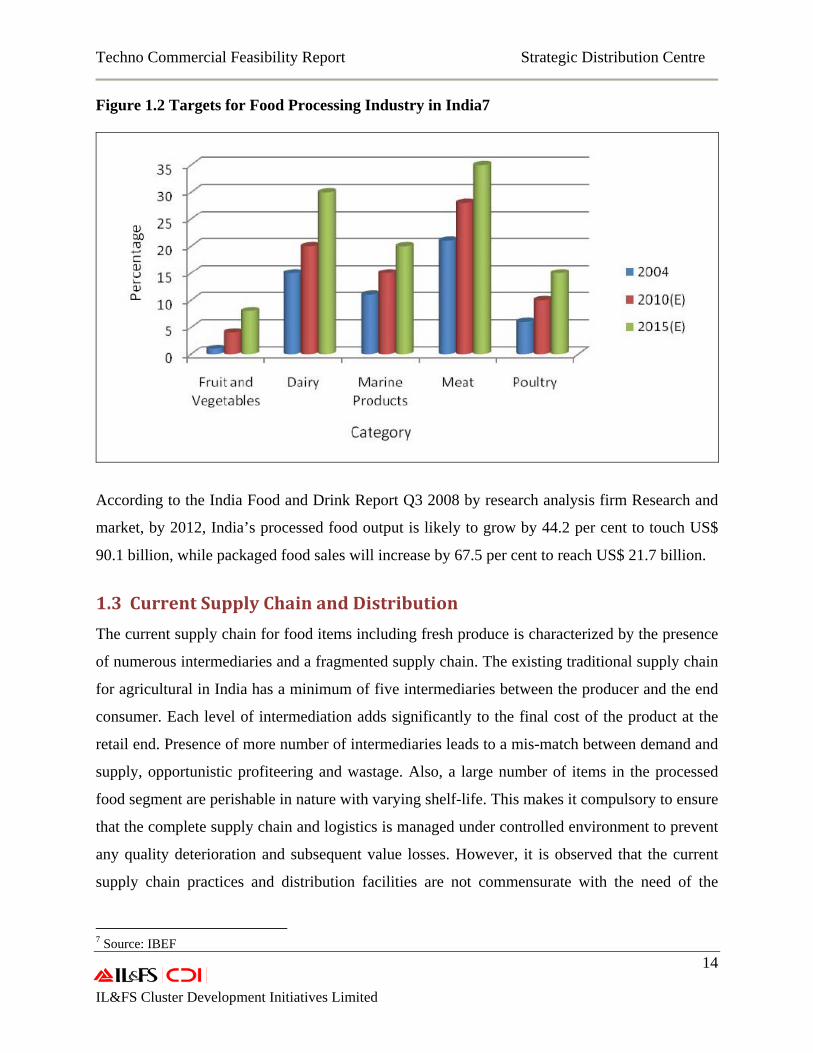
Figure 1.2 Targets for Food Processing Industry in India7
According to the India Food and Drink Report Q3 2008 by research analysis firm Research and
market, by 2012, India’s processed food output is likely to grow by 44.2 per cent to touch US$
90.1 billion, while packaged food sales will increase by 67.5 per cent to reach US$ 21.7 billion.
1.3 Current Supply Chain and Distribution The current supply chain for food items including fresh produce is characterized by the presence
of numerous intermediaries and a fragmented supply chain. The existing traditional supply chain
for agricultural in India has a minimum of five intermediaries between the producer and the end
consumer. Each level of intermediation adds significantly to the final cost of the product at the
retail end. Presence of more number of intermediaries leads to a mis-match between demand and
supply, opportunistic profiteering and wastage. Also, a large number of items in the processed
food segment are perishable in nature with varying shelf-life. This makes it compulsory to ensure
that the complete supply chain and logistics is managed under controlled environment to prevent
any quality deterioration and subsequent value losses. However, it is observed that the current
supply chain practices and distribution facilities are not commensurate with the need of the
7 Source: IBEF
Techno Commercial Feasibility Report Strategic Distribution Centre
15 IL&FS Cluster Development Initiatives Limited
processing industry. The inefficiencies in the system adversely affect the stakeholders’ income
and also make products less competitive.
A recent World Bank Study mentions that the “vastness of India, with large distances between
growing and consuming regions lead to high domestic transportation costs, and high wastage
when commodities are moved, due in large part to poor infrastructure and the lack of cold
storage infrastructure. For example in Apples - the major apple producing areas of the country
are located in the north and northeastern parts of India, and most apple trade happens through
Delhi. Domestically grown apples are much cheaper than foreign apples in markets located near
these regions. However the high cost of transporting and marketing these in the southern and
western regions leads to very high prices in these markets, rendering domestic production
uncompetitive. Apple prices in Chennai are almost 70 per cent higher than those in Delhi.” In
India various studies have estimated wastages at about 35% in case of fruits and vegetables, the
value of which is approximately Rs.33,000 Crore annually
A developed food processing industry would not only reduce the wastages, but would also
increasingly fetch remunerative income to farmers which is another problem before the
agriculture sector at present. A FIICCI –KPMG survey has highlighted some of the long-pending
demands of the industry like income tax exemption of agriculture and farm produce, cold storage
and processing of fruit and vegetables from April 2007 to March 2012. The survey said that
"The setting up of cold chain and other modernised technology for upgrading of storage handling
and transportation should be granted infrastructure status and a 10-year tax holiday should be
provided to it".
1.4 Current Logistics & Warehousing Scenario The market size of Indian logistics sector in 2007 is estimated at US$ 9.75 billion and is growing
at a CAGR of 7 percent. Logistics cost in India is 13 percent of GDP as compared to 11 percent
in Europe and 9 percent in U.S.A. The organized logistics market has a meager 6 percent share
though it is projected to become a US$ 15 billion industry by 2011.8 The higher spending on
warehousing and logistics is largely attributed to inadequate infrastructure facilities throughout
8 GATI-Logistics Industry Report
Techno Commercial Feasibility Report Strategic Distribution Centre
16 IL&FS Cluster Development Initiatives Limited
the country. Warehousing, packaging and transportation accounts for 24 percent of the total
logistics cost, while transportation alone accounts for almost 40 percent.9
The total warehousing capacity in India during 2005-06 is estimated at 81 million MT. Out of
this, the storage for food grains and food products is in the vicinity of about 30-35 million MT of
which Food Corporation of India managed storage capacity is 25.2 million MT (including about
8 million MT hired from CWC and SWCs) while that of CWC is 10.3 million MT. It is estimated
that demand for an additional warehousing capacity will surge to 35 million MT by 2012.
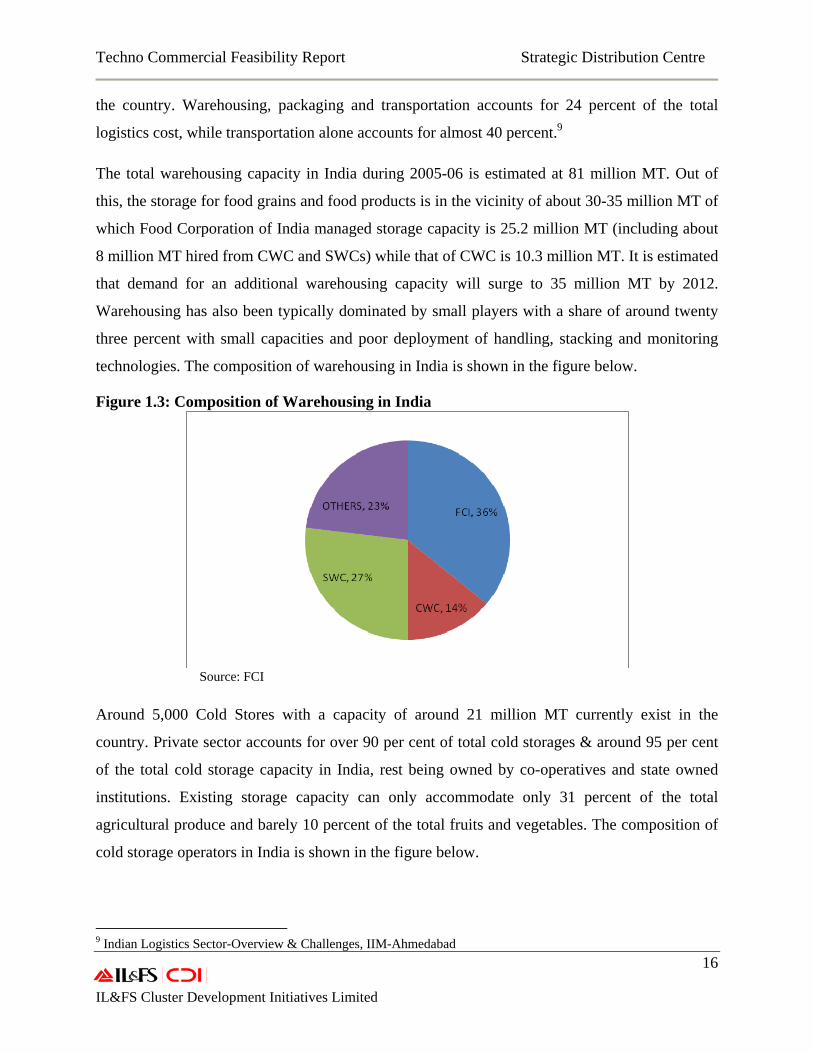
Warehousing has also been typically dominated by small players with a share of around twenty
three percent with small capacities and poor deployment of handling, stacking and monitoring
technologies. The composition of warehousing in India is shown in the figure below.
Figure 1.3: Composition of Warehousing in India
Source: FCI
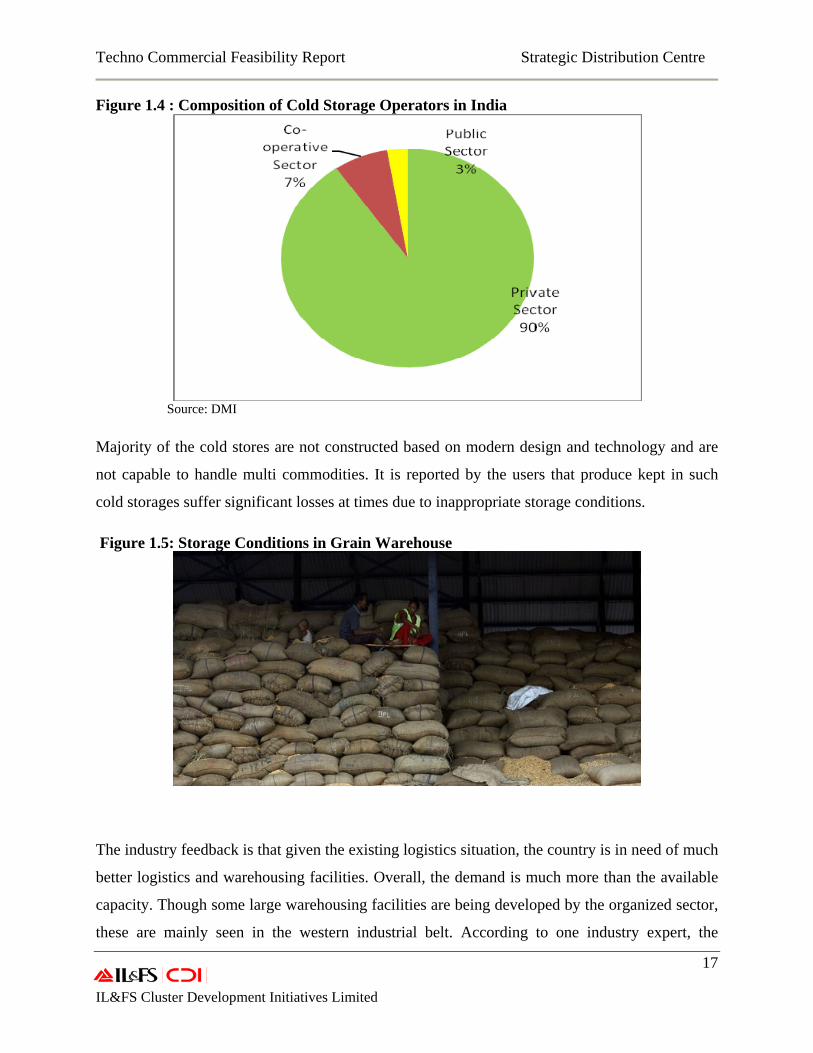
Around 5,000 Cold Stores with a capacity of around 21 million MT currently exist in the
country. Private sector accounts for over 90 per cent of total cold storages & around 95 per cent
of the total cold storage capacity in India, rest being owned by co-operatives and state owned
institutions. Existing storage capacity can only accommodate only 31 percent of the total
agricultural produce and barely 10 percent of the total fruits and vegetables. The composition of
cold storage operators in India is shown in the figure below.
9 Indian Logistics Sector-Overview & Challenges, IIM-Ahmedabad
Techno Commercial Feasibility Report Strategic Distribution Centre
17 IL&FS Cluster Development Initiatives Limited
Figure 1.4 : Composition of Cold Storage Operators in India
Source: DMI
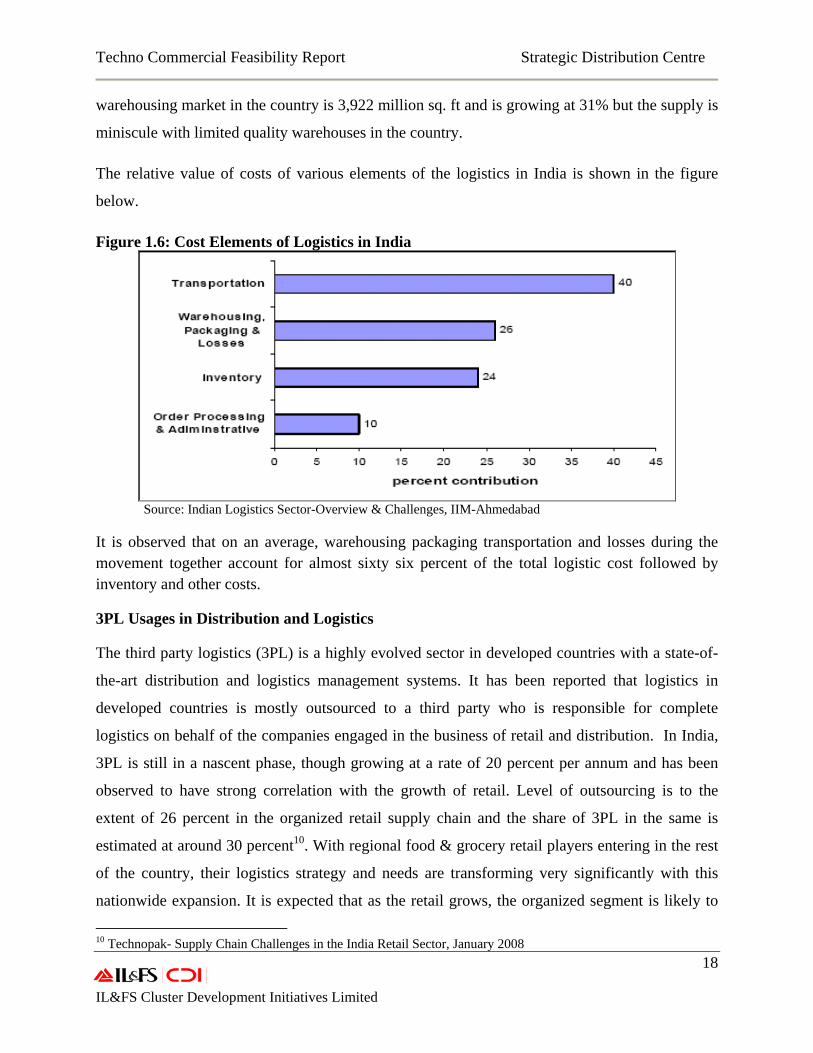
Majority of the cold stores are not constructed based on modern design and technology and are
not capable to handle multi commodities. It is reported by the users that produce kept in such
cold storages suffer significant losses at times due to inappropriate storage conditions.
Figure 1.5: Storage Conditions in Grain Warehouse
The industry feedback is that given the existing logistics situation, the country is in need of much
better logistics and warehousing facilities. Overall, the demand is much more than the available
capacity. Though some large warehousing facilities are being developed by the organized sector,
these are mainly seen in the western industrial belt. According to one industry expert, the
Techno Commercial Feasibility Report Strategic Distribution Centre
18 IL&FS Cluster Development Initiatives Limited
warehousing market in the country is 3,922 million sq. ft and is growing at 31% but the supply is
miniscule with limited quality warehouses in the country.
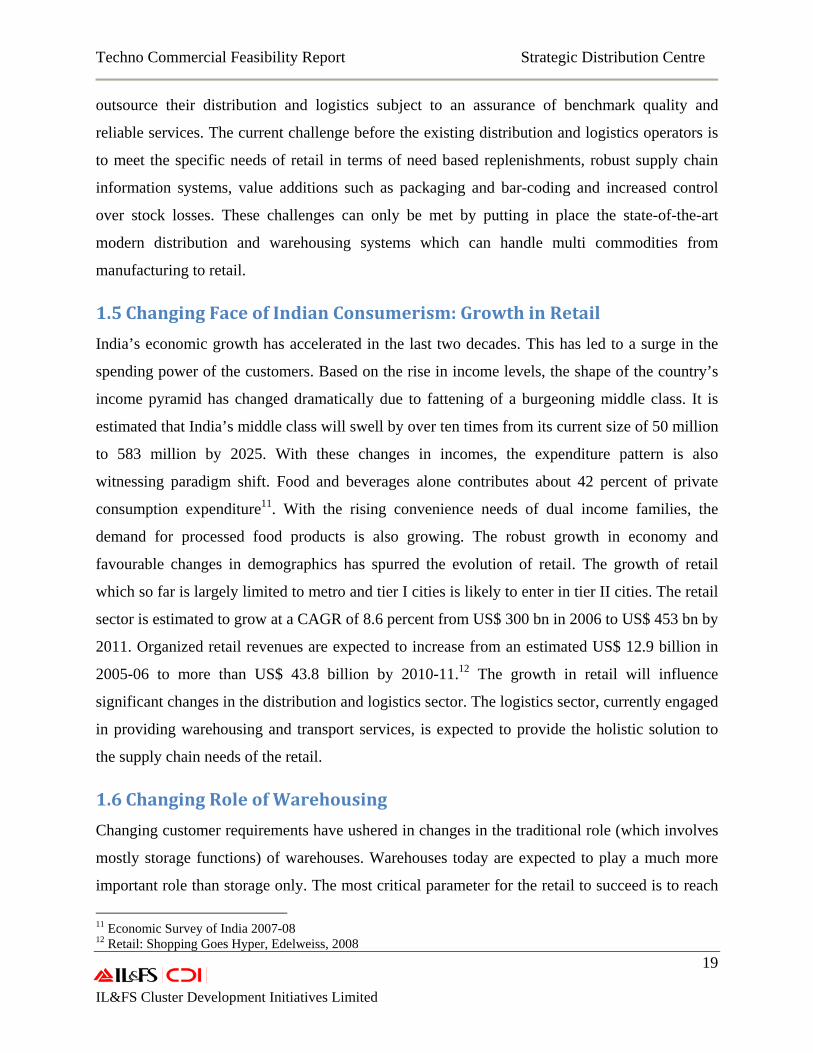
The relative value of costs of various elements of the logistics in India is shown in the figure
below.
Figure 1.6: Cost Elements of Logistics in India
Source: Indian Logistics Sector-Overview & Challenges, IIM-Ahmedabad
It is observed that on an average, warehousing packaging transportation and losses during the movement together account for almost sixty six percent of the total logistic cost followed by inventory and other costs.
3PL Usages in Distribution and Logistics
The third party logistics (3PL) is a highly evolved sector in developed countries with a state-of-
the-art distribution and logistics management systems. It has been reported that logistics in
developed countries is mostly outsourced to a third party who is responsible for complete
logistics on behalf of the companies engaged in the business of retail and distribution. In India,
3PL is still in a nascent phase, though growing at a rate of 20 percent per annum and has been
observed to have strong correlation with the growth of retail. Level of outsourcing is to the
extent of 26 percent in the organized retail supply chain and the share of 3PL in the same is
estimated at around 30 percent10. With regional food & grocery retail players entering in the rest
of the country, their logistics strategy and needs are transforming very significantly with this
nationwide expansion. It is expected that as the retail grows, the organized segment is likely to
10 Technopak- Supply Chain Challenges in the India Retail Sector, January 2008
Techno Commercial Feasibility Report Strategic Distribution Centre
19 IL&FS Cluster Development Initiatives Limited
outsource their distribution and logistics subject to an assurance of benchmark quality and
reliable services. The current challenge before the existing distribution and logistics operators is
to meet the specific needs of retail in terms of need based replenishments, robust supply chain
information systems, value additions such as packaging and bar-coding and increased control
over stock losses. These challenges can only be met by putting in place the state-of-the-art
modern distribution and warehousing systems which can handle multi commodities from
manufacturing to retail.
1.5 Changing Face of Indian Consumerism: Growth in Retail India’s economic growth has accelerated in the last two decades. This has led to a surge in the
spending power of the customers. Based on the rise in income levels, the shape of the country’s
income pyramid has changed dramatically due to fattening of a burgeoning middle class. It is
estimated that India’s middle class will swell by over ten times from its current size of 50 million
to 583 million by 2025. With these changes in incomes, the expenditure pattern is also
witnessing paradigm shift. Food and beverages alone contributes about 42 percent of private
consumption expenditure11. With the rising convenience needs of dual income families, the
demand for processed food products is also growing. The robust growth in economy and
favourable changes in demographics has spurred the evolution of retail. The growth of retail
which so far is largely limited to metro and tier I cities is likely to enter in tier II cities. The retail
sector is estimated to grow at a CAGR of 8.6 percent from US$ 300 bn in 2006 to US$ 453 bn by
2011. Organized retail revenues are expected to increase from an estimated US$ 12.9 billion in
2005-06 to more than US$ 43.8 billion by 2010-11.12 The growth in retail will influence
significant changes in the distribution and logistics sector. The logistics sector, currently engaged
in providing warehousing and transport services, is expected to provide the holistic solution to
the supply chain needs of the retail.
1.6 Changing Role of Warehousing Changing customer requirements have ushered in changes in the traditional role (which involves
mostly storage functions) of warehouses. Warehouses today are expected to play a much more
important role than storage only. The most critical parameter for the retail to succeed is to reach
11 Economic Survey of India 2007-08 12 Retail: Shopping Goes Hyper, Edelweiss, 2008
Techno Commercial Feasibility Report Strategic Distribution Centre
20 IL&FS Cluster Development Initiatives Limited
as far as possible. With the expected increase in retail penetration, adequate warehousing and
logistics support needs are likely to increase manifold. Some of the important facilities that the
warehouses are expected to provide are:
• Customized storage for products having different storage requirements (for example
different temperature zones for fresh produce and staples, etc.) for reducing wastage:
With the increase in the number of products being handled by the warehouses and
increasing stringency in quality parameters, warehouses are expected to provide
suitable storage facilities for different product segments.
• Processing activities such as sorting, grading, ripening, irradiation, etc for value
addition: Retailers these days are catering to multiple segments of customers
requiring different products. Modern warehouses which are being seen as the nearest
point for retail are expected to provide facilities which can segregate the products to
meet requirements of multiple customer segments. Bulk Handling Facilities: Modern
warehouses are expected to act as a point of consolidation. Also as a point of supply
for the food processors/retailers they are required to maintain certain level of safety
stock. This requires bulk handling facilities within the warehouses as an intermediate
process
• Further value addition in the form of packaging, bar-coding, etc: Warehouses are
expected to perform activities such as final packaging, bar coding etc. This is because
the tendency of manufacturers/food processors to postpone the product differentiation
to a point which is much closer to the retail point. The manufacturers are viewing this
postponement as an effort to meet the requirements of more number of consumers
Techno Commercial Feasibility Report Strategic Distribution Centre
21 IL&FS Cluster Development Initiatives Limited
Growth in retail sector and agro–processing industries has multiplied the need for this sort of
modern warehousing cum distribution centers.
While emphasis is being given to the supply side of the distribution chain the other aspect of the
distribution chain i.e. creation of demand is being neglected. The absence of an organized
distribution chain is hampering the growth of the food processing industry in India as distribution
is not being seen as a force to create more demand. Absence of an efficient distribution system is
acting as a bottleneck in creating large scale demand for the value added processed food items.
This is also limiting the export potential for Indian processed food items. A modern warehousing
cum distribution center helps the food processors, mainly, in overcoming this bottleneck. More
specifically it can perform the following functions
• Creating more retail visibility for the food items
• Increasing handling efficiency for catering the needs of export market
It may also help the processors in sourcing raw material for their units. The demand side
functions that a modern warehousing cum distribution center can perform are detailed below:
Retail Visibility: Production and distribution are interdependent and grow together. Due to
decentralized distribution system of food items including that of processed foods the landed cost
of items at the point of retail is increasing which in turn is reducing the willingness of the
retailers to store a variety of products subsequently affecting the off-take of the products. On the
other hand the food processors are not investing in large scale production as they don’t see the
retail space for their products.
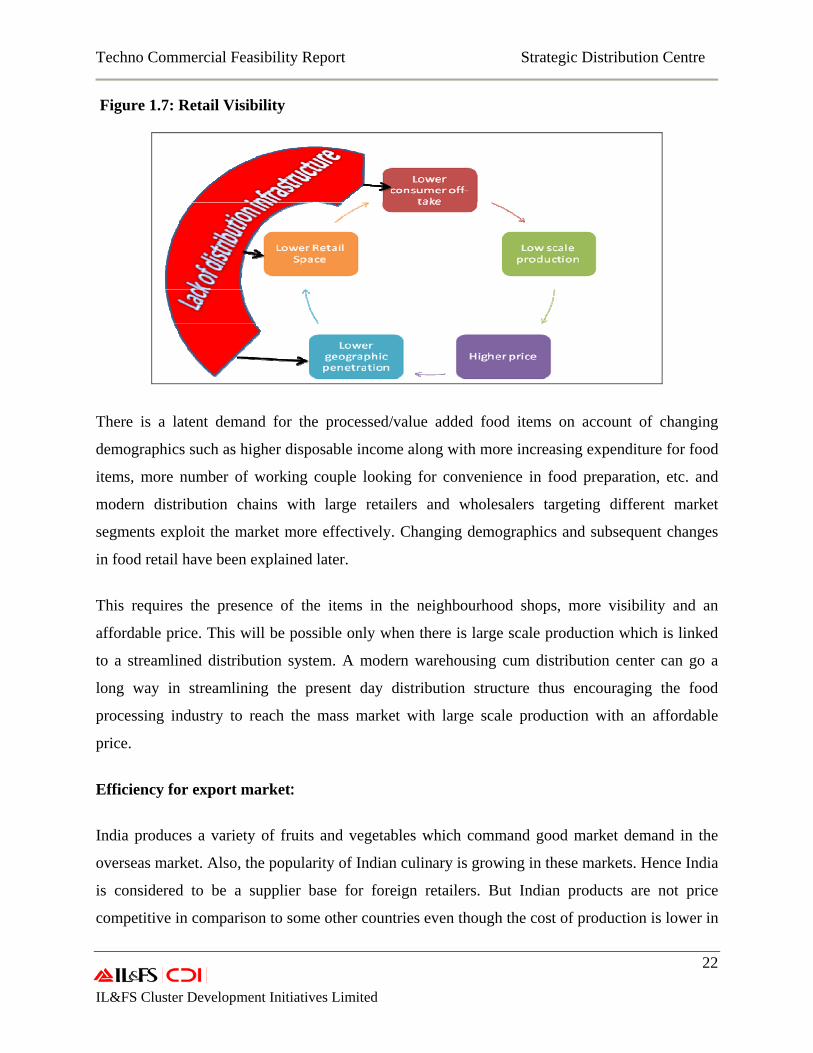
Small scale production of processed/value added food items is increasing the cost of the
production and subsequently affecting the price of the product. All these are leading to a scenario
of small scale production, lesser retail space confined to a very small geographical area and a
cost which is not affordable by the masses. The scenario, pictorially, is depicted below.
Techno Commercial Feasibility Report Strategic Distribution Centre
22 IL&FS Cluster Development Initiatives Limited
Figure 1.7: Retail Visibility
There is a latent demand for the processed/value added food items on account of changing
demographics such as higher disposable income along with more increasing expenditure for food
items, more number of working couple looking for convenience in food preparation, etc. and
modern distribution chains with large retailers and wholesalers targeting different market
segments exploit the market more effectively. Changing demographics and subsequent changes
in food retail have been explained later.
This requires the presence of the items in the neighbourhood shops, more visibility and an
affordable price. This will be possible only when there is large scale production which is linked
to a streamlined distribution system. A modern warehousing cum distribution center can go a
long way in streamlining the present day distribution structure thus encouraging the food
processing industry to reach the mass market with large scale production with an affordable
price.
Efficiency for export market:
India produces a variety of fruits and vegetables which command good market demand in the
overseas market. Also, the popularity of Indian culinary is growing in these markets. Hence India
is considered to be a supplier base for foreign retailers. But Indian products are not price
competitive in comparison to some other countries even though the cost of production is lower in
Techno Commercial Feasibility Report Strategic Distribution Centre
23 IL&FS Cluster Development Initiatives Limited
India. This is mainly attributed to the suppliers and the distribution channels which are small and
unorganized and have in-built inefficiency.
Source: Study conducted by MoFPI, GoI
To cater to the export market the distribution chain must be able to handle volumes and be able
to maintain stringent quality parameters throughout the chain. Most of the issues mentioned
above in the box can be addressed by a modern warehousing cum distribution center. The center
can handle large volumes of a number of items thus giving the importer a scope to choose his
product. It can maintain stringent quality parameters through in-house infrastructure. It can act as
an intermediate infrastructure between farm gate and import point through provision of storage
and other primary processing facilities. Above all it may re-define the supply chain and use
information technology to improve the overall efficiency of the existing supply chain. In short, it
will help the food processors in reaching out to the export market.
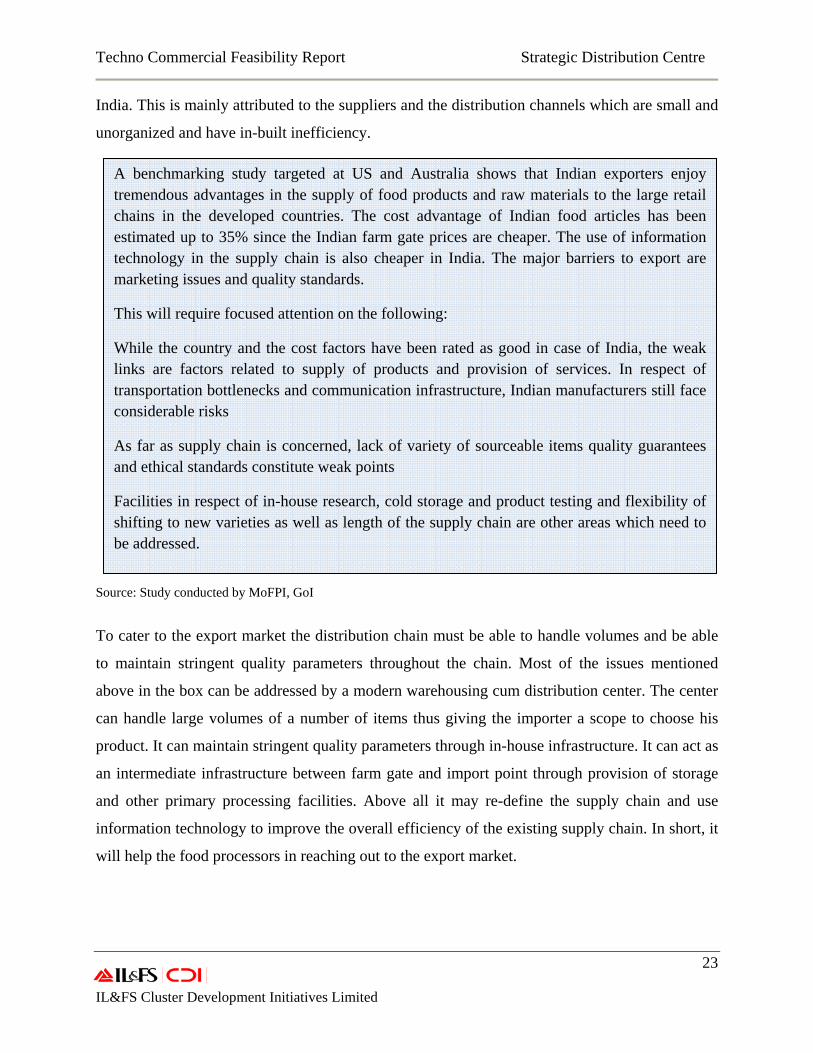
A benchmarking study targeted at US and Australia shows that Indian exporters enjoy tremendous advantages in the supply of food products and raw materials to the large retail chains in the developed countries. The cost advantage of Indian food articles has been estimated up to 35% since the Indian farm gate prices are cheaper. The use of information technology in the supply chain is also cheaper in India. The major barriers to export are marketing issues and quality standards.
This will require focused attention on the following:
While the country and the cost factors have been rated as good in case of India, the weak links are factors related to supply of products and provision of services. In respect of transportation bottlenecks and communication infrastructure, Indian manufacturers still face considerable risks
As far as supply chain is concerned, lack of variety of sourceable items quality guarantees and ethical standards constitute weak points
Facilities in respect of in-house research, cold storage and product testing and flexibility of shifting to new varieties as well as length of the supply chain are other areas which need to be addressed.
Techno Commercial Feasibility Report Strategic Distribution Centre
24 IL&FS Cluster Development Initiatives Limited
Raw Material Handling Facility:
The modern warehousing cum distribution center is also expected to deal with fresh fruits and
vegetables for catering to the needs of the fresh market segment. While the produce fit for fresh
segment can directly go to the retail markets, processors can source the rest of the produce fit for
processing
Thus in the changing scenario a modern warehousing cum distribution center is expected to cut
down the costs involved in procurement and distribution besides improving efficiency of the
distribution chain. A modern warehousing cum distribution center is seen as a marketing
infrastructure that would support agricultural growth as well as growth of the processed food
market.
Through these functions a modern warehousing cum distribution center is expected to overcome
following inefficiencies:
Higher cost of sales and distribution
Distribution and marketing is a huge cost in Indian consumer markets leading to overall
inefficiency. Various studies and reports have pointed out that in the current context in Indian
markets; distribution remains the biggest challenge in the supply chain of food items. High
logistics costs and higher level of inventories, which are to be maintained due to the nature (such
as seasonality and shelf life) of the products involved is increasing the final price of the products
thus reducing the consumer benefit. However, this higher price is not resulting in better price
realization for producers due to overall in-efficiency in the supply chain. This is also hampering
the overall growth of food market. A modern warehousing cum distribution center in place may
help to improve the current status of food supply chain.
Frequent stock outs
One of the major challenges in distribution is that demand changes quickly, but supply takes
longer to change. Surges in demand strain the capacity of supply chain and distribution,
compelling it to handle much more throughput than its capacity. Traditional distribution systems
have not been able to reduce these problems due to the lack of capacity in consolidating the
Techno Commercial Feasibility Report Strategic Distribution Centre
25 IL&FS Cluster Development Initiatives Limited
produce. This results in frequent stock outs for the retailers. The stock-out levels among Indian
retailers is in the range of 10 to 15 percent.13 The cost of these stock-outs is very high for the
retailers especially in the case of organized retailers. This also results in price fluctuations in
consumer price as there is a mismatch between the supply and demand of food products. This
has necessitated the establishment of modern warehousing cum distribution centers nearer to
consumption markets.
1.7 Mega Food Parks Ministry of Food Processing has launched the scheme to set up thirty Mega Food Parks (MFP) at
various locations across the country under 11th Five Year Plan. Ten of the proposed thirty MFPs
are likely to become operational in next 2-3 years. Such parks, once in place, are expected to
spur food processing in the country. Finished products from the MFPs will need to be supported
by strategic distribution networks before reaching out to the end customers. Most of such
processed products shall require an ambient condition for storage and appropriate handling
facility during warehousing. In addition to the Mega Food Park Scheme, there are other
initiatives such as the integrated cold chain, initiatives by the State Governments to promote food
processing industry, etc. which are expected to generate demand for specialized storage facilities
and the distribution network specific to food products in the country.
The distribution centres will act as hubs for distribution of food products for the domestic retail
segment including super markets as well as for exports of processed foods. The Ministry of Food
Processing Industries (MoFPI) proposes to facilitate the establishment of Strategic Distribution
Centres (SDCs) which will form the nerve centres of the various supply chain networks
including cold chain networks supporting the Mega Food Parks which are to be set up in the
country under the 11th five year plan scheme.
Since such Distribution Centres do not exist in the country, the MoFPI has commissioned a study
to explore the feasibility of setting up a SDC in the country (Scope of Work in the Annexure I).
13 IL&FS CDI Field study
Techno Commercial Feasibility Report Strategic Distribution Centre
26 IL&FS Cluster Development Initiatives Limited
2. Objective and Methodology
The techno-commercial feasibility study of a Strategic Distribution Center (SDC) involves
detailed conceptualization of market, geographic and demographic conditions along with the
supply chain solutions and costs, a detailed location analysis, adoption of a scientific method to
arrive at the design and layout and detailed financial analysis.
2.1 Objective
The broad objective of the assignment is
“To assess the techno-commercial feasibility of a Strategic Distribution Center (SDC”
Specific objectives of this techno-commercial feasibility study are as follows:
• To find out a potential location (city) for a pilot SDC • To identify suitable sites where SDC can be established • To study the existing supply chain and its inefficiencies in the catchment areas of the
SDC • To analyze the existing infrastructure and related gaps in the SDC location • To suggest facilities that can be provided through SDC • To estimate the throughput that can be handled by the SDC • To develop a scientific design and layout for the SDC • To suggest scientific operational processes in the SDC • To suggest viable business models for the SDCs in consultation with the stakeholders • To analyze the financial viability of the SDC
2.2 Methodology
The following methodology is being adopted to establish the techno-commercial feasibility of a
Strategic Distribution Center (SDC):
Conceptualization
Intensive one-to-one discussions were carried out with a number of organized retailers,
wholesalers, exporters and other industry representatives and Government officials to develop a
Techno Commercial Feasibility Report Strategic Distribution Centre
27 IL&FS Cluster Development Initiatives Limited
detailed concept of the SDC. This was aimed at understanding the requirement of the industry
and also their views on the need for the SDC.
Location analysis
After conceptualizing the SDC the next task was to find out a suitable location for the pilot
facility. Demographic, socio-economic and market related information was gathered for major
cities of India through intensive secondary research. Cities were compared with respect to the
above-mentioned parameters to arrive at the two most suitable locations for the SDC.
An intensive field based study was carried out to choose the best among the two. The field based
study included components such as assessment of the food market, estimate of throughput,
assessment of infrastructure, etc. Details of the location analysis are provided in Chapter-5.
Assessment of the supply chain and estimation of throughput
An assessment of the supply chain was carried out in the catchment area of the SDC to find out
supply chain and inventory management related gaps. A major aim of the assessment was to
finalize the facilities to be provided in the SDC.
Similarly an estimate of marketed food items in the SDC location was undertaken to arrive at the
capacities of the SDC and its facilities. This was also helpful in developing the design and layout
of the pilot SDC.
Site selection
An analysis of the infrastructure in and around the potential SDC location was undertaken to
arrive at a couple of the most suitable sites for the SDC. Infrastructures such as road, railway
network, availability of power and water, etc were assessed during this process.
Other issues such as availability of labour, traffic congestion, ease with which local retailers can
access the SDC were also analyzed in detail. Availability and cost of land was also taken into
consideration while selecting potential sites.
Developing design and layout
After estimating the throughput that the SDC can handle per day and assessing the nature of the
goods, a scientific design of the SDC was developed. Details of the design, its underlying
principles and layout of the SDC is given in Chapter-7
Techno Commercial Feasibility Report Strategic Distribution Centre
28 IL&FS Cluster Development Initiatives Limited
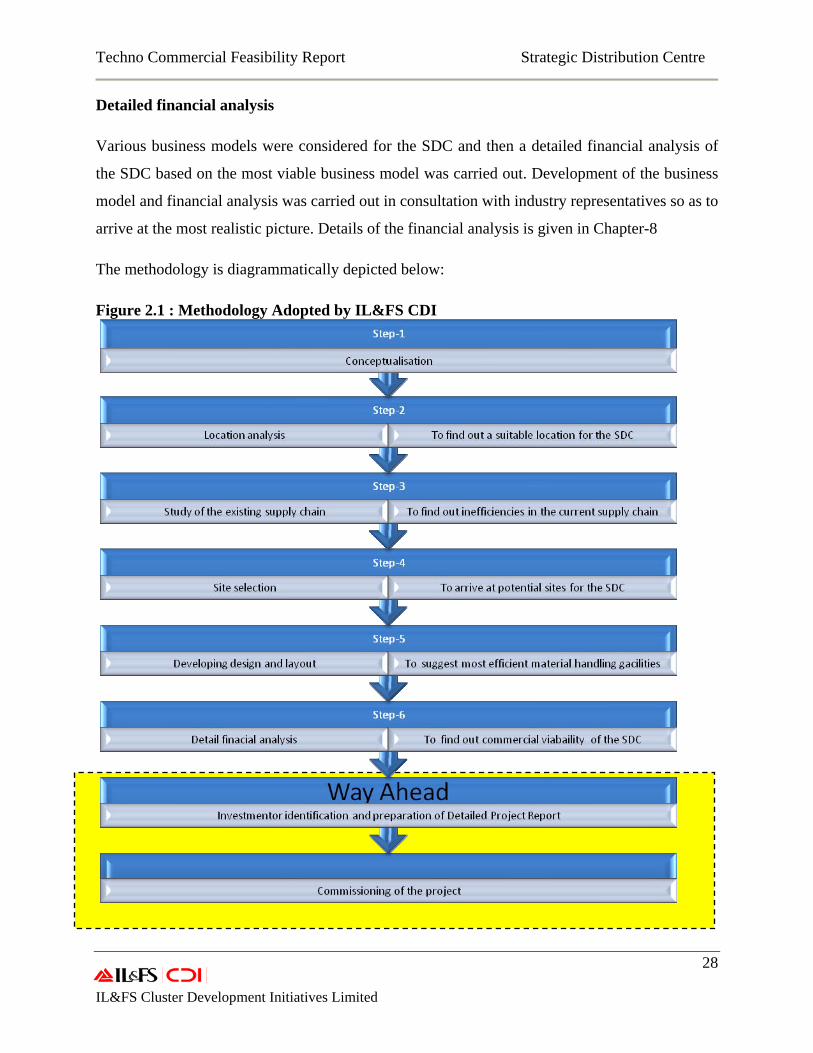
Detailed financial analysis
Various business models were considered for the SDC and then a detailed financial analysis of
the SDC based on the most viable business model was carried out. Development of the business
model and financial analysis was carried out in consultation with industry representatives so as to
arrive at the most realistic picture. Details of the financial analysis is given in Chapter-8
The methodology is diagrammatically depicted below:
Figure 2.1 : Methodology Adopted by IL&FS CDI
Techno Commercial Feasibility Report Strategic Distribution Centre
29 IL&FS Cluster Development Initiatives Limited
3. Modern Distribution Infrastructure: Indian Scenario
There has been a significant favourable shift of several demographic and economic factors in
India over the last decade. A strong 9 percent GDP growth, backed by changing consumer
behaviour in favour of increased discretionary spend, has set the stage for a handsome 8.6
percent growth in the retail space over 2007-10. It has, in addition, also called for a demand for
a paradigm shift in the Indian food distribution and logistics which will be quite different from
the current food supply chain in India, which is highly fragmented and characterized by the
presence of multiple intermediaries leading to low value realization and high wastages. The
produce is subjected to multiple handling which leads to quality deterioration and low
acceptance in the consumer market. This is further aggravated by the lack of appropriate
storage, distribution network and logistics.
3.1 Introduction
Current Indian Economy
India is the world 4th largest economy on purchasing power parity basis. India’s GDP for 2006-
07 is estimated to be US$ one trillion. At the moment India is the second fastest growing major
economy in the world, with a GDP growth rate of about 9 percent in 2006–2007.14
The economic development has significantly paced up during the last five years between 2002
and 2007. The rate of growth in per capita income as measured by per capita GDP at market
prices (constant 1999-2000 prices) grew by an annual average rate of 3.1 per cent during 1980-
81 to 1991-92. It accelerated marginally to 3.7 per cent per annum during the next 11 years
from1992-93 to 2002-03. Since then, there has been a sharp acceleration in the growth of per
capita income, almost doubling to an average of 7.2 per cent per annum (2003-04 to 2007-08).
This means that average income has doubled in a decade instead of after a generation. The
growth rate of per capita income in 2007-08 is projected to be 7.2 per cent, the same as the
14 The Economy Assessment and Prospects, RBI, August, 2008
Techno Commercial Feasibility Report Strategic Distribution Centre
30 IL&FS Cluster Development Initiatives Limited
average of the five years to the current year. Per capita private final consumption expenditure
(PFCE) has also increased in line with per capita income. The growth in PFCE has almost
doubled to 5.1 per cent per year during the subsequent five years from 2003-04 to 2007-08, with
the current year’s growth expected to be 5.3 per cent, marginally higher than the five year
average.15
With rising income levels, household consumption has increased manifold, with the emergence
of a redefined middle class. Growth in service sector has been the driving factor behind this. The
country is on the brink of becoming an economic powerhouse and gaining huge attention by
global players as an excellent investment destination.
High economic growth has led to increased disposable income for the Indian middle class, which
currently comprises of 22 percent of population and estimated to reach 32 percent by 2010.
Accordingly, disposable incomes are set to rise at an average of 8.5 percent by 2015.16 Indians
with an ability to spend over US$ 30, 000 per annum on PPP basis accounts for around 3 percent
of the country’s total population and amounts to 20 million people17.
Consumption and Spending Patterns
India possesses the advantage of having a large young population. It is estimated that around 35
percent of India’s population is under 14 years of age and more than 60 percent of the population
is estimated to constitute the working age group.18 Two-third of the population is under 35 years,
with a median age of 24 years, as opposed to USA, China and Japan with median ages of 35, 30
and 41 years respectively. The large population of working age group forms a wide consumer
base.19
Rapidly changing demographic profiles and increased disposable income are changing the face
of Indian consumers. The swelling middle class is redefining the consuming pattern with a shift
towards branded products. With the country’s income pyramid changing rapidly, a definite shift
is observed from saving to spending attitude. The middle class is estimated to reach a size of 582
15 Economic Survey of India, 2007-08 16 Ernst & Young Research, 2008 17 Mckinsey Research, 2007 18 Retail: Market and Opportunities, A report by Ernst & Young, 2008 19 Retail: Shopping Goes Hyper, Edelweiss, 2008
Techno Commercial Feasibility Report Strategic Distribution Centre
31 IL&FS Cluster Development Initiatives Limited
million from its current size of 50 million by 201520. Discretionary spending has seen 16 percent
rise for the urban upper and middle classes and the number of high income households has
grown by 20 percent year-on-year since 1995-96.21 The self employed segment of the population
has also grown significantly.
The number of working women, as a percentage of the total female population, has risen from 15
percent in 1991 to close to 25 percent in 2005. This has resulted in growing disposable income,
which in turn, leads to increasing spend on convenience food and grocery items.
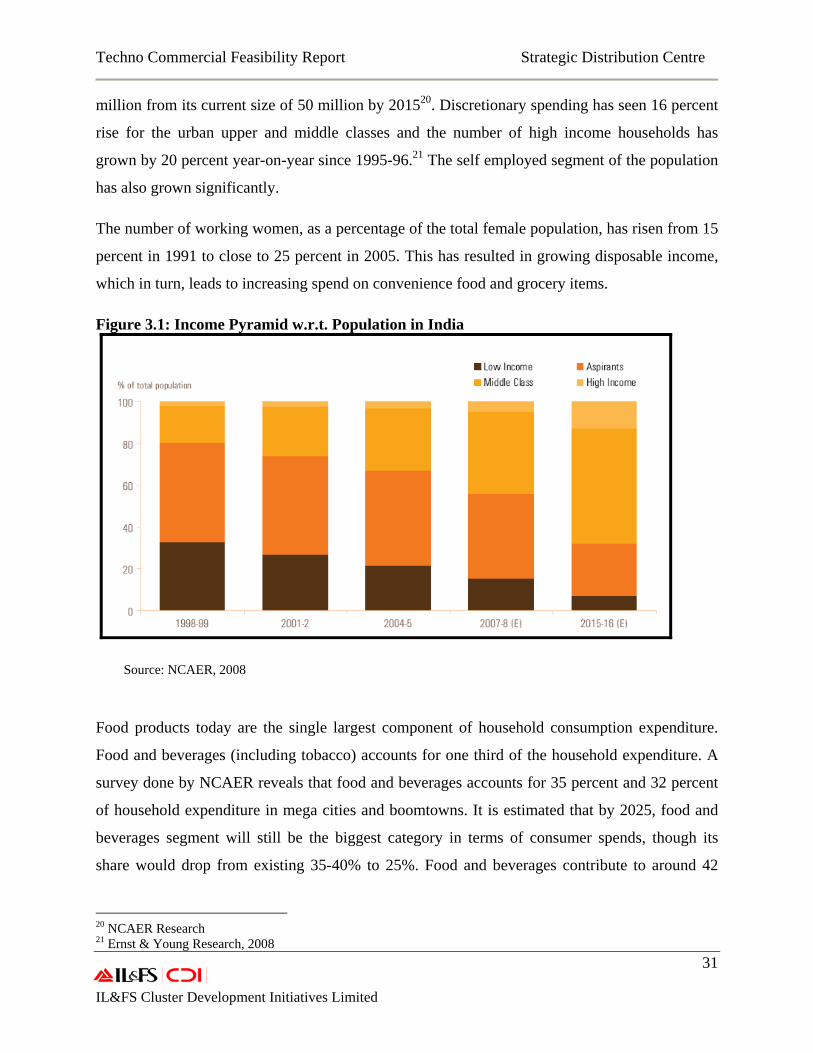
Figure 3.1: Income Pyramid w.r.t. Population in India
Source: NCAER, 2008
Food products today are the single largest component of household consumption expenditure.
Food and beverages (including tobacco) accounts for one third of the household expenditure. A
survey done by NCAER reveals that food and beverages accounts for 35 percent and 32 percent
of household expenditure in mega cities and boomtowns. It is estimated that by 2025, food and
beverages segment will still be the biggest category in terms of consumer spends, though its
share would drop from existing 35-40% to 25%. Food and beverages contribute to around 42
20 NCAER Research 21 Ernst & Young Research, 2008
Techno Commercial Feasibility Report Strategic Distribution Centre
32 IL&FS Cluster Development Initiatives Limited
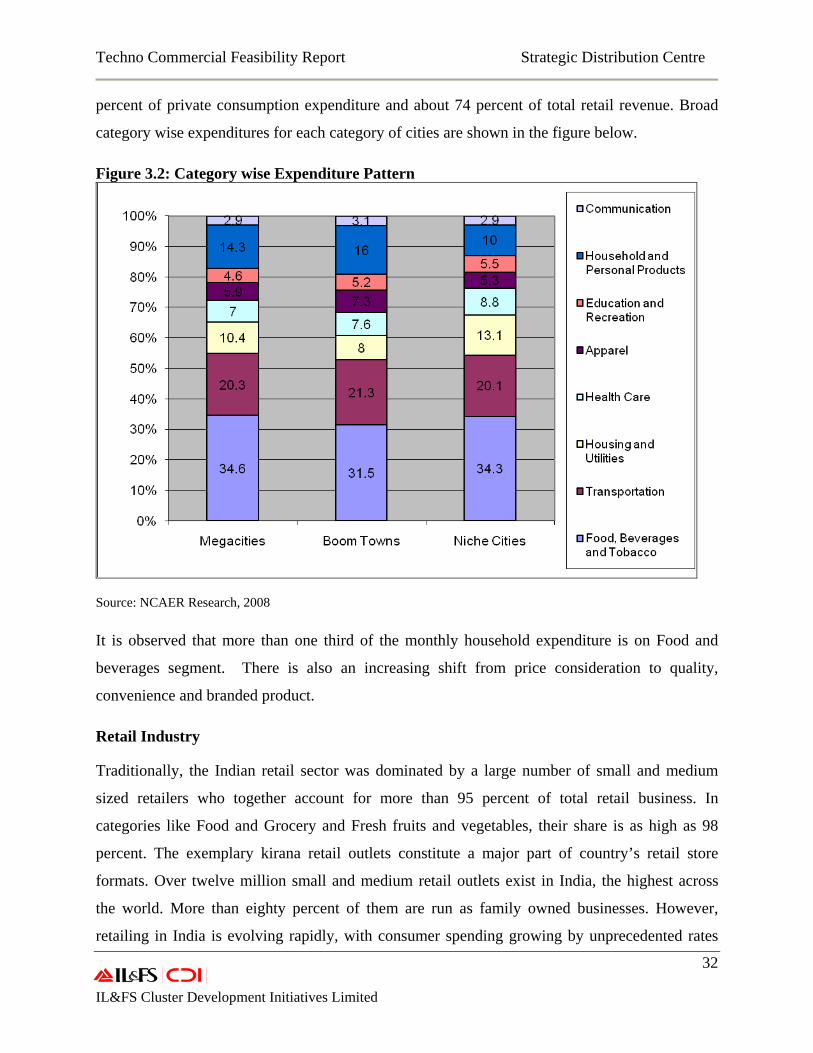
percent of private consumption expenditure and about 74 percent of total retail revenue. Broad
category wise expenditures for each category of cities are shown in the figure below.
Figure 3.2: Category wise Expenditure Pattern
Source: NCAER Research, 2008
It is observed that more than one third of the monthly household expenditure is on Food and
beverages segment. There is also an increasing shift from price consideration to quality,
convenience and branded product.
Retail Industry
Traditionally, the Indian retail sector was dominated by a large number of small and medium
sized retailers who together account for more than 95 percent of total retail business. In
categories like Food and Grocery and Fresh fruits and vegetables, their share is as high as 98
percent. The exemplary kirana retail outlets constitute a major part of country’s retail store
formats. Over twelve million small and medium retail outlets exist in India, the highest across
the world. More than eighty percent of them are run as family owned businesses. However,
retailing in India is evolving rapidly, with consumer spending growing by unprecedented rates
Techno Commercial Feasibility Report Strategic Distribution Centre
33 IL&FS Cluster Development Initiatives Limited
and with increasing number of domestic and global companies investing in this sector. These
players have been defined under the organized retail segment within the retail sector. The size of
Indian Retail Industry was estimated at US$ 311.7 billion in 2006, accounting for almost 39
percent of GDP. In 2006, organized retail stood at US$ 12.9 billion, implying a share of 4% of
the total retail revenue.22
Organized retail in India is currently undergoing a metamorphosis and is expected to scale up to
meet global standards in the next five years. The sector is rapidly evolving due to significant
shift in factors ranging from demographics to economics to social. Led by the rising purchasing
power, changing consumption patterns, increased access to information and communication
technology and improving infrastructure, the retail market is all set to observe a sea change at
both back as well as the front end. The most significant period of growth was recorded during
2000 to 2006, when the sector revenues increased by about 93.5 percent translating to CAGR of
13.3 percent. Organized retail revenues are expected to increase from an estimated US$ 12.9
billion in 2005-06 to more than US$ 43.8 billion by 2009-10.23
Though the retail market has been dominated by unorganized players and depicts rural biasness,
the entry of domestic and international organized players is set to change the scenario. The share
of organized retail, currently at only 4 percent, is expected to reach to a market share of 10
percent by 2010. Apart from increasing presence in metro and tier I cities, organized retail is also
looking at tier II cities to scale up their operations. Today, top eight cities (four metros, Pune,
Ahmedabad, Bangalore and Hyderabad) together account for almost 80 percent of the total
organized retail. This is also the reason behind almost all the players strongly focusing on these
cities for scaling up the business. Further to this, the tier II cities are also poised to contribute
significantly to future expansion plans of the organized retail.
Food Retail
Food Retail industry in India is currently estimated at US$ 161.7 billion and it has grown at a
CAGR of 3.96% between 2000 and 2005.24 Within this, organized food retail grew from US$
391 million in 2002 to US$ 1, 624 million in 2007 with a CAGR of about 33 percent. The
22 Retail-Market & Opportunity 2008, A report by Ernst & Young 23 Retail: Shopping Goes Hyper, Edelweiss, 2008 24 Industry Insight-Indian Food Retailing, Cygnus, 2008
Techno Commercial Feasibility Report Strategic Distribution Centre
34 IL&FS Cluster Development Initiatives Limited
organized segment, though small at present, is growing fast. Food production is expected to
double in the next ten years and the consumption of value added food products is expected to
grow at a much faster pace.
Food retail in India is primarily characterized by different type of products retailed rather than
different retail formats in operation. The food and beverages segment alone accounts for the
largest share of revenue of the total retail market, followed by apparels and clothing. This
category has the highest consumer demand across all income levels, consumer groups and
various retail formats. According to Edelweiss and Mckinsey Research, it is estimated that food
market size will reach US$ 334 billion by 2025 with a CAGR of around 4 percent.
Out of the total retail revenue of US$ 311 billion in 2006, food and beverages contribute US$
231 billion, which forms about 74 % of the total revenue. Retail sector revenue is estimated to
reach US$ 460.6 billion by 2010-11 with the organized retail projected revenue of US$ 43.8
billion25. It is envisaged that modern retail will adapt and absorb some of the traditional formats
in subsequent years. Also, with the rural retail constituting the largest share of total retail
revenues, the existing players are now looking at rural market to tap the opportunity. A few
players like ITC Limited, Godrej and DSCL have already started the venture under the brand
name of Choupal Sagaar, Aadhaar and Hariyali Kisaan Bazaar respectively.
3.2 Analysis of Existing Value/Supply Chain
One of the most serious challenges faced by the retail sector (both traditional and organized) is to
overcome the constraints of current supply chain and logistics system. In India, about 60 percent
of food quality is lost in the supply chain from the farm to the final consumer. 35 to 40 percent of
the total production of fresh fruits and vegetables is wasted in India. Consumers actually end up
paying approximately about 35 percent more because of wastage as well as multiple intermediate
handling in the current supply chain.26 The farmer in India gets around 30 percent of what the
consumer pays at the retail store. One of the most critical challenges in the retail sector in India
is poor supply chain and logistics management. The importance can be understood by the fact
that the logistics management cost component in India is as high as 7 -10 percent against the
global average of 4-5 percent of the total retail price. 25 Retail: Market and Opportunities, A report by Ernst & Young, 2008 26 Vision 2015, MoFPI, 2007
Techno Commercial Feasibility Report Strategic Distribution Centre
35 IL&FS Cluster Development Initiatives Limited
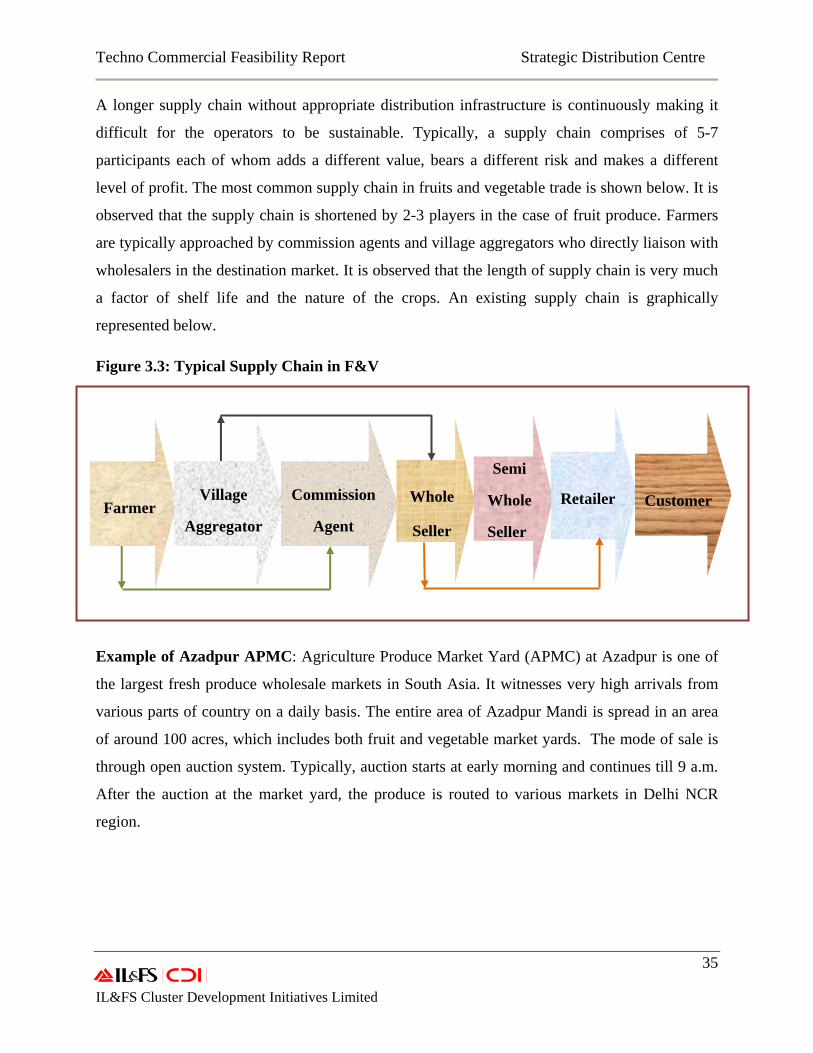
A longer supply chain without appropriate distribution infrastructure is continuously making it
difficult for the operators to be sustainable. Typically, a supply chain comprises of 5-7
participants each of whom adds a different value, bears a different risk and makes a different
level of profit. The most common supply chain in fruits and vegetable trade is shown below. It is
observed that the supply chain is shortened by 2-3 players in the case of fruit produce. Farmers
are typically approached by commission agents and village aggregators who directly liaison with
wholesalers in the destination market. It is observed that the length of supply chain is very much
a factor of shelf life and the nature of the crops. An existing supply chain is graphically
represented below.
Figure 3.3: Typical Supply Chain in F&V
Example of Azadpur APMC: Agriculture Produce Market Yard (APMC) at Azadpur is one of
the largest fresh produce wholesale markets in South Asia. It witnesses very high arrivals from
various parts of country on a daily basis. The entire area of Azadpur Mandi is spread in an area
of around 100 acres, which includes both fruit and vegetable market yards. The mode of sale is
through open auction system. Typically, auction starts at early morning and continues till 9 a.m.
After the auction at the market yard, the produce is routed to various markets in Delhi NCR
region.
Farmer
Village
Aggregator
Commission
Agent
Whole
Seller
Semi
Whole
Seller
Retailer
Customer
Techno Commercial Feasibility Report Strategic Distribution Centre
36 IL&FS Cluster Development Initiatives Limited
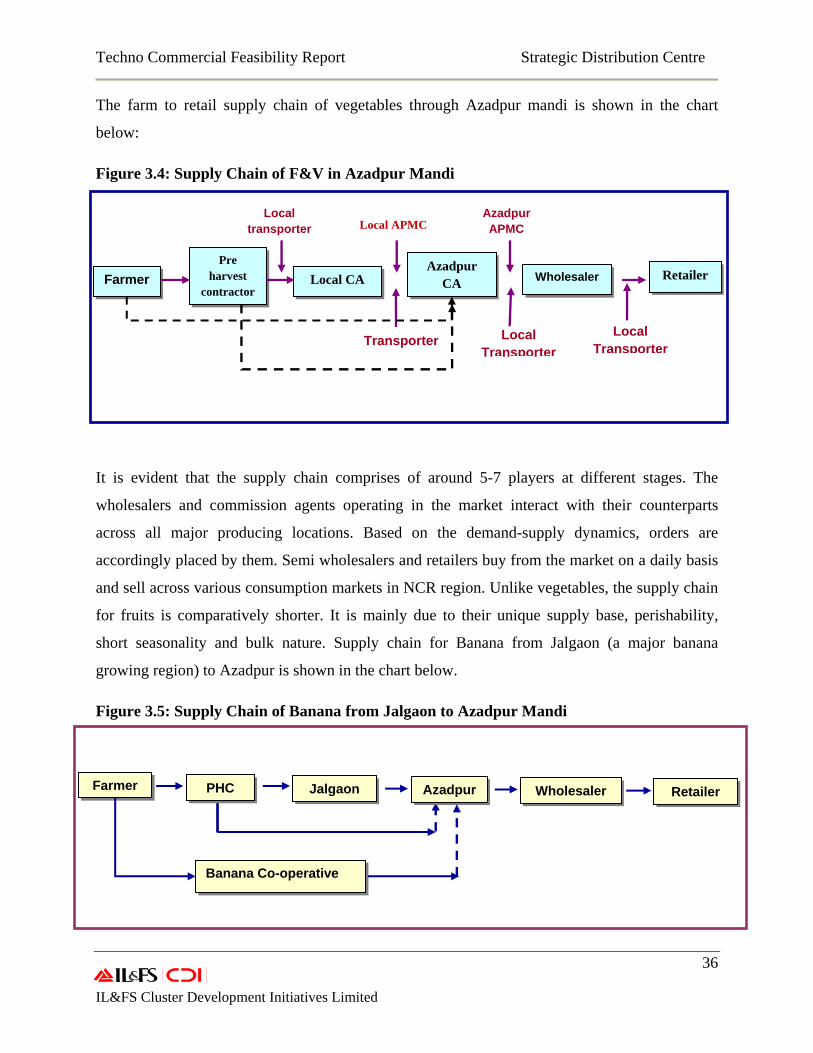
The farm to retail supply chain of vegetables through Azadpur mandi is shown in the chart
below:
Figure 3.4: Supply Chain of F&V in Azadpur Mandi
It is evident that the supply chain comprises of around 5-7 players at different stages. The
wholesalers and commission agents operating in the market interact with their counterparts
across all major producing locations. Based on the demand-supply dynamics, orders are
accordingly placed by them. Semi wholesalers and retailers buy from the market on a daily basis
and sell across various consumption markets in NCR region. Unlike vegetables, the supply chain
for fruits is comparatively shorter. It is mainly due to their unique supply base, perishability,
short seasonality and bulk nature. Supply chain for Banana from Jalgaon (a major banana
growing region) to Azadpur is shown in the chart below.
Figure 3.5: Supply Chain of Banana from Jalgaon to Azadpur Mandi
Farmer PHC Jalgaon Azadpur
Banana Co-operative
Wholesaler Retailer
Farmer Pre
harvest contractor
Local CA Azadpur
CA Wholesaler
Transporter
Retailer
Local transporter Local APMC
Azadpur APMC
Local Transporter
Local Transporter
Techno Commercial Feasibility Report Strategic Distribution Centre
37 IL&FS Cluster Development Initiatives Limited
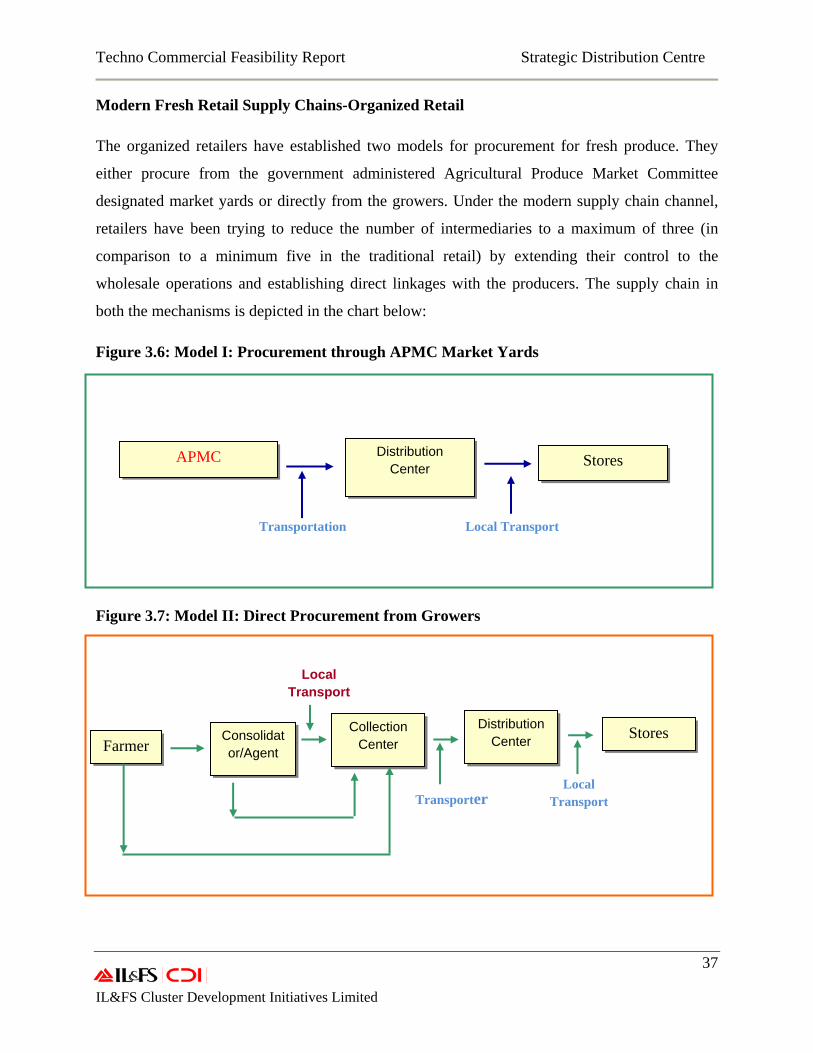
Modern Fresh Retail Supply Chains-Organized Retail
The organized retailers have established two models for procurement for fresh produce. They
either procure from the government administered Agricultural Produce Market Committee
designated market yards or directly from the growers. Under the modern supply chain channel,
retailers have been trying to reduce the number of intermediaries to a maximum of three (in
comparison to a minimum five in the traditional retail) by extending their control to the
wholesale operations and establishing direct linkages with the producers. The supply chain in
both the mechanisms is depicted in the chart below:
Figure 3.6: Model I: Procurement through APMC Market Yards
Figure 3.7: Model II: Direct Procurement from Growers
APMC Distribution Center Stores
Transportation Local Transport
Farmer Consolidator/Agent
Local Transport
Collection Center
Distribution Center Stores
Local Transport Transporter
Techno Commercial Feasibility Report Strategic Distribution Centre
38 IL&FS Cluster Development Initiatives Limited
In case of direct procurement from growers, the organized retailers have set up farm proximate
collection centers where the produce is aggregated and then, directly transported to respective
distribution centers. The produce is sorted, graded, and packed at the distribution centers and
then transported to retail stores. Distribution centers also have the facilities like cold storage,
ripening chamber and deep freeze storage.
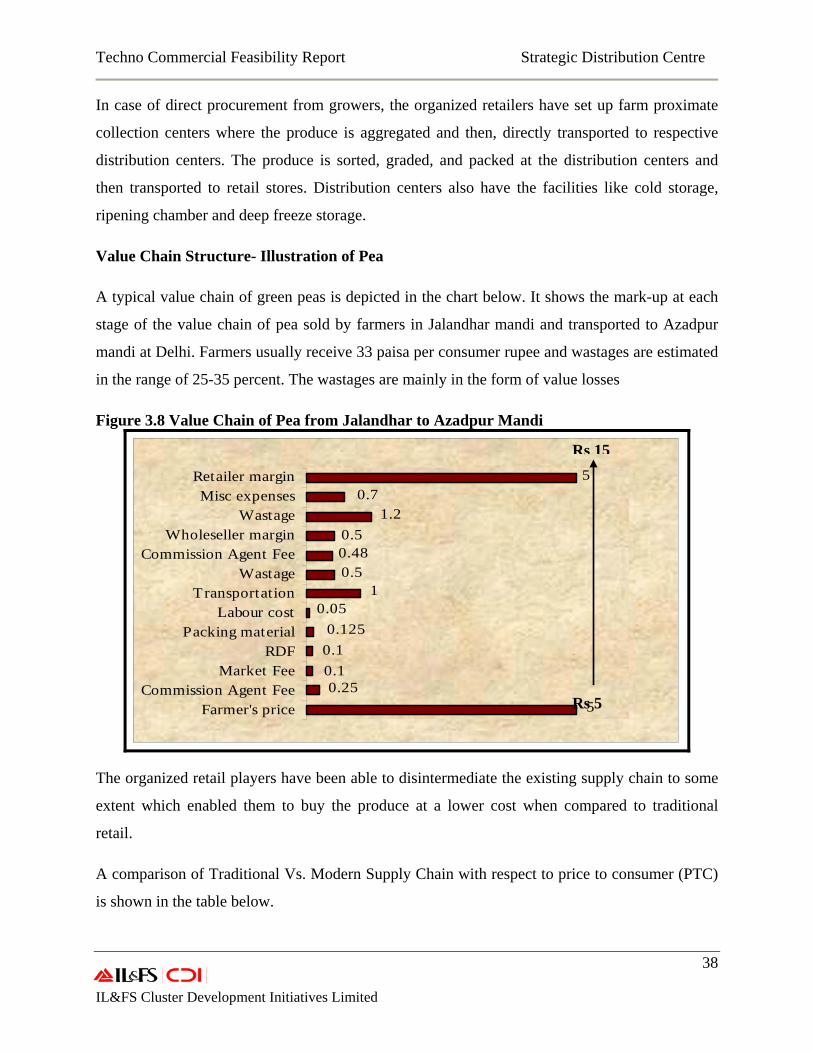
Value Chain Structure- Illustration of Pea
A typical value chain of green peas is depicted in the chart below. It shows the mark-up at each
stage of the value chain of pea sold by farmers in Jalandhar mandi and transported to Azadpur
mandi at Delhi. Farmers usually receive 33 paisa per consumer rupee and wastages are estimated
in the range of 25-35 percent. The wastages are mainly in the form of value losses
Figure 3.8 Value Chain of Pea from Jalandhar to Azadpur Mandi
5
5
0.71.2
0.50.480.5
10.05
0.1250.10.10.25
Farmer's priceCommission Agent Fee
Market FeeRDF
Packing materialLabour cost
TransportationWastage
Commission Agent FeeWholeseller margin
WastageMisc expenses
Retailer margin
The organized retail players have been able to disintermediate the existing supply chain to some
extent which enabled them to buy the produce at a lower cost when compared to traditional
retail.
A comparison of Traditional Vs. Modern Supply Chain with respect to price to consumer (PTC)
is shown in the table below.
Rs 15
Rs 5
Techno Commercial Feasibility Report Strategic Distribution Centre
39 IL&FS Cluster Development Initiatives Limited
Table 3.1: Comparison between Traditional & Modern Supply Chain
Source: ILFS CDI Field Research, (Prices prevailing during season)
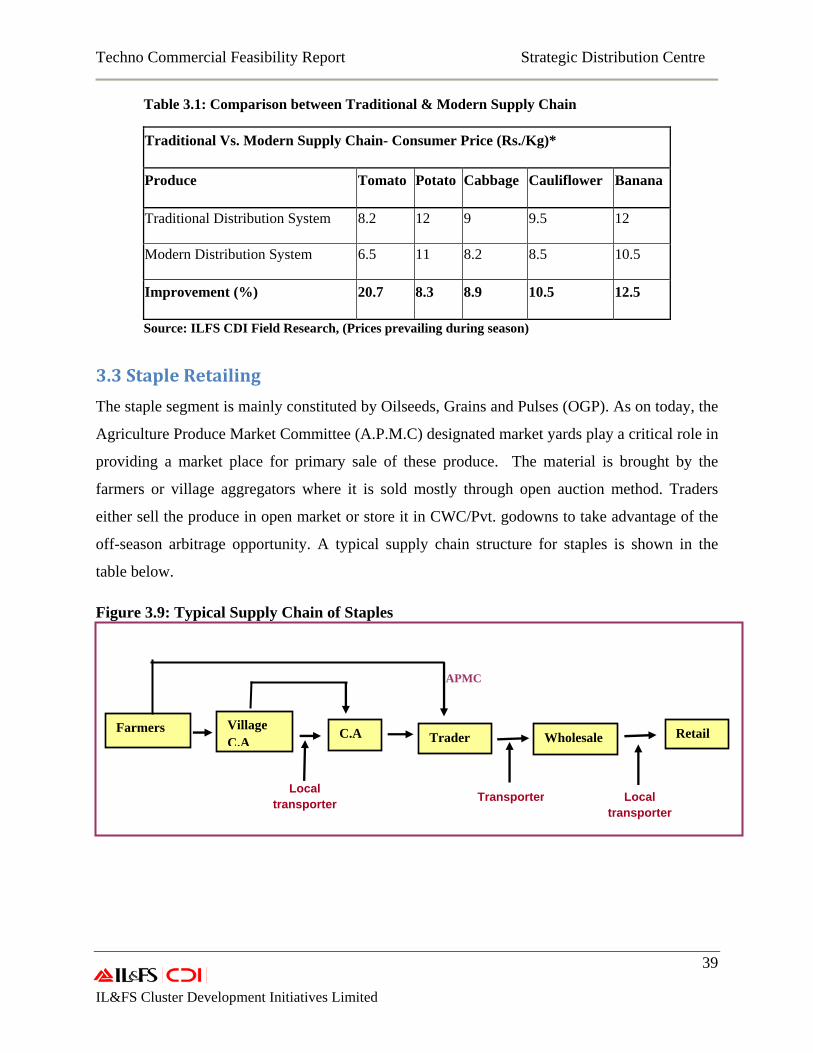
3.3 Staple Retailing
The staple segment is mainly constituted by Oilseeds, Grains and Pulses (OGP). As on today, the
Agriculture Produce Market Committee (A.P.M.C) designated market yards play a critical role in
providing a market place for primary sale of these produce. The material is brought by the
farmers or village aggregators where it is sold mostly through open auction method. Traders
either sell the produce in open market or store it in CWC/Pvt. godowns to take advantage of the
off-season arbitrage opportunity. A typical supply chain structure for staples is shown in the
table below.
Figure 3.9: Typical Supply Chain of Staples
Traditional Vs. Modern Supply Chain- Consumer Price (Rs./Kg)*
Produce Tomato Potato Cabbage Cauliflower Banana
Traditional Distribution System 8.2 12 9 9.5 12
Modern Distribution System 6.5 11 8.2 8.5 10.5
Improvement (%) 20.7 8.3 8.9 10.5 12.5
TransporterLocal
transporter
Farmers Village C.A
C.A Trader Wholesale Retail
APMC
Local transporter
Techno Commercial Feasibility Report Strategic Distribution Centre
40 IL&FS Cluster Development Initiatives Limited
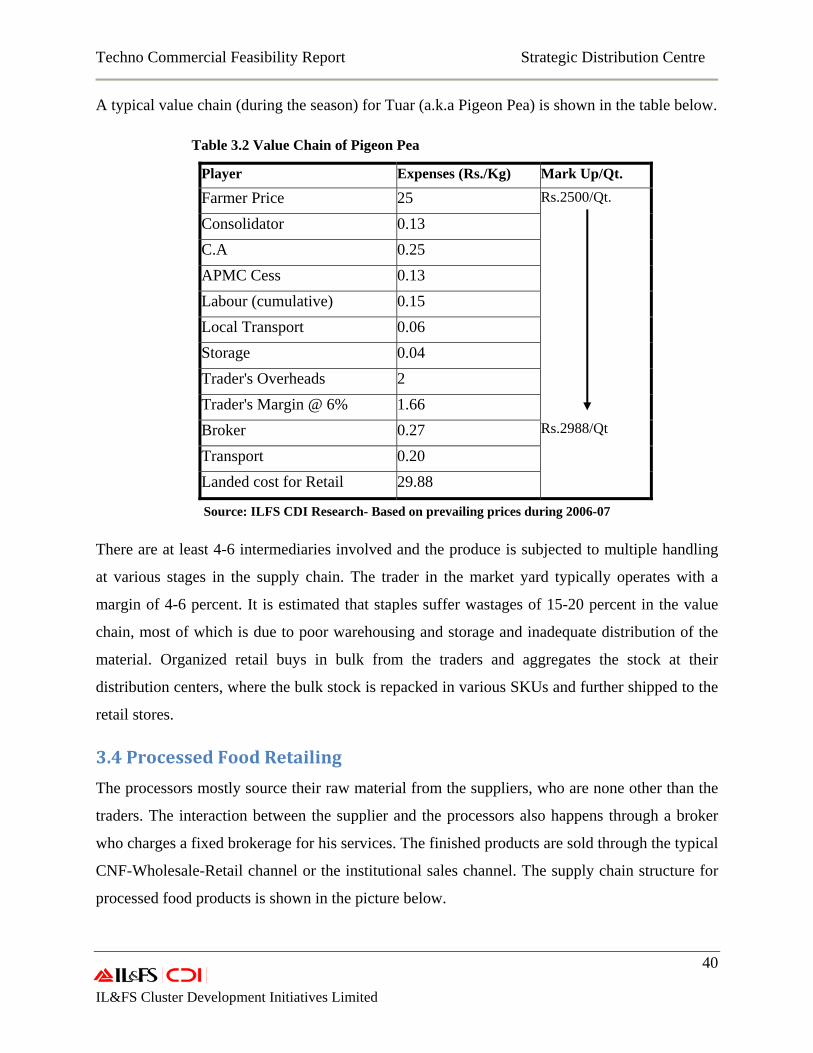
A typical value chain (during the season) for Tuar (a.k.a Pigeon Pea) is shown in the table below.
Table 3.2 Value Chain of Pigeon Pea
Source: ILFS CDI Research- Based on prevailing prices during 2006-07
There are at least 4-6 intermediaries involved and the produce is subjected to multiple handling
at various stages in the supply chain. The trader in the market yard typically operates with a
margin of 4-6 percent. It is estimated that staples suffer wastages of 15-20 percent in the value
chain, most of which is due to poor warehousing and storage and inadequate distribution of the
material. Organized retail buys in bulk from the traders and aggregates the stock at their
distribution centers, where the bulk stock is repacked in various SKUs and further shipped to the
retail stores.
3.4 Processed Food Retailing
The processors mostly source their raw material from the suppliers, who are none other than the
traders. The interaction between the supplier and the processors also happens through a broker
who charges a fixed brokerage for his services. The finished products are sold through the typical
CNF-Wholesale-Retail channel or the institutional sales channel. The supply chain structure for
processed food products is shown in the picture below.
Player Expenses (Rs./Kg) Mark Up/Qt.
Farmer Price 25 Rs.2500/Qt.
Rs.2988/Qt
Consolidator 0.13 C.A 0.25 APMC Cess 0.13 Labour (cumulative) 0.15 Local Transport 0.06 Storage 0.04 Trader's Overheads 2 Trader's Margin @ 6% 1.66 Broker 0.27 Transport 0.20 Landed cost for Retail 29.88
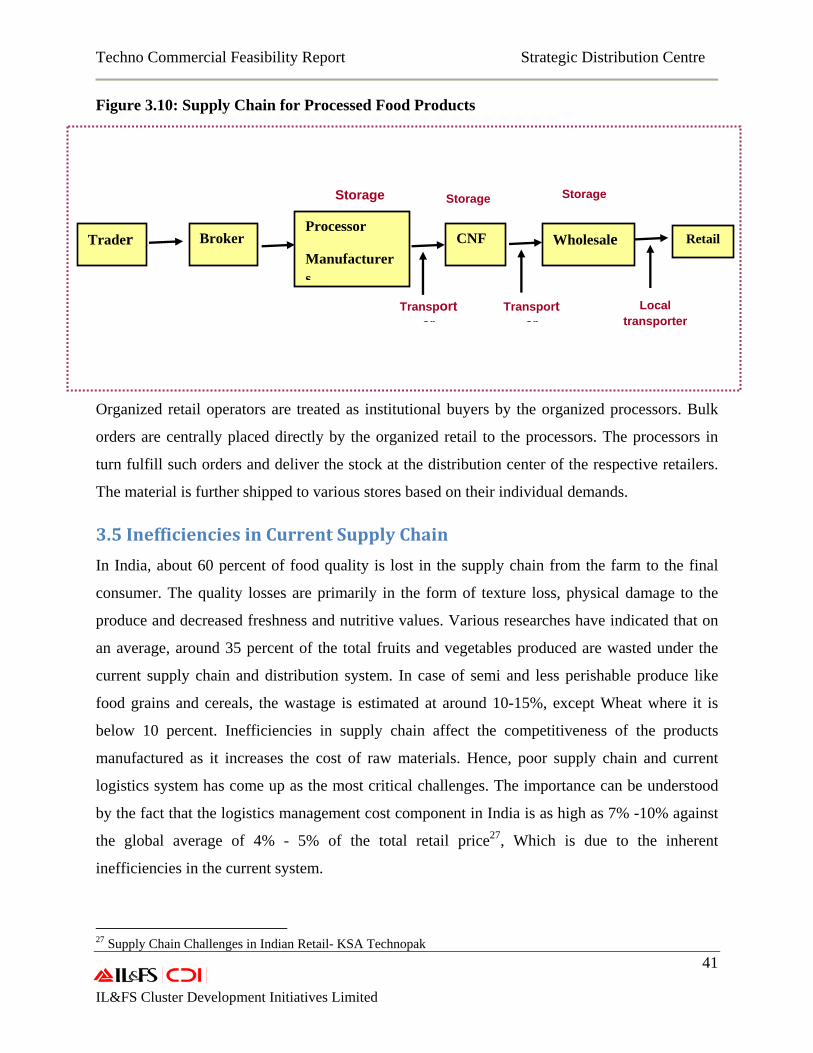
Techno Commercial Feasibility Report Strategic Distribution Centre
41 IL&FS Cluster Development Initiatives Limited
Figure 3.10: Supply Chain for Processed Food Products
Organized retail operators are treated as institutional buyers by the organized processors. Bulk
orders are centrally placed directly by the organized retail to the processors. The processors in
turn fulfill such orders and deliver the stock at the distribution center of the respective retailers.
The material is further shipped to various stores based on their individual demands.
3.5 Inefficiencies in Current Supply Chain
In India, about 60 percent of food quality is lost in the supply chain from the farm to the final
consumer. The quality losses are primarily in the form of texture loss, physical damage to the
produce and decreased freshness and nutritive values. Various researches have indicated that on
an average, around 35 percent of the total fruits and vegetables produced are wasted under the
current supply chain and distribution system. In case of semi and less perishable produce like
food grains and cereals, the wastage is estimated at around 10-15%, except Wheat where it is
below 10 percent. Inefficiencies in supply chain affect the competitiveness of the products
manufactured as it increases the cost of raw materials. Hence, poor supply chain and current
logistics system has come up as the most critical challenges. The importance can be understood
by the fact that the logistics management cost component in India is as high as 7% -10% against
the global average of 4% - 5% of the total retail price27, Which is due to the inherent
inefficiencies in the current system.
27 Supply Chain Challenges in Indian Retail- KSA Technopak
Processor
Manufacturers
Retail Trader Broker CNF Wholesale
Storage Storage Storage
Transporter
Local transporter
Transporter
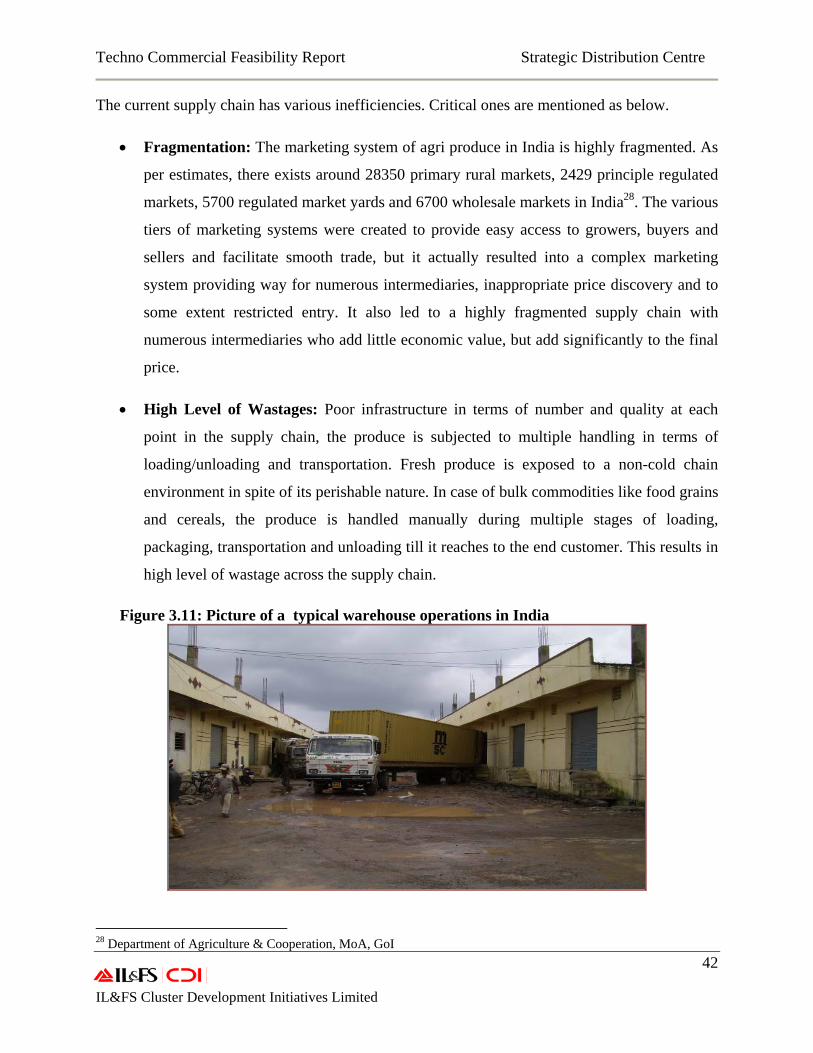
Techno Commercial Feasibility Report Strategic Distribution Centre
42 IL&FS Cluster Development Initiatives Limited
The current supply chain has various inefficiencies. Critical ones are mentioned as below.
• Fragmentation: The marketing system of agri produce in India is highly fragmented. As
per estimates, there exists around 28350 primary rural markets, 2429 principle regulated
markets, 5700 regulated market yards and 6700 wholesale markets in India28. The various
tiers of marketing systems were created to provide easy access to growers, buyers and
sellers and facilitate smooth trade, but it actually resulted into a complex marketing
system providing way for numerous intermediaries, inappropriate price discovery and to
some extent restricted entry. It also led to a highly fragmented supply chain with
numerous intermediaries who add little economic value, but add significantly to the final
price.
• High Level of Wastages: Poor infrastructure in terms of number and quality at each
point in the supply chain, the produce is subjected to multiple handling in terms of
loading/unloading and transportation. Fresh produce is exposed to a non-cold chain
environment in spite of its perishable nature. In case of bulk commodities like food grains
and cereals, the produce is handled manually during multiple stages of loading,
packaging, transportation and unloading till it reaches to the end customer. This results in
high level of wastage across the supply chain.
Figure 3.11: Picture of a typical warehouse operations in India
28 Department of Agriculture & Cooperation, MoA, GoI
Techno Commercial Feasibility Report Strategic Distribution Centre
43 IL&FS Cluster Development Initiatives Limited
• Distribution: As mentioned earlier, the agricultural produce typically has low shelf life
varying with the nature of produce. In view of this, time bound and efficient distribution
system throughout the supply chain becomes the most critical factor. Due to lack of a
strong distribution system, the produce often spends more time in the supply chain than it
ideally should spend. This leads to loss in quality and wastages during the transit and
lower acceptance at the retail end. Unlike developed country where the distribution
infrastructure is the backbone of the retail industry, India lacks significantly at this front.
Fragmented supply base and minimal infrastructure leads to very high distribution cost
for the India retailers and high prices for the end customer.
3.6 Challenges and Gaps
Distribution is a major impediment for Indian food processing industry and the retail sector in
India. Lack of quality infrastructure and an almost non-existent organized distribution system has
resulted in an overall inefficient logistics system. It is concluded that the market is going to
expand and demand for quality food products will raise manifold. While this provides strong
opportunity for the existing players and potential entrants to cater to increased demand, it also
possesses a number of challenges, especially in supply chain and distribution. The gap in
infrastructure and distribution network is not only leading to high wastages and value loss, but
also making it extremely difficult for the operators to sustain on a long-term basis.
The lack of storage and distribution increases the delivery costs of produce and it is affecting the
export potential of Indian commodities. According to a World Bank study29, the high delivery
cost in India is mainly due to two reasons:
a. Poor transport infrastructure and restricted competition due to a number of policy
distortions resulting in slow creation of new infrastructure and uneven utilization of
existing infrastructure, and
b. High storage and sales costs due to limited storage infrastructure and fragmented supply
chain (See Figure below). The logistics costs in India are comparatively much higher than
many countries.
29 Mattoo A., Mishra D., Narain A. 2007. From Competition at Home to Competing Abroad: A Case Study of India’s Horticulture, World Bank
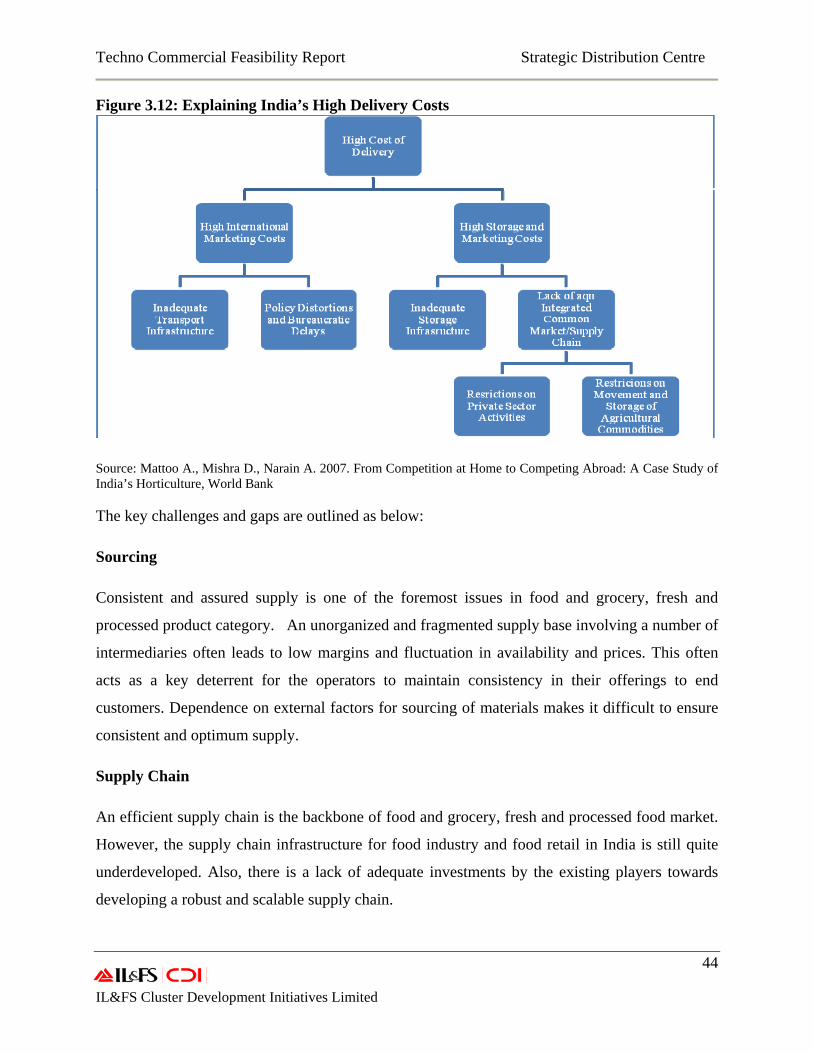
Techno Commercial Feasibility Report Strategic Distribution Centre
44 IL&FS Cluster Development Initiatives Limited
Figure 3.12: Explaining India’s High Delivery Costs
Source: Mattoo A., Mishra D., Narain A. 2007. From Competition at Home to Competing Abroad: A Case Study of India’s Horticulture, World Bank The key challenges and gaps are outlined as below:
Sourcing
Consistent and assured supply is one of the foremost issues in food and grocery, fresh and
processed product category. An unorganized and fragmented supply base involving a number of
intermediaries often leads to low margins and fluctuation in availability and prices. This often
acts as a key deterrent for the operators to maintain consistency in their offerings to end
customers. Dependence on external factors for sourcing of materials makes it difficult to ensure
consistent and optimum supply.
Supply Chain
An efficient supply chain is the backbone of food and grocery, fresh and processed food market.
However, the supply chain infrastructure for food industry and food retail in India is still quite
underdeveloped. Also, there is a lack of adequate investments by the existing players towards
developing a robust and scalable supply chain.
Techno Commercial Feasibility Report Strategic Distribution Centre
45 IL&FS Cluster Development Initiatives Limited
There has been investment to build the supply chain by a few operators for their individual
operations, but they were either product or business specific or had limited options for scaling
up. Unlike other countries, India at present does not have the supply chain models on which
multiple categories can travel through.
Distribution System
In the current context in Indian Markets, distribution remains the biggest challenge companies
face. Within distribution, the lack of distribution capacity is the biggest constraint faced. It is
worthwhile mentioning that the poor quality of infrastructure in the distribution sector results in
high logistics costs and higher level of inventories, which have to be maintained at a very high
level. The logistics costs are around 14 percent of GDP, compared with 8 percent in U.S30. This
is not a tribute to the size of logistics sector in India, but a symptom of the inefficiencies
resulting from the poor infrastructure. Most of the warehouses are poorly designed and operated
and do not meet the international standards.
Poor quality of warehousing assumes significance more so far when it comes to food and grocery
including perishables. Inadequate handling and distribution accounts for quality losses and
makes the product uncompetitive in the market. Organized retail has set up their own distribution
centers on a hub-n-spoke model where certain number of retail outlets is being catered by one
distribution center. However, such facilities are generally customized and captive for their own
requirement and have limited throughput handling capacity.
A.P.M.C
A.P.M.C plays a vital role by providing a platform for sale-purchase of agriculture produce
including perishables. It has wide network in most of the states in India, barring a few who have
either repealed the act or modified it to some extent. As per estimates, there are around 5700
regulated market yards governed by APMCs. In these market yards, traders and other marketing
agents are provided godowns and shops for purchase of agriculture produce from farmers.
Farmers can sell their produce to agents or traders under supervision of APMC. As per the
existing act only notified commodities can be traded by licensed traders in the notified area of
30 KSA Technopak-Supply Chain Challenges in Indian Retail, Jan ‘2008
Techno Commercial Feasibility Report Strategic Distribution Centre
46 IL&FS Cluster Development Initiatives Limited
respective APMC. These markets also do not play any role in terms of facilitating the market
participants to organize logistics and the supply chain. This provides the way for a number of
intermediaries to operate in the market and provide such services. However, a greater number of
such intermediaries make the supply chain uncompetitive and costly.
Also, most of these APMCs were constructed long ago and are not geared up to handle the
current throughput in the market yards. The planning and layouts of the markets does not provide
enough scope for renovation unless completely redesigned or relocated. Constraints like limited
auction platforms, lack of appropriate warehouse and cold storage facilities and parking etc are
gradually making it difficult for the operators to carry out their commercial activities. Last but
not the least, the cumulative effect of the above inefficiencies leads to a very high amount of
wastage estimated at around 15-20% within the market yard causing significant value loss.
Techno Commercial Feasibility Report Strategic Distribution Centre
47 IL&FS Cluster Development Initiatives Limited
4. Strategic Distribution Center (SDC) Higher cost of distribution due to lack of distribution capacity is the major driver behind the
initiative for establishing Strategic Distribution Centers. SDCs will also be able to meet the
changing role of a traditional warehouse system. SDCs will go a long way in improving the
efficiency of the food supply chain thus resulting in more consumer benefit and better price
realization for farmers/producers.
4.1 Concept
The SDC is envisaged as the last leg of the supply chain from where the finished products shall
directly be sent for export/processeing and to the retail/wholesale outlets. This can be both
organized and unorganized retail outlets. The SDC is also designed to handle fresh produce
which will be sorted and graded properly to meet the customer requirements. The grade fitted for
the fresh segment will be going to the retail markets, whereas the processable grade will be
available for the food processors for further value addition.
Hence, it will not merely be a storage facility and it will provide avenues for value addition such
as primary processing of fresh produce, retail packaging, etc to its users. It will be fully equipped
to meet the distribution needs of retailers and wholesalers and the sourcing needs of the food
processors. Thus the SDC will be able to streamline the entire distribution chain involved with
fresh as well as processed food items
The Strategic Distribution Center will be modeled along the lines of the logistics park for food
products where there is a coherent set of key logistics elements involved in food items such as
Integrated cold chain including specialized/climate controlled stores along with dry warehouses,
cold logistics, bulk material handling equipment, primary processing lines, aseptic packing lines,
X-Ray and Irradiation Facility, (if needed), integrated traffic management facilities, and inter
modal connectivity.
However, to begin with SDC will not be equipped with infrastructure for exports which includes
among others the container handling facilities. This has been deliberately done because SDC
equipped to handle exports and SDC equipped to handle domestic market function differently.
Techno Commercial Feasibility Report Strategic Distribution Centre
48 IL&FS Cluster Development Initiatives Limited
Nonetheless the retail SDC can meet both these requirements with the addition export
infrastructure.
SDC will have Modular Design equipped to handle products of different temperature zones. This
modular design will also be helpful in getting multiple users (Retailers/wholesalers/third parties)
to use the facility.
4.2 Potential Users of SDC
SDC is designed in such a manner so as to fulfill the needs of a variety of users. Potential users
of SDC include:
Retailers/Wholesalers
Organized retailers and big wholesalers may use this facility as a one stop arrangement for their
storage, transit and distribution. They may also use other facilities such as retail packaging,
labeling, etc.
Food Processors
Food processors are expected to use this facility to improve the efficiency of their distribution
chain by:
• Creating more retail visibility for the food items
• Increasing handling efficiency for catering the needs of export market
Also, with the design envisaged for the SDC the processors are expected to use the facility in
sourcing raw material for their units.
Third Parties
Third Party Logistics companies can operate the SDC on behalf of the Retailers and
Wholesalers.
Techno Commercial Feasibility Report Strategic Distribution Centre
49 IL&FS Cluster Development Initiatives Limited
4.3 Benefits of SDC
Being a vital part of the entire supply chain, SDC has been positioned in a manner to benefit
farmers, consumers and retailers.
Benefits to consumers
Consumers will benefit from the SDC in two ways. It will help in price reduction through an
efficient supply chain. Secondly, it will also help in improving the quality of goods. Thus overall
the SDC will help the consumer in getting the value for their money with a wide range of good
quality products at low prices.
Benefits to farmers
Due to the inefficiencies in the current food supply chain farmers are not able to realize the best
price for their goods, though the end price paid by the consumer is high. This is mainly due to a
mismatch in demand and supply of food items and the multiple handling of products. The SDC is
positioned to cut down the long supply chain especially in case of perishables and improve the
overall match between demand and supply. This will help in better price realization for farmers.
Benefits to retailers and wholesalers/retailers
At present, there is no convergent arrangement for transit storage and distribution in case of the
retailers and wholesalers dealing with multiple product types and temperatures. This is
increasing their cost and thus resulting in higher consumer price. The SDC through its facilities
and strategic positioning will improve this condition thus decreasing the cost of distribution and
resulting in better value for the consumers.
The SDC will also bring enormous benefits to the transportation of goods.
• Inbound – All suppliers will be able to deliver large volumes of their products in full
vehicles to a single destination that is easily accessible
• Outbound – Products of all categories will be dispatched from a single location that has
good road links to all the main consumer areas where the retail stores are based. These
delivery vehicles will be well utilized providing full loads to each store
Techno Commercial Feasibility Report Strategic Distribution Centre
50 IL&FS Cluster Development Initiatives Limited
Benefits to Processors
• SDC would facilitate a better understanding of market demands and consumptions trends.
• SDCs would provide better inventory management opportunities to the processors
• SDCs would also provide opportunities for test marketing of products in a more
controlled environment.
• SDC would improve the overall efficiency of the distribution chain thus increasing the
demand for processed items
• SDC will also help in sourcing raw materials in a more cost-effective manner
Benefits to Government
• SDCs will promote employment generation (including employment generation in allied
sector such as organized food retailing, etc)
• SDCs would reduce wastages, facilitate better quality control and compliance which
would help in overall development of food industry in India
• SDCs would aid the government in getting better access to reliable sales information
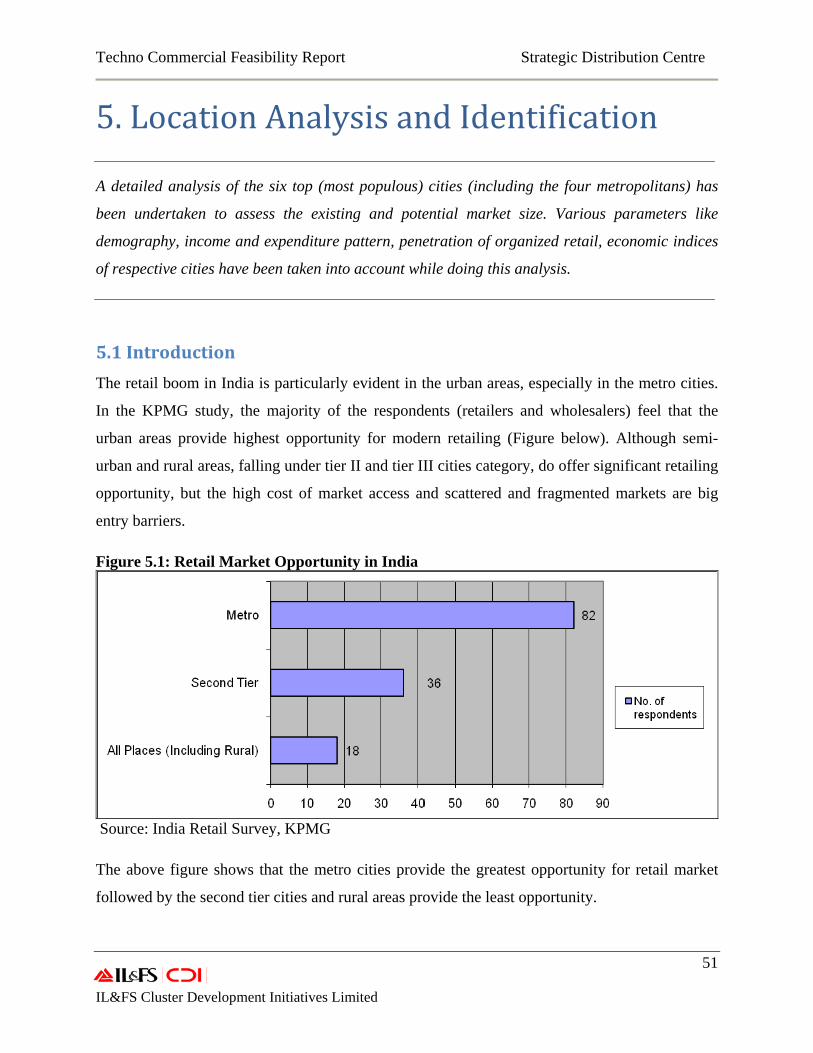
Techno Commercial Feasibility Report Strategic Distribution Centre
51 IL&FS Cluster Development Initiatives Limited
5. Location Analysis and Identification
A detailed analysis of the six top (most populous) cities (including the four metropolitans) has
been undertaken to assess the existing and potential market size. Various parameters like
demography, income and expenditure pattern, penetration of organized retail, economic indices
of respective cities have been taken into account while doing this analysis.
5.1 Introduction
The retail boom in India is particularly evident in the urban areas, especially in the metro cities.
In the KPMG study, the majority of the respondents (retailers and wholesalers) feel that the
urban areas provide highest opportunity for modern retailing (Figure below). Although semi-
urban and rural areas, falling under tier II and tier III cities category, do offer significant retailing
opportunity, but the high cost of market access and scattered and fragmented markets are big
entry barriers.
Figure 5.1: Retail Market Opportunity in India
Source: India Retail Survey, KPMG
The above figure shows that the metro cities provide the greatest opportunity for retail market
followed by the second tier cities and rural areas provide the least opportunity.
Techno Commercial Feasibility Report Strategic Distribution Centre
52 IL&FS Cluster Development Initiatives Limited
The share of organized retail, which was only 4.15 percent in 2005-06, is expected to grow to
9.52 percent in 2009-10.31 This growth will mainly happen in metro and tier I cities. Apart from
increasing presence in metro and tier I cities, organized retail is also looking at tier II cities to
scale up their operations.
The utilization of the proposed infrastructure in SDC will be primarily driven by organized retail.
The top eight cities (which include the four Metros, Pune, Ahmedabad, Hyderabad and
Bangalore) are expected to account for more than 80 percent of the organized retail business.
Moreover, 48 percent of total households (HHs) consuming class (with annual HH income above
Rs. 90,000) is present in the Metros and Tier I cities.32 These cities also have high Monthly Per
Capita Consumption Expenditure (MPCE) with food and groceries constituting for around 40
percent of the retail spend.
The fast increase of an already large consuming class in the cities and subsequent retail growth
coupled with the inefficiencies in logistics and inventory management (as discussed in the earlier
chapters) have made it imperative to develop SDCs in big urban clusters. Due to these reasons, it
is the Metros and Tier I cities, which make good locations for setting up the pilot SDC.
Therefore, the cities of Mumbai, Delhi, Kolkata, Chennai, Hyderabad and Bangalore have been
considered for the selection of a suitable location for SDCs.
With the success of the SDCs, the food retail outlets and supermarkets will experience high
growth bringing a greater range of products, consistent quality and low prices to all consumers.
Success in the main cities will promote growth in the other tiers and rural areas.
5.2 Comparison of Cities
The comparison of the cities of Mumbai, Delhi, Kolkata, Chennai, Bangalore and Hyderabad has
been done in terms of demographics, economic condition and the market size. The comparison
has been done to select the location with highest potential, in terms of market size and growth
potential of organized retails, for setting up of SDCs.
31 Retail: Market & Opportunities, Ernst and Young, 2007 32 Retail: Shopping Goes Hyper, Edelweiss, 2008
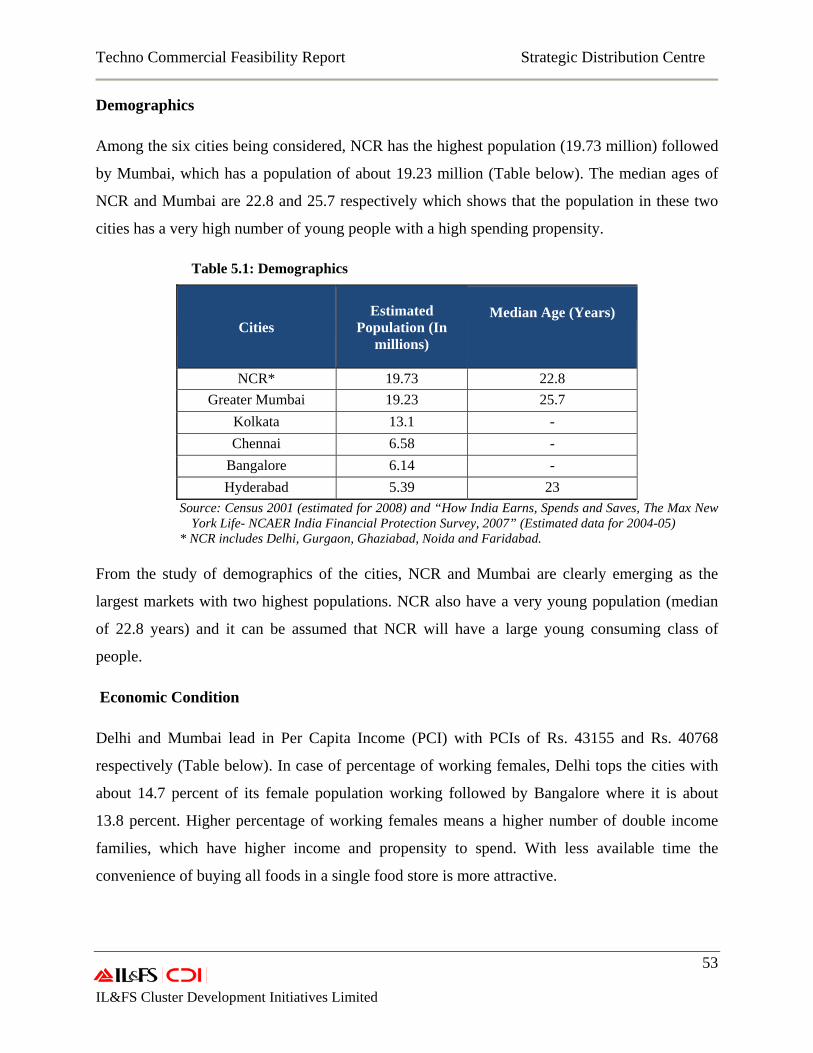
Techno Commercial Feasibility Report Strategic Distribution Centre
53 IL&FS Cluster Development Initiatives Limited
Demographics
Among the six cities being considered, NCR has the highest population (19.73 million) followed
by Mumbai, which has a population of about 19.23 million (Table below). The median ages of
NCR and Mumbai are 22.8 and 25.7 respectively which shows that the population in these two
cities has a very high number of young people with a high spending propensity.
Table 5.1: Demographics
Cities Estimated
Population (In millions)
Median Age (Years)
NCR* 19.73 22.8 Greater Mumbai 19.23 25.7
Kolkata 13.1 - Chennai 6.58 -
Bangalore 6.14 - Hyderabad 5.39 23
Source: Census 2001 (estimated for 2008) and “How India Earns, Spends and Saves, The Max New York Life- NCAER India Financial Protection Survey, 2007” (Estimated data for 2004-05)
* NCR includes Delhi, Gurgaon, Ghaziabad, Noida and Faridabad. From the study of demographics of the cities, NCR and Mumbai are clearly emerging as the
largest markets with two highest populations. NCR also have a very young population (median
of 22.8 years) and it can be assumed that NCR will have a large young consuming class of
people.
Economic Condition
Delhi and Mumbai lead in Per Capita Income (PCI) with PCIs of Rs. 43155 and Rs. 40768
respectively (Table below). In case of percentage of working females, Delhi tops the cities with
about 14.7 percent of its female population working followed by Bangalore where it is about
13.8 percent. Higher percentage of working females means a higher number of double income
families, which have higher income and propensity to spend. With less available time the
convenience of buying all foods in a single food store is more attractive.
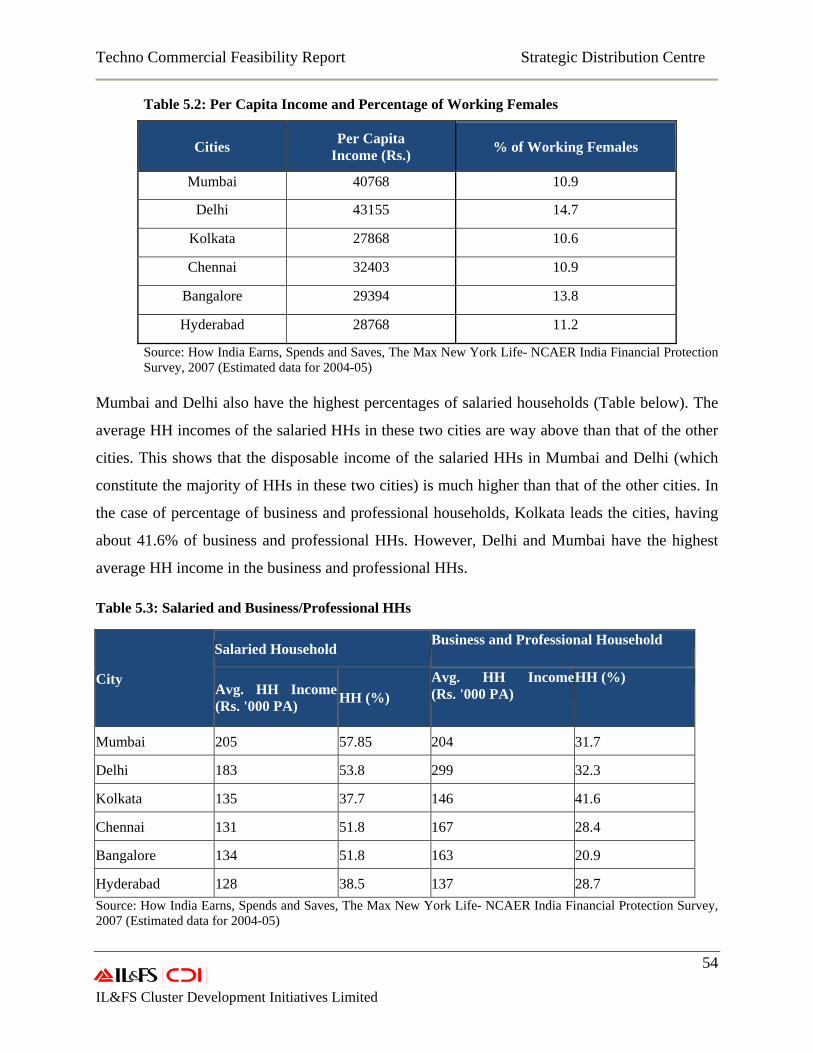
Techno Commercial Feasibility Report Strategic Distribution Centre
54 IL&FS Cluster Development Initiatives Limited
Table 5.2: Per Capita Income and Percentage of Working Females
Cities Per Capita Income (Rs.) % of Working Females
Mumbai 40768 10.9
Delhi 43155 14.7
Kolkata 27868 10.6
Chennai 32403 10.9
Bangalore 29394 13.8
Hyderabad 28768 11.2
Source: How India Earns, Spends and Saves, The Max New York Life- NCAER India Financial Protection Survey, 2007 (Estimated data for 2004-05)
Mumbai and Delhi also have the highest percentages of salaried households (Table below). The
average HH incomes of the salaried HHs in these two cities are way above than that of the other
cities. This shows that the disposable income of the salaried HHs in Mumbai and Delhi (which
constitute the majority of HHs in these two cities) is much higher than that of the other cities. In
the case of percentage of business and professional households, Kolkata leads the cities, having
about 41.6% of business and professional HHs. However, Delhi and Mumbai have the highest
average HH income in the business and professional HHs.
Table 5.3: Salaried and Business/Professional HHs
Source: How India Earns, Spends and Saves, The Max New York Life- NCAER India Financial Protection Survey, 2007 (Estimated data for 2004-05)
City
Salaried Household Business and Professional Household
Avg. HH Income(Rs. '000 PA) HH (%)
Avg. HH Income(Rs. '000 PA)
HH (%)
Mumbai 205 57.85 204 31.7
Delhi 183 53.8 299 32.3
Kolkata 135 37.7 146 41.6
Chennai 131 51.8 167 28.4
Bangalore 134 51.8 163 20.9
Hyderabad 128 38.5 137 28.7
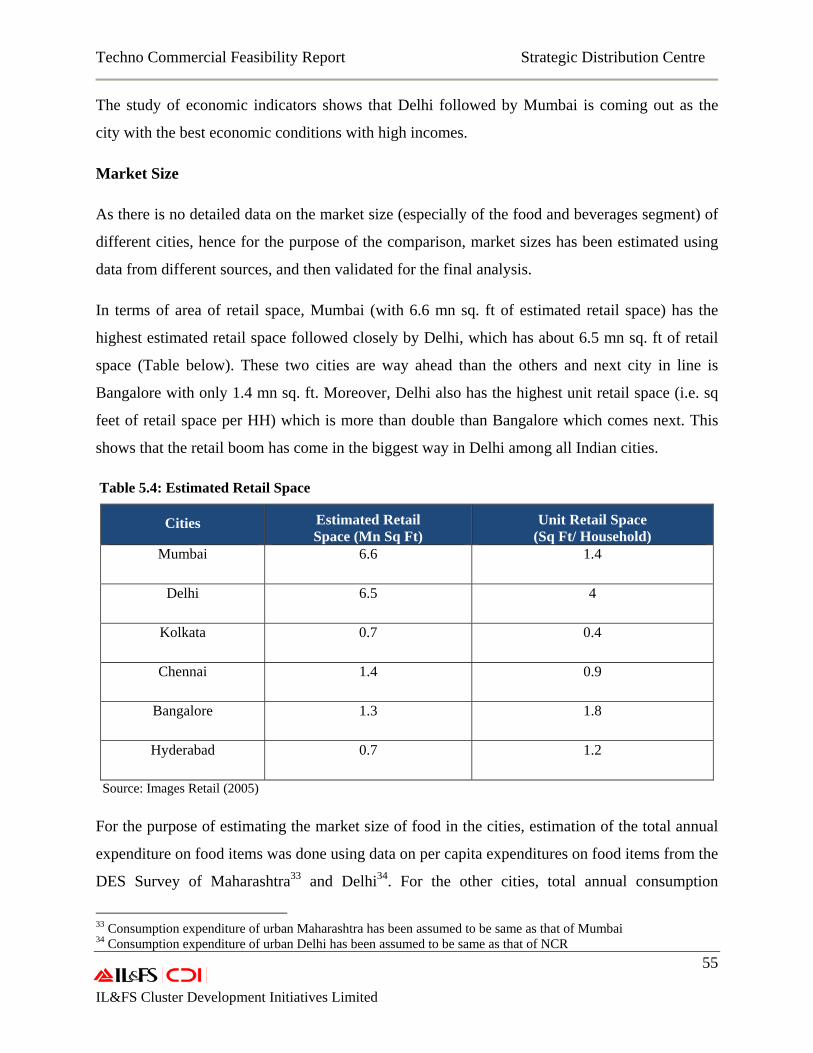
Techno Commercial Feasibility Report Strategic Distribution Centre
55 IL&FS Cluster Development Initiatives Limited
The study of economic indicators shows that Delhi followed by Mumbai is coming out as the
city with the best economic conditions with high incomes.
Market Size
As there is no detailed data on the market size (especially of the food and beverages segment) of
different cities, hence for the purpose of the comparison, market sizes has been estimated using
data from different sources, and then validated for the final analysis.
In terms of area of retail space, Mumbai (with 6.6 mn sq. ft of estimated retail space) has the
highest estimated retail space followed closely by Delhi, which has about 6.5 mn sq. ft of retail
space (Table below). These two cities are way ahead than the others and next city in line is
Bangalore with only 1.4 mn sq. ft. Moreover, Delhi also has the highest unit retail space (i.e. sq
feet of retail space per HH) which is more than double than Bangalore which comes next. This
shows that the retail boom has come in the biggest way in Delhi among all Indian cities.
Table 5.4: Estimated Retail Space
Cities Estimated Retail Space (Mn Sq Ft)
Unit Retail Space (Sq Ft/ Household)
Mumbai 6.6 1.4
Delhi 6.5 4
Kolkata 0.7 0.4
Chennai 1.4 0.9
Bangalore 1.3 1.8
Hyderabad 0.7 1.2
Source: Images Retail (2005)
For the purpose of estimating the market size of food in the cities, estimation of the total annual
expenditure on food items was done using data on per capita expenditures on food items from the
DES Survey of Maharashtra33 and Delhi34. For the other cities, total annual consumption
33 Consumption expenditure of urban Maharashtra has been assumed to be same as that of Mumbai 34 Consumption expenditure of urban Delhi has been assumed to be same as that of NCR
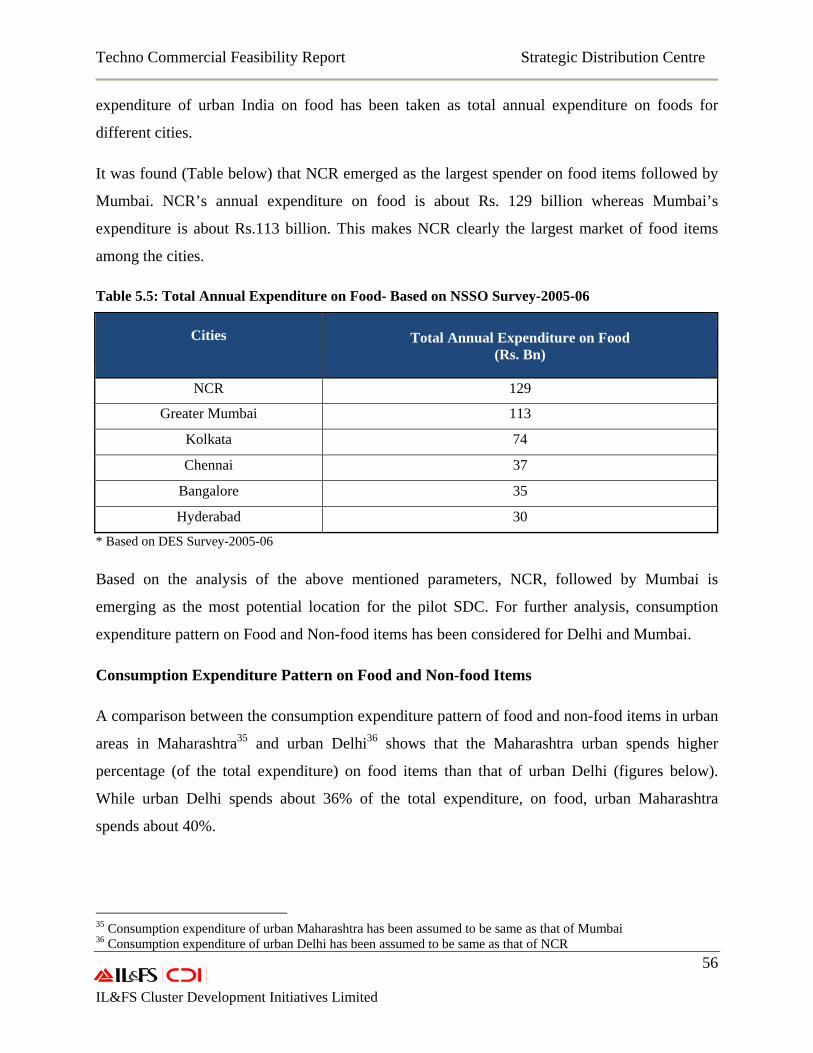
Techno Commercial Feasibility Report Strategic Distribution Centre
56 IL&FS Cluster Development Initiatives Limited
expenditure of urban India on food has been taken as total annual expenditure on foods for
different cities.
It was found (Table below) that NCR emerged as the largest spender on food items followed by
Mumbai. NCR’s annual expenditure on food is about Rs. 129 billion whereas Mumbai’s
expenditure is about Rs.113 billion. This makes NCR clearly the largest market of food items
among the cities.
Table 5.5: Total Annual Expenditure on Food- Based on NSSO Survey-2005-06
Cities Total Annual Expenditure on Food (Rs. Bn)
NCR 129
Greater Mumbai 113
Kolkata 74
Chennai 37
Bangalore 35
Hyderabad 30
* Based on DES Survey-2005-06
Based on the analysis of the above mentioned parameters, NCR, followed by Mumbai is
emerging as the most potential location for the pilot SDC. For further analysis, consumption
expenditure pattern on Food and Non-food items has been considered for Delhi and Mumbai.
Consumption Expenditure Pattern on Food and Non-food Items
A comparison between the consumption expenditure pattern of food and non-food items in urban
areas in Maharashtra35 and urban Delhi36 shows that the Maharashtra urban spends higher
percentage (of the total expenditure) on food items than that of urban Delhi (figures below).
While urban Delhi spends about 36% of the total expenditure, on food, urban Maharashtra
spends about 40%.
35 Consumption expenditure of urban Maharashtra has been assumed to be same as that of Mumbai 36 Consumption expenditure of urban Delhi has been assumed to be same as that of NCR
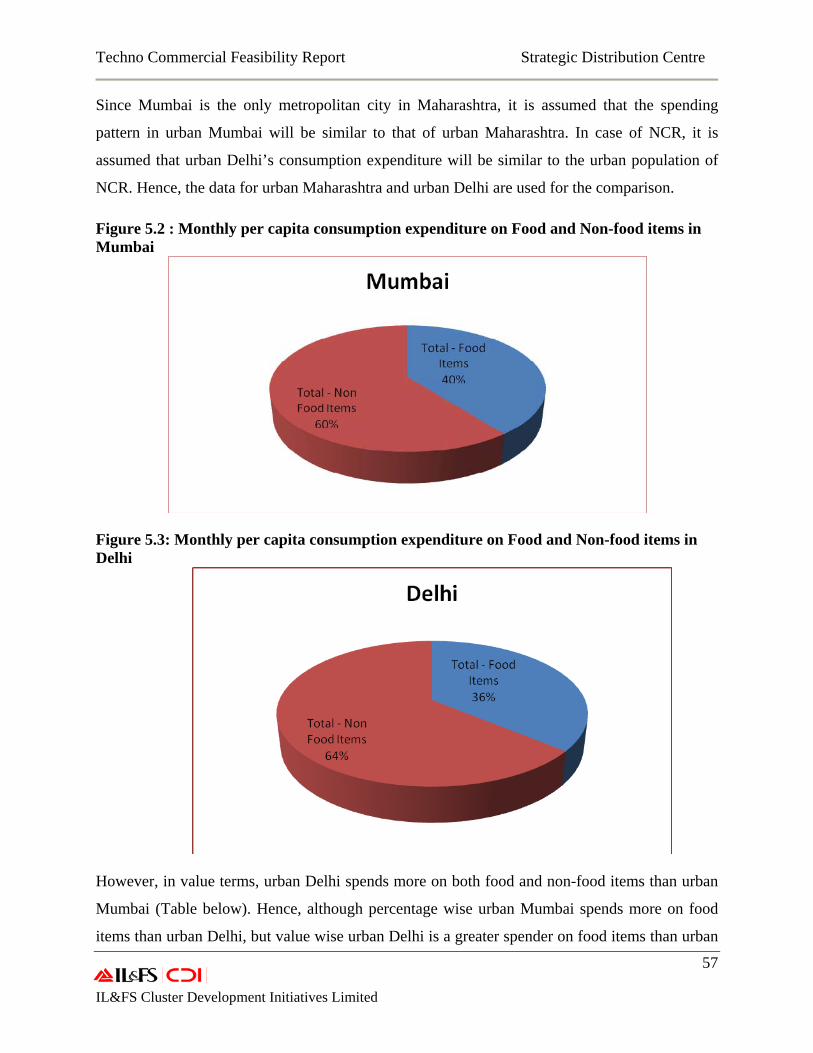
Techno Commercial Feasibility Report Strategic Distribution Centre
57 IL&FS Cluster Development Initiatives Limited
Since Mumbai is the only metropolitan city in Maharashtra, it is assumed that the spending
pattern in urban Mumbai will be similar to that of urban Maharashtra. In case of NCR, it is
assumed that urban Delhi’s consumption expenditure will be similar to the urban population of
NCR. Hence, the data for urban Maharashtra and urban Delhi are used for the comparison.
Figure 5.2 : Monthly per capita consumption expenditure on Food and Non-food items in Mumbai
Figure 5.3: Monthly per capita consumption expenditure on Food and Non-food items in Delhi
However, in value terms, urban Delhi spends more on both food and non-food items than urban
Mumbai (Table below). Hence, although percentage wise urban Mumbai spends more on food
items than urban Delhi, but value wise urban Delhi is a greater spender on food items than urban
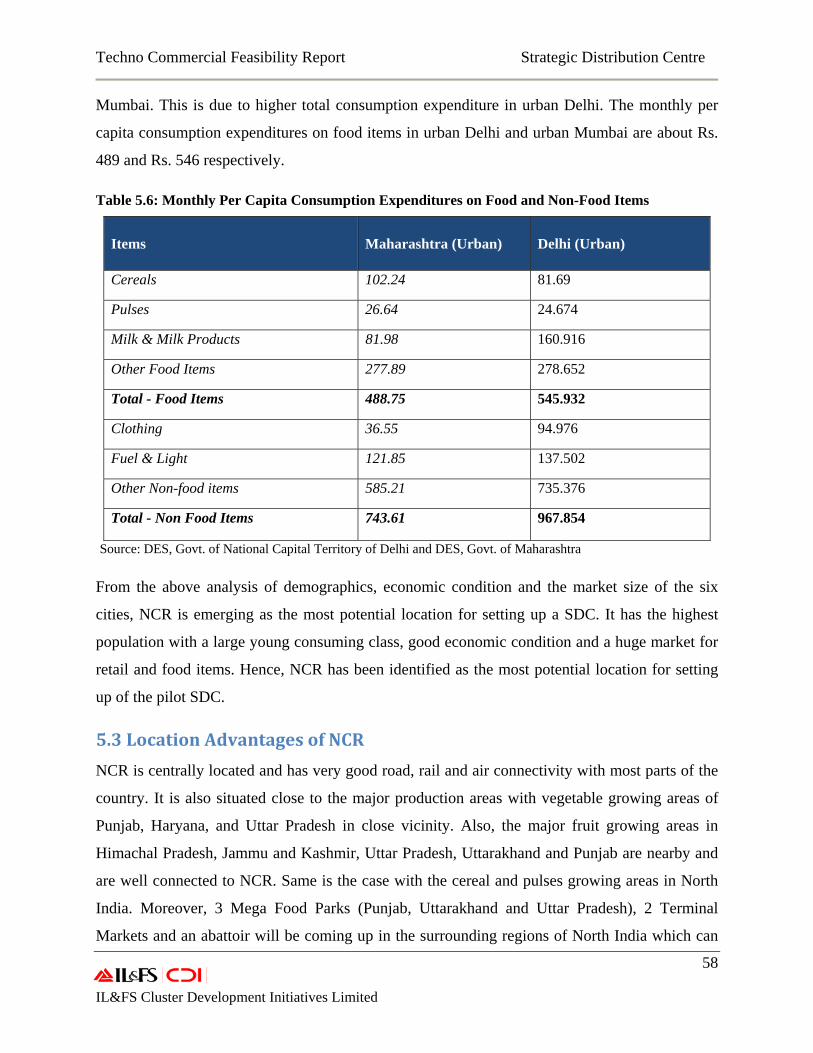
Techno Commercial Feasibility Report Strategic Distribution Centre
58 IL&FS Cluster Development Initiatives Limited
Mumbai. This is due to higher total consumption expenditure in urban Delhi. The monthly per
capita consumption expenditures on food items in urban Delhi and urban Mumbai are about Rs.
489 and Rs. 546 respectively.
Table 5.6: Monthly Per Capita Consumption Expenditures on Food and Non-Food Items
Items Maharashtra (Urban) Delhi (Urban)
Cereals 102.24 81.69
Pulses 26.64 24.674
Milk & Milk Products 81.98 160.916
Other Food Items 277.89 278.652
Total - Food Items 488.75 545.932
Clothing 36.55 94.976
Fuel & Light 121.85 137.502
Other Non-food items 585.21 735.376
Total - Non Food Items 743.61 967.854
Source: DES, Govt. of National Capital Territory of Delhi and DES, Govt. of Maharashtra
From the above analysis of demographics, economic condition and the market size of the six
cities, NCR is emerging as the most potential location for setting up a SDC. It has the highest
population with a large young consuming class, good economic condition and a huge market for
retail and food items. Hence, NCR has been identified as the most potential location for setting
up of the pilot SDC.
5.3 Location Advantages of NCR
NCR is centrally located and has very good road, rail and air connectivity with most parts of the
country. It is also situated close to the major production areas with vegetable growing areas of
Punjab, Haryana, and Uttar Pradesh in close vicinity. Also, the major fruit growing areas in
Himachal Pradesh, Jammu and Kashmir, Uttar Pradesh, Uttarakhand and Punjab are nearby and
are well connected to NCR. Same is the case with the cereal and pulses growing areas in North
India. Moreover, 3 Mega Food Parks (Punjab, Uttarakhand and Uttar Pradesh), 2 Terminal
Markets and an abattoir will be coming up in the surrounding regions of North India which can
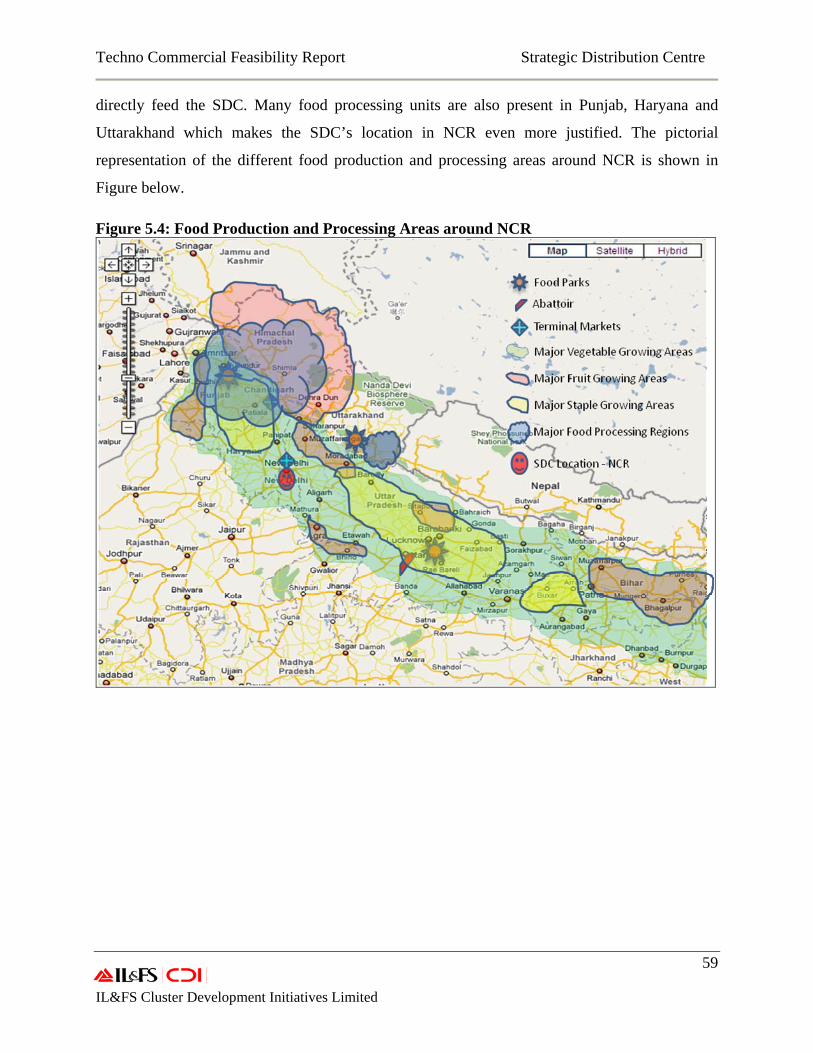
Techno Commercial Feasibility Report Strategic Distribution Centre
59 IL&FS Cluster Development Initiatives Limited
directly feed the SDC. Many food processing units are also present in Punjab, Haryana and
Uttarakhand which makes the SDC’s location in NCR even more justified. The pictorial
representation of the different food production and processing areas around NCR is shown in
Figure below.
Figure 5.4: Food Production and Processing Areas around NCR
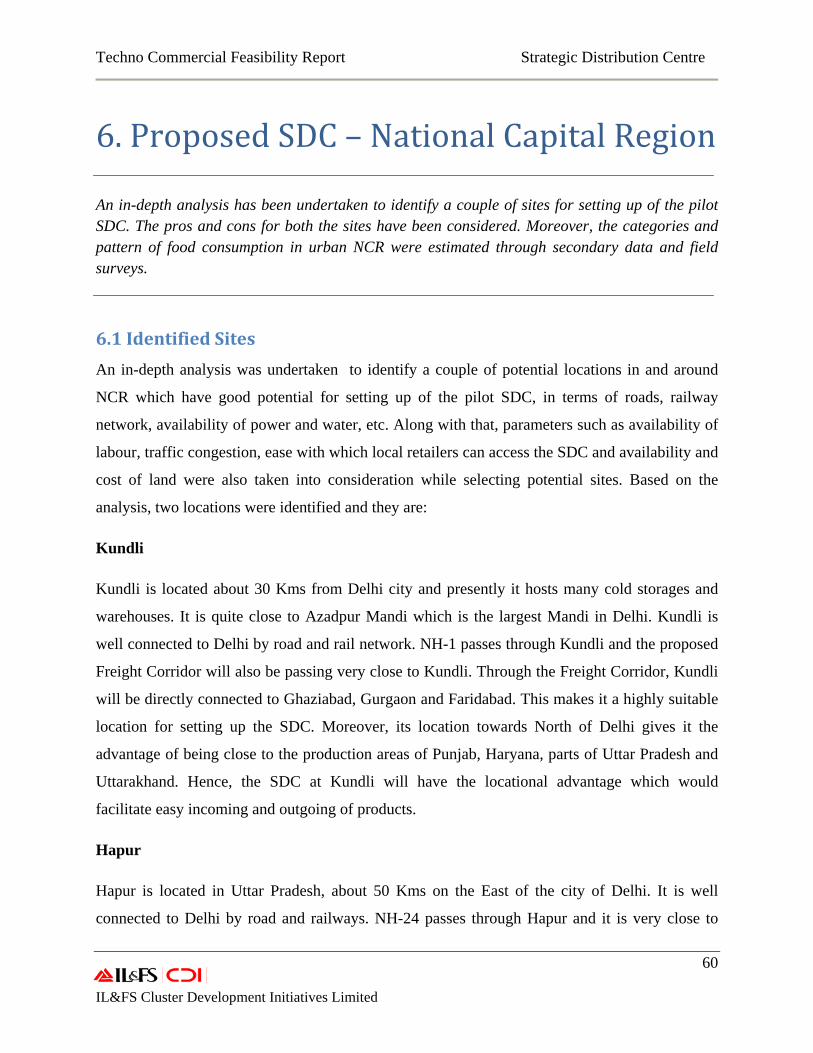
Techno Commercial Feasibility Report Strategic Distribution Centre
60 IL&FS Cluster Development Initiatives Limited
6. Proposed SDC – National Capital Region
An in-depth analysis has been undertaken to identify a couple of sites for setting up of the pilot SDC. The pros and cons for both the sites have been considered. Moreover, the categories and pattern of food consumption in urban NCR were estimated through secondary data and field surveys.
6.1 Identified Sites
An in-depth analysis was undertaken to identify a couple of potential locations in and around
NCR which have good potential for setting up of the pilot SDC, in terms of roads, railway
network, availability of power and water, etc. Along with that, parameters such as availability of
labour, traffic congestion, ease with which local retailers can access the SDC and availability and
cost of land were also taken into consideration while selecting potential sites. Based on the
analysis, two locations were identified and they are:
Kundli
Kundli is located about 30 Kms from Delhi city and presently it hosts many cold storages and
warehouses. It is quite close to Azadpur Mandi which is the largest Mandi in Delhi. Kundli is
well connected to Delhi by road and rail network. NH-1 passes through Kundli and the proposed
Freight Corridor will also be passing very close to Kundli. Through the Freight Corridor, Kundli
will be directly connected to Ghaziabad, Gurgaon and Faridabad. This makes it a highly suitable
location for setting up the SDC. Moreover, its location towards North of Delhi gives it the
advantage of being close to the production areas of Punjab, Haryana, parts of Uttar Pradesh and
Uttarakhand. Hence, the SDC at Kundli will have the locational advantage which would
facilitate easy incoming and outgoing of products.
Hapur
Hapur is located in Uttar Pradesh, about 50 Kms on the East of the city of Delhi. It is well
connected to Delhi by road and railways. NH-24 passes through Hapur and it is very close to
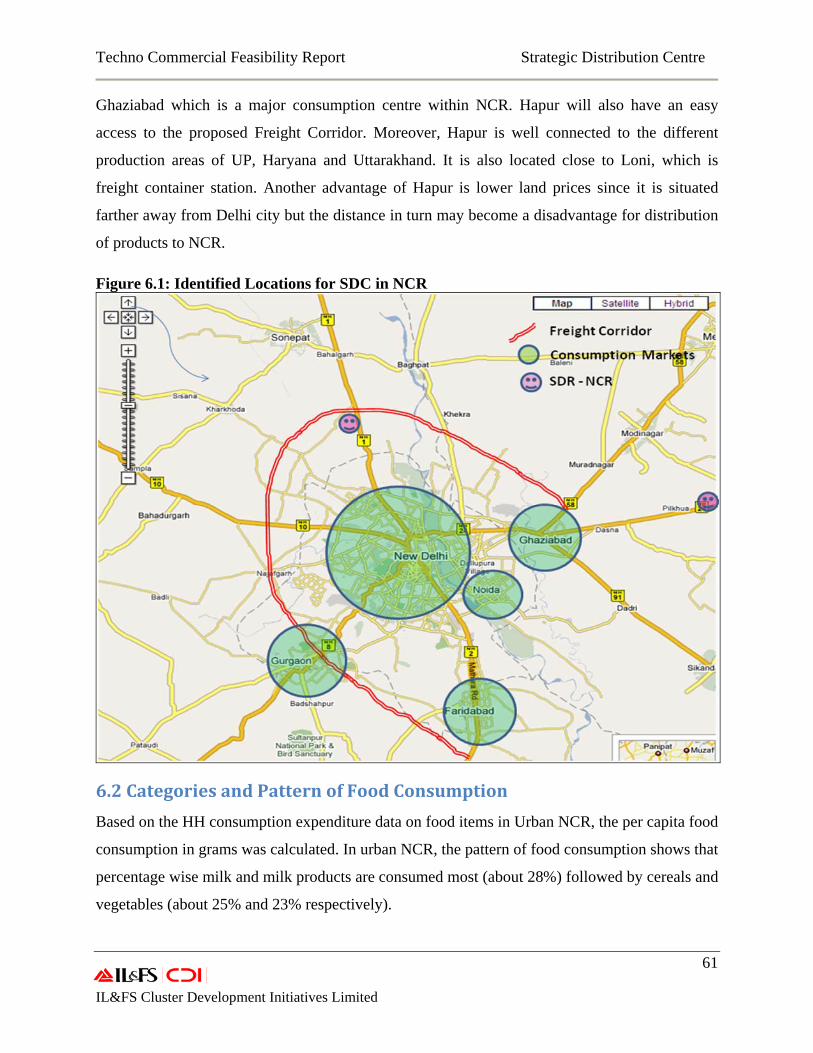
Techno Commercial Feasibility Report Strategic Distribution Centre
61 IL&FS Cluster Development Initiatives Limited
Ghaziabad which is a major consumption centre within NCR. Hapur will also have an easy
access to the proposed Freight Corridor. Moreover, Hapur is well connected to the different
production areas of UP, Haryana and Uttarakhand. It is also located close to Loni, which is
freight container station. Another advantage of Hapur is lower land prices since it is situated
farther away from Delhi city but the distance in turn may become a disadvantage for distribution
of products to NCR.
Figure 6.1: Identified Locations for SDC in NCR
6.2 Categories and Pattern of Food Consumption
Based on the HH consumption expenditure data on food items in Urban NCR, the per capita food
consumption in grams was calculated. In urban NCR, the pattern of food consumption shows that
percentage wise milk and milk products are consumed most (about 28%) followed by cereals and
vegetables (about 25% and 23% respectively).
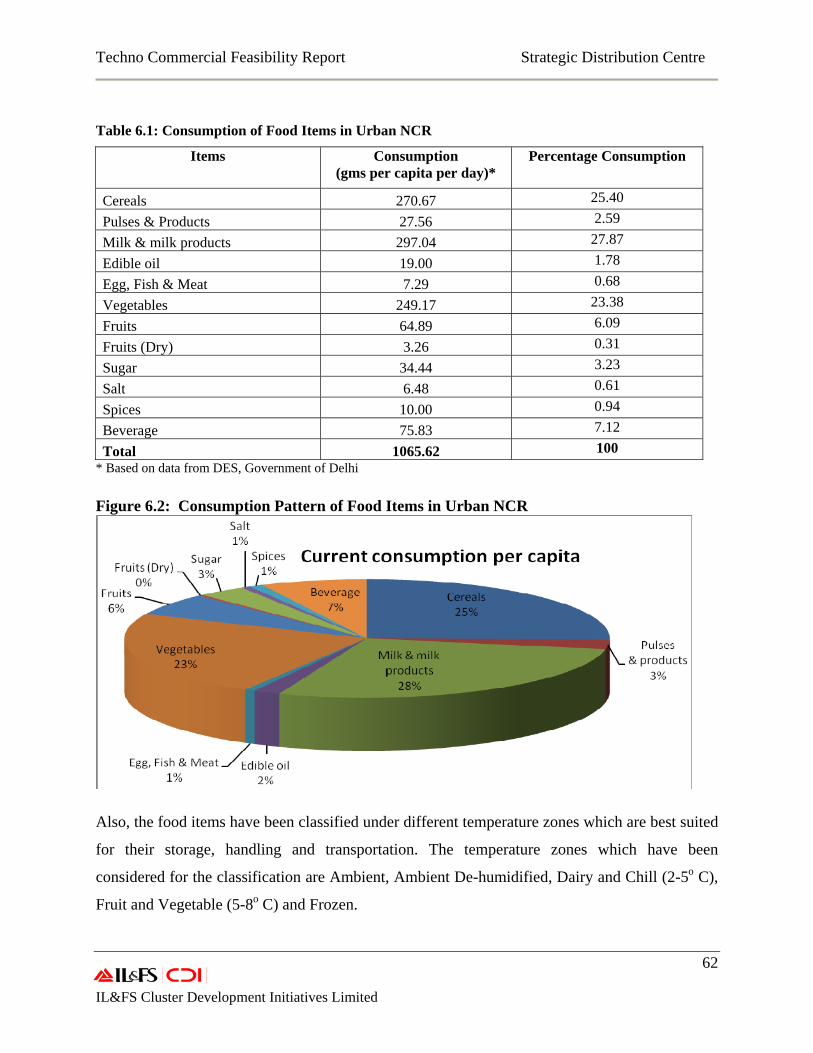
Techno Commercial Feasibility Report Strategic Distribution Centre
62 IL&FS Cluster Development Initiatives Limited
Table 6.1: Consumption of Food Items in Urban NCR
Items Consumption (gms per capita per day)*
Percentage Consumption
Cereals 270.67 25.40
Pulses & Products 27.56 2.59
Milk & milk products 297.04 27.87
Edible oil 19.00 1.78
Egg, Fish & Meat 7.29 0.68
Vegetables 249.17 23.38
Fruits 64.89 6.09
Fruits (Dry) 3.26 0.31
Sugar 34.44 3.23
Salt 6.48 0.61
Spices 10.00 0.94
Beverage 75.83 7.12
Total 1065.62 100 * Based on data from DES, Government of Delhi
Figure 6.2: Consumption Pattern of Food Items in Urban NCR
Also, the food items have been classified under different temperature zones which are best suited
for their storage, handling and transportation. The temperature zones which have been
considered for the classification are Ambient, Ambient De-humidified, Dairy and Chill (2-5o C),
Fruit and Vegetable (5-8o C) and Frozen.
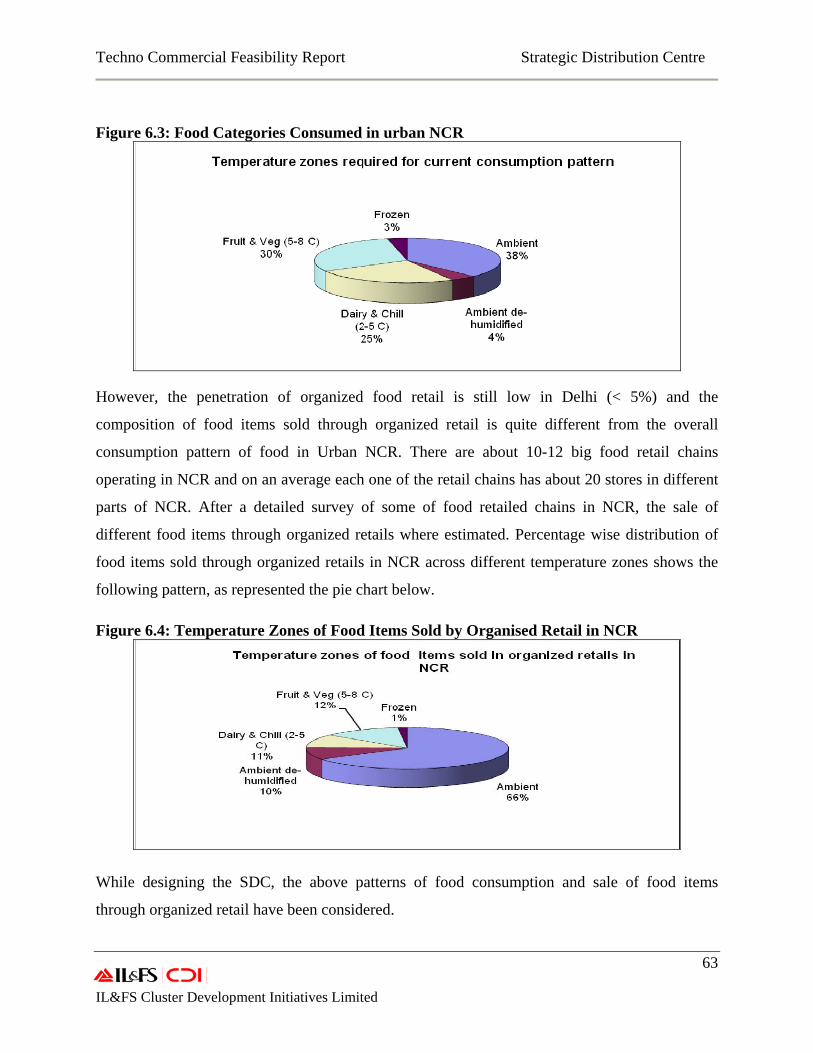
Techno Commercial Feasibility Report Strategic Distribution Centre
63 IL&FS Cluster Development Initiatives Limited
Figure 6.3: Food Categories Consumed in urban NCR
However, the penetration of organized food retail is still low in Delhi (< 5%) and the
composition of food items sold through organized retail is quite different from the overall
consumption pattern of food in Urban NCR. There are about 10-12 big food retail chains
operating in NCR and on an average each one of the retail chains has about 20 stores in different
parts of NCR. After a detailed survey of some of food retailed chains in NCR, the sale of
different food items through organized retails where estimated. Percentage wise distribution of
food items sold through organized retails in NCR across different temperature zones shows the
following pattern, as represented the pie chart below.
Figure 6.4: Temperature Zones of Food Items Sold by Organised Retail in NCR
While designing the SDC, the above patterns of food consumption and sale of food items
through organized retail have been considered.
Techno Commercial Feasibility Report Strategic Distribution Centre
64 IL&FS Cluster Development Initiatives Limited
7. Technical Details of SDC
The different product categories in terms of various temperature zones in SDC have been
discussed here. The operational processes, design and modeling of the SDC is also given in
details. A case study has been provided to illustrate the operations.
7.1 Product Categories
As seen in the previous chapters, the range of food currently sold through Supermarkets in India
falls into the following categories.
Ambient
Foods with medium to long shelf lives that do not require temperature control. It should be
noted that due to the potentially high temperatures in India ambient food may be required to be
kept below 25 to 30 0C. These are typically processed and packaged food in this category. The
products that will come in this category are: grains, pulses, tetra pack juices, concentrates, spices,
biscuits, honey, etc.
Ambient - de humidified
These are foods with similar characteristics to ambient but will be affected by high levels of
humidity. These are typically cereals and pulses that haven’t been packaged. The other products
that will come in this category are: salt, flour, etc.
Chill – Fruit and Vegetables
These are perishable items with short shelf lives so the time they spend in any distribution
facility is minimized and whilst within the facility the temperature is controlled. The range of
fruit and vegetables to be handled will have a range of optimum temperatures so a compromise
temperature is selected that best suits the full range of products. This temperature is usually
between 50C to 80C.
Chill – Dairy Products
A chill environment is also required for a further range of perishable foods such as cream, butter
margarine and yoghurts. There are also a number of fresh prepared foods such as pizza that are
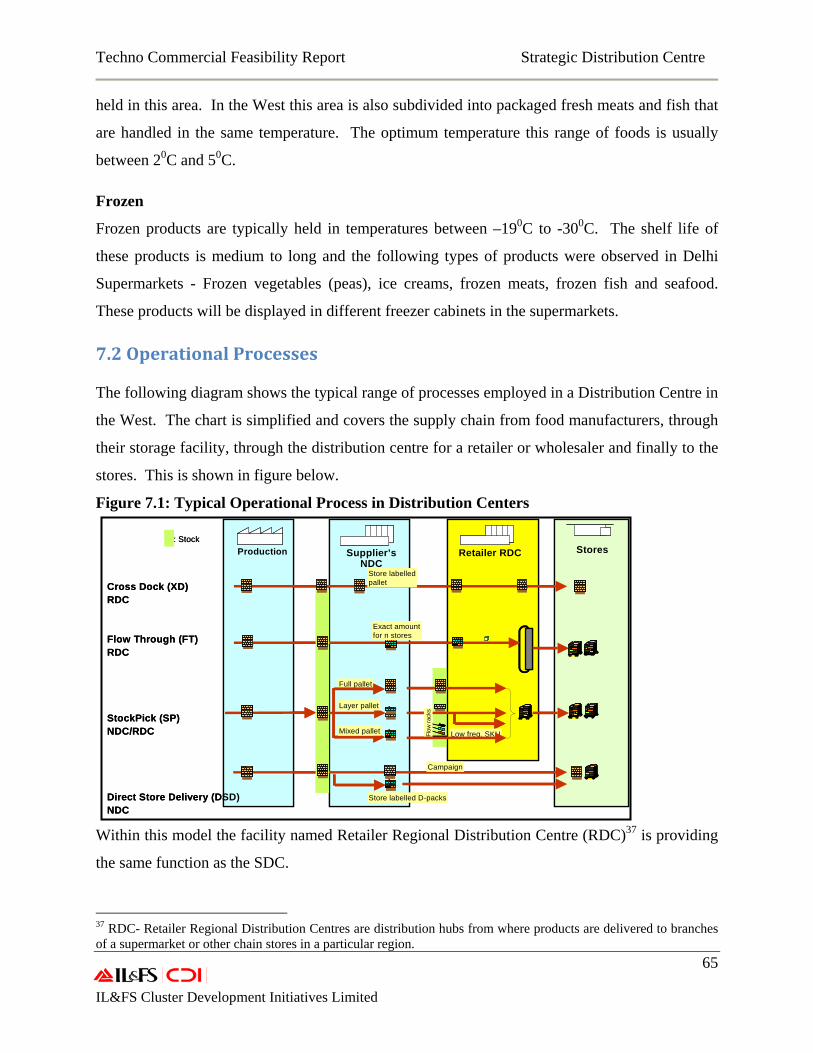
Techno Commercial Feasibility Report Strategic Distribution Centre
65 IL&FS Cluster Development Initiatives Limited
held in this area. In the West this area is also subdivided into packaged fresh meats and fish that
are handled in the same temperature. The optimum temperature this range of foods is usually
between 20C and 50C.
Frozen
Frozen products are typically held in temperatures between –190C to -300C. The shelf life of
these products is medium to long and the following types of products were observed in Delhi
Supermarkets - Frozen vegetables (peas), ice creams, frozen meats, frozen fish and seafood.
These products will be displayed in different freezer cabinets in the supermarkets.
7.2 Operational Processes
The following diagram shows the typical range of processes employed in a Distribution Centre in
the West. The chart is simplified and covers the supply chain from food manufacturers, through
their storage facility, through the distribution centre for a retailer or wholesaler and finally to the
stores. This is shown in figure below.
Figure 7.1: Typical Operational Process in Distribution Centers
Within this model the facility named Retailer Regional Distribution Centre (RDC)37 is providing
the same function as the SDC.
37 RDC- Retailer Regional Distribution Centres are distribution hubs from where products are delivered to branches of a supermarket or other chain stores in a particular region.
Production Retailer RDC Stores
Cross Dock (XD)RDC
Flow Through (FT)RDC
StockPick (SP)NDC/RDC
Direct Store Delivery (DSD) NDC
Layer pallet
Mixed pallet
Full pallet
Campaign
Low freq. SKU
: Stock
Store labelled D-packs
Store labelledpallet
Supplier’sNDC
Exact amountfor n stores
Flow
rack
s
Production Retailer RDC Stores
Cross Dock (XD)RDC
Flow Through (FT)RDC
StockPick (SP)NDC/RDC
Direct Store Delivery (DSD) NDC
Layer pallet
Mixed pallet
Full pallet
Campaign
Low freq. SKU
: Stock
Store labelled D-packs
Store labelledpallet
Supplier’sNDC
Exact amountfor n stores
Flow
rack
s
Techno Commercial Feasibility Report Strategic Distribution Centre
66 IL&FS Cluster Development Initiatives Limited
A brief description of the different processes is as follows:
Cross Dock Pallets
This is a very efficient method of distribution for Retailers and Wholesalers as they don’t hold
stock of the fastest moving items and handle only full pallets in and out of their distribution
facilities in a single day. The process is however dependant on a retail store requiring a full
pallet of a single product (SKU). As supermarkets in the Delhi area typically sell about 5 to 10
tonnes of food per supermarket per day there are very few products where full pallet quantities
(500 to 1,000kg) is used in a single or even several days. In the larger supermarkets in the West
(25 tonnes per day and over) this operational process is used for heavy and bulky items like
bottled water, soft drinks and beers.
Flow through.
Flow through is typically used for perishables products. These typically arrive in plastic crates
and cardboard cases and are often transported on pallets. Each retail store will require a number
of crates of each product rather than full pallets of each product. A typical process will be to
have an empty pallet on the floor for each retail store. As each product arrives in the SDC it can
be taken past the grid of retail store pallets and the correct number of crates of products put to
each store pallet. When a store pallet is full or all products have arrived and been distributed, the
store pallets can be despatched.
Typically there will be no products left in the facility at the end of the picking period. There are
some exceptions to this for products that require a chill environment but have longer shelf lives,
such as butter and margarine. In the West typical foods handled this way include – fruit and
vegetables, dairy products, fresh meat and fish, ready to eat meals. This method ensures that
fresh products arrive at the stores with the minimum lead times, but this method requires a daily
delivery of the exact quantities of all products required for all stores.
Pick from stock
If the shelf life of a product is longer there are benefits in ordering and receiving larger quantities
of products from suppliers that will meet the demand of all stores for one or two weeks. This
stock holding is held at the SDC and the exact quantities of products for each store are picked
daily or even every other day. This buffer of stock not only provides a better purchase price
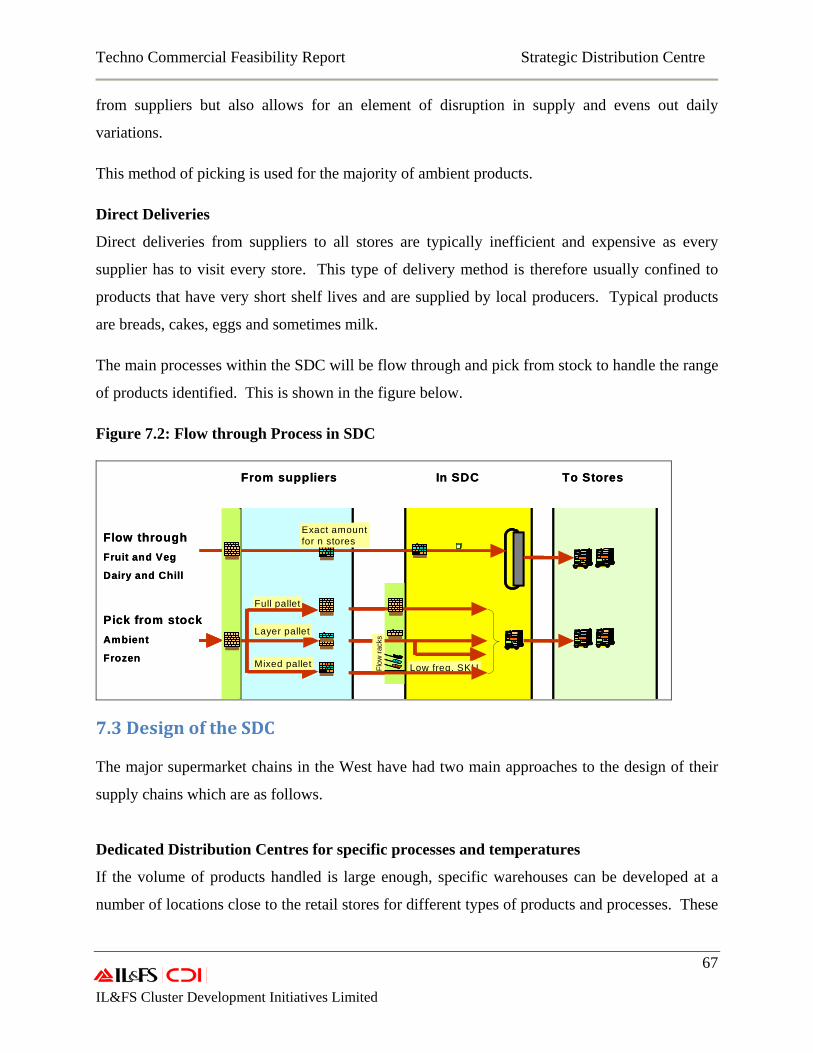
Techno Commercial Feasibility Report Strategic Distribution Centre
67 IL&FS Cluster Development Initiatives Limited
from suppliers but also allows for an element of disruption in supply and evens out daily
variations.
This method of picking is used for the majority of ambient products.
Direct Deliveries
Direct deliveries from suppliers to all stores are typically inefficient and expensive as every
supplier has to visit every store. This type of delivery method is therefore usually confined to
products that have very short shelf lives and are supplied by local producers. Typical products
are breads, cakes, eggs and sometimes milk.
The main processes within the SDC will be flow through and pick from stock to handle the range
of products identified. This is shown in the figure below.
Figure 7.2: Flow through Process in SDC
Layer pallet
Mixed pallet
Full pallet
Low freq. SKU
Exact amountfor n stores
Flow
rack
s
Layer pallet
Mixed pallet
Full pallet
Low freq. SKU
Exact amountfor n stores
Flow
rack
s
Flow throughFruit and Veg
Dairy and Chill
Pick from stockAmbient
Frozen
From suppliers In SDC To Stores
Layer pallet
Mixed pallet
Full pallet
Low freq. SKU
Exact amountfor n stores
Flow
rack
s
Layer pallet
Mixed pallet
Full pallet
Low freq. SKU
Exact amountfor n stores
Flow
rack
s
Flow throughFruit and Veg
Dairy and Chill
Pick from stockAmbient
Frozen
From suppliers In SDC To Stores
7.3 Design of the SDC
The major supermarket chains in the West have had two main approaches to the design of their
supply chains which are as follows.
Dedicated Distribution Centres for specific processes and temperatures
If the volume of products handled is large enough, specific warehouses can be developed at a
number of locations close to the retail stores for different types of products and processes. These
Techno Commercial Feasibility Report Strategic Distribution Centre
68 IL&FS Cluster Development Initiatives Limited
can be ambient stocked warehouses for fast and slow moving products; temperature controlled
stores for the flow through of fresh foods and frozen warehouses.
These dedicated warehouses work well for the very large companies as they have the volumes
that require large full vehicles delivering to the Distribution Centres and full vehicles of single
product types (ambient, chill etc) servicing the stores. Companies like Tesco in the UK have
taken this approach.
Multi temperature “Composite” Distribution Centres
For smaller retail distribution operations in the West, the Ambient, Chill and Frozen operations
are often kept together in one building and are known as a “Composite” Distribution Centre.
This brings efficiencies with the building, management team and transport to and from the DC.
This approach has been taken by the small retailers where one Composite DC will serve a region
with all products. It is not however exclusive to the smaller retailers as Wal-Mart have
implemented large Composite DCs to serve regions with food products in the USA.
As a result of the relatively small volumes that the developing food retailers are handling in each
region in India we can clearly identify that Composite distribution centres will best meet the food
retail requirements.
Thermal Efficiency
A major operating cost of a temperature controlled DC will be from the cooling, chilling and
freezing equipment. The thermal efficiency of the building is therefore important and will be
dependent on the following:
• A large chill or frozen area is more efficient than several small areas;
• The ratio of the cubic volume within a warehouse to the outside surface area;
• A single large chiller or freezer plant is more efficient than several small units;
• The coldest areas should have the most insulation;
• The temperature profile across each dividing wall should be minimized.
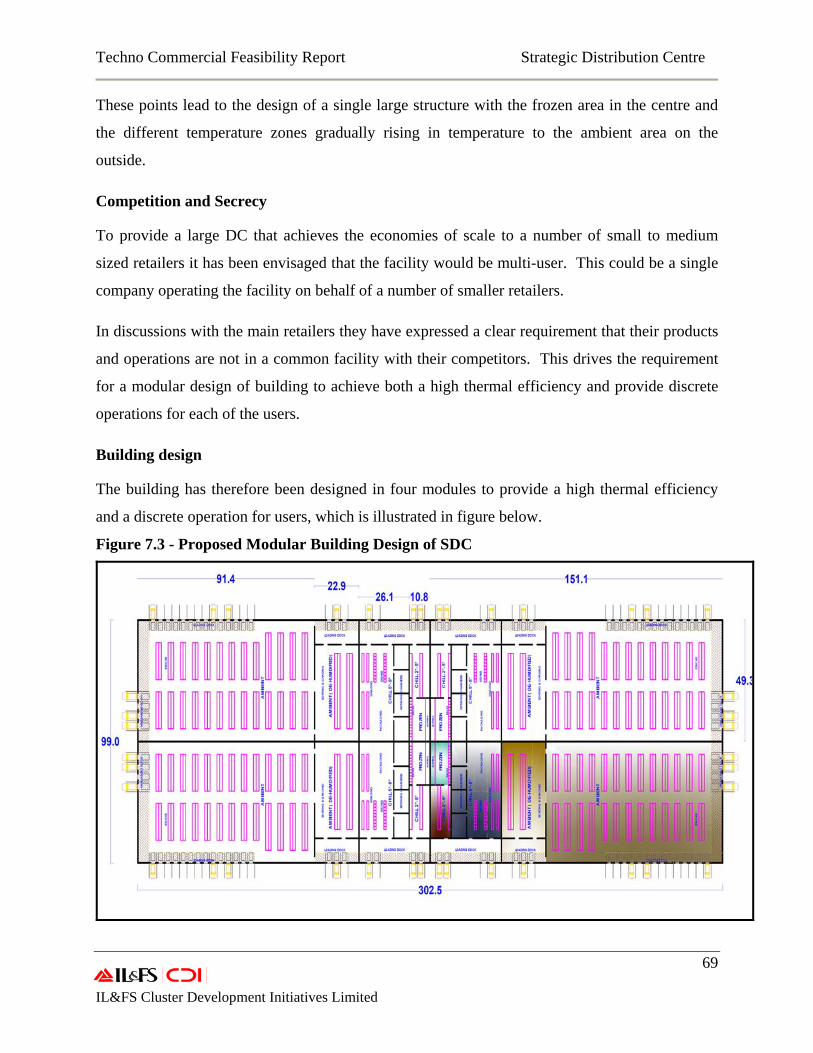
Techno Commercial Feasibility Report Strategic Distribution Centre
69 IL&FS Cluster Development Initiatives Limited
These points lead to the design of a single large structure with the frozen area in the centre and
the different temperature zones gradually rising in temperature to the ambient area on the
outside.
Competition and Secrecy
To provide a large DC that achieves the economies of scale to a number of small to medium
sized retailers it has been envisaged that the facility would be multi-user. This could be a single
company operating the facility on behalf of a number of smaller retailers.
In discussions with the main retailers they have expressed a clear requirement that their products
and operations are not in a common facility with their competitors. This drives the requirement
for a modular design of building to achieve both a high thermal efficiency and provide discrete
operations for each of the users.
Building design
The building has therefore been designed in four modules to provide a high thermal efficiency
and a discrete operation for users, which is illustrated in figure below.
Figure 7.3 - Proposed Modular Building Design of SDC
Techno Commercial Feasibility Report Strategic Distribution Centre
70 IL&FS Cluster Development Initiatives Limited
The shaded section represents one of the modules that include the following features.
• Discrete trucking operations into each of the modules;
• Proportion of Ambient, de-humidified, chill zones and frozen to be customised for each user;
• Complete self contained operational facility for each user;
• High thermal efficiency due to the freezer stores being in the centre of the building
and the temperature gradually increasing to the ambient zones at the edge of the
building;
• A central service corridor for service access to common cooling and freezing plant.
7.4 Modeling the SDC From the research work undertaken into the retail food sector in the Delhi area the following has
been established.
• The consumption pattern of the of the local inhabitants by food type (as shown in
Chapter 6);
• The range of these foods currently supplied through the supermarkets (as shown in
Chapter 6);
• The temperature and process requirements of handling these foods through an SDC;
• The number of main retailers in NCR;
• The number of stores run by each of the main retailers in NCR;
• The typical volume (in MT) of products handled by these stores on a daily basis.
This information has been modeled for the basis of the facility design.
Growth
While designing a module, the daily throughput in metric tons (MT) that could be expected from
one of the local Food retailers has been taken as the starting point. We have used 200 MT per
day for one module which represents 20 stores at 10 MT per store. Only the largest retailers
such as Reliance currently have this requirement but as the others are growing very quickly and
the facility will take up to two years to become operational this is thought to be the optimal
starting point.
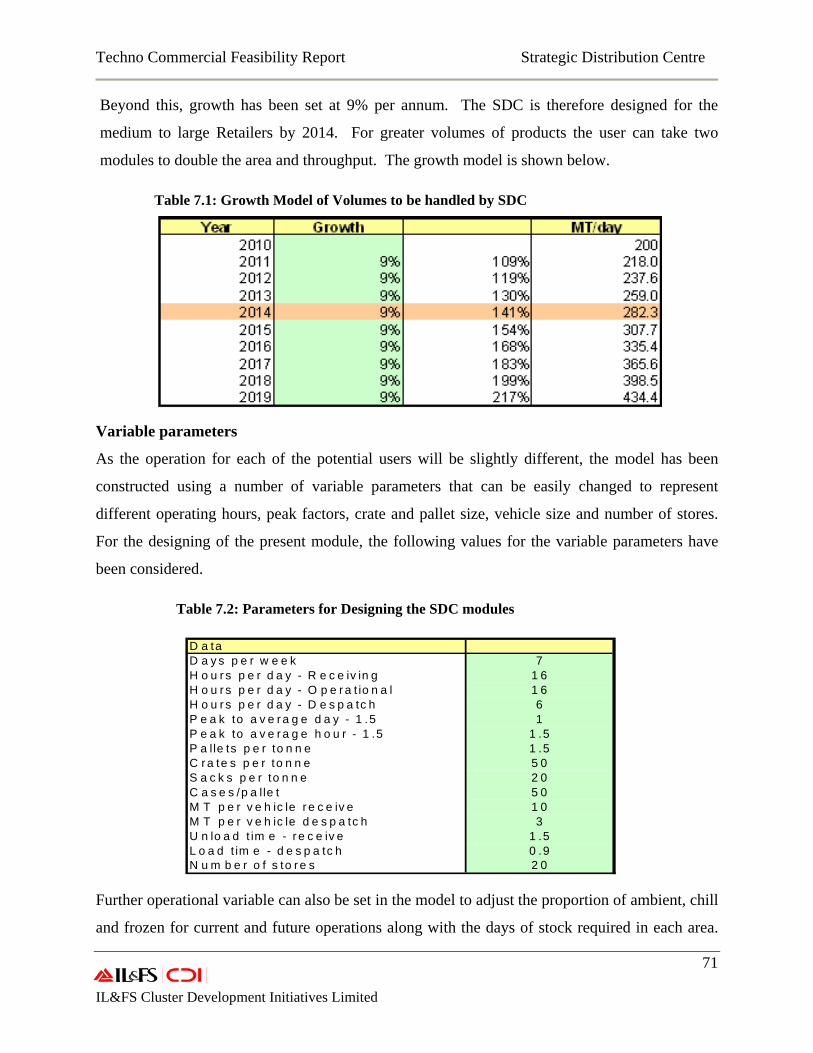
Techno Commercial Feasibility Report Strategic Distribution Centre
71 IL&FS Cluster Development Initiatives Limited
Beyond this, growth has been set at 9% per annum. The SDC is therefore designed for the
medium to large Retailers by 2014. For greater volumes of products the user can take two
modules to double the area and throughput. The growth model is shown below.
Table 7.1: Growth Model of Volumes to be handled by SDC
Variable parameters
As the operation for each of the potential users will be slightly different, the model has been
constructed using a number of variable parameters that can be easily changed to represent
different operating hours, peak factors, crate and pallet size, vehicle size and number of stores.
For the designing of the present module, the following values for the variable parameters have
been considered.
Table 7.2: Parameters for Designing the SDC modules
D a ta D a y s p e r w e e k 7H o u r s p e r d a y - R e c e iv in g 1 6H o u r s p e r d a y - O p e r a t io n a l 1 6H o u r s p e r d a y - D e s p a tc h 6P e a k to a v e r a g e d a y - 1 .5 1P e a k to a v e r a g e h o u r - 1 .5 1 .5P a lle ts p e r to n n e 1 .5C r a te s p e r to n n e 5 0S a c k s p e r to n n e 2 0C a s e s /p a lle t 5 0M T p e r v e h ic le r e c e iv e 1 0M T p e r v e h ic le d e s p a tc h 3U n lo a d t im e - r e c e iv e 1 .5L o a d t im e - d e s p a tc h 0 .9N u m b e r o f s to r e s 2 0
Further operational variable can also be set in the model to adjust the proportion of ambient, chill
and frozen for current and future operations along with the days of stock required in each area.
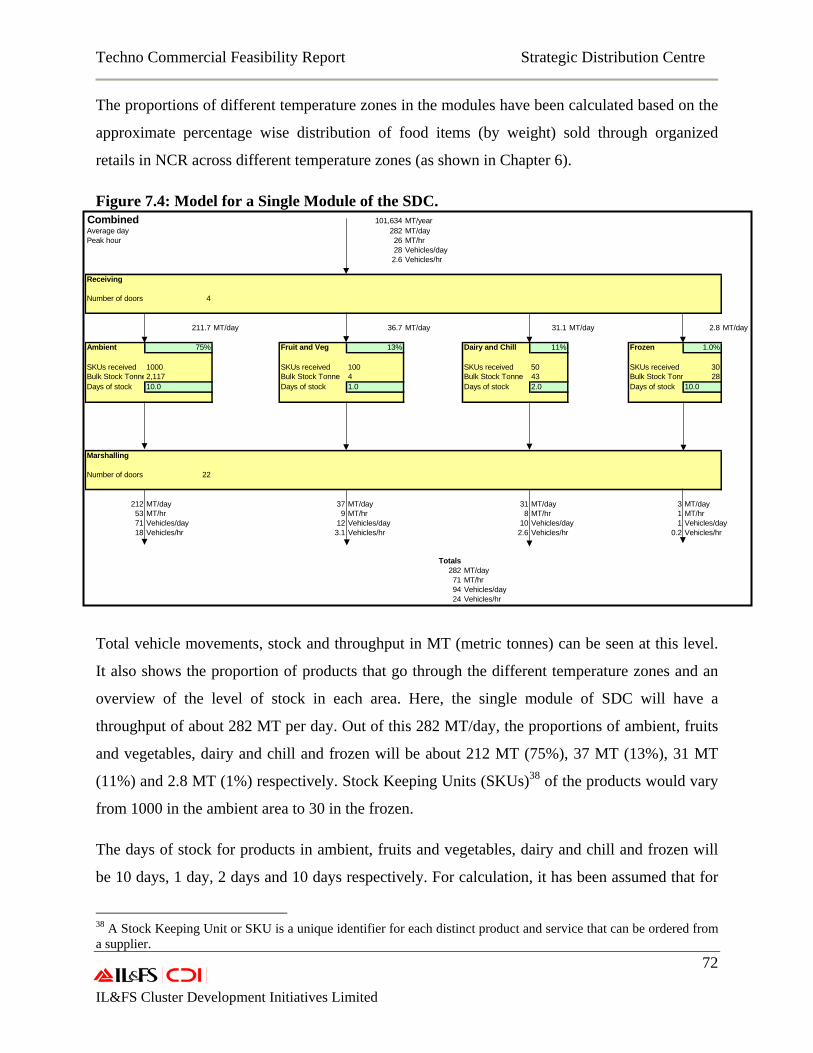
Techno Commercial Feasibility Report Strategic Distribution Centre
72 IL&FS Cluster Development Initiatives Limited
The proportions of different temperature zones in the modules have been calculated based on the
approximate percentage wise distribution of food items (by weight) sold through organized
retails in NCR across different temperature zones (as shown in Chapter 6).
Figure 7.4: Model for a Single Module of the SDC.
Total vehicle movements, stock and throughput in MT (metric tonnes) can be seen at this level.
It also shows the proportion of products that go through the different temperature zones and an
overview of the level of stock in each area. Here, the single module of SDC will have a
throughput of about 282 MT per day. Out of this 282 MT/day, the proportions of ambient, fruits
and vegetables, dairy and chill and frozen will be about 212 MT (75%), 37 MT (13%), 31 MT
(11%) and 2.8 MT (1%) respectively. Stock Keeping Units (SKUs)38 of the products would vary
from 1000 in the ambient area to 30 in the frozen.
The days of stock for products in ambient, fruits and vegetables, dairy and chill and frozen will
be 10 days, 1 day, 2 days and 10 days respectively. For calculation, it has been assumed that for
38 A Stock Keeping Unit or SKU is a unique identifier for each distinct product and service that can be ordered from a supplier.
Combined 101,634 MT/yearAverage day 282 MT/dayPeak hour 26 MT/hr
28 Vehicles/day2.6 Vehicles/hr
Receiving
Number of doors 4
211.7 MT/day 36.7 MT/day 31.1 MT/day 2.8 MT/day
Ambient 75% Fruit and Veg 13% Dairy and Chill 11% Frozen 1.0%
SKUs received 1000 SKUs received 100 SKUs received 50 SKUs received 30Bulk Stock Tonne2,117 Bulk Stock Tonne 4 Bulk Stock Tonne 43 Bulk Stock Tonn 28Days of stock 10.0 Days of stock 1.0 Days of stock 2.0 Days of stock 10.0
Marshalling
Number of doors 22
212 MT/day 37 MT/day 31 MT/day 3 MT/day53 MT/hr 9 MT/hr 8 MT/hr 1 MT/hr71 Vehicles/day 12 Vehicles/day 10 Vehicles/day 1 Vehicles/day18 Vehicles/hr 3.1 Vehicles/hr 2.6 Vehicles/hr 0.2 Vehicles/hr
Totals282 MT/day71 MT/hr94 Vehicles/day24 Vehicles/hr
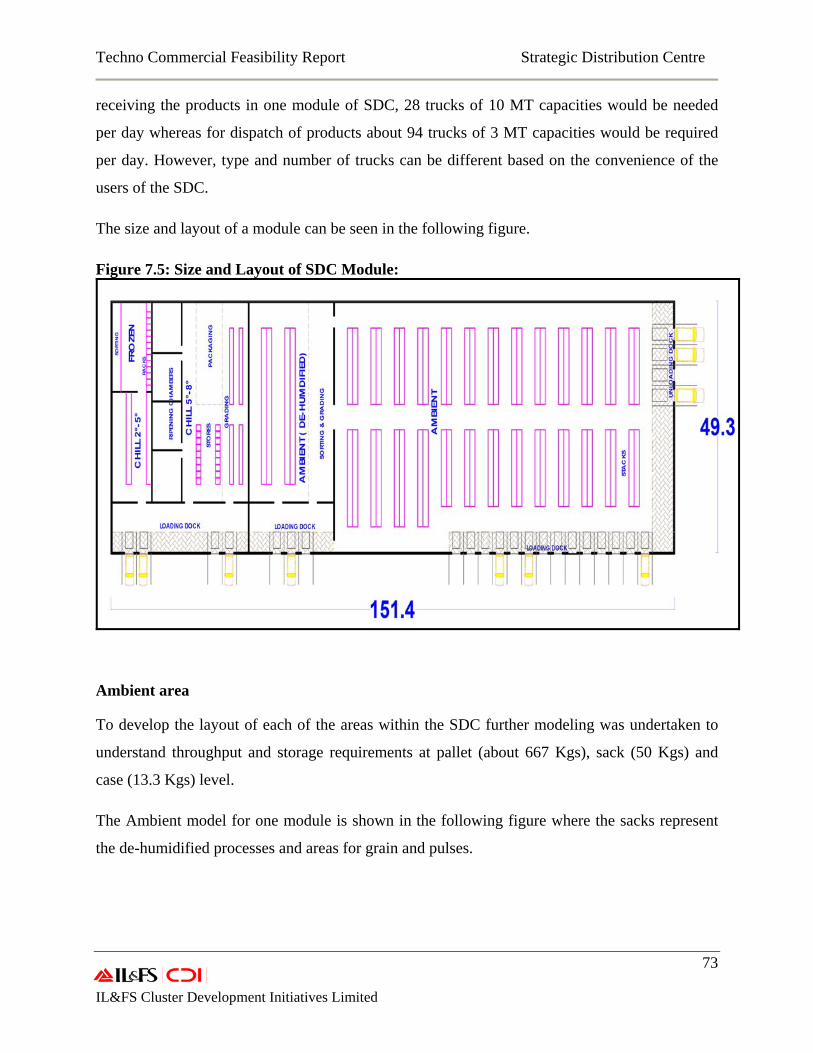
Techno Commercial Feasibility Report Strategic Distribution Centre
73 IL&FS Cluster Development Initiatives Limited
receiving the products in one module of SDC, 28 trucks of 10 MT capacities would be needed
per day whereas for dispatch of products about 94 trucks of 3 MT capacities would be required
per day. However, type and number of trucks can be different based on the convenience of the
users of the SDC.
The size and layout of a module can be seen in the following figure.
Figure 7.5: Size and Layout of SDC Module:
Ambient area
To develop the layout of each of the areas within the SDC further modeling was undertaken to
understand throughput and storage requirements at pallet (about 667 Kgs), sack (50 Kgs) and
case (13.3 Kgs) level.
The Ambient model for one module is shown in the following figure where the sacks represent
the de-humidified processes and areas for grain and pulses.
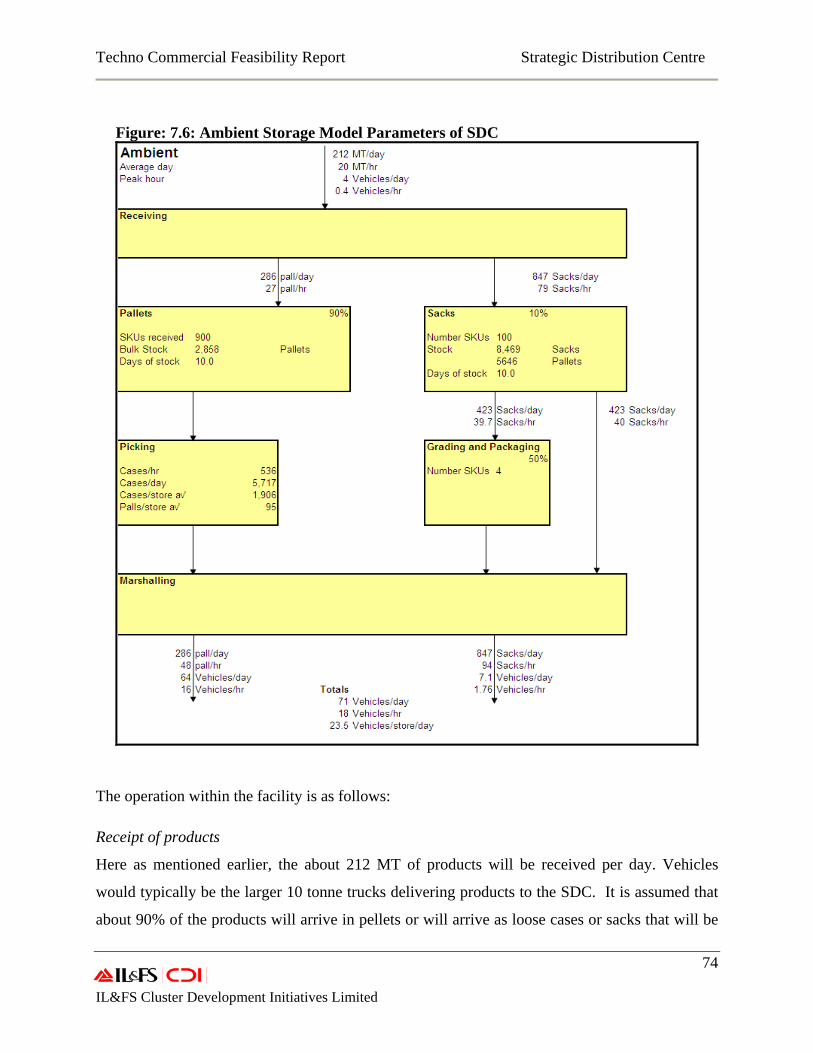
Techno Commercial Feasibility Report Strategic Distribution Centre
74 IL&FS Cluster Development Initiatives Limited
Figure: 7.6: Ambient Storage Model Parameters of SDC
The operation within the facility is as follows:
Receipt of products
Here as mentioned earlier, the about 212 MT of products will be received per day. Vehicles
would typically be the larger 10 tonne trucks delivering products to the SDC. It is assumed that
about 90% of the products will arrive in pellets or will arrive as loose cases or sacks that will be
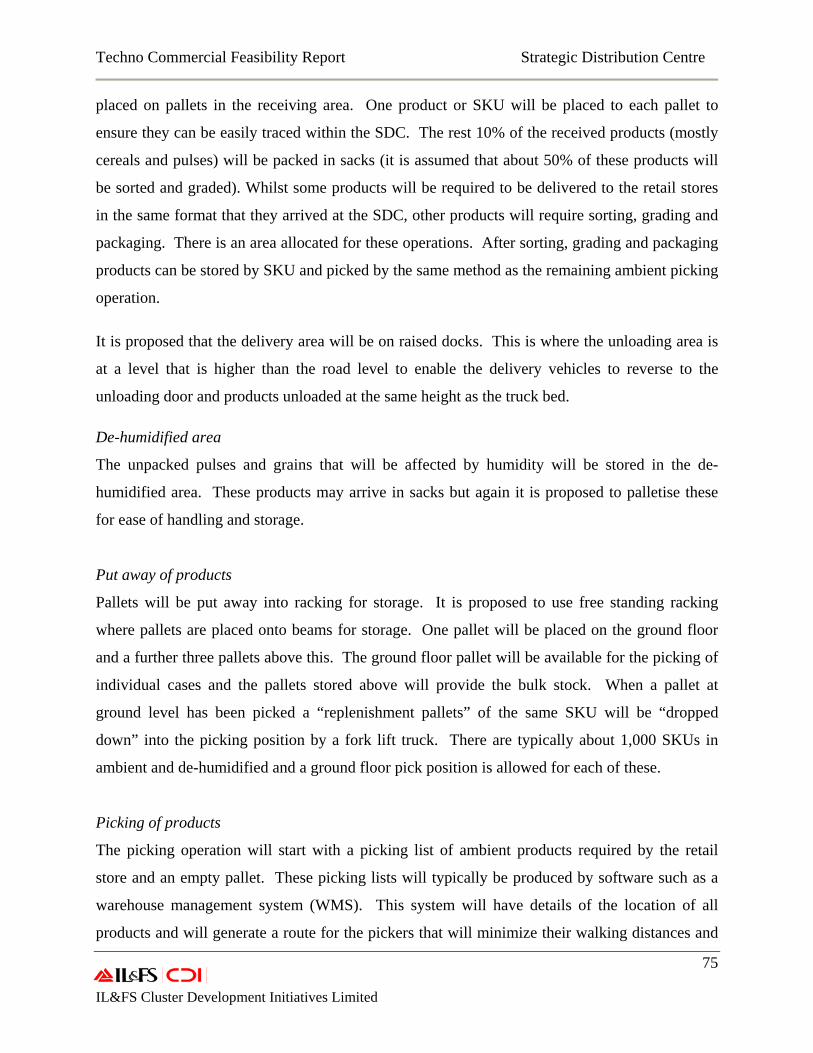
Techno Commercial Feasibility Report Strategic Distribution Centre
75 IL&FS Cluster Development Initiatives Limited
placed on pallets in the receiving area. One product or SKU will be placed to each pallet to
ensure they can be easily traced within the SDC. The rest 10% of the received products (mostly
cereals and pulses) will be packed in sacks (it is assumed that about 50% of these products will
be sorted and graded). Whilst some products will be required to be delivered to the retail stores
in the same format that they arrived at the SDC, other products will require sorting, grading and
packaging. There is an area allocated for these operations. After sorting, grading and packaging
products can be stored by SKU and picked by the same method as the remaining ambient picking
operation.
It is proposed that the delivery area will be on raised docks. This is where the unloading area is
at a level that is higher than the road level to enable the delivery vehicles to reverse to the
unloading door and products unloaded at the same height as the truck bed.
De-humidified area
The unpacked pulses and grains that will be affected by humidity will be stored in the de-
humidified area. These products may arrive in sacks but again it is proposed to palletise these
for ease of handling and storage.
Put away of products
Pallets will be put away into racking for storage. It is proposed to use free standing racking
where pallets are placed onto beams for storage. One pallet will be placed on the ground floor
and a further three pallets above this. The ground floor pallet will be available for the picking of
individual cases and the pallets stored above will provide the bulk stock. When a pallet at
ground level has been picked a “replenishment pallets” of the same SKU will be “dropped
down” into the picking position by a fork lift truck. There are typically about 1,000 SKUs in
ambient and de-humidified and a ground floor pick position is allowed for each of these.
Picking of products
The picking operation will start with a picking list of ambient products required by the retail
store and an empty pallet. These picking lists will typically be produced by software such as a
warehouse management system (WMS). This system will have details of the location of all
products and will generate a route for the pickers that will minimize their walking distances and
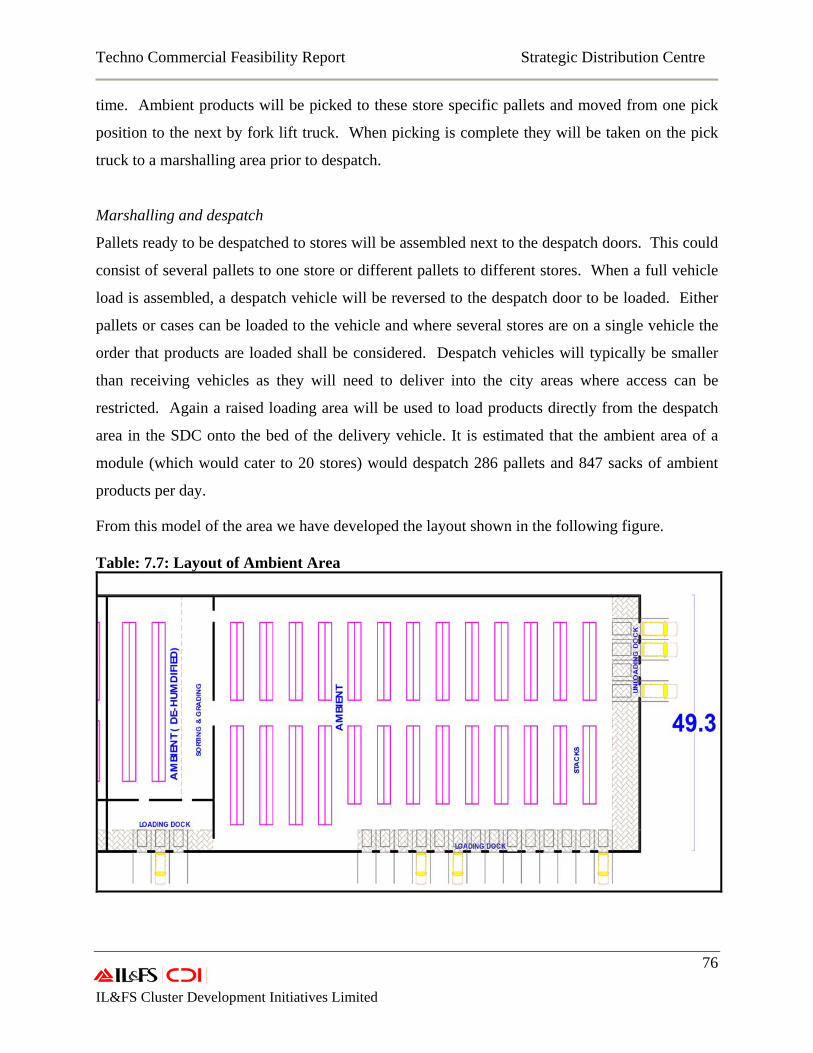
Techno Commercial Feasibility Report Strategic Distribution Centre
76 IL&FS Cluster Development Initiatives Limited
time. Ambient products will be picked to these store specific pallets and moved from one pick
position to the next by fork lift truck. When picking is complete they will be taken on the pick
truck to a marshalling area prior to despatch.
Marshalling and despatch
Pallets ready to be despatched to stores will be assembled next to the despatch doors. This could
consist of several pallets to one store or different pallets to different stores. When a full vehicle
load is assembled, a despatch vehicle will be reversed to the despatch door to be loaded. Either
pallets or cases can be loaded to the vehicle and where several stores are on a single vehicle the
order that products are loaded shall be considered. Despatch vehicles will typically be smaller
than receiving vehicles as they will need to deliver into the city areas where access can be
restricted. Again a raised loading area will be used to load products directly from the despatch
area in the SDC onto the bed of the delivery vehicle. It is estimated that the ambient area of a
module (which would cater to 20 stores) would despatch 286 pallets and 847 sacks of ambient
products per day.
From this model of the area we have developed the layout shown in the following figure. Table: 7.7: Layout of Ambient Area
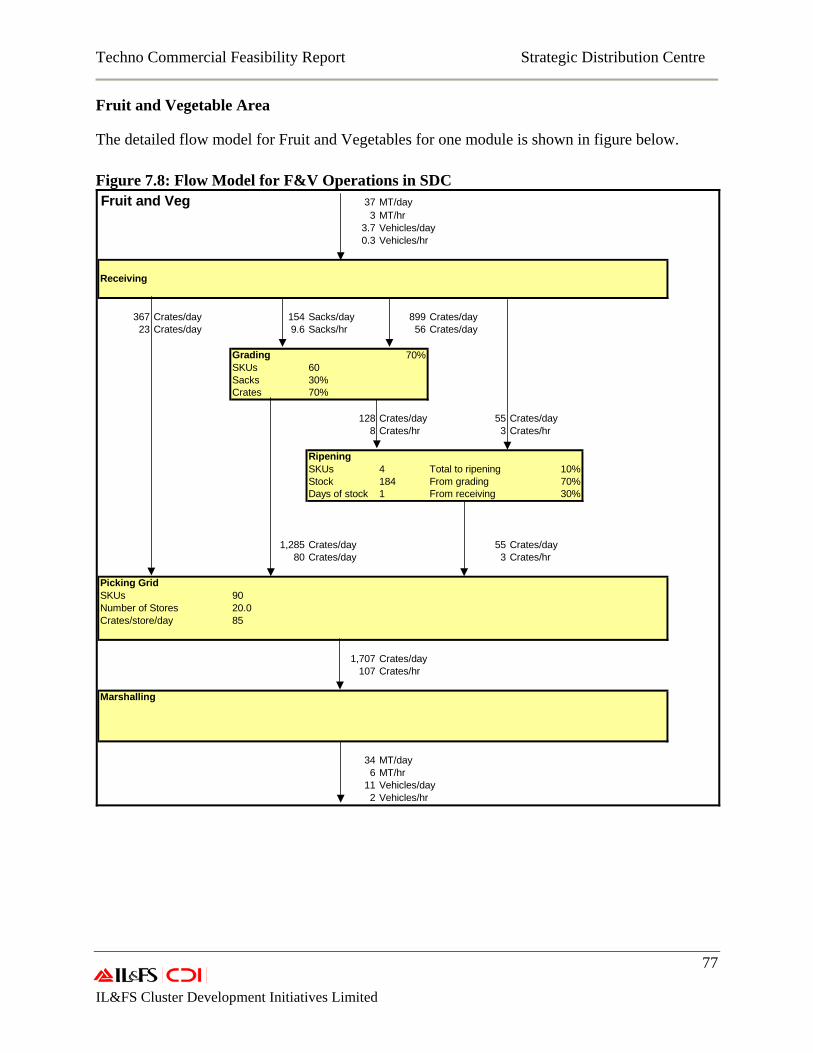
Techno Commercial Feasibility Report Strategic Distribution Centre
77 IL&FS Cluster Development Initiatives Limited
Fruit and Vegetable Area
The detailed flow model for Fruit and Vegetables for one module is shown in figure below.
Figure 7.8: Flow Model for F&V Operations in SDC Fruit and Veg 37 MT/day
3 MT/hr3.7 Vehicles/day0.3 Vehicles/hr
Receiving
367 Crates/day 154 Sacks/day 899 Crates/day23 Crates/day 9.6 Sacks/hr 56 Crates/day
Grading 70%SKUs 60Sacks 30%Crates 70%
128 Crates/day 55 Crates/day8 Crates/hr 3 Crates/hr
RipeningSKUs 4 Total to ripening 10%Stock 184 From grading 70%Days of stock 1 From receiving 30%
1,285 Crates/day 55 Crates/day80 Crates/day 3 Crates/hr
Picking GridSKUs 90Number of Stores 20.0Crates/store/day 85
1,707 Crates/day107 Crates/hr
Marshalling
34 MT/day6 MT/hr
11 Vehicles/day2 Vehicles/hr
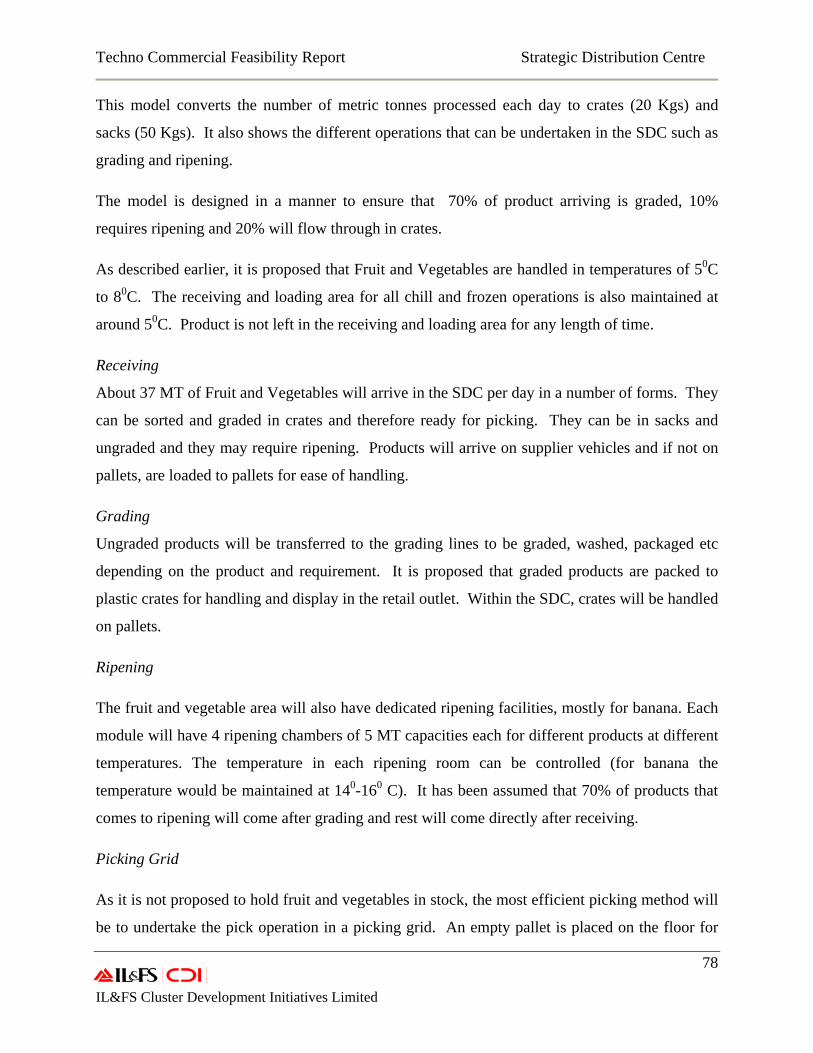
Techno Commercial Feasibility Report Strategic Distribution Centre
78 IL&FS Cluster Development Initiatives Limited
This model converts the number of metric tonnes processed each day to crates (20 Kgs) and
sacks (50 Kgs). It also shows the different operations that can be undertaken in the SDC such as
grading and ripening.
The model is designed in a manner to ensure that 70% of product arriving is graded, 10%
requires ripening and 20% will flow through in crates.
As described earlier, it is proposed that Fruit and Vegetables are handled in temperatures of 50C
to 80C. The receiving and loading area for all chill and frozen operations is also maintained at
around 50C. Product is not left in the receiving and loading area for any length of time.
Receiving
About 37 MT of Fruit and Vegetables will arrive in the SDC per day in a number of forms. They
can be sorted and graded in crates and therefore ready for picking. They can be in sacks and
ungraded and they may require ripening. Products will arrive on supplier vehicles and if not on
pallets, are loaded to pallets for ease of handling.
Grading
Ungraded products will be transferred to the grading lines to be graded, washed, packaged etc
depending on the product and requirement. It is proposed that graded products are packed to
plastic crates for handling and display in the retail outlet. Within the SDC, crates will be handled
on pallets.
Ripening
The fruit and vegetable area will also have dedicated ripening facilities, mostly for banana. Each
module will have 4 ripening chambers of 5 MT capacities each for different products at different
temperatures. The temperature in each ripening room can be controlled (for banana the
temperature would be maintained at 140-160 C). It has been assumed that 70% of products that
comes to ripening will come after grading and rest will come directly after receiving.
Picking Grid
As it is not proposed to hold fruit and vegetables in stock, the most efficient picking method will
be to undertake the pick operation in a picking grid. An empty pallet is placed on the floor for
Techno Commercial Feasibility Report Strategic Distribution Centre
79 IL&FS Cluster Development Initiatives Limited
each retail store and products are brought to each of these pallets. Crates of potatoes, onions
tomatoes etc can be placed to the empty retail store pallets and a mixed product pallet assembled
for each store.
Despatch
When assembled, these pallets are transferred to the marshalling area ready to be loaded to the
outgoing transport vehicles. Either pallets or individual cases can be loaded to the vehicles.
About 11 trucks of 3 MT capacities would be needed per day for the despatch.
The layout that was developed from these operational flows is shown in the following figure.
Figure 7.9: Layout of Chill and Frozen Sections Operational Flows
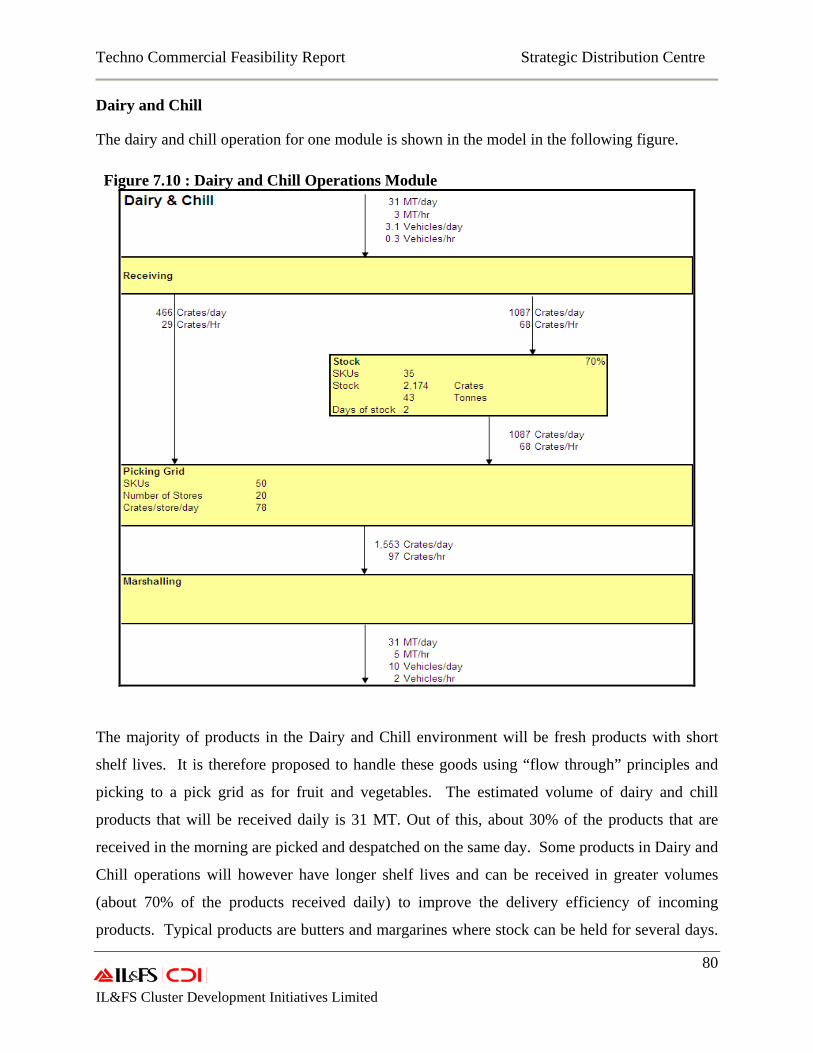
Techno Commercial Feasibility Report Strategic Distribution Centre
80 IL&FS Cluster Development Initiatives Limited
Dairy and Chill
The dairy and chill operation for one module is shown in the model in the following figure.
Figure 7.10 : Dairy and Chill Operations Module
The majority of products in the Dairy and Chill environment will be fresh products with short
shelf lives. It is therefore proposed to handle these goods using “flow through” principles and
picking to a pick grid as for fruit and vegetables. The estimated volume of dairy and chill
products that will be received daily is 31 MT. Out of this, about 30% of the products that are
received in the morning are picked and despatched on the same day. Some products in Dairy and
Chill operations will however have longer shelf lives and can be received in greater volumes
(about 70% of the products received daily) to improve the delivery efficiency of incoming
products. Typical products are butters and margarines where stock can be held for several days.
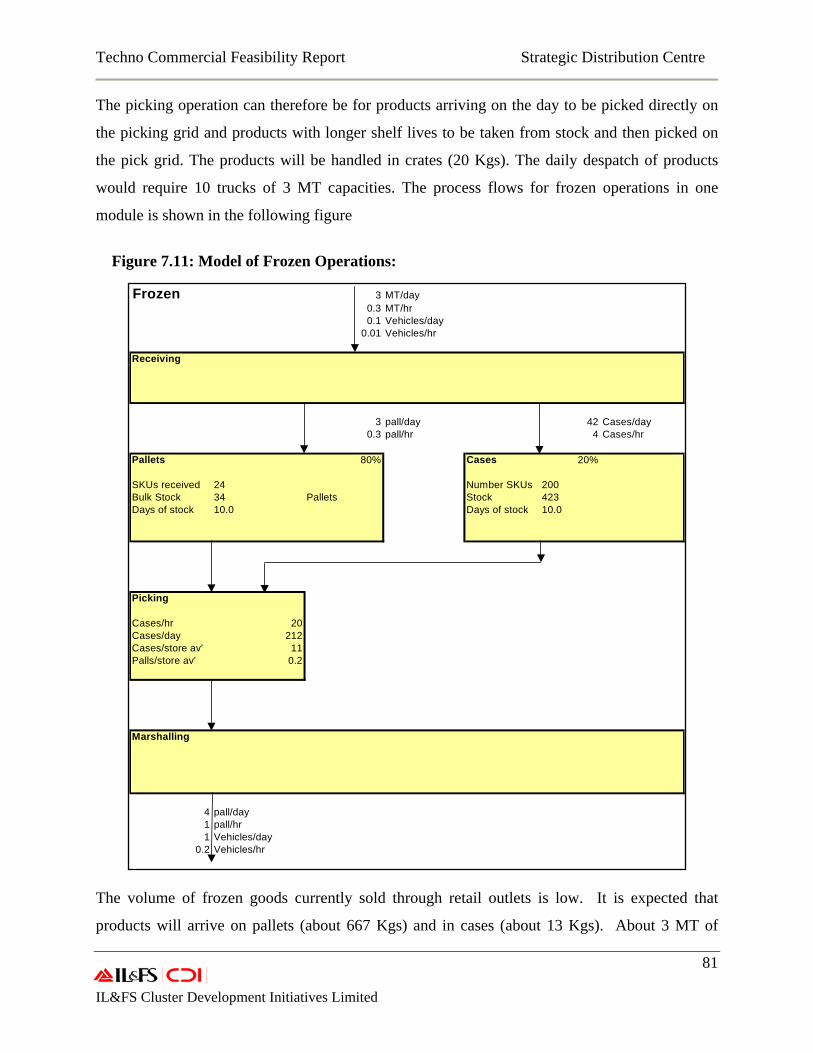
Techno Commercial Feasibility Report Strategic Distribution Centre
81 IL&FS Cluster Development Initiatives Limited
The picking operation can therefore be for products arriving on the day to be picked directly on
the picking grid and products with longer shelf lives to be taken from stock and then picked on
the pick grid. The products will be handled in crates (20 Kgs). The daily despatch of products
would require 10 trucks of 3 MT capacities. The process flows for frozen operations in one
module is shown in the following figure
Figure 7.11: Model of Frozen Operations:
The volume of frozen goods currently sold through retail outlets is low. It is expected that
products will arrive on pallets (about 667 Kgs) and in cases (about 13 Kgs). About 3 MT of
Frozen 3 MT/day0.3 MT/hr0.1 Vehicles/day
0.01 Vehicles/hr
Receiving
3 pall/day 42 Cases/day0.3 pall/hr 4 Cases/hr
Pallets 80% Cases 20%
SKUs received 24 Number SKUs 200Bulk Stock 34 Pallets Stock 423Days of stock 10.0 Days of stock 10.0
Picking
Cases/hr 20Cases/day 212Cases/store av' 11Palls/store av' 0.2
Marshalling
4 pall/day1 pall/hr1 Vehicles/day
0.2 Vehicles/hr
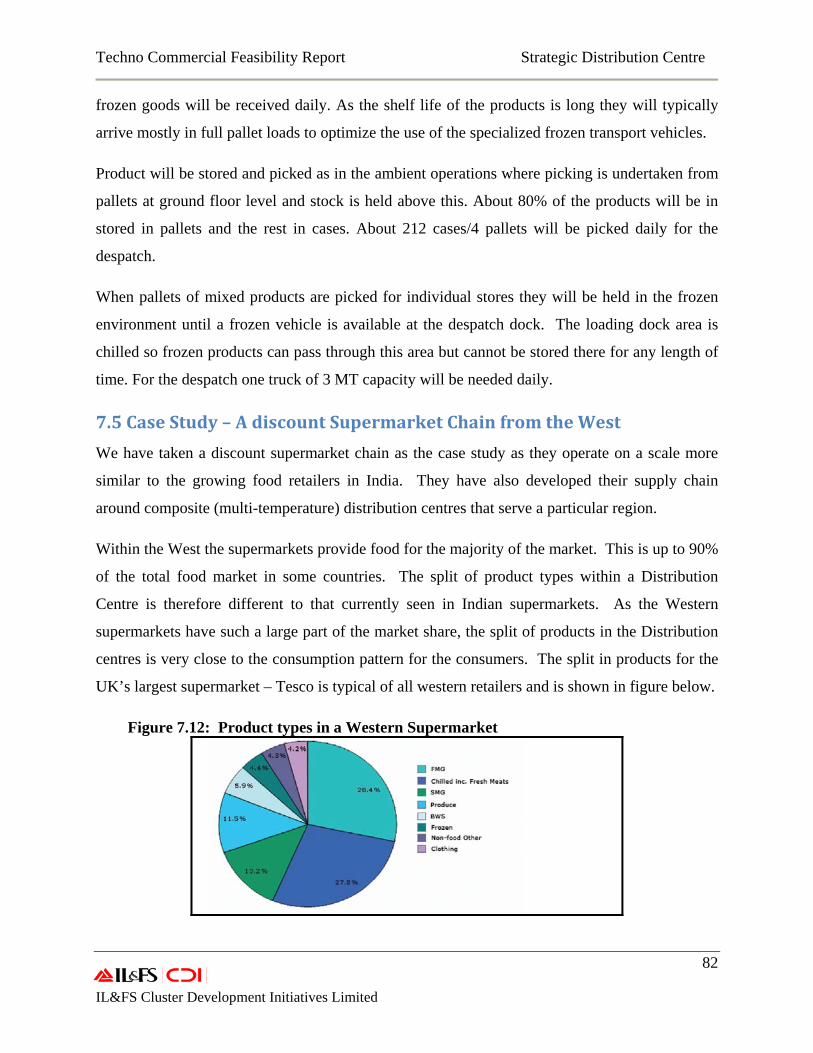
Techno Commercial Feasibility Report Strategic Distribution Centre
82 IL&FS Cluster Development Initiatives Limited
frozen goods will be received daily. As the shelf life of the products is long they will typically
arrive mostly in full pallet loads to optimize the use of the specialized frozen transport vehicles.
Product will be stored and picked as in the ambient operations where picking is undertaken from
pallets at ground floor level and stock is held above this. About 80% of the products will be in
stored in pallets and the rest in cases. About 212 cases/4 pallets will be picked daily for the
despatch.
When pallets of mixed products are picked for individual stores they will be held in the frozen
environment until a frozen vehicle is available at the despatch dock. The loading dock area is
chilled so frozen products can pass through this area but cannot be stored there for any length of
time. For the despatch one truck of 3 MT capacity will be needed daily.
7.5 Case Study – A discount Supermarket Chain from the West
We have taken a discount supermarket chain as the case study as they operate on a scale more
similar to the growing food retailers in India. They have also developed their supply chain
around composite (multi-temperature) distribution centres that serve a particular region.
Within the West the supermarkets provide food for the majority of the market. This is up to 90%
of the total food market in some countries. The split of product types within a Distribution
Centre is therefore different to that currently seen in Indian supermarkets. As the Western
supermarkets have such a large part of the market share, the split of products in the Distribution
centres is very close to the consumption pattern for the consumers. The split in products for the
UK’s largest supermarket – Tesco is typical of all western retailers and is shown in figure below.
Figure 7.12: Product types in a Western Supermarket
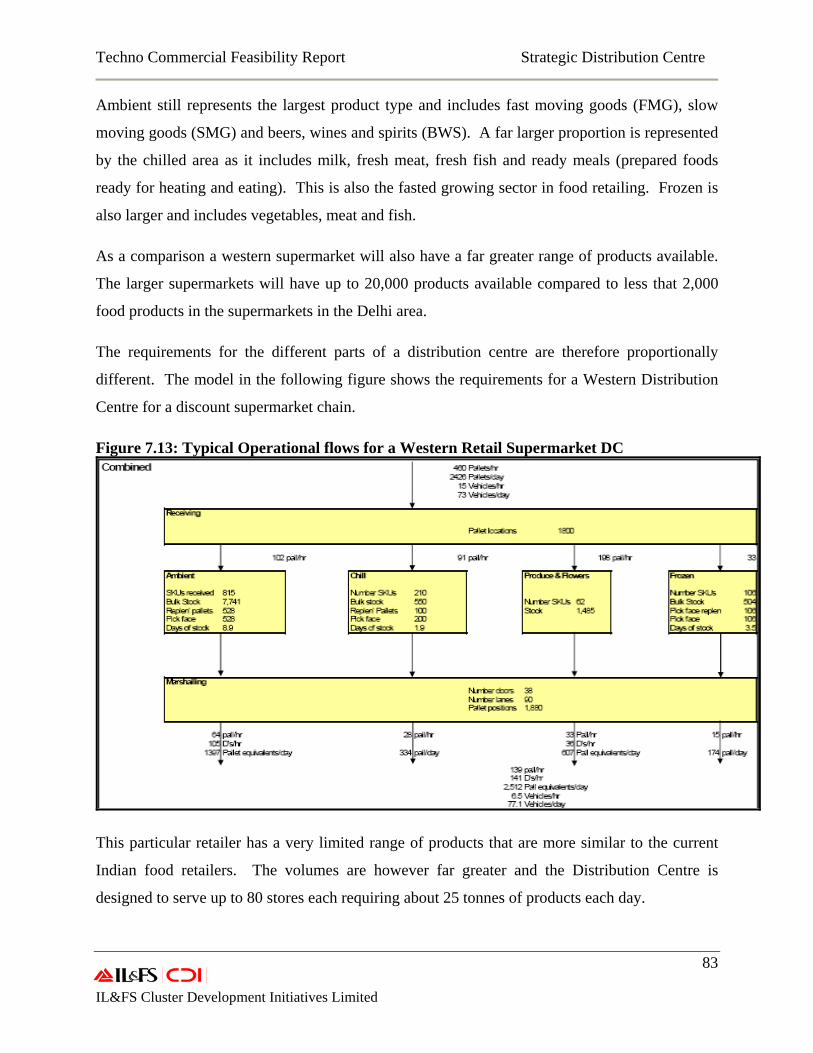
Techno Commercial Feasibility Report Strategic Distribution Centre
83 IL&FS Cluster Development Initiatives Limited
Ambient still represents the largest product type and includes fast moving goods (FMG), slow
moving goods (SMG) and beers, wines and spirits (BWS). A far larger proportion is represented
by the chilled area as it includes milk, fresh meat, fresh fish and ready meals (prepared foods
ready for heating and eating). This is also the fasted growing sector in food retailing. Frozen is
also larger and includes vegetables, meat and fish.
As a comparison a western supermarket will also have a far greater range of products available.
The larger supermarkets will have up to 20,000 products available compared to less that 2,000
food products in the supermarkets in the Delhi area.
The requirements for the different parts of a distribution centre are therefore proportionally
different. The model in the following figure shows the requirements for a Western Distribution
Centre for a discount supermarket chain.
Figure 7.13: Typical Operational flows for a Western Retail Supermarket DC
This particular retailer has a very limited range of products that are more similar to the current
Indian food retailers. The volumes are however far greater and the Distribution Centre is
designed to serve up to 80 stores each requiring about 25 tonnes of products each day.
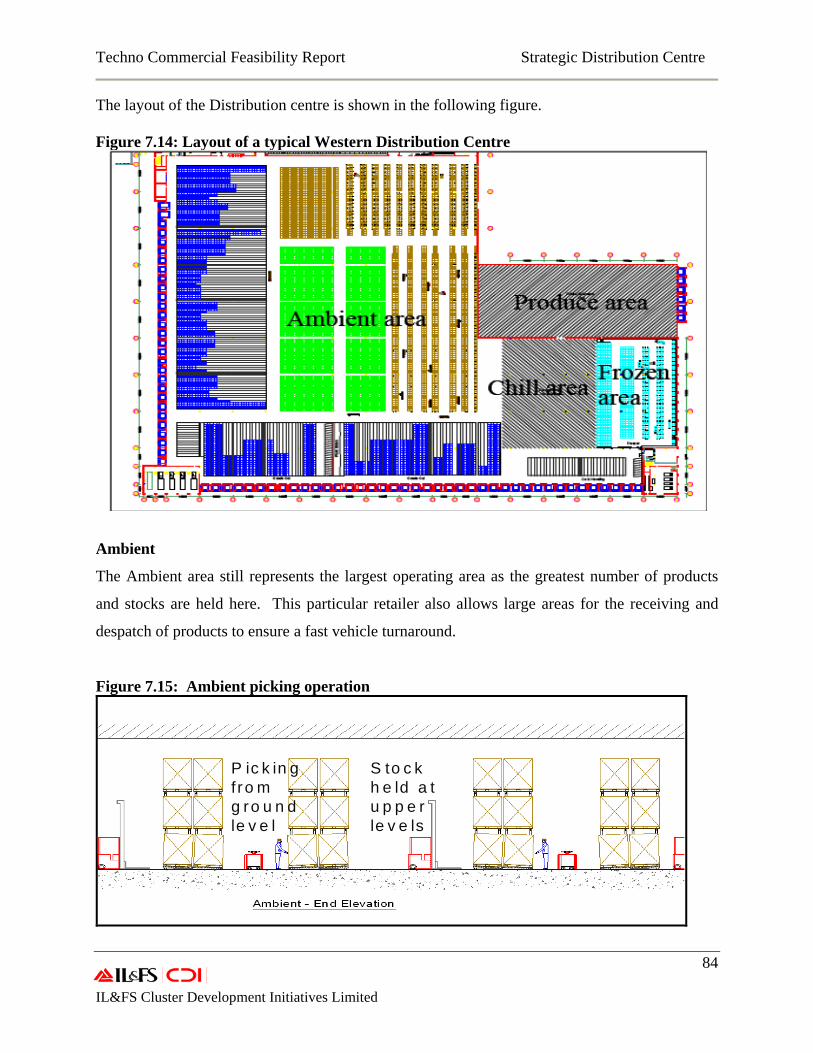
Techno Commercial Feasibility Report Strategic Distribution Centre
84 IL&FS Cluster Development Initiatives Limited
The layout of the Distribution centre is shown in the following figure. Figure 7.14: Layout of a typical Western Distribution Centre
Ambient
The Ambient area still represents the largest operating area as the greatest number of products
and stocks are held here. This particular retailer also allows large areas for the receiving and
despatch of products to ensure a fast vehicle turnaround.
Figure 7.15: Ambient picking operation
P ic k in g f ro m g ro u n d le v e l
S to c k h e ld a t u p p e r le v e ls
P ic k in g f ro m g ro u n d le v e l
S to c k h e ld a t u p p e r le v e ls
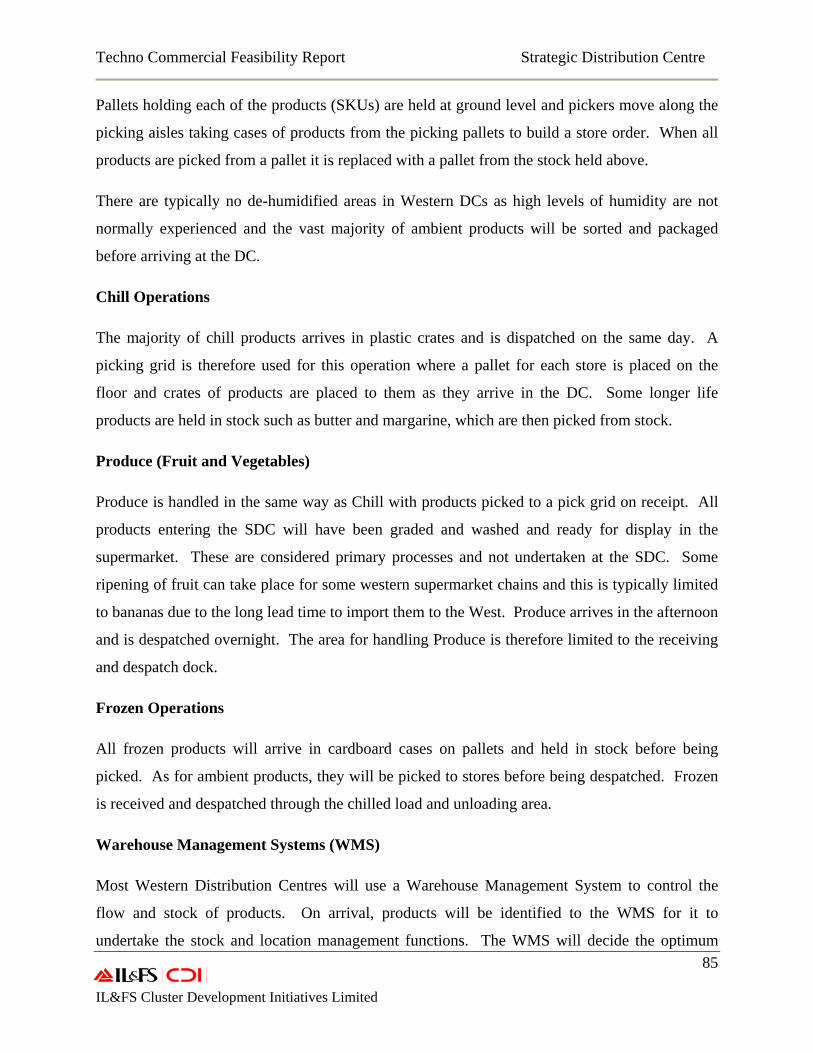
Techno Commercial Feasibility Report Strategic Distribution Centre
85 IL&FS Cluster Development Initiatives Limited
Pallets holding each of the products (SKUs) are held at ground level and pickers move along the
picking aisles taking cases of products from the picking pallets to build a store order. When all
products are picked from a pallet it is replaced with a pallet from the stock held above.
There are typically no de-humidified areas in Western DCs as high levels of humidity are not
normally experienced and the vast majority of ambient products will be sorted and packaged
before arriving at the DC.
Chill Operations
The majority of chill products arrives in plastic crates and is dispatched on the same day. A
picking grid is therefore used for this operation where a pallet for each store is placed on the
floor and crates of products are placed to them as they arrive in the DC. Some longer life
products are held in stock such as butter and margarine, which are then picked from stock.
Produce (Fruit and Vegetables)
Produce is handled in the same way as Chill with products picked to a pick grid on receipt. All
products entering the SDC will have been graded and washed and ready for display in the
supermarket. These are considered primary processes and not undertaken at the SDC. Some
ripening of fruit can take place for some western supermarket chains and this is typically limited
to bananas due to the long lead time to import them to the West. Produce arrives in the afternoon
and is despatched overnight. The area for handling Produce is therefore limited to the receiving
and despatch dock.
Frozen Operations
All frozen products will arrive in cardboard cases on pallets and held in stock before being
picked. As for ambient products, they will be picked to stores before being despatched. Frozen
is received and despatched through the chilled load and unloading area.
Warehouse Management Systems (WMS)
Most Western Distribution Centres will use a Warehouse Management System to control the
flow and stock of products. On arrival, products will be identified to the WMS for it to
undertake the stock and location management functions. The WMS will decide the optimum
Techno Commercial Feasibility Report Strategic Distribution Centre
86 IL&FS Cluster Development Initiatives Limited
location to store each product on arrival depending on the free locations and products already in
stock.
Picking lists to satisfy store demands will be generated by the WMS to optimise the picking
operations by using the minimum number of pickers on the shortest pick routes. As pallets are
depleted from the pick faces the WMS generates replenishment orders from the available stock.
On completion of their pick routes, pickers will be directed to place picked pallets in pre-defined
positions on the despatch docks awaiting despatch.
The WMS will produce the despatch paperwork showing all products picked and any shortages.
Many further reports will also be produced providing information on stock levels, products
received, products despatched, labour utilization and timing of operations.
7.6 Summary
The distribution centres of SDC has been designed based on several parameters such as the
consumption pattern of the of the local inhabitants by food type, the range of these foods
currently supplied through the supermarkets, the temperature and process requirements of
handling these foods through an SDC, the number of main retailers in NCR, the number of stores
run by each of the main retailers in NCR and the typical volume (in MT) of products handled by
these stores on a daily basis.
SDC has been visualized as multi temperature “composite” distribution centres which would act
as dedicated distribution centres for specific processes and temperatures. While designing the
buildings thermal and energy efficiency and competition and secrecy issues of potential users
have been considered. International best practices of operational processes of similar distribution
centres were studied and appropriate processes have been adopted keeping in mind the local
conditions and requirements. At the end, the case study illustrates the operations which have
been envisaged for the SDC.
Techno Commercial Feasibility Report Strategic Distribution Centre
87 IL&FS Cluster Development Initiatives Limited
8. Financial Analysis
Different business models for the SDC have been discussed. The project cost and the business
plan have also been illustrated, along with the key assumptions. Moreover, the expected
financial performance of the SDC has been included and sensitivity analysis has been done to
analyze the effect of government subsidy on the financial performance.
8.1 Business Model
Business model
Various business models for the SDC were developed and analyzed in consultation with the
industry representatives and other stakeholders. Following were considered for detailed analysis.
• Developer Model
• Anchor Investor Model
• Special Purpose Vehicle Model
Developer Model
A developer will create the infrastructure (technical infrastructure and common facilities) for the
SDC by mobilizing resources including grants from the Ministry. Here, the developer will not
be a user of the facilities in the SDC. The facilities will be leased out by the developer to the
users on rental basis as per appropriate terms. The management of technical infrastructure and
common facilities will be done by the developer. Material handling facilities (for e.g. forklifts,
etc) will also be provided to the users by the developer and the cost will be incorporated in the
lease rentals.
Developer model is the most commonly used model for the development of the Special
Economic Zones (SEZs). It may have the advantage of having a skilled developer with expertise
Techno Commercial Feasibility Report Strategic Distribution Centre
88 IL&FS Cluster Development Initiatives Limited
in infrastructure development. The pricing strategy is market driven and hence there is a
potential for good viability of the project. However, the main drawbacks of this model are:
1) Since the developer is not the user of the SDC (also he may not be from the food processing
sector), he has limited market knowledge which may lead to unrealistic expectations.
2) There are several instances where projects developed under the developer model have become
more skewed towards real estate (non- market facilities). To counter this, in the designing of the
SDC much stress has been put on the development of technical infrastructure and facilities some
of which may be made mandatory for a SDC to be eligible for grant.
Anchor Investor Model
In this model, the infrastructure (technical infrastructure and common facilities) development is
done by an anchor investor who will also be the primary user of the facility. The anchor investor
will use a major portion of the facilities. The surplus facility will be leased out to other users.
The overall facility management will lie with the anchor investor. The pricing for the lease rental
is based on market rates whereas the anchor investor, by using the major portions, benefits by
saving costs which it would have incurred had it used any other facility for distribution.
The major advantage of this model is that since the anchor investor is a part of food
processing/organized retail industry, it will have a good understanding of the market. This would
lead to the development of facilities at a realistic scale. This model also ensures major captive
utilization of the facilities by the anchor. However, the anchor investor may not have sufficient
expertise in developing an infrastructure of the magnitude of the SDC. Also, other potential users
of the SDC may not be comfortable to lease in facilities from the anchor investor (a potential
business rival) due to competition and business secrecy.
Special Purpose Vehicle Model
In this model, a group of potential users (small to medium players) of the SDC forms an SPV
and the SPV develops the infrastructure (technical infrastructure and common facilities) of the
SDC. The facilities will be managed by the SPV through professional management. The SPV
will lease out the facilities to members (i.e. the users) on rental basis. Since the facilities will be
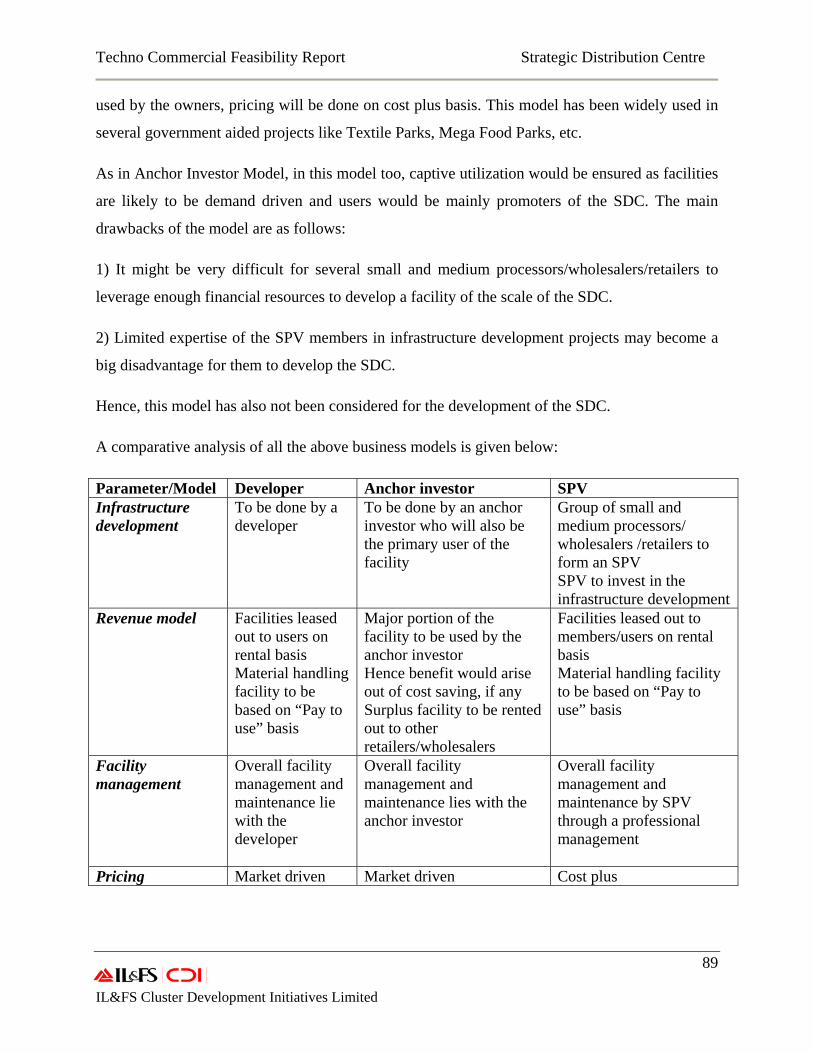
Techno Commercial Feasibility Report Strategic Distribution Centre
89 IL&FS Cluster Development Initiatives Limited
used by the owners, pricing will be done on cost plus basis. This model has been widely used in
several government aided projects like Textile Parks, Mega Food Parks, etc.
As in Anchor Investor Model, in this model too, captive utilization would be ensured as facilities
are likely to be demand driven and users would be mainly promoters of the SDC. The main
drawbacks of the model are as follows:
1) It might be very difficult for several small and medium processors/wholesalers/retailers to
leverage enough financial resources to develop a facility of the scale of the SDC.
2) Limited expertise of the SPV members in infrastructure development projects may become a
big disadvantage for them to develop the SDC.
Hence, this model has also not been considered for the development of the SDC.
A comparative analysis of all the above business models is given below:
Parameter/Model Developer Anchor investor SPV Infrastructure development
To be done by a developer
To be done by an anchor investor who will also be the primary user of the facility
Group of small and medium processors/ wholesalers /retailers to form an SPV SPV to invest in the infrastructure development
Revenue model Facilities leased out to users on rental basis Material handling facility to be based on “Pay to use” basis
Major portion of the facility to be used by the anchor investor Hence benefit would arise out of cost saving, if any Surplus facility to be rented out to other retailers/wholesalers
Facilities leased out to members/users on rental basis Material handling facility to be based on “Pay to use” basis
Facility management
Overall facility management and maintenance lie with the developer
Overall facility management and maintenance lies with the anchor investor
Overall facility management and maintenance by SPV through a professional management
Pricing Market driven Market driven Cost plus
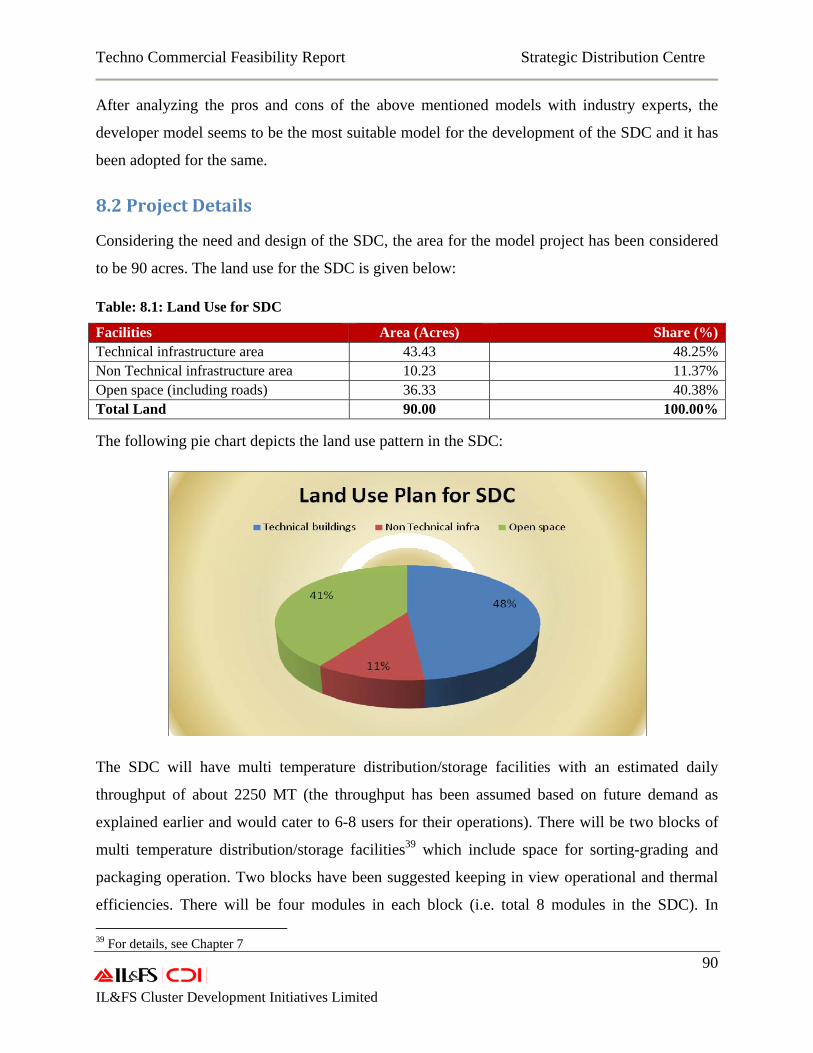
Techno Commercial Feasibility Report Strategic Distribution Centre
90 IL&FS Cluster Development Initiatives Limited
After analyzing the pros and cons of the above mentioned models with industry experts, the
developer model seems to be the most suitable model for the development of the SDC and it has
been adopted for the same.
8.2 Project Details
Considering the need and design of the SDC, the area for the model project has been considered
to be 90 acres. The land use for the SDC is given below:
Table: 8.1: Land Use for SDC
Facilities Area (Acres) Share (%)Technical infrastructure area 43.43 48.25%Non Technical infrastructure area 10.23 11.37%Open space (including roads) 36.33 40.38%Total Land 90.00 100.00%
The following pie chart depicts the land use pattern in the SDC:
The SDC will have multi temperature distribution/storage facilities with an estimated daily
throughput of about 2250 MT (the throughput has been assumed based on future demand as
explained earlier and would cater to 6-8 users for their operations). There will be two blocks of
multi temperature distribution/storage facilities39 which include space for sorting-grading and
packaging operation. Two blocks have been suggested keeping in view operational and thermal
efficiencies. There will be four modules in each block (i.e. total 8 modules in the SDC). In 39 For details, see Chapter 7
Techno Commercial Feasibility Report Strategic Distribution Centre
91 IL&FS Cluster Development Initiatives Limited
addition to these, the SDC will also have a dry warehouse of about 50000 MT storage capacity
(28000 sq m area).
The capacity of the warehouse is designed by assuming that it will be able to provide backup to
ambient facilities by having storage capacity of about one month. Due to seasonal availability of
different crops in the country, a user (wholesaler, processors, traders etc.) may buy the produce
during harvesting season for storage and sell in the off-season. All these facilities are considered
to be part of the technical infrastructure.
The details of the technical infrastructure are provided below:
Table 8.2: Details of Technical Infrastructure in the SDC
Facilities Nos. Area (Sq m) Total Area (Sq m)Warehouse 1 28,000 28,000Multi temperature blocks Modules Area/ Module (Sq m) Ambient 8 5658 45,263Chilled* 8 1611 12,884Frozen 8 216 1728
*The chilled segment of each module will include 4 ripening chambers of 5 MT capacities each. So in 2 blocks there
will be 32 ripening chambers in all with a total capacity of 160 MT. They would be primarily used for ripening of
banana.
To support the operations of above facilities the SDC will also have non-technical facilities like
administration block, canteen, dormitory, parking space, conference hall, guest house, bank
counter etc. A list of these facilities is given below:
Table 8.3: Non technical facilities in the SDC
Non technical Facilities Area (Sq m)Administrative building 2000Parking* 16,000Dormitory* 1500Bank 100Guest House* 800Conference Hall 100Canteen 200Total 20,700*For detail see the cost assumptions of non technical infrastructure
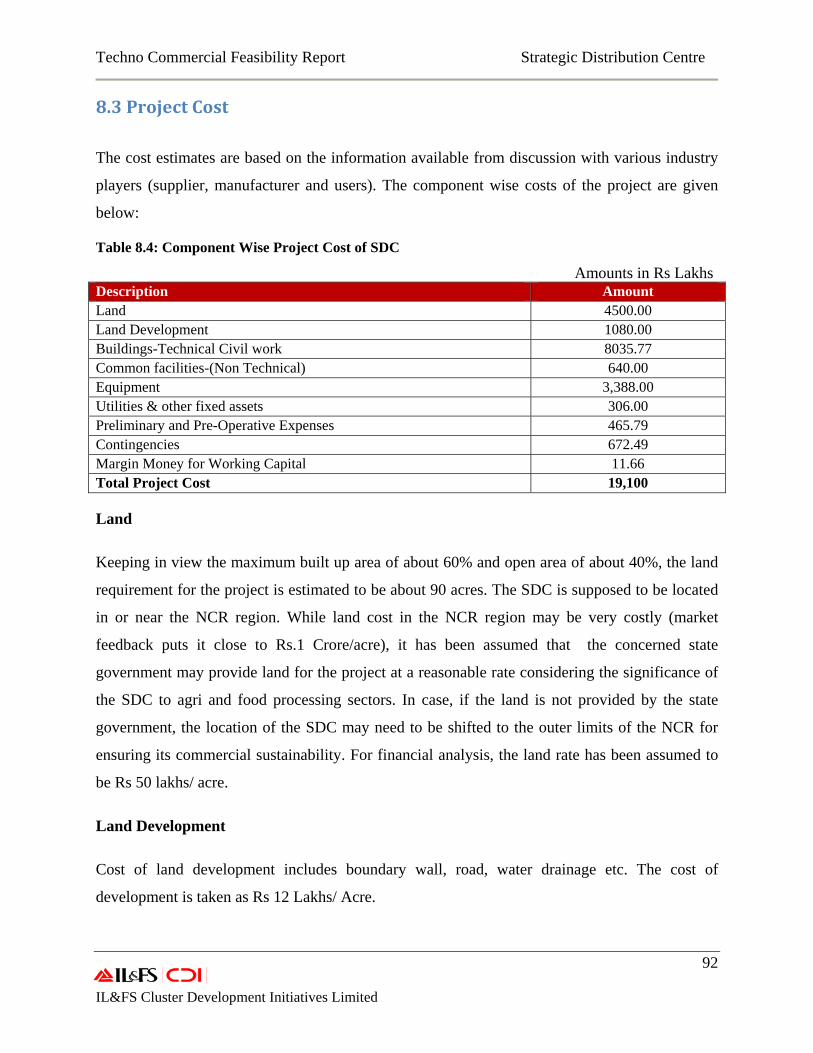
Techno Commercial Feasibility Report Strategic Distribution Centre
92 IL&FS Cluster Development Initiatives Limited
8.3 Project Cost
The cost estimates are based on the information available from discussion with various industry
players (supplier, manufacturer and users). The component wise costs of the project are given
below:
Table 8.4: Component Wise Project Cost of SDC
Amounts in Rs Lakhs Description Amount Land 4500.00 Land Development 1080.00 Buildings-Technical Civil work 8035.77 Common facilities-(Non Technical) 640.00 Equipment 3,388.00 Utilities & other fixed assets 306.00 Preliminary and Pre-Operative Expenses 465.79 Contingencies 672.49 Margin Money for Working Capital 11.66 Total Project Cost 19,100
Land
Keeping in view the maximum built up area of about 60% and open area of about 40%, the land
requirement for the project is estimated to be about 90 acres. The SDC is supposed to be located
in or near the NCR region. While land cost in the NCR region may be very costly (market
feedback puts it close to Rs.1 Crore/acre), it has been assumed that the concerned state
government may provide land for the project at a reasonable rate considering the significance of
the SDC to agri and food processing sectors. In case, if the land is not provided by the state
government, the location of the SDC may need to be shifted to the outer limits of the NCR for
ensuring its commercial sustainability. For financial analysis, the land rate has been assumed to
be Rs 50 lakhs/ acre.
Land Development
Cost of land development includes boundary wall, road, water drainage etc. The cost of
development is taken as Rs 12 Lakhs/ Acre.
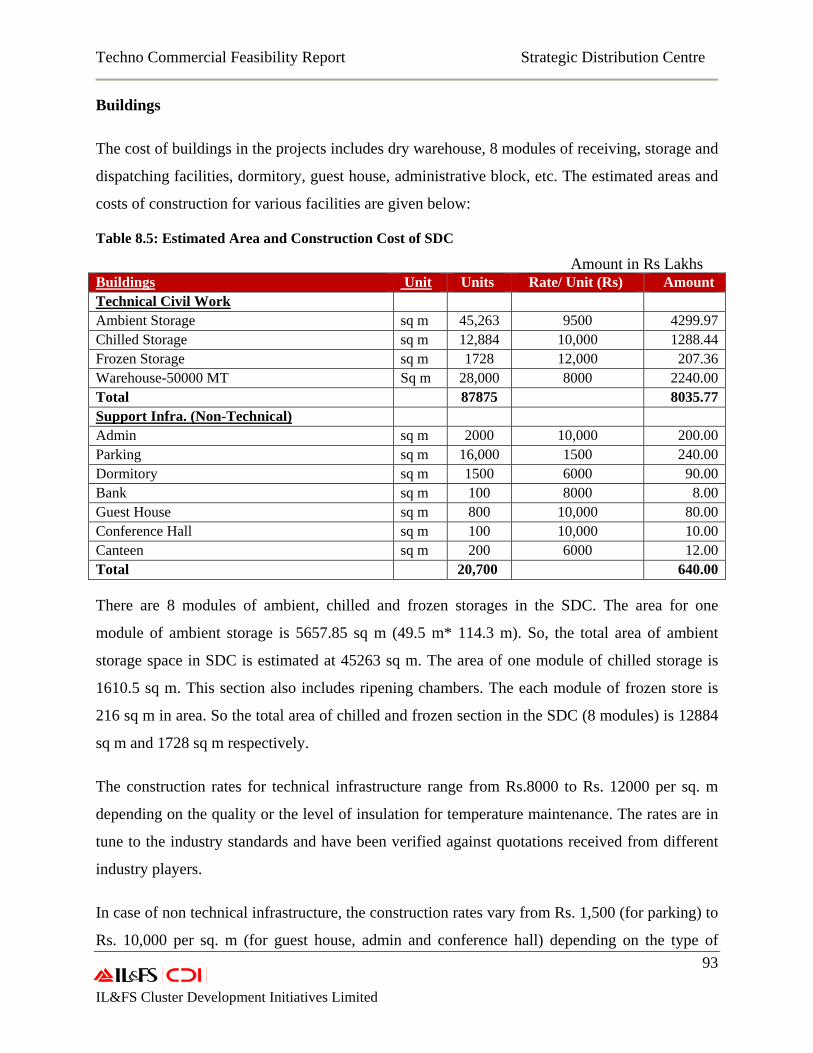
Techno Commercial Feasibility Report Strategic Distribution Centre
93 IL&FS Cluster Development Initiatives Limited
Buildings
The cost of buildings in the projects includes dry warehouse, 8 modules of receiving, storage and
dispatching facilities, dormitory, guest house, administrative block, etc. The estimated areas and
costs of construction for various facilities are given below:
Table 8.5: Estimated Area and Construction Cost of SDC
Amount in Rs Lakhs Buildings Unit Units Rate/ Unit (Rs) Amount Technical Civil Work Ambient Storage sq m 45,263 9500 4299.97Chilled Storage sq m 12,884 10,000 1288.44Frozen Storage sq m 1728 12,000 207.36Warehouse-50000 MT Sq m 28,000 8000 2240.00Total 87875 8035.77Support Infra. (Non-Technical) Admin sq m 2000 10,000 200.00Parking sq m 16,000 1500 240.00Dormitory sq m 1500 6000 90.00Bank sq m 100 8000 8.00Guest House sq m 800 10,000 80.00Conference Hall sq m 100 10,000 10.00Canteen sq m 200 6000 12.00Total 20,700 640.00
There are 8 modules of ambient, chilled and frozen storages in the SDC. The area for one
module of ambient storage is 5657.85 sq m (49.5 m* 114.3 m). So, the total area of ambient
storage space in SDC is estimated at 45263 sq m. The area of one module of chilled storage is
1610.5 sq m. This section also includes ripening chambers. The each module of frozen store is
216 sq m in area. So the total area of chilled and frozen section in the SDC (8 modules) is 12884
sq m and 1728 sq m respectively.
The construction rates for technical infrastructure range from Rs.8000 to Rs. 12000 per sq. m
depending on the quality or the level of insulation for temperature maintenance. The rates are in
tune to the industry standards and have been verified against quotations received from different
industry players.
In case of non technical infrastructure, the construction rates vary from Rs. 1,500 (for parking) to
Rs. 10,000 per sq. m (for guest house, admin and conference hall) depending on the type of
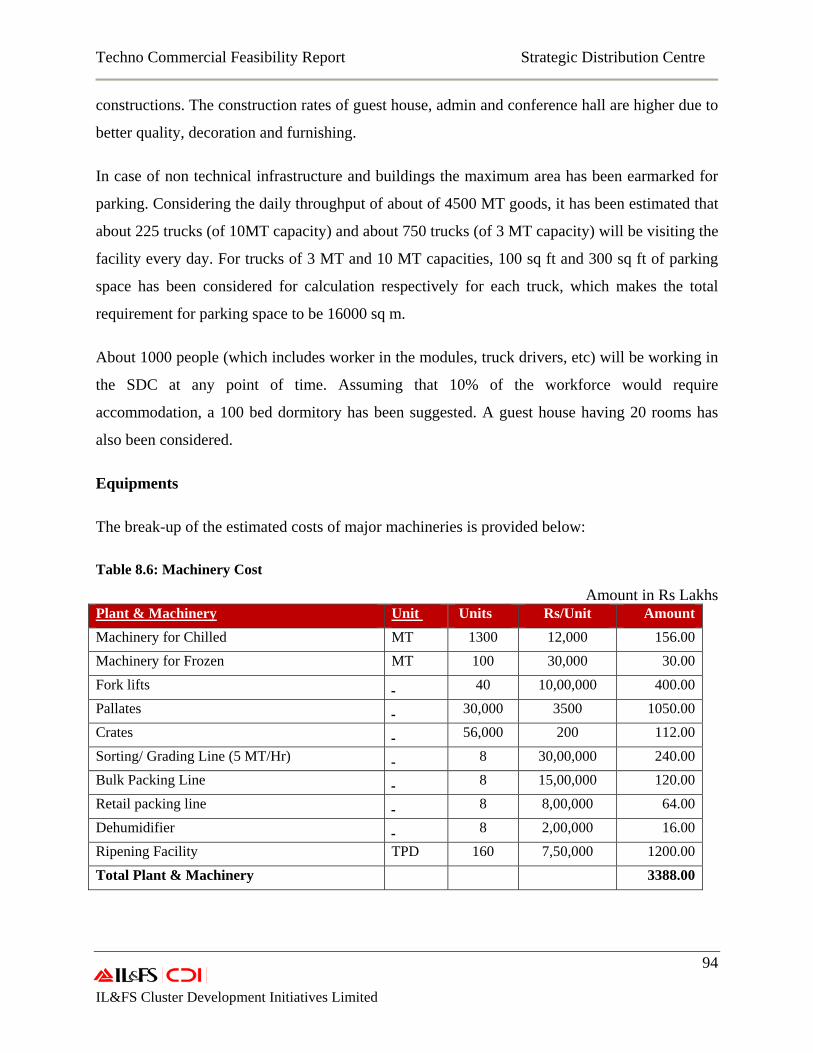
Techno Commercial Feasibility Report Strategic Distribution Centre
94 IL&FS Cluster Development Initiatives Limited
constructions. The construction rates of guest house, admin and conference hall are higher due to
better quality, decoration and furnishing.
In case of non technical infrastructure and buildings the maximum area has been earmarked for
parking. Considering the daily throughput of about of 4500 MT goods, it has been estimated that
about 225 trucks (of 10MT capacity) and about 750 trucks (of 3 MT capacity) will be visiting the
facility every day. For trucks of 3 MT and 10 MT capacities, 100 sq ft and 300 sq ft of parking
space has been considered for calculation respectively for each truck, which makes the total
requirement for parking space to be 16000 sq m.
About 1000 people (which includes worker in the modules, truck drivers, etc) will be working in
the SDC at any point of time. Assuming that 10% of the workforce would require
accommodation, a 100 bed dormitory has been suggested. A guest house having 20 rooms has
also been considered.
Equipments
The break-up of the estimated costs of major machineries is provided below:
Table 8.6: Machinery Cost
Amount in Rs Lakhs Plant & Machinery Unit Units Rs/Unit AmountMachinery for Chilled MT 1300 12,000 156.00Machinery for Frozen MT 100 30,000 30.00Fork lifts 40 10,00,000 400.00Pallates 30,000 3500 1050.00Crates 56,000 200 112.00Sorting/ Grading Line (5 MT/Hr) 8 30,00,000 240.00Bulk Packing Line 8 15,00,000 120.00Retail packing line 8 8,00,000 64.00Dehumidifier 8 2,00,000 16.00Ripening Facility TPD 160 7,50,000 1200.00Total Plant & Machinery 3388.00
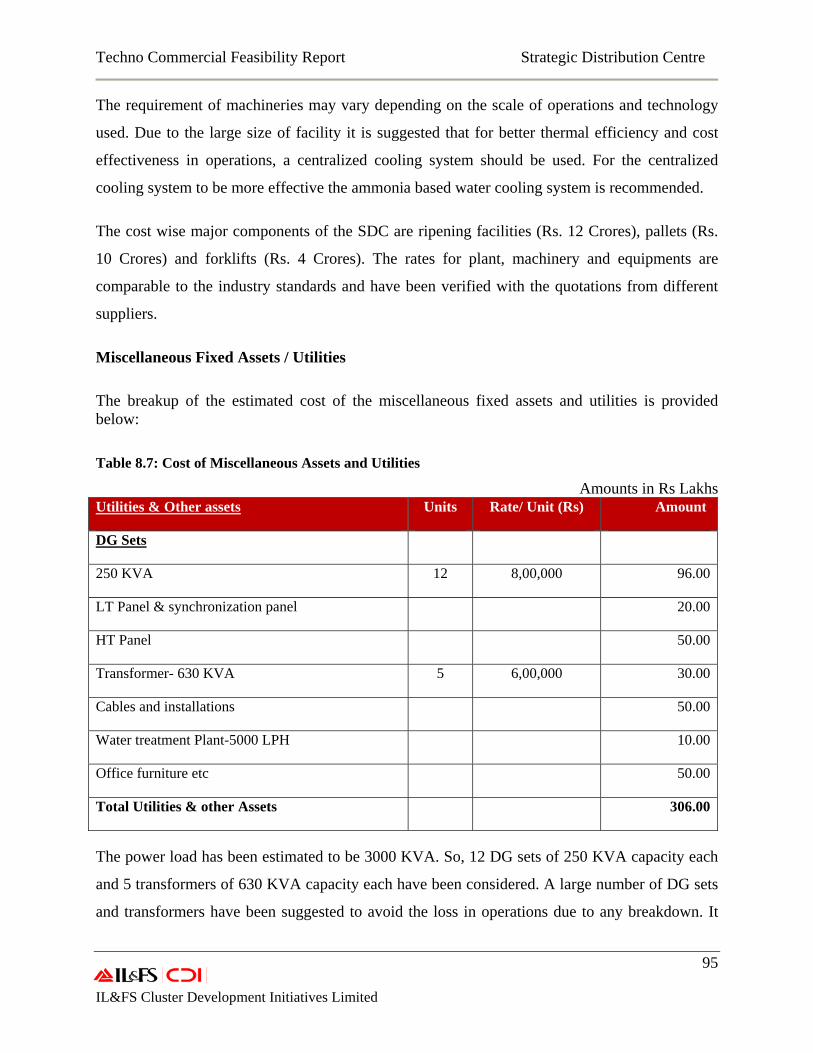
Techno Commercial Feasibility Report Strategic Distribution Centre
95 IL&FS Cluster Development Initiatives Limited
The requirement of machineries may vary depending on the scale of operations and technology
used. Due to the large size of facility it is suggested that for better thermal efficiency and cost
effectiveness in operations, a centralized cooling system should be used. For the centralized
cooling system to be more effective the ammonia based water cooling system is recommended.
The cost wise major components of the SDC are ripening facilities (Rs. 12 Crores), pallets (Rs.
10 Crores) and forklifts (Rs. 4 Crores). The rates for plant, machinery and equipments are
comparable to the industry standards and have been verified with the quotations from different
suppliers.
Miscellaneous Fixed Assets / Utilities
The breakup of the estimated cost of the miscellaneous fixed assets and utilities is provided below: Table 8.7: Cost of Miscellaneous Assets and Utilities
Amounts in Rs Lakhs Utilities & Other assets Units Rate/ Unit (Rs) Amount
DG Sets
250 KVA 12 8,00,000 96.00
LT Panel & synchronization panel 20.00
HT Panel 50.00
Transformer- 630 KVA 5 6,00,000 30.00
Cables and installations 50.00
Water treatment Plant-5000 LPH 10.00
Office furniture etc 50.00
Total Utilities & other Assets 306.00
The power load has been estimated to be 3000 KVA. So, 12 DG sets of 250 KVA capacity each
and 5 transformers of 630 KVA capacity each have been considered. A large number of DG sets
and transformers have been suggested to avoid the loss in operations due to any breakdown. It
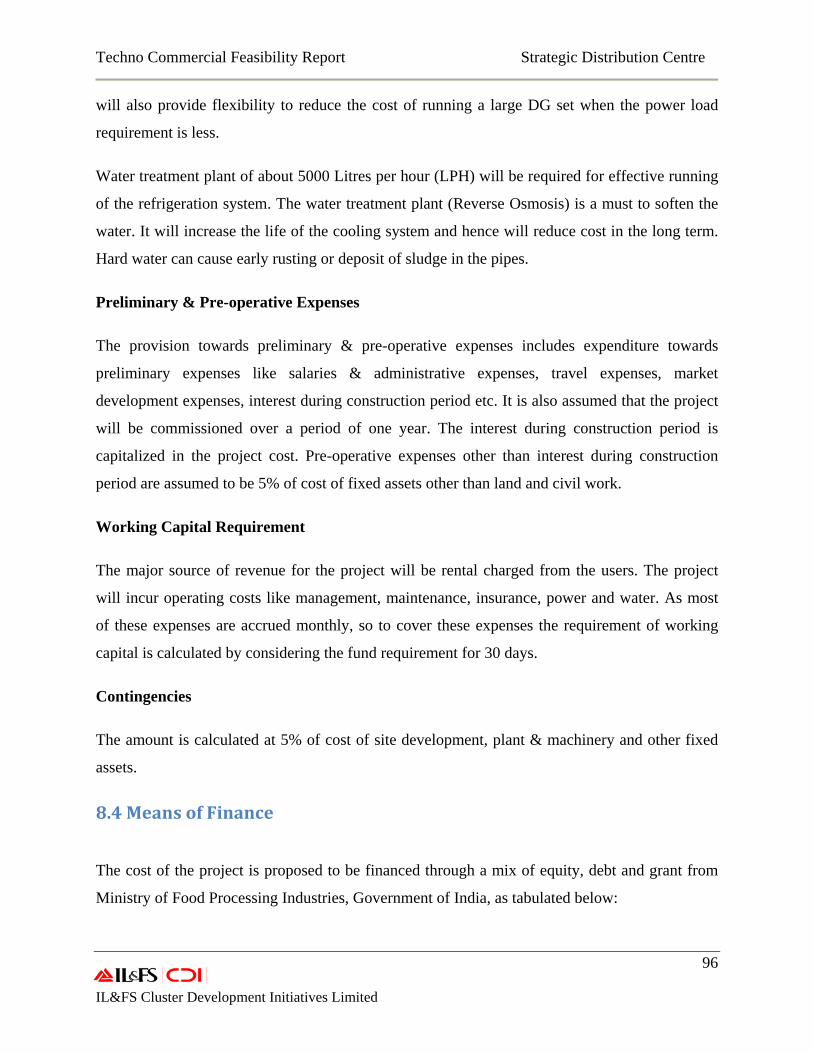
Techno Commercial Feasibility Report Strategic Distribution Centre
96 IL&FS Cluster Development Initiatives Limited
will also provide flexibility to reduce the cost of running a large DG set when the power load
requirement is less.
Water treatment plant of about 5000 Litres per hour (LPH) will be required for effective running
of the refrigeration system. The water treatment plant (Reverse Osmosis) is a must to soften the
water. It will increase the life of the cooling system and hence will reduce cost in the long term.
Hard water can cause early rusting or deposit of sludge in the pipes.
Preliminary & Pre-operative Expenses
The provision towards preliminary & pre-operative expenses includes expenditure towards
preliminary expenses like salaries & administrative expenses, travel expenses, market
development expenses, interest during construction period etc. It is also assumed that the project
will be commissioned over a period of one year. The interest during construction period is
capitalized in the project cost. Pre-operative expenses other than interest during construction
period are assumed to be 5% of cost of fixed assets other than land and civil work.
Working Capital Requirement
The major source of revenue for the project will be rental charged from the users. The project
will incur operating costs like management, maintenance, insurance, power and water. As most
of these expenses are accrued monthly, so to cover these expenses the requirement of working
capital is calculated by considering the fund requirement for 30 days.
Contingencies
The amount is calculated at 5% of cost of site development, plant & machinery and other fixed
assets.
8.4 Means of Finance
The cost of the project is proposed to be financed through a mix of equity, debt and grant from
Ministry of Food Processing Industries, Government of India, as tabulated below:
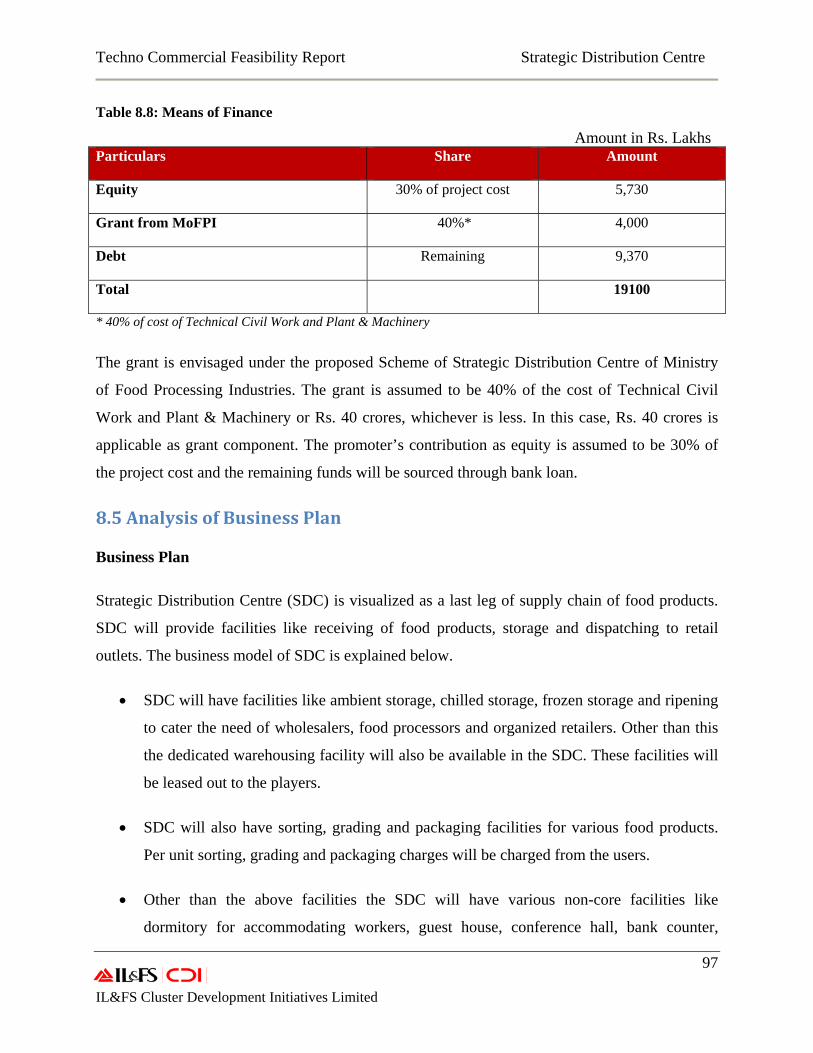
Techno Commercial Feasibility Report Strategic Distribution Centre
97 IL&FS Cluster Development Initiatives Limited
Table 8.8: Means of Finance
Amount in Rs. Lakhs Particulars Share Amount
Equity 30% of project cost 5,730
Grant from MoFPI 40%* 4,000
Debt Remaining 9,370
Total 19100
* 40% of cost of Technical Civil Work and Plant & Machinery
The grant is envisaged under the proposed Scheme of Strategic Distribution Centre of Ministry
of Food Processing Industries. The grant is assumed to be 40% of the cost of Technical Civil
Work and Plant & Machinery or Rs. 40 crores, whichever is less. In this case, Rs. 40 crores is
applicable as grant component. The promoter’s contribution as equity is assumed to be 30% of
the project cost and the remaining funds will be sourced through bank loan.
8.5 Analysis of Business Plan
Business Plan
Strategic Distribution Centre (SDC) is visualized as a last leg of supply chain of food products.
SDC will provide facilities like receiving of food products, storage and dispatching to retail
outlets. The business model of SDC is explained below.
• SDC will have facilities like ambient storage, chilled storage, frozen storage and ripening
to cater the need of wholesalers, food processors and organized retailers. Other than this
the dedicated warehousing facility will also be available in the SDC. These facilities will
be leased out to the players.
• SDC will also have sorting, grading and packaging facilities for various food products.
Per unit sorting, grading and packaging charges will be charged from the users.
• Other than the above facilities the SDC will have various non-core facilities like
dormitory for accommodating workers, guest house, conference hall, bank counter,
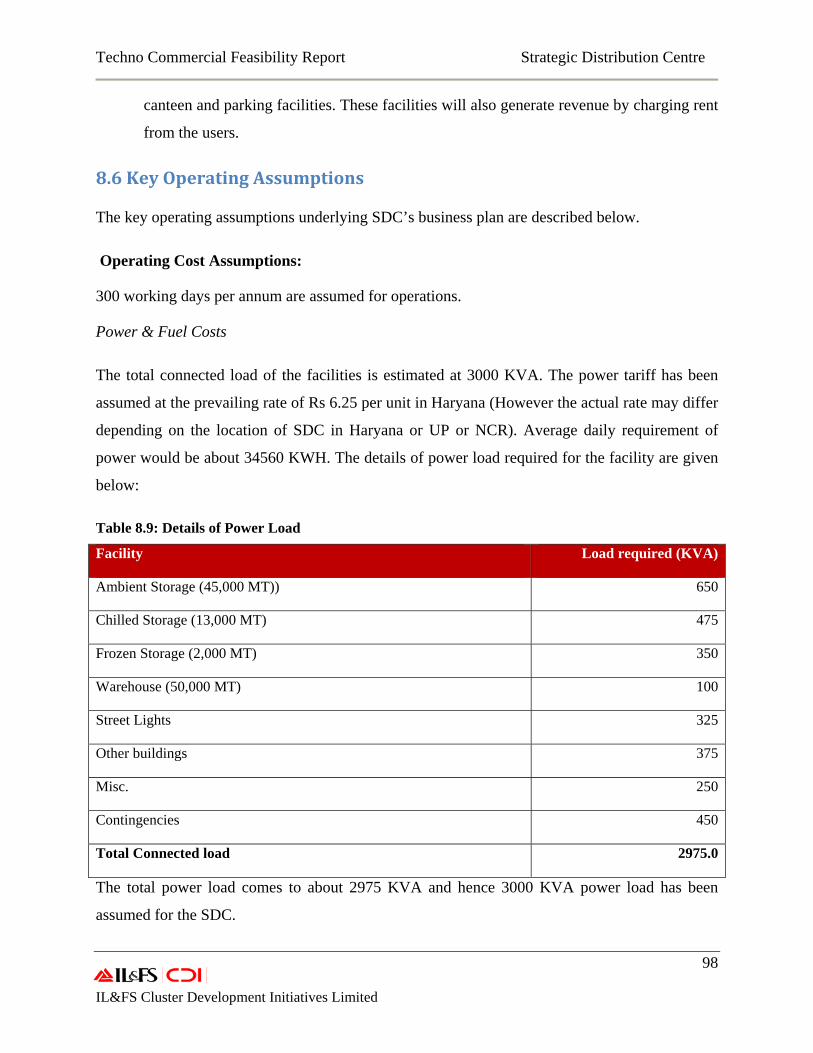
Techno Commercial Feasibility Report Strategic Distribution Centre
98 IL&FS Cluster Development Initiatives Limited
canteen and parking facilities. These facilities will also generate revenue by charging rent
from the users.
8.6 Key Operating Assumptions
The key operating assumptions underlying SDC’s business plan are described below.
Operating Cost Assumptions:
300 working days per annum are assumed for operations.
Power & Fuel Costs
The total connected load of the facilities is estimated at 3000 KVA. The power tariff has been
assumed at the prevailing rate of Rs 6.25 per unit in Haryana (However the actual rate may differ
depending on the location of SDC in Haryana or UP or NCR). Average daily requirement of
power would be about 34560 KWH. The details of power load required for the facility are given
below:
Table 8.9: Details of Power Load
Facility Load required (KVA)
Ambient Storage (45,000 MT)) 650
Chilled Storage (13,000 MT) 475
Frozen Storage (2,000 MT) 350
Warehouse (50,000 MT) 100
Street Lights 325
Other buildings 375
Misc. 250
Contingencies 450
Total Connected load 2975.0
The total power load comes to about 2975 KVA and hence 3000 KVA power load has been
assumed for the SDC.
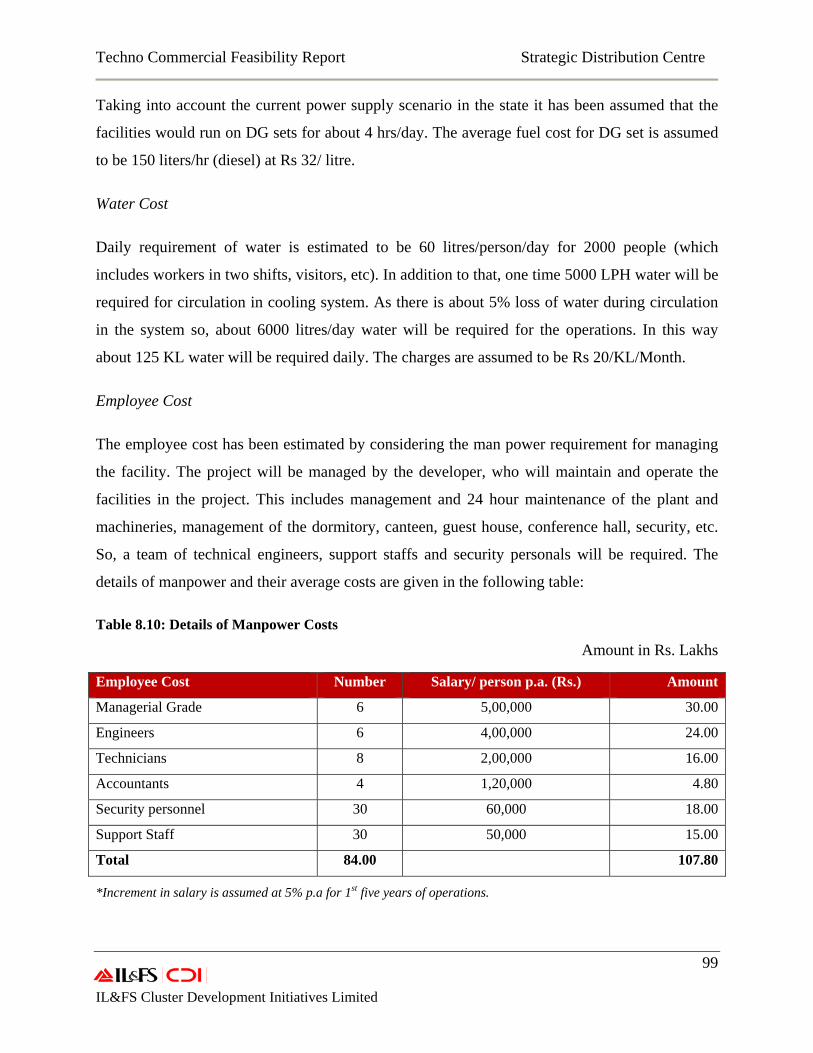
Techno Commercial Feasibility Report Strategic Distribution Centre
99 IL&FS Cluster Development Initiatives Limited
Taking into account the current power supply scenario in the state it has been assumed that the
facilities would run on DG sets for about 4 hrs/day. The average fuel cost for DG set is assumed
to be 150 liters/hr (diesel) at Rs 32/ litre.
Water Cost
Daily requirement of water is estimated to be 60 litres/person/day for 2000 people (which
includes workers in two shifts, visitors, etc). In addition to that, one time 5000 LPH water will be
required for circulation in cooling system. As there is about 5% loss of water during circulation
in the system so, about 6000 litres/day water will be required for the operations. In this way
about 125 KL water will be required daily. The charges are assumed to be Rs 20/KL/Month.
Employee Cost
The employee cost has been estimated by considering the man power requirement for managing
the facility. The project will be managed by the developer, who will maintain and operate the
facilities in the project. This includes management and 24 hour maintenance of the plant and
machineries, management of the dormitory, canteen, guest house, conference hall, security, etc.
So, a team of technical engineers, support staffs and security personals will be required. The
details of manpower and their average costs are given in the following table:
Table 8.10: Details of Manpower Costs
Amount in Rs. Lakhs
Employee Cost Number Salary/ person p.a. (Rs.) Amount
Managerial Grade 6 5,00,000 30.00
Engineers 6 4,00,000 24.00
Technicians 8 2,00,000 16.00
Accountants 4 1,20,000 4.80
Security personnel 30 60,000 18.00
Support Staff 30 50,000 15.00
Total 84.00 107.80
*Increment in salary is assumed at 5% p.a for 1st five years of operations.
Techno Commercial Feasibility Report Strategic Distribution Centre
100 IL&FS Cluster Development Initiatives Limited
Cost of Insurance
The cost of insurance has been assumed as 1.0% of WDV of plant & machinery and
miscellaneous fixed assets.
Admin & Marketing Overheads
The developer will be responsible for only the management and maintenance of the facilities
without any own operations. However, initial tie ups are needed for better capacity utilization of
the facilities. Most of the promotional/marketing expenses will be incurred up front with only
small recurring expenses afterwards. Hence during operations, marketing and business
development expenses will not be significant for the project.
The major overheads for the project will be traveling costs, statutory (like audit etc.) costs and
communication expenses etc. So, the admin & selling overhead costs have been assumed @
2.0% of revenue in line with the industry norms for such facilities.
Financial Assumptions
Taxes
Income Tax rate is assumed to be 33.99% flat (Prevailing Corporate Tax Rate). Income tax is
calculated on PBT after adjusting for the difference between the depreciations calculated
according to Companies Act, 1956 and Income Tax Act, 1961.
Depreciation Rates
Depreciation has been calculated by straight-line method, as per the Companies Act, 1956, for
book purpose, whereas for tax purpose (As per Rule-5 of Income Tax Act, 1961), written down
value method is employed. The rates of depreciation are in tune to the rates that are used in cold
storage and warehousing industry. The depreciation rates used for different assets are given
below
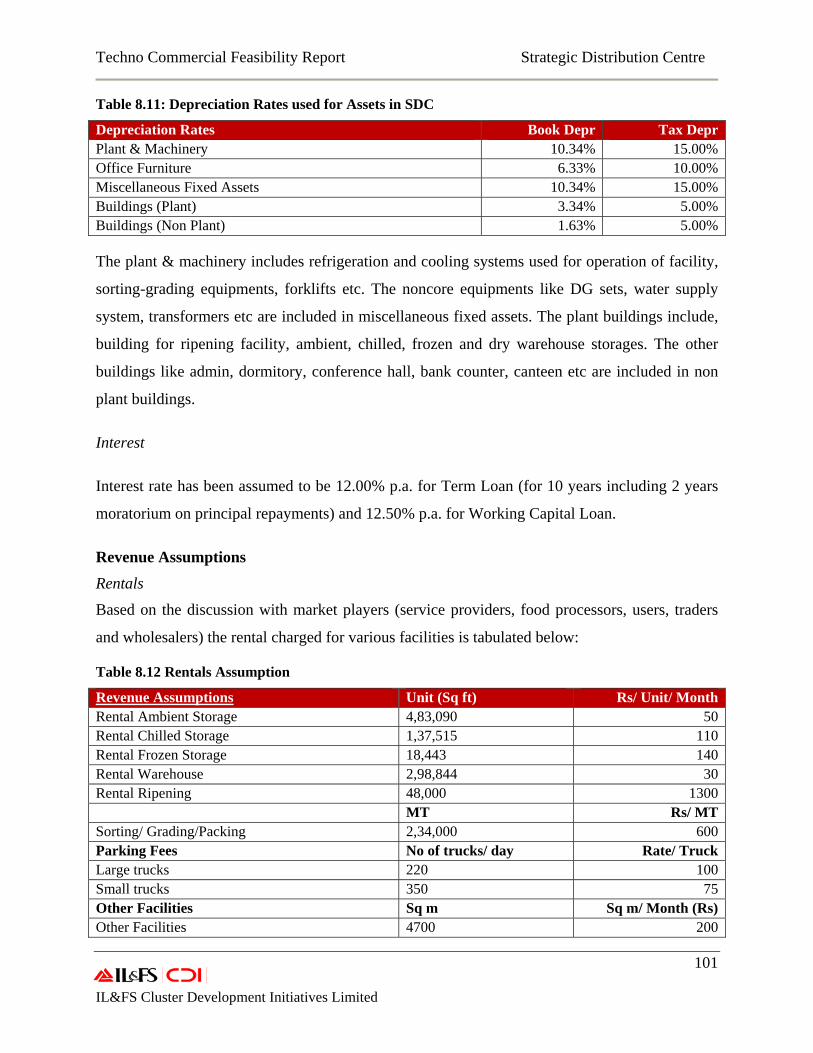
Techno Commercial Feasibility Report Strategic Distribution Centre
101 IL&FS Cluster Development Initiatives Limited
Table 8.11: Depreciation Rates used for Assets in SDC
Depreciation Rates Book Depr Tax DeprPlant & Machinery 10.34% 15.00%Office Furniture 6.33% 10.00%Miscellaneous Fixed Assets 10.34% 15.00%Buildings (Plant) 3.34% 5.00%Buildings (Non Plant) 1.63% 5.00%
The plant & machinery includes refrigeration and cooling systems used for operation of facility,
sorting-grading equipments, forklifts etc. The noncore equipments like DG sets, water supply
system, transformers etc are included in miscellaneous fixed assets. The plant buildings include,
building for ripening facility, ambient, chilled, frozen and dry warehouse storages. The other
buildings like admin, dormitory, conference hall, bank counter, canteen etc are included in non
plant buildings.
Interest
Interest rate has been assumed to be 12.00% p.a. for Term Loan (for 10 years including 2 years
moratorium on principal repayments) and 12.50% p.a. for Working Capital Loan.
Revenue Assumptions
Rentals
Based on the discussion with market players (service providers, food processors, users, traders
and wholesalers) the rental charged for various facilities is tabulated below:
Table 8.12 Rentals Assumption
Revenue Assumptions Unit (Sq ft) Rs/ Unit/ MonthRental Ambient Storage 4,83,090 50Rental Chilled Storage 1,37,515 110Rental Frozen Storage 18,443 140Rental Warehouse 2,98,844 30Rental Ripening 48,000 1300
MT Rs/ MTSorting/ Grading/Packing 2,34,000 600Parking Fees No of trucks/ day Rate/ TruckLarge trucks 220 100Small trucks 350 75Other Facilities Sq m Sq m/ Month (Rs)Other Facilities 4700 200
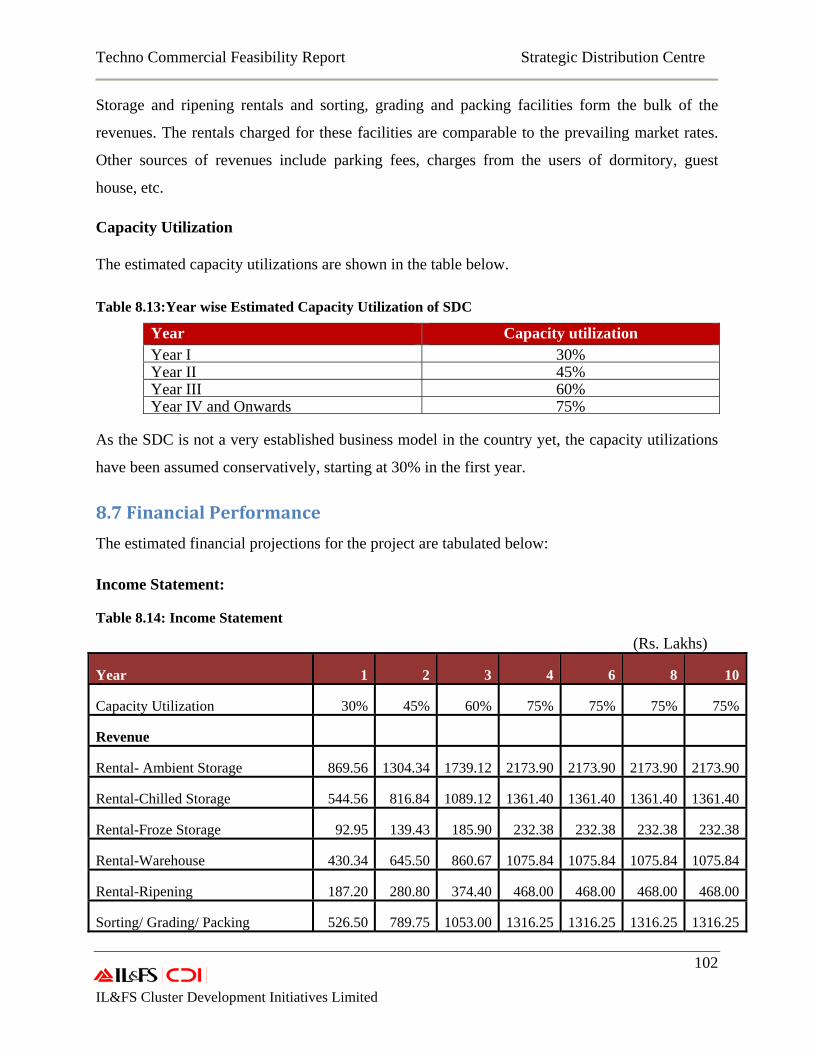
Techno Commercial Feasibility Report Strategic Distribution Centre
102 IL&FS Cluster Development Initiatives Limited
Storage and ripening rentals and sorting, grading and packing facilities form the bulk of the
revenues. The rentals charged for these facilities are comparable to the prevailing market rates.
Other sources of revenues include parking fees, charges from the users of dormitory, guest
house, etc.
Capacity Utilization
The estimated capacity utilizations are shown in the table below.
Table 8.13:Year wise Estimated Capacity Utilization of SDC
Year Capacity utilization Year I 30% Year II 45% Year III 60% Year IV and Onwards 75%
As the SDC is not a very established business model in the country yet, the capacity utilizations
have been assumed conservatively, starting at 30% in the first year.
8.7 Financial Performance
The estimated financial projections for the project are tabulated below:
Income Statement:
Table 8.14: Income Statement
(Rs. Lakhs)
Year 1 2 3 4 6 8 10
Capacity Utilization 30% 45% 60% 75% 75% 75% 75%
Revenue
Rental- Ambient Storage 869.56 1304.34 1739.12 2173.90 2173.90 2173.90 2173.90
Rental-Chilled Storage 544.56 816.84 1089.12 1361.40 1361.40 1361.40 1361.40
Rental-Froze Storage 92.95 139.43 185.90 232.38 232.38 232.38 232.38
Rental-Warehouse 430.34 645.50 860.67 1075.84 1075.84 1075.84 1075.84
Rental-Ripening 187.20 280.80 374.40 468.00 468.00 468.00 468.00
Sorting/ Grading/ Packing 526.50 789.75 1053.00 1316.25 1316.25 1316.25 1316.25
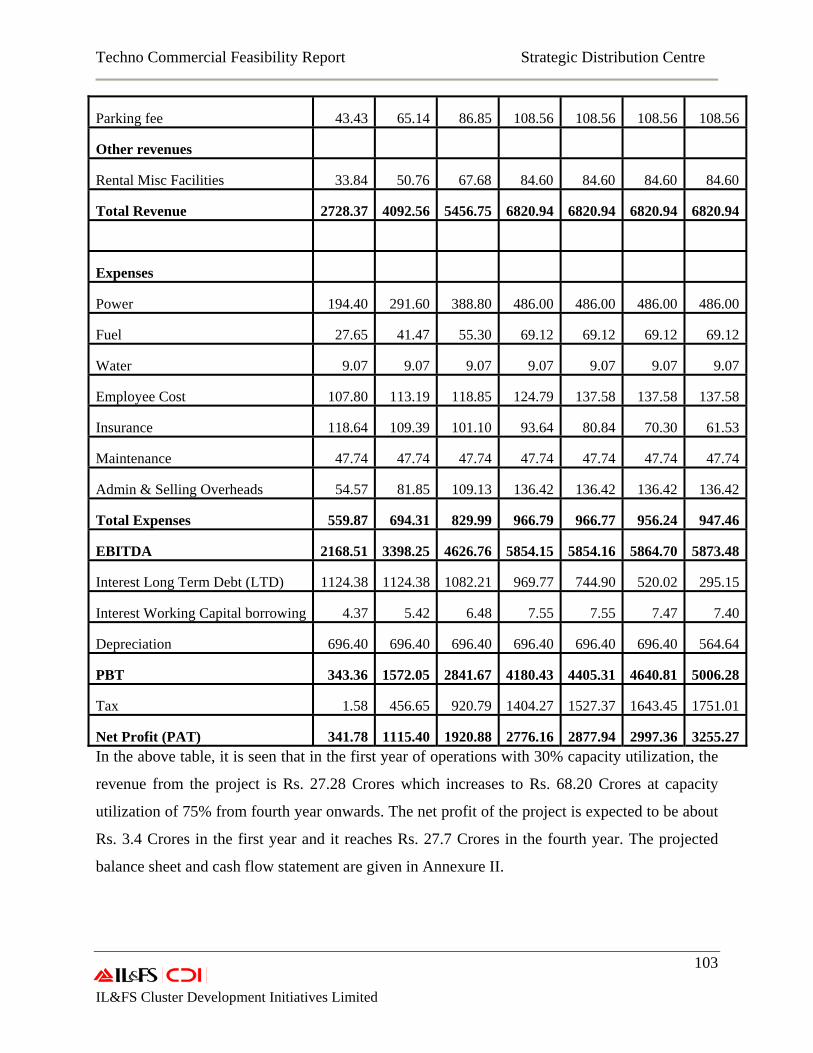
Techno Commercial Feasibility Report Strategic Distribution Centre
103 IL&FS Cluster Development Initiatives Limited
Parking fee 43.43 65.14 86.85 108.56 108.56 108.56 108.56
Other revenues
Rental Misc Facilities 33.84 50.76 67.68 84.60 84.60 84.60 84.60
Total Revenue 2728.37 4092.56 5456.75 6820.94 6820.94 6820.94 6820.94
Expenses
Power 194.40 291.60 388.80 486.00 486.00 486.00 486.00
Fuel 27.65 41.47 55.30 69.12 69.12 69.12 69.12
Water 9.07 9.07 9.07 9.07 9.07 9.07 9.07
Employee Cost 107.80 113.19 118.85 124.79 137.58 137.58 137.58
Insurance 118.64 109.39 101.10 93.64 80.84 70.30 61.53
Maintenance 47.74 47.74 47.74 47.74 47.74 47.74 47.74
Admin & Selling Overheads 54.57 81.85 109.13 136.42 136.42 136.42 136.42
Total Expenses 559.87 694.31 829.99 966.79 966.77 956.24 947.46
EBITDA 2168.51 3398.25 4626.76 5854.15 5854.16 5864.70 5873.48
Interest Long Term Debt (LTD) 1124.38 1124.38 1082.21 969.77 744.90 520.02 295.15
Interest Working Capital borrowing 4.37 5.42 6.48 7.55 7.55 7.47 7.40
Depreciation 696.40 696.40 696.40 696.40 696.40 696.40 564.64
PBT 343.36 1572.05 2841.67 4180.43 4405.31 4640.81 5006.28
Tax 1.58 456.65 920.79 1404.27 1527.37 1643.45 1751.01
Net Profit (PAT) 341.78 1115.40 1920.88 2776.16 2877.94 2997.36 3255.27In the above table, it is seen that in the first year of operations with 30% capacity utilization, the
revenue from the project is Rs. 27.28 Crores which increases to Rs. 68.20 Crores at capacity
utilization of 75% from fourth year onwards. The net profit of the project is expected to be about
Rs. 3.4 Crores in the first year and it reaches Rs. 27.7 Crores in the fourth year. The projected
balance sheet and cash flow statement are given in Annexure II.
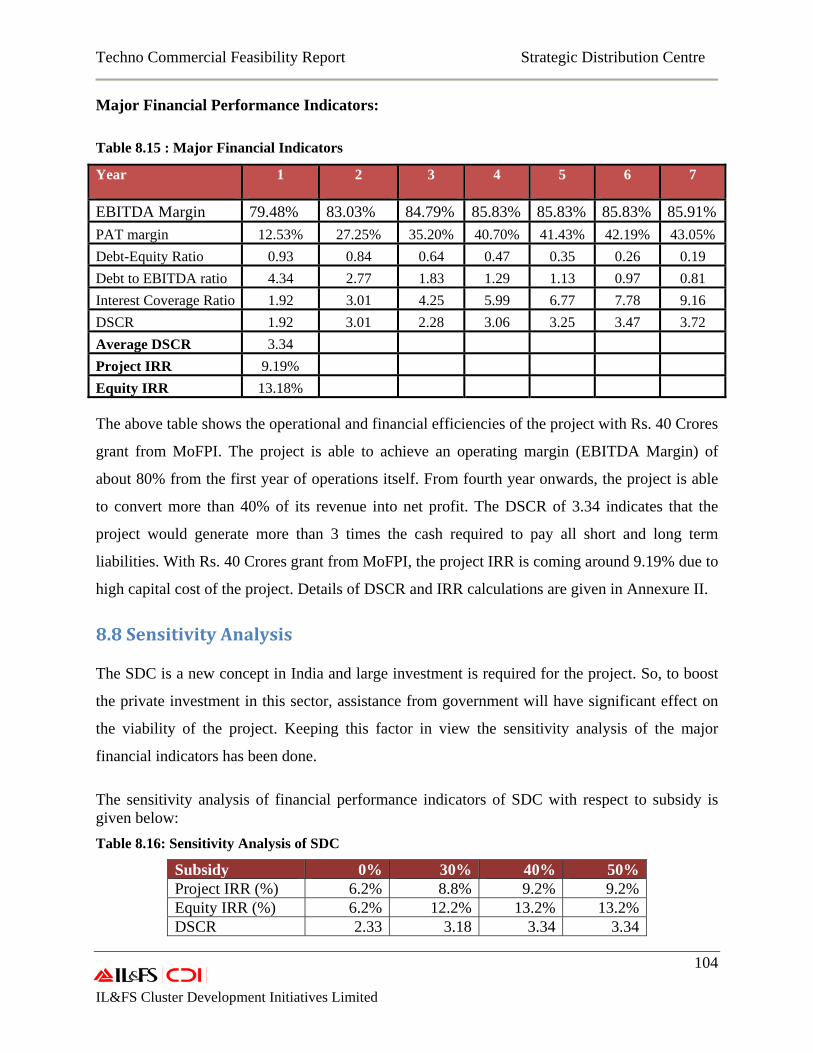
Techno Commercial Feasibility Report Strategic Distribution Centre
104 IL&FS Cluster Development Initiatives Limited
Major Financial Performance Indicators:
Table 8.15 : Major Financial Indicators
Year 1 2 3 4 5 6 7
EBITDA Margin 79.48% 83.03% 84.79% 85.83% 85.83% 85.83% 85.91%PAT margin 12.53% 27.25% 35.20% 40.70% 41.43% 42.19% 43.05% Debt-Equity Ratio 0.93 0.84 0.64 0.47 0.35 0.26 0.19 Debt to EBITDA ratio 4.34 2.77 1.83 1.29 1.13 0.97 0.81 Interest Coverage Ratio 1.92 3.01 4.25 5.99 6.77 7.78 9.16 DSCR 1.92 3.01 2.28 3.06 3.25 3.47 3.72 Average DSCR 3.34 Project IRR 9.19% Equity IRR 13.18%
The above table shows the operational and financial efficiencies of the project with Rs. 40 Crores
grant from MoFPI. The project is able to achieve an operating margin (EBITDA Margin) of
about 80% from the first year of operations itself. From fourth year onwards, the project is able
to convert more than 40% of its revenue into net profit. The DSCR of 3.34 indicates that the
project would generate more than 3 times the cash required to pay all short and long term
liabilities. With Rs. 40 Crores grant from MoFPI, the project IRR is coming around 9.19% due to
high capital cost of the project. Details of DSCR and IRR calculations are given in Annexure II.
8.8 Sensitivity Analysis
The SDC is a new concept in India and large investment is required for the project. So, to boost
the private investment in this sector, assistance from government will have significant effect on
the viability of the project. Keeping this factor in view the sensitivity analysis of the major
financial indicators has been done.
The sensitivity analysis of financial performance indicators of SDC with respect to subsidy is given below: Table 8.16: Sensitivity Analysis of SDC
Subsidy 0% 30% 40% 50% Project IRR (%) 6.2% 8.8% 9.2% 9.2% Equity IRR (%) 6.2% 12.2% 13.2% 13.2% DSCR 2.33 3.18 3.34 3.34
Techno Commercial Feasibility Report Strategic Distribution Centre
105 IL&FS Cluster Development Initiatives Limited
Analysis of the above table shows that if there is no assistance from the Government the returns
from the project will be unattractive to the investors. So, to make this project viable, from private
sector’s perspective, assistance from the government will be required.
Annexure Annexure I: Scope of Work
The scope of the proposed feasibility study will be as under:
a) Identification and assessment of at least three potential locations for Strategic
Distribution Centre in the country based on availability of raw/processed fruit and
vegetables products including fishery/meat, export potential, proximity to
consumption market and other infrastructure like rail, road, airport etc.
b) Assessment of marketable surplus/processable produce from the identified
locations/catchments areas. Also provide projections for marketable surplus for
identified products.
c) Consultation with various stakeholders including industry and government to explore
opportunity and challenges of establishing food related strategic distribution center,
identify industry trend and factors affecting competitiveness and suggesting models to
overcome it.
d) Assessment of existing infrastructure including cold chain, transportation (road,
railway, seaports and airports), loading/unloading points, weigh bridge power supply,
transmission and distribution infrastructure, marketing infrastructure, telecom and IT,
warehouses, etc. The possibility of modernizing the existing infrastructure into full-
fledged SDC can be looked into. A detailed need assessment and identification of the
required infrastructure for integrated cold chain with strategic distribution center etc
is a must.
Techno Commercial Feasibility Report Strategic Distribution Centre
106 IL&FS Cluster Development Initiatives Limited
e) Study of existing supply chain mechanism with special focus on linkages with major
production as well as consumption centers (domestic/international), organized retail
chains and exporters etc.
f) Identification of gaps at each stage of value chain and suggesting operational models
in PPP mode including linkages and develop business plan for integrated cold chain
with SDC for value addition.
g) Working on project models for the proposed cold chain and strategic distribution
center based on field study and detailed consultation with various stakeholders and
providing concrete suggestions regarding
1. Financing pattern – users contribution, Government assistance, commercial
borrowing etc
2. Technical and Project management aspects
3. Building the supply chain
4. Infrastructure needed to support the supply chain and linkages – domestic and
export market
5. Regulatory aspects pertaining to custom clearance for export etc
6. Government regulations
7. Integration of various components like Mega Food park, SDC, Terminal
market etc for leveraging synergies and reducing cost.
8. Role of implementation agency
h) Bid Process Management
Assist the Ministry in Bid Process Management including development of selection criteria for
identifying and selecting agencies for undertaking the development of Strategic Distribution
Center and subsequently in over-sighting Project implementation to time, cost and specifications
as agreed upon.
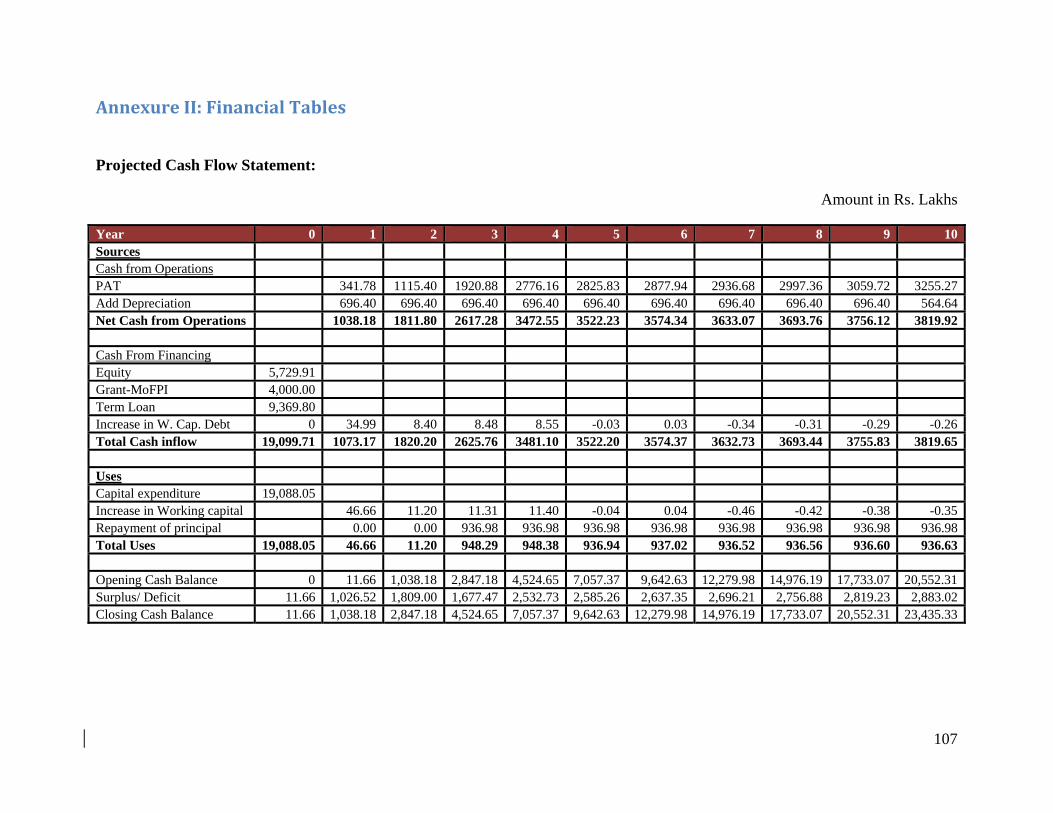
107
Annexure II: Financial Tables
Projected Cash Flow Statement:
Amount in Rs. Lakhs
Year 0 1 2 3 4 5 6 7 8 9 10Sources Cash from Operations PAT 341.78 1115.40 1920.88 2776.16 2825.83 2877.94 2936.68 2997.36 3059.72 3255.27Add Depreciation 696.40 696.40 696.40 696.40 696.40 696.40 696.40 696.40 696.40 564.64Net Cash from Operations 1038.18 1811.80 2617.28 3472.55 3522.23 3574.34 3633.07 3693.76 3756.12 3819.92 Cash From Financing Equity 5,729.91 Grant-MoFPI 4,000.00 Term Loan 9,369.80 Increase in W. Cap. Debt 0 34.99 8.40 8.48 8.55 -0.03 0.03 -0.34 -0.31 -0.29 -0.26Total Cash inflow 19,099.71 1073.17 1820.20 2625.76 3481.10 3522.20 3574.37 3632.73 3693.44 3755.83 3819.65 Uses Capital expenditure 19,088.05 Increase in Working capital 46.66 11.20 11.31 11.40 -0.04 0.04 -0.46 -0.42 -0.38 -0.35Repayment of principal 0.00 0.00 936.98 936.98 936.98 936.98 936.98 936.98 936.98 936.98Total Uses 19,088.05 46.66 11.20 948.29 948.38 936.94 937.02 936.52 936.56 936.60 936.63 Opening Cash Balance 0 11.66 1,038.18 2,847.18 4,524.65 7,057.37 9,642.63 12,279.98 14,976.19 17,733.07 20,552.31Surplus/ Deficit 11.66 1,026.52 1,809.00 1,677.47 2,532.73 2,585.26 2,637.35 2,696.21 2,756.88 2,819.23 2,883.02Closing Cash Balance 11.66 1,038.18 2,847.18 4,524.65 7,057.37 9,642.63 12,279.98 14,976.19 17,733.07 20,552.31 23,435.33
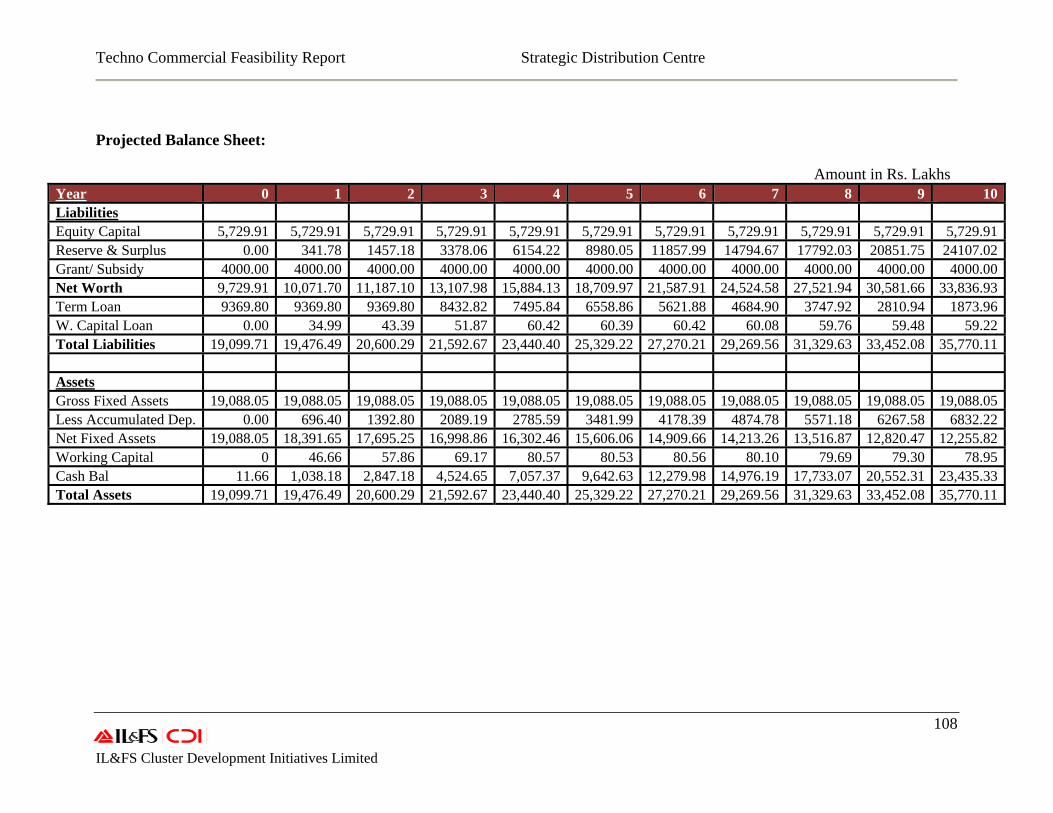
Techno Commercial Feasibility Report Strategic Distribution Centre
108 IL&FS Cluster Development Initiatives Limited
Projected Balance Sheet:
Amount in Rs. Lakhs Year 0 1 2 3 4 5 6 7 8 9 10 Liabilities Equity Capital 5,729.91 5,729.91 5,729.91 5,729.91 5,729.91 5,729.91 5,729.91 5,729.91 5,729.91 5,729.91 5,729.91 Reserve & Surplus 0.00 341.78 1457.18 3378.06 6154.22 8980.05 11857.99 14794.67 17792.03 20851.75 24107.02 Grant/ Subsidy 4000.00 4000.00 4000.00 4000.00 4000.00 4000.00 4000.00 4000.00 4000.00 4000.00 4000.00 Net Worth 9,729.91 10,071.70 11,187.10 13,107.98 15,884.13 18,709.97 21,587.91 24,524.58 27,521.94 30,581.66 33,836.93 Term Loan 9369.80 9369.80 9369.80 8432.82 7495.84 6558.86 5621.88 4684.90 3747.92 2810.94 1873.96 W. Capital Loan 0.00 34.99 43.39 51.87 60.42 60.39 60.42 60.08 59.76 59.48 59.22 Total Liabilities 19,099.71 19,476.49 20,600.29 21,592.67 23,440.40 25,329.22 27,270.21 29,269.56 31,329.63 33,452.08 35,770.11 Assets Gross Fixed Assets 19,088.05 19,088.05 19,088.05 19,088.05 19,088.05 19,088.05 19,088.05 19,088.05 19,088.05 19,088.05 19,088.05 Less Accumulated Dep. 0.00 696.40 1392.80 2089.19 2785.59 3481.99 4178.39 4874.78 5571.18 6267.58 6832.22 Net Fixed Assets 19,088.05 18,391.65 17,695.25 16,998.86 16,302.46 15,606.06 14,909.66 14,213.26 13,516.87 12,820.47 12,255.82 Working Capital 0 46.66 57.86 69.17 80.57 80.53 80.56 80.10 79.69 79.30 78.95 Cash Bal 11.66 1,038.18 2,847.18 4,524.65 7,057.37 9,642.63 12,279.98 14,976.19 17,733.07 20,552.31 23,435.33 Total Assets 19,099.71 19,476.49 20,600.29 21,592.67 23,440.40 25,329.22 27,270.21 29,269.56 31,329.63 33,452.08 35,770.11
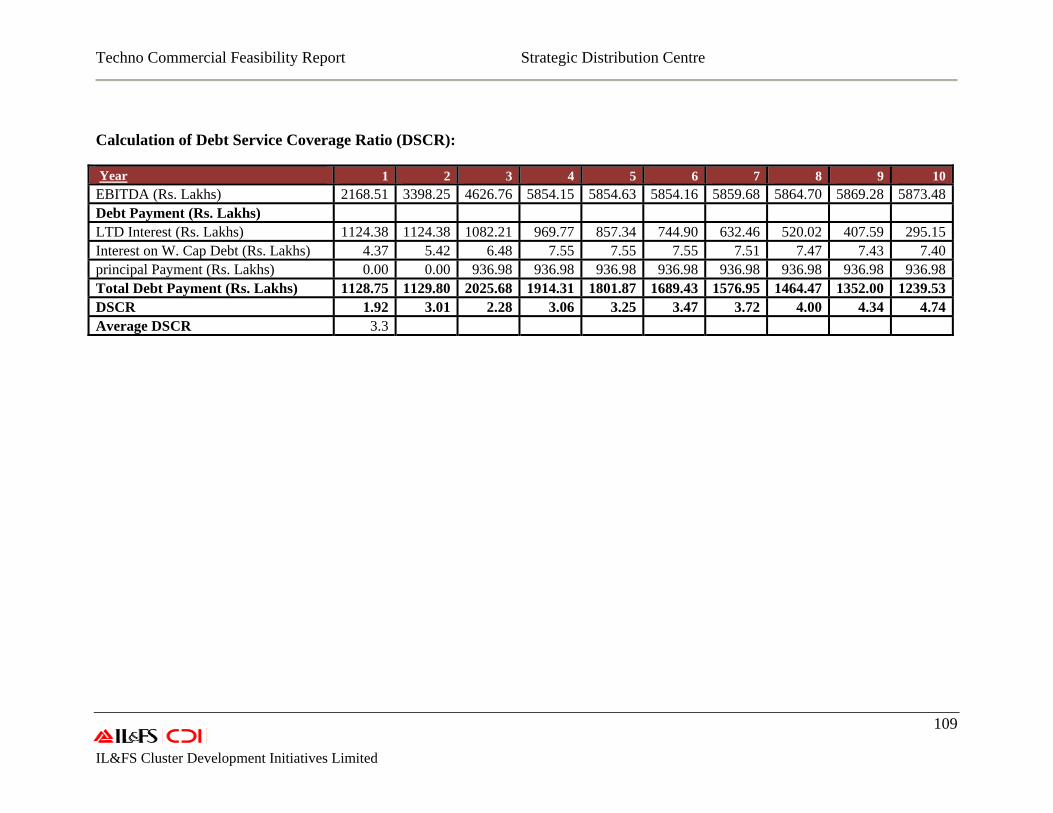
Techno Commercial Feasibility Report Strategic Distribution Centre
109 IL&FS Cluster Development Initiatives Limited
Calculation of Debt Service Coverage Ratio (DSCR):
Year 1 2 3 4 5 6 7 8 9 10EBITDA (Rs. Lakhs) 2168.51 3398.25 4626.76 5854.15 5854.63 5854.16 5859.68 5864.70 5869.28 5873.48Debt Payment (Rs. Lakhs) LTD Interest (Rs. Lakhs) 1124.38 1124.38 1082.21 969.77 857.34 744.90 632.46 520.02 407.59 295.15Interest on W. Cap Debt (Rs. Lakhs) 4.37 5.42 6.48 7.55 7.55 7.55 7.51 7.47 7.43 7.40principal Payment (Rs. Lakhs) 0.00 0.00 936.98 936.98 936.98 936.98 936.98 936.98 936.98 936.98Total Debt Payment (Rs. Lakhs) 1128.75 1129.80 2025.68 1914.31 1801.87 1689.43 1576.95 1464.47 1352.00 1239.53DSCR 1.92 3.01 2.28 3.06 3.25 3.47 3.72 4.00 4.34 4.74Average DSCR 3.3
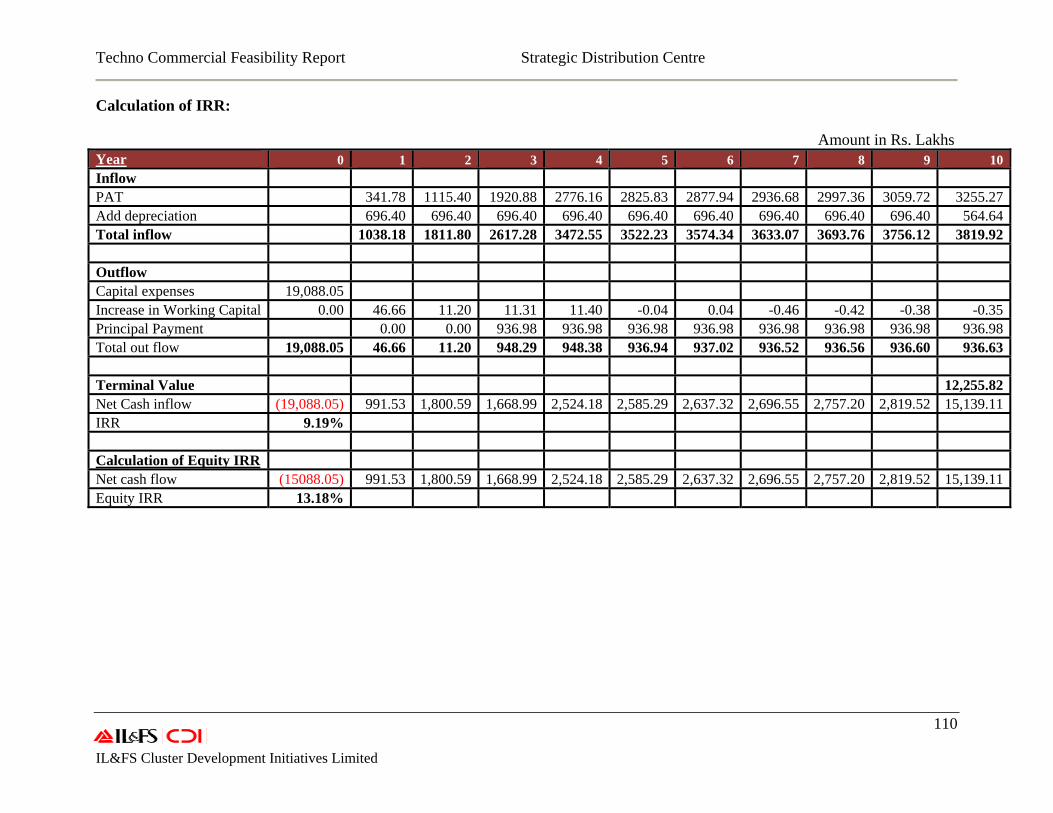
Techno Commercial Feasibility Report Strategic Distribution Centre
110 IL&FS Cluster Development Initiatives Limited
Calculation of IRR:
Amount in Rs. Lakhs Year 0 1 2 3 4 5 6 7 8 9 10 Inflow PAT 341.78 1115.40 1920.88 2776.16 2825.83 2877.94 2936.68 2997.36 3059.72 3255.27 Add depreciation 696.40 696.40 696.40 696.40 696.40 696.40 696.40 696.40 696.40 564.64 Total inflow 1038.18 1811.80 2617.28 3472.55 3522.23 3574.34 3633.07 3693.76 3756.12 3819.92 Outflow Capital expenses 19,088.05 Increase in Working Capital 0.00 46.66 11.20 11.31 11.40 -0.04 0.04 -0.46 -0.42 -0.38 -0.35 Principal Payment 0.00 0.00 936.98 936.98 936.98 936.98 936.98 936.98 936.98 936.98 Total out flow 19,088.05 46.66 11.20 948.29 948.38 936.94 937.02 936.52 936.56 936.60 936.63 Terminal Value 12,255.82 Net Cash inflow (19,088.05) 991.53 1,800.59 1,668.99 2,524.18 2,585.29 2,637.32 2,696.55 2,757.20 2,819.52 15,139.11 IRR 9.19% Calculation of Equity IRR Net cash flow (15088.05) 991.53 1,800.59 1,668.99 2,524.18 2,585.29 2,637.32 2,696.55 2,757.20 2,819.52 15,139.11 Equity IRR 13.18%
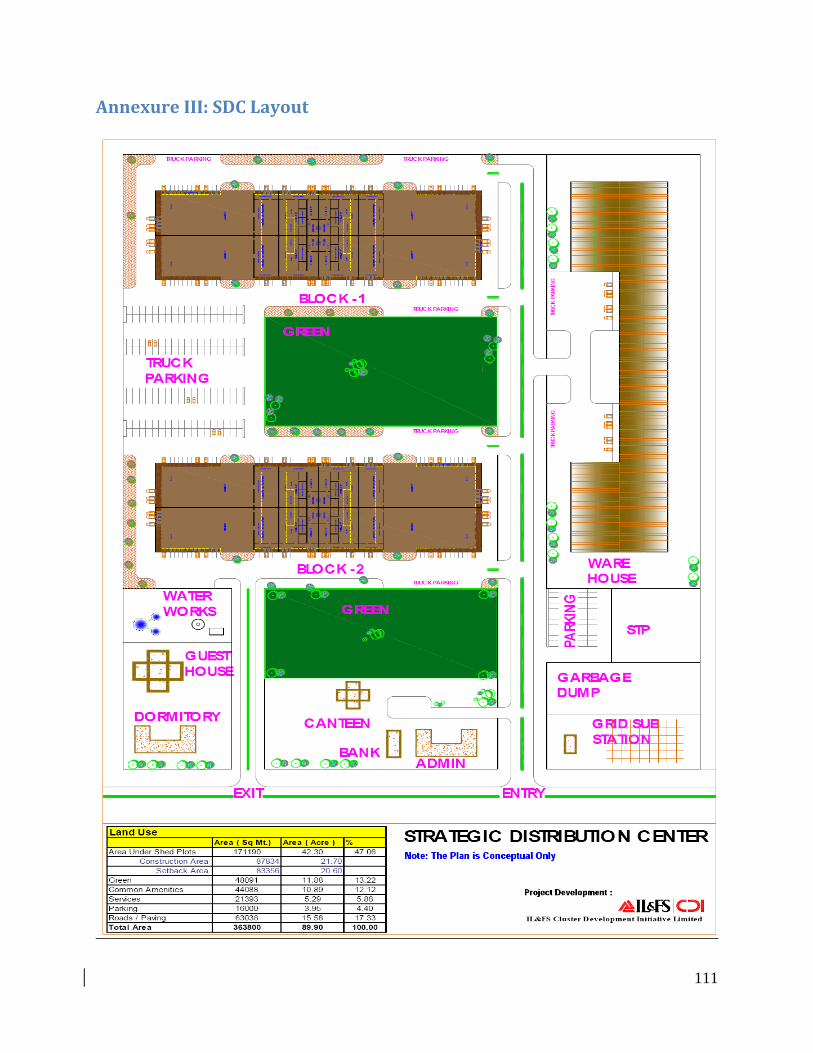
111
Annexure III: SDC Layout
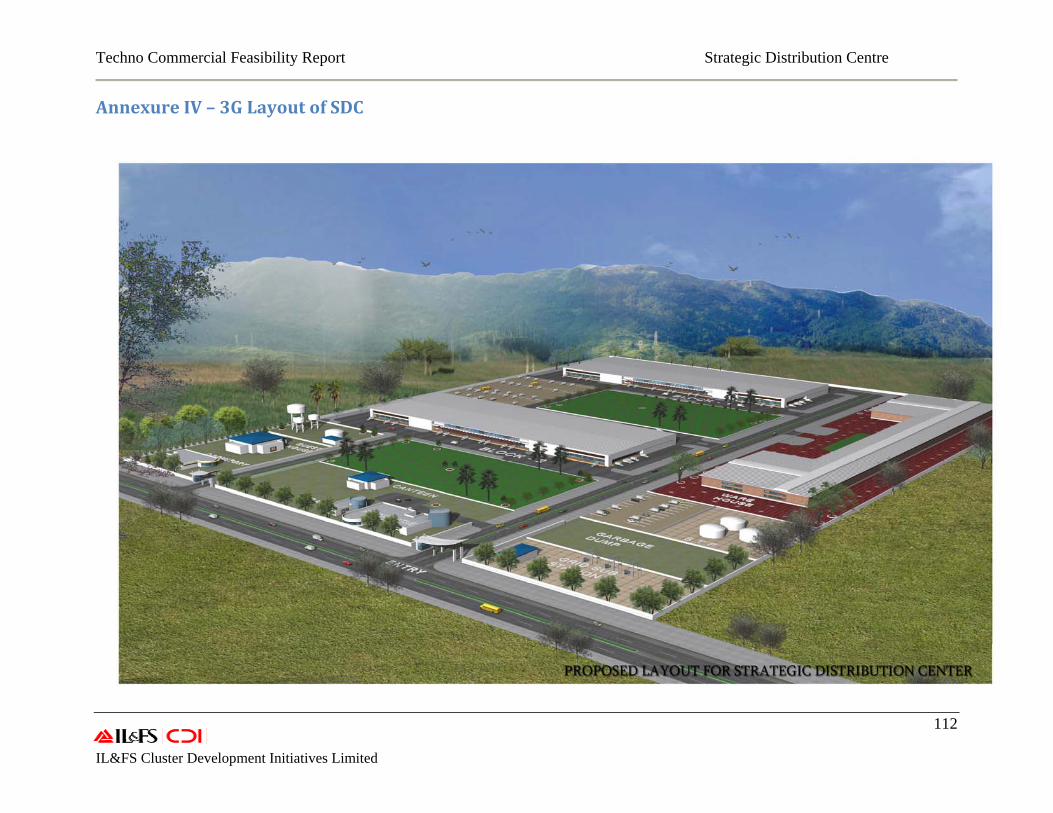
Techno Commercial Feasibility Report Strategic Distribution Centre
112 IL&FS Cluster Development Initiatives Limited
Annexure IV – 3G Layout of SDC
Recommended