
8/8/2019 Stock Market Reports for the Week (10th - 14th January - 2011)
http://slidepdf.com/reader/full/stock-market-reports-for-the-week-10th-14th-january-2011 1/6
1 | NOVEMBER 2010 | www.capitalvia.com
U.S. stocks fell, trimming the market's sixth weekly gain, after the nation added fewer jobs than forecast and two banks lost a pivotal foreclosure case.
Last month's 6.5 percent advance in the S&P 500 was the biggest December rally since 1991, Bloomberg data show, and the index is up 21 percent since the
end of August. This pushed valuations on the gauge to 16 times the operating profits of its companies, the highest since June.
Payrolls increased 103,000, compared with the median forecast of 150,000 in a Bloomberg News survey, Labor Department figures showed. November
employment rose a revised 71,000, more than previously estimated. The jobless rate fell to 9.4 percent, the lowest level since May 2009, reflecting gains in jobs
and fewer people in the labor force.
US MARKET
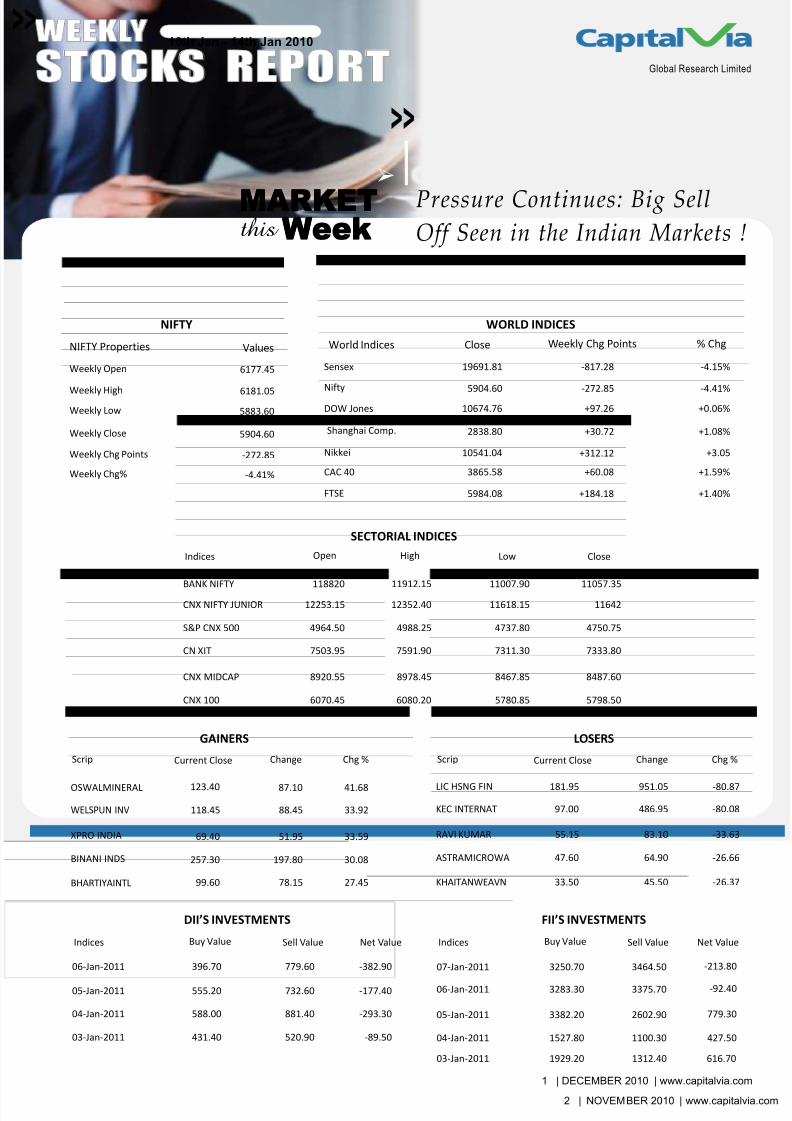
Bears took the charge over markets in first week of 2011 itself and dragged the 50-share NSE Nifty to 5,904.60, down 229.9 points or 3.75% and the Sensex shed
817.28 points or 3.98% to settled at 19,691.81.
Midcap, Small Cap and Nifty Junior indices went down 3-4.8%. In midcap space, IndusInd and YES Bank crashed 14%.
The Reserve Bank of India is scheduled to review policy on Jan. 25, and a economists poll on Wednesday forecast at least a 25 basis point increase in key rates.
The 50-share NSE index was down 2.4 percent at 5,904.60 points.
WEEK WRAP
Asian stocks rose for a fourth straight week as exporters gained on a rising dollar and U.S. economic reports that boosted confidence in the world's largest
economy.
In Japan, the Nikkei 225 Stock Average rose 3.1 percent as a stronger dollar boosted the profit outlook for Japanese exporters. Markets in Japan, China, Australia
and New Zealand were closed on Jan. 3 for a holiday.
IntercontinentalExchange Inc.'s Dollar Index, which tracks the greenback against the currencies of six major U.S. trading partners including the yen, increased 2.7
percent to 81.136 at 5 p.m. yesterday in New York, from 79.028 on Dec. 31. The gauge of the greenback rose yesterday for a fifth consecutive day.
ASIAN & EMERGING MARKET
Foreign exchange reserves rose $2.3 billion during the week ended December 31, largely on account of revaluation of non- dollar reserves vis-à-vis the dollar.
The latest figures released by the Reserve Bank of India (RBI) on Friday show that the total foreign exchange reserves, including gold and special drawing rights
(SDR — reserve currency with the International Monetary Fund) rose $2,303 million to touch $297.33 billion during the week ended December 31. While
foreign currency assets rose $1,909 million, the value of gold in reserves rose $346 million. The value of SDR and the reserve capital reserves with the IMF rose$35 million and $13 million, respectively, during the week
The RBI has raised the key interest rates for six times in 2010 and is expected to again hike them in its next policy review on January 25 to cool down inflation.
MICRO ECONOMIC FRONT
10th Jan - 14th Jan 2010WEEKLY
STOCKS REPORTGlobal Research Limited
Pressure Continues: Big SellOff Seen in the Indian Markets !
MARKETthis WeekMARKETthis Week
>
>>
8/8/2019 Stock Market Reports for the Week (10th - 14th January - 2011)
http://slidepdf.com/reader/full/stock-market-reports-for-the-week-10th-14th-january-2011 2/61 | DECEMBER 2010 | www.capitalvia.com
LOSERSGAINERS
FII’S INVESTMENTSDII’S INVESTMENTS
Indices Buy Value Sell Value Net Value
Scrip Current Close Change Chg % Scrip Current Close Change Chg %
Indices Buy Value Sell Value Net Value
S&P CNX 500
CN XIT
CNX MIDCAP
CNX 100
4964.50
7503.95
8920.55
6070.45
4988.25
7591.90
8978.45
6080.20
4737.80
7311.30
8467.85
5780.85
4750.75
7333.80
8487.60
5798.50
OSWALMINERAL
XPRO INDIA
123.40
69.40
BHARTIYAINTL 99.60
WELSPUN INV 118.45
BINANI INDS 257.30
87.10
51.95
78.15
88.45
197.80
41.68
33.59
27.45
33.92
30.08
LIC HSNG FIN
KEC INTERNAT
RAVI KUMAR
ASTRAMICROWA
KHAITANWEAVN
97.00
181.95
55.15
47.60
33.50
486.95
951.05
83.10
64.90
45.50
-80.08
-80.87
-33.63
-26.66
-26.37
06-Jan-2011 396.70 779.60 -382.90
05-Jan-2011 555.20 732.60 -177.40
07-Jan-2011 3250.70 3464.50
06-Jan-2011 3283.30 3375.70
05-Jan-2011 3382.20 2602.90
04-Jan-2011 1527.80 1100.30
-213.80
-92.40
779.30
427.50
WORLD INDICES
CloseWorld Indices Weekly Chg Points % Chg
NIFTY
NIFTY Properties Values
Open High Low Close
SECTORIAL INDICES
Indices
Shanghai Comp.
DOW Jones
19691.81
5904.60
2838.80
10674.76
5984.08
10541.04
3865.58
Sensex
Nifty
FTSE
Nikkei
CAC 40
-817.28
-272.85
+30.72
+97.26
+184.18
+312.12
+60.08
-4.15%
-4.41%
+1.08%
+0.06%
+1.40%
+3.05
+1.59%
Weekly Open
Weekly High
Weekly Low
Weekly Close
Weekly Chg Points
Weekly Chg%
6177.45
6181.05
5883.60
5904.60
-272.85
-4.41%
BANK NIFTY
CNX NIFTY JUNIOR 12253.15
118820
12352.40
11912.15
11618.15
11007.90
11642
11057.35
2 | NOVEMBER 2010 | www.capitalvia.com
10th Jan - 14th Jan 2010WEEKLY
STOCKS REPORTGlobal Research Limited
MARKETthis WeekMARKETthis Week
>>
>
03-Jan-2011 1929.20 1312.40 616.70
04-Jan-2011 588.00 881.40 -293.30
03-Jan-2011 431.40 520.90 -89.50
Pressure Continues: Big SellOff Seen in the Indian Markets !

8/8/2019 Stock Market Reports for the Week (10th - 14th January - 2011)
http://slidepdf.com/reader/full/stock-market-reports-for-the-week-10th-14th-january-2011 3/6
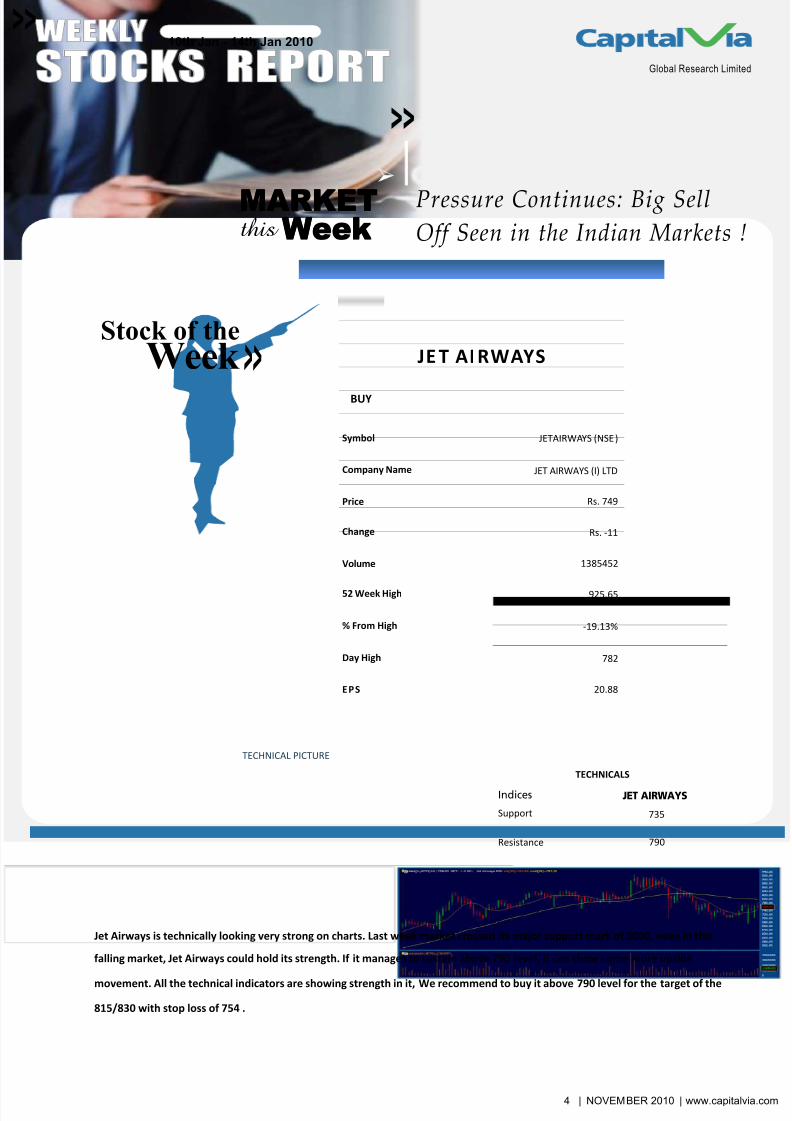
WEEK AHEAD SPOT NIFTY
Bank nifty had sharp fall in last trading session, If it break 11040 level we can see more correction in it. ,One Should take position after
proper break out in either side .Support for bank nifty is at 11041 /10920 and Resistance is at 11350/11445 levels
F i g u r e : B a n k N i f t y W
e e k l y
WEEK AHEAD BANK NIFTY
Support 1
Support 2
Resistance 1
Resistance 2
10972
10864
11256
11432
TECHNICALS
ValuesProperties
Nifty future had sharp fall in last trading session and closed below its psychological level. In coming week we can see smart Pull back in
it. One should take position after proper break out. . Support for nifty future is at 5863/5750 and Resistance 5980/6030.
F i g u r e : 1 N i f t y W e e k l y
TECHNICALS
ValuesProperties
Support 1
Support 2
Resistance 1
Resistance 2
5845
5775
6025
6140
3 | NOVEMBER 2010 | www.capitalvia.com
10th Jan - 14th Jan 2010WEEKLY
STOCKS REPORTGlobal Research Limited
MARKETthis WeekMARKETthis Week
>>
>
Pressure Continues: Big SellOff Seen in the Indian Markets !
8/8/2019 Stock Market Reports for the Week (10th - 14th January - 2011)
http://slidepdf.com/reader/full/stock-market-reports-for-the-week-10th-14th-january-2011 4/6

8/8/2019 Stock Market Reports for the Week (10th - 14th January - 2011)
http://slidepdf.com/reader/full/stock-market-reports-for-the-week-10th-14th-january-2011 5/6
W
H Y C A N S
L I M
?
“CAN SLIM is a formula created by
William J. O'Neil, who is thefounder of the Investor's Business
Daily and author of the book How
to Make Money in Stocks - A
Winning System in Good Times or
Bad.
Each letter in CAN SLIM stands for
one of the seven chief
characteristics that are commonly
found in the greatest winning
stocks. The C-A-N-S-L-I-M.
characteristics are often presentprior to a stock making a
significant rise in price, and making
huge profits for the shareholders!
O'Neil explains how he conducted
an intensive study of 500 of the
biggest winners in the stock
market from 1953 to 1990. A
model of each of these companies
was built and studied. Again and
again, it was noticed that almost
all of the biggest stock marketwinners had very similar
characteristics just before they
began their big moves.”
Primary Factors
Almost 251.21% of increase in Q o Q Earnings.
KEY STATISTICS
CCurrent Quarter Earning per Share. The Higher The Better.
Primary Factors
Annual losses incurred has shown a decline of 69.20% Y o Y.
A
Primary Factors
JET AIRWAYS (I) LTD is set to break out its resistance after a goodconsolidation phase.
N
Primary Factors
JET AIRWAYS (I) LTD is a large cap stock consisting of approx Rs.
6465.65 crores Shares Outstanding (Total Public Shareholding).
S Supply and Demand: Shares Outstanding Plus Big Volume
Demand.
Primary Factors
JET AIRWAYS (I) LTD is a leading stock with a relative
strength 52.99% in Weekly and 49.50% in Daily.
LLeader or Laggard: Which is your stock?
Primary Factors
Approximately 16.82% of Shares are held by the
Institutional Investors (FII”s, Mutual Funds etc.)
IInstitutional Sponsorship: Follow the Leaders.
Primary Factors
If Market continues to remain in a secular uptrend,
hence overall conditions are appropriate to initiate long
position in the stock: A Big plus for the Stock.
M
Market Direction
Annual Earnings Increases: Look for a significant growth.
New Products, New Management, New Highs, Buying at
Right Time.
S o u r c e s : S i h l . i n
5 | NOVEMBER 2010 | www.capitalvia.com
10th Jan - 14th Jan 2010WEEKLY
STOCKS REPORTGlobal Research Limited
MARKETthis WeekMARKETthis Week
>>
>
Pressure Continues: Big SellOff Seen in the Indian Markets !
**Please notice our stock of the week this time is purely based on strong technical analysis. So it's our kind request to clients that those trading with a short
term technical perspective should only take positions in it while those investing with fundamental aspects may skip it as it may not be the right choice
fundamentally.

8/8/2019 Stock Market Reports for the Week (10th - 14th January - 2011)
http://slidepdf.com/reader/full/stock-market-reports-for-the-week-10th-14th-january-2011 6/6
The information and views in this report, our website & all the service we provide are believed to be reliable, but we do not accept any responsibility (or
liability) for errors of fact or opinion. Users have the right to choose the product/s that suits them the most.
Sincere efforts have been made to present the right investment perspective. The information contained herein is
based on analysis and up on sources that we consider reliable. This material is
for personal information and based upon it & take no responsibility
The stock price projections shown are not necessarily indicative of future price performance. The information herein, together with all estimates and
forecasts, can change without notice.
Analyst or any person related to CapitalVia might be holding positions in the stocks recommended.
It is understood that anyone who is browsing through the site has done so at his free will and does not read any views expressed as a recommendation for
which either the site or its owners or anyone can be held responsible for.
Any surfing and reading of the information is the acceptance of this disclaimer.
All Rights Reserved.
Investment in Stocks has its own risks.
We, however, do not vouch for the accuracy or the completeness thereof.
we are not responsible for any loss incurred whatsoever for any financial profits or
loss which may arise from the recommendations above.
CapitalVia does not purport to be an invitation or an offer to buy or sell any financial instrument.
Our Clients (Paid Or Unpaid), Any third party or anyone else have no rights to forward or share our calls or SMS or Report or Any Information Provided by
us to/with anyone which is received directly or indirectly by them. If found so then Serious Legal Actions can be taken.
D I S C L A I M E R
Contact Number:
Hotline: +91-91790-02828
Landline: +91-731-668000
Fax: +91-731-4238027
No. 99, 1st Floor, Surya Complex
R. V. Road, Basavangudi
Opposite Lalbagh West Gate
Bangalore - 560004
Corporate Office Address:
India:
CapitalVia Global Research Limited
No. 506 West, Corporate House
169, R. N. T. Marg, Near D. A. V. V.
Indore - 452001
Singapore:
CapitalVia Global Research Pvt. Ltd.
Block 2 Balestier Road
#04-665 Balestier Hill
Shopping Centre
Singapore - 320002
C O N T A C T U S
10th Jan - 14th Jan 2010WEEKLY
STOCKS REPORTGlobal Research Limited
MARKETthis WeekMARKETthis Week
>>
>
Pressure Continues: Big SellOff Seen in the Indian Markets !
Recommended


