Taunton Deane
Public Health District Needs Profile
To inform the commissioning and delivery of services to improve the Health and Wellbeing outcomes for children and
their families
Produced by:
Public Health at Somerset County Council February 2015

i
Introduction
Public Health has produced this Health and Wellbeing Needs Profile, in collaboration
with the getset service, to inform the commissioning and delivery of services to
improve outcomes for children and their families.
‘getset’ Somerset is all about narrowing the gap in achievement. We want to do this
by bridging the equalities gap to make sure all children, young people and their
families are able to achieve their full potential.
Our Vision is to offer high quality, easily accessible local services which target those
who need them most. We want to ensure that:
Children, young people and their families receive services that they need,
when they need them and where they can easily access them.
Service providers work together to provide coherent, flexible and integrated
Early Help services for children and young people and their families when
they need them and so reducing the likelihood of the development of more
complex needs
Commissioners work together across sectors and services to meet need in
the best way possible and achieve the best value for money
The services provided make a difference to the lives of children, young people
and their families and local communities.
This profile contains data and statistics at a District Authority level. There are some
indicators which are only available at a county-wide level that are not currently
included.
West Taunton Deane ‘getset’ contains areas that overlap with both West Somerset
and Taunton Deane Local (District) Authority areas. Although for the purposes of
‘getset’ West Taunton Deane area is considered to be part of West Somerset, in this
report the Local (District) Authority boundaries have been used. This is because
most of the indicators are only available at a district level from national sources.
Please note that the getset service is currently (March 2015) producing a series of
getset Data Summary documents (a county-wide summary and a summary for each
getset Service Area) to support the getset 0-4 (Children’s Centre) service.
ii
Contents
Introduction ................................................................................................................. i
Contents ...................................................................................................................... ii
Summary .................................................................................................................... 1
1. Population ............................................................................................................ 2
2. Deprivation .......................................................................................................... 4
3. Lone Parent Households ..................................................................................... 7
4. Births ................................................................................................................... 8
5. Breastfeeding..................................................................................................... 10
6. Healthy Weight .................................................................................................. 11
7. Awareness of help and support ......................................................................... 13
8. Hospital Admissions .......................................................................................... 14
9. Mortality ............................................................................................................. 15
Appendix A: Deprivation Indicators .......................................................................... 17
Appendix B: Census Geographies ........................................................................... 17
Appendix C: Rates ................................................................................................... 17
Page 1 of 18
Summary
There are 25,564 children and young people aged between 0 and 19 living in
Taunton Deane and these people represent 23% of the overall population.
Unsurprisingly in Taunton Deane there are relatively higher numbers of children and
young people living in some areas of Taunton and Wellington.
Somerset (14.9%) has a lower proportion of children aged 15 and under living in
poverty than the South West (16.2%) and England (20.6%) averages and
percentage for Taunton Deane (14.6%) is roughly in line with Somerset.
Children in most areas of Wellington and Taunton are expected to experience high
levels of both income deprivation and overall multiple deprivation in comparison to
their peers in the rest of the county.
Taunton Dean (8.9%) had a higher proportion of lone parent households than the
Somerset (8.4%) average at the time of the 2011 Census.
Taunton Lyngford was one of only three wards in the county to be a hotspot for
teenage conceptions in the county in both 2009-11 and 2010-12. There were no
other wards in the district that were a hotspot in 2010-12.
Taunton Deane (85.3%) had a significantly higher proportion of babies that were
initially breastfed than the Somerset (82.6%) average. The percentage breastfed at
6-8 weeks (51.9%) was also significantly higher than the county (48.5%) average.
However, this still reflects the high drop-off rates seen across Somerset.
In general levels of obesity across the district were comparatively low to the rest of
Somerset. However the Taunton Lyngford area had some of the highest levels of
obesity in the county that had been measured for both Reception and Year 6
children in the National Childhood Measurement Programme (NCMP) between
2009/10 and 2013/14. Kingston St Mary’s area and Wellington area also had some
of the highest levels for Year 6 children.
Pupils in Taunton Deane were the most likely (33%) to say they knew an adult they
could trust to talk to if they were worried about something. However, they were also
less likely (54%) to know how to visit the school nurse than most other districts.
Page 2 of 18
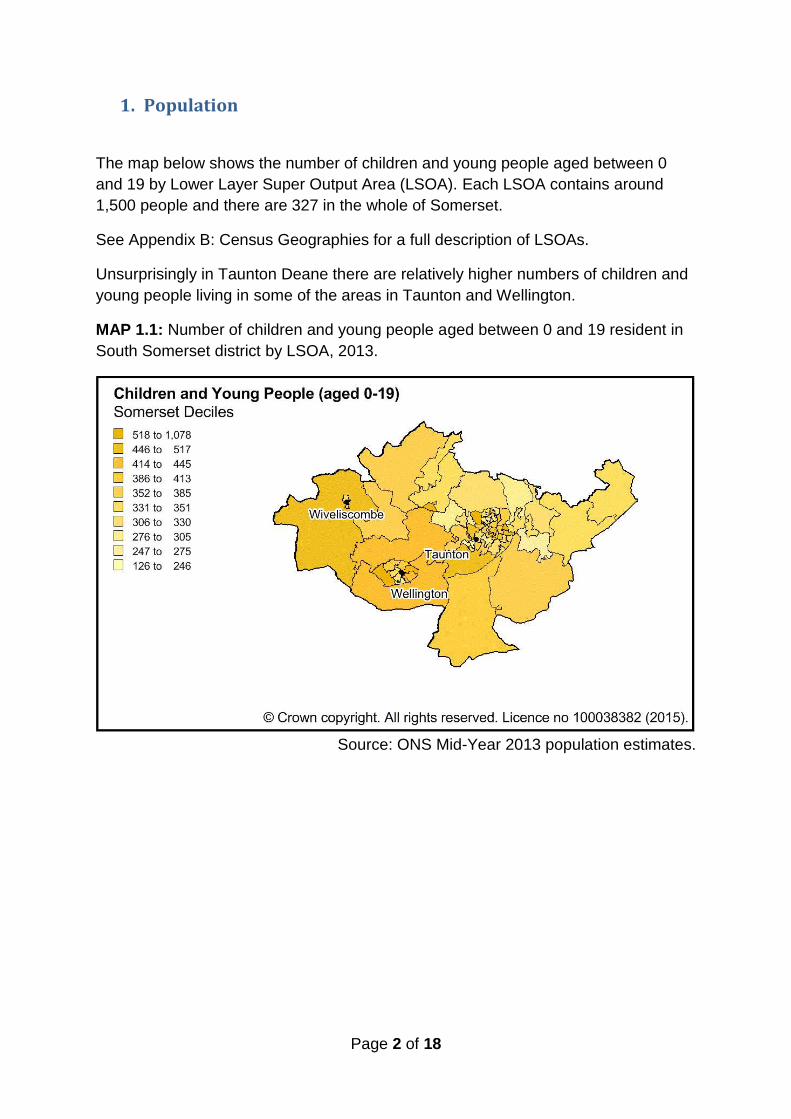
1. Population
The map below shows the number of children and young people aged between 0
and 19 by Lower Layer Super Output Area (LSOA). Each LSOA contains around
1,500 people and there are 327 in the whole of Somerset.
See Appendix B: Census Geographies for a full description of LSOAs.
Unsurprisingly in Taunton Deane there are relatively higher numbers of children and
young people living in some of the areas in Taunton and Wellington.
MAP 1.1: Number of children and young people aged between 0 and 19 resident in
South Somerset district by LSOA, 2013.
Source: ONS Mid-Year 2013 population estimates.
Page 3 of 18
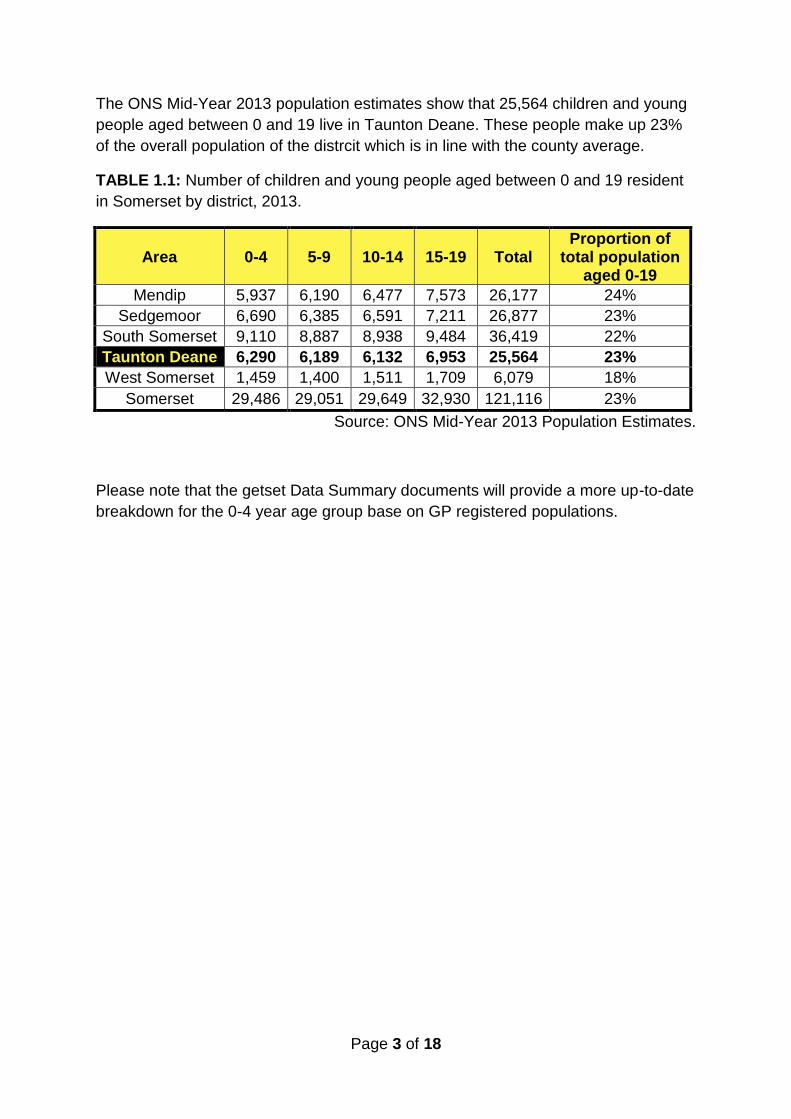
The ONS Mid-Year 2013 population estimates show that 25,564 children and young
people aged between 0 and 19 live in Taunton Deane. These people make up 23%
of the overall population of the distrcit which is in line with the county average.
TABLE 1.1: Number of children and young people aged between 0 and 19 resident
in Somerset by district, 2013.
Area 0-4 5-9 10-14 15-19 Total Proportion of
total population aged 0-19
Mendip 5,937 6,190 6,477 7,573 26,177 24%
Sedgemoor 6,690 6,385 6,591 7,211 26,877 23%
South Somerset 9,110 8,887 8,938 9,484 36,419 22%
Taunton Deane 6,290 6,189 6,132 6,953 25,564 23%
West Somerset 1,459 1,400 1,511 1,709 6,079 18%
Somerset 29,486 29,051 29,649 32,930 121,116 23%
Source: ONS Mid-Year 2013 Population Estimates.
Please note that the getset Data Summary documents will provide a more up-to-date
breakdown for the 0-4 year age group base on GP registered populations.
Page 4 of 18
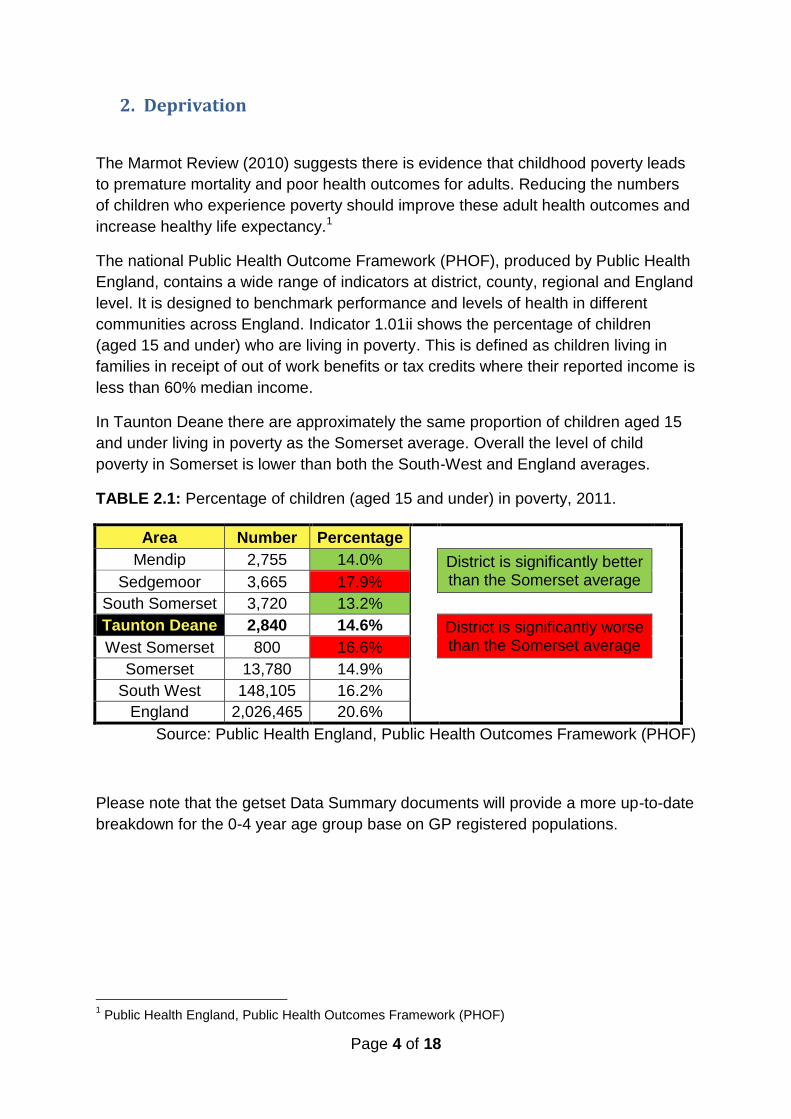
2. Deprivation
The Marmot Review (2010) suggests there is evidence that childhood poverty leads
to premature mortality and poor health outcomes for adults. Reducing the numbers
of children who experience poverty should improve these adult health outcomes and
increase healthy life expectancy.1
The national Public Health Outcome Framework (PHOF), produced by Public Health
England, contains a wide range of indicators at district, county, regional and England
level. It is designed to benchmark performance and levels of health in different
communities across England. Indicator 1.01ii shows the percentage of children
(aged 15 and under) who are living in poverty. This is defined as children living in
families in receipt of out of work benefits or tax credits where their reported income is
less than 60% median income.
In Taunton Deane there are approximately the same proportion of children aged 15
and under living in poverty as the Somerset average. Overall the level of child
poverty in Somerset is lower than both the South-West and England averages.
TABLE 2.1: Percentage of children (aged 15 and under) in poverty, 2011.
Area Number Percentage
Mendip 2,755 14.0% District is significantly better than the Somerset average
Sedgemoor 3,665 17.9%
South Somerset 3,720 13.2%
Taunton Deane 2,840 14.6% District is significantly worse than the Somerset average
West Somerset 800 16.6%
Somerset 13,780 14.9%
South West 148,105 16.2%
England 2,026,465 20.6%
Source: Public Health England, Public Health Outcomes Framework (PHOF)
Please note that the getset Data Summary documents will provide a more up-to-date
breakdown for the 0-4 year age group base on GP registered populations.
1 Public Health England, Public Health Outcomes Framework (PHOF)
Page 5 of 18
The difference in deprivation between areas is a major determinant of health
inequality in the United Kingdom. Many studies and analyses have demonstrated the
association of increasingly poor health with increasing deprivation. For instance, all-
cause mortality, smoking prevalence and self-reported long standing illness are all
correlated with deprivation. If deprivation inequalities decrease, health inequalities
are likely to decrease also.2
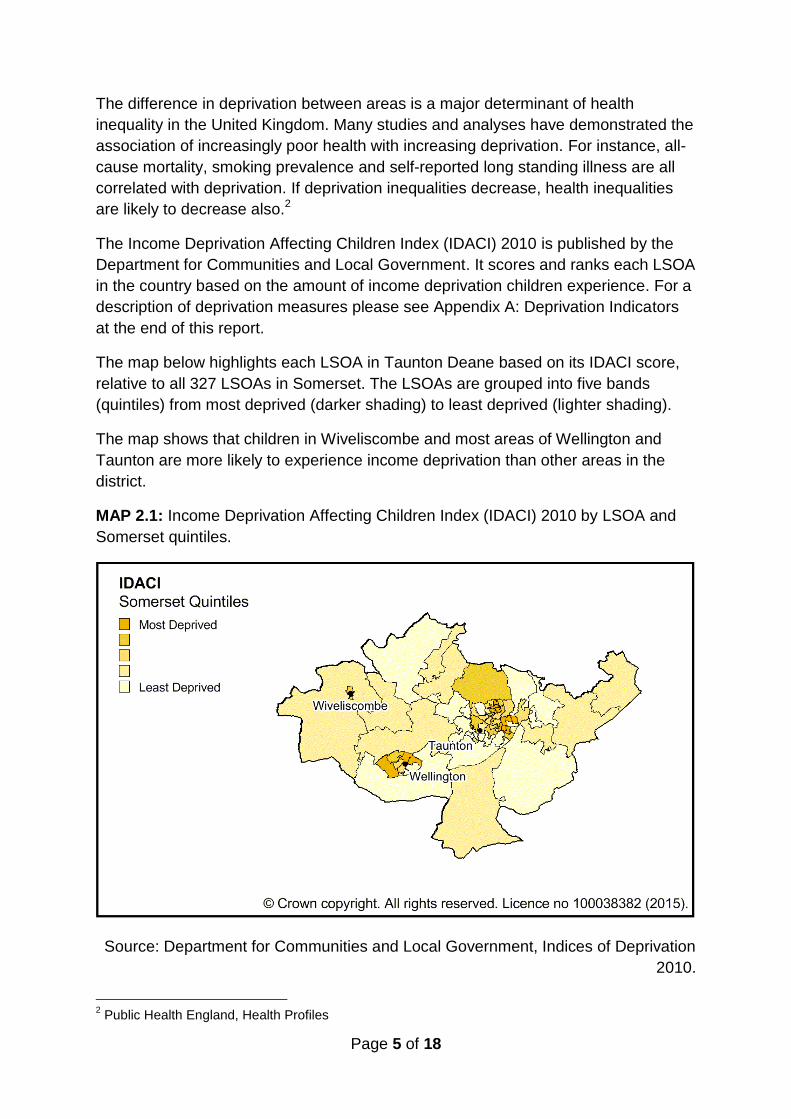
The Income Deprivation Affecting Children Index (IDACI) 2010 is published by the
Department for Communities and Local Government. It scores and ranks each LSOA
in the country based on the amount of income deprivation children experience. For a
description of deprivation measures please see Appendix A: Deprivation Indicators
at the end of this report.
The map below highlights each LSOA in Taunton Deane based on its IDACI score,
relative to all 327 LSOAs in Somerset. The LSOAs are grouped into five bands
(quintiles) from most deprived (darker shading) to least deprived (lighter shading).
The map shows that children in Wiveliscombe and most areas of Wellington and
Taunton are more likely to experience income deprivation than other areas in the
district.
MAP 2.1: Income Deprivation Affecting Children Index (IDACI) 2010 by LSOA and
Somerset quintiles.
Source: Department for Communities and Local Government, Indices of Deprivation
2010.
2 Public Health England, Health Profiles
Page 6 of 18
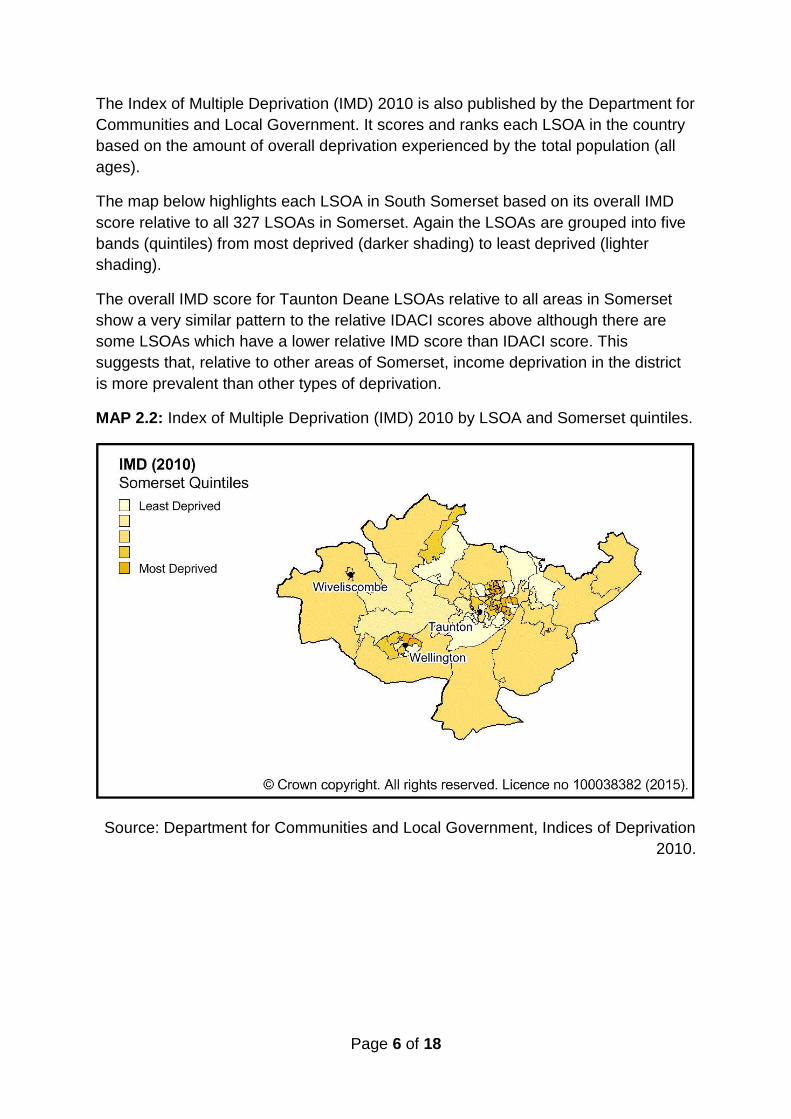
The Index of Multiple Deprivation (IMD) 2010 is also published by the Department for
Communities and Local Government. It scores and ranks each LSOA in the country
based on the amount of overall deprivation experienced by the total population (all
ages).
The map below highlights each LSOA in South Somerset based on its overall IMD
score relative to all 327 LSOAs in Somerset. Again the LSOAs are grouped into five
bands (quintiles) from most deprived (darker shading) to least deprived (lighter
shading).
The overall IMD score for Taunton Deane LSOAs relative to all areas in Somerset
show a very similar pattern to the relative IDACI scores above although there are
some LSOAs which have a lower relative IMD score than IDACI score. This
suggests that, relative to other areas of Somerset, income deprivation in the district
is more prevalent than other types of deprivation.
MAP 2.2: Index of Multiple Deprivation (IMD) 2010 by LSOA and Somerset quintiles.
Source: Department for Communities and Local Government, Indices of Deprivation
2010.
Page 7 of 18
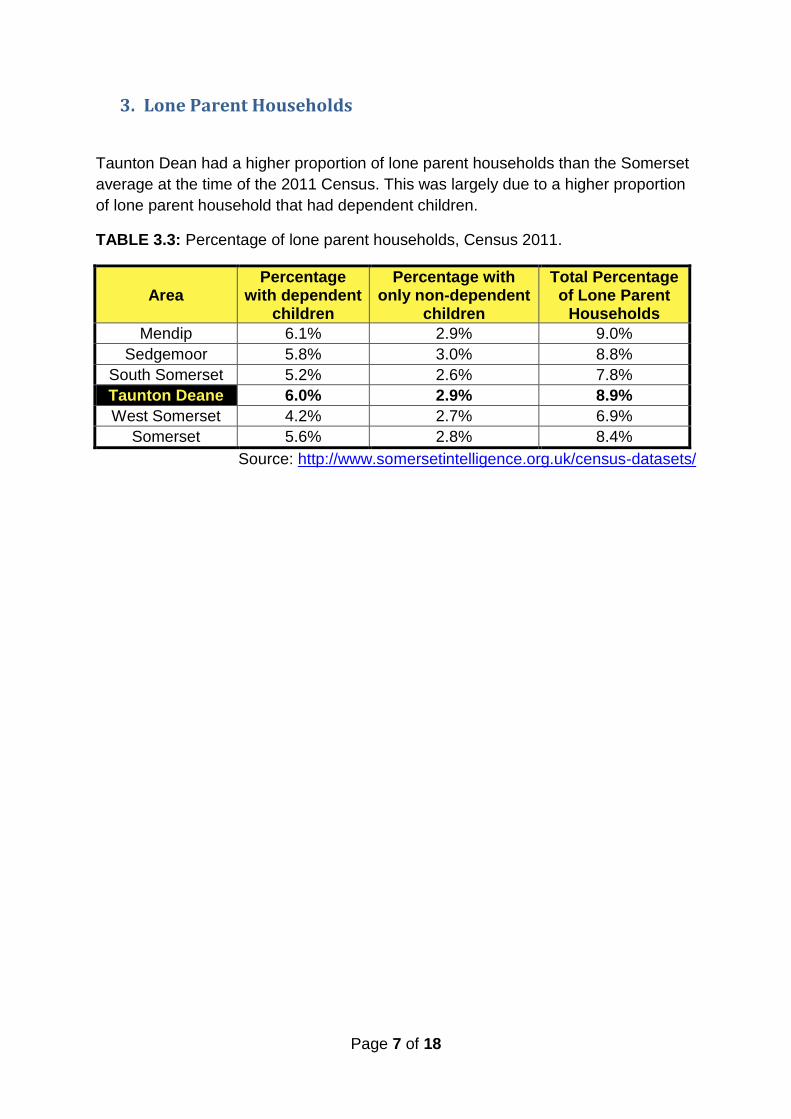
3. Lone Parent Households
Taunton Dean had a higher proportion of lone parent households than the Somerset
average at the time of the 2011 Census. This was largely due to a higher proportion
of lone parent household that had dependent children.
TABLE 3.3: Percentage of lone parent households, Census 2011.
Area Percentage
with dependent children
Percentage with only non-dependent
children
Total Percentage of Lone Parent
Households
Mendip 6.1% 2.9% 9.0%
Sedgemoor 5.8% 3.0% 8.8%
South Somerset 5.2% 2.6% 7.8%
Taunton Deane 6.0% 2.9% 8.9%
West Somerset 4.2% 2.7% 6.9%
Somerset 5.6% 2.8% 8.4%
Source: http://www.somersetintelligence.org.uk/census-datasets/
Page 8 of 18
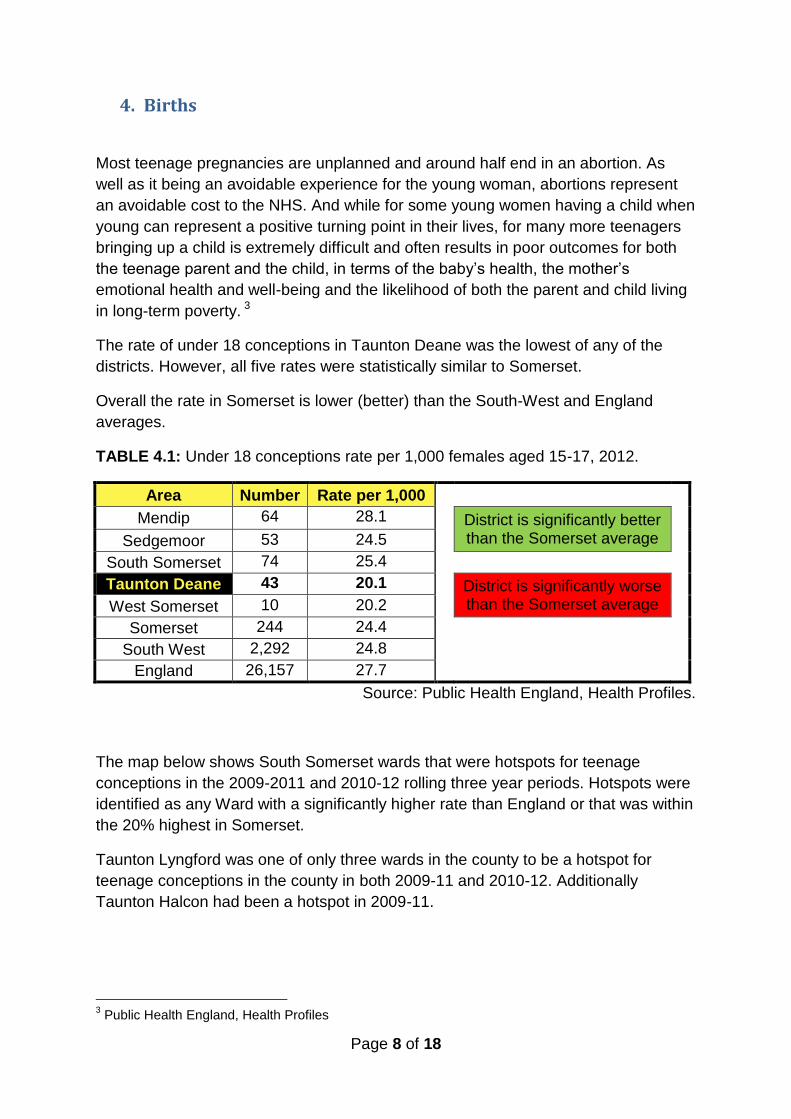
4. Births
Most teenage pregnancies are unplanned and around half end in an abortion. As
well as it being an avoidable experience for the young woman, abortions represent
an avoidable cost to the NHS. And while for some young women having a child when
young can represent a positive turning point in their lives, for many more teenagers
bringing up a child is extremely difficult and often results in poor outcomes for both
the teenage parent and the child, in terms of the baby’s health, the mother’s
emotional health and well-being and the likelihood of both the parent and child living
in long-term poverty. 3
The rate of under 18 conceptions in Taunton Deane was the lowest of any of the
districts. However, all five rates were statistically similar to Somerset.
Overall the rate in Somerset is lower (better) than the South-West and England
averages.
TABLE 4.1: Under 18 conceptions rate per 1,000 females aged 15-17, 2012.
Area Number Rate per 1,000
Mendip 64 28.1 District is significantly better than the Somerset average
Sedgemoor 53 24.5
South Somerset 74 25.4
Taunton Deane 43 20.1 District is significantly worse than the Somerset average
West Somerset 10 20.2
Somerset 244 24.4
South West 2,292 24.8
England 26,157 27.7
Source: Public Health England, Health Profiles.
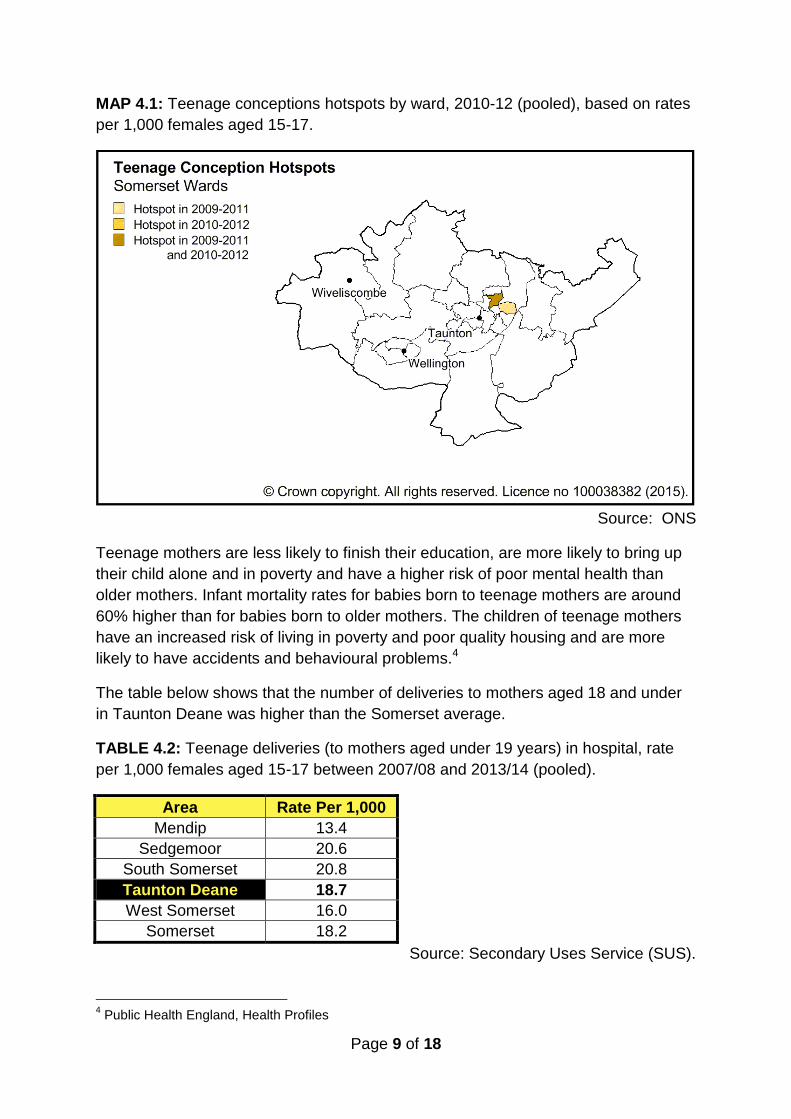
The map below shows South Somerset wards that were hotspots for teenage
conceptions in the 2009-2011 and 2010-12 rolling three year periods. Hotspots were
identified as any Ward with a significantly higher rate than England or that was within
the 20% highest in Somerset.
Taunton Lyngford was one of only three wards in the county to be a hotspot for
teenage conceptions in the county in both 2009-11 and 2010-12. Additionally
Taunton Halcon had been a hotspot in 2009-11.
3 Public Health England, Health Profiles
Page 9 of 18
MAP 4.1: Teenage conceptions hotspots by ward, 2010-12 (pooled), based on rates
per 1,000 females aged 15-17.
Source: ONS
Teenage mothers are less likely to finish their education, are more likely to bring up
their child alone and in poverty and have a higher risk of poor mental health than
older mothers. Infant mortality rates for babies born to teenage mothers are around
60% higher than for babies born to older mothers. The children of teenage mothers
have an increased risk of living in poverty and poor quality housing and are more
likely to have accidents and behavioural problems.4
The table below shows that the number of deliveries to mothers aged 18 and under
in Taunton Deane was higher than the Somerset average.
TABLE 4.2: Teenage deliveries (to mothers aged under 19 years) in hospital, rate
per 1,000 females aged 15-17 between 2007/08 and 2013/14 (pooled).
Area Rate Per 1,000
Mendip 13.4
Sedgemoor 20.6
South Somerset 20.8
Taunton Deane 18.7
West Somerset 16.0
Somerset 18.2
Source: Secondary Uses Service (SUS).
4 Public Health England, Health Profiles
Page 10 of 18
5. Breastfeeding
The PHOF gives the number and proportion of infants initially breastfed and the
prevalence of breastfeeding at the 6-8 week check-up after a baby is born.
NHS England also publish statistics at GP Practice level and these can be accessed
at www.england.nhs.uk/statistics/statistical-work-areas/maternity-and-breastfeeding/
In Taunton Deane the proportion of infants initially breastfed is significantly higher
than the Somerset average. The county in general also has higher rates than both
the South West and England values.
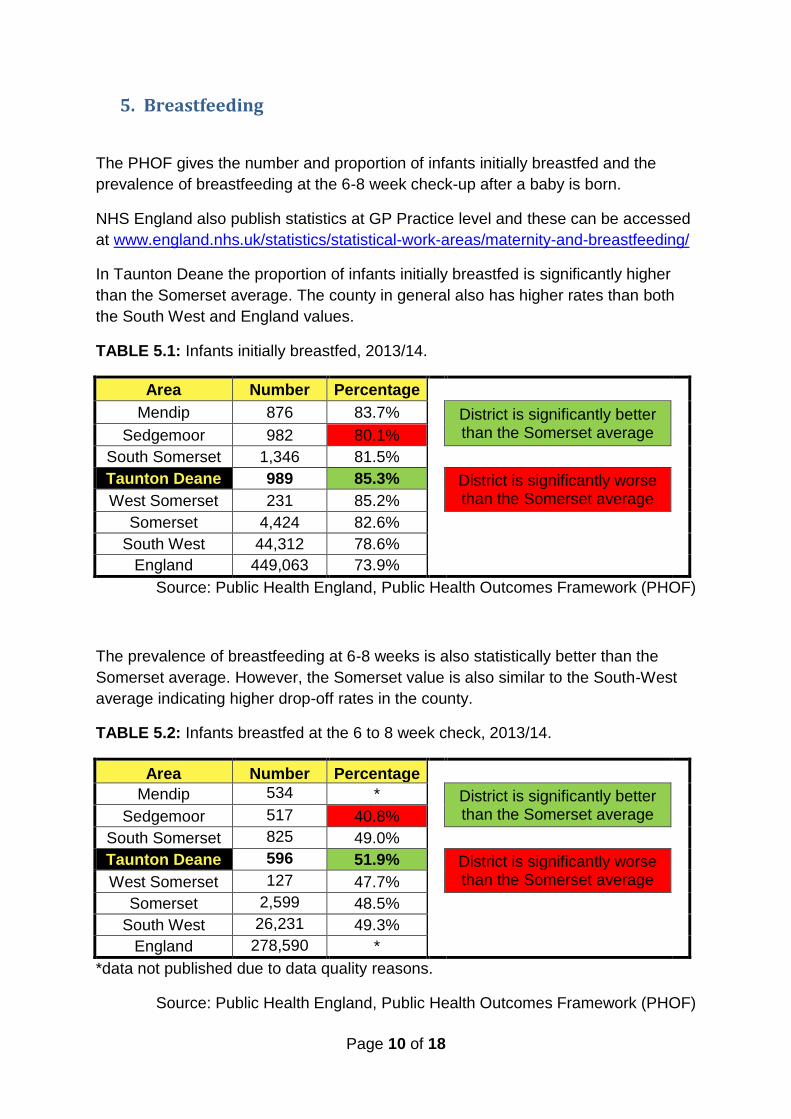
TABLE 5.1: Infants initially breastfed, 2013/14.
Area Number Percentage
Mendip 876 83.7% District is significantly better than the Somerset average
Sedgemoor 982 80.1%
South Somerset 1,346 81.5%
Taunton Deane 989 85.3% District is significantly worse than the Somerset average
West Somerset 231 85.2%
Somerset 4,424 82.6%
South West 44,312 78.6%
England 449,063 73.9%
Source: Public Health England, Public Health Outcomes Framework (PHOF)
The prevalence of breastfeeding at 6-8 weeks is also statistically better than the
Somerset average. However, the Somerset value is also similar to the South-West
average indicating higher drop-off rates in the county.
TABLE 5.2: Infants breastfed at the 6 to 8 week check, 2013/14.
Area Number Percentage
Mendip 534 * District is significantly better than the Somerset average
Sedgemoor 517 40.8%
South Somerset 825 49.0%
Taunton Deane 596 51.9% District is significantly worse than the Somerset average
West Somerset 127 47.7%
Somerset 2,599 48.5%
South West 26,231 49.3%
England 278,590 *
*data not published due to data quality reasons.
Source: Public Health England, Public Health Outcomes Framework (PHOF)
Page 11 of 18
6. Healthy Weight
The health consequences of childhood obesity include: increased blood lipids,
glucose intolerance, type 2 diabetes, hypertension, increases in liver enzymes
associated with fatty liver, exacerbation of conditions such as asthma and
psychological problems like social isolation, low self-esteem, teasing and bullying.5
The National Child Measurement Programme (NCMP) for England records height
and weight measurements of children in Reception (typically aged 4-5 years) and
Year 6 (aged 10-11 years).6
The following maps show the proportion of children measured as obese at Reception
and Year 6 by Middle Layer Super Output Area (MSOA) over the past five years.
See Appendix B: Census Geographies for a description of MSOAs.
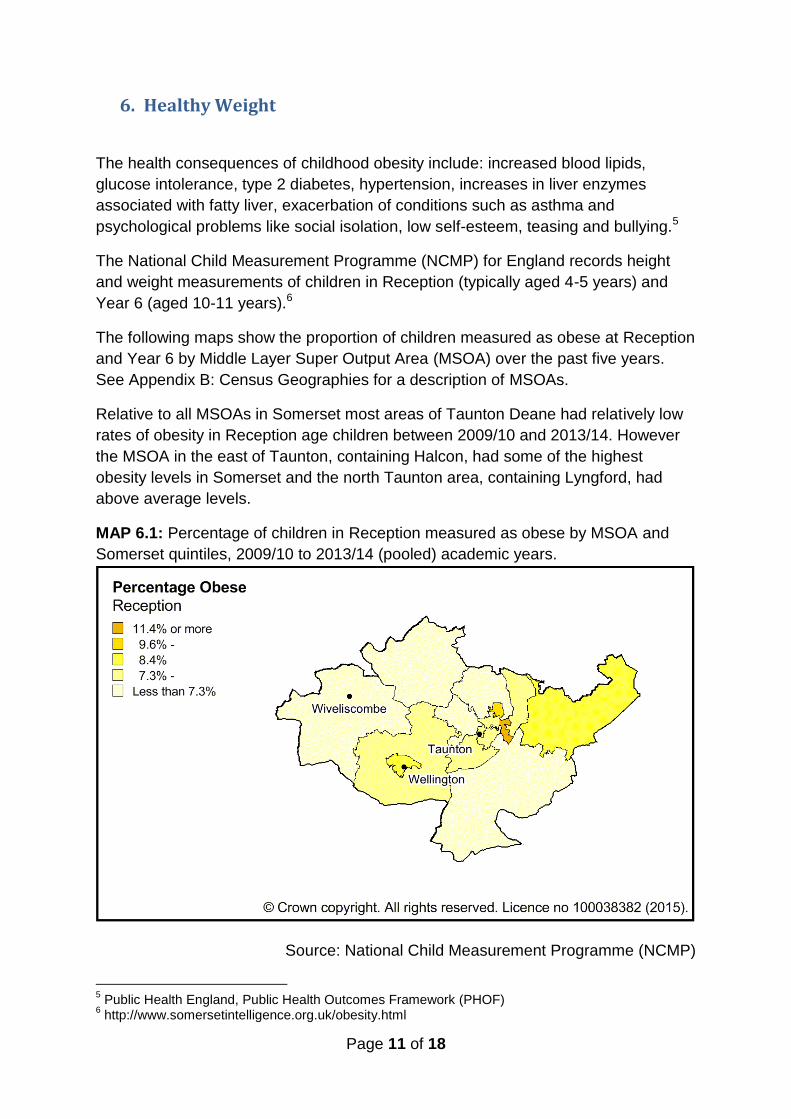
Relative to all MSOAs in Somerset most areas of Taunton Deane had relatively low
rates of obesity in Reception age children between 2009/10 and 2013/14. However
the MSOA in the east of Taunton, containing Halcon, had some of the highest
obesity levels in Somerset and the north Taunton area, containing Lyngford, had
above average levels.
MAP 6.1: Percentage of children in Reception measured as obese by MSOA and
Somerset quintiles, 2009/10 to 2013/14 (pooled) academic years.
Source: National Child Measurement Programme (NCMP)
5 Public Health England, Public Health Outcomes Framework (PHOF)
6 http://www.somersetintelligence.org.uk/obesity.html
Page 12 of 18
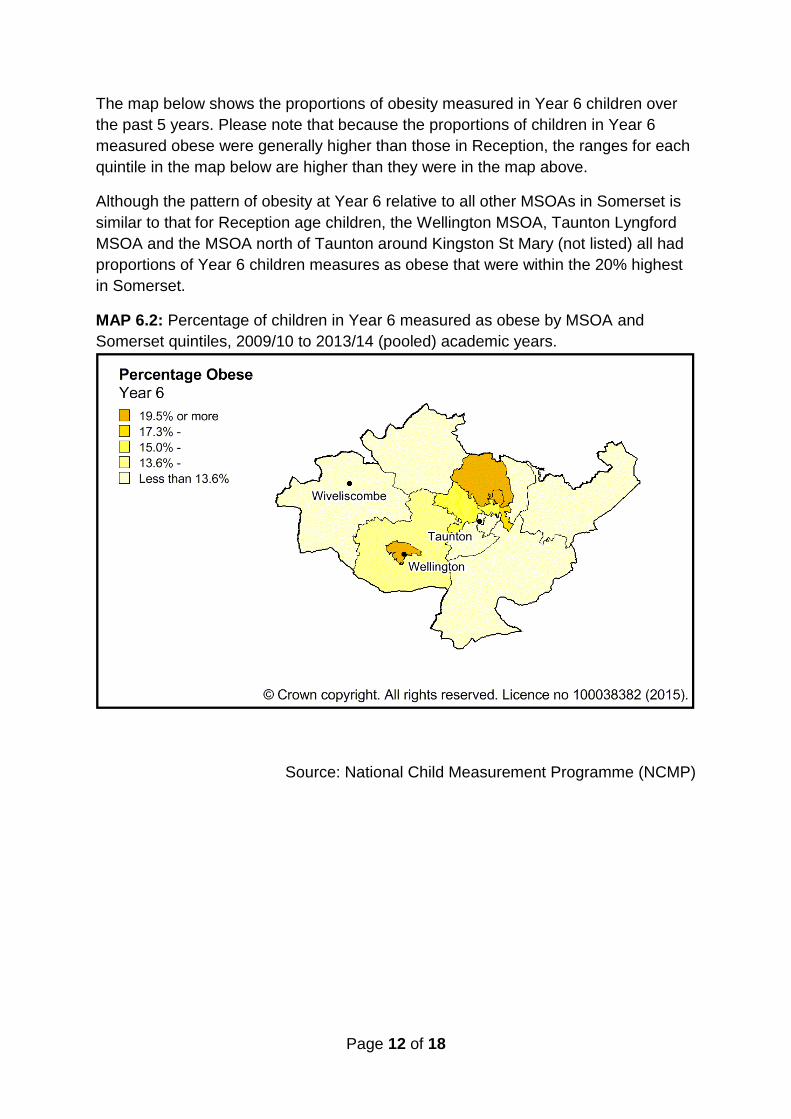
The map below shows the proportions of obesity measured in Year 6 children over
the past 5 years. Please note that because the proportions of children in Year 6
measured obese were generally higher than those in Reception, the ranges for each
quintile in the map below are higher than they were in the map above.
Although the pattern of obesity at Year 6 relative to all other MSOAs in Somerset is
similar to that for Reception age children, the Wellington MSOA, Taunton Lyngford
MSOA and the MSOA north of Taunton around Kingston St Mary (not listed) all had
proportions of Year 6 children measures as obese that were within the 20% highest
in Somerset.
MAP 6.2: Percentage of children in Year 6 measured as obese by MSOA and
Somerset quintiles, 2009/10 to 2013/14 (pooled) academic years.
Source: National Child Measurement Programme (NCMP)
Page 13 of 18
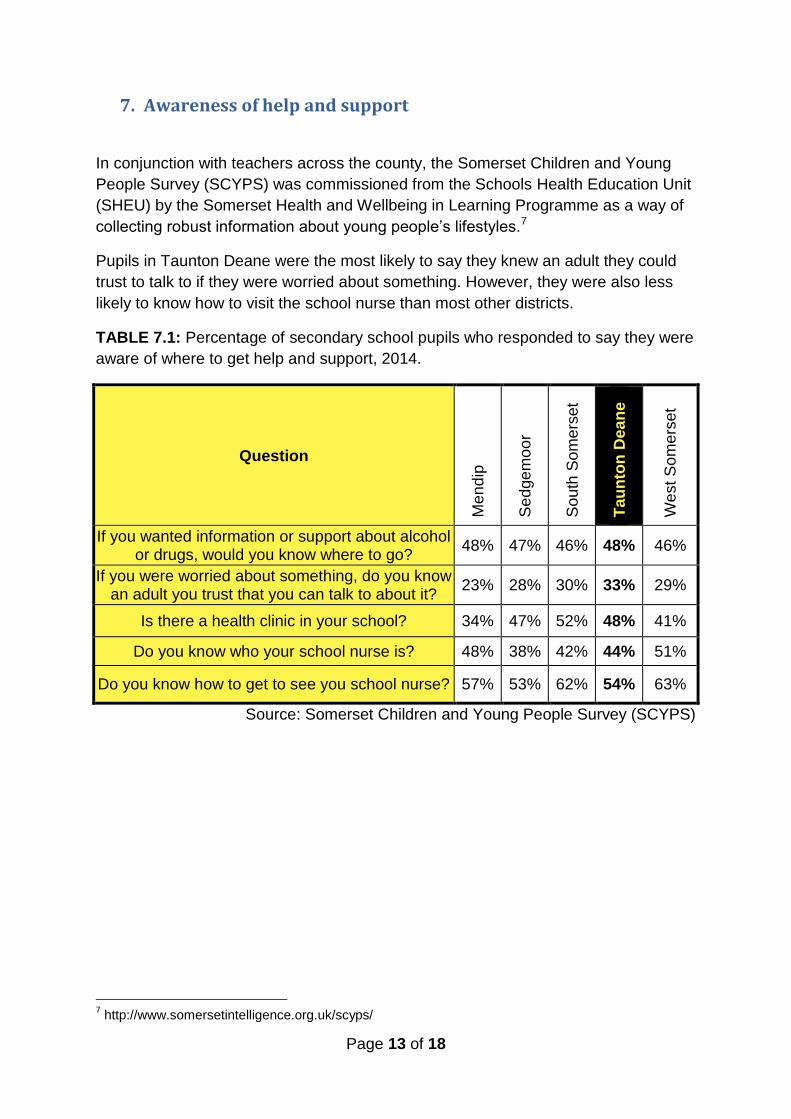
7. Awareness of help and support
In conjunction with teachers across the county, the Somerset Children and Young
People Survey (SCYPS) was commissioned from the Schools Health Education Unit
(SHEU) by the Somerset Health and Wellbeing in Learning Programme as a way of
collecting robust information about young people’s lifestyles.7
Pupils in Taunton Deane were the most likely to say they knew an adult they could
trust to talk to if they were worried about something. However, they were also less
likely to know how to visit the school nurse than most other districts.
TABLE 7.1: Percentage of secondary school pupils who responded to say they were
aware of where to get help and support, 2014.
Question
Me
nd
ip
Se
dge
mo
or
So
uth
So
me
rset
Tau
nto
n D
ea
ne
We
st
So
me
rset
If you wanted information or support about alcohol or drugs, would you know where to go?
48% 47% 46% 48% 46%
If you were worried about something, do you know an adult you trust that you can talk to about it?
23% 28% 30% 33% 29%
Is there a health clinic in your school? 34% 47% 52% 48% 41%
Do you know who your school nurse is? 48% 38% 42% 44% 51%
Do you know how to get to see you school nurse? 57% 53% 62% 54% 63%
Source: Somerset Children and Young People Survey (SCYPS)
7 http://www.somersetintelligence.org.uk/scyps/
Page 14 of 18
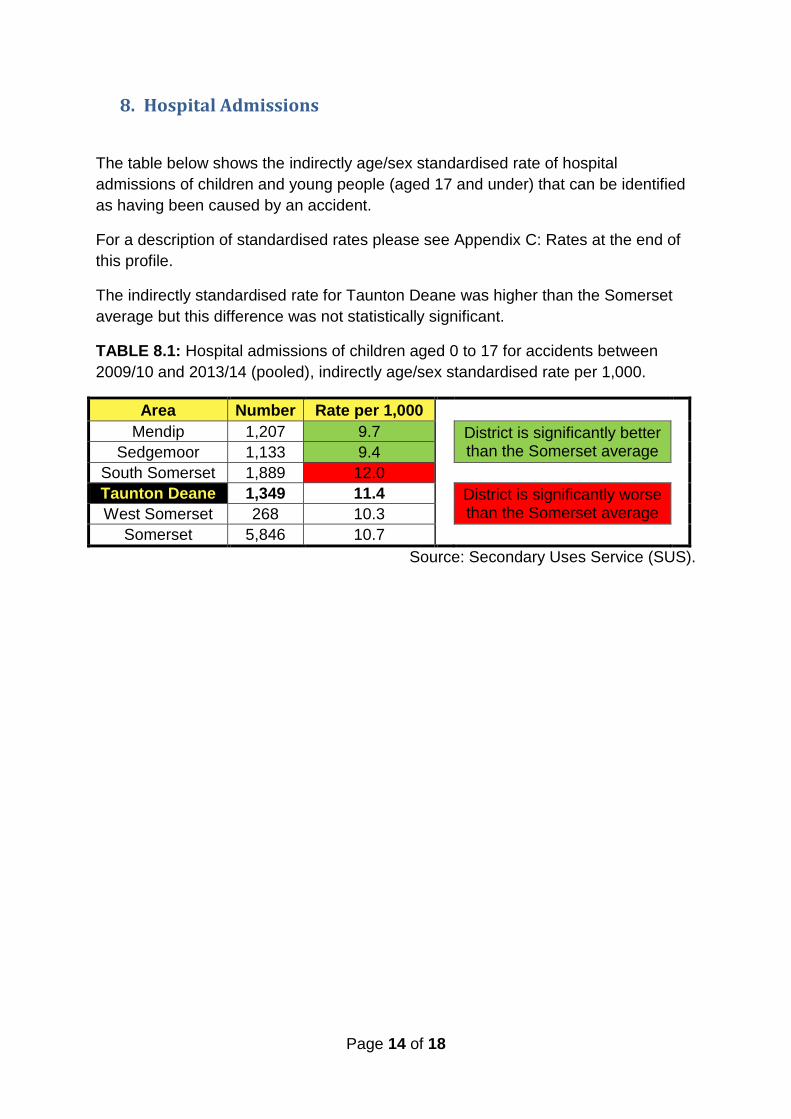
8. Hospital Admissions
The table below shows the indirectly age/sex standardised rate of hospital
admissions of children and young people (aged 17 and under) that can be identified
as having been caused by an accident.
For a description of standardised rates please see Appendix C: Rates at the end of
this profile.
The indirectly standardised rate for Taunton Deane was higher than the Somerset
average but this difference was not statistically significant.
TABLE 8.1: Hospital admissions of children aged 0 to 17 for accidents between
2009/10 and 2013/14 (pooled), indirectly age/sex standardised rate per 1,000.
Area Number Rate per 1,000
Mendip 1,207 9.7
District is significantly better than the Somerset average Sedgemoor 1,133 9.4
South Somerset 1,889 12.0
Taunton Deane 1,349 11.4
District is significantly worse than the Somerset average West Somerset 268 10.3
Somerset 5,846 10.7
Source: Secondary Uses Service (SUS).
Page 15 of 18
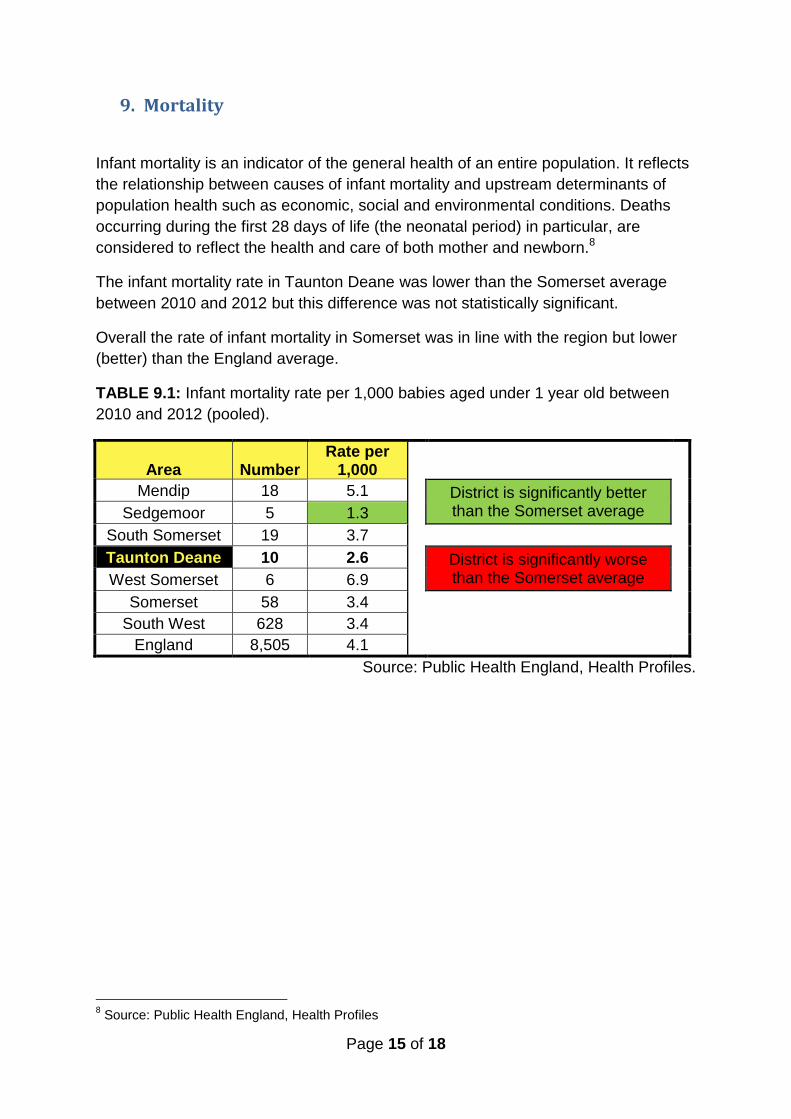
9. Mortality
Infant mortality is an indicator of the general health of an entire population. It reflects
the relationship between causes of infant mortality and upstream determinants of
population health such as economic, social and environmental conditions. Deaths
occurring during the first 28 days of life (the neonatal period) in particular, are
considered to reflect the health and care of both mother and newborn.8
The infant mortality rate in Taunton Deane was lower than the Somerset average
between 2010 and 2012 but this difference was not statistically significant.
Overall the rate of infant mortality in Somerset was in line with the region but lower
(better) than the England average.
TABLE 9.1: Infant mortality rate per 1,000 babies aged under 1 year old between
2010 and 2012 (pooled).
Area Number Rate per
1,000
Mendip 18 5.1 District is significantly better than the Somerset average
Sedgemoor 5 1.3
South Somerset 19 3.7
Taunton Deane 10 2.6 District is significantly worse than the Somerset average
West Somerset 6 6.9
Somerset 58 3.4
South West 628 3.4
England 8,505 4.1
Source: Public Health England, Health Profiles.
8 Source: Public Health England, Health Profiles
Page 16 of 18
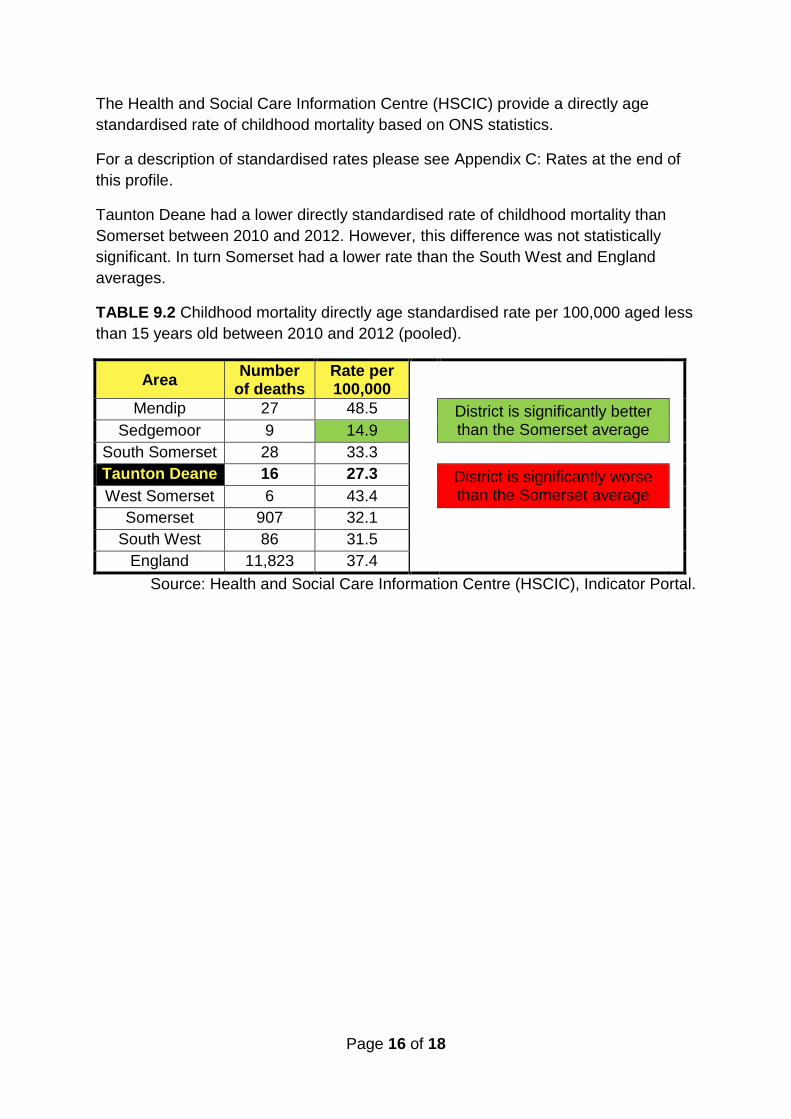
The Health and Social Care Information Centre (HSCIC) provide a directly age
standardised rate of childhood mortality based on ONS statistics.
For a description of standardised rates please see Appendix C: Rates at the end of
this profile.
Taunton Deane had a lower directly standardised rate of childhood mortality than
Somerset between 2010 and 2012. However, this difference was not statistically
significant. In turn Somerset had a lower rate than the South West and England
averages.
TABLE 9.2 Childhood mortality directly age standardised rate per 100,000 aged less
than 15 years old between 2010 and 2012 (pooled).
Area Number
of deaths Rate per 100,000
Mendip 27 48.5 District is significantly better than the Somerset average
Sedgemoor 9 14.9
South Somerset 28 33.3
Taunton Deane 16 27.3 District is significantly worse than the Somerset average
West Somerset 6 43.4
Somerset 907 32.1
South West 86 31.5
England 11,823 37.4
Source: Health and Social Care Information Centre (HSCIC), Indicator Portal.
Page 17 of 18
Appendix A: Deprivation Indicators
Index of Multiple Deprivation (IMD)
The Index of Multiple Deprivation 2010 combines a number of indicators, chosen to
cover a range of economic, social and housing issues, into a single deprivation score
for each small area in England. This allows each area to be ranked relative to one
another according to their level of deprivation.
The IMD (2010) was made up of seven domains: Income Deprivation Domain,
Employment Deprivation Domain, Health Deprivation and Disability Domain,
Education, Skills and Training Deprivation Domain, Barriers to Housing and Services
Domain, Crime Domain, Living Environment Deprivation Domain.
Income Deprivation Affecting Children Index (IDACI)
The IDACI is a supplementary index of the IMD. The IDACI is the percentage of
children aged 0 - 15 in each lower super output area (LSOA) living in families that
are income deprived – that is in receipt of income support, income based jobseeker's
allowance or pension credit, or those not in receipt of these benefits but in receipt of
Child Tax Credit with an equivalised income (excluding housing benefits) below 60%
of the national median before housing costs.9
Appendix B: Census Geographies
Lower Layer Super Output Area (LSOA) and Middle Layer Super Output Area
(MSOA)
The Office of National Statistics (ONS) created LSOAs for the 2001 census and they
were revised for the 2011 census. They are small, relatively homogeneous areas
that usually contain around 1,500 people. There are 327 LSOAs in Somerset.
MSOAs are similar to LSOAs however they are larger, containing around 7,500
people and there are 71 MSOAs in Somerset.
Appendix C: Rates
Crude Rates
A crude rate is the number of events divided by the population.
9 LG Inform
Page 18 of 18
Standardised Rates
Rates of disease, death or admissions to hospital (events) usually increase with age
and often different between the genders. This means that if you are looking at the
number of events per 1000 people a population with more elderly people would have
higher values just because of the population structure. Standardisation is a way of
comparing results in populations to allow for any differences in population structure.
There are two main methods of standardisation: indirect and direct.
Indirectly Standardised Rates
The description that follows is for admissions to hospital in a district in Somerset.
Age/sex specific rates in Somerset (the Standard population) are applied to the
population of the district to work out what the expected number of admissions would
be if the rates were identical across the whole county. The observed number of
admissions is expressed as a percentage of the expected number to give the
standardised ratio. A value less than 100% means that the district has fewer
admissions than expected and hence has a lower standardised rate than Somerset
and a value of more than 100% that the area has more admissions than expected
and a higher standardised rate than Somerset. This standardised ratio is multiplied
by the overall crude rate in Somerset to give the indirectly age/sex standardised rate
in the district.
Indirect standardisation is usually used when numbers of events are small or the
age/sex breakdown of events is unknown in the area being considered but the total
number is known. The Standard population can be the sum of the areas being
compared (for example, Somerset is the sum of the five districts). Standardised rates
for areas can be compared but only if they are calculated using the same Standard.
Directly Standardised Rates
The description that follows is for deaths in a district.
A directly age-standardised rate is calculated by working out the crude death rate for
each age group in the district. These rates are then applied to the European
Standard Population (ESP) (the Standard population) and summed across the
age/sex groups to give the crude rate that would be observed in the ESP if the
district’s death rates applied.
Direct standardisation is used for larger numbers and is used for national and
international comparisons. One drawback is that the ESP does not necessarily
reflect the true population distribution of an area and the resulting standardised rate
may not be at all close to the crude rate. For example the ESP has more children
and fewer older people than the Somerset population and so rates standardised to
the ESP will, in general, be much lower than the crude rates.
Recommended