1
Sinus node
Atria
AV node
Bundle of His
Bundle branches
Ventricles
Purkinje bers
RA
LA
RV LV
Sinus node
Intraatrialpathways
AV node
Bundle of His
Rightbundle
Left bundle
Leftanteriorfascicle
Leftposteriorfascicle
Purkinje bers
Septal (median) branch
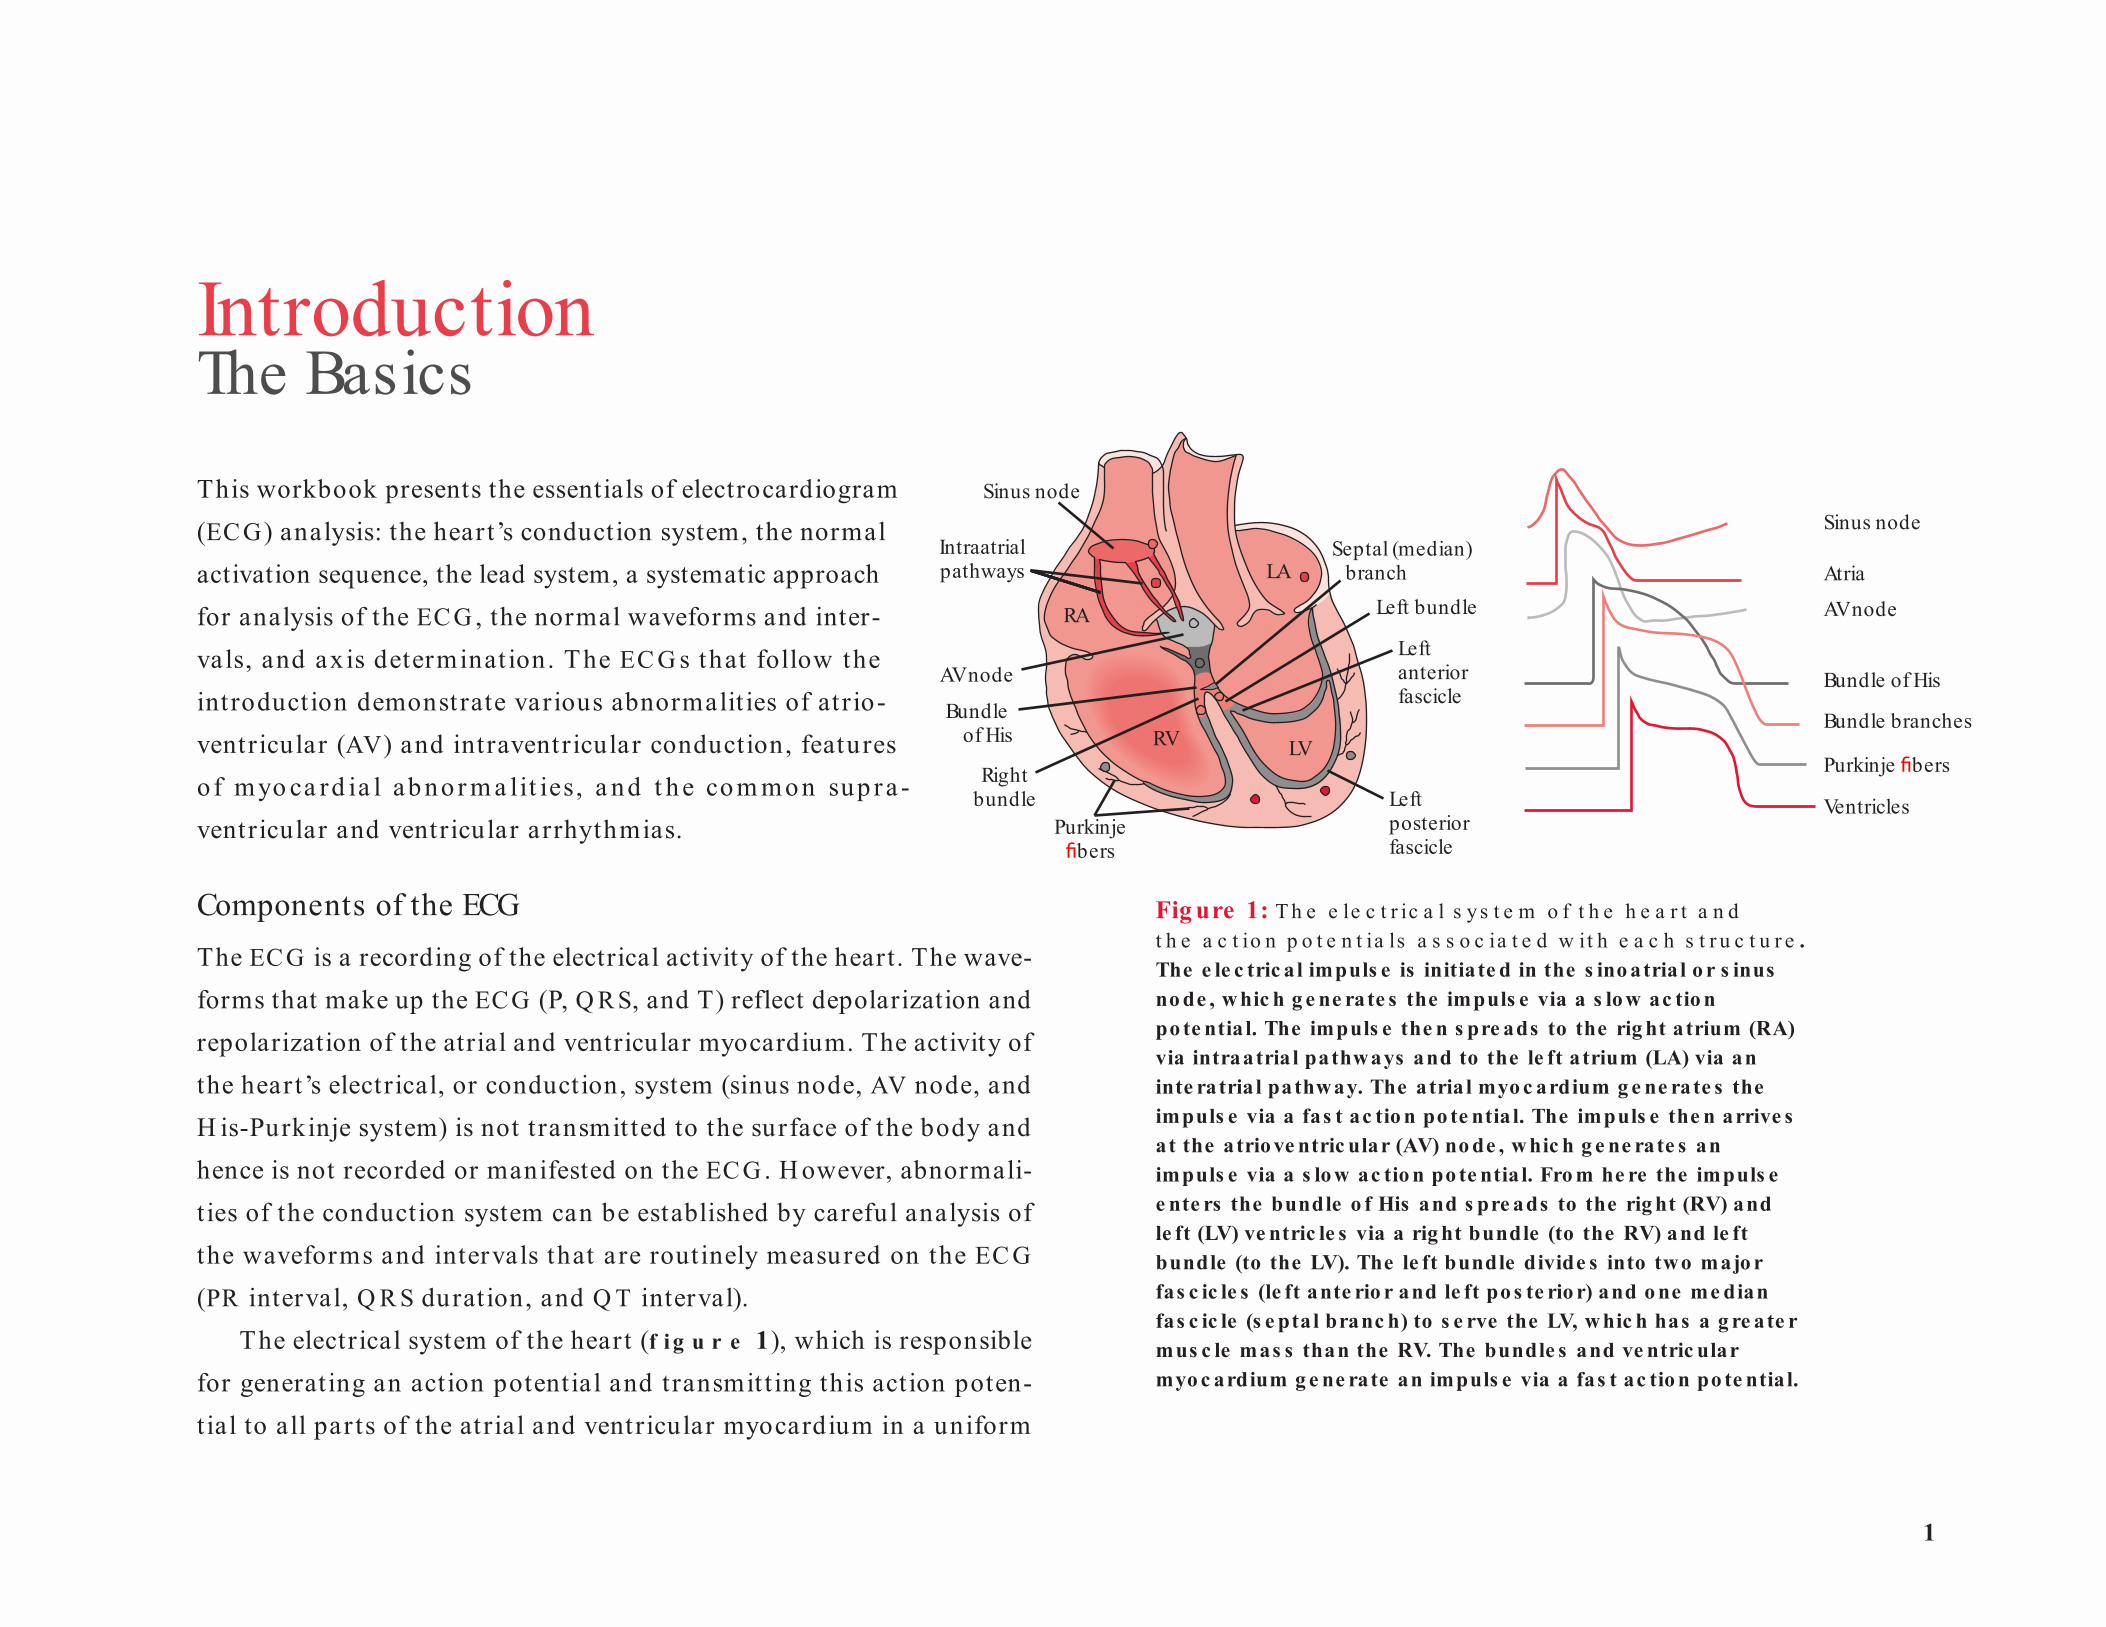
Fig ure 1: T h e e le c t r ic a l s y s t e m o f t h e h e a r t a n d t h e a c t io n p o t e n t ia ls a s s o c ia t e d w it h e a c h s t r u c t u r e . The e le c tric a l impuls e is initia te d in the s ino atria l o r s inus no de , w hic h g e ne rate s the impuls e via a s lo w ac tio n po te ntia l. The impuls e the n s pre ads to the rig ht a trium (RA) via intraatria l pathways and to the le ft a trium (LA) via an inte ratria l pathway. The atria l myo c ardium g e ne rate s the impuls e via a fas t ac tio n po te ntia l. The impuls e the n arrive s a t the atrio ve ntric ular (AV) no de , w hic h g e ne rate s an impuls e via a s lo w ac tio n po te ntia l. Fro m he re the impuls e e nte rs the bundle o f His and s pre ads to the rig ht (RV) and le ft (LV) ve ntric le s via a rig ht bundle (to the RV) and le ft bundle (to the LV). The le ft bundle divide s into two majo r fas c ic le s (le ft ante rio r and le ft po s te rio r) and o ne me dian fas c ic le (s e ptal branc h) to s e rve the LV, w hic h has a g re ate r mus c le mas s than the RV. The bundle s and ve ntric ular myo c ardium g e ne rate an impuls e via a fas t ac tio n po te ntia l.
Introduction The BasicsThis workbook presents the essentials of electrocardiogram (ECG) analysis: the heart’s conduction system, the normal activation sequence, the lead system, a systematic approach for analysis of the ECG , the normal waveforms and inter-vals, and ax is determinat ion. The EC G s that follow the introduction demonstrate various abnormalit ies of atr io-ventricular (AV) and intraventricular conduction, features o f myo ca rd ia l abno r m a lit ies, a nd t he com mon sup ra -ventricular and ventricular arrhythmias.
Components of the ECGThe ECG is a recording of the electrical activity of the heart. The wave-forms that make up the ECG (P, Q R S, and T) reflect depolarization and repolarization of the atrial and ventricular myocardium. The activity of the hear t’s electrical, or conduction, system (sinus node, AV node, and H is-Purkinje system) is not transmit ted to the surface of the body and hence is not recorded or manifested on the ECG . H owever, abnormali-t ies of the conduction system can be established by careful analysis of the waveforms and intervals that are routinely measured on the EC G (PR interval, Q R S duration, and Q T interval).
The electrical system of the heart (f i g u r e 1), which is responsible for generating an action potential and transmit t ing this action poten-tial to all par ts of the atrial and ventricular myocardium in a uniform
2
Podrid’s Real-World ECGs
AV node
Sinusnode
Atrialdepolarization
Apicaldepolarization
Left ventriculardepolarization
Septaldepolarization
–––
––
– –
–
–––
––
++
++
++++
++
++
+
–––
–
––– –
––
––
––
–
–––
+++
+++
+
++
+
+++++
+
+
+
Delay atAV node
P P
PRsegment
P P
Q Q
R
R
P
Q
– +– +
– +– +
––
––
––
––
––
––
– ––
– ––
–
––
–
+
++
++
+++
++
+
++
+
+
+
++
+
+
+++
++
+
+
+
++ +
––
–––
–
––
–– +– +
– +
– +–+
–+
–– ++
–+
–+
–+–+
–+– +
– +– +–
+
Ventriclesdepolarized
Ventriclesrepolarized
Late left ventriculardepolarization
Ventricularrepolarization
Q
R
P
Q
R
P ST segment
Q
R
P T
R
P T
Q
and simultaneous fash ion, includes the sinus or sinoat r ia l node (the dominant pacemaker of the heart as it generates an impulse with higher frequency than any other t issue), conduct ion pathways th rough the right and left atria, the AV node or junction, the bundle of H is, the right bundle (which innervates the r ight vent r icle), the left bundle (which innervates the left ventricle), and the Purkinje fibers (which bring the
impulse to the individual myocardial cells). Since the muscle mass of the left ventricle is large, the left bundle splits into two major fascicles and one minor fascicle that result in simultaneous act ivat ion of the entire left vent r icu la r myocard ium. These fascicles include a minor septa l branch or median fascicle (innervating the interventricular septum) and two major fascicles (the left anterior fascicle and left posterior fascicle).
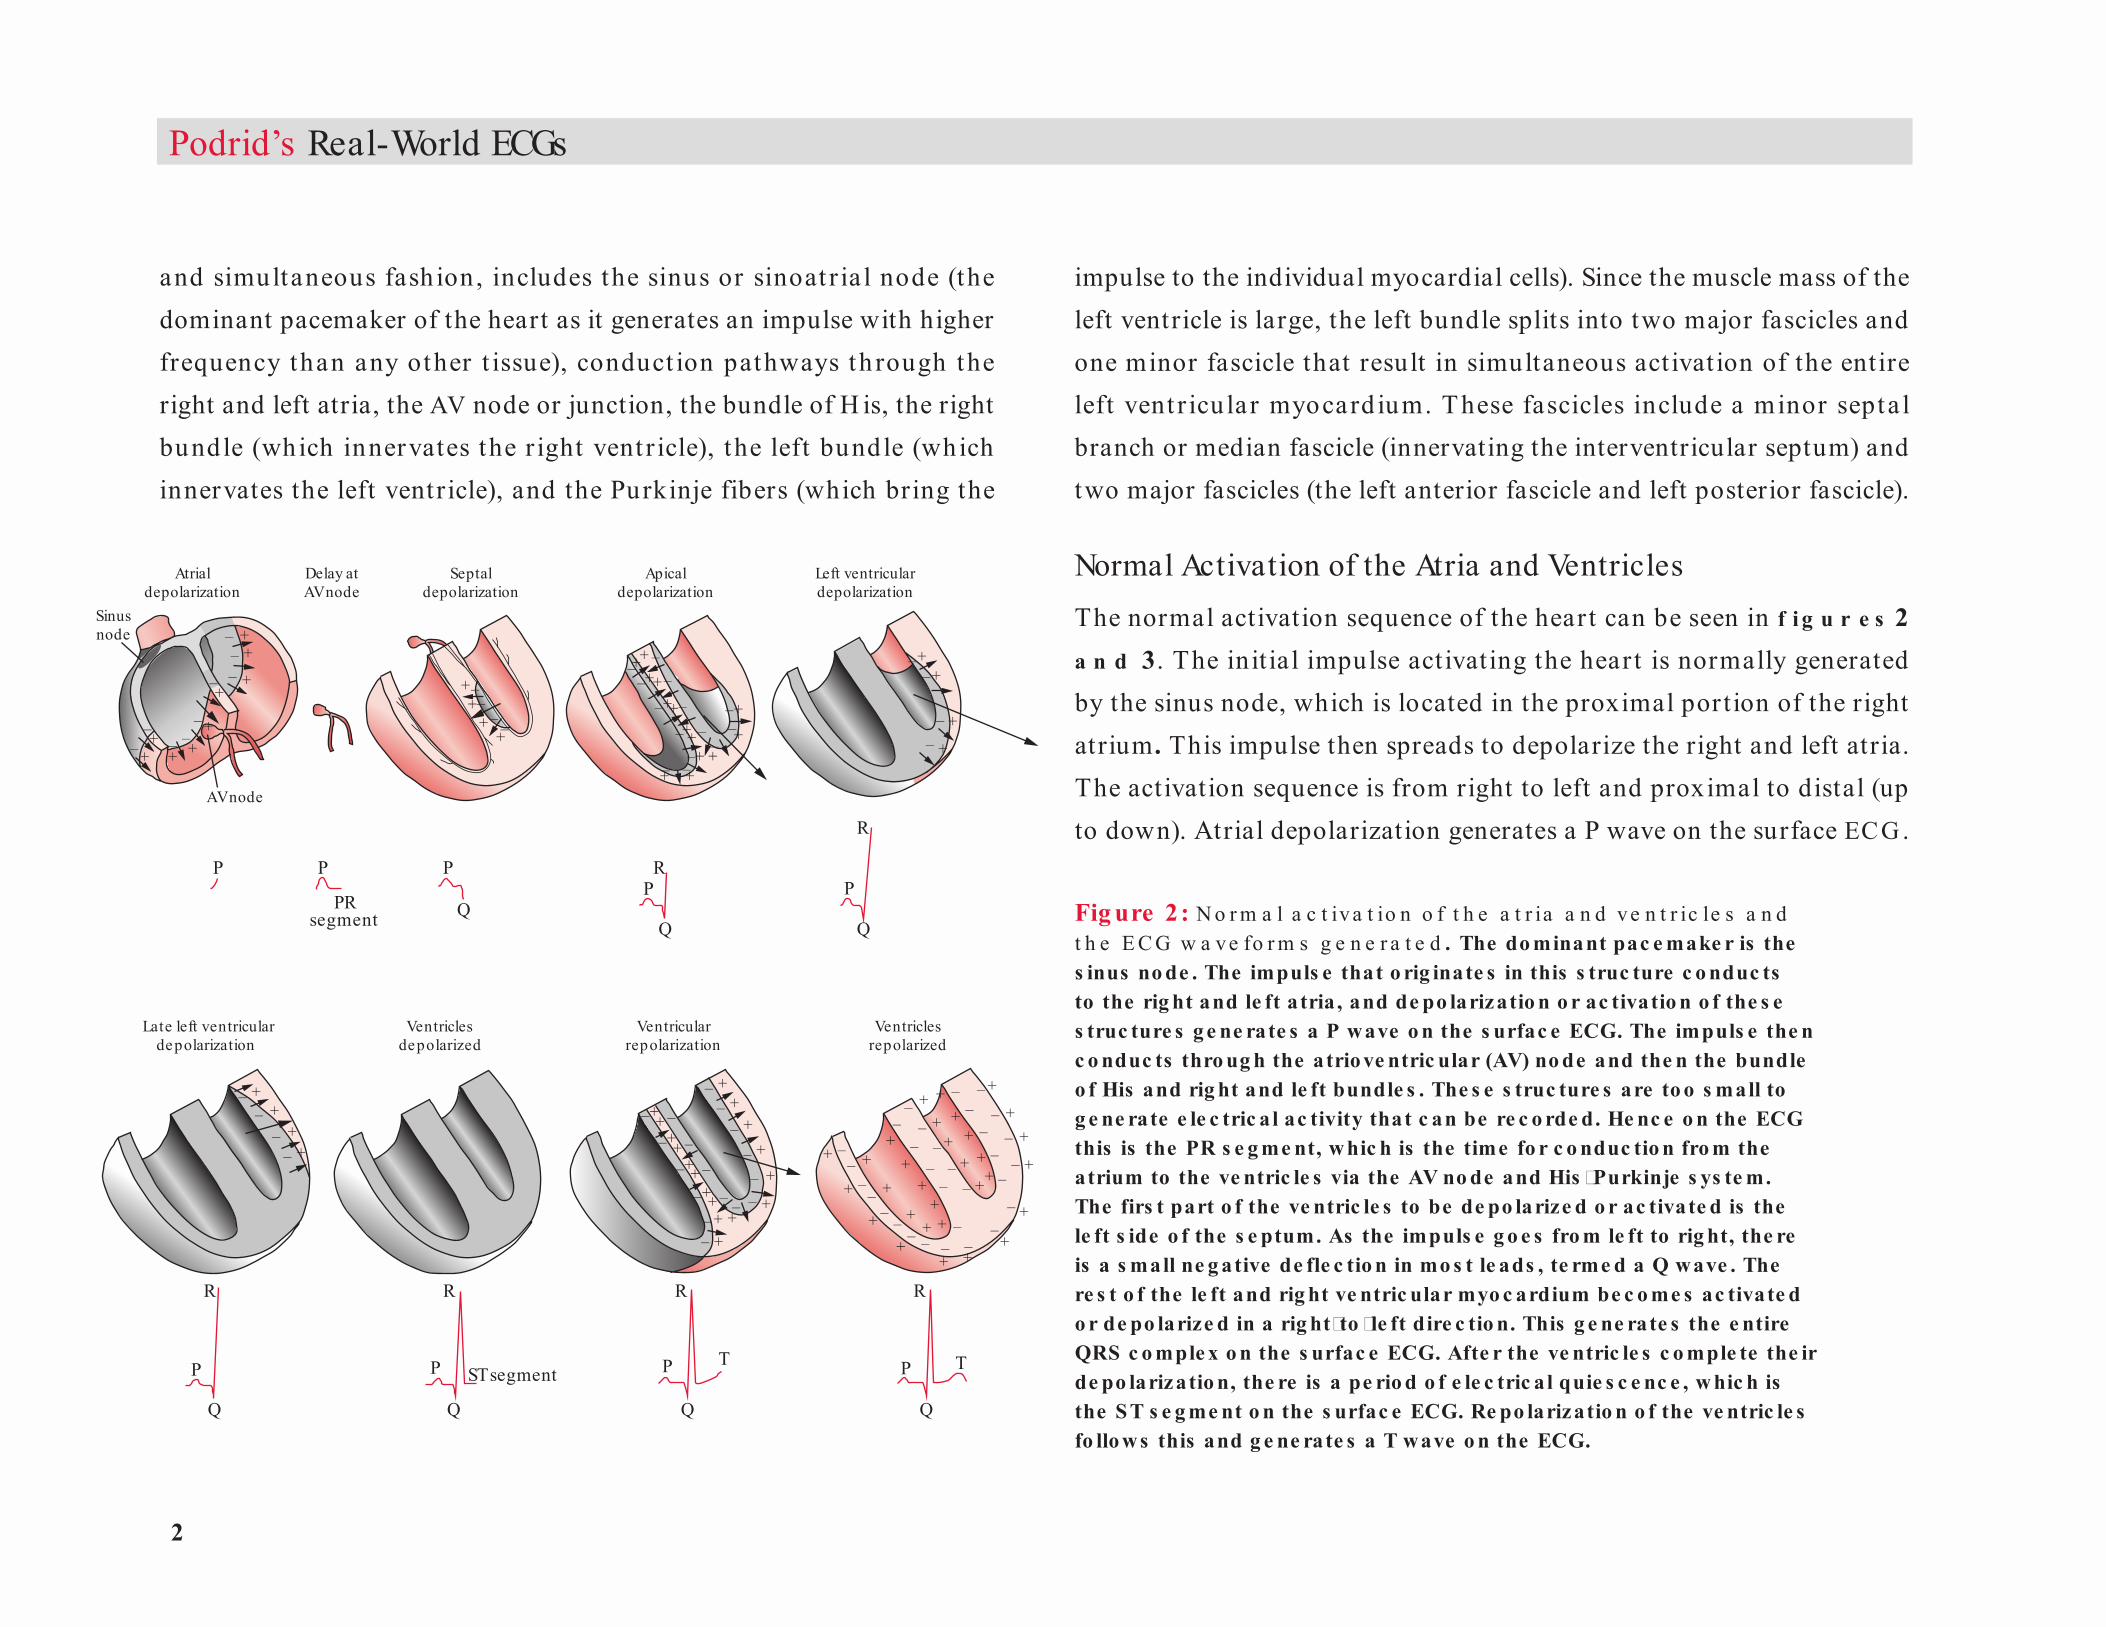
Normal Activation of the Atria and VentriclesThe normal activation sequence of the heart can be seen in f i g u r e s 2 a n d 3. The initial impulse activating the hear t is normally generated by the sinus node, which is located in the proximal portion of the right atrium . This impulse then spreads to depolarize the right and left atria. The activation sequence is from right to left and proximal to distal (up to down). Atrial depolarization generates a P wave on the surface ECG.
Fig ure 2 : N o r m a l a c t iva t io n o f t h e a t r ia a n d ve n t r ic le s a n d t h e E C G w a ve fo r m s g e n e r a t e d . The do minant pac e make r is the s inus no de . The impuls e that o rig inate s in this s truc ture c o nduc ts to the rig ht and le ft a tria , and de po larizatio n o r ac tivatio n o f the s e s truc ture s g e ne rate s a P wave o n the s urfac e ECG. The impuls e the n c o nduc ts thro ug h the atrio ve ntric ular (AV) no de and the n the bundle o f His and rig ht and le ft bundle s . The s e s truc ture s are to o s mall to g e ne rate e le c tric a l ac tivity that c an be re c o rde d. He nc e o n the ECG this is the PR s e g me nt, w hic h is the time fo r c o nduc tio n fro m the atrium to the ve ntric le s via the AV no de and His �Purkinje s ys te m. The firs t part o f the ve ntric le s to be de po larize d o r ac tivate d is the le ft s ide o f the s e ptum. As the impuls e g o e s fro m le ft to rig ht, the re is a s mall ne g ative de fle c tio n in mo s t le ads , te rme d a Q wave . The re s t o f the le ft and rig ht ve ntric ular myo c ardium be c o me s ac tivate d o r de po larize d in a rig ht�to �le ft dire c tio n. This g e ne rate s the e ntire QRS c o mple x o n the s urfac e ECG. Afte r the ve ntric le s c o mple te the ir de po larizatio n, the re is a pe rio d o f e le c tric a l quie s c e nc e , w hic h is the S T s e g me nt o n the s urfac e ECG. Re po larizatio n o f the ve ntric le s fo llo ws this and g e ne rate s a T wave o n the ECG.
3
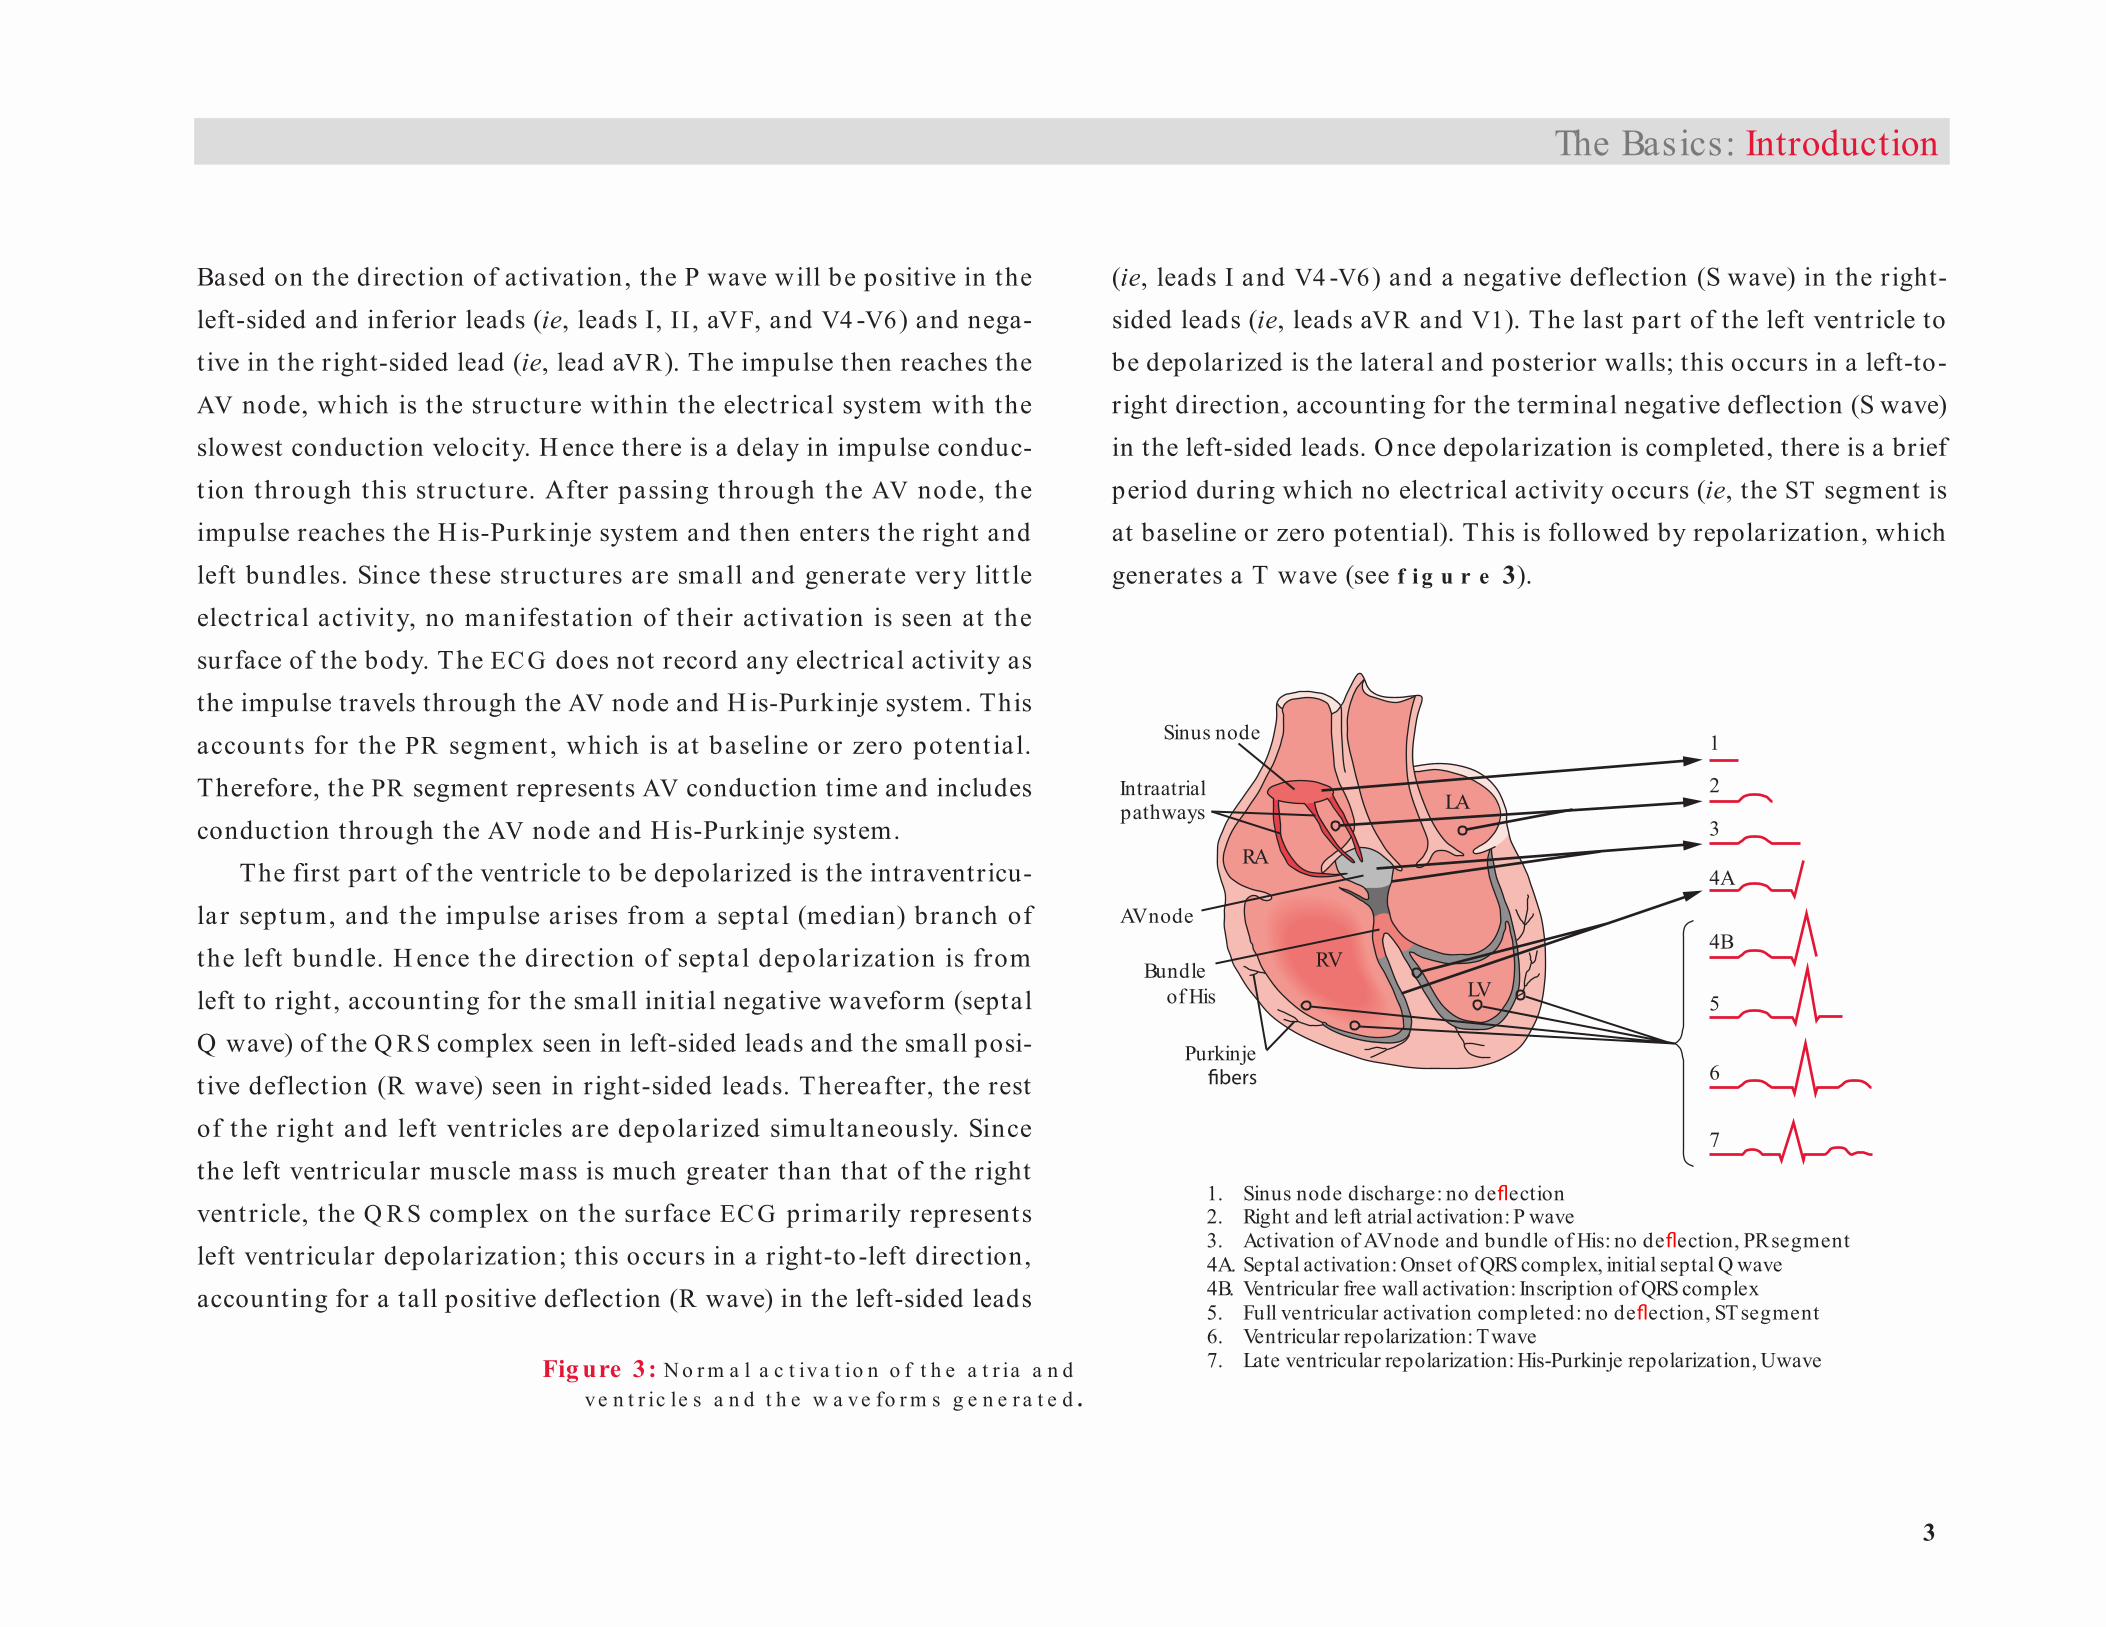
2. Right and left atrial activation: P wave3. Activation of AV node and bundle of His: no de ection, PR segment
5. Full ventricular activation completed: no de ection, ST segment
1. Sinus node discharge: no de ection
4A. Septal activation: Onset of QRS complex, initial septal Q wave4B. Ventricular free wall activation: Inscription of QRS complex
6. Ventricular repolarization: T wave7. Late ventricular repolarization: His-Purkinje repolarization, U wave
Sinus node
Intraatrialpathways
RA
LA
RVLV
AV node
Bundle of His
1
2
3
4A
4B
5
6
7
Purkinje
Based on the direction of activation, the P wave will be posit ive in the left-sided and inferior leads (ie, leads I, II , aVF, and V4 -V6) and nega-tive in the right-sided lead (ie, lead aVR). The impulse then reaches the AV node, which is the st ructure within the electrical system with the slowest conduction velocity. H ence there is a delay in impulse conduc-t ion through th is st ructu re. After passing th rough the AV node, the impulse reaches the H is-Purkinje system and then enters the right and left bundles. Since these st ructures are small and generate very lit t le elect r ical act ivity, no manifestat ion of their act ivat ion is seen at the surface of the body. The ECG does not record any electrical activity as the impulse travels through the AV node and H is-Purkinje system. This accounts for the PR segment , which is at baseline or zero potent ia l. Therefore, the PR segment represents AV conduction time and includes conduction through the AV node and H is-Purkinje system.
The first part of the ventricle to be depolarized is the intraventricu-lar septum, and the impulse ar ises from a septal (median) branch of the left bundle. H ence the d irect ion of septal depolar izat ion is from left to right, accounting for the small init ial negative waveform (septal Q wave) of the Q R S complex seen in left-sided leads and the small posi-t ive deflect ion (R wave) seen in r ight-sided leads. Thereafter, the rest of the r ight and left vent r icles are depolar ized simultaneously. Since the left ventricular muscle mass is much greater than that of the right ventr icle, the Q R S complex on the surface EC G primarily represents left ventricular depolarization; this occurs in a r ight-to-left direction, accounting for a tall positive deflection (R wave) in the left-sided leads
(ie, leads I and V4 -V6) and a negative deflection (S wave) in the r ight-sided leads (ie, leads aVR and V1). The last par t of the left ventricle to be depolarized is the lateral and posterior walls; this occurs in a left-to-right direction, accounting for the terminal negative deflection (S wave) in the left-sided leads. O nce depolarization is completed, there is a brief period during which no electrical activity occurs (ie, the ST segment is at baseline or zero potential). This is followed by repolarization, which generates a T wave (see f i g u r e 3).
The Basics: Introduction
Fig ure 3: N o r m a l a c t iva t io n o f t h e a t r ia a n dve n t r ic le s a n d t h e w a ve fo r m s g e n e r a t e d .

4
Podrid’s Real-World ECGs
Frequently seen following the T wave is a U wave, which is believed to represent late repolarization of the H is-Purkinje system. Some believe that the U wave may represent late repolarization of the papillary mus-cles. This is a low-amplitude posit ive waveform after the T wave, best seen in the right precordial leads (ie, leads V1-V3).
Lead SystemThe standa rd EC G includes 12 leads: six limb leads (record ing the electrical current in the frontal plane) and six precordial or chest leads (recording the electrical current in the horizontal plane).
The six limb leads include the following (f i g u r e s 4 a n d 5):
• Lead I is a bipolar lead that records the impulse as it travels from right arm to left arm. Impulses going toward the left produce a positive waveform in this lead; impulses going toward the right produce a negative waveform. Therefore, in normal situations the P wave (due to atrial activation that goes from right to left) is positive in this lead. The Q R S complex, which is due to impulse conduction in a right-to-left direction, is also positive, and there may be a small septal Q wave (representing septal depolarization that occurs in a left-to-right direction) before the tall positive waveform, or R wave, representing left ventricular depolarization.
• Lead II is a bipolar lead that records the impulse as it travels from the right arm to the left foot. Impulses going toward the foot generate a positive waveform in this lead; a negative waveform is generated if the impulse is directed away from the foot toward the right arm. Therefore, in normal situations the
Lead III
–
+Lead II
–
+
Lead I
– +
Fig ure 4: Le a d s I , II , a n d III a r e b ip o la r le a d s . In le ad I an impuls e that trave ls to ward the le ft arm g e ne rate s a po s itive wave fo rm, and an impuls e that trave ls toward the rig ht arm g e ne rate s a ne g ative wave fo rm. In le ads II and III, an impuls e that trave ls to ward the fo o t g e ne rate s a po s itive wave fo rm and an impuls e that g o e s away fro m the fo o t to ward the arms g e ne rate s a ne g ative wave fo rm.
I
IIIII
Foot
Right arm
Left arm
5
aVR
aVL
aVF
Foot
Right arm
Left arm
Lead aVF
+Lead aVLLead aVR
+ +
– – –
P wave (representing atrial activation that occurs in a proximal-to-distal direction) is positive in this lead. The Q RS complex (representing ventricular depolarization that occurs from proximal to distal) is also positive, and there may be a small septal Q wave before the tall positive waveform, or R wave, representing left ventricular depolarization.
• Lead III is a bipolar lead that records the impulse as it travels from the left arm to the left foot. Impulses going toward the foot generate a positive waveform in this lead; a negative waveform is generated if the impulse is directed away from the foot toward the left arm. Based on the angle of lead III in relation to the heart, the waveforms may be positive or negative depending on small changes in the direction of electrical activation. H ence lead III is an indeterminate lead and should not be evaluated by itself.
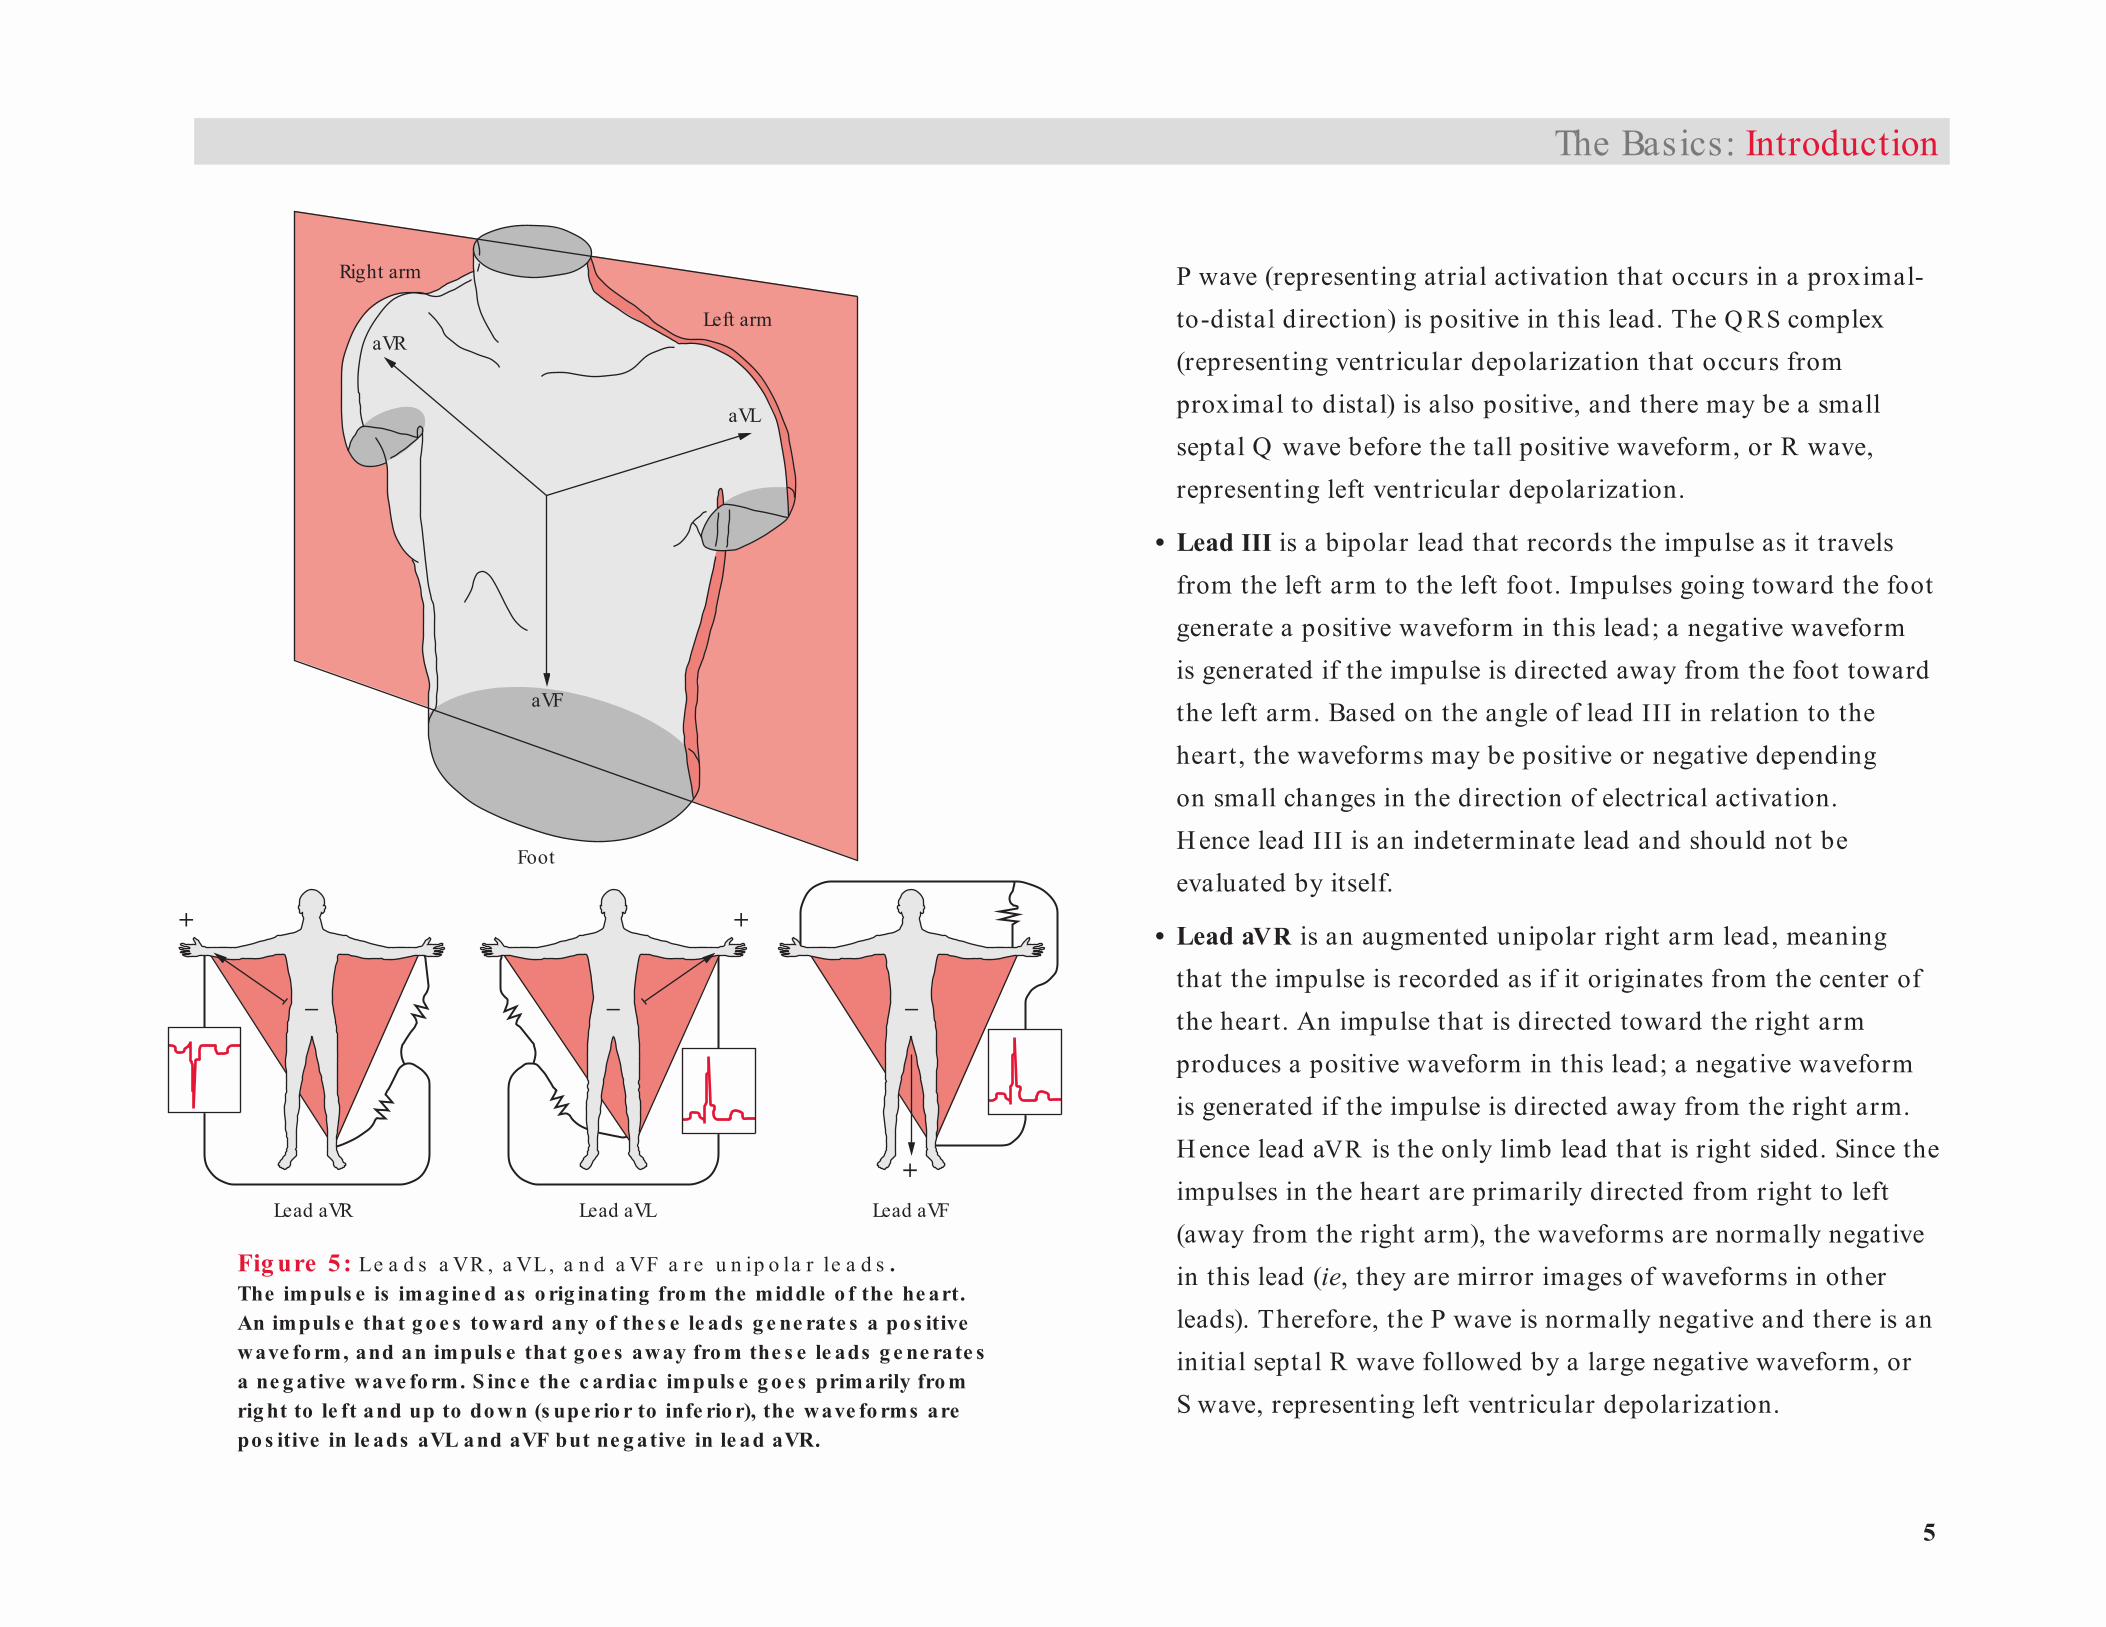
• Lead aVR is an augmented unipolar right arm lead, meaning that the impulse is recorded as if it originates from the center of the heart. An impulse that is directed toward the right arm produces a positive waveform in this lead; a negative waveform is generated if the impulse is directed away from the right arm. H ence lead aVR is the only limb lead that is right sided. Since the impulses in the heart are primarily directed from right to left (away from the right arm), the waveforms are normally negative in this lead (ie, they are mirror images of waveforms in other leads). Therefore, the P wave is normally negative and there is an initial septal R wave followed by a large negative waveform, or S wave, representing left ventricular depolarization.
The Basics: Introduction
Fig ure 5: Le a d s a VR , a VL, a n d a VF a r e u n ip o la r le a d s . The impuls e is imag ine d as o rig inating fro m the middle o f the he art. An impuls e that g o e s to ward any o f the s e le ads g e ne rate s a po s itive wave fo rm, and an impuls e that g o e s away fro m the s e le ads g e ne rate s a ne g ative wave fo rm. S inc e the c ardiac impuls e g o e s primarily fro m rig ht to le ft and up to do w n (s upe rio r to infe rio r), the wave fo rms are po s itive in le ads aVL and aVF but ne g ative in le ad aVR.
6
Podrid’s Real-World ECGs
1
34 5 6
V1 V2V3 V4 V5
2 V6
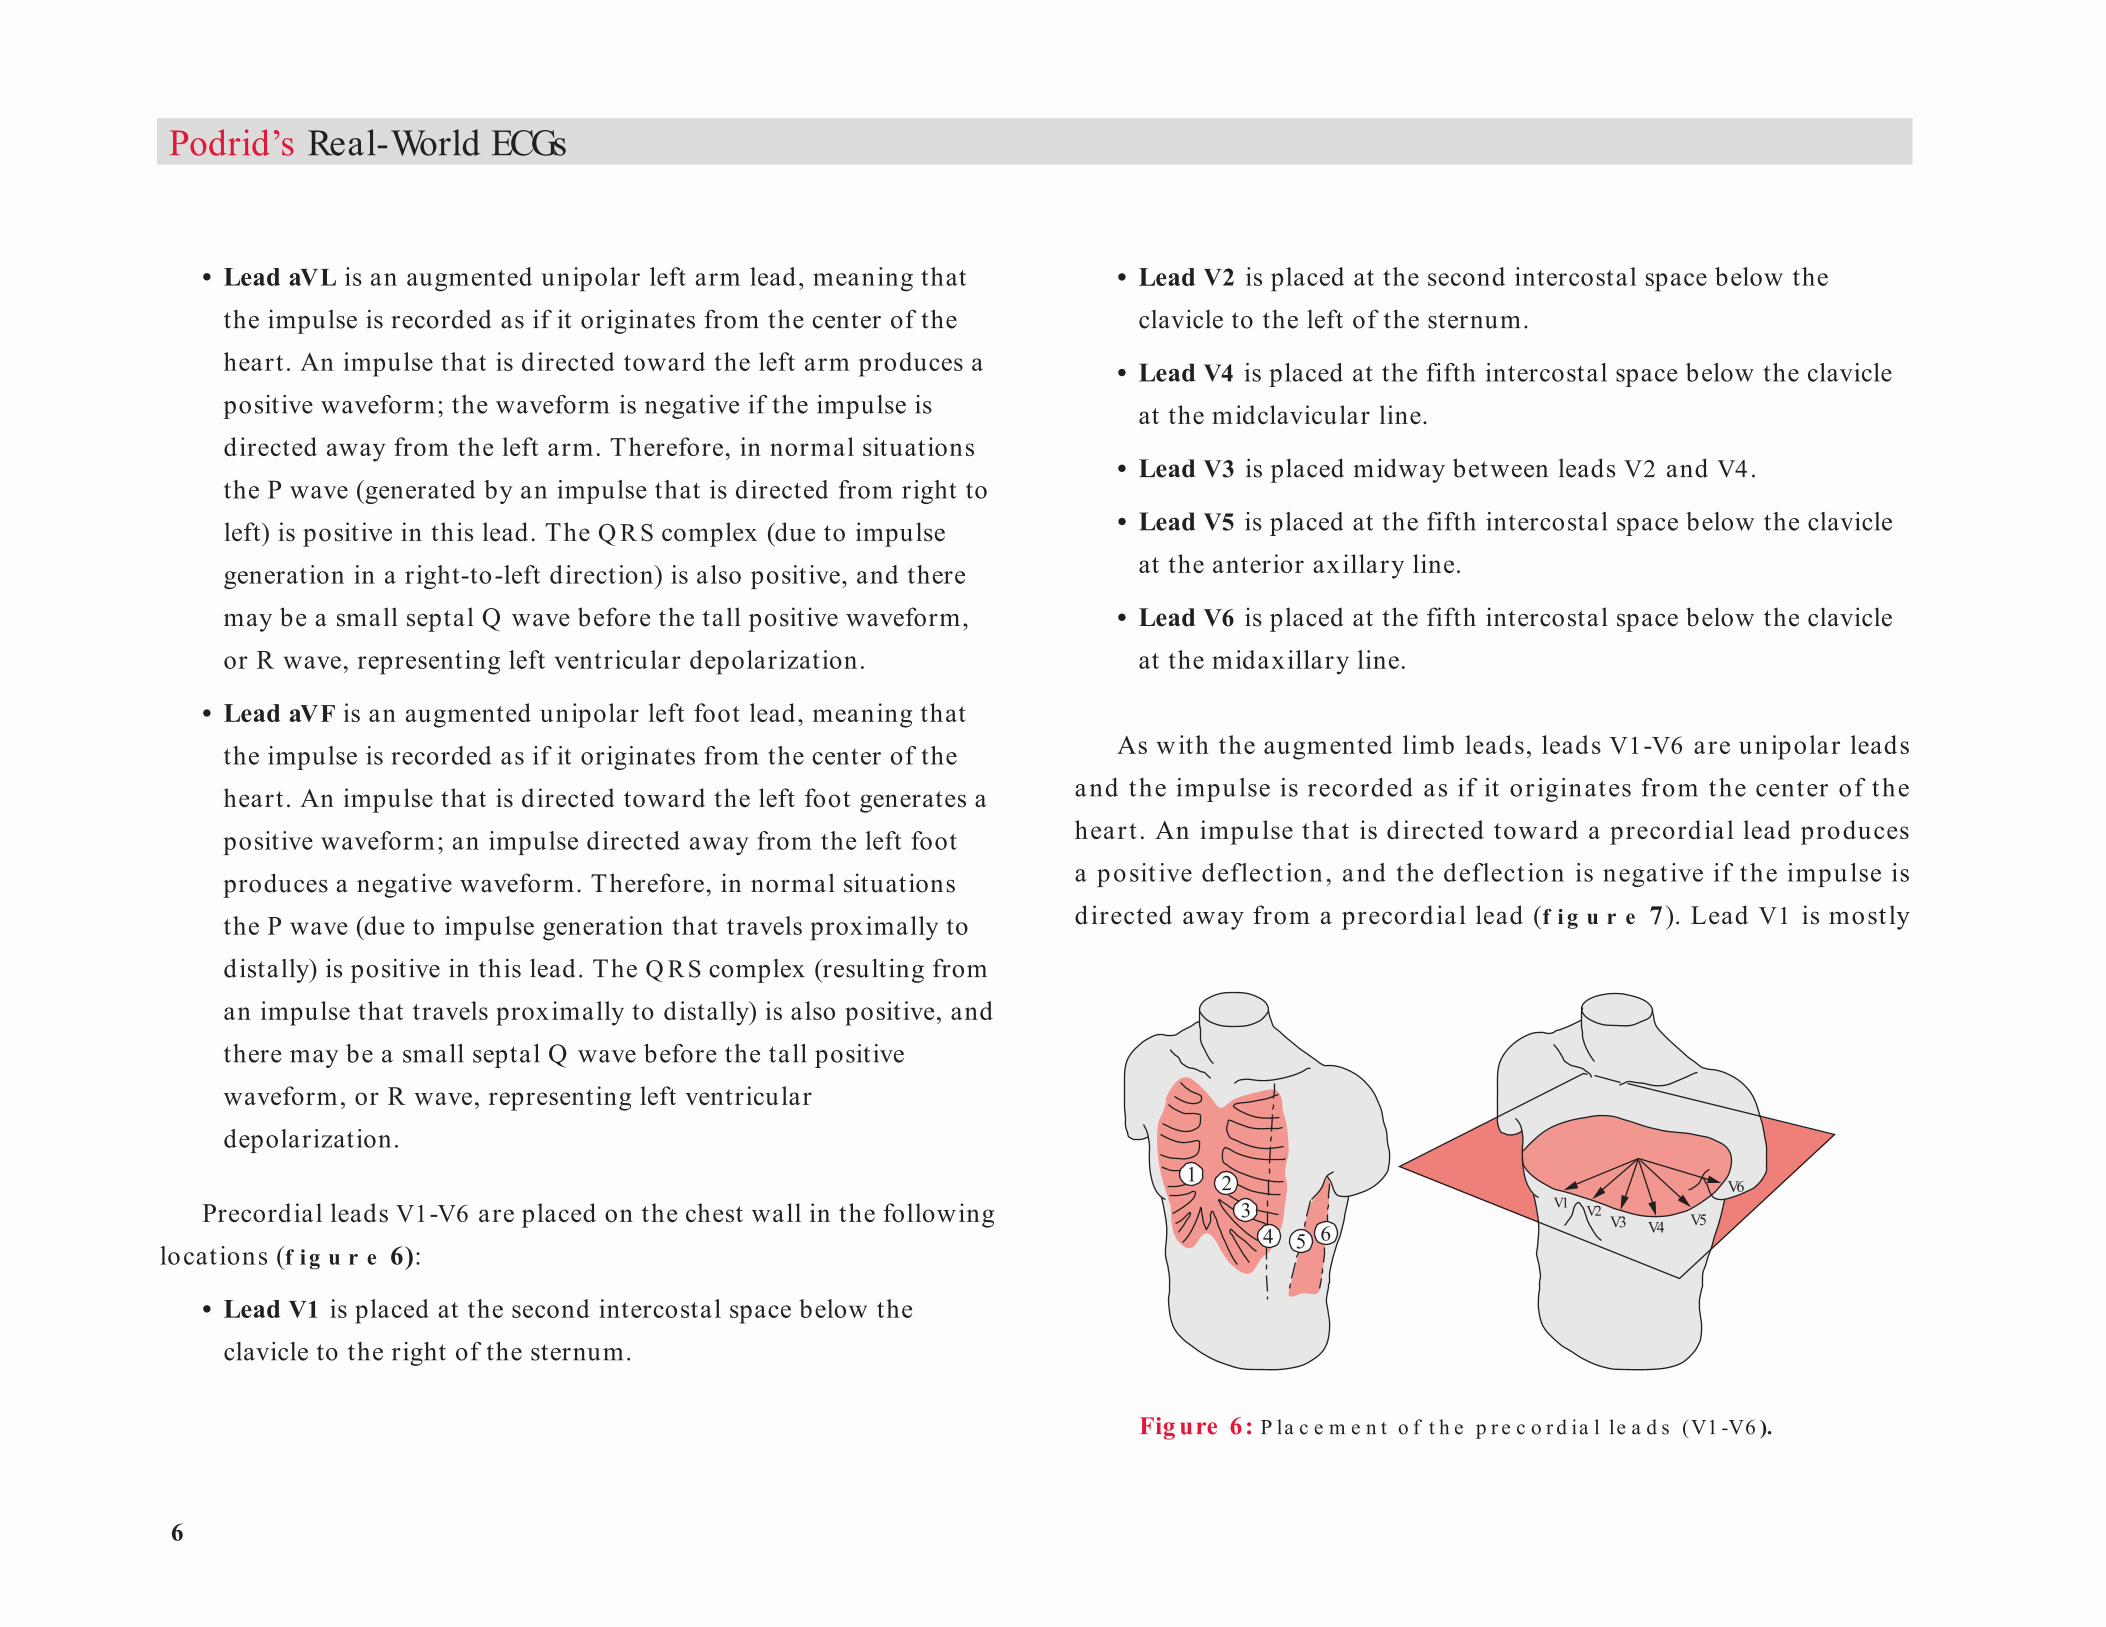
• Lead aVL is an augmented unipolar left arm lead, meaning that the impulse is recorded as if it originates from the center of the heart. An impulse that is directed toward the left arm produces a positive waveform; the waveform is negative if the impulse is directed away from the left arm. Therefore, in normal situations the P wave (generated by an impulse that is directed from right to left) is positive in this lead. The Q RS complex (due to impulse generation in a right-to-left direction) is also positive, and there may be a small septal Q wave before the tall positive waveform, or R wave, representing left ventricular depolarization.
• Lead aVF is an augmented unipolar left foot lead, meaning that the impulse is recorded as if it originates from the center of the heart. An impulse that is directed toward the left foot generates a positive waveform; an impulse directed away from the left foot produces a negative waveform. Therefore, in normal situations the P wave (due to impulse generation that travels proximally to distally) is positive in this lead. The Q RS complex (resulting from an impulse that travels proximally to distally) is also positive, and there may be a small septal Q wave before the tall positive waveform, or R wave, representing left ventricular depolarization.
Precordial leads V1-V6 are placed on the chest wall in the following locations (f i g u r e 6):
• Lead V1 is placed at the second intercostal space below the clavicle to the right of the sternum.
• Lead V2 is placed at the second intercostal space below the clavicle to the left of the sternum.
• Lead V4 is placed at the fifth intercostal space below the clavicle at the midclavicular line.
• Lead V3 is placed midway between leads V2 and V4.
• Lead V5 is placed at the fifth intercostal space below the clavicle at the anterior axillary line.
• Lead V6 is placed at the fifth intercostal space below the clavicle at the midaxillary line.
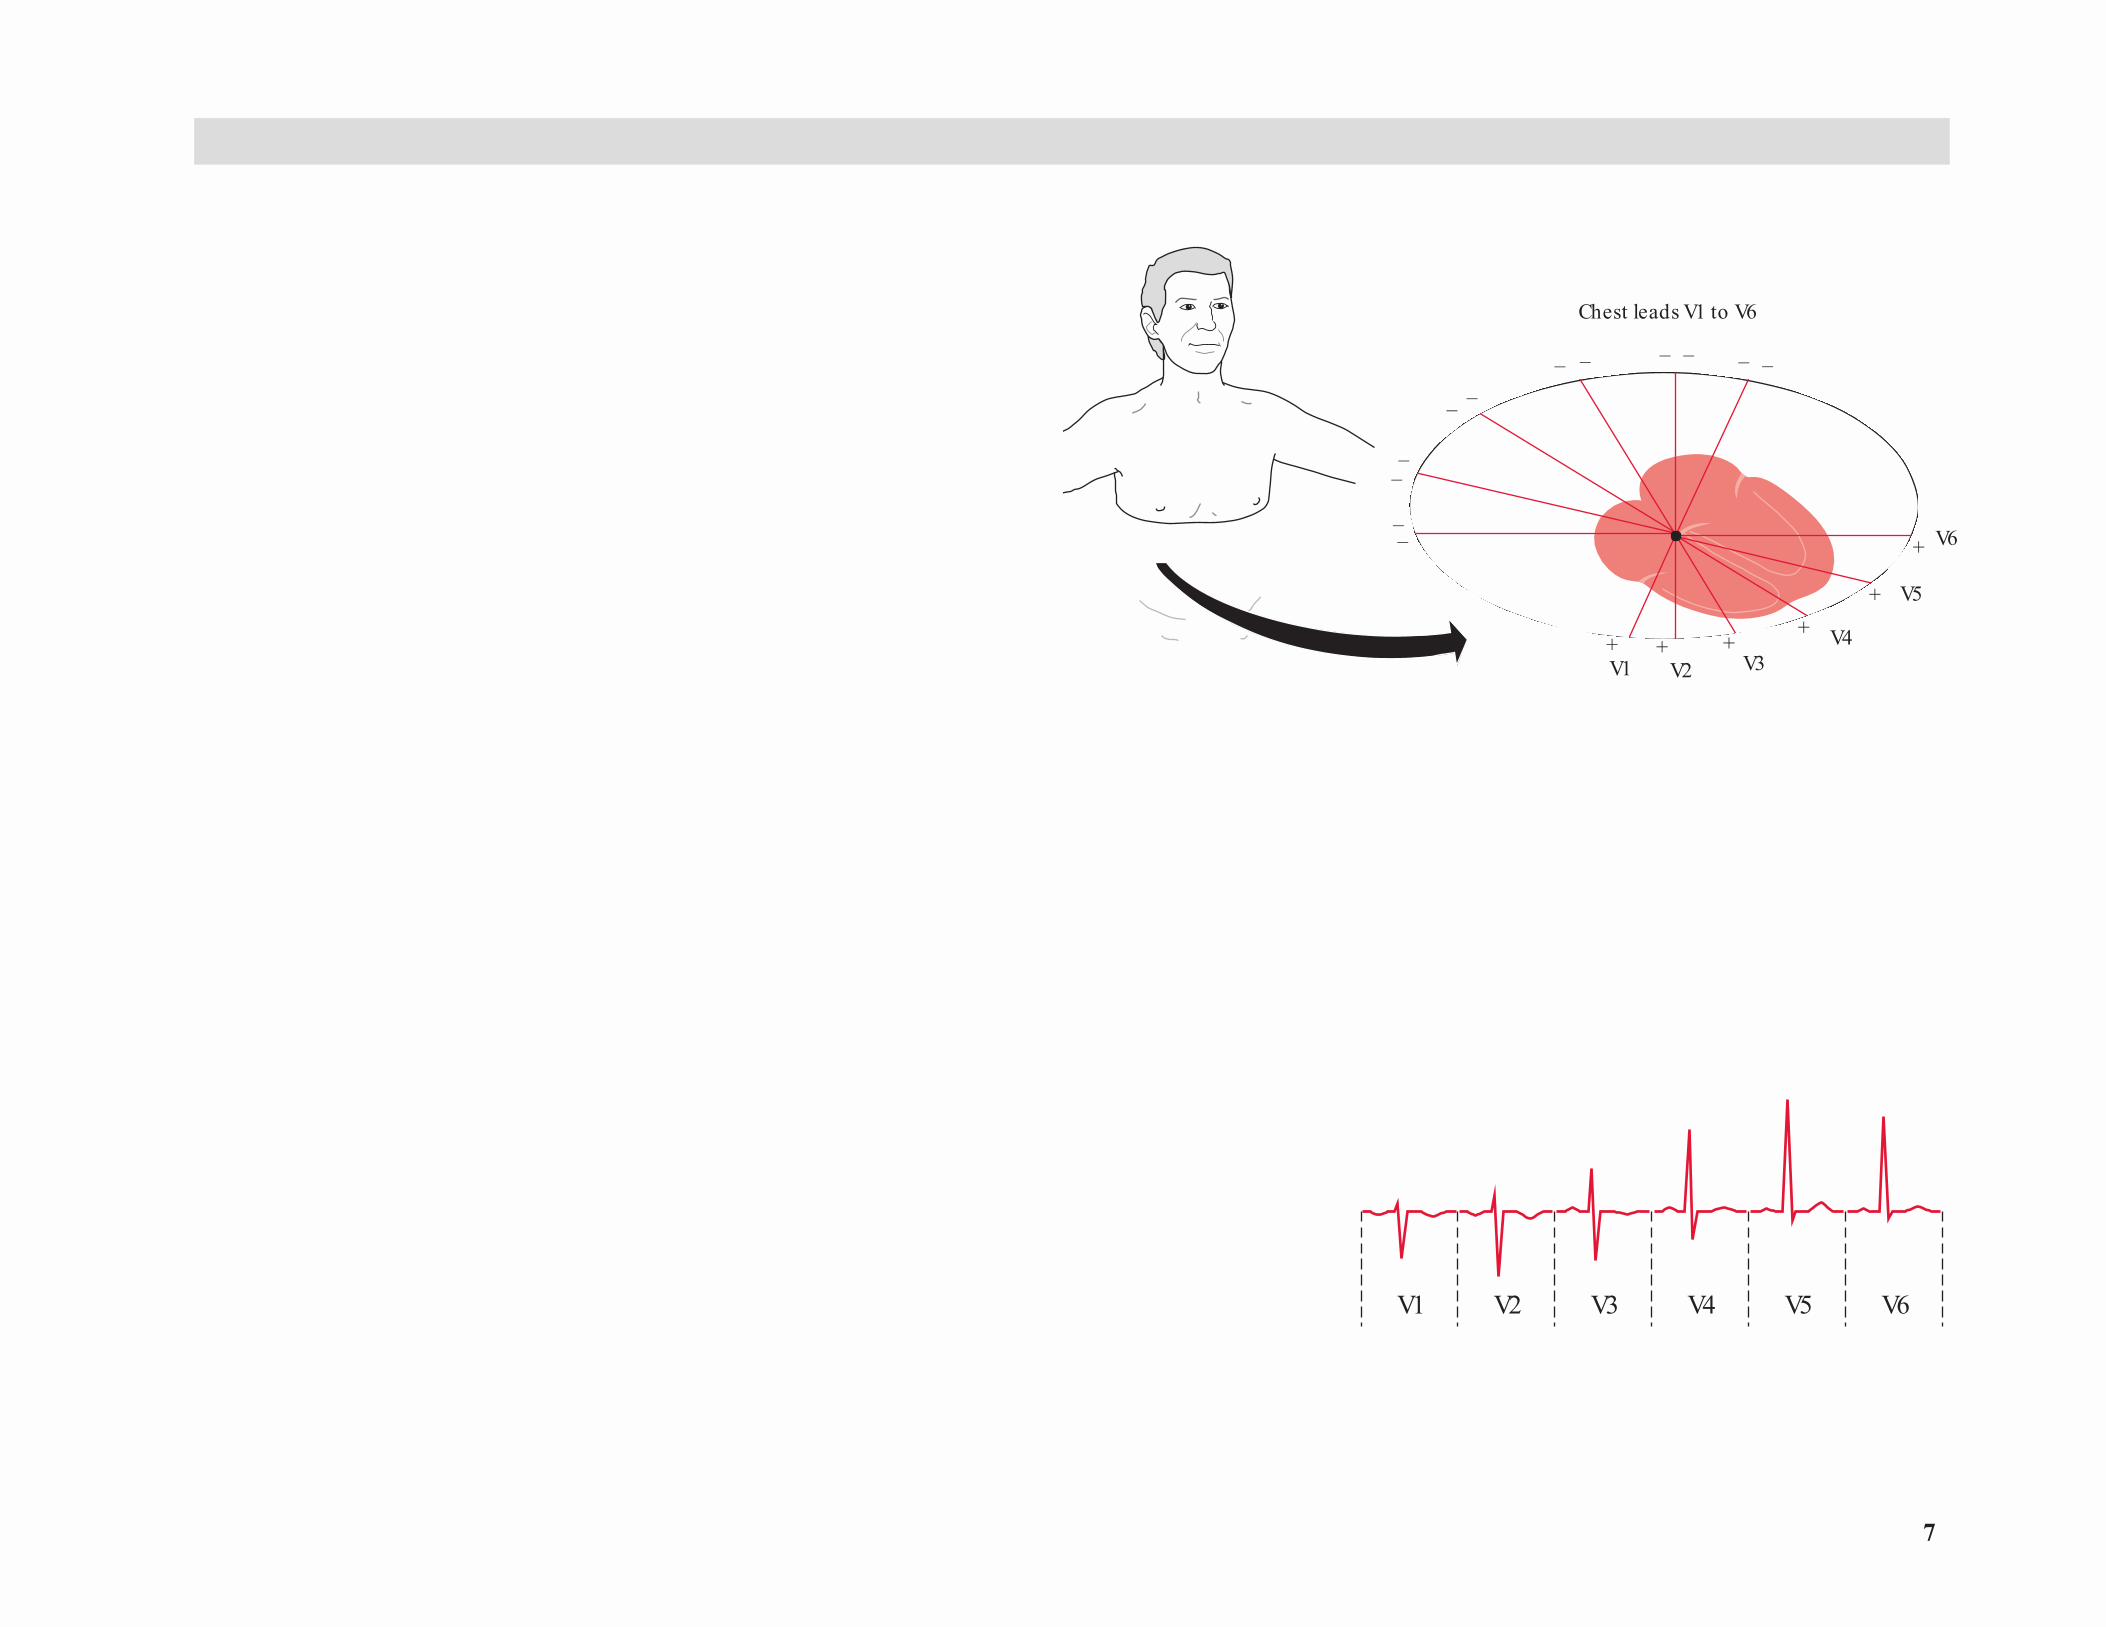
As with the augmented limb leads, leads V1-V6 are unipolar leads and the impulse is recorded as if it or iginates from the center of the hear t . An impulse that is directed toward a precordial lead produces a posit ive deflect ion, and the deflect ion is negat ive if the impulse is d irected away from a precordial lead (f i g u r e 7). Lead V1 is most ly
Fig ure 6: P la c e m e n t o f t h e p r e c o r d ia l le a d s (V1 -V6 ).
7
V1 V2 V3 V4 V5 V6
Chest Leads on EKG
V1
Chest leads V1 to V6
+ + ++
+
+
V2 V3V4
V5
V6
––
––
– –– – – – – –
The Basics: Introduction
over the r ight vent r icle and r ight at r ium, while leads V2 -V3 are pr i-marily over the int raventricular septum toward the left ventricle and leads V4 -V6 are over the left vent r icle and left at r ium. Therefore, in lead V1 (and occasionally in lead V2) the P wave is biphasic, as the ini-tial depolarization is from the right atrium (going toward lead V1) and the second par t of the P wave is from the left atrium, going away from lead V1. The P waves in leads V3 -V6 are normally posit ive as these leads are primarily over the left atrium and reflect left atrial activation, which goes toward these leads.
Based on the location of the V leads, there is an init ial small posi-t ive waveform (R wave) in lead V1, representing septal depolarization going from left to right and hence toward this lead. This is followed by a deep S wave representing left ventricular depolarization, which goes in a r ight-to-left direct ion (away from this lead). In contrast , lead V6 has an in it ia l negat ive waveform (Q wave) represent ing in it ia l sep -tal act ivat ion going from left to r ight or away from this lead. This is followed by a ta ll posit ive deflect ion (R wave) represent ing left ven-t r icular depolarizat ion, which t ravels in a r ight-to-left direct ion and hence toward th is lead. As one inspects leads V1-V6 (which go in a r ight-to-left direct ion across the chest), there is a gradual increase in the amplitude of the R wave (reflect ing more left vent r icu la r forces d irected toward the lead) and a decrease in the depth of the S wave (which reflects left ventricular forces going away from the lead). H ence the gradual increase in the amplitude of the R wave (going from V1 -V6) is called R-wave progression across the precordium (f i g u r e 8). The transition (R / S ≥ 1) usually occurs between leads V3 and V4.
Fig ure 7: P r e c o r d ia l c h e s t le a d s in t h e h o r iz o n t a l p la n e . An impuls e dire c te d to ward a pre c o rdia l le ad pro duc e s a po s itive de fle c tio n, w hile an impuls e dire c te d away fro m a pre c o rdia l le ad pro duc e s a ne g ative de fle c tio n.
Fig ure 8: R -w a v e p r o g r e s s io n a c r o s s t h e p r e c o r d iu m . Go ing fro m le ad V1 (w hic h s its o ve r the rig ht ve ntric le ) to le ad V6 (w hic h is o ve r the le ft ve ntric le ), the re is a g radual inc re as e in the amplitude o f the R wave and de c re as e in the de pth o f the S wave . In le ad V1 the initia l R wave re pre s e nts a s e pta l fo rc e , w hile the S wave is the le ft ve ntric ular fo rc e . Go ing fro m le ads V1 to V6 ( ie , fro m rig ht to le ft ve ntric le s ), the le ft ve ntric ular fo rc e s be c o me mo re pro mine nt ( ie , the R�wave amplitude inc re as e s and the S �wave de pth de c re as e s as the le ft ve ntric ular fo rc e s are g o ing to ward the le ad).
8
Podrid’s Real-World ECGs
Approach to ECG AnalysisEC G s shou ld b e a n a lyzed t ho rou gh ly a nd syst em at ica lly wh ile considering the patient’s clinical history. By following a standardized sequence of steps, subtle abnormalities in the ECG will become evident.
1. Establish the heart rate. The normal heart rate ranges from 60 to 100 bpm; bradycardia is defined as a heart rate of 60 bpm or lower and tachycardia as a heart rate of 100 bpm or higher. Heart rate can be established in two ways:
• Count the number of Q RS complexes and multiply by 6 (as an ECG recording takes 10 seconds). This is the preferred method when the rhythm is irregular.
• Use the grid on the ECG tracing. H eart rate = 300 ÷ the number of large boxes within one R R interval. If the R R interval duration is between two large boxes, the number of small boxes (five per large box) is then used to approximate the heart rate. For example, if the R R interval is between one and two large boxes (ie, the heart rate is between 300 and 150), each small box is 150 ÷ 5 or 30 bpm. If the R R interval is between two and three large boxes (ie, heart rate between 150 and 100 bpm), each small box is 50 ÷ 5 or 10 bpm. If the R R interval is between three and four large boxes (ie, heart rate between 100 and 75 bpm), each small box is 25 ÷ 5 or 5 bpm. If the R R interval is between four and five large boxes (ie, heart rate between 60 and 75 bpm), each small box is 15 ÷ 5 or 3 bpm.
2. Establish where the rhythm originates, that is, in which structure is the pacemaker that initiates the impulse. This is based on the
presence or absence of a P wave, location of the P wave (before or after the Q RS complex), and P-wave morphology. A sinus origin for the atrial activity is associated with a positive P wave in leads I, II, aVF, and V4 -V6. The normal atrial impulse direction generates a positive waveform in these leads. If the P wave is negative in any of these leads, the impulse direction is not normal and hence the origin is not the sinus node but rather somewhere else in the atrium; therefore, this is an atrial rhythm. If there is no P wave before any Q RS complex, the origin of the impulse is not sinus or atrial but is either the AV node or AV junction (if the Q RS complex is narrow and normal) or the ventricular myocardium (if the Q RS complex is wide with an unusual morphology).
3. Establish the regularity of the rhythm. Note whether the R R intervals are regular, regularly irregular (irregular but with a pattern often based on abnormalities in AV conduction or AV block), or irregularly irregular (no pattern to the R R intervals).
4. Determine the electrical axis in the frontal plane (ie, normal, leftward, rightward, or indeterminate).
5. Measure the PR interval, Q RS complex duration, and Q T interval.
6. Evaluate the R-wave progression across the precordium. This will also establish the electrical axis in the horizontal plane (ie, normal, clockwise, or counterclockwise rotation).
7. Evaluate the P-wave amplitude, duration, and morphology.
8. Establish the Q RS complex duration, amplitude, and morphology.
9. Indicate the presence of pathologic Q waves (ie, longer than 0.04 sec in duration).

9
J Point
P
R
Q
S
T
U
5 mm0.2 SECOND
5
m
m
0
.
5
m
V
1
m
m
0
.
1
m
V
1 mm
0.04 SECOND
STSegment
PRSegment
PRInterval
JTInterval
QRSComplexInterval
(Duration)QT
Interval
10. Evaluate the ST-segment (morphology and elevation or depression) and J-point changes.
11. Note T-wave abnormalities.
12. Indicate the presence of other waveforms (eg, U waves, pacemaker spikes, artifact).
Normal Waveforms and IntervalsComponents of the normal waveform include the P wave, PR interval, Q R S complex, Q T interval, T wave, and U wave (f i g u r e 9).
P WaveThe normal P wave, which should be posit ive in leads I, I I , aVF, and V4 -V6, represents right atrial followed by left atrial depolarization. The normal P-wave duration is 0.12 second or less, and the usual amplitude is less than 2 .5 mV (2 .5 small boxes).
PR Interva lThe PR interval, which includes the P wave and PR segment, is a mea-sure of AV conduction, or the time required for the impulse to go from atr ium to ventr icle (including conduction through the at r ium, which is the P wave, and conduction through the AV node and H is-Purkinje system, which is the PR segment). The PR interval is determined by measuring the duration from the beginning of P wave to the first wave of Q R S complex (either a Q or R wave). The normal PR inter va l is between 0.14 and 0.20 second. The PR segment should be at baseline or zero potential as there is no electrical activity measured on the surface
The Basics: Introduction
Fig ure 9: C o m p o n e n t s o f a t y p ic a l w a ve fo r m a n d t h e u s u a l in t e r v a ls t h a t a r e m e a s u r e d . The PR inte rval (time fo r AV c o nduc tio n) is me as ure d fro m the be g inning o f the P wave to the be g inning o f the QRS c o mple x (e ithe r a Q o r R wave ). The PR inte rval inc lude s the P wave and PR s e g me nt. The QRS c o mple x duratio n o r inte rval, w hic h is the time fo r ve ntric ular de po larizatio n, is me as ure d fro m the be g inning o f the QRS c o mple x (e ithe r a Q o r R wave ) to the e nd o f the QRS c o mple x, w hic h is the J po int. The QT inte rval, w hic h is the time fo r ve ntric ular de po larizatio n and re po larizatio n, is me as ure d fro m the be g inning o f the QRS c o mple x (e ithe r a Q wave o r R wave ) to the e nd o f the T wave . This inte rval inc lude s the QRS c o mple x, S T s e g me nt, and T wave .
1 0
Podrid’s Real-World ECGs
ECG during this time, even though there is electrical activity occurring within the AV node and H is-Purkinje system.
T he PR inter va l cha nges w it h hea r t ra t e, pr ima r ily reflect ing changes in AV nodal conduction time (which is the major determinant of the PR segment). Conduct ion th rough the H is-Purk inje system is constant as there is no alteration of conduction velocity related to heart rate changes (ie, conduction through this part of the conduction system is all or none). At slower sinus rates (higher vagal tone and less sympa-thetic st imulation), conduction through the AV node slows and hence the PR interval (segment) lengthens. With fast sinus rates, reflecting less vagal tone and increased sympathetic st imulat ion, AV nodal conduc-tion velocity increases and the PR interval (segment) shortens. There is, however, no method available to correct the PR interval for rate.
At a given hear t rate, the PR interval should be constant. Any vari-ability reflects an AV conduction abnormality. When there is no pattern to the variability, AV dissociation is present. The presence of progres-sive lengthening of the PR interval is seen with type 1 second-degree AV block (M obitz I or Wenckebach).
Q RS ComplexThe Q R S complex duration (or interval) represents time for ventricular depolar izat ion. The durat ion is measured from the beginning of the Q R S complex (either a Q or R wave) to the end of the Q R S complex (which is defined as the J point and is located at the end of the Q R S
complex and the beginning of the ST segment). Right and left ventricu-lar depolarization is simultaneous. H owever, since the left ventricular myocardial mass is much greater than the right ventricular mass, the
Q R S complex pr imarily reflects left vent r icu lar depolar izat ion. The normal Q R S durat ion is between 0.06 and 0.10 second and does not change with hear t rate (ie, H is-Purkinje impulse conduction is a ll or none). A Q R S complex duration that is 0.10 second or longer is called an intraventricular conduction delay (IVC D). If the Q RS complex dura-t ion is 0.12 second or longer with a t ypica l pat tern , the IVC D may represent a bundle branch block.
Q T Interva lThe Q T interval is a measure of the t ime for vent r icu la r repolar iza-t ion. It is measured from the beginning of Q R S complex (either a Q or R wave) to the end of T wave. It must be remembered that since the Q T interval measurement includes the Q R S complex , it is not just a measure of left ventricular repolarization but also includes the t ime of left ventricular depolarization. It is also important to remember that a prolonged Q RS duration (due to a bundle branch block or a non specific IVC D) may result in lengthening of the measured Q T interval. In this situation, the prolonged Q T interval is not due to prolongation of repo-la r izat ion. As the normal Q T interval measurements a re based on a normal Q R S durat ion (ie, 0.06 to 0.10 sec), any prolongat ion of the Q R S duration above this value needs to be considered and the increased duration (in milliseconds) subtracted from the Q T measurement. T he Q T interva l changes with hea r t rate, that is, it is prolonged at slower rates and shor tens with faster rates. Therefore, the Q T interval must be corrected for rate (ie, Q Tc), using Bazet t’s formula:
Q Tc = Q T ÷ √ R R interval (in seconds) The normal Q Tc is less than 0.44 to 0.48 second.
11
T WaveThe T wave actually represents ventricular repolarization. The T-wave axis is usually the same as that of the Q RS complex. That is, the T-wave direction (positive or negative) is the same direction as the major deflec-t ion of the Q R S complex; if the Q R S complex is posit ive the T wave is posit ive, and if the Q R S complex is negative the T wave is negative. The normal T wave is asymmetric regardless of amplitude (ie, it has a slower upstroke than downstroke). Also, the normal T wave is smooth in both its upst roke and downst roke. Any notches, bumps, or other irregularit ies on the T wave may represent superimposed P waves.
U WaveThe U wave is a low-amplitude posit ive waveform that follows the T wave. The U wave is believed to represent delayed repolarization of the H is-Purkinje system, a lthough it has been suggested that it may represent delayed repolar izat ion of the papilla ry muscles. It is most often seen in the right precordial leads (ie, leads V1-V3).
Normal ECG RecordingIn most cases, 12 leads are recorded (ie, six limb leads and six precor-dia l [chest] leads). The standard layout for the EC G is four columns with three leads in each column (I, II, III; aVR , aVL, aVF; V1, V2 , V3; V4, V5, V6). Each column is simultaneously recorded while each line is continuously recorded. O ne or several rhythm strips (one lead continu-ously recorded over t ime) may be present at the bot tom of EC G .
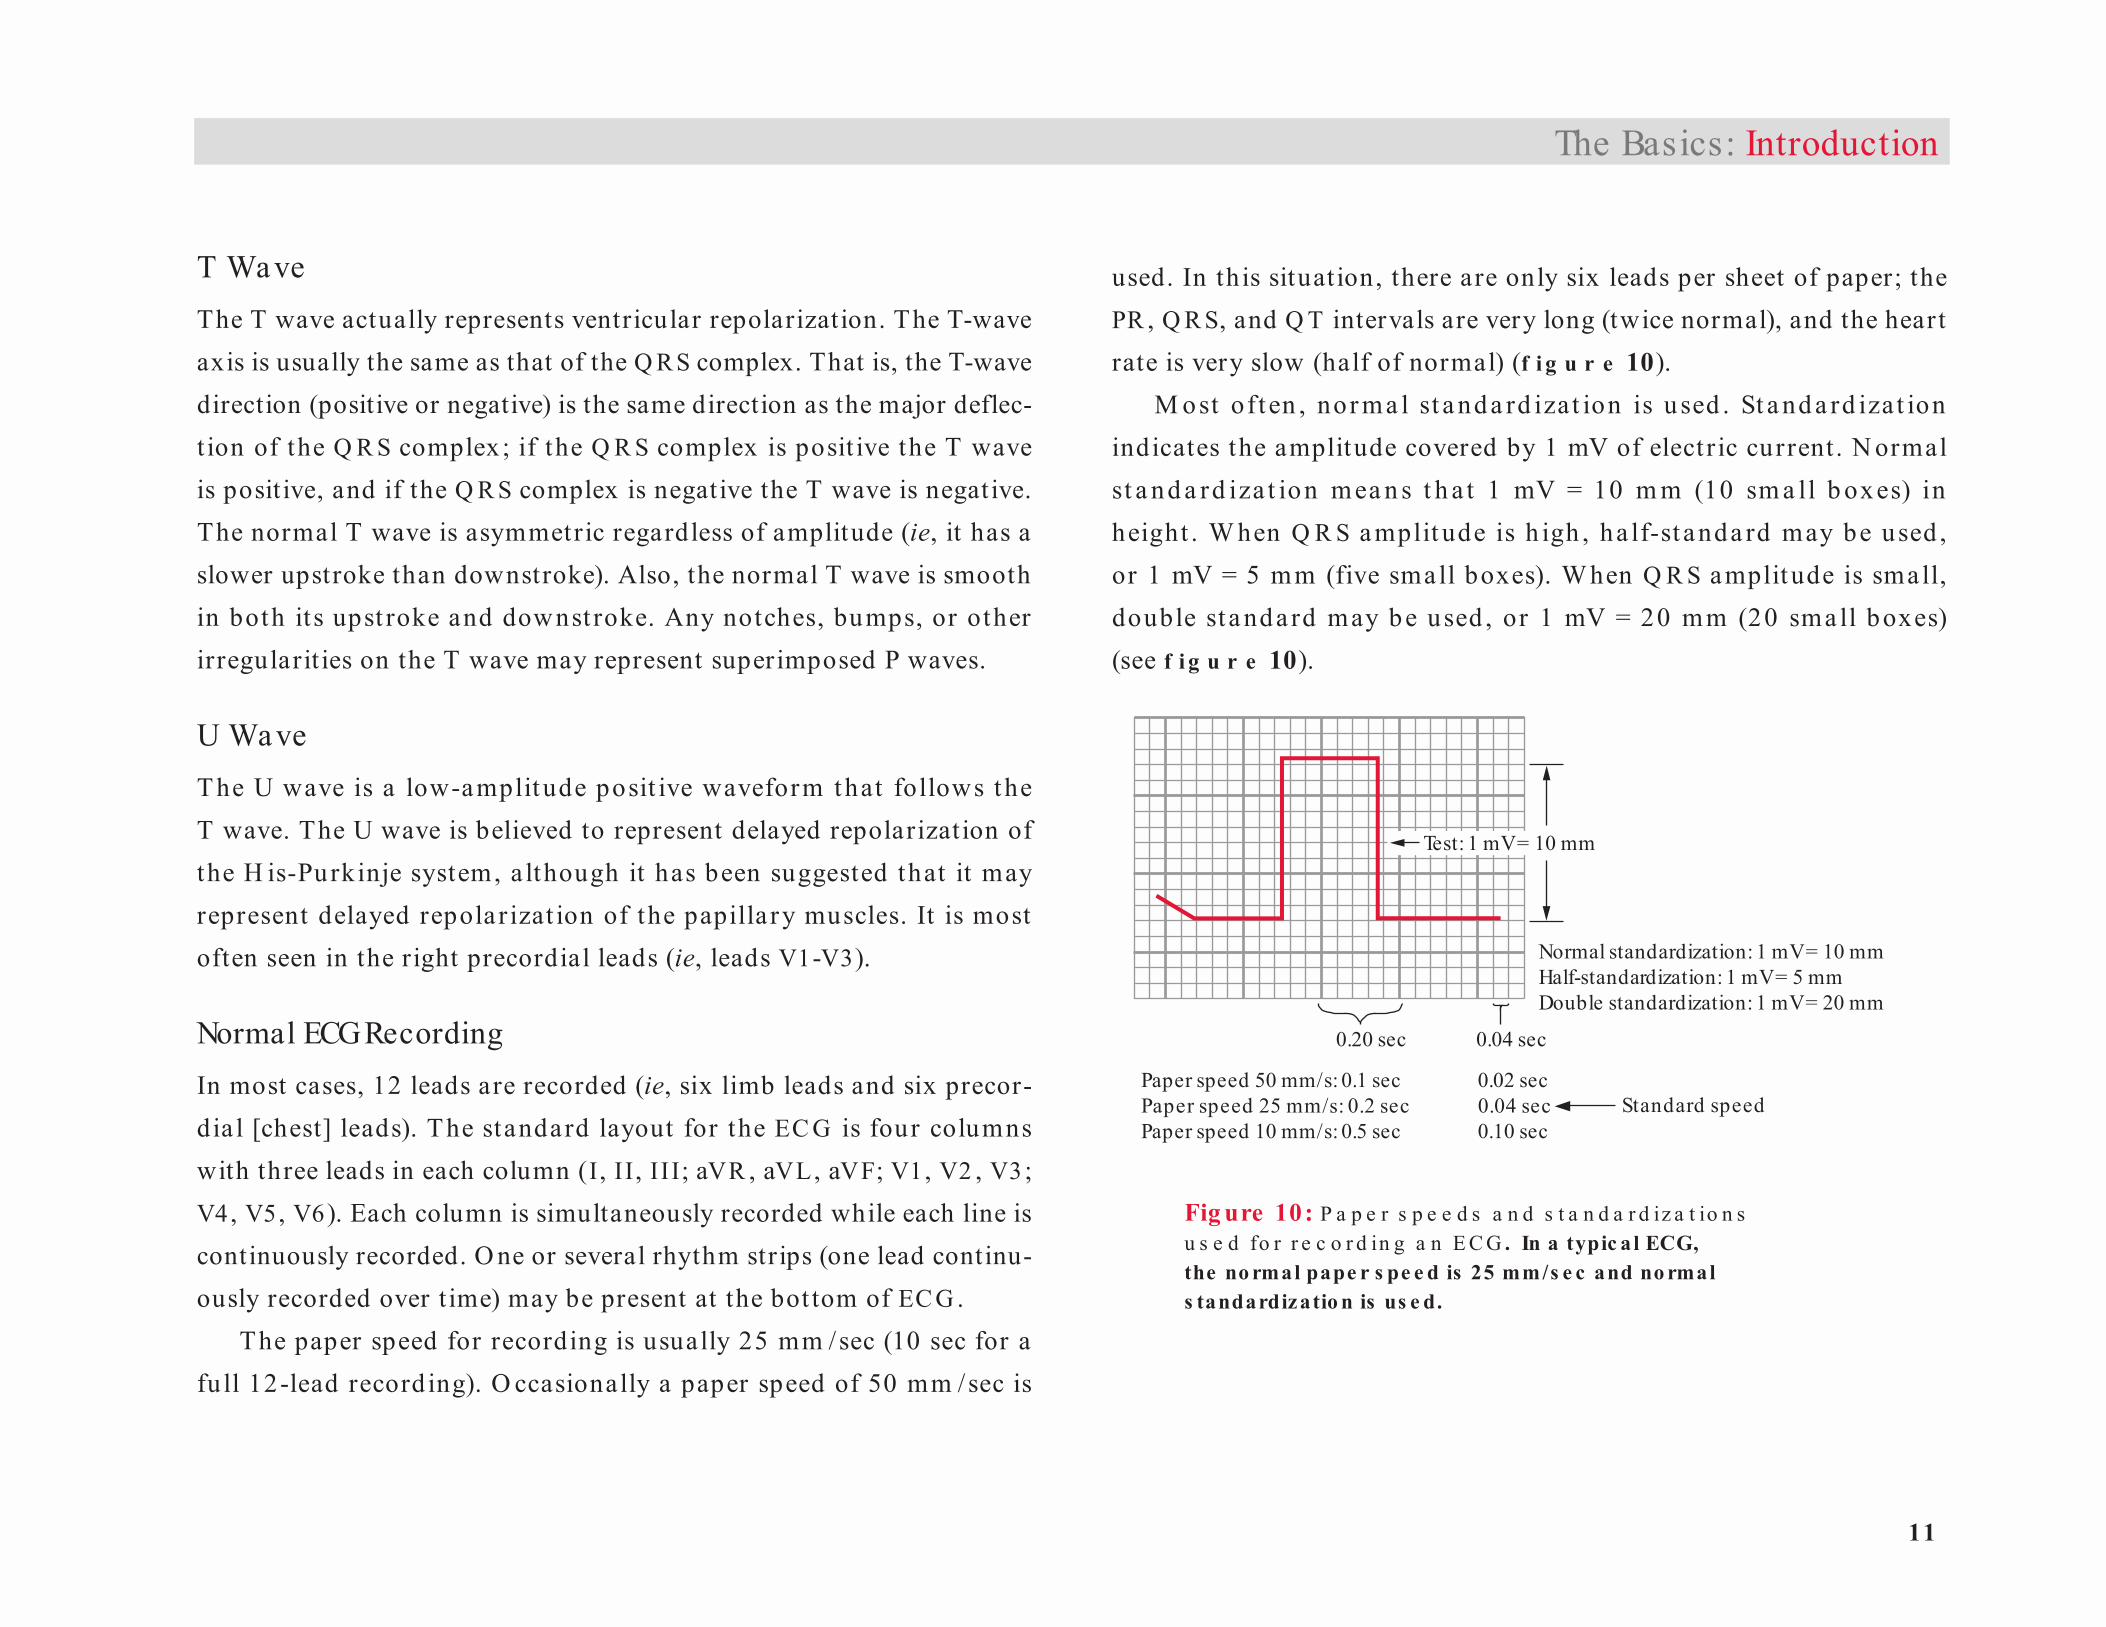
The paper speed for recording is usually 25 mm /sec (10 sec for a fu ll 12-lead record ing). O ccasionally a paper speed of 50 mm /sec is
used. In this situation, there are only six leads per sheet of paper; the PR , Q R S, and Q T intervals are very long (twice normal), and the heart rate is very slow (half of normal) (f i g u r e 10).
M ost oft en , nor ma l st a nda rd izat ion is u sed . St a nd a rd iza t ion indicates the amplitude covered by 1 mV of elect r ic current. N ormal st a nd a rd iza t ion mea n s t h a t 1 mV = 10 m m (10 sm a ll b oxes) in height . W hen Q R S amplit ude is h igh , ha lf-st anda rd may be used , or 1 mV = 5 mm (five small boxes). W hen Q R S amplitude is small, double st a nda rd may be used , or 1 mV = 20 mm (20 sma ll boxes) (see f i g u r e 10).
The Basics: Introduction
Paper speed 50 mm/s: 0.1 sec 0.02 secPaper speed 25 mm/s: 0.2 sec 0.04 secPaper speed 10 mm/s: 0.5 sec 0.10 sec
Standard speed
Test: 1 mV = 10 mm
Normal standardization: 1 mV = 10 mmHalf-standardization: 1 mV = 5 mmDouble standardization: 1 mV = 20 mm
0.20 sec 0.04 sec
Fig ure 10: P a p e r s p e e d s a n d s t a n d a r d iz a t io n s u s e d fo r r e c o r d in g a n E C G . In a typic a l ECG, the no rmal pape r s pe e d is 25 mm/s e c and no rmal s tandardizatio n is us e d.
1 2
Podrid’s Real-World ECGs
RA
RA
LA
LA
0.1SEC 0.2 0.3 0.1SEC 0.2 0.3
Normal
3 mm
2 mm
1mm
0 mm
Right atrial abnormality or hypertrophy
3 mm
2 mm
1mm
0 mm
RA LARA
LA
0.1SEC
Normal
0.2 0.3 0.1SEC 0.2 0.3
3 mm
2 mm
1mm
0 mm
Left atrial abnormality or hypertrophy
3 mm
2 mm
1mm
0 mm
P Wave and PR Interva lSince the sinus node is located in the prox imal por t ion of the r ight at r ium and depolar izat ion occurs in a r ight-to -left and up-to -down (proximal to distal) direction, the normal P wave is posit ive (upright) in leads I, II , aVF, and V4 -V6 . Atrial repolarization occurs during the time of the Q R S complex and hence is not seen.
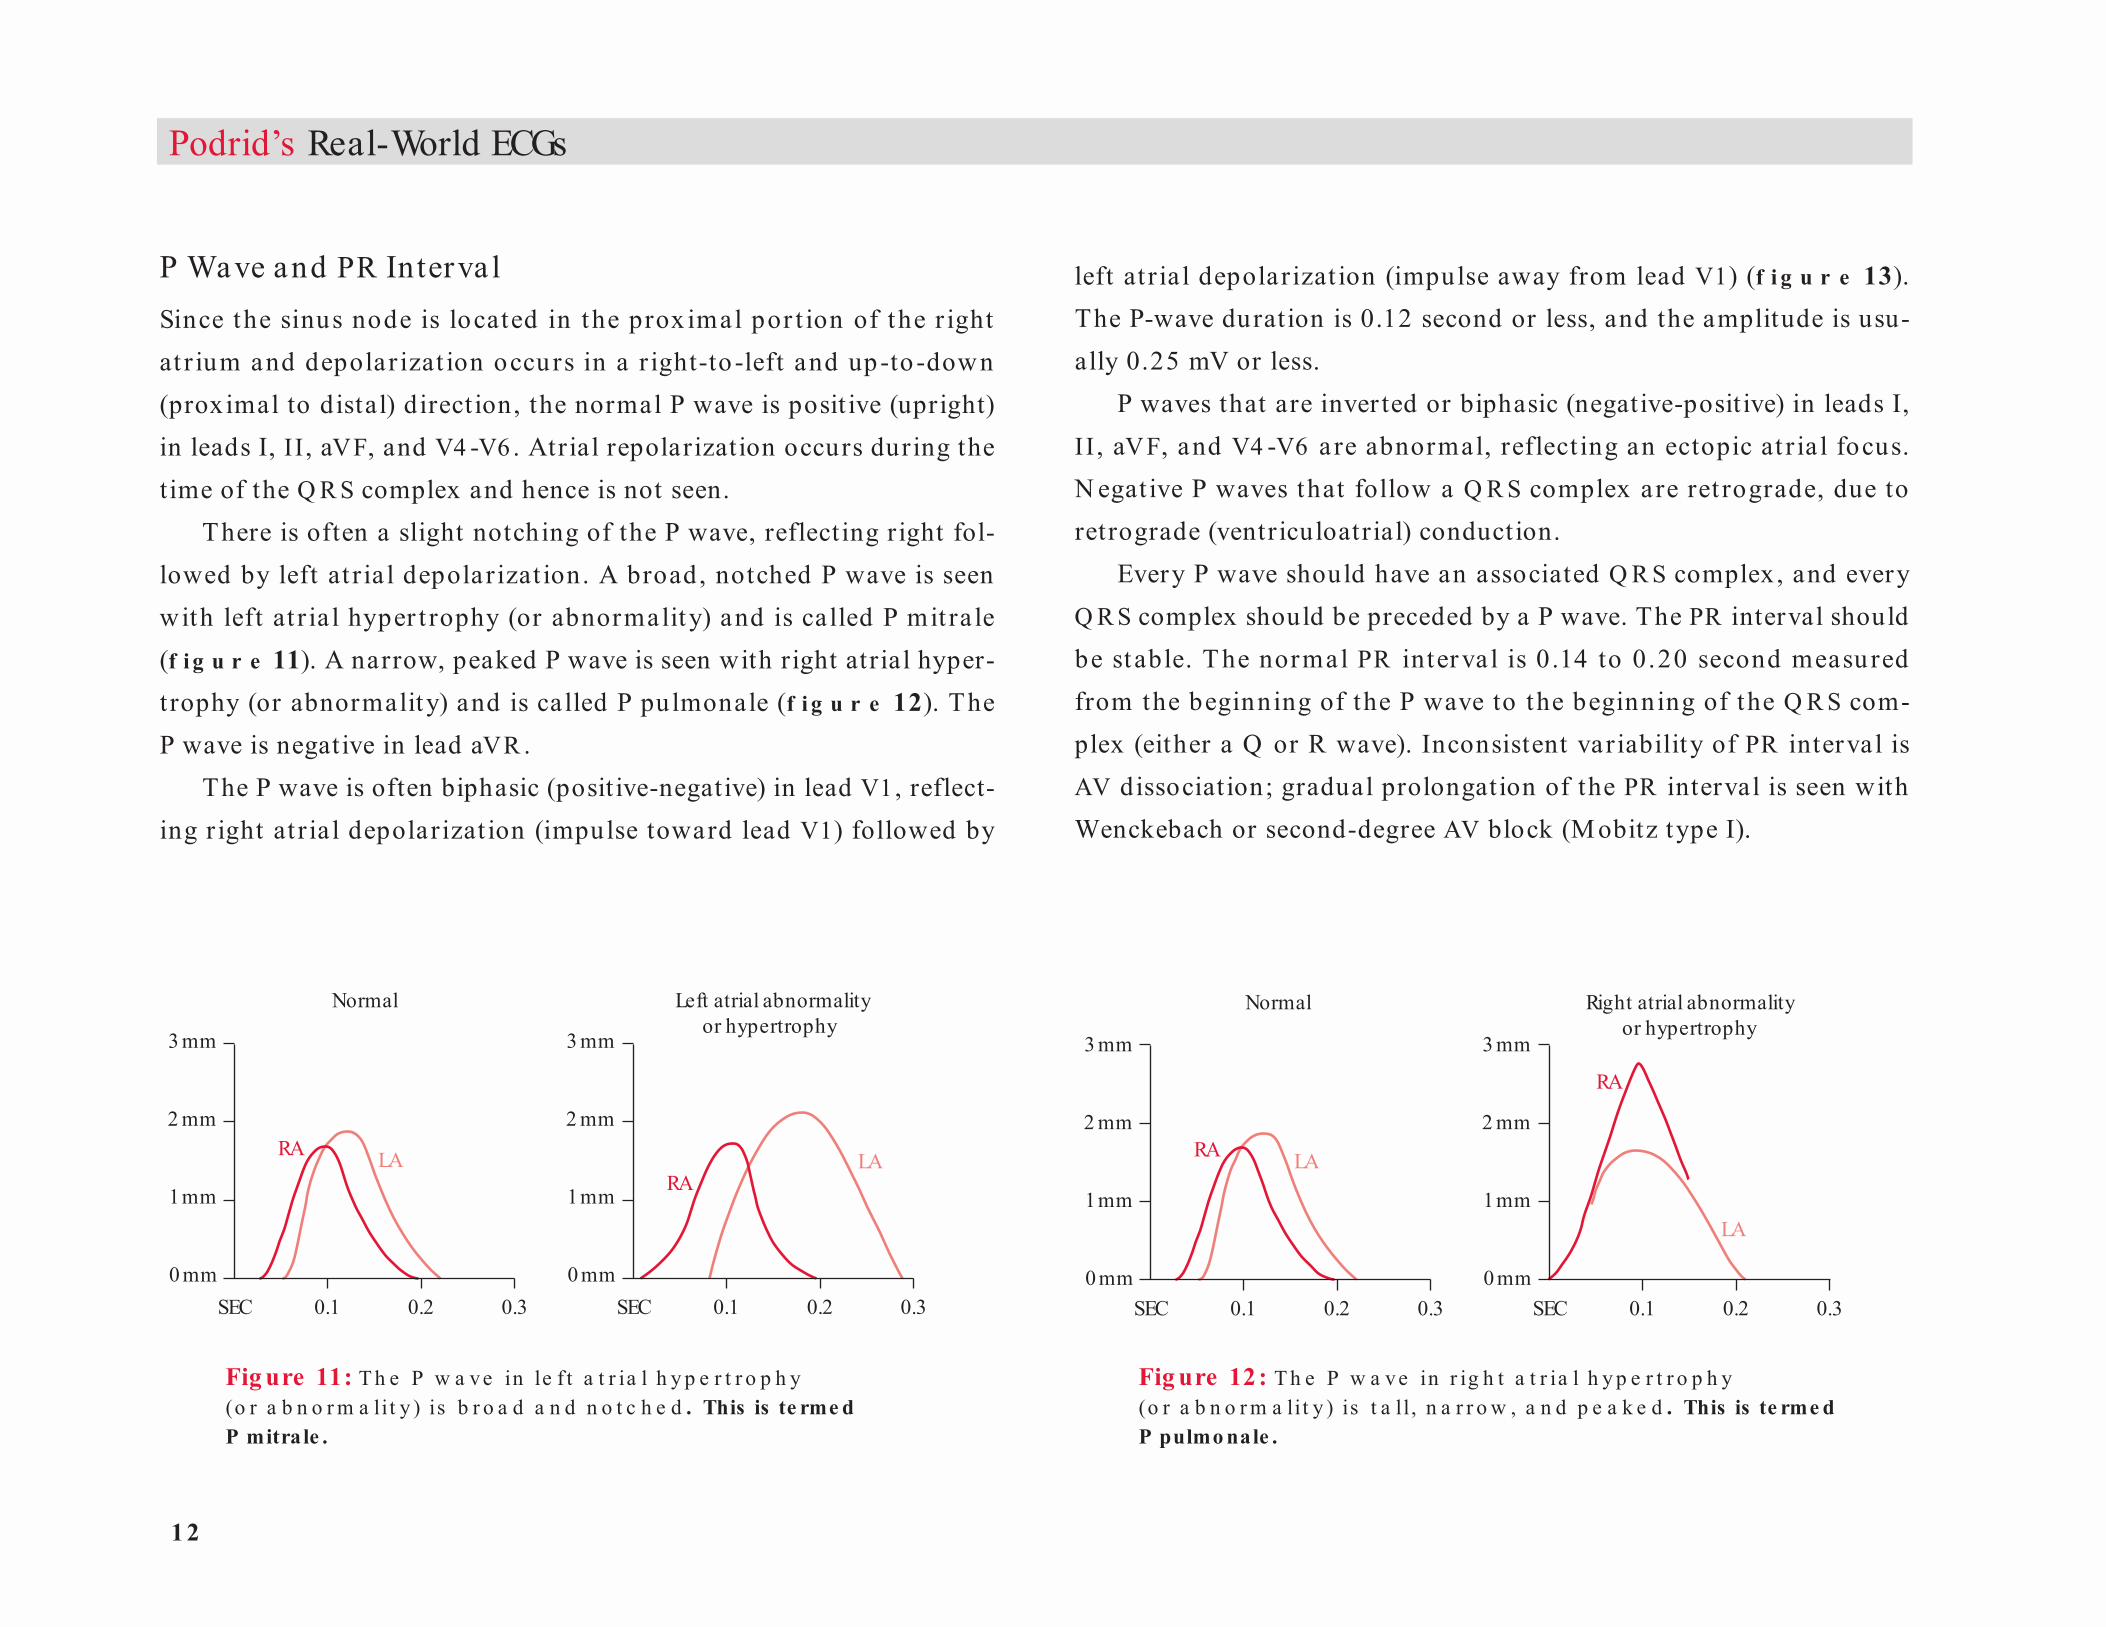
There is often a slight notching of the P wave, reflecting right fol-lowed by left at r ia l depolarizat ion. A broad, notched P wave is seen with left at r ia l hyper t rophy (or abnormality) and is called P mit ra le (f i g u r e 11). A narrow, peaked P wave is seen with right atrial hyper-trophy (or abnormality) and is called P pulmonale (f i g u r e 12). The P wave is negative in lead aVR .
The P wave is often biphasic (posit ive-negative) in lead V1, reflect-ing r ight at r ia l depolarizat ion (impulse toward lead V1) followed by
left at r ia l depolarizat ion (impulse away from lead V1) (f i g u r e 13). The P-wave duration is 0.12 second or less, and the amplitude is usu-ally 0.25 mV or less.
P waves that are inver ted or biphasic (negative-posit ive) in leads I, I I , aVF, and V4 -V6 are abnormal, reflect ing an ectopic at r ia l focus. N egat ive P waves that follow a Q R S complex are ret rograde, due to retrograde (ventriculoatrial) conduction.
Every P wave should have an associated Q R S complex, and every Q R S complex should be preceded by a P wave. The PR interval should be stable. The normal PR inter va l is 0.14 to 0.20 second measu red from the beginning of the P wave to the beginning of the Q R S com-plex (either a Q or R wave). Inconsistent variability of PR interval is AV dissociat ion; gradual prolongation of the PR interval is seen with Wenckebach or second-degree AV block (M obitz type I).
Fig ure 11: T h e P w a ve in le f t a t r ia l h y p e r t r o p h y (o r a b n o r m a lit y ) is b r o a d a n d n o t c h e d . This is te rme d P mitra le .
Fig ure 12: T h e P w a ve in r ig h t a t r ia l h y p e r t r o p h y (o r a b n o r m a lit y ) is t a ll , n a r r o w , a n d p e a k e d . This is te rme d P pulmo nale .

1 3
QR
R Rs rS QS
rR’ r(s)R’ rsR’
Qr qR qRs
RA
Lead II Lead V1
RA LA
LA
Combined
Normal
Right atrial hypertrophy
or abnormality
RA
LA
RA
LA
RA LALeft atrial hypertrophy
or abnormality
Q RS Complex The d irect ion of the waveforms or deflect ions of the Q R S complex determine the let ter applied to the components of the Q R S complex (f ig u r e 14). If the first deflection is negative it is called a Q wave. Any first positive deflection is called an R wave (there may or may not be a Q wave). Any negative deflection after the R wave is called an S wave. If there is a second posit ive deflection, it is termed an R′ (R prime).
T he fir st depola r izat ion of t he left vent r icle occu rs in t he left septum (via the septal or median branch of the left bundle) in a left-
to-r ight d irect ion. H ence there is normally a small septa l Q wave in leads I and V5-V6 and a small septal R wave in lead V1. The direction of the rest of vent r icu la r act ivat ion is r ight to left and prox imal to d ista l. Therefore, the normal Q R S complex is posit ive in leads I, I I , aVF, and V1-V6 and negative in lead aVR . There may be a small R′ in lead V1, which is a normal variant reflecting a slight conduction delay in the r ight ventricle. The Q R S complex may have notching, which is a normal variant.
Since the precordial leads reflect activation from the right to the left ventr icle, the in it ia l septal forces are d irected toward lead V1 (small R wave) and away from lead V6 (small Q wave). The rest of the left ventr icular forces are d irected away from lead V1 (hence an S wave) and toward lead V6 (hence an R wave). Therefore, going from lead V1
to V6 , t he R-wave a mplit ude p ro gressively increa ses a nd the S-wave depth decreases; that is, R / S becomes greater
The Basics: Introduction
Fig ure 13: Ap p e a r a n c e o f t h e P w a ve in le a d s II a n d V1 in r ig h t a n d le f t a t r ia l h y p e r t r o p h y . The no rmal P wave in le ad V1 is biphas ic as the initia l fo rc e (de po larizatio n) is fro m the rig ht a trium, g o ing to ward le ad V1 (and he nc e a po s itive de fle c tio n), w hile le ft atria l de po larizatio n is s lig htly late r, g o ing away fro m le ad V1 and he nc e g e ne rating a ne g ative wave fo rm. With rig ht a tria l hype rtro phy o r abno rmality, the de po larizatio n is primarily to ward le ad V1, the re by g e ne rating a po s itive wave fo rm. With le ft a tria l hype rtro phy o r abno rmality, the de po larizatio n is primarily away fro m V1, the re by g e ne rating a ne g ative wave fo rm.
Fig ure 14: T h e d ir e c t io n o f t h e w a ve fo r m s o r d e fle c t io n s o f t h e Q R S c o m p le x d e t e r m in e t h e le t t e r a p p lie d . If the firs t de fle c tio n is ne g ative it is te rme d a Q wave . Any firs t po s itive wave fo rm (w ith o r w itho ut a Q wave ) is te rme d an R wave . A ne g ative de fle c tio n afte r the R wave is te rme d an S wave . If the re is a s e c o nd po s itive de fle c tio n a fte r the S wave it is c a lle d R' .
14
Podrid’s Real-World ECGs
(northwestquadrant)
pathologic
lead II
physiologic
lead aVF
–90°–120°
+90°+60°
0°+/–180°
I aVF
I aVFI II aVF
I II aVF
I II aVF
–30°
lead I
Rightaxis axis
Leftaxis
axis
Normal
Indeterminate
Left axis
than 1 (ie, normal R-wave progression). The transit ion point at which R /S is 1 or greater is leads V3 -V4. This is termed R-wave progression (see f i g u r e 8).
An increased Q RS amplitude in precordial and /or limb leads, which reflects increased voltage recorded at the body surface, is seen in young subjects, in those with thin chests and no lung disease, and in individu-a ls with myocard ia l hyper t rophy. Low Q R S amplitude is defined as a Q R S amplitude of 5 mm or less in each limb lead and /or less than 10 mm in each precordial lead. This may reflect a reduction in impulse conduction to the surface of the body, which may be due to lung dis-ease, obesity, th ick pericardium, pericardial effusion, or a reduct ion in myocardial muscle mass.
Small septal Q waves are often seen in limb leads and lateral pre-cordial leads. Significant (pathologic) Q waves—that is, any Q wave in leads V1-V3 (although Q S may normally be seen in leads V1-V2) or a Q wave more than 0.04 second in duration and more than 1 mm in depth in leads I, II , aVL, or aVF or in two consecutive leads V4 -V6 —are indicative of old myocardial infarction (M I). An isolated Q wave in lead III is of no significance as it may be normal. An infarction is diag-nosed if there is also a significant Q wave in lead II and /or lead aVF.
The normal Q R S complex duration is 0.06 to 0.10 second. A Q R S
complex duration longer than 0.10 second is considered an IVCD. When the Q R S complex durat ion is 0.10 to 0.12 second, the IVC D is often ca lled incomplete r ight bund le branch block (R BBB) or incomplete left bundle branch block (LBBB) if there is a morphology resembling either R BBB or LBBB. H owever, since H is-Purkinje conduction is all or none and not incomplete, an IVC D (to either the right or left ventricle) is a more appropriate term. A Q R S complex durat ion 0.12 second or
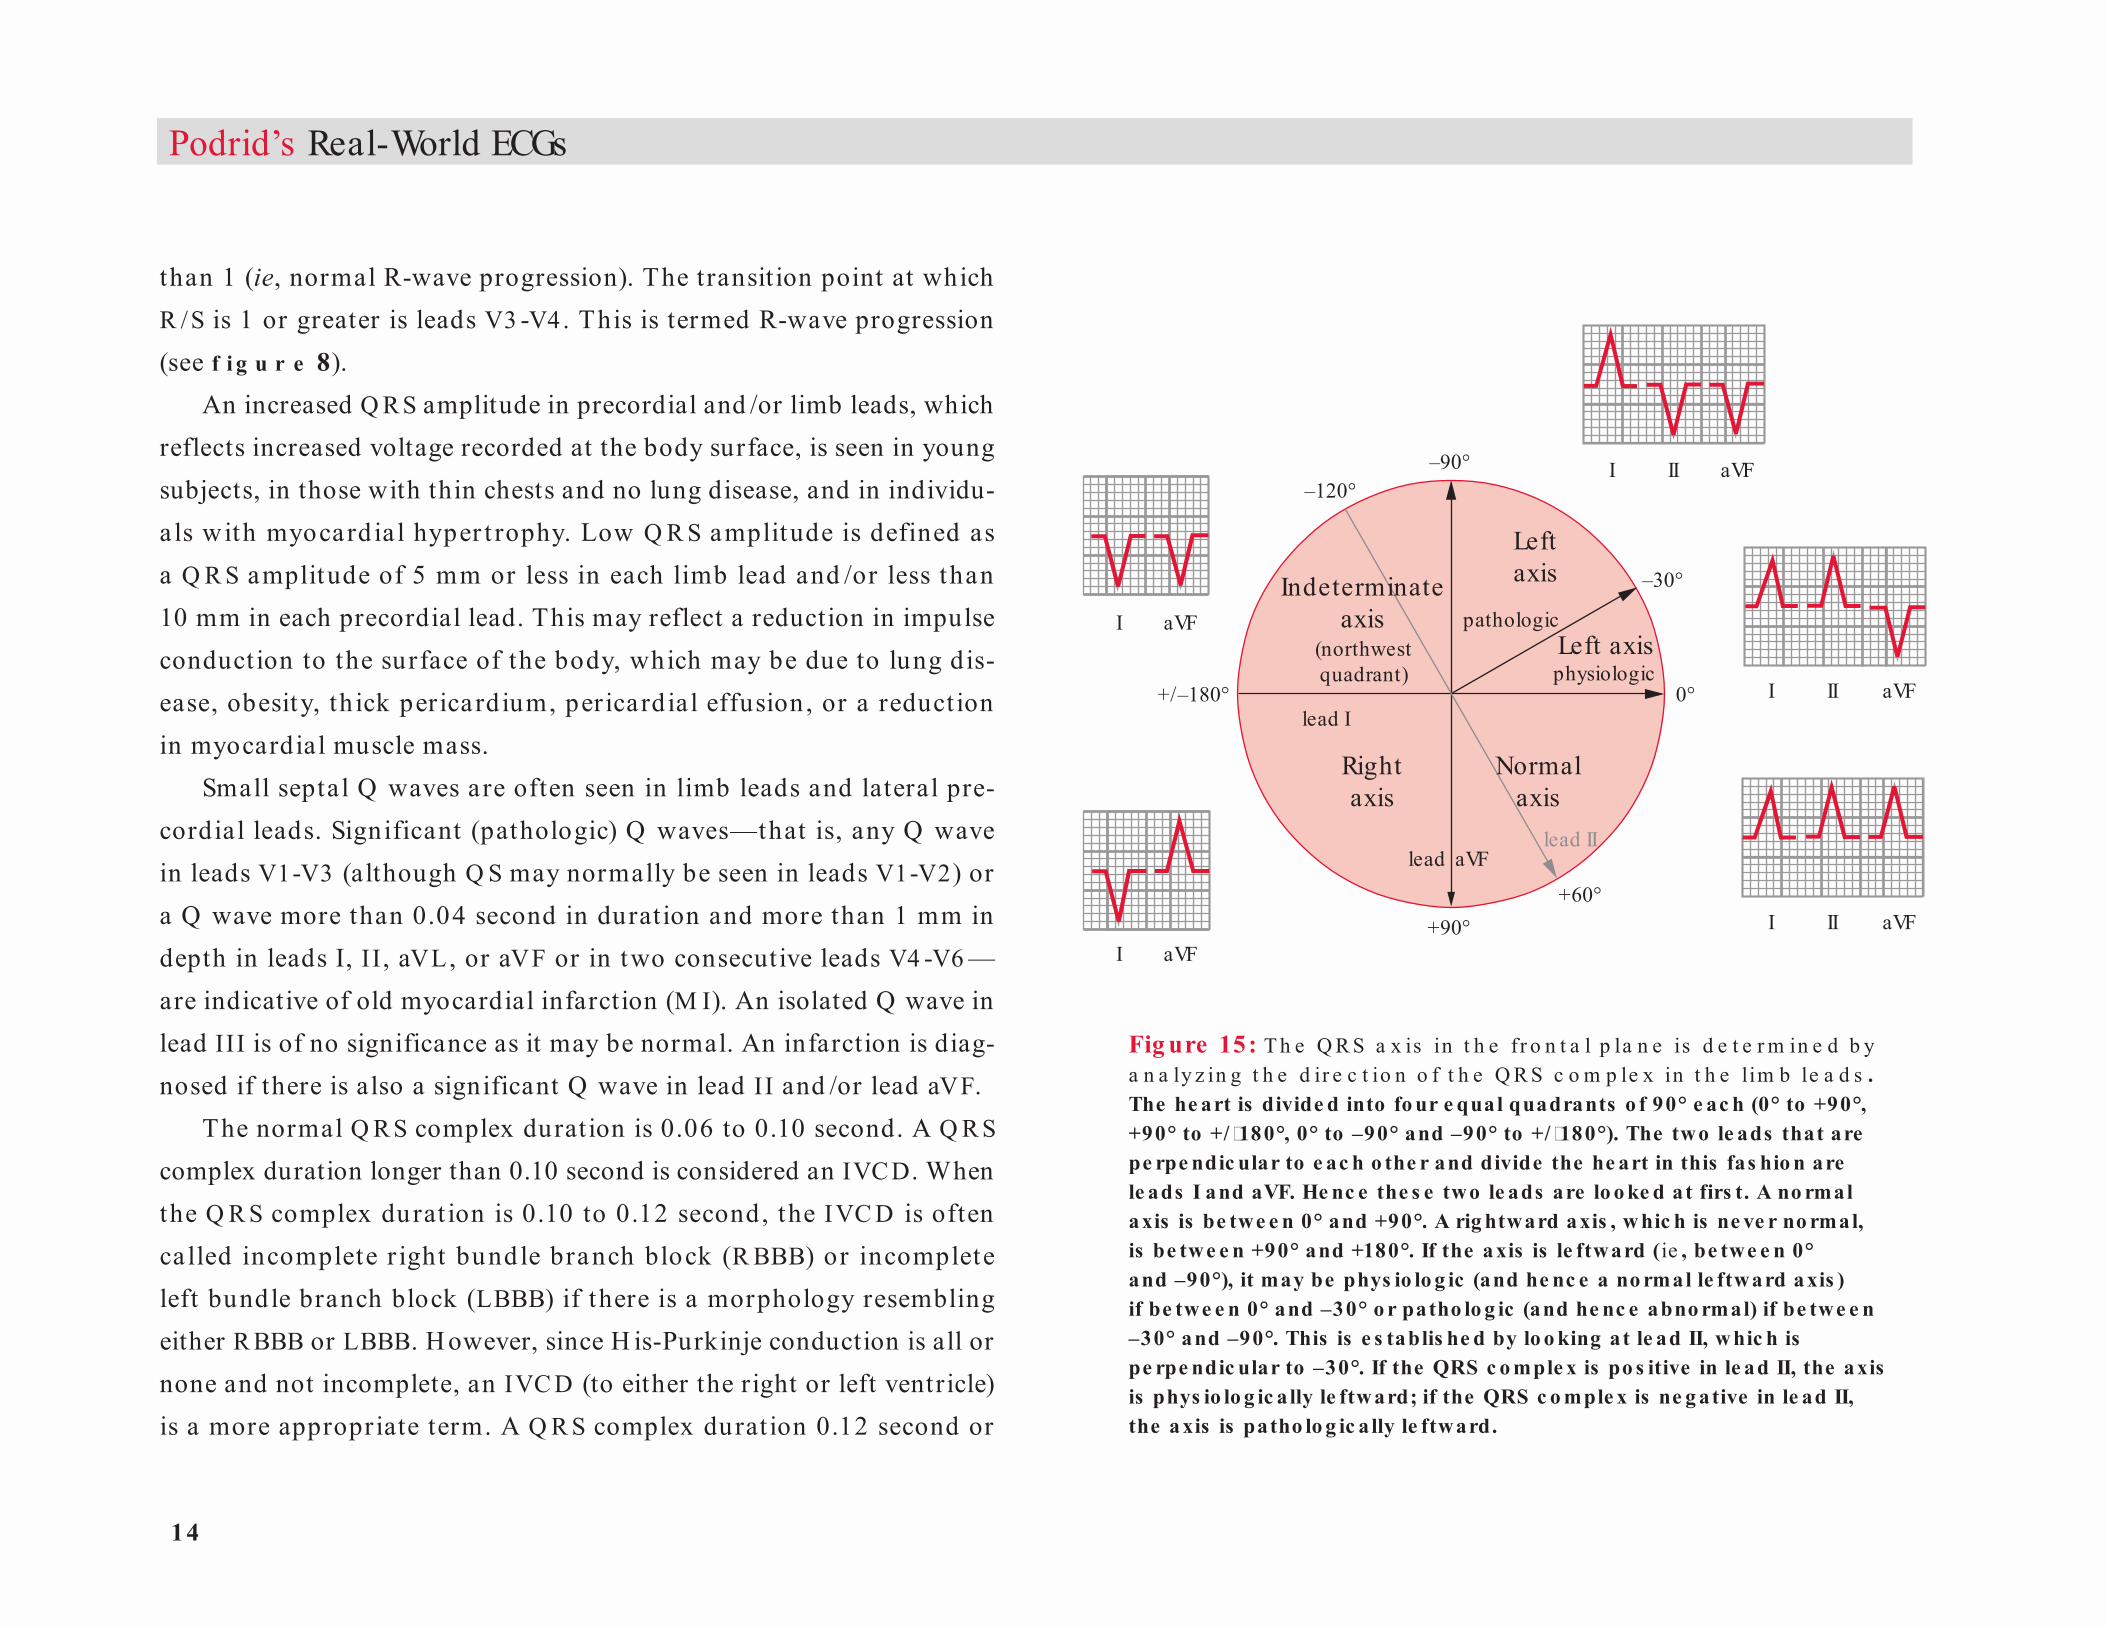
Fig ure 15: T h e Q R S a x is in t h e fr o n t a l p la n e is d e t e r m in e d b y a n a ly z in g t h e d ir e c t io n o f t h e Q R S c o m p le x in t h e lim b le a d s . The he art is divide d into fo ur e qual quadrants o f 90° e ac h (0° to +90°, +90° to +/�180°, 0° to –90° and –90° to +/�180°). The two le ads that are pe rpe ndic ular to e ac h o the r and divide the he art in this fas hio n are le ads I and aVF. He nc e the s e two le ads are lo o ke d at firs t. A no rmal axis is be twe e n 0° and +90°. A rig htward axis , w hic h is ne ve r no rmal, is be twe e n +90° and +180°. If the axis is le ftward (ie , be twe e n 0° and –90°), it may be phys io lo g ic (and he nc e a no rmal le ftward a xis ) if be twe e n 0° and –30° o r patho lo g ic (and he nc e abno rmal) if be twe e n –30° and –90°. This is e s tablis he d by lo o king at le ad II, w hic h is pe rpe ndic ular to –30°. If the QRS c o mple x is po s itive in le ad II, the axis is phys io lo g ic a lly le ftward; if the QRS c o mple x is ne g ative in le ad II, the axis is patho lo g ic a lly le ftward.
1 5
longer occurs with R BBB or LBBB; bundle branch blocks are associ-ated with a specific Q R S complex morphology. When the Q RS complex morphology is without a specific pat tern of a bundle branch block , it is an I VC D. A Q R S complex du rat ion of 0 .16 to 0 .22 second is often seen with severe cardiomyopathy, drug effect , or hyperkalemia. When the Q R S complex durat ion is 0.24 second or longer, the cause is hyperkalemia.
Q RS Axis Frontal PlaneThe Q R S ax is in the fronta l plane is determined by ana lysis of the Q R S complex direction in the limb leads (f i g u r e 15). The axis may be normal, leftward, r ightward , or indeterminate, as established by an init ial analysis of leads I and aVF, which are perpendicular to each other and divide the hear t into four equal quadrants (0° to +90°, +90° to ±180°, 0° to –90° and –90° to +/-180°). An impulse going toward the left (toward 0°) is posit ive in lead I, and an impulse going toward the right (toward +180°) is negative in lead I. An impulse directed toward the foot (toward +90°) is posit ive in lead aVF, and an impulse directed away from the foot (toward –90°) is negative in lead aVF.
A normal ax is is 0° to +90°. In th is situat ion the Q R S complex is positive in leads I and aVF. A leftward axis is 0° to –90° (the Q R S com-plex is positive in lead I and negative in lead aVF). H owever, a leftward ax is may be physiologic (normal) when it is between 0° and –30° or pathologic (abnormal) when it is between –30° and –90°. In the pres-ence of a left axis, therefore, lead II is evaluated, as it is perpendicular to –30°. An impulse that is directed toward the foot (less negative than
–30°) is posit ive in lead II, and an impulse that is directed away from the foot (more negative than –30°) is negative in lead II.
A physiologic left axis is 0° to –30° (the Q R S complex is positive in leads I and II and negative in lead aVF). An extreme or pathologic left axis is –30° to –90° (the Q R S complex is positive in lead I and negative in leads II and aVF, ie, rS complex). This is referred to as a left anterior fascicular block (LAFB). H owever, it is impor tant to exclude inferior wall M I as a cause for left axis (ie, Q r complex in leads II and aVF). An LAFB cannot be established in the presence of an inferior wall M I. Limb lead switch must also be excluded.
A r ight a x is is b et ween +90 ° a nd +180 ° (t he Q R S complex is negat ive in lead I, ie, rS complex , and posit ive in lead aVF). This is referred to as a left posterior fascicular block (LPFB). H owever, other causes for a r ight ax is must be excluded , including a latera l M I (Q r complex in leads I and aV L), r ight vent r icu la r hyper t rophy (RV H ), Wolff-Parkinson-White pat tern, dextrocardia, or right-to-left arm lead switch. An indeterminate ax is, between –90° and + /-180° (the Q R S complex is negat ive in leads I and aVF), is either an extreme leftward ax is or an ex treme r ightward ax is. There is no conduction sequence through the normal H is-Purkinje system that will be associated with an indeterminate axis. H ence an indeterminate axis is seen whenever two abnormalit ies co-ex ist . For example, RVH , which is associated with a right axis, may co-exist with an LAFB, which is associated with a marked left axis, resulting in an indeterminate axis. O ther situations include a lateral wall M I (with deep Q waves in leads I and aVL), which will present as a right axis, associated with an LAFB; a lateral wall M I
The Basics: Introduction
1 6
Podrid’s Real-World ECGs
V1
Chest leads V1 to V6
Clockwise rotation (late transition)
Counterclockwise rotation (early transition)
+ + ++
+
+
V2 V3V4
V5
V6
––
––
– –– – – – – –
associated with an inferior wall M I (deep Q waves in leads II and aVF), which will have a left axis; or an inferior wall M I associated with an LPFB, which causes a r ight ax is. An indeterminate ax is is a lso seen when there is direct myocardial activation, such as with a ventricular complex, Wolff-Parkinson-White pat tern, or a paced complex.
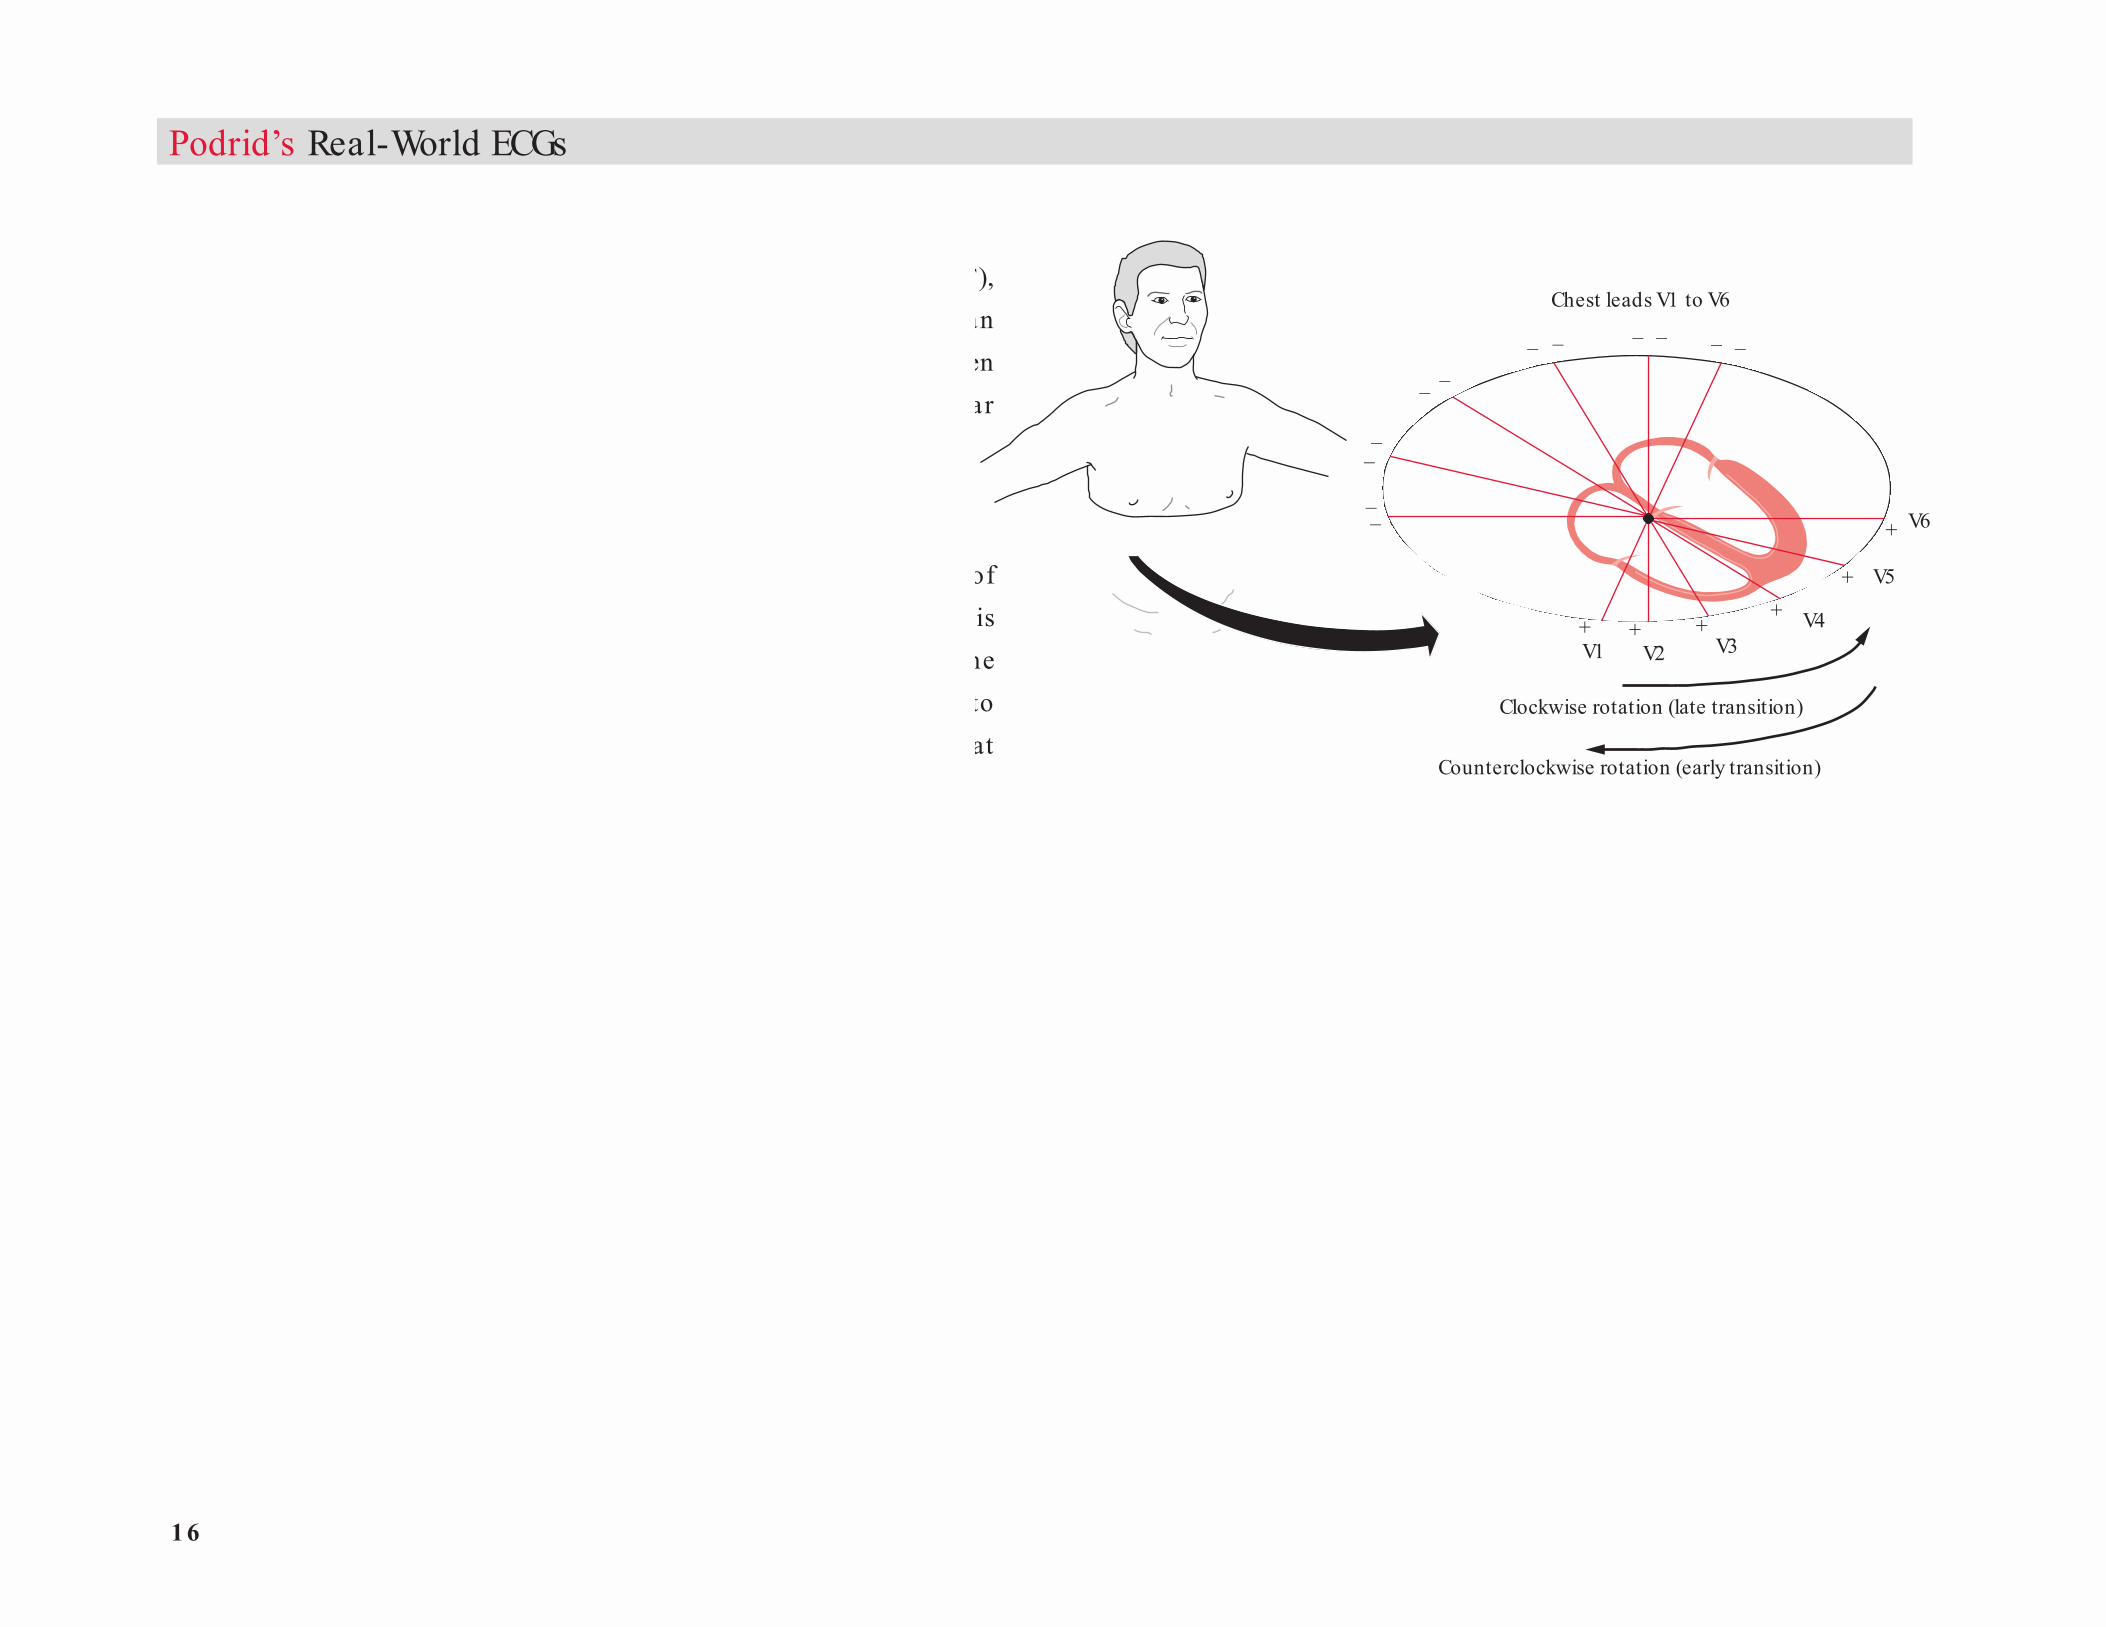
Horizontal PlaneThe Q R S ax is in the hor izonta l plane is determined by ana lysis of the Q R S complex direction in the precordial leads (f i g u r e 16). This ax is is established by imagin ing the hear t as viewed from under the diaphragm (ie, the right ventricle is anterior and the left ventricle is to the left). H ere, the normal Q R S t ransit ion point (R / S > 1) occurs at leads V3 -V4. Clockwise rotat ion is present when the left vent r icular electrical forces are shifted to the back and seen late in the precordial leads. Therefore, there is poor R-wave progression with late transition. R-wave amplitude increases slowly across the precordium, and the tran-sit ion (R /S > 1) is later, between leads V4 and V6 . Counterclockwise rotation is present when the left ventricular electrical forces are shifted anteriorly and seen early in the precordial leads. There is early t ransi-t ion (R /S > 1 in lead V2) or a tall R wave in lead V2 .
Beat-to-beat changes in the Q R S axis and /or amplitude are called electrical (or Q R S) alternans. There may also be beat-to-beat changes in T-wave amplitude /morphology, ie, T-wave alternans.
ST Segment The ST segment begins at the J point (the point of transition at the end of the Q R S complex and the beginning of the ST segment) and ends
at the onset of T wave (f i g u r e 17 ). It represents the period of t ime between the end of depolarization and the beginning of repolarization. The normal ST segment is slight ly concave. The J point and ST seg-ment are usually isoelectr ic or at zero potent ial, which is established by the T P segment. If the T P segment cannot be identified, as with a t achy card ia (when the T and P waves a re on top of each other), the PR segment is used to establish the isoelectric baseline.
Fig ure 16: T h e Q R S a x is in t h e h o r iz o n t a l p la n e is d e t e r m in e d b y a n a ly z in g t h e d ir e c t io n o f t h e Q R S c o m p le x in t h e p r e c o r d ia l le a d s . This is e s tablis he d by imag ining the he art as vie we d fro m unde r the diaphrag m. With c lo c kw is e ro tatio n, the le ft ve ntric ular fo rc e s are s e e n la te r in the pre c o rdia l le ads . This pre s e nts w ith po o r R�wave pro g re s s io n and la te trans itio n. With c o unte rc lo c kw is e ro tatio n, le ft ve ntric ular fo rc e s de ve lo p e arlie r in the pre c o rdial le ads . This pre s e nts w ith a ta ll R wave in le ad V2 , w hic h is te rme d e arly trans itio n.
17
B. J-point depression
F. ST-segment elevation(>_1 mm)
A. Normal ST segment C. Upsloping ST-segment depression(>_1.5 mm at 80 msec)
80msec
E. Downsloping ST-segment depression(>_1 mm)
D. Horizontal ST-segment depression(>_1 mm)
The Basics: Introduction
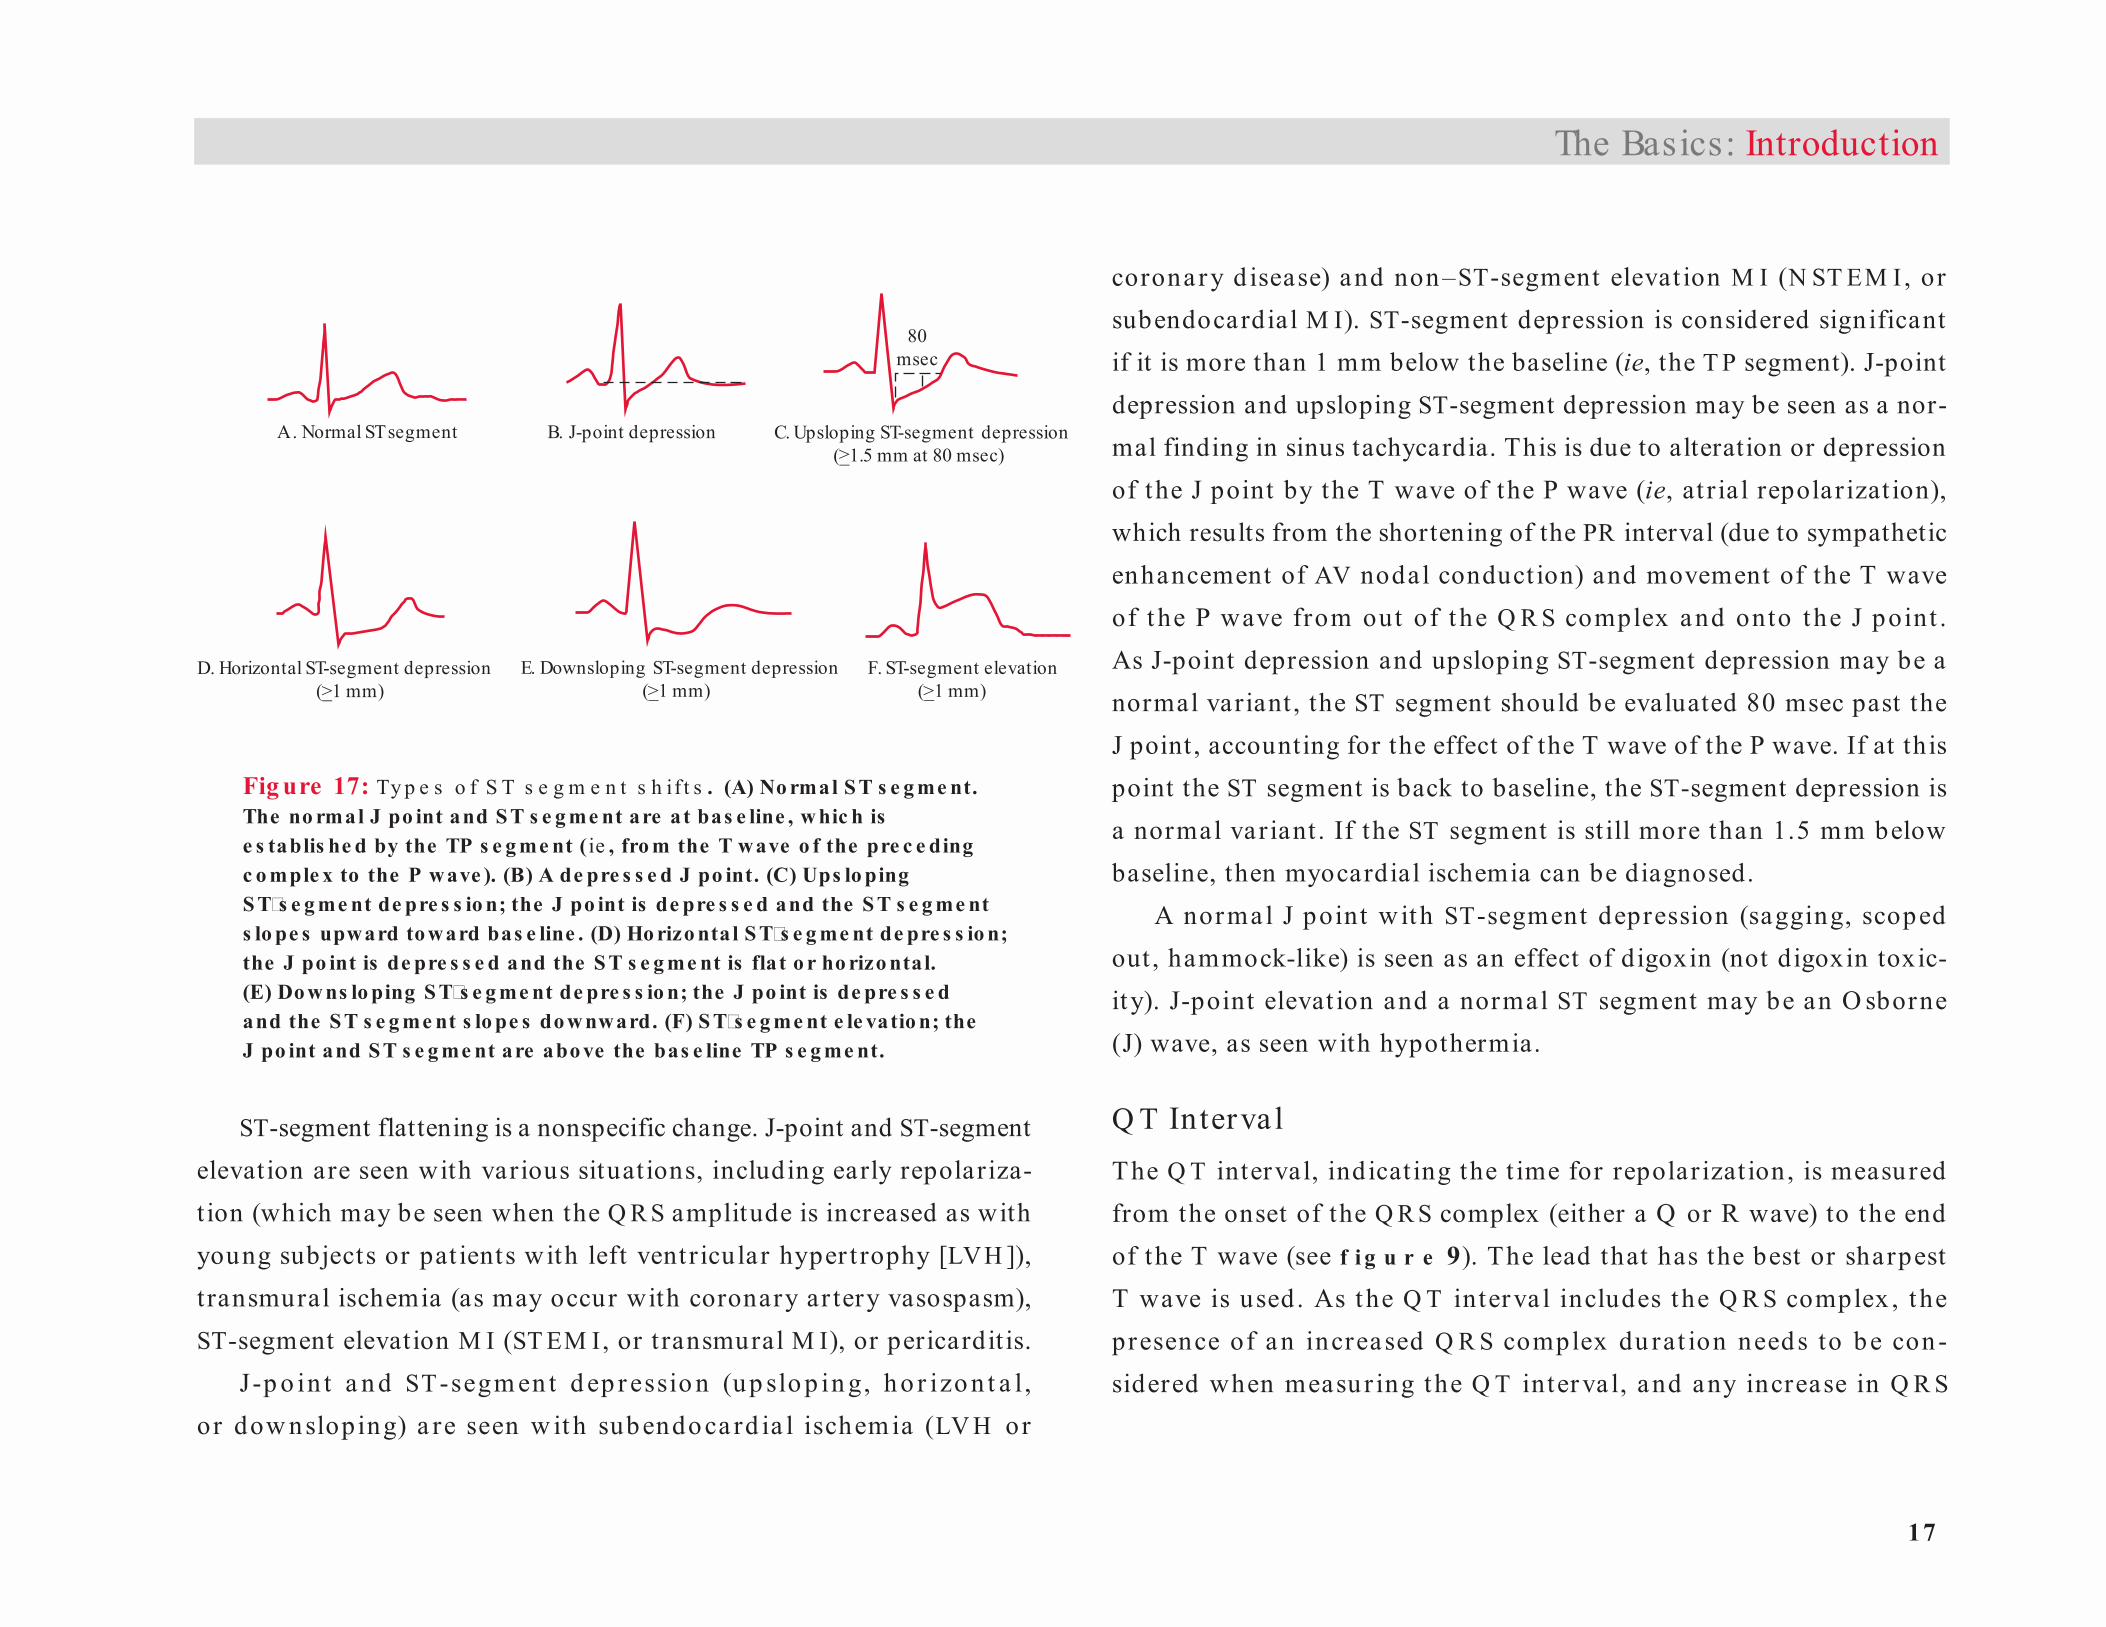
ST-segment flattening is a nonspecific change. J-point and ST-segment elevation are seen with various situations, including early repolariza-t ion (which may be seen when the Q R S amplitude is increased as with young subjects or pat ients with left ventr icular hyper t rophy [LVH ]), t ransmural ischemia (as may occur with coronary ar tery vasospasm), ST-segment elevation M I (ST EM I, or t ransmural M I), or pericardit is.
J-p o in t a n d ST-segm en t d ep r essio n (up slo p in g, ho r izo n t a l , or dow nsloping) a re seen w it h subendoca rd ia l ischem ia (LV H or
coronary d isease) and non–ST-segment elevat ion M I (N ST EM I, or subendo cardial M I). ST-segment depression is considered significant if it is more than 1 mm below the baseline (ie, the T P segment). J-point depression and upsloping ST-segment depression may be seen as a nor-mal finding in sinus tachycardia. This is due to alteration or depression of the J point by the T wave of the P wave (ie, at r ia l repolar izat ion), which results from the shortening of the PR interval (due to sympathetic enhancement of AV nodal conduct ion) and movement of the T wave of t he P wave from out of t he Q R S complex and onto the J point . As J-point depression and upsloping ST-segment depression may be a normal variant , the ST segment should be evaluated 80 msec past the J point , accounting for the effect of the T wave of the P wave. If at this point the ST segment is back to baseline, the ST-segment depression is a normal variant . If the ST segment is st ill more than 1.5 mm below baseline, then myocardial ischemia can be diagnosed.
A normal J point with ST-segment depression (sagging, scoped out , hammock-like) is seen as an effect of digoxin (not digoxin toxic-ity). J-point elevat ion and a normal ST segment may be an O sborne (J) wave, as seen with hypothermia.
Q T Interva l The Q T interval, indicat ing the t ime for repolar izat ion, is measured from the onset of the Q R S complex (either a Q or R wave) to the end of the T wave (see f i g u r e 9). The lead that has the best or sharpest T wave is used. As the Q T interva l includes the Q R S complex , the presence of a n increased Q R S complex du rat ion needs to be con-sidered when measu r ing the Q T inter va l, and any increase in Q R S
Fig ure 17: Ty p e s o f S T s e g m e n t s h if t s . (A) No rmal S T s e g me nt. The no rmal J po int and ST s e g me nt are at bas e line , w hic h is e s tablis he d by the TP s e g me nt ( ie , fro m the T wave o f the pre c e ding c o mple x to the P wave ). (B) A de pre s s e d J po int. (C) Ups lo ping S T�s e g me nt de pre s s io n; the J po int is de pre s s e d and the S T s e g me nt s lo pe s upward to ward bas e line . (D) Ho rizo nta l S T�s e g me nt de pre s s io n; the J po int is de pre s s e d and the S T s e g me nt is fla t o r ho rizo ntal. (E) Do w ns lo ping S T�s e g me nt de pre s s io n; the J po int is de pre s s e d and the S T s e g me nt s lo pe s do w nward. (F) S T�s e g me nt e le vatio n; the J po int and ST s e g me nt are abo ve the bas e line TP s e g me nt.
1 8
Podrid’s Real-World ECGs
Normal T wave Hyperacute T wave
complex durat ion (msec) above normal (ie, 0.06 to 0.10 sec) needs to be subtracted from the Q T-interval measurement. Thereafter, the Q T
interval needs to be corrected for hear t rate. The normal Q TC is 0.44 to 0.48 second or less.
A long Q T interva l may resu lt from delayed or prolonged repo-la r izat ion. With delayed repolar izat ion, the ST-segment durat ion is long while the T-wave duration is normal. This is seen with metabolic abnormalit ies, par t icularly low calcium or low magnesium levels. In prolonged repolar izat ion, the ST segment is normal in durat ion but the T wave is broad or prolonged. This is due to drugs (acquired Q T
prolongat ion) or a genet ic abnormalit y producing a channelopathy (congenital long Q T syndrome). Congenital Q T prolongation may have a prominent U wave interrupting the T wave (Q T-U wave).
A short Q T interval is due to a metabolic abnormality (high calcium or high magnesium levels) or a congenital shor t Q T syndrome.
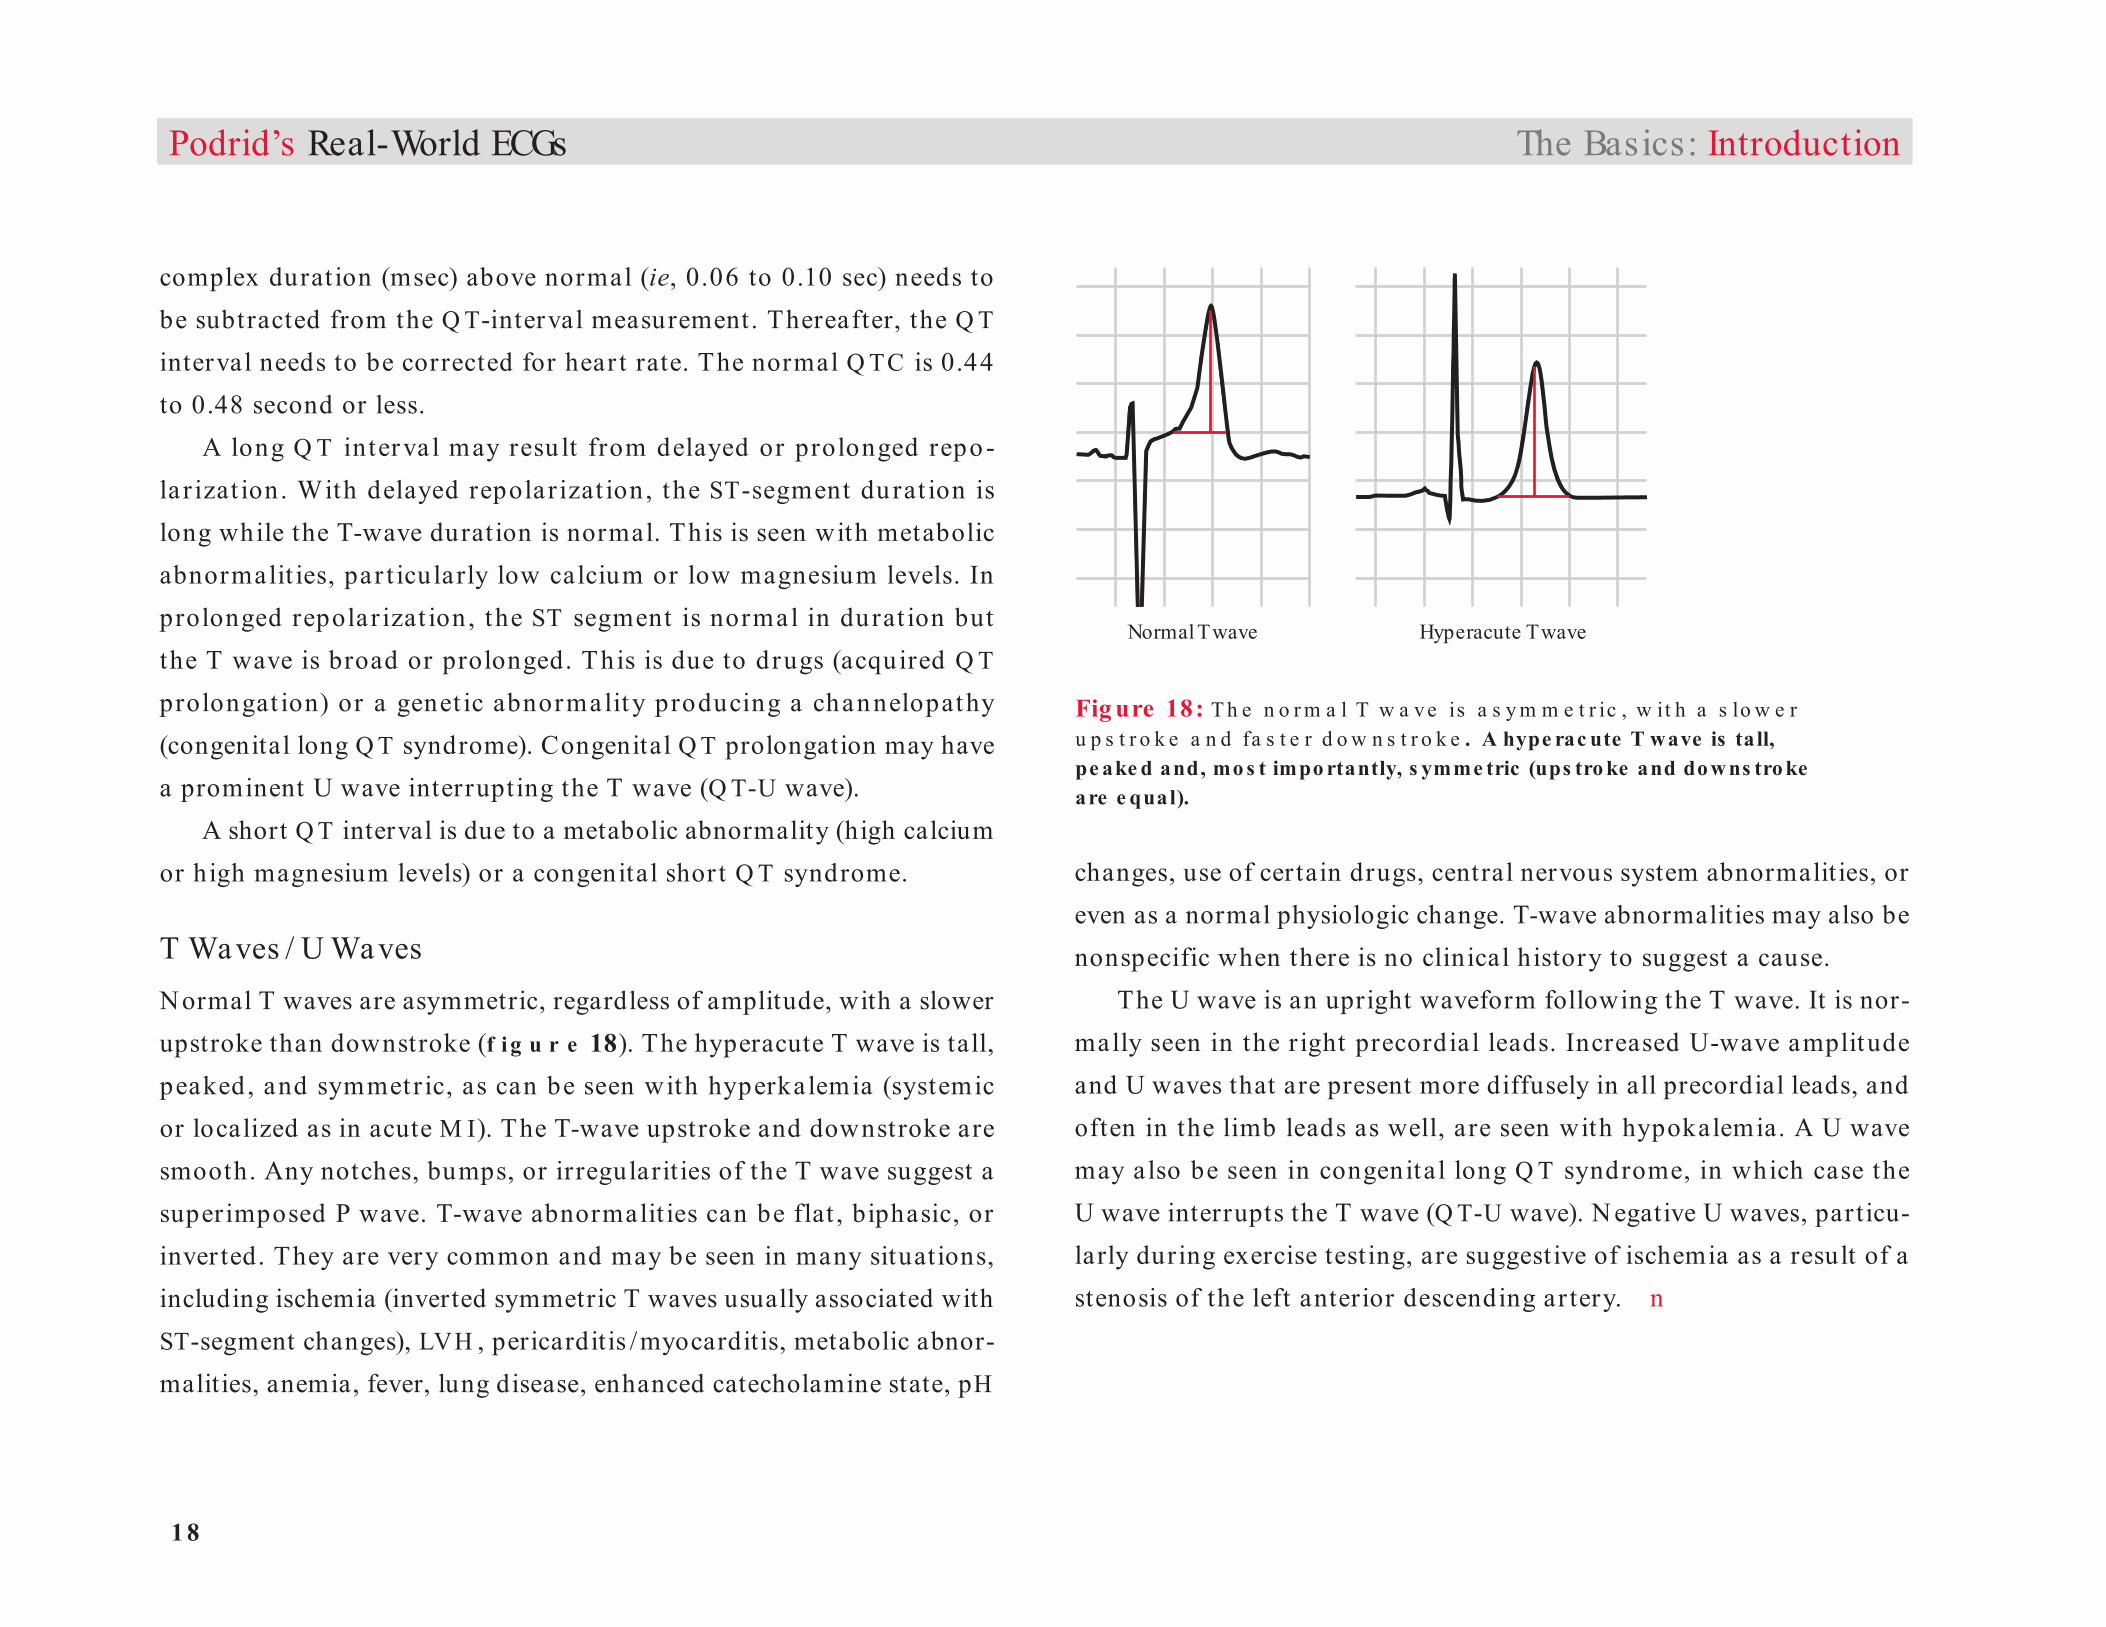
T Waves / U WavesNormal T waves are asymmetric, regardless of amplitude, with a slower upstroke than downstroke (f i g u r e 18). The hyperacute T wave is tall, peaked, and symmetr ic, as can be seen with hyperkalemia (systemic or localized as in acute M I). The T-wave upstroke and downstroke are smooth. Any notches, bumps, or irregularit ies of the T wave suggest a superimposed P wave. T-wave abnormalit ies can be flat , biphasic, or inver ted. They are very common and may be seen in many situations, including ischemia (inverted symmetric T waves usually associated with ST-segment changes), LVH , pericarditis /myocarditis, metabolic abnor-malities, anemia, fever, lung disease, enhanced catecholamine state, pH
changes, use of certain drugs, central nervous system abnormalities, or even as a normal physiologic change. T-wave abnormalities may also be nonspecific when there is no clinical history to suggest a cause.
The U wave is an upright waveform following the T wave. It is nor-mally seen in the r ight precordial leads. Increased U-wave amplitude and U waves that are present more diffusely in all precordial leads, and often in the limb leads as well, are seen with hypokalemia. A U wave may also be seen in congenital long Q T syndrome, in which case the U wave interrupts the T wave (Q T-U wave). N egative U waves, particu-larly during exercise testing, are suggestive of ischemia as a result of a stenosis of the left anterior descending ar tery. n
Fig ure 18: T h e n o r m a l T w a ve is a s y m m e t r ic , w it h a s lo w e r u p s t r o k e a n d fa s t e r d o w n s t r o k e . A hype rac ute T wave is ta ll, pe ake d and, mo s t impo rtantly, s ymme tric (ups tro ke and do w ns tro ke are e qual).
The Basics: Introduction
1
Introduction Myocardial Abnormalities
The surface electrocardiogram (ECG) is often used to diagnose abnor-
malities of the atrial and ventricular myocardium, including hypertrophy,
ischemia, infarction, and inflammation (myocarditis/pericarditis).
Hypertrophy
Left Ventricular Hypertrophy
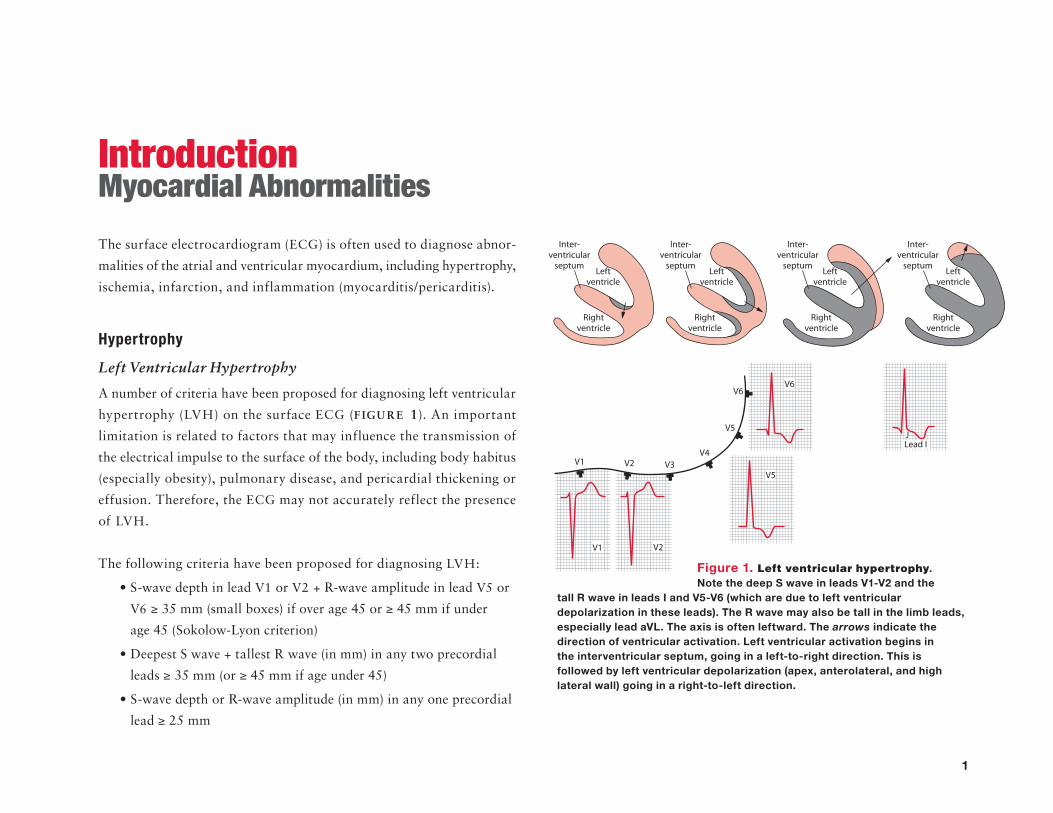
A number of criteria have been proposed for diagnosing left ventricular
hypertrophy (LVH) on the surface ECG (F IGURE 1). An important
limitation is related to factors that may influence the transmission of
the electrical impulse to the surface of the body, including body habitus
(especially obesity), pulmonary disease, and pericardial thickening or
effusion. Therefore, the ECG may not accurately reflect the presence
of LVH.
The following criteria have been proposed for diagnosing LVH:
V1 or V2 + R-wave amplitude in lead V5 or
V6 ≥ 35 mm (small boxes) if over age 45 or ≥ 45 mm if under
age 45 (Sokolow-Lyon criterion)
leads ≥ 35 mm (or ≥ 45 mm if age under 45)
lead ≥ 25 mm
Inter-ventricular
septum
Rightventricle
Leftventricle
Inter-ventricular
septum
Rightventricle
Leftventricle
Inter-ventricular
septum
Rightventricle
Leftventricle
Inter-ventricular
septum
Rightventricle
Leftventricle
V4
V3V2V1
V5
V6V6
JLead I
V5
V2V1
Figure 1. Left ventricular hypertrophy. Note the deep S wave in leads V1-V2 and the
tall R wave in leads I and V5-V6 (which are due to left ventricular depolarization in these leads). The R wave may also be tall in the limb leads, especially lead aVL. The axis is often leftward. The arrows indicate the direction of ventricular activation. Left ventricular activation begins in the interventricular septum, going in a left-to-right direction. This is followed by left ventricular depolarization (apex, anterolateral, and high lateral wall) going in a right-to-left direction.
2
Podrid’s Real-World ECGs
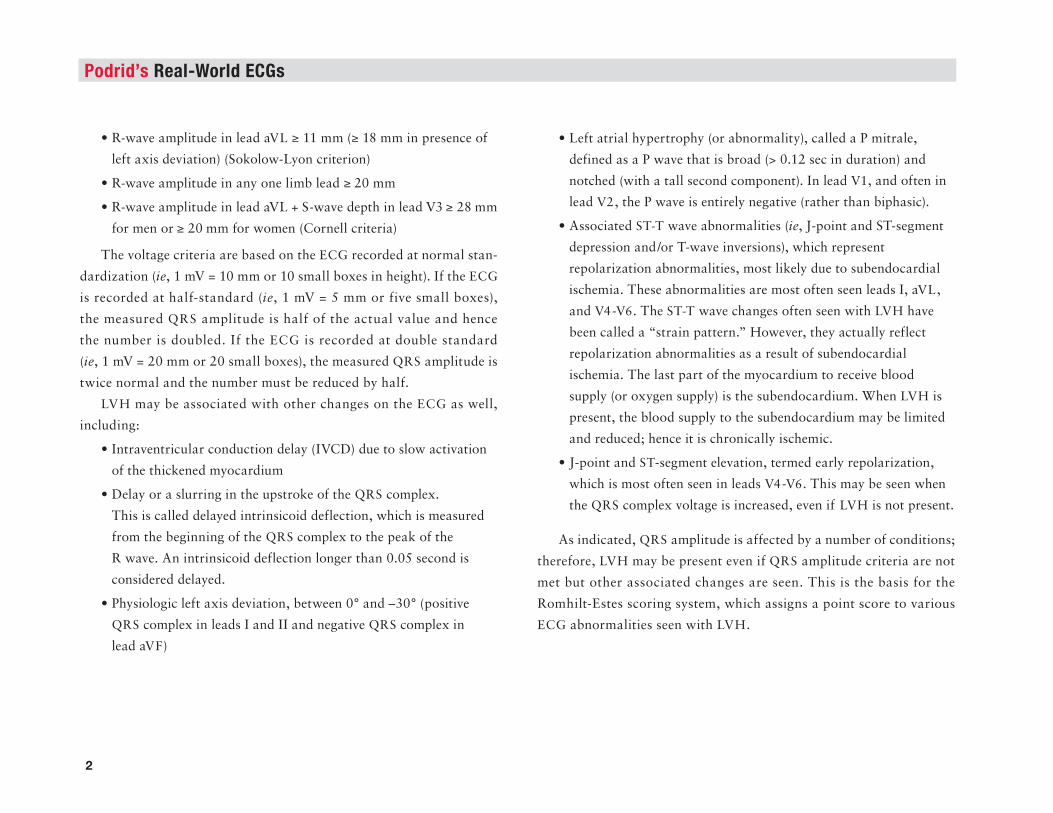
VL ≥ 11 mm (≥ 18 mm in presence of
left axis deviation) (Sokolow-Lyon criterion)
≥ 20 mm
≥ 28 mm
for men or ≥ 20 mm for women (Cornell criteria)
The voltage criteria are based on the ECG recorded at normal stan-
dardization (ie, 1 mV = 10 mm or 10 small boxes in height). If the ECG
is recorded at half-standard (ie, 1 mV = 5 mm or five small boxes),
the measured QRS amplitude is half of the actual value and hence
the number is doubled. If the ECG is recorded at double standard
(ie, 1 mV = 20 mm or 20 small boxes), the measured QRS amplitude is
twice normal and the number must be reduced by half.
LVH may be associated with other changes on the ECG as well,
including:
of the thickened myocardium
QRS complex.
This is called delayed intrinsicoid deflection, which is measured
from the beginning of the QRS complex to the peak of the
R wave. An intrinsicoid deflection longer than 0.05 second is
considered delayed.
QRS complex in leads I and II and negative QRS complex in
lead aVF)
defined as a P wave that is broad (> 0.12 sec in duration) and
notched (with a tall second component). In lead V1, and often in
lead V2, the P wave is entirely negative (rather than biphasic).
ST-T wave abnormalities (ie, J-point and ST-segment
depression and/or T-wave inversions), which represent
repolarization abnormalities, most likely due to subendocardial
ischemia. These abnormalities are most often seen leads I, aVL,
and V4-V6. The ST-T wave changes often seen with LVH have
been called a “strain pattern.” However, they actually reflect
repolarization abnormalities as a result of subendocardial
ischemia. The last part of the myocardium to receive blood
supply (or oxygen supply) is the subendocardium. When LVH is
present, the blood supply to the subendocardium may be limited
and reduced; hence it is chronically ischemic.
ST-segment elevation, termed early repolarization,
which is most often seen in leads V4-V6. This may be seen when
the QRS complex voltage is increased, even if LVH is not present.
As indicated, QRS amplitude is affected by a number of conditions;
therefore, LVH may be present even if QRS amplitude criteria are not
met but other associated changes are seen. This is the basis for the
Romhilt-Estes scoring system, which assigns a point score to various
ECG abnormalities seen with LVH.
3
Romhilt-Estes Scoring System
Romhilt-Estes Criterion Points
R-wave height or S-wave depth in any limb lead ≥ 20 mm 3
OR
S-wave depth in lead V1 or V2 ≥ 30 mm
OR
R-wave height in lead V5 or V6 ≥ 30 mm
ST-T wave changes typical of LVH
Taking digoxin 1
Not taking digoxin 3
Left atrial hypertrophy
(terminal force in lead V1 ≥ 1 mm in depth and > 0.04 sec in duration) 3
Left axis deviation (< ) 2
QRS duration ≥ 90 ms (ie, IVCD) 1
Intrinsicoid deflection in lead V5 or V6 > 0.05 sec 1
A point score of ≥ 5 indicates definite LVH;
a point score of 4 is probable LVH.
Right Ventricular Hypertrophy
The mass of the left ventricular myocardium is far greater than that of
the right ventricle. Hence the QRS complex primarily reflects depolari-
zation of the left ventricular myocardium. Since depolarization occurs
simultaneously in the left and right ventricles, manifestations of right
ventricular depolarization are not usually seen. However, evidence of
right ventricular depolarization may be seen when there is a signifi-
cant increase in right ventricular myocardial mass (ie, right ventricular
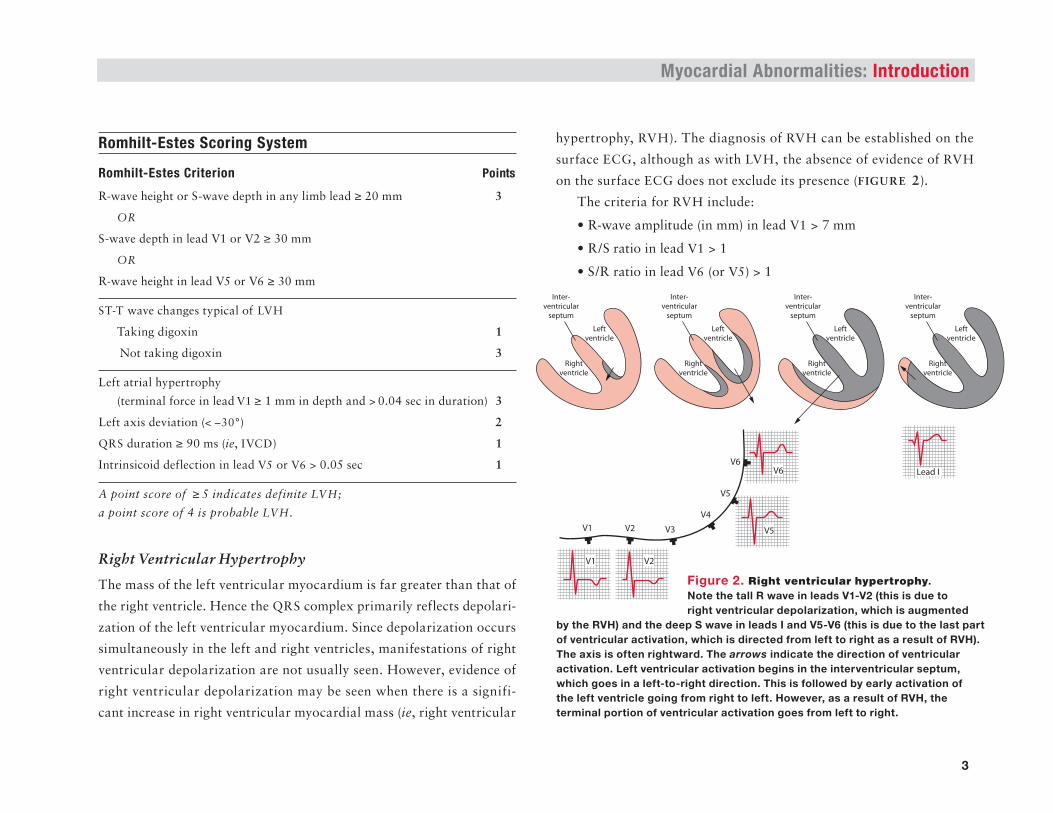
hypertrophy, RVH). The diagnosis of RVH can be established on the
surface ECG, although as with LVH, the absence of evidence of RVH
on the surface ECG does not exclude its presence (FIGURE 2).
The criteria for RVH include:
V1 > 7 mm
V1 > 1
V6 (or V5) > 1
Myocardial Abnormalities: Introduction
V4
V3V2V1
V5
V6
V1 V2
V5
V6 Lead I
Rightventricle
Leftventricle
Rightventricle
Leftventricle
Rightventricle
Leftventricle
Rightventricle
Leftventricle
Inter-ventricular
septum
Inter-ventricular
septum
Inter-ventricular
septum
Inter-ventricular
septum
Figure 2. Right ventricular hypertrophy. Note the tall R wave in leads V1-V2 (this is due to right ventricular depolarization, which is augmented
by the RVH) and the deep S wave in leads I and V5-V6 (this is due to the last part of ventricular activation, which is directed from left to right as a result of RVH). The axis is often rightward. The arrows indicate the direction of ventricular activation. Left ventricular activation begins in the interventricular septum, which goes in a left-to-right direction. This is followed by early activation of the left ventricle going from right to left. However, as a result of RVH, the terminal portion of ventricular activation goes from left to right.
4
Podrid’s Real-World ECGs
Other ECG findings may help confirm the diagnosis:
≥
This is identified by a P wave that is narrow, tall, and peaked in
the limb leads (> 2.5 mm of height in lead II) and primarily
positive in lead V1 (and often V2).
ST-T wave abnormalities in leads V1-V3. As with
LVH, ST-T wave abnormalities represent chronic ischemia of the
subendocardial layer of the right ventricle.
However, other causes for a tall R wave in lead V1 need to be
considered and excluded before diagnosing RVH. These include a
posterior wall myocardial infarction (MI, usually associated with an
inferior wall MI), Wolff-Parkinson-White pattern (short PR interval
and widened QRS-delta wave), hypertrophic cardiomyopathy (sep-
tal hyper trophy with prominent septal Q waves in other leads), early
transition (counter clockwise rotation), Duchenne muscular dystrophy
(posterolateral infarction pattern), dextrocardia (reverse R-wave pro-
gression in leads V1-V6, right axis deviation, negative P wave in lead I),
lead switch (leads V1, V2, V3), recording of right-sided leads (reverse
R-wave progression in leads V1-V6), and a normal variant.
Normal P Wave
The P wave reflects depolarization of the right followed by the left
atrium (FIGURES 3, 4, AND 5). When the impulse is generated by the
sinus node, the direction of transmission is from right to left and from
the arms to the legs (downward direction), and the normal P wave
is positive (upright) in leads I, II, aVF, and V5-V6 and negative in
lead aVR. There is often a slight notch, reflecting right followed by
slightly delayed left atrial depolari zation. The P-wave duration is
0.12 second or less, and the amplitude is usually 0.25 mV (2.5 small
boxes) or less. The P wave is often biphasic (positive–negative) in
lead V1 (FIGURE 4). Since lead V1 sits over the right ventricle and right
atrium, the initial portion is positive, reflecting right atrial depolariza-
tion going toward lead V1 (positive) and then left atrial depolarization
going away from lead V1 (negative).
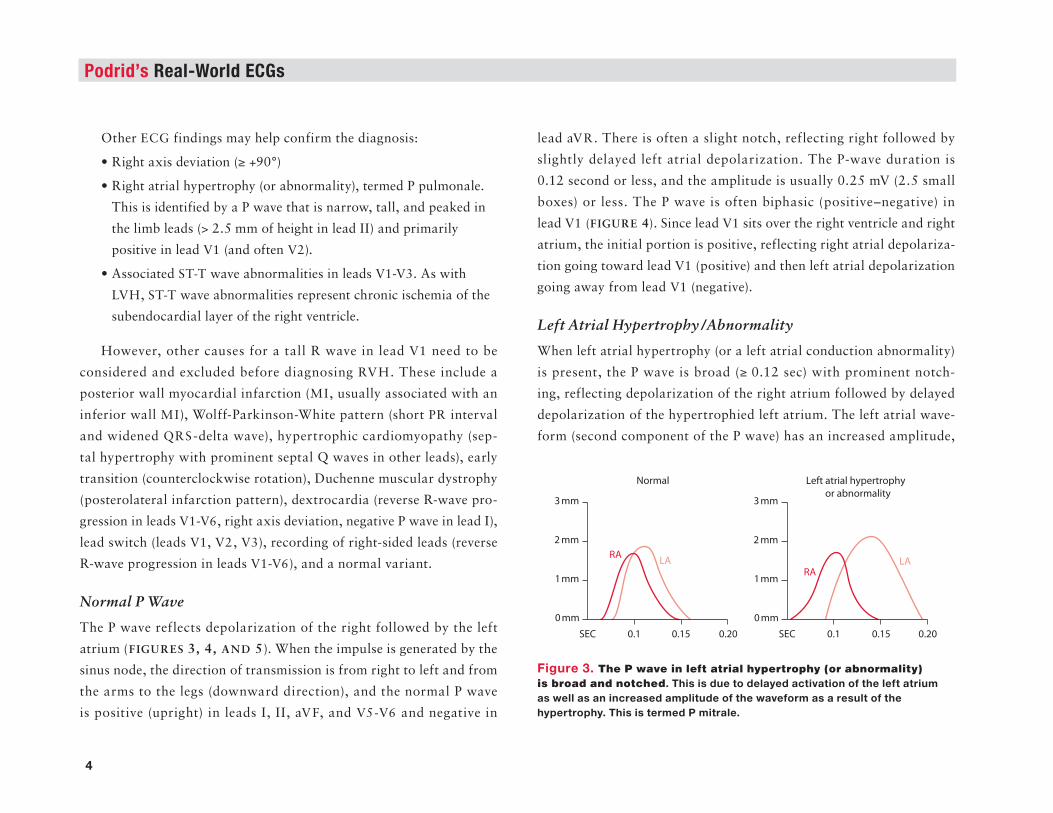
Left Atrial Hypertrophy /Abnormality
When left atrial hypertrophy (or a left atrial conduction abnormality)
is present, the P wave is broad (≥ 0.12 sec) with prominent notch-
ing, reflecting depolarization of the right atrium followed by delayed
depolarization of the hypertrophied left atrium. The left atrial wave-
form (second component of the P wave) has an increased amplitude,
RALA
RALA
0.1SEC
Normal
0.15 0.20 0.1SEC 0.15 0.20
3 mm
2 mm
1mm
0 mm
Left atrial hypertrophy
or abnormality3 mm
2 mm
1mm
0 mm
Figure 3. The P wave in left atrial hypertrophy (or abnormality) is broad and notched. This is due to delayed activation of the left atrium as well as an increased amplitude of the waveform as a result of the hypertrophy. This is termed P mitrale.

5
Right Atrial Hypertrophy /Abnormality
With right atrial hypertrophy, depolarization of the hypertrophied right
atrium is delayed, occurring simultaneously with left atrial depolari-
zation. The superimposed atrial waveforms result in a P wave that is
narrow, tall, and peaked as the right atrial waveform has an increased
amplitude, reflecting the hypertrophy (FIGURES 4 AND 5). This has
been termed P pulmonale. The etiology is either right-sided valvular
disease or pulmonary artery hypertension (primary or secondary from
lung disease or left ventricular abnormalities).
Also seen with right atrial hypertrophy is a P wave in lead V1 that
is predominantly positive (due to a right atrial impulse that is directed
toward lead V1) (FIGURE 4); this P-wave morphology may also be seen
in lead V2.
Myocardial Abnormalities: Introduction
Figure 5. The P wave in right atrial hypertrophy (or abnormality) is tall, narrow, and peaked. This is due to delayed activation of the right atrium and activation is superimposed on left atrial activation. As there is increased muscle mass, the amplitude of the right atrial waveform is also increased. This is termed P pulmonale.
RA
Lead II Lead V1
RA LA
LA
Combined
Normal
Right atrial
hypertrophy
or abnormality
RA
LA
RA
LA
RA LALeft atrial
hypertrophy
or abnormalityRA
RA
LA
LA
0.1SEC 0.15 0.20 0.1SEC 0.15 0.20
Normal
3 mm
2 mm
1mm
0 mm
Right atrial hypertrophy
or abnormality3 mm
2 mm
1mm
0 mmFigure 4. Appearance of the P wave in leads II and V1 in right and left atrial hypertrophy. The normal P wave in lead V1 is biphasic as the initial force (depolarization) is from the right atrium, going toward lead V1 (and hence a positive deflection), while left atrial depolarization is slightly later, going away from lead V1 and hence generating a negative waveform. With right atrial hypertrophy or abnormality, the depolarization is primarily toward lead V1, thereby generating a positive waveform. With left atrial hypertrophy or abnormality, the depolarization is primarily away from V1, thereby generating a negative waveform.
reflecting the hypertrophy (FIGURES 3 AND 4). This has been termed
P mitrale. It is seen in conditions that cause left atrial hypertrophy,
such as systemic hypertension, aortic stenosis, or mitral valve disease
(especially mitral stenosis).
Also seen with left atrial hypertrophy is a P wave in lead V1 that is
predominantly negative (ie, left atrial forces going away from lead V1)
(FIGURE 4); a prominent negative component of the P wave may be
seen also in leads V2-V3.
6
Podrid’s Real-World ECGs
Low QRS Complex Voltage
Low QRS complex voltage is defined as a QRS amplitude ≤ 5 mm in
each limb lead and /or ≤ 10 mm in each precordial lead. The low voltage
reflects reduced electrical activity measured at the surface of the body
and may be due to loss of myocardial muscle mass, pericardial effusion,
thickened pericardium, lung disease, or obesity.
ST-segment Changes
The normal ST segment is slightly concave and is at baseline, which is
always the TP segment. ST-segment flattening is a nonspecific change.
ST-segment depression or ST-segment elevation is of importance.
J-point and ST-segment depression (upsloping, horizontal, down-
sloping) are due to ischemia of the subendocardium, which is the first
part of the myocardium to become ischemic. There are a number of
causes of J-point and ST-segment elevation:
Transmural ischemia: ST-segment elevation in the absence of
Q waves; in the presence of Q waves (indicating a prior
transmural MI), ST-segment elevation most likely indicates a
wall motion abnormality
Acute MI: Localized ST-segment elevation; reciprocal ST-segment
depressions may be seen in other leads (ie, the ST-segment
change viewed from another direction); hyperacute T waves (tall,
peaked, and symmetric) are often present
Aneurysmal segment: Persistent ST-segment elevation after an MI
Pericarditis: Diffuse concave ST-segment elevation in all or
most leads; there are no reciprocal ST-segment changes and the
T waves are normal (asymmetric)
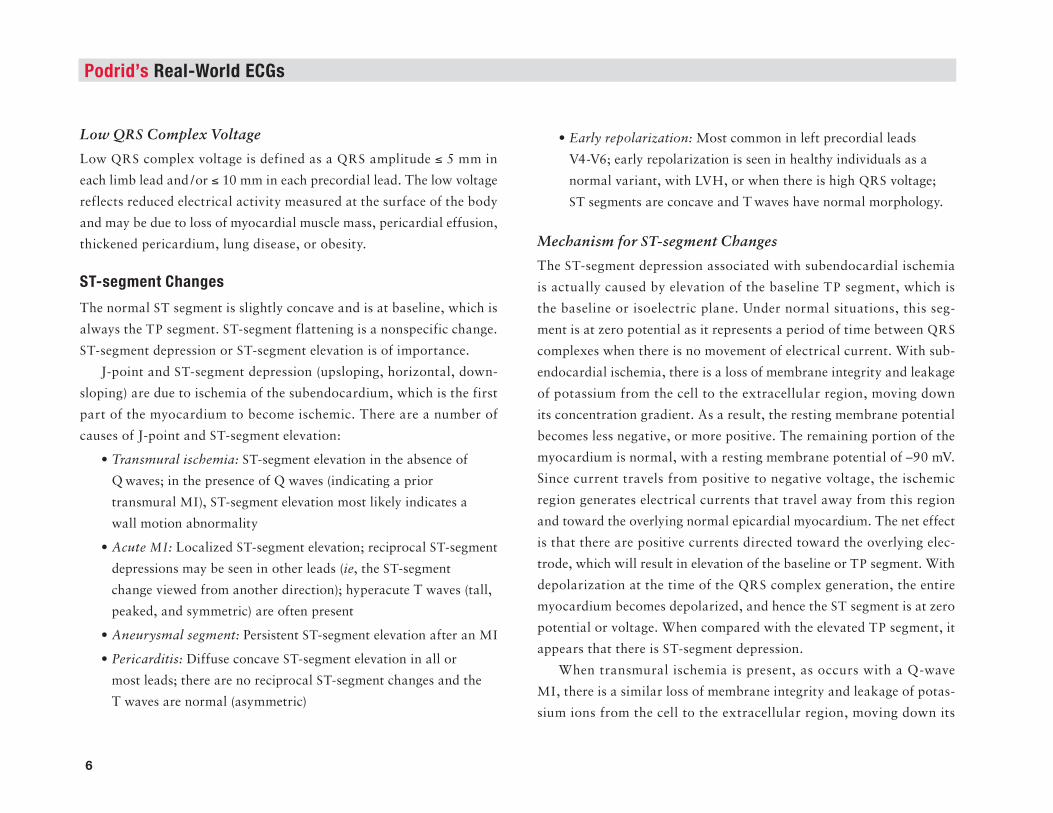
Early repolarization: Most common in left precordial leads
V4-V6; early repolarization is seen in healthy individuals as a
normal variant, with LVH, or when there is high QRS voltage;
ST segments are concave and T waves have normal morphology.
Mechanism for ST-segment Changes
The ST-segment depression associated with subendocardial ischemia
is actually caused by elevation of the baseline TP segment, which is
the baseline or isoelectric plane. Under normal situations, this seg-
ment is at zero potential as it represents a period of time between QRS
complexes when there is no movement of electrical current. With sub-
endocardial ischemia, there is a loss of membrane integrity and leakage
of potassium from the cell to the extracellular region, moving down
its concentration gradient. As a result, the resting membrane potential
becomes less negative, or more positive. The remaining portion of the
myocardium is normal, with a resting membrane potential of –90 mV.
Since current travels from positive to negative voltage, the ischemic
region generates electrical currents that travel away from this region
and toward the overlying normal epicardial myocardium. The net effect
is that there are positive currents directed toward the overlying elec-
trode, which will result in elevation of the baseline or TP segment. With
depolarization at the time of the QRS complex generation, the entire
myocardium becomes depolarized, and hence the ST segment is at zero
potential or voltage. When compared with the elevated TP segment, it
appears that there is ST-segment depression.
When transmural ischemia is present, as occurs with a Q-wave
MI, there is a similar loss of membrane integrity and leakage of potas-
sium ions from the cell to the extracellular region, moving down its
7
concentration gradient. As a result, the resting membrane potential
becomes less negative, or more positive, in the injured tissue. The adja-
cent normal myocardium has a normal resting membrane potential of
–90 mV. Since current travels from positive to negative voltage, the
ischemic region generates positive currents that travel away from the
entire ischemic region toward the normal myocardium. Hence the elec-
trical current travels away from the overlying electrode. In this situation
the baseline voltage, and hence the TP segment, will be more negative
(ie, there will be depression of the TP segment) in the leads overlying
the injured myocardium. With depolarization at the time of the QRS
complex, the entire myocardium becomes depolarized, and hence the
ST segment is at zero potential or voltage. When compared with the
depressed TP segment, it appears that there is ST-segment elevation.
Myocardial Ischemia
Myocardial ischemia (regardless of etiology) is diagnosed by the
presence of J-point and ST-segment depression, which ref lects
subendocardial ischemia. Since myocardial blood f low is from
epicardium to endocardium, the subendocardium is the last layer to
receive blood. As a result, it is the first part of the myocardium to
become ischemic when there is an increased oxygen demand or reduced
oxygen supply. The ST segment is compared with the baseline or
0 potential on the ECG (ie, TP segment). If the TP segment is not
obvious (as may happen with a sinus tachycardia where the T wave and
P wave merge), the PR segment can be used. Three types of ST-segment
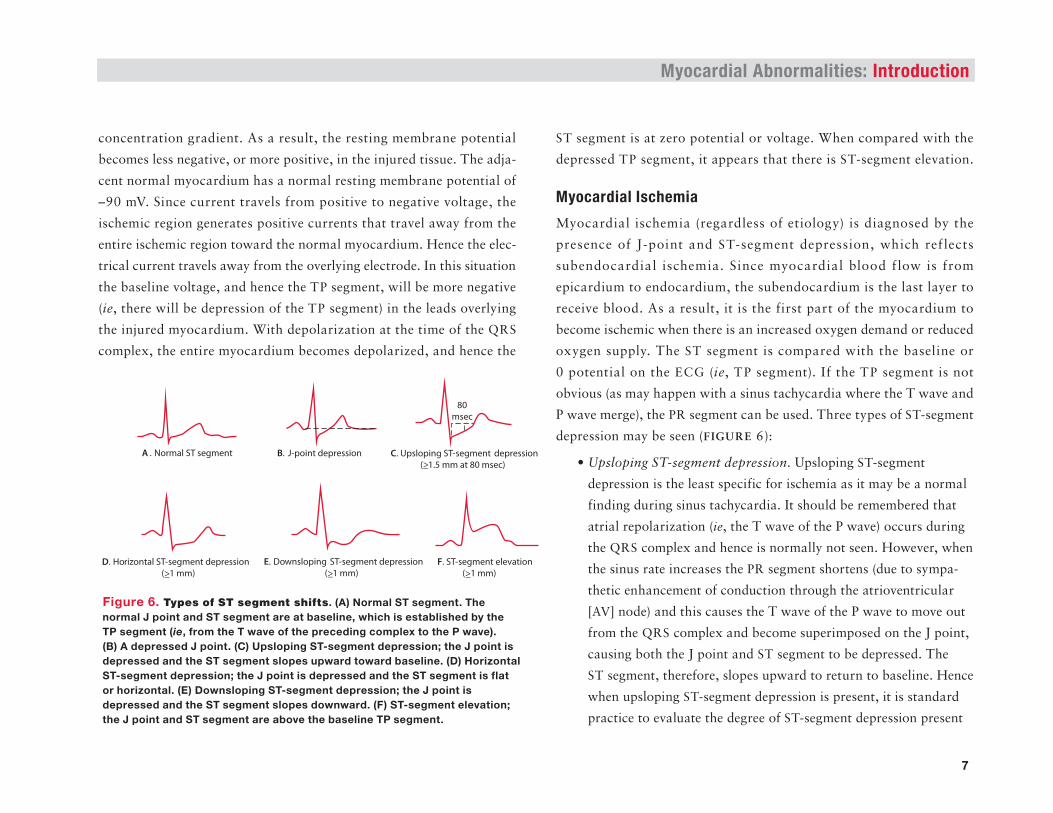
depression may be seen (FIGURE 6):
Upsloping ST-segment depression. Upsloping ST-segment
depression is the least specific for ischemia as it may be a normal
finding during sinus tachycardia. It should be remembered that
atrial repolarization (ie, the T wave of the P wave) occurs during
the QRS complex and hence is normally not seen. However, when
the sinus rate increases the PR segment shortens (due to sympa-
thetic enhancement of conduction through the atrioventricular
[AV] node) and this causes the T wave of the P wave to move out
from the QRS complex and become superimposed on the J point,
causing both the J point and ST segment to be depressed. The
ST segment, therefore, slopes upward to return to baseline. Hence
when upsloping ST-segment depression is present, it is standard
practice to evaluate the degree of ST-segment depression present
Myocardial Abnormalities: Introduction
B. J-point depression
F. ST-segment elevation
(>_1 mm)
A . Normal ST segment C. Upsloping ST-segment depression
(>_1.5 mm at 80 msec)
80
msec
E. Downsloping ST-segment depression
(>_1 mm)D. Horizontal ST-segment depression
(>_1 mm)
Figure 6. Types of ST segment shifts. (A) Normal ST segment. The normal J point and ST segment are at baseline, which is established by the TP segment (ie, from the T wave of the preceding complex to the P wave). (B) A depressed J point. (C) Upsloping ST-segment depression; the J point is depressed and the ST segment slopes upward toward baseline. (D) Horizontal ST-segment depression; the J point is depressed and the ST segment is flat or horizontal. (E) Downsloping ST-segment depression; the J point is depressed and the ST segment slopes downward. (F) ST-segment elevation; the J point and ST segment are above the baseline TP segment.
8
Podrid’s Real-World ECGs
at 80 msec (two small boxes) past the J point, which eliminates
any effect from the atrial T wave on the J point and ST segment.
If the ST segment at 80 msec past the J point is still depressed
1.5 mm or more below baseline (the TP segment or, if not
obvious, the PR segment), then subendocardial ischemia is
likely present.
Horizontal ST-segment depression. The J point and ST segment
are depressed (≥ 1 mm below baseline) and are flat thereafter.
Downsloping ST-segment depression. The J point is depressed
below baseline (≥ 1 mm), and the ST segment slopes downward.
This is the most specific pattern for ischemia.
Although the usual criterion for ischemia is ST-segment depression
more than 1 mm below baseline, specificity for ischemia increases as
the degree of ST-segment depression increases. However, sensitivity for
the diagnosis of ischemia decreases. In addition, specificity increases
with an increased number of leads showing ST-segment depression. The
location of ischemia based on the leads that show ST-segment depres-
sion does not always identify the region of subendocardium involved.
Myocardial Infarction
Acute Infarction
Acute infarction is the result of a total cessation of blood flow and oxy-
gen supply to the myocardium. This causes loss of membrane integrity
and loss of the normal sodium–potassium–ATPase pump, which is
energy dependent and requires an oxygen supply. Potassium leaks out of
the cell, based on its electrochemical gradient (intracellular potassium
levels are normally higher than extracellular levels as maintained by this
ATPase pump). Since there is no blood flow into or out of the region of
infarction, potassium remains in this area, producing local hyperkalemia.
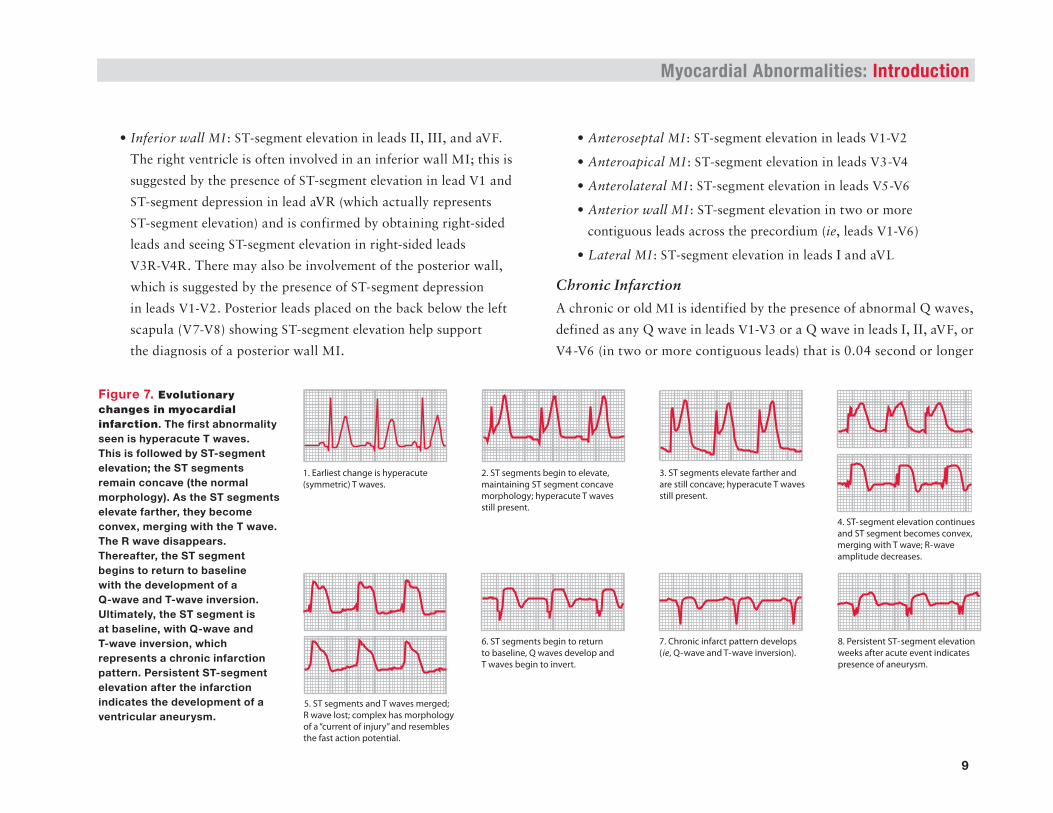
Therefore, the earliest change with a transmural or ST-segment
elevation MI (STEMI) is a hyperacute (tall, peaked, and symmetric)
T wave seen in the area of the involved myocardium (F IGU R E 7 ).
The hyperacute T wave occurs even before there are any ST-segment
changes (if the ECG is obtained shortly after the onset of symptoms).
Thereafter, the ST segment begins to elevate, maintaining its normal
concave morphology; hyperacute T waves are still present. The ST seg-
ment elevates farther and is still concave; hyperacute T waves are also
still present. ST segments continue to elevate and become convex, merg-
ing with the T wave. The amplitude of the R wave decreases. When the
ST segment and T waves merge and the R wave is no longer obvious,
the complex has the morphology of a “current of injury.” It resembles
the fast, sodium ion–mediated action potential. This ECG pattern of
an acute infarction has been referred to as “tombstoning,” as the QRS
complex looks like a tombstone. The ST segment begins to return to
baseline, Q waves develop, and T waves begin to invert, resulting in a
chronic infarct pattern (ie, Q-wave and T-wave inversion). In addition
to ST-segment elevation, there are reciprocal changes (ie, ST-segment
depressions in other leads). This actually represents the ST-segment
elevation observed from another angle. Persistent ST-segment elevation,
present weeks to years after an acute event, indicates the presence of
an aneurysm in the area of the previous infarction.
The location of these changes identifies the region of the myo-
cardium involved; it may not identify which coronary artery is
the “culprit”:
9
Inferior wall MI : ST-segment elevation in leads II, III, and aVF.
The right ventricle is often involved in an inferior wall MI; this is
suggested by the presence of ST-segment elevation in lead V1 and
ST-segment depression in lead aVR (which actually represents
ST-segment elevation) and is confirmed by obtaining right-sided
leads and seeing ST-segment elevation in right-sided leads
V3R-V4R. There may also be involvement of the posterior wall,
which is suggested by the presence of ST-segment depression
in leads V1-V2. Posterior leads placed on the back below the left
scapula (V7-V8) showing ST-segment elevation help support
the diagnosis of a posterior wall MI.
Anteroseptal MI : ST-segment elevation in leads V1-V2
Anteroapical MI : ST-segment elevation in leads V3-V4
Anterolateral MI : ST-segment elevation in leads V5-V6
Anterior wall MI : ST-segment elevation in two or more
contiguous leads across the precordium (ie, leads V1-V6)
Lateral MI : ST-segment elevation in leads I and aVL
Chronic Infarction
A chronic or old MI is identified by the presence of abnormal Q waves,
defined as any Q wave in leads V1-V3 or a Q wave in leads I, II, aVF, or
V4-V6 (in two or more contiguous leads) that is 0.04 second or longer
Myocardial Abnormalities: Introduction
1. Earliest change is hyperacute
(symmetric) T waves.
3. ST segments elevate farther and
are still concave; hyperacute T waves
still present.
8. Persistent ST-segment elevation
weeks after acute event indicates
presence of aneurysm.
4. ST-segment elevation continues
and ST segment becomes convex,
merging with T wave; R-wave
amplitude decreases.
5. ST segments and T waves merged;
R wave lost; complex has morphology
of a “current of injury” and resembles
the fast action potential.
7. Chronic infarct pattern develops
(ie, Q-wave and T-wave inversion).
2. ST segments begin to elevate,
maintaining ST segment concave
morphology; hyperacute T waves
still present.
6. ST segments begin to return
to baseline, Q waves develop and
T waves begin to invert.
Figure 7. Evolutionary changes in myocardial infarction. The first abnormality seen is hyperacute T waves. This is followed by ST-segment elevation; the ST segments remain concave (the normal morphology). As the ST segments elevate farther, they become convex, merging with the T wave. The R wave disappears. Thereafter, the ST segment begins to return to baseline with the development of a Q-wave and T-wave inversion. Ultimately, the ST segment is at baseline, with Q-wave and T-wave inversion, which represents a chronic infarction pattern. Persistent ST-segment elevation after the infarction indicates the development of a ventricular aneurysm.
10
Podrid’s Real-World ECGs
in duration (or, as per new guidelines ≥ 0.03 sec, which is difficult to
measure) and at least 1 mm in depth. However, Q waves may be normal
and are ignored in lead III (unless they are also in leads II and aVF),
in lead V1 (unless also in lead V2), and in lead aVL (unless Q-wave
depth ≥ 50% R-wave height). A QS complex in leads V1-V2 may also
be normal variant, especially in women.
T-wave inversions are usually present in the leads showing Q waves.
ST-segment elevation that persists for more than a few weeks after the
acute infarction suggests an aneurysm of the involved wall. The location
of Q waves identifies the region of the left ventricle that is involved,
but not necessarily the vessel that is occluded:
Inferior wall MI : Q waves in leads II, III, and aVF
Anteroseptal MI : Q waves in leads V1-V2
complex with a delta wave), dextrocardia (reverse R-wave
progression across the precordium with a right axis deviation
and negative P waves in leads I and aVL), lead misplacement
(V1, V2, V3), recording of right-sided leads (reverse R-wave
progression in leads V1-V6), Duchenne muscular dystrophy
(a posterolateral infarction pattern), or hypertrophic
cardiomyopathy (prominent septal Q waves). On occasion
it may be a normal variant or due to counterclockwise
rotation (ie, early transition).
Pericarditis /Myocarditis
Pericarditis, which is often associated with myocardial inflammation
or myocarditis of the epicardium, causes diffuse inflammation and
diffuse ECG changes reflecting involvement of all or most of the heart.
The characteristic ECG findings with pericarditis include:
ST-segment elevation is seen in all or almost all leads.
ST segments have normal concave morphology regardless of the
height of ST-segment elevation. There is no change in the
ST-segment morphology over time (ie, there are no evolutionary
changes, as are seen with an acute MI).
ST-segment depression.
ie, asymmetric).
PR depression may be seen. However, its absence does not
exclude pericarditis.
ST segments return to
isoelectric baseline. n
Anteroapical MI : Q waves in leads V3-V4
Anterolateral MI : Q waves leads V5-V6
Anterior wall MI : Q waves in two or more contiguous
precordial leads
Lateral MI : Q waves in leads I and aVL
Posterior MI : Tall R wave in lead V1 (R-wave amplitude > 7 mm
or R/S > 1) with a duration of 0.04 second or longer (or ≥ 0.03 sec).
This is typically seen in association with inferior wall MI,
although there may be a true posterior wall MI in which there
is no inferior wall involvement. However, other abnormalities
associated with a tall R wave in lead V1 need to be considered,
including evidence of RVH (usually associated with a right axis
deviation and right atrial hypertrophy), Wolff-Parkinson-White
pattern (short PR interval and a wide and abnormal QRS
Myocardial Abnormalities: Introduction
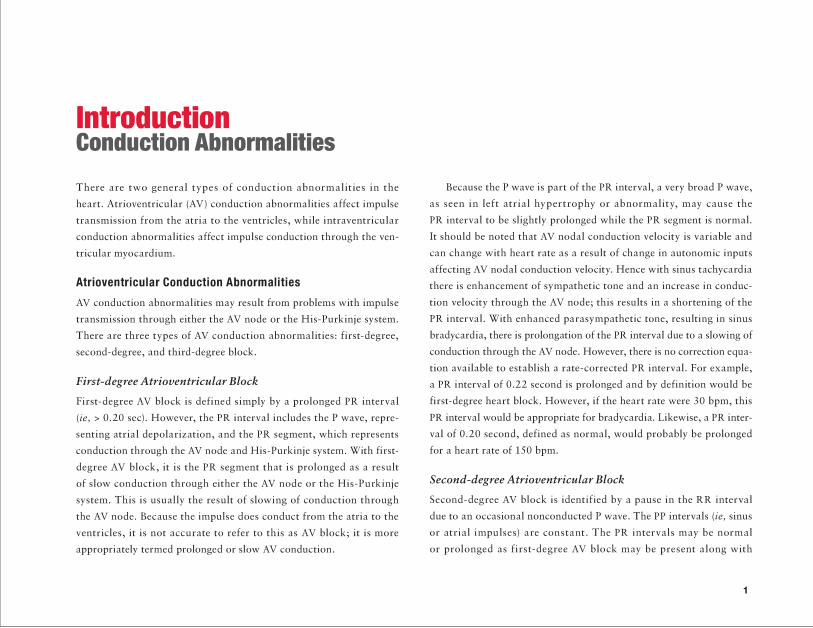
Introduction Conduction Abnonnalities
There are two general types of conduction abnormalities in the
heart. Atrioventricular (AV) conduction abnormalities affect impulse
transmission from the atria to the ventricles, while intraventricular
conduction abnormalities affect impulse conduction through the ven
tricular myocardium.
Atrioventricular Conduction Abnormalities
AV conduction abnormalities may result from problems with impulse
transmission through either the AV node or the His-Purkinje system.
There are three types of AV conduction abnormalities: first-degree,
second-degree, and third-degree block.
First-degree Atrioventricular Block
First-degree AV block is defined simply by a prolonged PR interval
(ie, > 0.20 sec). However, the PR interval includes the P wave, repre
senting atrial depolarization, and the PR segment, which represents
conduction through the AV node and His-Purkinje system. With first
degree AV block, it is the PR segment that is prolonged as a result
of slow conduction through either the AV node or the His-Purkinje
system. This is usually the result of slowing of conduction through
the AV node. Because the impulse docs conduct from the atria to the
ventricles, it is not accurate to refer to this as AV block; it is more
appropriately termed prolonged or slow AV conduction.
Because the P wave is part of the PR interval, a very broad P wave,
as seen in left atrial hypertrophy or abnormality, may cause the
PR interval to be slightly prolonged while the PR segment is normal.
It should be noted that AV nodal conduction velocity is variable and
can change with heart rate as a result of change in autonomic inputs
affecting AV nodal conduction velocity. Hence with sinus tachycardia
there is enhancement of sympathetic tone and an increase in conduc
tion velocity through the AV node; this results in a shortening of the
PR interval. With enhanced parasympathetic tone, resulting in sinus
bradycardia, there is prolongation of the PR interval due to a slowing of
conduction through the AV node. However, there is no correction equa
tion available to establish a rate-corrected PR interval. For example,
a PR interval of 0.22 second is prolonged and by definition would be
first-degree heart block. However, if the heart rate were 30 bpm, this
PR interval would be appropriate for bradycardia. Likewise, a PR inter
val of 0.20 second, defined as normal, would probably be prolonged
for a heart rate of 150 bpm.
Second-degree Atrioventricular Block
Second-degree AV block is identified by a pause in the RR interval
due to an occasional nonconducted P wave. The PP intervals (ie, sinus
or atrial impulses) are constant. The PR intervals may be normal
or prolonged as first-degree AV block may be present along with
Podrld's Real-World ECGs
second-degree AV block. There are two types of second-degree
AV block as the block may be in either the AV node (Mobitz type I) or
the His-Purkinje system (Mobitz type II).
Mobitz Type I Atrioventricular Block (Wenckebach)
Mobitz type I AV block (Wenckebach) results from a conduction abnor
mality within the AV node. In Wenckebach, progressive PR-interval
prolongation results in a single nonconducted P wave and pause in
the RR interval. The duration of the pause (the PP interval around the
pause) is equal to two sinus intervals. After the pause, the PR interval
shortens to the baseline PR interval. Hence the baseline interval is the
PR interval of the complex immediately following the pause, and the
PR interval after each pause should be the same. It may be normal or
prolonged. There is only one nonconducted P wave each time, and
hence there will be one more P wave than QRS complex. Therefore,
Wenckebach is termed 3:2, 4:3, 5:4, etc. This results in a pattern of
grouped beating. The pattern of block may be fixed (only 3:2, only
4:3, etc) or variable (periods of both 3:2 and 4:3, etc).
The basis of Mobitz type I AV block is that impulse genera
tion within the AV node results from calcium currents (ie, a slow
action potential). The slow action potential demonstrates changes in
refractoriness and conduction velocity. Therefore, the rate of impulse
conduction through the AV node is variable. AV nodal refractoriness
and conduction velocity change as a result of various factors, including
autonomic impulses, drugs, and electrolyte abnormalities. Because of
changes in refractoriness, impulse velocity can change; that is, the
ability of the AV node to conduct impulses is not all or none, as is
2
seen in the His-Purkinje system where impulse generation is the result
of fast sodium currents (ie, the fast action potential). Therefore, the
AV node demonstrates a property known as decremental conduction,
(ie, conduction velocity through the AV node changes based on how rap
idly the node is stimulated). In the absence of sympathetic stimulation,
when the rate of impulse stimulation of the AV node increases, the
impulse conduction velocity through it slows. This results in length
ening of the PR interval. Each successive atrial impulse reaches the
AV node earlier, when it may be even more refractory. As a result, there
is a progressive slowing of each subsequent impulse due to decremental
AV nodal conduction, until the node finally fails to conduct the impulse
because it has arrived at a time when it is absolutely refractory. As a
result of blockade of impulse conduction within the AV node, there
is no activation of the ventricle and no QRS impulse on the ECG.
The increment of PR lengthening is greatest at the beginning of a
Wenckebach cycle and may decrease progressively from one beat to
the next. For example, the PR interval may lengthen from the baseline
of 0.16 second, to 0.24 second, then to 0.28 second, and finally to
0.30 second. Since the PP interval is constant, this results in shorten
ing of the RR interval. However, shortening of the RR interval may
not be seen, especially if there is a long Wenckebach cycle length or if
the underlying heart rate is fast. Hence this finding is not necessary to
identify Wenckebach.
Although Wenckebach is seen most often in sinus rhythm, it may
occur with an atrial rhythm, atrial tachycardia, or atrial flutter.
Regardless of the underlying rhythm, there is a regular PP interval.
Wenckebach is most often benign and does not require any therapy.
Importantly, if a failure of impulse conduction from atria to ventricles
Introduction: Conduction Abnormalities L_ ____________________________________________________________________ __
would develop (ie, complete heart block), the escape rhythm would be
junctional. Junctional rhythms are generally reliable, predictable, and
stable with regard to rate. In general, urgent pacemaker insertion is not
required unless there are symptoms resulting from bradycardia.
Mobitz Type II Atrioventricular Block
With Mobitz type II AV block, there is an occasional nonconducted
P wave, but when there is AV conduction the PR interval is constant
(ie, the PR intervals before and after the pause are constant). There
may be one or more nonconducted P waves; the occurrence of two
or more nonconducted P waves is often called high-degree AV block.
Mobitz type II block is failure of conduction within the His-Purkinje
system. Since impulse generation within the His-Purkinje system results
from the fast action potential mediated by a rapid influx of sodium
currents, conduction through the His-Purkinje system is all or none;
that is, it either conducts (always at the same rate) or does not conduct.
Therefore, when there is AV conduction, the PR interval is always
the same. Mobitz type II block has more serious implications because
if there is a failure of AV conduction (ie, complete heart block), the
escape rhythm will be ventricular. Ventricular escape rhythms are
unreliable, unpredictable, and unstable with regard to rate. A tempo
rary pacemaker should be inserted, even if there are no symptoms.
2:1 Atrioventricular Block
In 2:1 AV block, which is also a type of second-degree AV block, every
other P wave is nonconducted. When the P wave is conducted, the
PR interval is constant. 2:1 AV block may be Mobitz type I or II. The
etiology can only be established if another pattern of AV conduction
is seen as a result of several sequentially conducted P waves. If there
is progressive lengthening of the PR interval, then the 2:1 AV block is
Mobitz type I. In contrast, if all the PR intervals are the same, then
the 2:1 AV block is Mobitz type II. Alternatively, if complete heart
block develops, the presence of an escape junctional rhythm indicates
that the problem is within the AV node and hence the 2:1 AV block is
Wenckebach. If there is an escape ventricular rhythm, the 2:1 AV block
is within the His-Purkinje system and hence is Mobitz type II.
Third-degree Atrioventricular Block
Third-degree AV block (complete heart block) is manifest by the
presence of AV dissociation; that is, there is no association between
P waves and QRS complexes. Hence the PR intervals are variable and
the variability has no pattern (unlike Mobitz type I, in which there is
a pattern to the variability of the PR intervals, ie, progressive length
ening). In addition, the atrial rate is faster than the rate of the QRS
complexes as the QRS complexes are the result of an escape rhythm.
Complete heart block may be due to disease of the AV node or the
His-Purkinje system (ie, infranodal); therefore, the escape rhythm may
be junctional or ventricular. The origin of the escape rhythm is based
on QRS morphology and not the rate of the escape rhythm.
Atrioventricular Dissociation
AV dissociation is identified by the absence of a relationship between
the P wave and the QRS complex. Hence there are variable PR intervals
that are random without any pattern to the variability. In contrast,
there is variability of the PR intervals with Wenckebach, but there is a
3

Podrld's Real-World ECGs
pattern with progressive PR interval lengthening. There are two causes
for AV dissociation:
• Third-degree AV block, or complete heart block, in which
there is no impulse conduction between the atria and ventricles.
In this situation, the atrial rate is faster than the rate of the QRS
complexes, which are the result of an escape rhythm. The
location of the escape rhythm may be the junction (junctional
escape) or the ventricle (ventricular escape). The location of the
escape rhythm is not based on the rate of the escape rhythm but
on the morphology of the QRS complexes. Although the teaching
is that junctional escape rhythms have a rate of 50 to 60 bpm and
ventricular escape rhythms have a rate of 20 to 30 bpm, the rate
is influenced by autonomic tone and circulating catecholamines.
Hence there may be an escape junctional rhythm at a rate of
30 bpm and an escape ventricular rhythm at a rate of 70 bpm.
• An accelerated junctional or ventricular rhythm may also present
with AV dissociation. In this situation, the atrial rate is slower
than the rate of the QRS complexes. The focus responsible for the
accelerated rhythm (junction or ventricle) is based on the QRS
complex morphology and not on the rate.
Isorhythmic Dissociatio11
Isorhythmic dissociation is a variation of AV dissociation. As noted,
with complete heart block the atrial rate is faster than the rate of the
QRS complexes, while with an accelerated rhythm the atrial rate is
slower than the rate of the QRS complexes. However, if AV dissociation
is present (ill, variable PR intervals), but the rate of the P waves and
4
QRS complexes is the same, the etiology for AV dissociation (ie, com
plete AV block or an accelerated lower focus) cannot be established.
This is termed isorhythmic dissociation.
Ventriculophasic Arrhythmia
Ventriculophasic arrhythmia (ie, phasic changes in the sinus rate related
to ventricular contraction) may be seen with 2:1 AV block or AV dissoci
ation, particularly when there is complete heart block. Ventriculophasic
arrhythmia is diagnosed when the sinus PP intervals are irregular with
a repeating pattern (ill, the PP interval surrounding a QRS complex is
slightly shorter than the PP interval without a QRS complex). This is
termed ventriculophasic arrhythmia and is due to one of several causes:
• With ventricular contraction there is an increase in pulsatile
sinus nodal artery blood flow that results in an increase in sinus
node automaticity and hence the shorter PP interval.
• With ventricular contraction the stretch on the right atrium
enhances sinus node automaticity.
• With ventricular contraction (and hence stroke volume) there
are effects on the baroreceptors and, as a result, there are changes
in vagal outputs that alter the sinus rate.
Intraventricular Conduction Abnormalities
Intraventricular conduction abnormalities may be due to one of
three causes:
• Diffuse slowing of impulse conduction through the normal
His-Purkinje system that innervates the ventricles (known as
intraventricular conduction delay [IVCD])
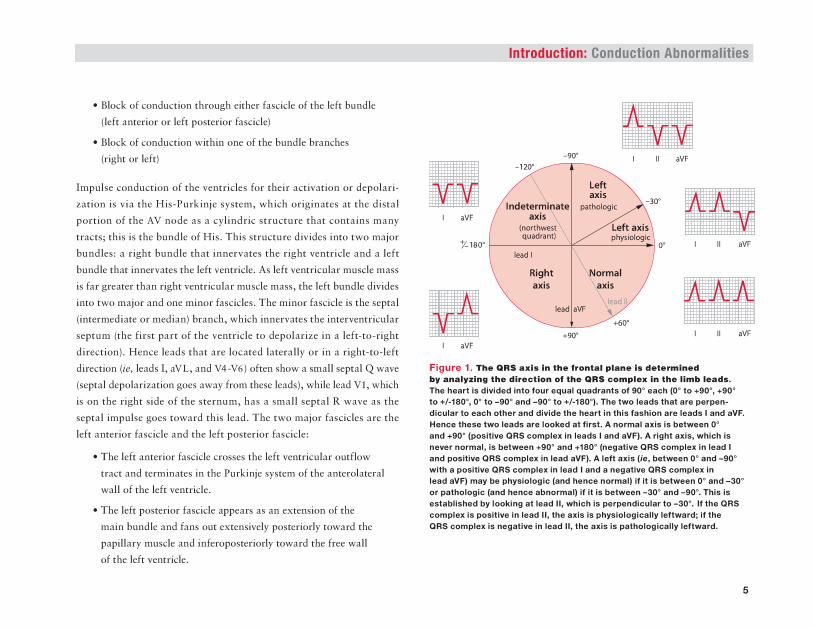
Introduction: Conduction Abnormalities L_ ____________________________________________________________________ __
• Block of conduction through either fascicle of the left bundle
(left anterior or left posterior fascicle)
• Block of conduction within one of the bundle branches
(right or left)
Impulse conduction of the ventricles for their activation or depolari
zation is via the His-Purkinje system, which originates at the distal
portion of the AV node as a cylindric structure that contains many
tracts; this is the bundle of His. This structure divides into two major
bundles: a right bundle that innervates the right ventricle and a left
bundle that innervates the left ventricle. As left ventricular muscle mass
is far greater than right ventricular muscle mass, the left bundle divides
into two major and one minor fascicles. The minor fascicle is the septal
(intermediate or median) branch, which innervates the interventricular
septum (the first part of the ventricle to depolarize in a left-to-right
direction). Hence leads that are located laterally or in a right-to-left
direction (ie, leads I, aVL, and V4-V6) often show a small septal Q wave
(septal depolarization goes away from these leads), while lead Vl, which
is on the right side of the sternum, has a small septal R wave as the
septal impulse goes toward this lead. The two major fascicles arc the
left anterior fascicle and the left posterior fascicle:
• The left anterior fascicle crosses the left ventricular outflow
tract and terminates in the Purkinje system of the anterolateral
wall of the left ventricle.
• The left posterior fascicle appears as an extension of the
main bundle and fans out extensively posteriorly toward the
papillary muscle and infcropostcriorly toward the free wall
of the left ventricle.
aVF
+90" aVF
aVF
Figure 1. Tho CIRS azlaln tho frontal pl•ola determined by an.lplng tho direction ol tho CIRS compl- In tho llmll I-da. The heart is divided into four equal quadrants of oo• each (0" to +90", +90" to +/-180", o• to -90" and -90" to +/-180"). The two leada that ant perpendicular to aach other and divide the heart in this fashion ant leads I and aYF. Hence theee two leada are looked at ttrat. A nonnal axle Ia between o• end +90" (poaltlva QRS complex In laada I and aVF). A right axle, which Ia newr normal, is between +90" and +180" (negative QRS complex in lead I and poaltlve QRS complex In lead aVF). A left axle (le, between o• and -90" with a poaltlve QRS complex In lead I and a negative QRS complex In lead aYF) may be phyalologlc (and hence normal) It It Ia between o• and -30" or pathologic (and hence abnormal) If It Ia batwaan -30" and _.o•. Thla Ia established by looking at lead II, which is perpendicular to -30". If the QRS complex Ia positive In lead II, the axla Ia phyalologlcally leftward; If the QRS complex Ia negatlva In lead II, the axla Ia pathologically laltward.
5
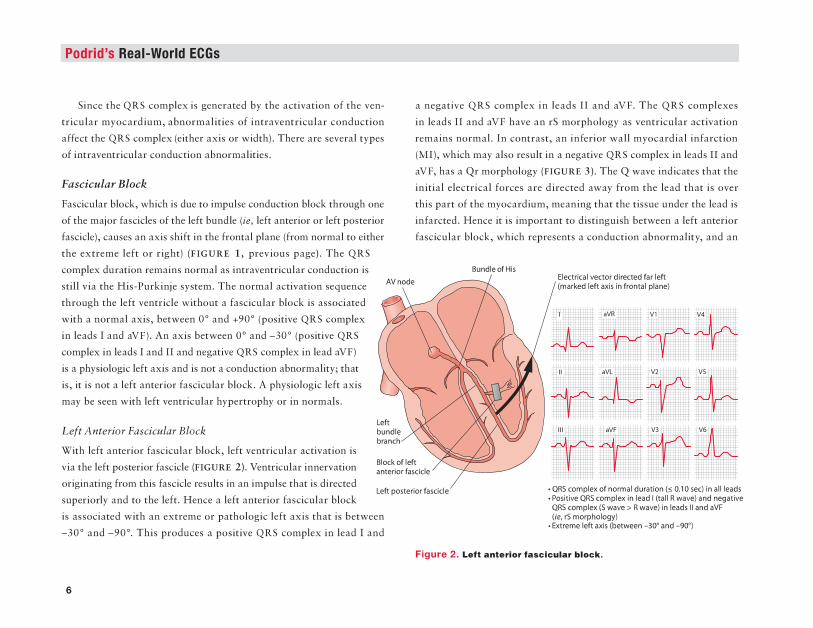
Podrid's Real-World ECGs
Sinc;e the QRS c;omplc:x is generated by the activation of the ven
tricular myocardium, abnormalities of intraventricular conduction
affe(;t the QRS compla (either axis or width). There are &everal types
of intraventricular conduction abnormalities.
FasciC'IilM Bloclt.
Fasacular block. whith is due to impulse conduction block through one
of the major fasaclea of the le.ft bundle (ie, left anterior or left posterior
fascicle), causes an axis shift in the frontal plane (from normal to either
the extreme left or right) (FIGUB.B 1, previous page). The QRS
complex duration remains normal as intraventricular conduction is
still via the His-Purkinje system. The normal activation sequence
through the left ventricle without a fascicular bloc:k is assoaated
with a normal axis, between o• and +90• (positive QRS complex
in leads I and aVF). A:zJ. axis between o• and -Jo• (positive QRS
complex in leads I and II and negative QRS complex in lead aVF)
ill a physiologic left a.xiJ and ill not a conduction abnormality; that
is, it is not a left anterior fascicular bloc:k. A physiologic le.ft a.xiJ
may be scc:n with left -n:ntricular hypertrophy or in normals.
Left Anterior :Fascicular Bloclt.
With left anterior fascicular block, left ventricular activation is
via the le.ft posterior fascicle (FIGURE 1). Ventricular innervation
originating from this .fascicle results in an impulse that is din:ctcd
superiorly and to the left. Henc:e a left anterior &.acicular block
is associated with an extreme or pathologic left axis that is between
-30" and -90". This produces a positive QRS complex in lead I and
8
a negative QRS complex in leads II and aVF. The QRS complexes
in leads II and aVP have an rS morphology as ventricular activation
remains normal. In contrast, an inferior wall myocardial infarction
(MI), which may also result in a negative QRS complex in leads II and
aVF, has a Qr morphology (FIGURE 3). The Q wave indicates that the
initial electrical forces are directed away from the lead that is over
this plUt of the myoc:ardium, meaning that the tissue under the leltd is
infarcted. Hence it is important to distinguish between a left anterior
fascicular block, whith represents a conduction abnormality, and an
BundeofHll
•QRScomplelcofnonnaldunrtlon (s0.10.seqln~lllttds •Pio.llllve QltS (JOI!Iple~C In let.d 1 (tell R wt.llll) tnd neg~~tiVe 0\ScomJ)IextsW~Ve> Rwa\'tl In ltt.dsll1nd1VF (Ito. rS mOiphclogy) ·~left «XXI~ -30" and -90')
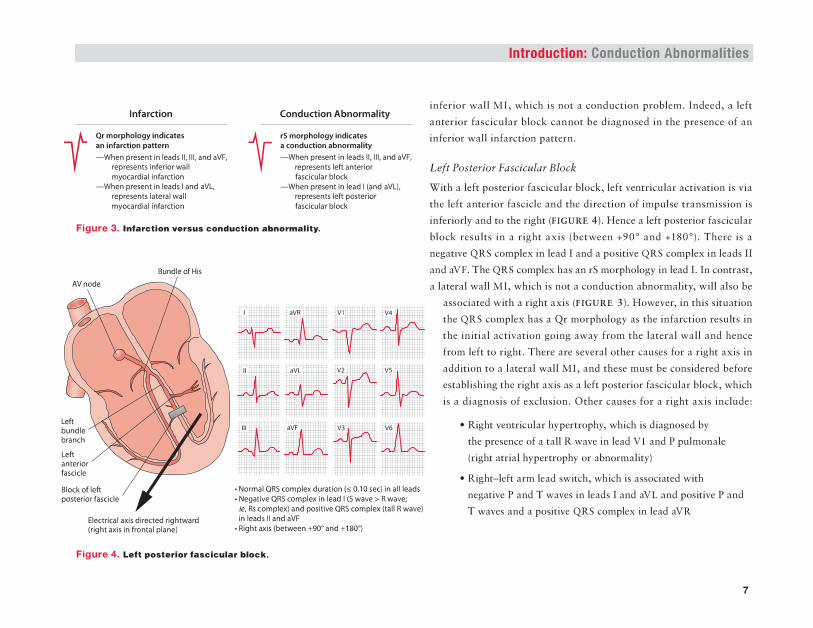
Introduction: Conduction Abnormalities ~--------------------------------------------------------------
lnf8rdfon
Qrmorphology lnolal'lu an lnl'llrction pettetn
-when present In leldsl~lll.~nd~VF. n!Prt!lents lrlerlotWIII myoardlll rnlircUon
-when present In lelds 11nd ~VI. repraents lltet~l Wllll III)'OOII'd llllnl'vc:Uon
EIKtrical axis dlr«ted rlghlwlnl (rlghtaxlslnflontll pllne)
Conduction Abnormality
rS mOtpiiGiotrlncllclttll 1 CIOI1Ciuctlon lllnOtmalit)' -when pte.~ent In let.ds II, II~ and aVF,
n!fi~IS left anteffat f&Kfallar bloclt
-when prmnt In IMd I (llllld aVI.), retOI'eJCflts left posletfat fllllclcullr blOCk
•Norm1l QRS ccrnplex dun~tlon (>; 0.10 sec) In lllllelldl • l\legll'-'eQRSc:omplelcl~lead I(S\IIIIIIIl> Rwwe; 1t. Rs complex) and positive QRS c:omplex 0111 R wavtJ In le.adsllandaVF •Aightull~+Wind+110')
Flgunt 4. Lett poatMior faac:leuiU'IIIIIeeiL
inferior wall MI, which is not a conduction problem. Indeed, a left
anterior fascicular block cannot be diagnosed in the presence of an
inferior wall infam.ion pattern.
Left Posterior FasciCNlar Block
With a le.ft posterior fascicular block, le.ft ventricular activation is via
the left anterior fascicle and the direction of impulse transmission is
inferiorly and to the right (PIGUBl!. 4 ). Hence a left postcr.ior fascicular
block results in a right axis (between +.90" and +180"). There is a
negative QRS complex in lead I and a positive QRS complex in leads n and aVP. The QRS complex has an rS morphology in lead LIn contrast,
a lateral wall MI, which is not a conduction abnormality, will also be
associated with a right axis {FIGURE 3). However, in this situation
the QRS complex has a Qr morphology as the infarction results in
the initial activation going away from the lateral wall and hence
from left to right. There are several other causes for a right axis in
addition to a late.ral wall MI, and these must be considered before
establishing the right axis as a left posterior fascicular block, which
i$ a diagno$is of exclusion. Other cause$ for a right axis include:
• !tight ventricular hypertrophy, which is diagnosed by
the presence of a tall R wave in lead Vl and P pulmonale
(right atrial hypertrophy or abnormality}
• R4ht-left arm lc:ad switch, whkh is associated with
negative P and T wana in leads I and aVL and positive P and
T waves and a positive QRS complex: in lead aVR
7

Podrld's Real-World ECGs
• Dextrocardia, in which there is a pattern that resembles right-left
arm lead switch (it:, an inverted P wave in leads I and aVL, a
positive QRS complex, and positive P and T waves in lead aVR),
as well as reverse R-wave progression across the precordium
• Wolff-Parkinson-White syndrome, with negative delta waves in
leads I and aVL that are indicative of a left lateral pathway
• A biventricular pacemaker, in which the initial waveform
of the QRS complex in lead I is a Q wave or QS pattern.
However, most often a biventricular pacemaker is associated
with an indeterminate axis.
A broad and deep terminal S wave in a right bundle branch block
(RBBB) may give the appearance of a right axis. However, in this
case the terminal S wave represents delayed right ventricular activa
tion and not a left ventricular force. In this situation the terminal
S wave should be ignored and is not considered for axis determination.
Indetenninate Axis
An indeterminate axis with a supraventricular complex is defined as an
axis that is between -90" and +/-180". The QRS complex is negative in
leads I and aVF. This may represent either a very extreme left axis or
a very extreme right axis. In a human adult heart, it is unusual to see
an indeterminate axis with a supraventricular QRS complex. There is
no type of conduction pattern through the normal His-Purkinje system
that will result in an indeterminate axis. Thus an indeterminate axis is
the result of the simultaneous presence of two different abnormalities.
For example, an indeterminate axis may be seen when there is right
ventricular hypertrophy (which shifts the axis rightward) associated
8
with a left anterior fascicular block or an inferior wall MI (which
shifts the axis leftward). An indeterminate axis may appear to be
present if an old lateral and inferior wall MI is evident. However,
in this case there are Q waves in leads I, II, III, and aVF and hence
the axis shih is the result of an infarction. The presence of a lateral
wall MI (which has a right axis) with a left anterior fascicular block
(which has a left axis) or an inferior wall MI (which has a left axis)
with a left posterior fascicular block (which has a right axis) will also
have an indeterminate axis. However, in this case the negative QRS
complex in either lead I (with a lateral wall MI) or lead aVF (inferior
wall MI) is due to an infarction and not an axis shift. A right-left arm
lead switch (which has a right axis) associated with either an inferior
wall MI or a left anterior fascicular block (which has a left axis) will
have an indeterminate axis. Lastly, the presence of a deepS wave due
to an RBBB may give the appearance of a negative QRS complex in
lead I, and the presence of a left anterior fascicular block will give
the appearance of an indeterminate axis. In the presence of an RBBB
the deep S wave in lead I is the result of terminal delay in right ven
tricular activation and is not considered as part of axis determination
(which is the direction of impulse conduction within the left ventricle).
An indeterminate axis associated with a wide QRS complex may be
seen with any situation in which there is direct ventricular myocardial
activation, including a ventricular complex, a paced complex (especially
biventricular pacing), or a preexcitation pattern, specifically Wolff
Parkinson-White.
Intraventricular Conduction Delay
An IVCD is a nonspecific QRS widening (QRS duration > 0.10 sec)
without any specific bundle branch block pattern. Conduction is
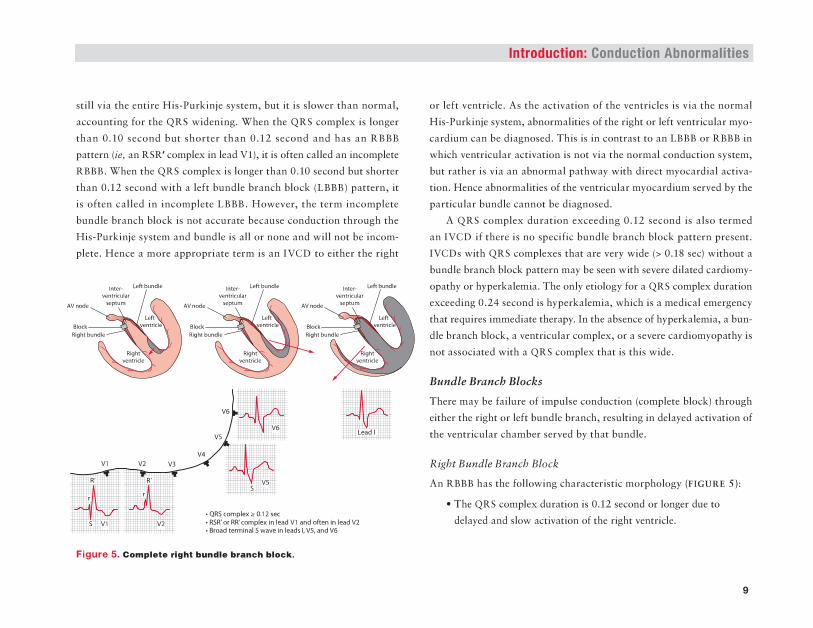
still via the entire His-Purkinjc system, but it is slower than normal,
accounting for the QRS widening. When the QRS complex is longer
than 0.10 second but shorter than 0.12 second and bas an R888
pattern (ie, an RSR' complex in lead Vl), it is often called an incomplete
RBBB. When the QRS complex is longer than 0.10 second but shorter
than 0.12 second with a left bundle branch block (LBBB) pattern, it
is often called in incomplete LBBB. However, the term incomplete
bundle branch bled: is not accurate because conduction through the
His-Purk.inje system and bundle is all or none and will not be incom
plete. Hence a more appropriate term is an IVCD to either the right
•QR5mmpla:.0.12uc • R5R' a< IIA' "'"'"""'In-V1 ond oftonln- V2 •BroadtlrmiNIS-Inlees~V5,.wiVIS
Figure 6. c .... ,." ... ,"' IIH!n•• ....._h lll•eiL
Introduction: Conduction Abnormalities
or left ventricle. As the activation of the ventricles is via the: normal
His-Purkinje system, abnormalities of the right or left ventricular myo
cardium can be diagnosed. This is in contrast to an LBBB or RBBB in
which ventricular activation is not via the normal conduction system,
but rather is via an abnormal pathway with direct myocardial activa
tion. Hence abnormalities of the ventricular myocardium served by the
particular bundle cannot be diagnosed.
A QRS complex duration exceeding 0.12 second is also termed
an IVCD if there is no specific bundle branch block pattern present.
IVCDs with QRS complexes that are very wide (> 0.18 sec) without a
bundle branch bloclt pattern may be seen with severe dilated ca.rdiomy
opauhy or hypcrlcalemia. The only etiology for a QRS complex duration
exceeding 0.24 second is hyperkalemia, which is a medical cmcrgcnc.y
that requires immediate therapy. In the absence of hyperkalemia, a bun
dle branch block, a ventricular complex, or a severe cardiomyopathy is
not a56oc:iated with a QRS complex that is this wide.
Bt11Ulle Bf'tltu:b Blocks
There may be failure of impulse conduction (<:ompletc bled:) through
either the right or leh bundle branch, resulting in delayed activation of
the ventricular chamber served by that bundle.
Right B11ndle Brandt Block
An RBBB has the following characteristic morphology (FIGURE S):
• The QRS complex duration is 0.12 second or longer due to
delayed and slow a<:tivation of the right ventricle.
9
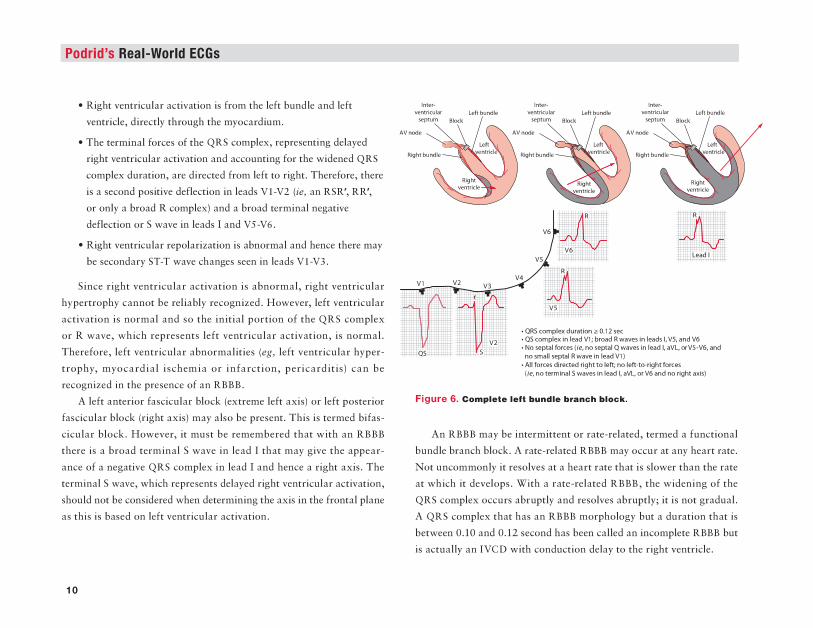
Podrld's Real-World ECGs
• Right ventricular activation is from the left bundle and left ventricle, directly through the myocardium.
• The terminal forces of the QRS complex, representing delayed
~t ventricular activation and accounting for the widened QRS
complex duration, are directed from left to right. Therefore, there
is a second positive deflection in leads V1-V2 (ie, an RSR', RR',
or only a broad R complex) and a broad terminal negative
deflection or S wave in leads I and VS-V6.
• Right ventricular repolarization is abnormal and hence there may
be secondary ST-T wave c;hat~gCs seen in leads V1-V3.
Since right ventricular activation is abnormal, right ventricular
hypertrophy cannot be reliably recognized. However, left ventricular
activation is normal and so the initial portion of the QRS complex
or R wave, which represents left ventricular activation, is normal.
Therefore, left ventricular abnormalities (eg, left ventricular hyper
trophy, myocardial ischemia or infarction, pericarditis) can be
rcc:ognizcd in the presence of an RBBB.
A left anterior fascicular block (extreme left axis) or left posterior
fascicular block (right axis) may also be present. This is termed bifas
cicular block. However, it must be remembered that with an RBBB
there is a broad terminal S wave in lead I that may give the appear
ance of a negative QRS complex in lead I and hence a right axis. The
terminal S wave, which represents delayed right ventricular attivation.
should not be considered when determining the axis in the frontal plane
as this is based on left ventricular aruvation.
10
·~<XImpltxdln1!0ftli00.12st< •<IS"""'plalns.dVl;_R_I'n_I,VS,ondYI!i • N~_,., '-!to,nolllllbl Q-ln s.d ~IIVI.<rVS·YI!i,onl no m\1111 stJ>QI R~ In Ieee! VII •AIIf-dlnlclodrighttaloll;n~loft~hlt'aiC'II (t.,nourmlniiS_,.Inladl,a111,01YI!ilfldnollglrtuh)
Figure o. c.-plete left ...,. ... ._ 11,.11c:h lll.c:k.
An RBBB may be intermittent or rate-related, termed a functional
bundle branch block. A rate-related RBBB may occur at any heart rate.
Not uncommonly it resolves at a heart rate that is slower than the rate
at which it develops. With a rate-related RBBB, the widening of the
QRS complex occiUll abruptly and resolves abrupdy; it is not gradual.
A QRS complex that has an RBBB morphology but a duration that is
between 0.10 and 0.12 second has been called an incomplete RBBB but
.iJ actually an IVCD with conduruon delay to the right ventricle.
Introduction: Conduction Abnormalities L_ ____________________________________________________________________ __
Left Bundle Branch Block
An LBBB has the following characteristic morphology (FIGURE 6):
• The QRS complex duration is 0.12 second or longer due to
delayed and slow activation of the left ventricle.
• Left ventricular activation is entirely from the right bundle and
right ventricle and travels directly through the myocardium
(hence prolonging the QRS complex duration).
• All ventricular forces are directed from right to left. Hence
there is a broad, tall R wave in leads I, aVL, and V5-V6 (although
a deep QS complex may be seen in leads VS-V6) and deep
QS complexes in lead Vl and occasionally in lead V2. There
should not be any ventricular forces directed from left to right.
If there is an LBBB pattern present, but there are terminal
S waves in leads I and V6, the etiology for the widened QRS
complex is an IVCD.
• As an LBBB also involves the septal branch of the left bundle,
there are no septal forces present; that is, small septal Q waves
in leads I, aVL, and V5-V6 are not seen and there is no septal
R wave in lead Vl. If there is an LBBB pattern present in
addition to septal forces, the etiology is an IVCD.
• Abnormal ventricular repolarization is associated with an
LBBB, and hence there are typically diffuse secondary ST-T
wave abnormalities.
• The QRS axis in the frontal plane may be normal or leftward.
A left axis may represent abnormalities in the direction
of impulse conduction through the left ventricular myocardium
(eg, due to the presence of fibrosis) and is not a left anterior
fascicular block as both fascicles are blocked. A right axis should
not be seen with an LBBB as all forces are directed from
right to left.
Since left ventricular activation is abnormal (ie, bypassing the
normal His-Purkinje system), abnormalities affecting the left ven
tricular myocardium (eg, left ventricular hypertrophy, myocardial
ischemia and chronic infarction, pericarditis) cannot be recognized.
However, an acute MI can be established with an LBBB (or any other
situation in which there is direct myocardial activation, such as ven
tricular pacing, a ventricular complex, and likely a preexcited complex
in Wolff-Parkinson-White pattern) using the Sgarbossa criteria:
• ST-segment elevation of 1 or 2 mm or more that is in the
same direction (concordant) as the QRS complex in any lead
• ST-segment depression of 1 mm or more in any lead from
Vl toV3
• ST-segment elevation of 5 mm or more that is discordant with
the QRS complex (ie, associated with a QS or rS complex)
An LBBB may be intermittent or rate-related (functional bun
dle branch block). As with an intermittent RBBB, a rate-related
LBBB may occur at any heart rate. Not uncommonly, it resolves at
a heart rate that is slower than the rate at which it develops. With a
11
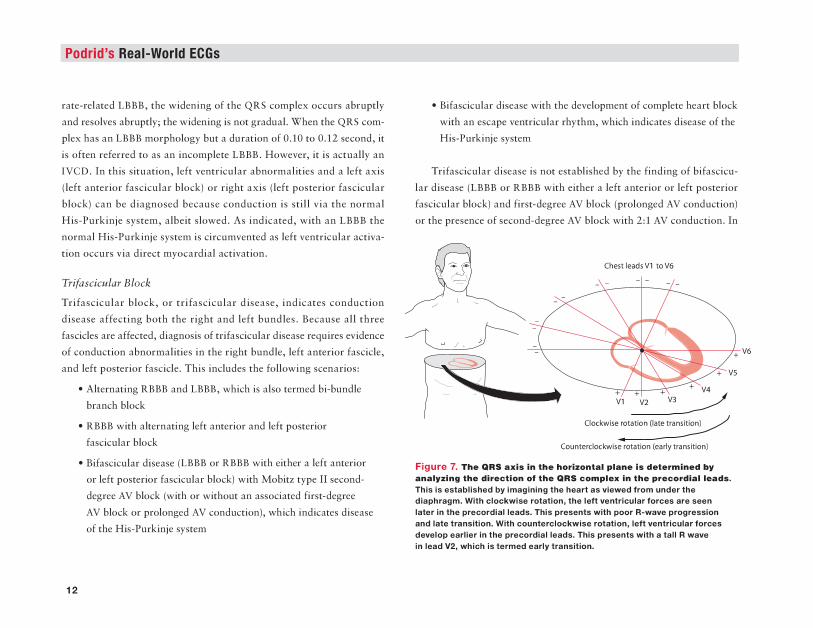
Podrld's Real-World ECGs
rate-related LBBB, the widening of the QRS complex occurs abruptly
and resolves abruptly; the widening is not gradual. When the QRS com
plex has an LBBB morphology but a duration of 0.10 to 0.12 second, it
is often referred to as an incomplete LBBB. However, it is actually an
IVCD. In this situation, left ventricular abnormalities and a left axis
(left anterior fascicular block) or right axis (left posterior fascicular
block) can be diagnosed because conduction is still via the normal
His-Purkinje system, albeit slowed. As indicated, with an LBBB the
normal His-Purkinje system is circumvented as left ventricular activa
tion occurs via direct myocardial activation.
Trifascicular Block
Trifascicular block, or trifascicular disease, indicates conduction
disease affecting both the right and left bundles. Because all three
fascicles are affected, diagnosis of trifascicular disease requires evidence
of conduction abnormalities in the right bundle, left anterior fascicle,
and left posterior fascicle. This includes the following scenarios:
12
• Alternating RBBB and LBBB, which is also termed hi-bundle
branch block
• RBBB with alternating left anterior and left posterior
fascicular block
• Bifascicular disease (LBBB or RBBB with either a left anterior
or left posterior fascicular block) with Mobitz type II second
degree AV block (with or without an associated first-degree
AV block or prolonged AV conduction), which indicates disease
of the His-Purkinje system
• Bifascicular disease with the development of complete heart block
with an escape ventricular rhythm, which indicates disease of the
His-Purkinje system
Trifasdcular disease is not established by the finding of bifascicu
lar disease (LBBB or RBBB with either a left anterior or left posterior
fascicular block) and first-degree AV block (prolonged AV conduction)
or the presence of second-degree AV block with 2:1 AV conduction. In
ChestleadsV1 toV6
Counterdockwise rotation (early transition)
Figura 7. Tho QRS axla In tho horlz-tal plana Ia determined by -• .. zing tha dlractl- err tha QRS complox In tho precordial laada. This is established by imagining the heart as viewed from undar tha diaphragm. With clockwlaa rotation, tha laft ventricular forcaa ara aaan later in the precordial leads. This presents with poor R-wave progression and late transition. With counterclockwise rotation, left ventricular force• develop aarllar In tha precordlallaada. Thla preaanta with a tall R wave in lead Y2, which iatenned early transition.
Introduction: Conduction Abnormalities L_ ____________________________________________________________________ __
these situations the AV conduction abnormality may be within either
the AV node or the His-Purkinje system (in which case trifascicular
disease cannot be definitively diagnosed). Trifascicular disease can only
be established if there is evidence of a conduction abnormality within
the remaining fascicle.
Axis in the Horizontal Plane
In addition to the axis in the frontal plane (ie, normal, right, left,
indeterminate), there is also an axis in the horizontal plane of the
heart. However, abnormalities in the axis of the horizontal plane are
not the result of a conduction abnormality. The axis in the horizontal
plane is established by imagining the heart as viewed from under the
diaphragm (FIGURE 7). In this situation, the right ventricle is in front
and the left ventricle is to the left. When there is an electrical rotation
in a clockwise direction, right ventricular forces are still present in
the lateral precordial leads, while the development of left ventricular
forces is delayed. In this situation there is poor R-wave progression
from leads Vl-V3 or V4 and late transition (ie, the R wave does not
develop an amplitude greater than the S wave until lead VS-V6) com
pared with the normal transition between leads V3-V4. The poor
R-wave progression should not be confused with an anterior wall MI.
When there is counterclockwise rotation, the left ventricular forces
develop earlier and there is a tall R wave in lead V2 (ie, early tran
sition). The tall R wave in lead V2 should not be confused with a
posterior wall MI or right ventricular hypertrophy, in which there is a
tall R wave in lead Vl.
Enhanced Atrioventricular Conduction
In addition to slowing or block of AV conduction, AV conduction may
be fast, due either to enhanced (accelerated) conduction through the
AV node or to an accessory pathway (bypass tract) that bypasses the
AV node (which is the site of slowest impulse conduction in the heart),
serving as a second pathway for AV conduction from the atria to the
ventricles. With enhanced AV conduction, the ECG shows a short
(:$ 0.14 sec) PR interval at a normal rate (ie, < 100 bpm). It should
be remembered that a short PR interval may also be seen with sinus
tachycardia due to enhanced conduction through the AV node resulting
from sympathetic stimulation.
There are two patterns for enhanced AV conduction due to a bypass
tract. These patterns are also called preexcitation.
Wolff-Parkinson-White Pattern
Wolff-Parkinson-White pattern is due to an AV nodal bypass tract
called the bundle of Kent, which is a direct connection between
the atrial and ventricular myocardium, resulting in early ventricu
lar myocardial activation that precedes activation via the AV node
(ill, preexcitation). The QRS complex is widened as a result of the
early, direct, and slow myocardial activation via the accessory pathway,
which bypasses the normal AV node-His-Purkinje system. Thereafter
there is normal ventricular activation via the AV node-His-Purkinje
system. The QRS complex is, therefore, a fusion beat representing early
but slow ventricular activation initiated via the accessory pathway
and normal ventricular activation via the AV node-His-Purkinje
13
Podrld's Real-World ECGs Introduction: Conduction Abnormalities ---------------------------------------
system. As a result, the initial upstroke of the QRS complex is slowed
due to direct myocardial activation. This is termed a delta wave, which
produces a widening of the initial portion of the QRS complex, while the
remainder of the QRS complex, due to activation via the His-Purkinje
system, is narrow. The degree of aberration (delta wave width) is related
to the balance between conduction through the AV node and accessory
pathway, which is determined by AV nodal conduction because con
duction through the accessory pathway is fixed (ie, it is all or none as
it is Purkinje-like tissue). Hence if AV nodal conduction is slow, more
of the initiation of ventricular activation is via the accessory pathway,
resulting in a shorter PR interval and wider delta wave. If AV nodal
conduction is fast, then less ventricular myocardial activation is via
the accessory pathway and the PR interval is longer and the delta wave
narrower. As the QRS complex in Wolff-Parkinson-White pattern is
14
a fusion complex, the degree of fusion may vary from one period of
time to another, as changes in AV nodal conduction may occur in a
variable and unpredictable fashion, in part related to changes in auto
nomic inputs into the AV node. Hence there may be variability in the
PR interval and width of the QRS complex (ie, prominence of the delta
wave). This is termed the concertina effect.
Lown-Ganong-Levine Pattern
Lown-Ganong-Levine pattern results from conduction via a bypass
tract known as the bundle of James, which is a connection between
the atrium and the bundle of His. Since the AV node is bypassed, the
PR interval is short. However, ventricular activation is via the normal
His-Purkinje system and, therefore, the QRS complex (morphology and
duration) is normal. •
IntroductionArrhythmias
The key to rhythm analysis is a comprehensive and organized approach to the ECG, looking carefully at each lead. This approach includes
two prim ary steps: looking for P waves and exam ining the QRS
complexes.
Approach to Rhythm A n a ly s is
Look forP Waves
The P wave is the key to rhythm analysis. Each lead needs to be exam
ined carefully. P waves may not be immediately apparent, and they may
be at the end of a T wave or within a T wave or even an ST segment. Since the upstroke and downstroke of the T wave and the ST segment
should be smooth, any bumps, notches, or irregularities in the T wave or ST segment could be superimposed P waves. Importantly, look for
P waves after any pause in the rhythm. The following questions need
to be addressed when analyzing the P waves:
• Are P waves present or absent?
• Is the P-wave morphology normal (sinus rhythm should have positive P waves in leads I, II, aVF, and V4-V6) or abnormal
(inverted or biphasic P wave in leads where it should be positive)?
• What is the P-wave (atrial) rate?
• Are the P waves occurring with regular or irregular PP intervals?
• What is the relationship between the P wave and QRS complex?
There should be a P wave before or after each QRS complex, and the PR (or RP) interval should be constant. If it is not constant, is
it variable with a pattern {ie, Wenckebach) or without a pattern
{ie, AV dissociation)?
Examine the QRS Complexes
Next consider the QRS complexes, addressing the following questions:
• Are the QRS complexes narrow or wide, normal or abnormal?
• What is the QRS complex (ventricular) rate?
• What is the pattern of the QRS complex intervals
{ie, RR intervals)? Are they regular, regularly irregular
{ie, irregular RR intervals with a pattern to the irregularity),
or irregularly irregular {ie, RR intervals that are random
without any pattern)?
Importantly, only three supraventricular rhythms are irregularly
irregular: sinus arrhythmia, in which there is one P-wave morphol
ogy and PR interval; wandering atrial pacemaker or multifocal atrial rhythm (rate < 100 bpm) or multifocal atrial tachycardia (rate > 100 bpm),
in which there are three or more different P-wave morphologies and
1
Podrid’s Real-World ECGs
PR intervals without any one P wave being dom inant; and atrial
fibrillation, in which there is no organized atrial activity or distinct
P wave. Polymorphic ventricular tachycardia also has QRS complexes that are irregularly irregular in interval and very variable in QRS mor
phology. Polymorphic ventricular tachycardia usually has a very rapid
rate. Atrial tachycardia or atrial flutter may have variable RR intervals,
but there will be a pattern based on the degree of AV block; hence these
rhythms are regularly irregular.
S in u s Rhythm
Since the sinus node is located in the right atrium, the sinus P wave is
upright in leads I, II, aVF, and V4-V6 and is inverted in lead aVR. The
sinus P wave is usually biphasic in lead V I, reflecting right atrial activa
tion (impulse going toward lead VI) followed by left atrial activation (impulse going away from lead VI). There is one P-wave morphology.
Although not necessary to establish a sinus rhythm, there is usually a
stable PR interval. There are five types of sinus rhythm:
• Norm al sinus rhythm is a regular rhythm with a stable
PP interval at a rate of 60 to 100 bpm.
• Sinus bradycardia is a regular rhythm with a stable PP interval
at a rate less than 60 bpm.
• Sinus tachycardia is a regular rhythm with a stable PP interval
at a rate higher than 100 bpm; if seen, rate increase at onset and
rate decrease at offset occur gradually.
• Sinus node reentry is a regular rhythm with a stable PP interval,
usually at a rate higher than 100 bpm. It resembles sinus
tachycardia, but the rate increase at onset and rate decrease at offset are abrupt.
2
• Sinus arrhythmia is an irregularly irregular rhythm. The heart rate (PP interval) is variable due to respiration (ie, it is a
respirophasic arrhythmia). The sinus rate increases with
inspiration and decreases with expiration as a result of changing vagal inputs into the sinus node.
S in u s Node Pause
A sinus node pause is identified by a pause in rhythm (long RR interval)
with the absence of a P wave during the pause. There are two etiologies
for a sinus node pause:
• Sinus node exit block: The sinus node generates an impulse on time, but the impulse does not exit the sinus node region to
activate the atrium. The duration of the pause (ie, PP interval
around the pause) is twice the underlying sinus PP interval.
• Sinus node arrest: The sinus node fails to develop an impulse.
The duration of the pause (ie, PP interval around the pause) is unrelated to the underlying sinus rate. It may be shorter or
longer than two sinus PP intervals. A pause that is longer
than two sinus intervals may be suggestive of sinus node
dysfunction (sick sinus syndrome).
Prem ature Atrial Com plex
Premature atrial complex (PAC) is synonymous with premature atrial
beat, atrial premature beat, atrial premature complex, premature atrial
extrasystole, and atrial premature extrasystole. It has the following characteristics:
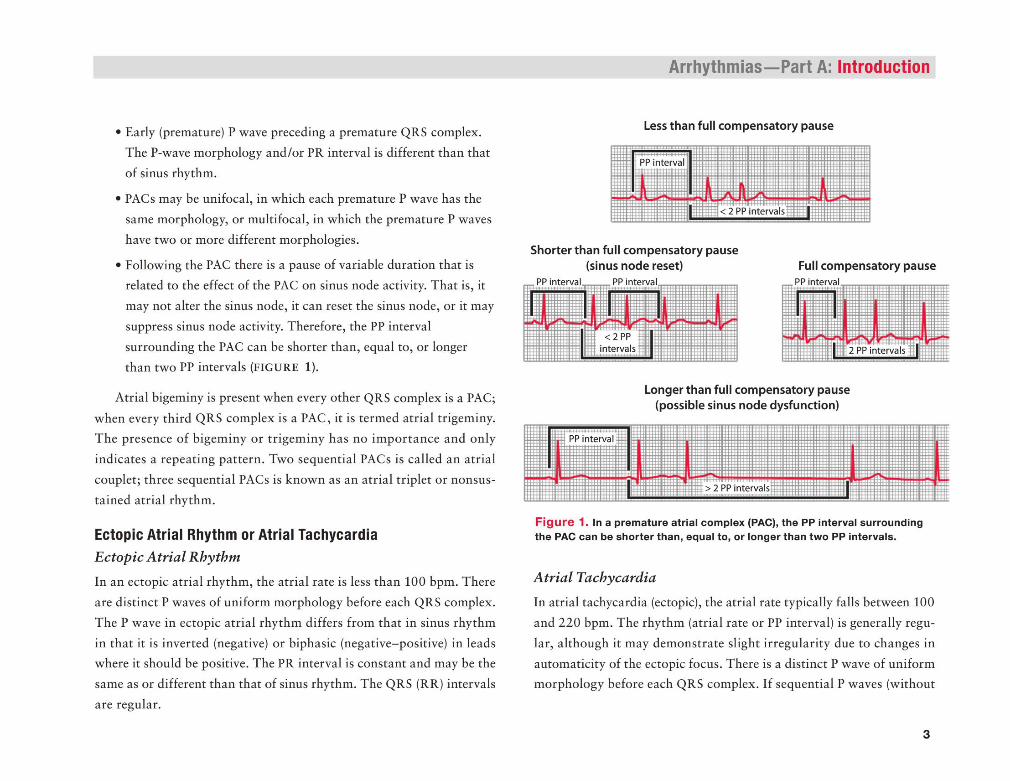
• Early (premature) P wave preceding a premature QRS complex.
The P-wave morphology and/or PR interval is different than that
of sinus rhythm.
• PACs may be unifocal, in which each premature P wave has the
same morphology, or multifocal, in which the premature P waves
have two or more different morphologies.
• Following the PAC there is a pause of variable duration that is
related to the effect of the PAC on sinus node activity. That is, it
may not alter the sinus node, it can reset the sinus node, or it may
suppress sinus node activity. Therefore, the PP interval
surrounding the PAC can be shorter than, equal to, or longer than two PP intervals (FIGURE 1).
Atrial bigeminy is present when every other QRS complex is a PAC;
when every third QRS complex is a PAC, it is termed atrial trigeminy.
The presence of bigeminy or trigeminy has no importance and only
indicates a repeating pattern. Two sequential PACs is called an atrial
couplet; three sequential PACs is known as an atrial triplet or nonsus
tained atrial rhythm.
Ectopic Atrial Rhythm or Atrial Tachycardia
Ectopic Atrial Rhythm
In an ectopic atrial rhythm, the atrial rate is less than 100 bpm. There
are distinct P waves of uniform morphology before each QRS complex.
The P wave in ectopic atrial rhythm differs from that in sinus rhythm
in that it is inverted (negative) or biphasic (negative-positive) in leads where it should be positive. The PR interval is constant and may be the
same as or different than that of sinus rhythm. The QRS (RR) intervals
are regular.
Arrhythmias— Part A: Introduction
Less than full compensatory pause
Shorter than full compensatory pause(sinus node reset) Full compensatory pause
Longer than full compensatory pause (possible sinus node dysfunction)
F ig u re 1. In a prem ature atrial complex (PAC), the PP interval surrounding the PAC can be shorter than, equal to, or longer than tw o PP intervals.
Atrial Tachycardia
In atrial tachycardia (ectopic), the atrial rate typically falls between 100
and 220 bpm. The rhythm (atrial rate or PP interval) is generally regu
lar, although it may demonstrate slight irregularity due to changes in
automaticity of the ectopic focus. There is a distinct P wave of uniform morphology before each QRS complex. If sequential P waves (without
3
Podrid’s Real-World ECGs
QRS complexes) are seen (ie, when AV block present), then distinct
P waves can be seen with an isoelectric baseline between each. The
PR interval may be constant or variable if Wenckebach is present.
Slightly variable PR intervals may also be seen as a result of antegrade concealed AV nodal conduction, which refers to an atrial impulse that
does not completely conduct through the AV node. As conduction
velocity through the AV node may variable, some of the atrial impulses
conduct entirely through the AV node, some are completely blocked
within the AV node, and others conduct partially through the AV node
and are extinguished within the node (concealed). Since the AV node is not completely depolarized, it is capable of conducting the next atrial
impulse, but at a slower rate. In this situation there is also slight variability of the ventricular rate.
The QRS intervals are regular or may be regularly irregular if variable AV block (eg, a variable pattern of 2:1 , 3:1, 4:1, 5:1, etc, or even
Wenckebach) is present.
Multifocal Atrial Rhythm /Multifocal Atrial Tachycardia
In multifocal atrial tachycardia (atrial rate > 100 bpm) and wandering
atrial pacemaker or multifocal atrial rhythm (atrial rate < 100 bpm),
there is a distinct P wave before each QRS complex. However, the P-wave morphologies are variable and three or more different P-wave
morphologies are present. A dominant P-wave morphology cannot be
identified. The PR intervals also vary. The PP and RR intervals are
irregularly irregular (ie, there is no pattern to the irregularity).
4
Atrial Flutter
Typical Atrial FlutterIn typical atrial flutter, the atrial rate is usually 260 to 320 bpm and the
flutter waves are regular as the mechanism of the arrhythmia is reen
try around a fixed circuit, which involves the entire right atrium. The circuit is a result of an area of slow conduction due to fibrosis of the
isthmus (ie, an anatomic block), which is located between the inferior
vena cava and the tricuspid annulus. Hence typical flutter is termed
isthmus dependent. The atrial flutter rate may be slower than 260 bpm
as a result of anti-arrhythmic drugs or disease of the atrial myocardium; however, the waveforms maintain the typical flutter morphology.
The flutter waves, which are negative/positive in leads II, III, and
AVF (due to counterclockwise rotation of the impulse), are uniform
in morphology, amplitude, and interval. There is no isoelectric base
line between sequential flutter waves as there is continuous electrical activity. The atrial flutter waves have a continuously undulating (saw
tooth) morphology, reflecting the underlying mechanism of a reentrant
circuit resulting in depolarization of the right followed by the left
atrium. The QRS complex intervals are regular or regularly irregular if variable AV block (eg, a variable pattern of 2 :1 , 3:1, 4 :1 , 5:1, etc,
or even Wenckebach) is present. In addition, there may be a variable
relationship between flutter wave and QRS complex due to antegrade concealed AV nodal conduction (similar to what may be seen
with atrial tachycardia). As conduction velocity through the AV node
may be variable, some of the atrial impulses conduct entirely through the AV node, some are completely blocked within the AV node, and
others conduct partially through the AV node and are extinguished
within the node (concealed). Because the AV node is not completely
depolarized, it is capable of conducting the next atrial impulse, but
at a slower rate. In this situation there is also slight variability of the ventricular rate.
Atypical Atrial Flutter
In atypical atrial flutter the atrial rate is regular (ie, between 320 and
400 bpm). Similar to typical flutter, the mechanism is reentry within
the right atrial myocardium. However, there is no anatomic block or area of slow conduction as is seen with typical atrial flutter; hence
atypical atrial flutter is not isthmus dependent. In contrast, there are
functional changes in membrane refractoriness in a small area of the
atrial myocardium that account for the reentrant circuit. Therefore,
the circuit is smaller and the velocity of impulse conduction is more rapid as there is only a functional change in refractoriness and not
a slowing of conduction as a result of fibrosis. This accounts for the
faster atrial rate.
The flutter waves are positive in leads II , I II , and aVF (due to
clockwise rotation). As with typical atrial flutter, they are uniform in
morphology, amplitude, and interval. There is no isoelectric baseline between sequential flutter waves; they are continuously undulating
(saw tooth). Similar to typical atrial flutter, the QRS intervals are
regular or regularly irregular (if AV block is present). As with typical
atrial flutter, AV block may be constant or variable; Wenckebach may
also be present. In addition, antegrade concealed conduction may also
be present.
Arrhythmias— Part A: Introduction
Atrial Fibrillation
There is no organized atrial activity or distinct P wave in atrial fibrilla
tion; fibrillatory waves are present. The atrial rate usually ranges from
320 to 450 bpm but can be even more rapid. Fibrillatory waves are usually coarse (> 2 mm) when atrial fibrillation is recent in onset and
fine (low-amplitude oscillations) when atrial fibrillation is of longer
duration. When coarse, fibrillatory waves may resemble flutter waves
(particularly in lead V I); however, fibrillatory waves are irregular in
morphology, amplitude, and interval while flutter waves are regular. In addition, QRS complex intervals in atrial fibrillation are irregularly
irregular as the conduction to the ventricle is dependent on conduction
through the AV node, which will be irregular. The maximum heart rate depends on AV nodal conduction; generally the ventricular rate
reaches 170 bpm when the AV node is normal and when no AV nodal
blocking agents are being used. Ventricular rates faster than 200 bpm generally reflect an increase in AV nodal conduction velocity, usually a
result of increased sympathetic tone or an increase in circulating cate
cholamines. Ventricular rates less than 100 bpm result from enhanced
vagal tone, use of an AV nodal blocking agent (digoxin, |3-blocker, or
calcium-channel blocker), or intrinsic AV nodal disease.
Atrioventricu lar Nodal (Junctional) Rhythm s
In AV nodal rhythms there is no P wave in front of the QRS complex.
An inverted or retrograde P wave (most importantly in lead aVF, which
is perpendicular to the atria) may be present following the QRS complex as a result of ventriculoatrial (VA) conduction. The RP interval is
5
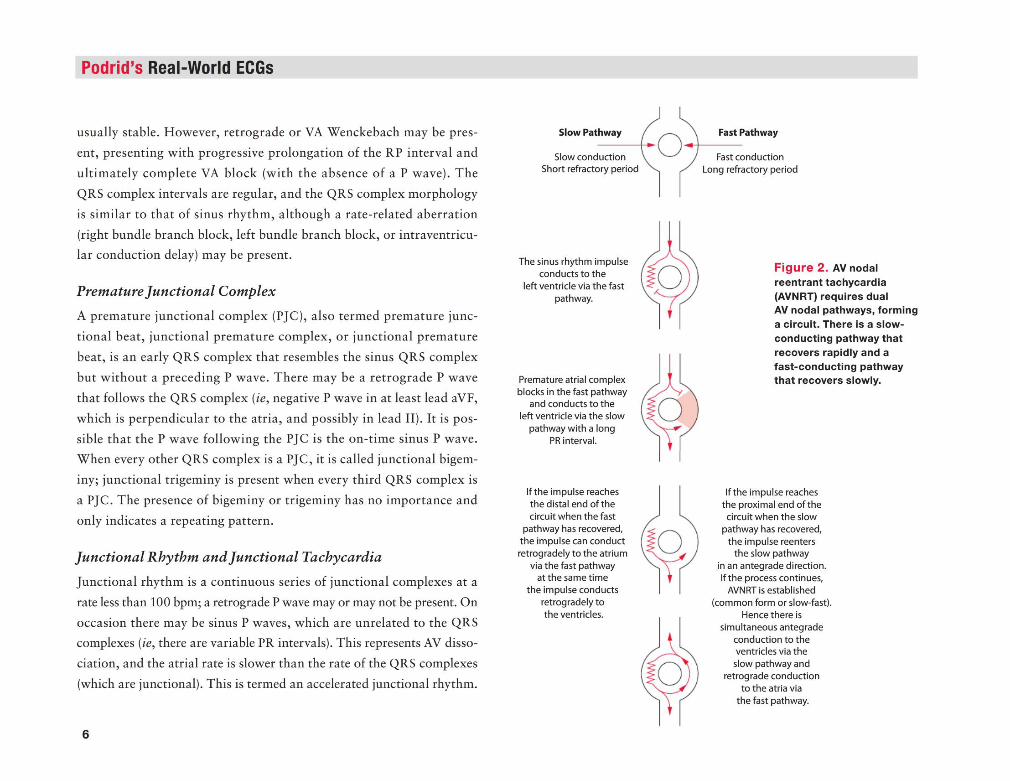
Podrid’s Real-World ECGs
usually stable. However, retrograde or VA Wenckebach may be pres
ent, presenting with progressive prolongation of the RP interval and
ultimately complete VA block (with the absence of a P wave). The
QRS complex intervals are regular, and the QRS complex morphology
is similar to that of sinus rhythm, although a rate-related aberration
(right bundle branch block, left bundle branch block, or intraventricu- lar conduction delay) may be present.
Premature Junctional Complex
A premature junctional complex (PJC), also termed premature junc
tional beat, junctional premature complex, or junctional premature
beat, is an early QRS complex that resembles the sinus QRS complex
but without a preceding P wave. There may be a retrograde P wave
that follows the QRS complex (ie, negative P wave in at least lead aVF,
which is perpendicular to the atria, and possibly in lead II). It is pos
sible that the P wave following the PJC is the on-time sinus P wave. When every other QRS complex is a PJC, it is called junctional bigem
iny; junctional trigeminy is present when every third QRS complex is
a PJC. The presence of bigeminy or trigeminy has no importance and
only indicates a repeating pattern.
Junctional Rhythm and Junctional Tachycardia
Junctional rhythm is a continuous series of junctional complexes at a
rate less than 100 bpm; a retrograde P wave may or may not be present. On
occasion there may be sinus P waves, which are unrelated to the QRS complexes (ie, there are variable PR intervals). This represents AV disso
ciation, and the atrial rate is slower than the rate of the QRS complexes
(which are junctional). This is termed an accelerated junctional rhythm.
6
Slow Pathway
Slow conduction Short refractory period
o Fast Pathway
Fast conduction Long refractory period
The sinus rhythm impulse conducts to the
left ventricle via the fast pathway.
Premature atrial complex blocks in the fast pathway
and conducts to the left ventricle via the slow
pathway with a long PR interval.
F ig u re 2 . AV nodal reentrant tachycardia (AVNRT) requires dual AV nodal pathways, forming a circuit. There is a slow- conducting pathway that recovers rapidly and a fast-conducting pathway that recovers slowly.
If the impulse reaches the distal end of the circuit when the fast
pathway has recovered, the impulse can conduct retrogradely to the atrium
via the fast pathway at the same time
the impulse conducts retrogradely to the ventricles.
d
If the impulse reaches the proximal end of the circuit when the slow
pathway has recovered, the impulse reenters
the slow pathway in an antegrade direction. If the process continues,
AVNRT is established (common form or slow-fast).
Hence there is simultaneous antegrade
conduction to the ventricles via the slow pathway and
retrograde conduction to the atria via
the fast pathway.
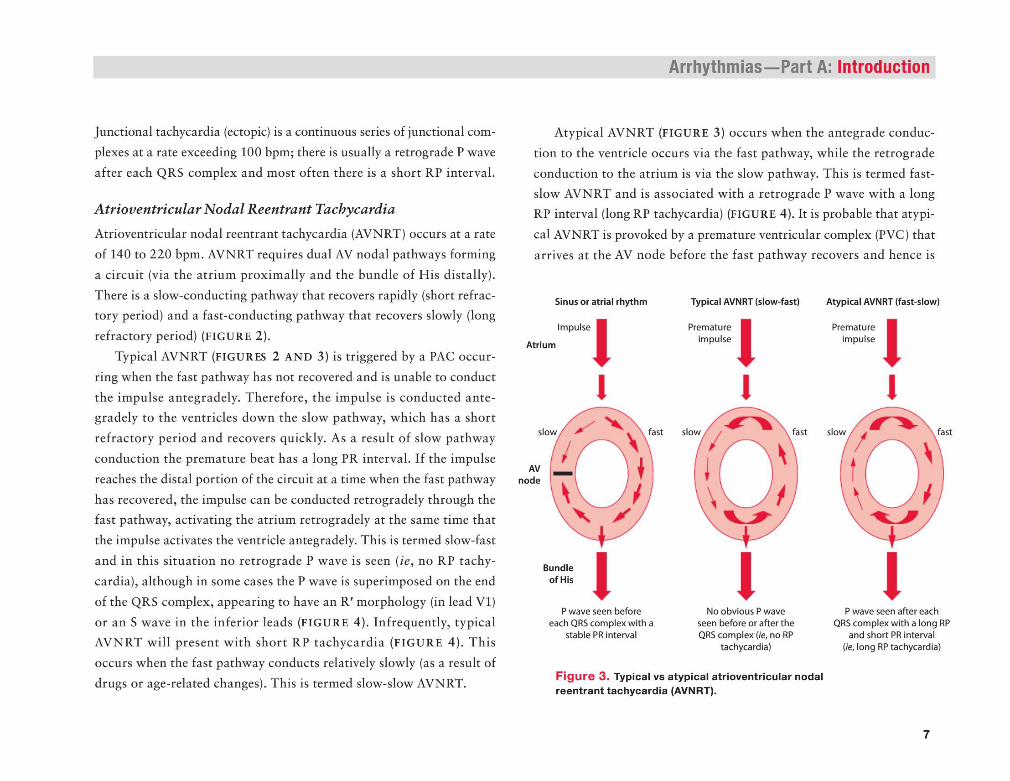
Junctional tachycardia (ectopic) is a continuous series of junctional com
plexes at a rate exceeding 100 bpm; there is usually a retrograde P wave
after each QRS complex and most often there is a short RP interval.
Atrioventricular Nodal Reentrant Tachycardia
Atrioventricular nodal reentrant tachycardia (AVNRT) occurs at a rate
of 140 to 220 bpm. AVNRT requires dual AV nodal pathways forming
a circuit (via the atrium proximally and the bundle of His distally).
There is a slow-conducting pathway that recovers rapidly (short refractory period) and a fast-conducting pathway that recovers slowly (long
refractory period) (FIGURE 2).
Typical AVNRT (FIGURES 2 AND 3) is triggered by a PAC occur
ring when the fast pathway has not recovered and is unable to conduct
the impulse antegradely. Therefore, the impulse is conducted ante- gradely to the ventricles down the slow pathway, which has a short
refractory period and recovers quickly. As a result of slow pathway
conduction the premature beat has a long PR interval. If the impulse
reaches the distal portion of the circuit at a time when the fast pathway
has recovered, the impulse can be conducted retrogradely through the fast pathway, activating the atrium retrogradely at the same time that
the impulse activates the ventricle antegradely. This is termed slow-fast
and in this situation no retrograde P wave is seen (ie, no RP tachy
cardia), although in some cases the P wave is superimposed on the end
of the QRS complex, appearing to have an R ' morphology (in lead VI)
or an S wave in the inferior leads (FIGURE 4). Infrequently, typical AVNRT will present with short RP tachycardia (FIGURE 4). This
occurs when the fast pathway conducts relatively slowly (as a result of
drugs or age-related changes). This is termed slow-slow AVNRT.
Arrhythmias— Part A: Introduction
Atypical AVNRT (FIGURE 3) occurs when the antegrade conduc
tion to the ventricle occurs via the fast pathway, while the retrograde
conduction to the atrium is via the slow pathway. This is termed fast- slow AVNRT and is associated with a retrograde P wave with a long RP interval (long RP tachycardia) (FIGURE 4). It is probable that atypi
cal AVNRT is provoked by a premature ventricular complex (PVC) that arrives at the AV node before the fast pathway recovers and hence is
Sinus or atrial rhythm Typical AVNRT (slow-fast) Atypical AVNRT (fast-slow)
P wave seen after each QRS complex with a long RP
and short PR interval (fe, long RP tachycardia)
F ig u re 3 . Typical vs atypical atrioventricular nodal reentrant tachycardia (AVNRT).
P wave seen before each QRS complex with a
stable PR interval
No obvious P wave seen before or after the QRS complex [ie, no RP
tachycardia)
Impulse
Atrium
Bundle of His
Prematureimpulse
Prematureimpulse
7
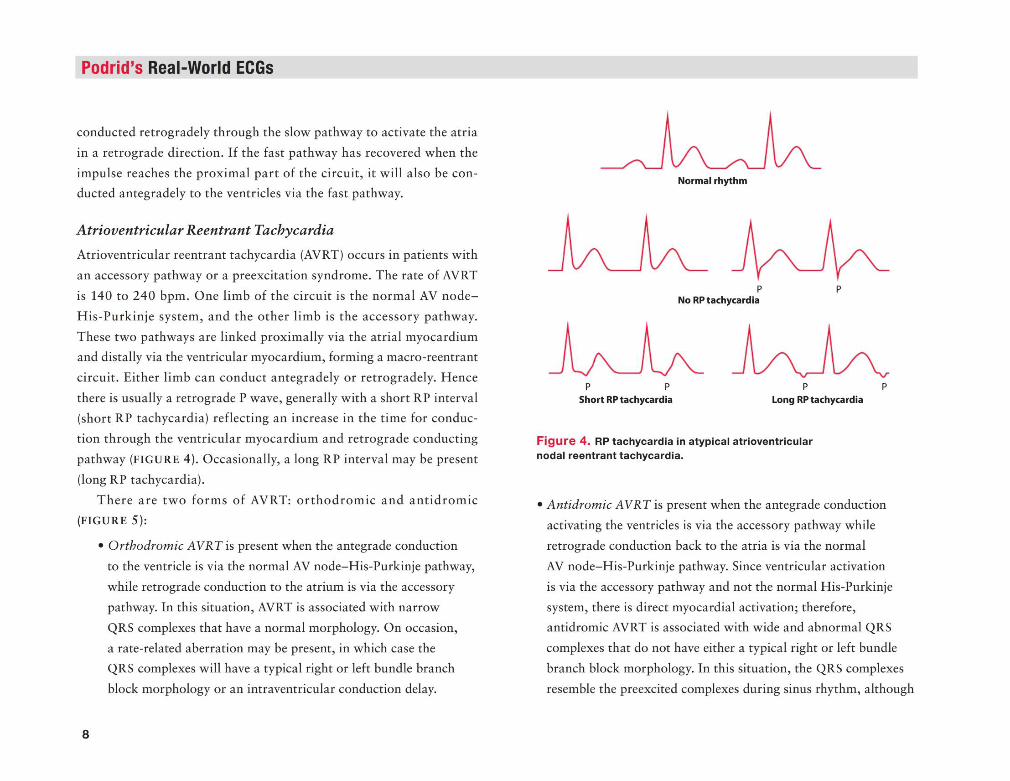
Podrid’s Real-World ECGs
conducted retrogradely through the slow pathway to activate the atria
in a retrograde direction. If the fast pathway has recovered when the
impulse reaches the proximal part of the circuit, it will also be conducted antegradely to the ventricles via the fast pathway.
Atrioventricular Reentrant Tachycardia
Atrioventricular reentrant tachycardia (AVRT) occurs in patients with
an accessory pathway or a preexcitation syndrome. The rate of AVRT
is 140 to 240 bpm. One limb of the circuit is the normal AV node-
His-Purkinje system, and the other limb is the accessory pathway.
These two pathways are linked proximally via the atrial myocardium and distally via the ventricular myocardium, forming a macro-reentrant
circuit. Either limb can conduct antegradely or retrogradely. Hence
there is usually a retrograde P wave, generally with a short RP interval (short RP tachycardia) reflecting an increase in the time for conduc
tion through the ventricular myocardium and retrograde conducting
pathway (FIGURE 4). Occasionally, a long RP interval may be present
(long RP tachycardia).
There are two form s of AVRT: orthodrom ic and antidrom ic (FIGURE 5):
• Orthodromic AVRT is present when the antegrade conduction
to the ventricle is via the normal AV node-His-Purkinje pathway,
while retrograde conduction to the atrium is via the accessory
pathway. In this situation, AVRT is associated with narrow
QRS complexes that have a normal morphology. On occasion,
a rate-related aberration may be present, in which case the
QRS complexes will have a typical right or left bundle branch
block morphology or an intraventricular conduction delay.
8
Norm al rhythm
F ig u re 4 . RP tachycardia in atypical atrioventricular nodal reentrant tachycardia.
• Antidromic AVRT is present when the antegrade conduction
activating the ventricles is via the accessory pathway while
retrograde conduction back to the atria is via the normal
AV node-His-Purkinje pathway. Since ventricular activation
is via the accessory pathway and not the normal His-Purkinje
system, there is direct myocardial activation; therefore, antidromic AVRT is associated with wide and abnormal QRS
complexes that do not have either a typical right or left bundle
branch block morphology. In this situation, the QRS complexes
resemble the preexcited complexes during sinus rhythm, although
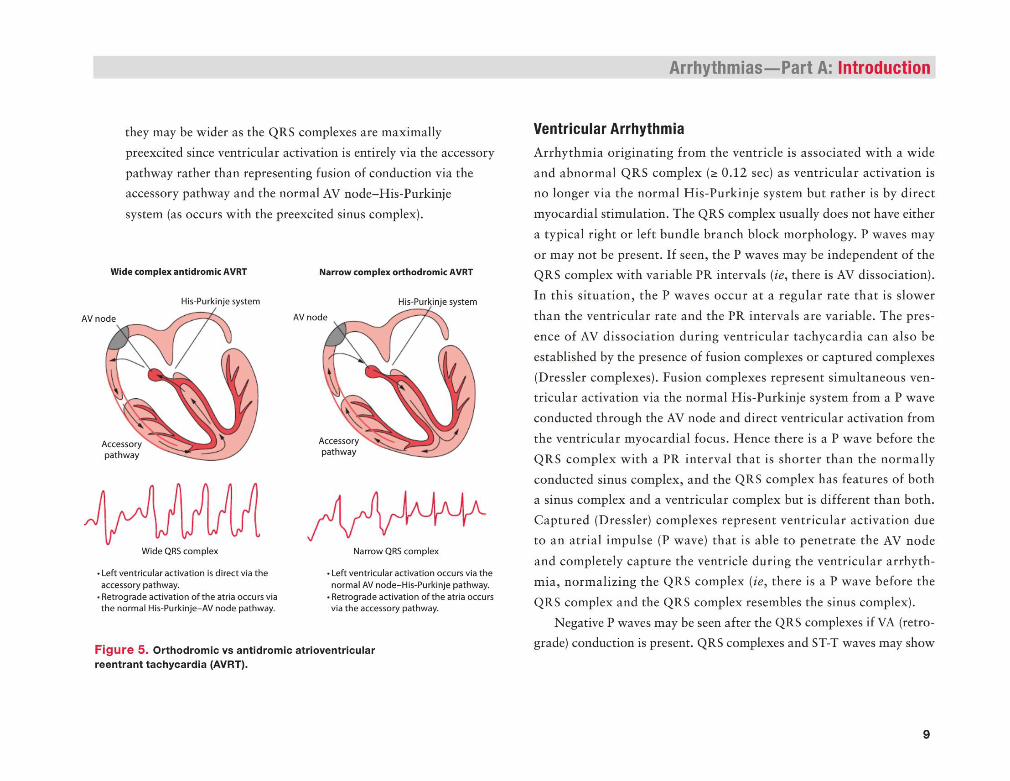
they may be wider as the QRS complexes are maximally
preexcited since ventricular activation is entirely via the accessory
pathway rather than representing fusion of conduction via the accessory pathway and the normal AV node-His-Purkinje
system (as occurs with the preexcited sinus complex).
Narrow complex orthodromic AVRT
His-Purkinje system
AV node
Accessorypathway
Wide complex antidromic AVRT
AV node
Accessorypathway
Left ventricular activation is direct via the accessory pathway.Retrograde activation of the atria occurs via the normal His-Purkinje-AV node pathway.
Narrow QRS complex
Left ventricular activation occurs via the normal AV node-His-Purkinje pathway. Retrograde activation of the atria occurs via the accessory pathway.
F ig u re 5 . Orthodrom ic vs antidrom ic atrioventricular reentrant tachycardia (AVRT).
Arrhythmias— Part A: Introduction
Ventricular A rrhythm ia
Arrhythmia originating from the ventricle is associated with a wide and abnormal QRS complex (> 0.12 sec) as ventricular activation is
no longer via the normal His-Purkinje system but rather is by direct
myocardial stimulation. The QRS complex usually does not have either
a typical right or left bundle branch block morphology. P waves may
or may not be present. If seen, the P waves may be independent of the QRS complex with variable PR intervals (ie, there is AV dissociation).
In this situation, the P waves occur at a regular rate that is slower
than the ventricular rate and the PR intervals are variable. The pres
ence of AV dissociation during ventricular tachycardia can also be
established by the presence of fusion complexes or captured complexes
(Dressier complexes). Fusion complexes represent simultaneous ventricular activation via the normal His-Purkinje system from a P wave
conducted through the AV node and direct ventricular activation from
the ventricular myocardial focus. Hence there is a P wave before the
QRS complex with a PR interval that is shorter than the normally
conducted sinus complex, and the QRS complex has features of both a sinus complex and a ventricular complex but is different than both.
Captured (Dressier) complexes represent ventricular activation due to an atrial impulse (P wave) that is able to penetrate the AV node
and completely capture the ventricle during the ventricular arrhythmia, normalizing the QRS complex {ie, there is a P wave before the
QRS complex and the QRS complex resembles the sinus complex).
Negative P waves may be seen after the QRS complexes if VA (retrograde) conduction is present. QRS complexes and ST-T waves may show
9
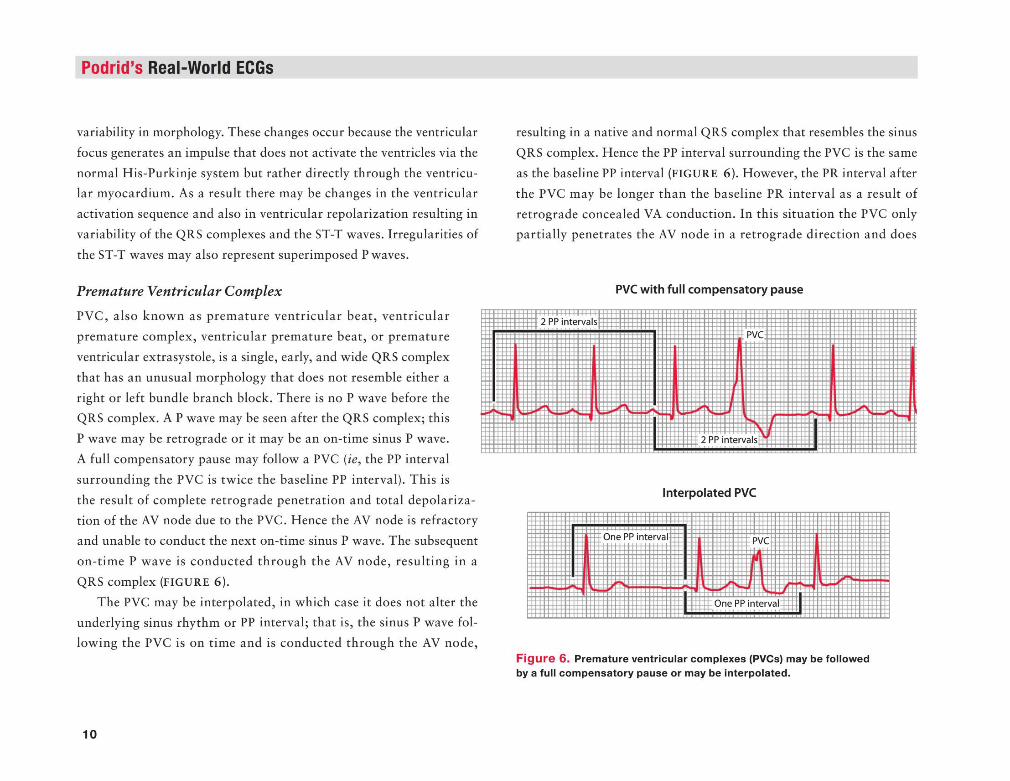
Podrid’s Real-World ECGs
variability in morphology. These changes occur because the ventricular
focus generates an impulse that does not activate the ventricles via the
normal His-Purkinje system but rather directly through the ventricular myocardium. As a result there may be changes in the ventricular
activation sequence and also in ventricular repolarization resulting in
variability of the QRS complexes and the ST-T waves. Irregularities of
the ST-T waves may also represent superimposed P waves.
Premature Ventricular Complex
PVC, also known as premature ventricular beat, ventricular
premature complex, ventricular premature beat, or premature
ventricular extrasystole, is a single, early, and wide QRS complex
that has an unusual morphology that does not resemble either a
right or left bundle branch block. There is no P wave before the QRS complex. A P wave may be seen after the QRS complex; this
P wave may be retrograde or it may be an on-time sinus P wave.
A full compensatory pause may follow a PVC (ie, the PP interval
surrounding the PVC is twice the baseline PP interval). This is
the result of complete retrograde penetration and total depolarization of the AV node due to the PVC. Hence the AV node is refractory
and unable to conduct the next on-time sinus P wave. The subsequent
on-time P wave is conducted through the AV node, resulting in a
QRS complex (FIGURE 6).
The PVC may be interpolated, in which case it does not alter the underlying sinus rhythm or PP interval; that is, the sinus P wave fol
lowing the PVC is on time and is conducted through the AV node,
10
resulting in a native and normal QRS complex that resembles the sinus
QRS complex. Hence the PP interval surrounding the PVC is the same
as the baseline PP interval (FIGURE 6). However, the PR interval after
the PVC may be longer than the baseline PR interval as a result of retrograde concealed VA conduction. In this situation the PVC only
partially penetrates the AV node in a retrograde direction and does
PVC with full compensatory pause
Interpolated PVC
F ig u re 6 . Premature ventricular complexes (PVCs) may be followed by a full com pensatory pause or may be interpolated.
not completely depolarize the node (ie, the impulse is concealed). Since
the AV node is not completely depolarized and not totally refractory, it
is able to conduct the next P wave but the rate of conduction through
the AV node is slower than normal as a result of partial depolarization
and some prolongation of refractoriness, accounting for the longer PR interval after the PVC.
If all the PVCs have the same morphology, they are termed uni
focal. If there are different QRS morphologies the PVCs are termed
multifocal. Two sequential PVCs is called a ventricular couplet; three
in a row is termed a ventricular triplet or may be called nonsustained
ventricular tachycardia (NSVT).When every other QRS complex is a PVC, it is termed ventricular
bigeminy; when every third QRS complex is a PVC it is called ventricu
lar trigeminy. The presence of bigeminy or trigeminy has no importance
and only indicates a repeating pattern.
Ventricular Rhythm
Ventricular rhythm is the presence of sequential ventricular complexes
at a rate of 60 bpm or less. When the rate is 60 to 100 bpm it is termed
an accelerated idioventricular rhythm, or it may also be called slow ventricular tachycardia. P waves may or may not be present. If present,
the P waves (when seen) will be regular (stable PP interval) but disso
ciated from the QRS complexes; that is, the PR intervals are variable
without any pattern and the atrial rate is slower than the ventricular
rate. The P wave may also be retrograde due to VA conduction. In this case the P wave is negative in at least lead aVF (which is perpendicular
to the atria) as well as in other leads. Additionally, it will have a fixed
Arrhythmias— Part A: Introduction
RP interval or coupling interval between the P wave and the preceding
QRS complex.
Nonsustained Ventricular Tachycardia (monomorphic or polymorphic)
N SVT is defined as tachycardia (rate > 100 bpm) consisting of three
or more sequential ventricular QRS complexes lasting for up to
30 seconds. However, tachycardia may be considered NSVT if it self-
terminates. If all the QRS complexes are similar, the NSVT is termed monomorphic. If the QRS complexes have a variable morphology and
axis, the NSVT is termed polymorphic. If the QT interval of the sinus
QRS complex is normal, the polymorphic NSVT is simply called poly
morphic N SVT, which is usually due to ischemia. If the QT interval
of the sinus QRS complex is prolonged (ie, long QT syndrome), the polymorphic NSVT is called torsade de pointes. This may be due to
either a drug that prolongs the QT interval (acquired) or a congenital
(genetic) abnormality that results in a channelopathy.
Sustained Ventricular Tachycardia (monomorphic or polymorphic)
Sustained ventricular tachycardia is defined as a series of regular ven
tricular QRS complexes at a rate 100 bpm or faster that lasts longer
than 30 seconds or is terminated in less than 30 seconds (often due to
hemodynamic compromise). If all of the QRS complexes have a similar
morphology the ventricular tachycardia is termed monomorphic. If the
QRS complexes vary in morphology and axis the ventricular tachy
cardia is termed polymorphic. If the QT interval of the sinus QRS
11
Podrid’s Real-World ECGs
complex is normal, the polymorphic ventricular tachycardia is simply
called polymorphic ventricular tachycardia, which is usually due to
ischemia. If the QT interval of the sinus QRS complex is prolonged,
the polymorphic ventricular tachycardia is called torsade de pointes.
Ventricular tachycardia that occurs at a rate exceeding 260 bpm is often called ventricular flutter. This is meant only to indicate that the
tachycardia is at a very fast rate.
12
Arrhythmias— Part A: Introduction
Ventricular FibrillationVentricular fibrillation is identified by the absence of any organized QRS complexes. There are fibrillatory waves that are irregular in mor
phology, interval, and amplitude. This arrhythmia is most commonly
the result of ischemia and can only be terminated with the unsynchronized delivery of a high-energy electrical impulse to the heart, termed
defibrillation. ■
Recommended