Directorate of Hydrography and Navigation (DHN)Navy Hydrographic Center (CHM)
r
International Hydrography Organization (IHO)International Hydrography Organization (IHO)
11stst Tidal and Water Level Tidal and Water Level Working Group MeetingWorking Group Meeting
Niterói, Brazil. March 30 – April 01, 2009

NATIONAL PRESENTATIONSNATIONAL PRESENTATIONS
BRAZIL BRAZIL
Lt Cdr Rosuita Helena Roso, [email protected]
TIDES SECTION

1th Tidal and
1st Tidal and Water Level Working Group Meeting
Ilha Fiscal station
An overview of tides in Brazil…
1th Tidal and 1th Tidal and
(Veloso, T. G., 2005)

1st Tidal and Water Level Working Group Meeting
Tide bore in Brazil…Pororoca
Projects underway at the Hydrographic Center related to Tides
I. To establish LAT as the Brazilian CD:
I.1. Revitalization of the tidal stations networkI.2. Upgrade of the Tides System software
II. Modeling tides (Lt Maria Fernanda, M.Sc.)III. GPS applied for soundings reduction (Lt Cdr Ramos, M.Sc.)V. Digital tidal currents charts (Lt Cdr Marcelo, M. Sc.)
1st Tidal and Water Level Working Group Meeting
Brazilian Chart Datum
For maritime areasCD = MLWS (Courtier - Balay criterium)
Differences between LAT and MLWS can be significant
In order to perform the IHO Technical Resolutionsit’s needed to adopt LAT as the national CD….
1st Tidal and Water Level Working Group Meeting
Problems must be solved ahead !!
I. Lack of data for that purpose:
• most of the data is outdated • short periods of observation for most of the stations
• no common “epoch” for all stations
Low cooperation from other national Institutions
II. Necessity of an effective software to process a large amount of data
1st Tidal and Water Level Working Group Meeting

Ilha Fiscal station
I.1. Project to revitalize the tidal stations network
Migrating to digital sensors with automatic data transmission (radar, encoder, pressure)
2002 GLOSS2008 : IBGE/ CHM/ INPE / CVRD
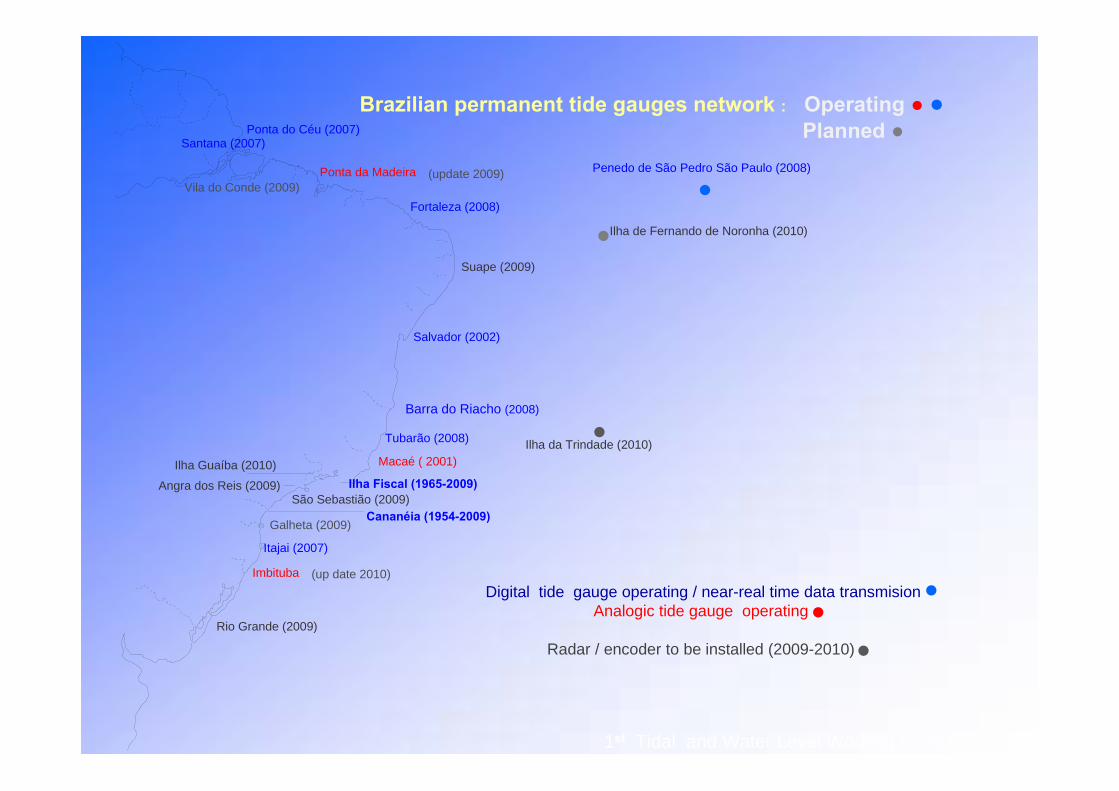
Brazilian permanent tide gauges network : Operating ● ●Planned ●
1st Tidal and Water Level Working Group Meeting
Digital tide gauge operating / near-real time data transmisionAnalogic tide gauge operating
Radar / encoder to be installed (2009-2010)
●●
●
Ponta do Céu (2007)
Vila do Conde (2009)
Imbituba
Salvador (2002)
Ilha Fiscal (1965-2009)
Ponta da Madeira
Fortaleza (2008)
Suape (2009)
Tubarão (2008)
Santana (2007)
(update 2009)
Galheta (2009)
Rio Grande (2009)
(up date 2010)
Ilha Guaíba (2010)
São Sebastião (2009)Angra dos Reis (2009)
Penedo de São Pedro São Paulo (2008)
Ilha da Trindade (2010)
Ilha de Fernando de Noronha (2010)
Cananéia (1954-2009)
Itajai (2007)
Macaé ( 2001)
●
●
●Barra do Riacho (2008)
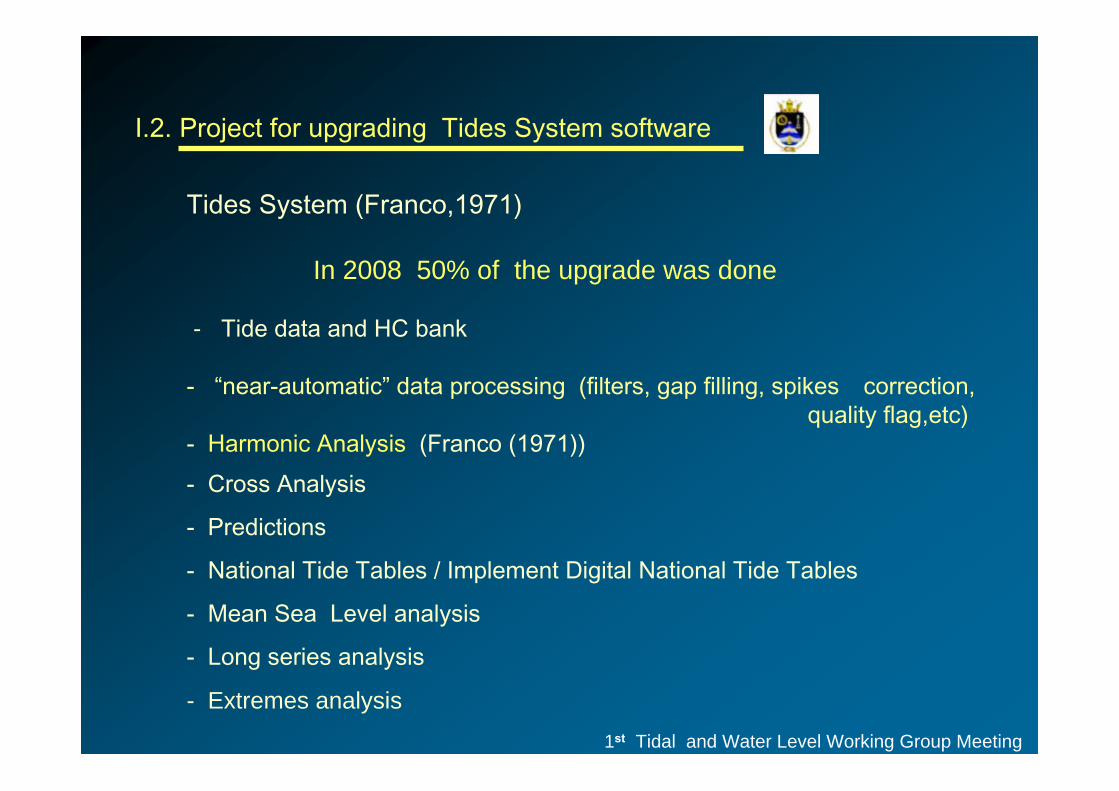
I.2. Project for upgrading Tides System software
Tides System (Franco,1971)
In 2008 50% of the upgrade was done
- Tide data and HC bank
- “near-automatic” data processing (filters, gap filling, spikes correction, quality flag,etc)
- Harmonic Analysis (Franco (1971))- Cross Analysis
- Predictions
- National Tide Tables / Implement Digital National Tide Tables
- Mean Sea Level analysis
- Long series analysis
- Extremes analysis1st Tidal and Water Level Working Group Meeting
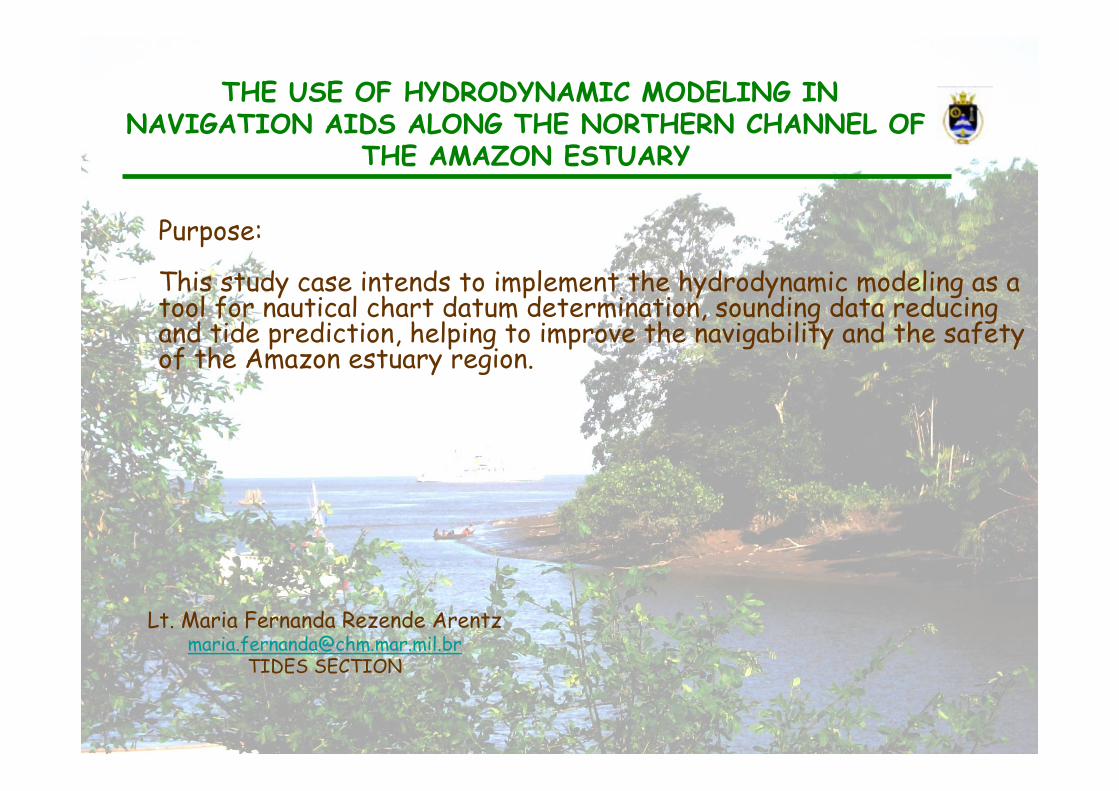
Purpose:
This study case intends to implement the hydrodynamic modeling as a tool for nautical chart datum determination, sounding data reducing and tide prediction, helping to improve the navigability and the safety of the Amazon estuary region.
THE USE OF HYDRODYNAMIC MODELING IN NAVIGATION AIDS ALONG THE NORTHERN CHANNEL OF
THE AMAZON ESTUARY
Lt. Maria Fernanda Rezende [email protected]
TIDES SECTION
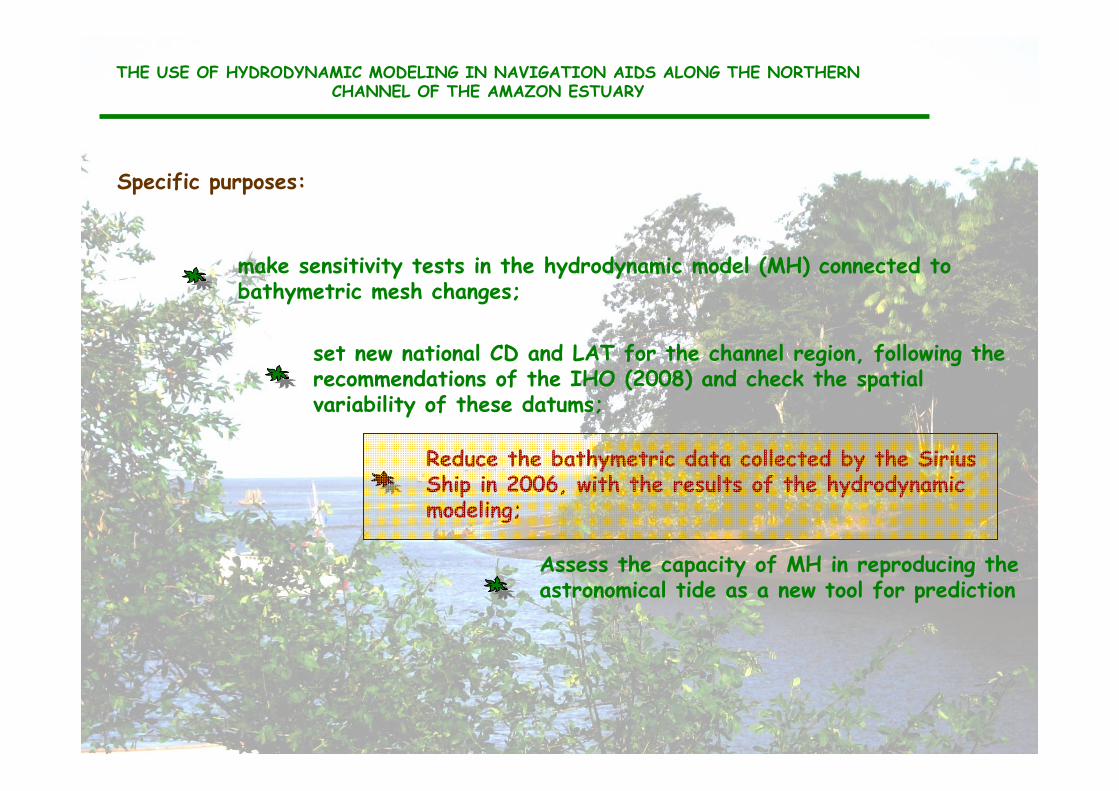
THE USE OF HYDRODYNAMIC MODELING IN NAVIGATION AIDS ALONG THE NORTHERN CHANNEL OF THE AMAZON ESTUARY
Specific purposes:
make sensitivity tests in the hydrodynamic model (MH) connected tobathymetric mesh changes;
set new national CD and LAT for the channel region, following the recommendations of the IHO (2008) and check the spatial variability of these datums;
Reduce the bathymetric data collected by the Sirius Ship in 2006, with the results of the hydrodynamic modeling;
Assess the capacity of MH in reproducing the astronomical tide as a new tool for prediction
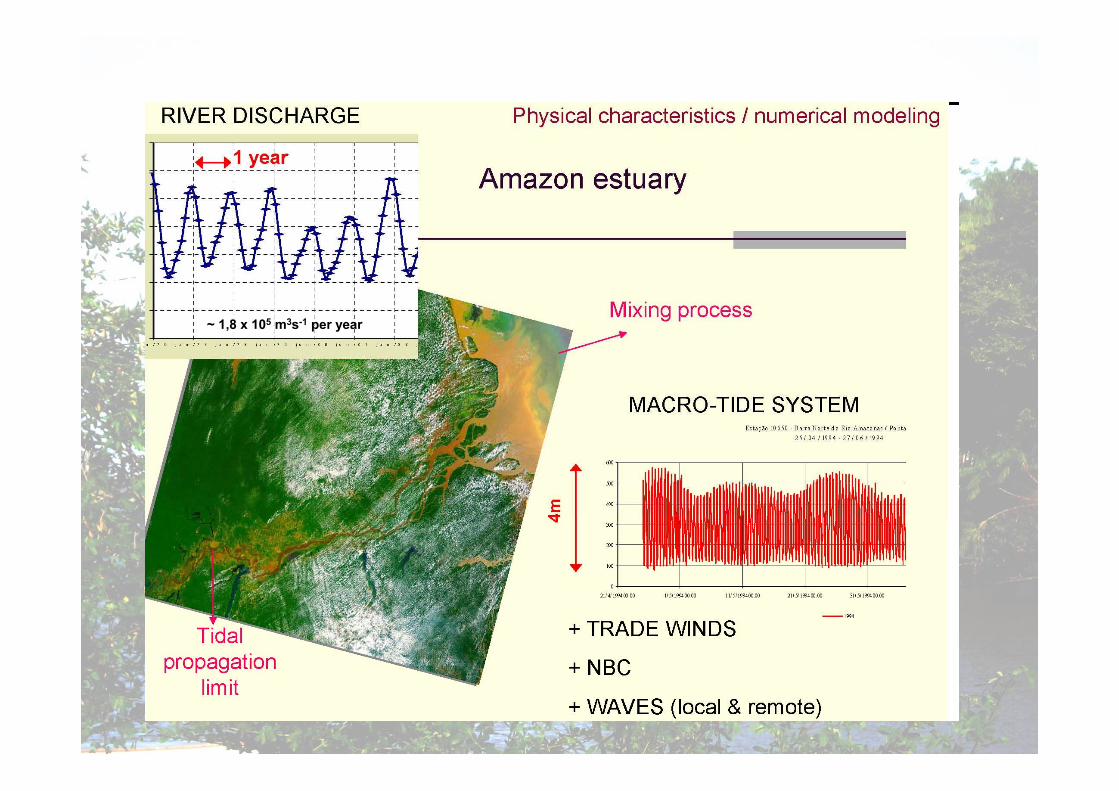
~ 1,8 x 10⁵ m3s-1 per year
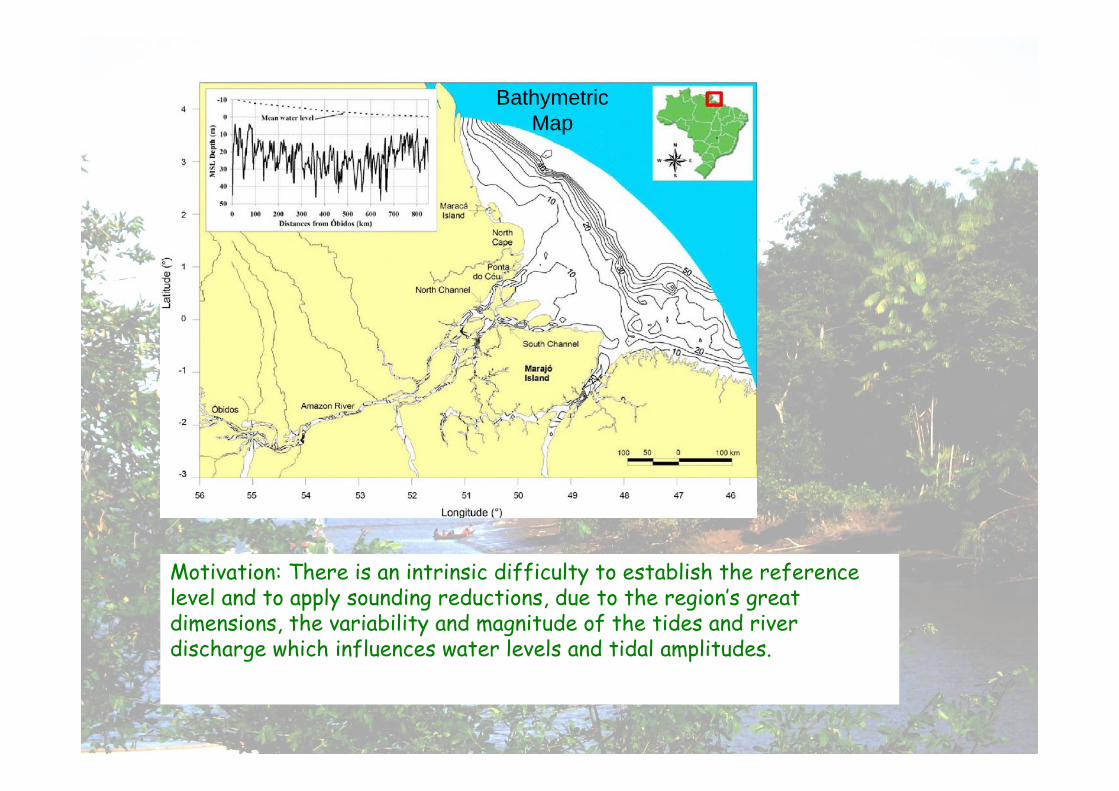
BathymetricMap
Motivation: There is an intrinsic difficulty to establish the reference level and to apply sounding reductions, due to the region’s great dimensions, the variability and magnitude of the tides and riverdischarge which influences water levels and tidal amplitudes.
0 200000 400000 600000 800000 1000000 1200000
0
200000
400000
600000
800000
[0,0] = UTM [588952.99 , 9668415.69]
Barra Norte
OceanoAtlântico
Penrod
Santa Maria do Cocal
Ilha de Maracá
Guará
CaniveteMacapá
SantanaAfuá
Chaves
Vila NazaréMachadinho
Maguari
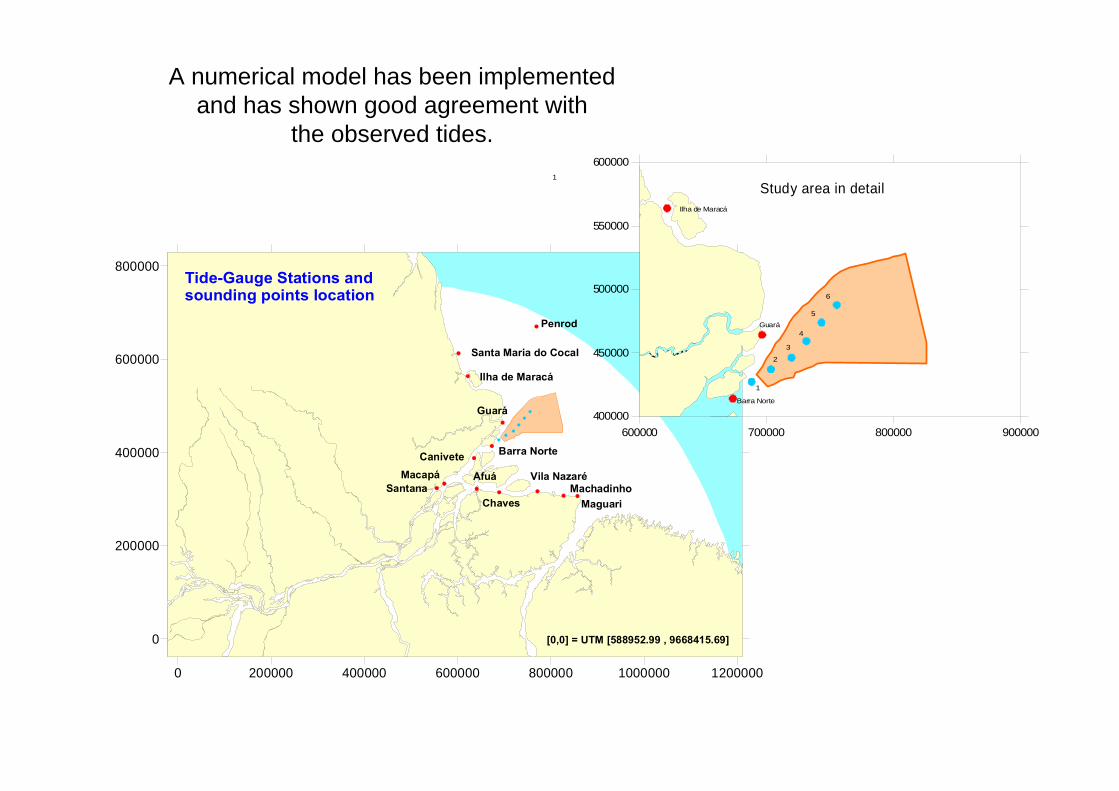
Tide-Gauge Stations and sounding points location
600000 700000 800000 900000400000
450000
500000
550000
600000
Study area in detail
Barra Norte
Guará
Ilha de Maracá
1
2
1
3
4
5
6
A numerical model has been implemented and has shown good agreement with
the observed tides.
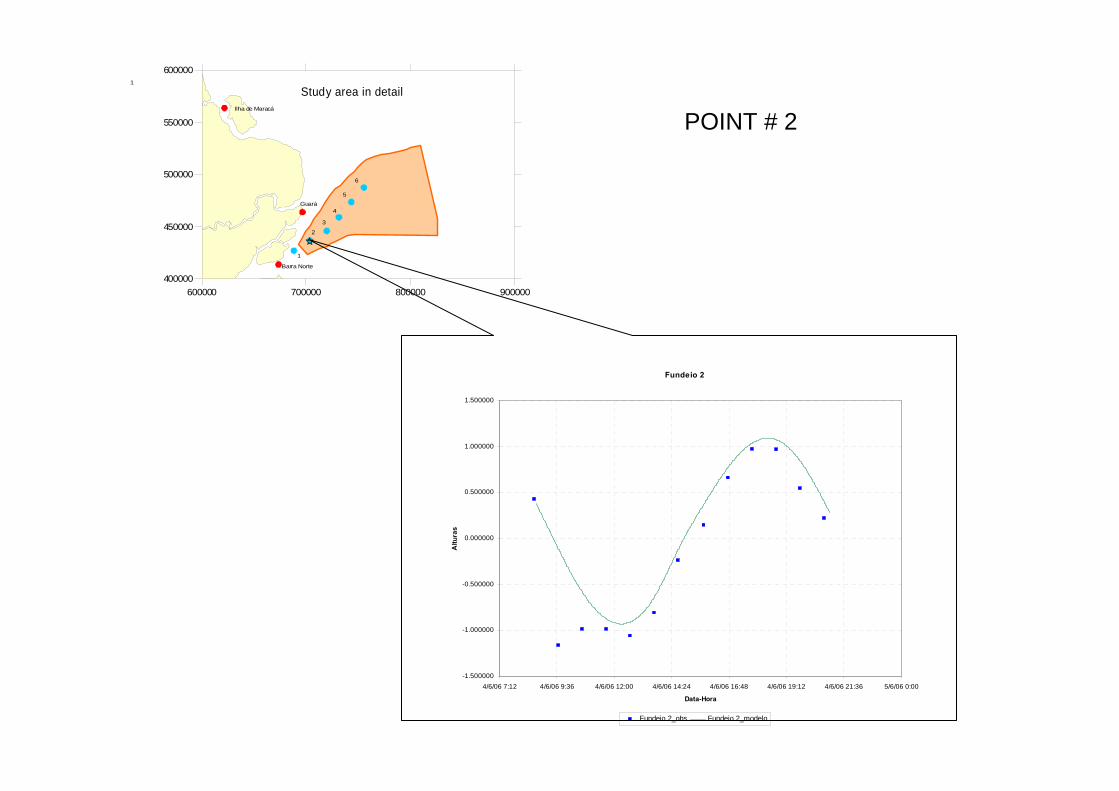
POINT # 2
Fundeio 2
-1.500000
-1.000000
-0.500000
0.000000
0.500000
1.000000
1.500000
4/6/06 7:12 4/6/06 9:36 4/6/06 12:00 4/6/06 14:24 4/6/06 16:48 4/6/06 19:12 4/6/06 21:36 5/6/06 0:00
Data-Hora
Altu
ras
Fundeio 2_obs Fundeio 2_modelo
600000 700000 800000 900000400000
450000
500000
550000
600000
Study area in detail
Barra Norte
Guará
Ilha de Maracá
1
2
1
3
4
5
6
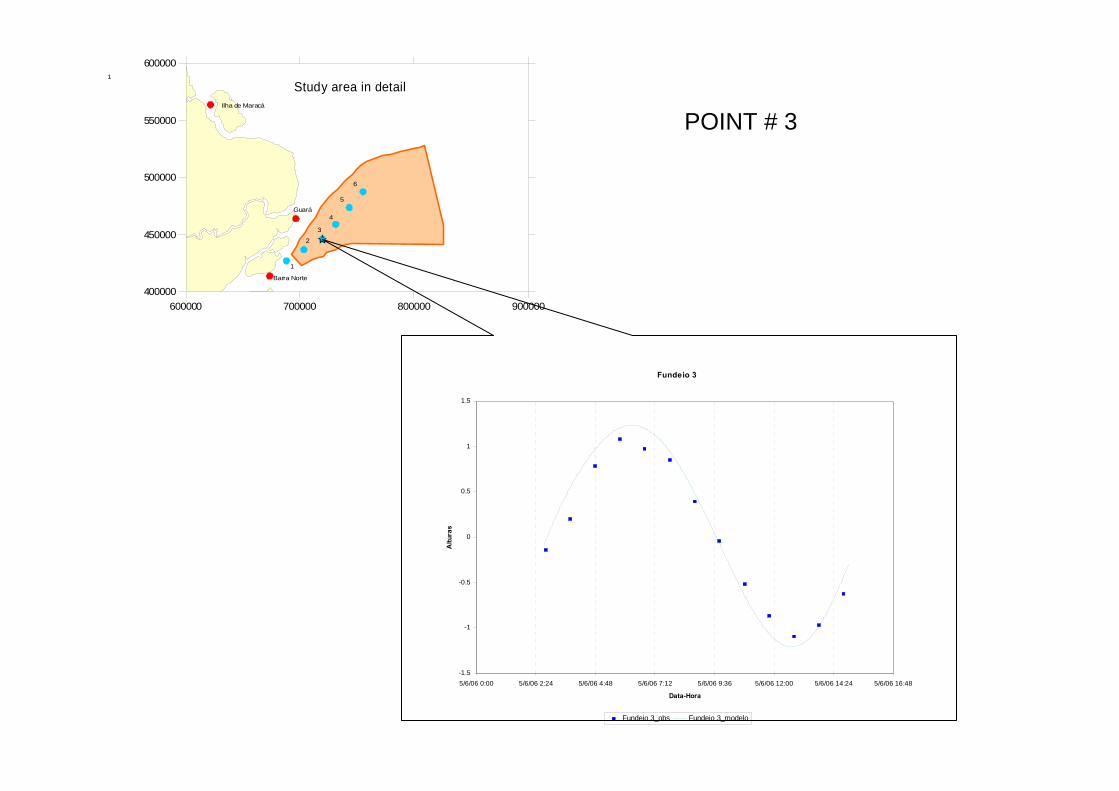
POINT # 3
Fundeio 3
-1.5
-1
-0.5
0
0.5
1
1.5
5/6/06 0:00 5/6/06 2:24 5/6/06 4:48 5/6/06 7:12 5/6/06 9:36 5/6/06 12:00 5/6/06 14:24 5/6/06 16:48
Data-Hora
Altu
ras
Fundeio 3_obs Fundeio 3_modelo
600000 700000 800000 900000400000
450000
500000
550000
600000
Study area in detail
Barra Norte
Guará
Ilha de Maracá
1
2
1
3
4
5
6
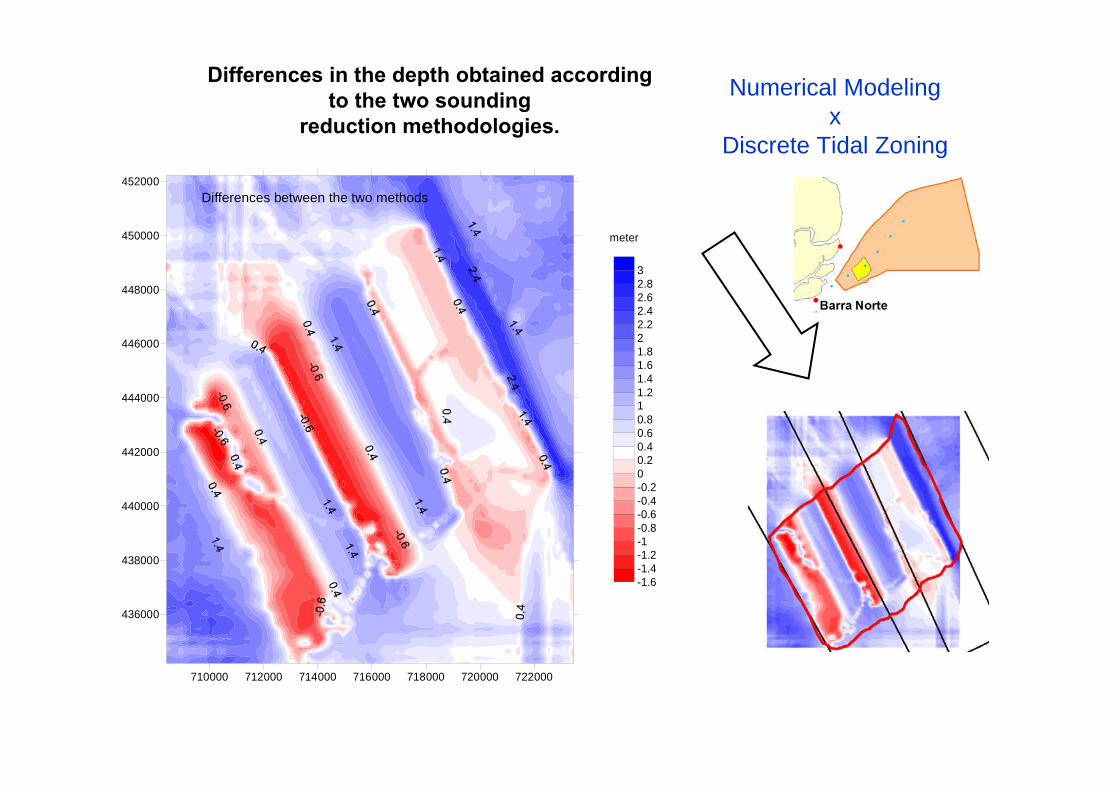
Numerical Modeling x
Discrete Tidal Zoning
Differences in the depth obtained according to the two sounding
reduction methodologies.
meter
710000 712000 714000 716000 718000 720000 722000
436000
438000
440000
442000
444000
446000
448000
450000
452000Differences between the two methods
-1.6-1.4-1.2-1-0.8-0.6-0.4-0.200.20.40.60.811.21.41.61.822.22.42.62.83

THE USE OF HYDRODYNAMIC MODELING IN NAVIGATION AIDS ALONG THE NORTHERN CHANNEL OF THE AMAZON ESTUARY
Conclusions:
The methodology of sounding reduction proposed in this workfor a particular depth surveying data (2006) has shown significant differences that call attention for the need to improve the sounding reduction methodology.
The implementation of a numerical model allowed a continuous fit of the water level, considering the seasonality of the local hydrodynamics. The model has established a better description of tide asymmetry and the variation of the mean sea level – all of them are sources of uncertainties of the currently used methodology.

THE USE OF HYDRODYNAMIC MODELING IN NAVIGATION AIDS ALONG NORTHERN CHANNEL OF THE AMAZON ESTUARY
GPS apllyed for Tides
1st Tidal and Water Level Working Group Meeting
Lt Cdr Alexandre Moreira Ramos, [email protected]
GEODESY SECTION
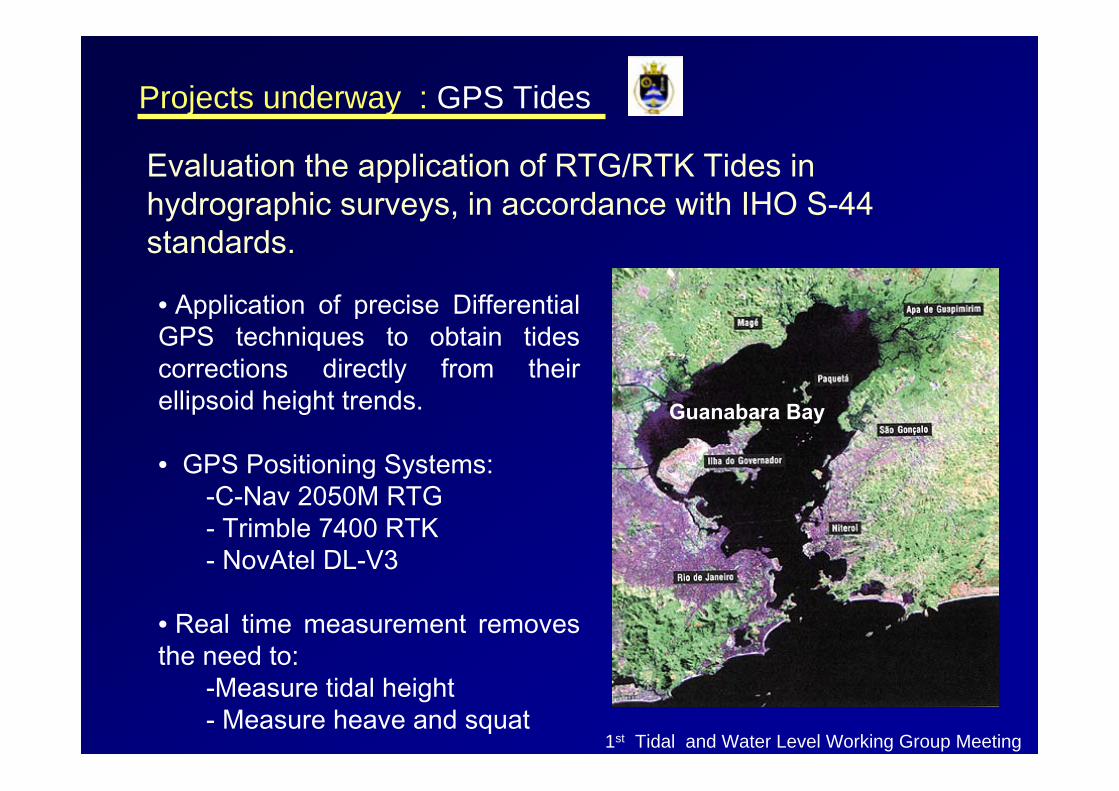
Projects underway : GPS Tides
Evaluation the application of RTG/RTK Tides in hydrographic surveys, in accordance with IHO S-44 standards.
Guanabara Bay
• Application of precise Differential GPS techniques to obtain tides corrections directly from their ellipsoid height trends.
• GPS Positioning Systems:-C-Nav 2050M RTG- Trimble 7400 RTK- NovAtel DL-V3
• Real time measurement removes the need to:
-Measure tidal height- Measure heave and squat
1st Tidal and Water Level Working Group Meeting
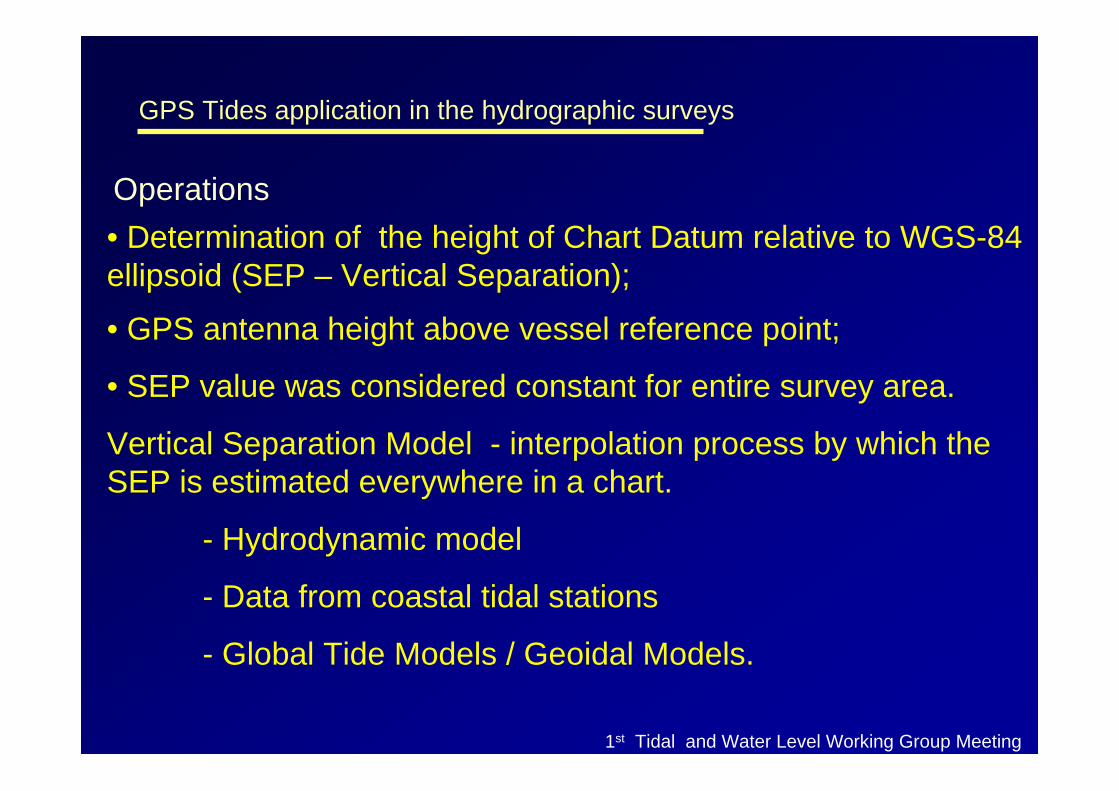
GPS Tides application in the hydrographic surveys
Operations• Determination of the height of Chart Datum relative to WGS-84 ellipsoid (SEP – Vertical Separation);
• GPS antenna height above vessel reference point;
• SEP value was considered constant for entire survey area.
Vertical Separation Model - interpolation process by which the SEP is estimated everywhere in a chart.
- Hydrodynamic model
- Data from coastal tidal stations
- Global Tide Models / Geoidal Models.
1st Tidal and Water Level Working Group Meeting

GPS Tides – 2006 Tests
1st Tidal and Water Level Working Group Meeting
-1 -0.6 -0.2 0.2 0.6 1
0
40
80
120
160
Mean of Differences = -0.007 m
Standard Deviation (68%) = 0,127 m
TPE (95%) = 0.250 m
Trimble 7400 RTK
Conventional Tide
Corrections
-1 -0.6 -0.2 0.2 0.6 1
0
30
60
90
120
150Mean of Differences = -0.029 m
Standard Deviation (68%) = 0,129 m
TPE (95%) = 0.259 m
Trimble 7400 RTK
GPS Tide
Corrections
-1 -0.6 -0.2 0.2 0.6 10
30
60
90
120
150Mean of Differences = -0.014 m
Standard Deviation (68%) = 0,126 m
TPE (95%) = 0.248 m
C-Nav 2050M RTG
Conventional Tide
Corrections
-1 -0.6 -0.2 0.2 0.6 10
20
40
60
80Mean of Differences = -0.051 m
Standard Deviation (68%) = 0,229 m
TPE (95%) = 0.460 m
C-Nav 2050M RTG
GPS Tide
Corrections
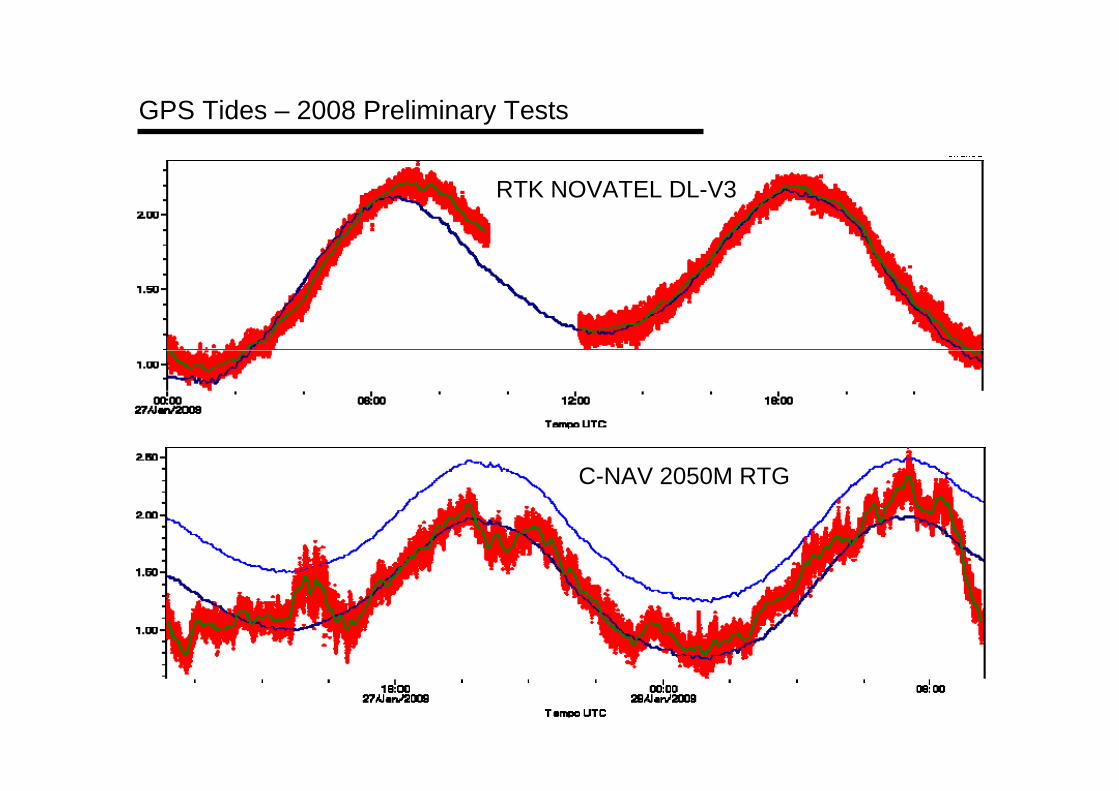
GPS Tides – 2008 Preliminary Tests
1th Tidal and Water Level Working Group Meeting
RTK NOVATEL DL-V3
C-NAV 2050M RTG
Thanks!
Cdr Marcelo Fricks , Lt Cdr Rosuita Helena Roso, Lt Cdr Alexandre Moreria Ramos, Lt Maria Fernanda Rezende ArentzCentro de Hidrografia da Marinha. Rua Barão de Jaceguay, s/nº Ponta da ArmaçãoNiterói – RJ - Brasil, CEP 24.048-900 (55 21) 2189-3238, Fax: (55 – 21) 2189-3237
Recommended
![IHO S-100: The New IHO Hydrographic Geospatial … hydrographic review may 2009 →iho s-100) iho s-100 [] .Published in: International Hydrographic Review · 2009Authors: Robert Ward](https://img.dokumen.tips/doc/110x75/5ae4a48c7f8b9a495c8ed661/iho-s-100-the-new-iho-hydrographic-geospatial-hydrographic-review-may-2009.jpg)