csdCenter for Sustainable Development
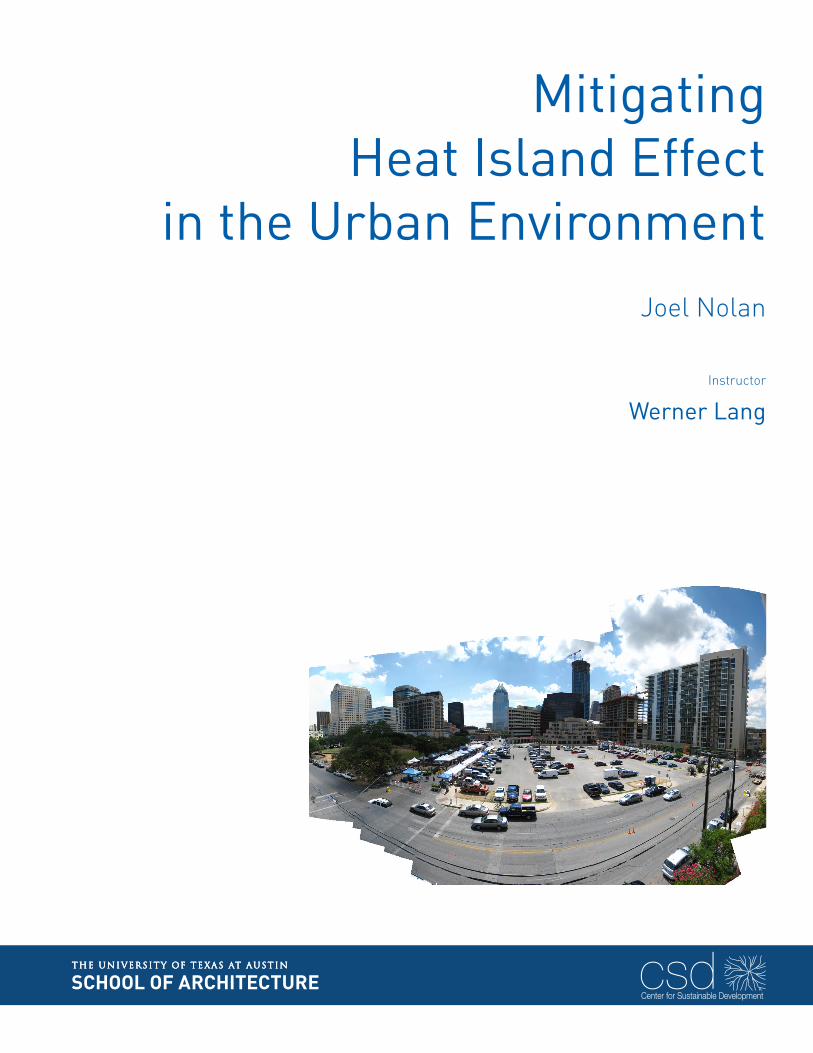
Mitigating Heat Island Effect
in the Urban EnvironmentJoel Nolan
Werner LangInstructor

UTSoA - Seminar in Sustainable Architecture
2
3
UTSoA - Seminar in Sustainable Architecture
main picture of presentation
Mitigating Heat Island Effectin the Urban Environment
Joel Nolan
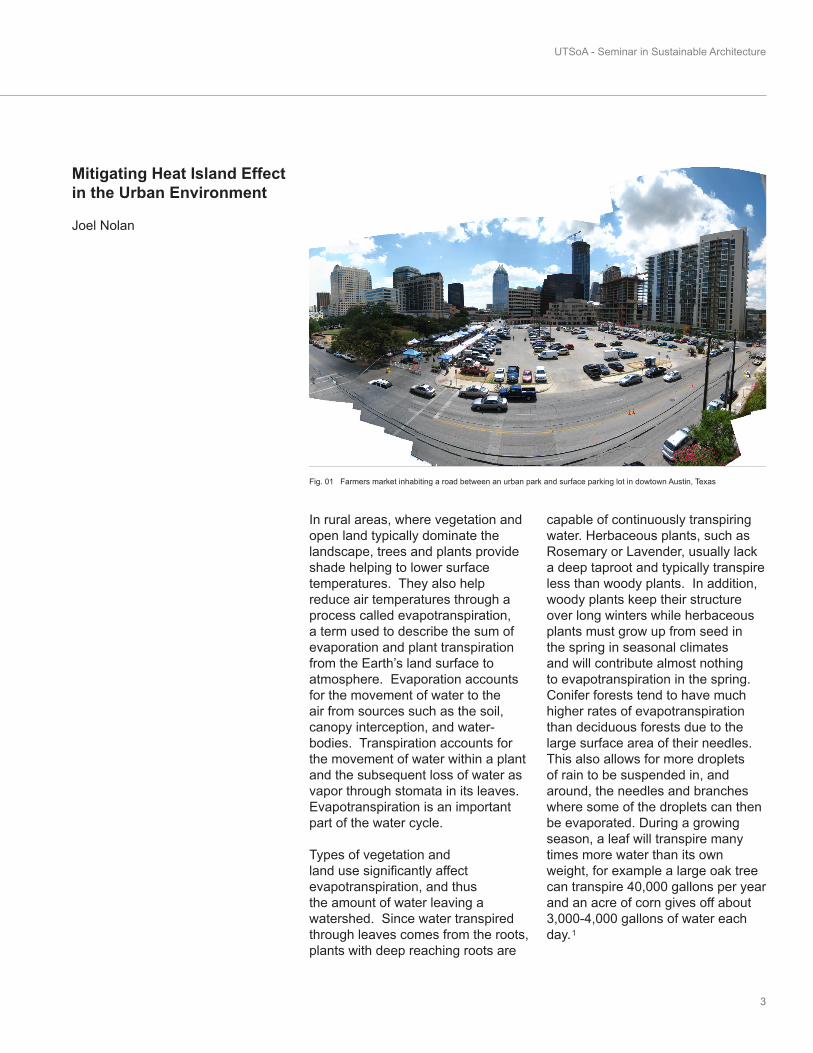
In rural areas, where vegetation and open land typically dominate the landscape, trees and plants provide shade helping to lower surface temperatures. They also help reduce air temperatures through a process called evapotranspiration, a term used to describe the sum of evaporation and plant transpiration from the Earth’s land surface to atmosphere. Evaporation accounts for the movement of water to the air from sources such as the soil, canopy interception, and water-bodies. Transpiration accounts for the movement of water within a plant and the subsequent loss of water as vapor through stomata in its leaves. Evapotranspiration is an important part of the water cycle.
Types of vegetation and land use significantly affect evapotranspiration, and thus the amount of water leaving a watershed. Since water transpired through leaves comes from the roots, plants with deep reaching roots are
capable of continuously transpiring water. Herbaceous plants, such as Rosemary or Lavender, usually lack a deep taproot and typically transpire less than woody plants. In addition, woody plants keep their structure over long winters while herbaceous plants must grow up from seed in the spring in seasonal climates and will contribute almost nothing to evapotranspiration in the spring. Conifer forests tend to have much higher rates of evapotranspiration than deciduous forests due to the large surface area of their needles. This also allows for more droplets of rain to be suspended in, and around, the needles and branches where some of the droplets can then be evaporated. During a growing season, a leaf will transpire many times more water than its own weight, for example a large oak tree can transpire 40,000 gallons per year and an acre of corn gives off about 3,000-4,000 gallons of water each day.
Fig. 01 Farmers market inhabiting a road between an urban park and surface parking lot in dowtown Austin, Texas
1
UTSoA - Seminar in Sustainable Architecture
4
Factors that influence evapotranspiration include the plant’s growth stage or level of maturity, percentage of soil cover, solar radiation, humidity, temperature, and wind. Transpiration rates go up as the temperature goes up, especially during the growing season, when the air is warmer due to stronger sunlight and warmer air masses. Higher temperatures cause the plant cells which control the openings (stoma) where water is released to the atmosphere to open, whereas colder temperatures cause the openings to close. As the relative humidity of the air surrounding the plant rises the transpiration rate falls. It is easier for water to evaporate into dryer air than into more saturated air. Increased movement of the air around a plant will result in a higher transpiration rate. This is somewhat related to the relative humidity of the air, in that as water transpires from a leaf, the water saturates the air surrounding the leaf. If there is no wind, the air around the leaf may not move very much, raising the level of humidity. Wind will move the air around, with the result that the more saturated air close to the leaf is replaced by drier air. When moisture is lacking, plants can begin to senesce (premature ageing, which can result in leaf loss) and transpire less water.
In contrast, urban areas are characterized by dry, impervious surfaces, such as conventional roofs, sidewalks, roads and parking lots. As cities develop, more vegetation is lost, and more surfaces are paved or covered with large amounts of impervious cover. Urban areas typically have surface materials, such as roofing and paving, which have a lower albedo than those in rural settings. As a result, built
up communities generally reflect less and absorb more of the sun’s energy. These changes cause urban regions to become warmer than their rural surroundings, forming an island of higher temperatures in the landscape. Heat islands occur on the surface as well as in atmosphere. On a hot and sunny summer day the sun can heat these exposed urban surfaces to temperatures 50–90°F (27–50°C) hotter than the air. The annual mean air temperature of a city with 1 million people or more can be 1.8–5.4°F (1–3°C) warmer than its surroundings. On a clear, calm night, however, the temperature difference can be as much as 22°F (12°C). Even smaller cities and towns will produce heat islands, though the effect often decreases
as city size decreases. The impacts from urban heat islands and global climate change (or global warming) are often similar. For example, some communities may experience longer growing seasons due to either or both phenomena. Urban heat islands and global climate change can also increase energy demand, particularly summertime air conditioning demand resulting in an increase of air pollution and greenhouse gas emissions, depending on the electric system power fuel mix.
Although solar reflectance is the main determinant of a material’s surface temperature, thermal emittance, or emissivity, also plays a role. Thermal emittance is a measure of a surface’s ability to shed heat, or emit long-wave (infrared) radiation.
Pavements
Perc
enta
ge o
f Lan
d A
rea
2 - A
cre R
esid
entia
l1 -
Acr
e Res
iden
tial
1/2 -
Acr
e Res
iden
tial
1/3 -
Acr
e Res
iden
tial
1/4 -
Acr
e Res
iden
tial
1/8-
Acr
e Res
iden
tial
Industr
ialCom
mer
cial &
Busin
ess
Shoppin
g Cen
ters
100
90
80
70Roofs
60
50
40
30
20
10
0
9090
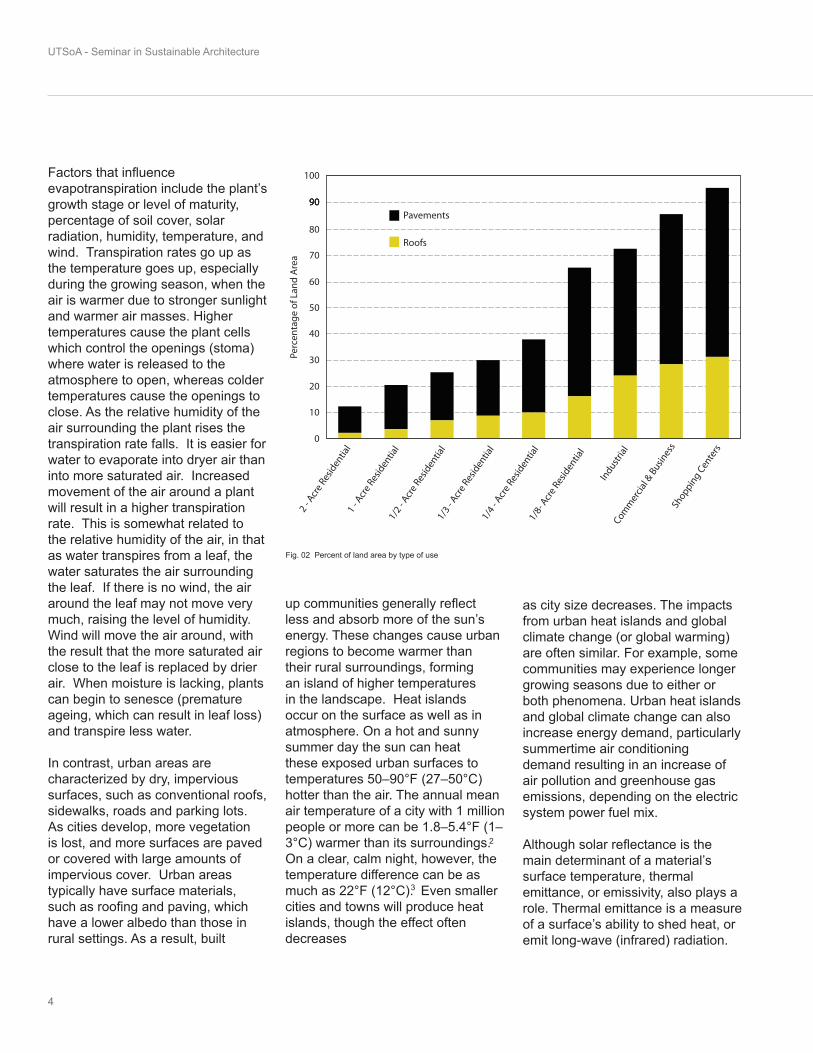
Fig. 02 Percent of land area by type of use
2
3
Mitigating Heat Island Effect in the Urban Environment
5
All things equal, surfaces with high emittance values will stay cooler, because they will release heat more readily. Most construction materials, with the exception of metal, have high thermal emittance values. Thus, this property is mainly of interest to those installing cool roofs, which can be metallic. Another important property that influences heat island development is a material’s heat capacity, which refers to its ability to store heat. Many building materials, such as steel and stone, have higher heat capacities than rural
materials, such as dry soil and sand. As a result, cities are typically more effective at storing the sun’s energy as heat within their infrastructure. Downtown metropolitan areas can absorb and store twice the amount of heat compared to their rural surroundings during the daytime.In addition to heating the air in and around an urban center, urban heat islands degrade water quality mainly through thermal pollution where pavement and rooftop surfaces, that have reached temperatures well above the air temperature
surrounding them, transfer this excess heat to storm-water. Field measurements from one study showed that runoff from urban areas was about 20°F (11-17°C) hotter than runoff from a nearby rural area on summer days when pavement temperatures at midday were 20-35°F (11-19°C) above air temperature. When the rain came before the pavement had a chance to heat up, runoff temperatures from the rural and urban areas differed by less than 4°F (2°C). This heated storm-water generally drains into storm sewers and raises water temperatures as it is released into streams, rivers, ponds, and lakes. A study in Arlington, Virginia, recorded temperature increases in surface waters as high as 8ºF (4°C) in 40 minutes after heavy summer rains. Water temperature affects all aspects of aquatic life, especially the metabolism and reproduction of many aquatic species. Rapid temperature changes in aquatic ecosystems resulting from warm storm-water runoff can be particularly stressful. Brook trout, for example, experience thermal stress and shock when the water temperature changes more than 2-4ºF (1-2°C) in less than 24 hours.
Trees help reduce storm-water runoff and enhance ground water recharge by breaking the impact of raindrops and improving soil structure. A tree’s effectiveness in this capacity is correlated with the size of the crown and root zone area. Trees create organic matter on the soil surface from their leaf litter, and their roots increase soil permeability resulting in reduced surface runoff of water from storms, and increased ground water recharge that is significantly reduced by paving. Tree roots also reduce
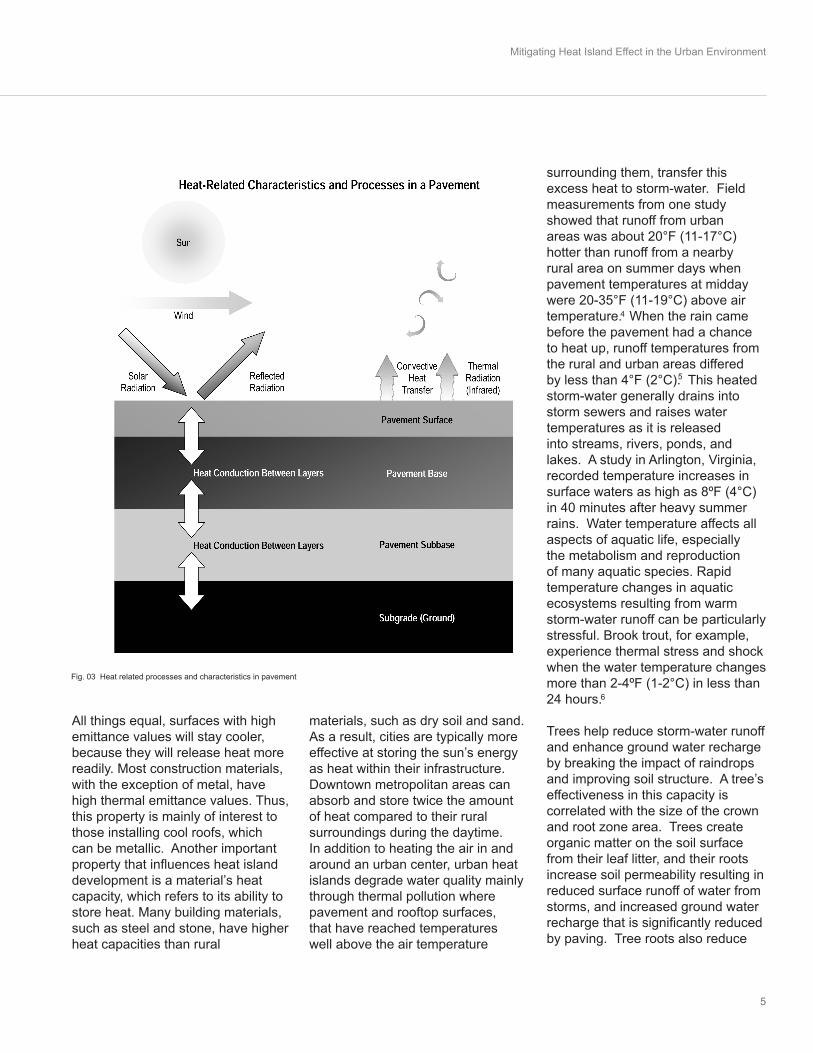
Fig. 03 Heat related processes and characteristics in pavement
4
5
6
UTSoA - Seminar in Sustainable Architecture
6
soil erosion from wind. Without trees, cities would need to increase sewage and storm water drainage channels and waste-treatment capabilities to handle increased water runoff. The emphasis on preserving existing trees in the Land Development Code is due in part to the adverse growing conditions in the Austin area. Indigenous trees are more adapted to local conditions and are more likely to survive the climatic fluctuations. Many of the trees in the Austin area grow very slowly, thus making preservation more critical in order to avoid long term impacts.
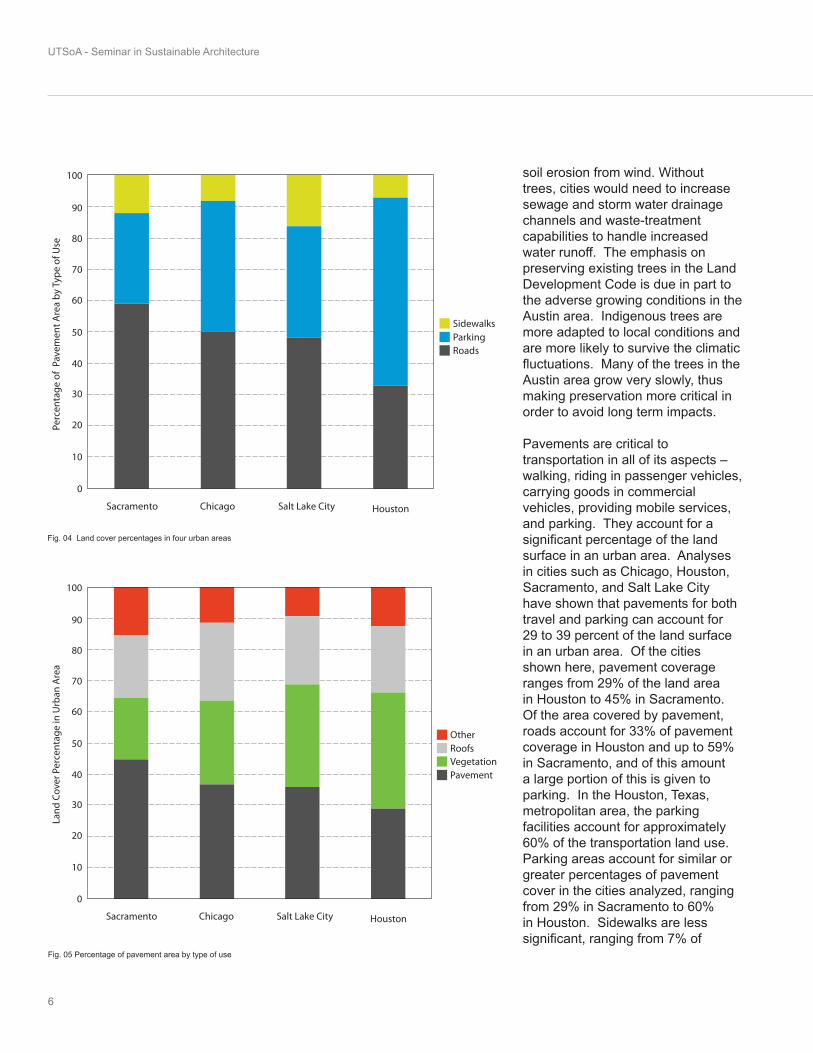
Pavements are critical to transportation in all of its aspects – walking, riding in passenger vehicles, carrying goods in commercial vehicles, providing mobile services, and parking. They account for a significant percentage of the land surface in an urban area. Analyses in cities such as Chicago, Houston, Sacramento, and Salt Lake City have shown that pavements for both travel and parking can account for 29 to 39 percent of the land surface in an urban area. Of the cities shown here, pavement coverage ranges from 29% of the land area in Houston to 45% in Sacramento. Of the area covered by pavement, roads account for 33% of pavement coverage in Houston and up to 59% in Sacramento, and of this amount a large portion of this is given to parking. In the Houston, Texas, metropolitan area, the parking facilities account for approximately 60% of the transportation land use. Parking areas account for similar or greater percentages of pavement cover in the cities analyzed, ranging from 29% in Sacramento to 60% in Houston. Sidewalks are less significant, ranging from 7% of
Land
Cov
er P
erce
ntag
e in
Urb
an A
rea
Sacramento Chicago Salt Lake City Houston
OtherRoofsVegetation
100
80
70
60
50
40
30
20
10
0
90
Pavement
Fig. 05 Percentage of pavement area by type of use
Perc
enta
ge o
f Pa
vem
ent A
rea
by T
ype
of U
se
Sacramento Chicago Salt Lake City Houston
SidewalksParkingRoads
100
80
70
60
50
40
30
20
10
0
90
Fig. 04 Land cover percentages in four urban areas
Mitigating Heat Island Effect in the Urban Environment
7
pavement area in Houston to 16% in Salt Lake City.
If we take a closer look at parking issues we may begin to understand what an impact the car has had on the modern American city. Common angled or perpendicular parking stalls are 8 to 9 feet wide by 16 to 18 feet long. The choice of specific parking dimensions depends upon the function of the parking - the greater the use of the space (high turnover) and/or more retail customer in nature - the larger dimensions are commonly utilized. A typical parking space adjacent to the curb (parallel) is 8 feet wide by 20 feet long, and the length of parallel spaces are commonly marked 22 to 26 feet long to account for entry and exit maneuvering. This means a typical
small or compact stall is about 275 sq. ft., while the average stall is about 325 sq. ft., if we include the area for the parking stall plus the circulation areas, end of aisle areas/landscaping. Americans have one parking spot reserved for them at each of their typical destinations on a given day; so if we imagine that you have one parking spot at your house, favorite coffee shop, place of work and grocery store then we are each allotted up to 1300 sq.ft. of parking space, a much larger space than the average house you would find in most of the world. The next generation of surface parking lots and garages must tear apart our current tendency of construction and look to provide alternate options that are a vast improvement on the existing
situation. As urban centers grow larger and more complex the type of space, amount of space, and location of that space within the city selected for parking and driving will be of primary concern for a system that advocates smart growth. Our communities have become increasingly worried about the downside of an auto-based landscape that is no longer holding the promise of progress and growth, but rather fosters congestion. In contrast to auto-oriented sprawl, the future and vitality of our communities is dependent upon our ability to foster a better planned, more environmentally protective, more sustainable pattern of development. As developers attempt to meet the parking requirements of their projects, they find themselves beset
0
500
1,000
1,500
2,000
2,500
3,000
3,500
4,000
4,500
5,000
10:00 11:00 12:00 13:00 14:00 15:00 16:00 17:00 18:00
Time of Day
Num
ber o
f Par
ked
Vehi
cles
4,670
4,203
0
1,000
2,000
3,000
4,000
5,000
6,000
7,000
8,000
9,000
10 ,000
11 ,000
12 ,000
13 ,000
10 :00 11 :00 12 :00 13 :00 14 :00 15 :00 16 :00 17 :00 18 :00
T im e o f D ay
Num
ber o
f Par
ked
Veh
icle
s
12,841
10,915
0
2,000
4,000
6,000
8,000
10,000
12,000
14,000
16,000
18,000
20,000
22,000
10:00 11:00 12:00 13:00 14:00 15:00 16:00 17:00 18:00
Time of Day
Num
ber o
f Par
ked
Vehi
cles
20,575
17,489
FIGURE 4OVERALL PARKING ACCUMULATION FOR CBD CORE AREA
Downtown Austin Comprehensive Parking StudyAustin, Texas
On-Street Parking Surface Parking
Garage Parking
Source:Parking utilization survey conducted byWilbur Smith Associates and Urban DesignGroup during March-April 2000.
Total Available Parking Spaces
Effective Parking Spaces(90% of total for On-Street and85% of total for Off-Street)
0
500
1,000
1,500
2,000
2,500
3,000
3,500
4,000
4,500
5,000
10:00 11:00 12:00 13:00 14:00 15:00 16:00 17:00 18:00
Time of Day
Num
ber o
f Par
ked
Vehi
cles
4,670
4,203
0
1,000
2,000
3,000
4,000
5,000
6,000
7,000
8,000
9,000
10 ,000
11 ,000
12 ,000
13 ,000
10 :00 11 :00 12 :00 13 :00 14 :00 15 :00 16 :00 17 :00 18 :00
T im e o f D ay
Num
ber o
f Par
ked
Veh
icle
s12,841
10,915
0
2,000
4,000
6,000
8,000
10,000
12,000
14,000
16,000
18,000
20,000
22,000
10:00 11:00 12:00 13:00 14:00 15:00 16:00 17:00 18:00
Time of Day
Num
ber o
f Par
ked
Vehi
cles
20,575
17,489
FIGURE 4OVERALL PARKING ACCUMULATION FOR CBD CORE AREA
Downtown Austin Comprehensive Parking StudyAustin, Texas
On-Street Parking Surface Parking
Garage Parking
Source:Parking utilization survey conducted byWilbur Smith Associates and Urban DesignGroup during March-April 2000.
Total Available Parking Spaces
Effective Parking Spaces(90% of total for On-Street and85% of total for Off-Street)
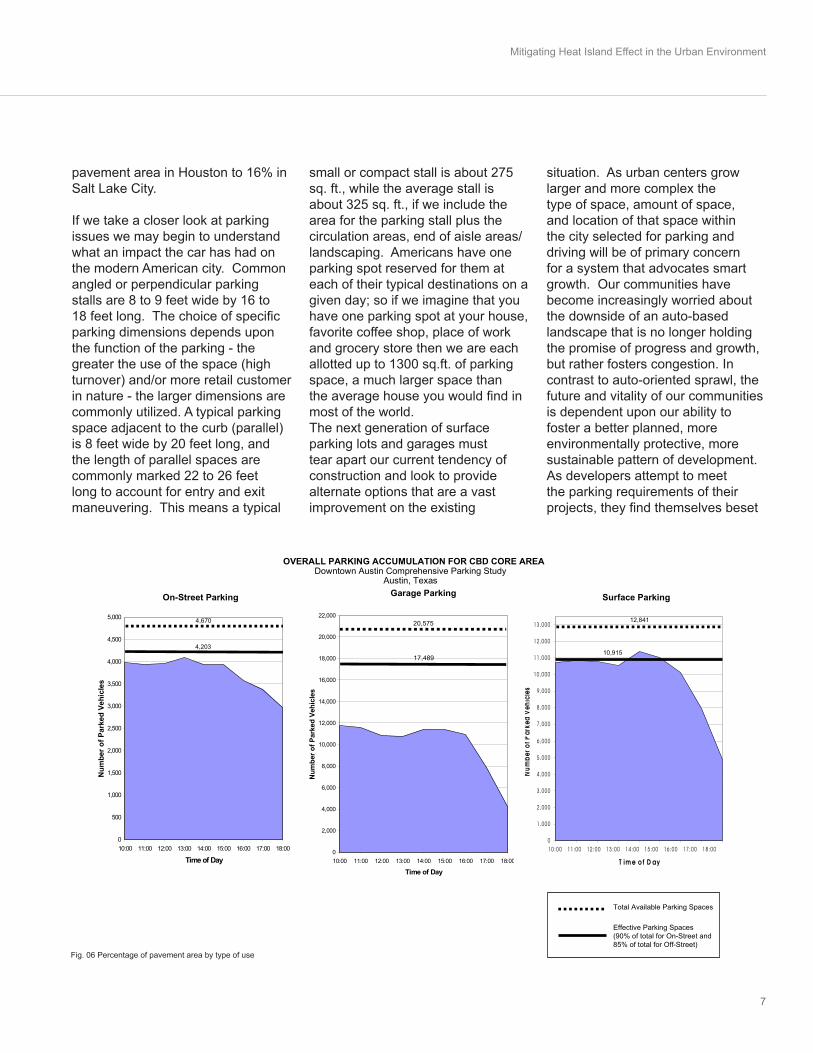
Fig. 06 Percentage of pavement area by type of use
UTSoA - Seminar in Sustainable Architecture
8
with obstacles related to zoning, financing, and design, just to name a few. Parking requirements now drive many site designs, and are often the make or break issue for financing new developments. Too many quality smart growth projects remain on the drawing board because they simply cannot solve the parking dilemma. We need parking, but we need to re-think parking design, parking financing, and parking supply and demand to better meet the needs ofcommunities, developers, and users.
Local planners have traditionally regulated the supply of parking through zoning codes that prescribe minimum parking requirements for development projects based on land use and size. These minimum requirements are typically drawn from parking generation rates and standards that are published by the Institute of Transportation Engineers. In one such commonly used publication, Parking Generation, the parking generation rates are derived from a small number of studies that measure peak parking demand at suburban locations, where parking is free and there is no public transit. The maximum parking demand from these studies oftentimes becomes the minimum parking requirement established in zoning codes. Recognizing the limitations of these parking generation rates, planners will sometimes look to zoning codes in comparable cities to further inform their own minimum parking requirements. However, this comparison is also quite limited in that it cannot account for all of the geographic and demographic factors specific to a particular jurisdiction or development site. As a result of applying published generic
parking standards or borrowing parking standards from seemingly comparable cities, minimum parking requirements tend to be excessive and inflexible, leading to more parking than is necessary. One of the primary ways local planners can more appropriately control the supply of parking is by revising local zoning ordinances to more accurately reflect local parking demand and circumstances.
In 1997 the City of Austin initiated the Downtown Austin Comprehensive Parking Study to address the current and future parking needs in central Austin. The study is expected to help the City plan for ways to alleviate current and future parking problems in the downtown, South Congress and E. 11th/E. 12th Street areas. Looking at Figure 06 we can see that there is a major surplus of parking in the downtown area.
There is roughly a surplus of 470 extra spaces for on-street parking, 8,575 in the parking garages, and 1,341 in surface lots. Added together this equates to a surplus of 10,386 parking spots. When multiplied by the earlier estimation of square footage per space (including circulation space) we get between 2,856,150 sq ft (65.56 acres) and 3,375,450 sq ft (77.45 acres) of surplus parking space on an average day in Austin.
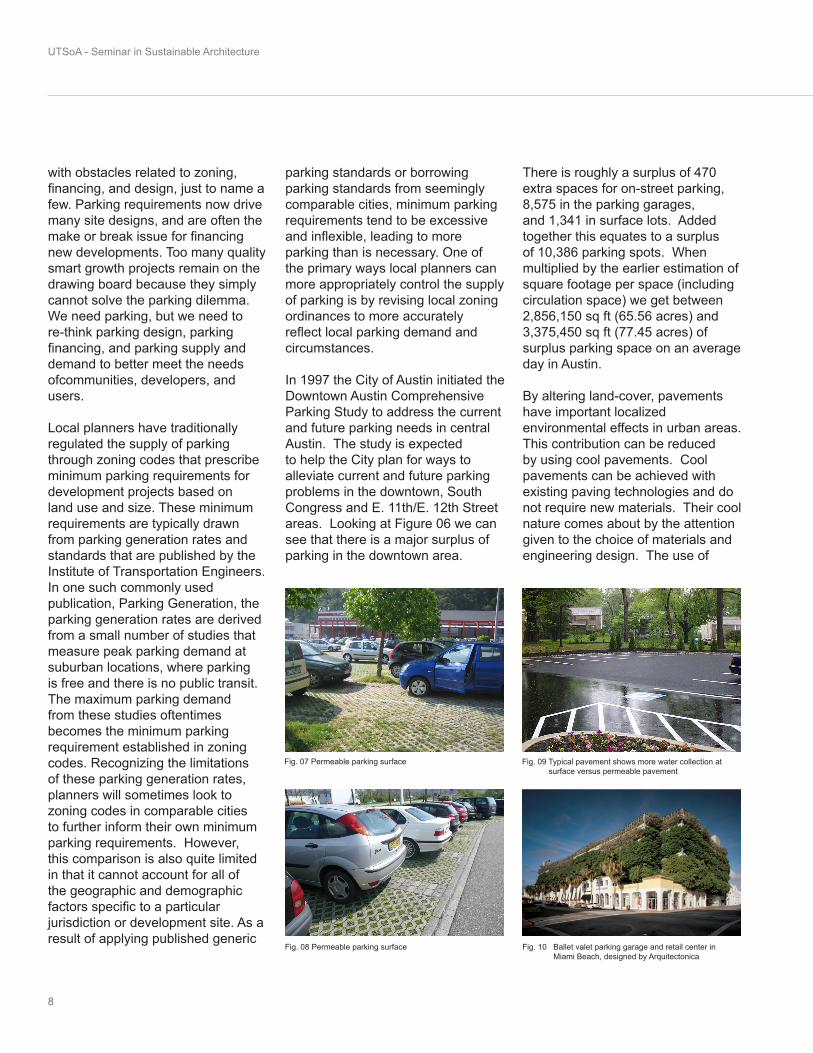
By altering land-cover, pavements have important localized environmental effects in urban areas. This contribution can be reduced by using cool pavements. Cool pavements can be achieved with existing paving technologies and do not require new materials. Their coolnature comes about by the attention given to the choice of materials and engineering design. The use of
Fig. 07 Permeable parking surface
Fig. 08 Permeable parking surface
Fig. 09 Typical pavement shows more water collection at surface versus permeable pavement
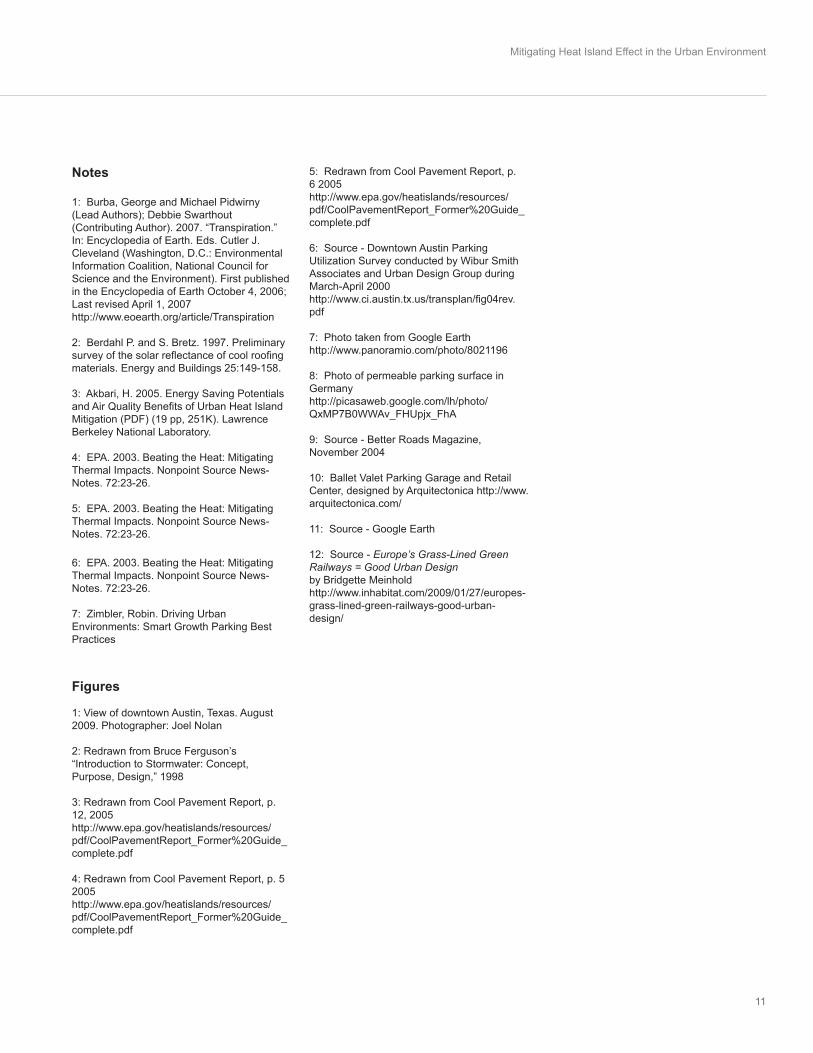
Fig. 10 Ballet valet parking garage and retail center in Miami Beach, designed by Arquitectonica
Mitigating Heat Island Effect in the Urban Environment
9
cool pavements is meant to reduce pavement temperature by increasing pavement reflectivity or controlling temperature by other means, with the selected technique(s) applied as appropriate throughout the urban area. Specific pavement technologies with cool attributes will not be appropriate for all uses; some may be better suited to light traffic areas, for instance; others to areas where noise management is considered crucial. In addition, certain paving technologies may not always be appropriate or feasible in a particular region of the country – whether technically, economically, organizationally, or institutionally – and local pavement engineers and owner agencies may not be sufficiently familiar with cool pavements to apply them confidently.
As part of a heat island reduction strategy, cool pavements contributeto the general benefits of heat island
mitigation, including increased comfort, decreased energy use, and likely improved air quality. Cool pavements also can be one component of a larger sustainable pavements program, or a green transportation infrastructure. Cool pavements can contribute to local, as well as regional, comfort improvements. For instance, they help make large paved areas, such as parking lots, more comfortable for users and shopping centers may feel this enhances the shopping experience.
A porous or permeable ground surface that allows water to percolate through it can exert a cooling effect through evaporation of water in the pavement voids or from beneath, depending on the type of surface and thickness. In addition, permeable surfaces are sometimes more conducive to cooling from convective airflow. Both asphalt and
concrete pavements can be built with porous surfaces, and unbound surfaces (e.g., grass, gravel) can be constructed using grids for reinforcement.
Some developers of parking structures are beginning to incorporate green roofs on parking structures to retain and naturally filter storm-water runoff, thereby improving water quality. Green roofs can retain 50-60% of the total annual runoff volume of a roof, reducing the need for costly storm-watermanagement systems. Underground parking structures often have lawns and parks planted on top. Above ground parking structures could also incorporate roof systems of vegetation, soil, drainage, and waterproof membranes to alleviate environmental problems including storm water runoff and the urban heat island effect. Additional benefits of green-roofs include improved livability of the urban environment by buffering noise, reducing glare, and offering an aesthetic alternative to asphalt roofing. Green roofs are more costly than traditional roof systems; however, the associated costs could be offset by the reduced need for storm-water facilities. Also, parking structures with frontage along streets should provide retail and commercial uses along the street in order to enhance the pedestrian experience and create street level activity. Incorporating retail and commercial uses in parking structures has the added benefit of generating additional sources of revenue through the lease or sale of space.
As we develop our strategies for dealing with future parcels of asphalt that will expand to cover the urban
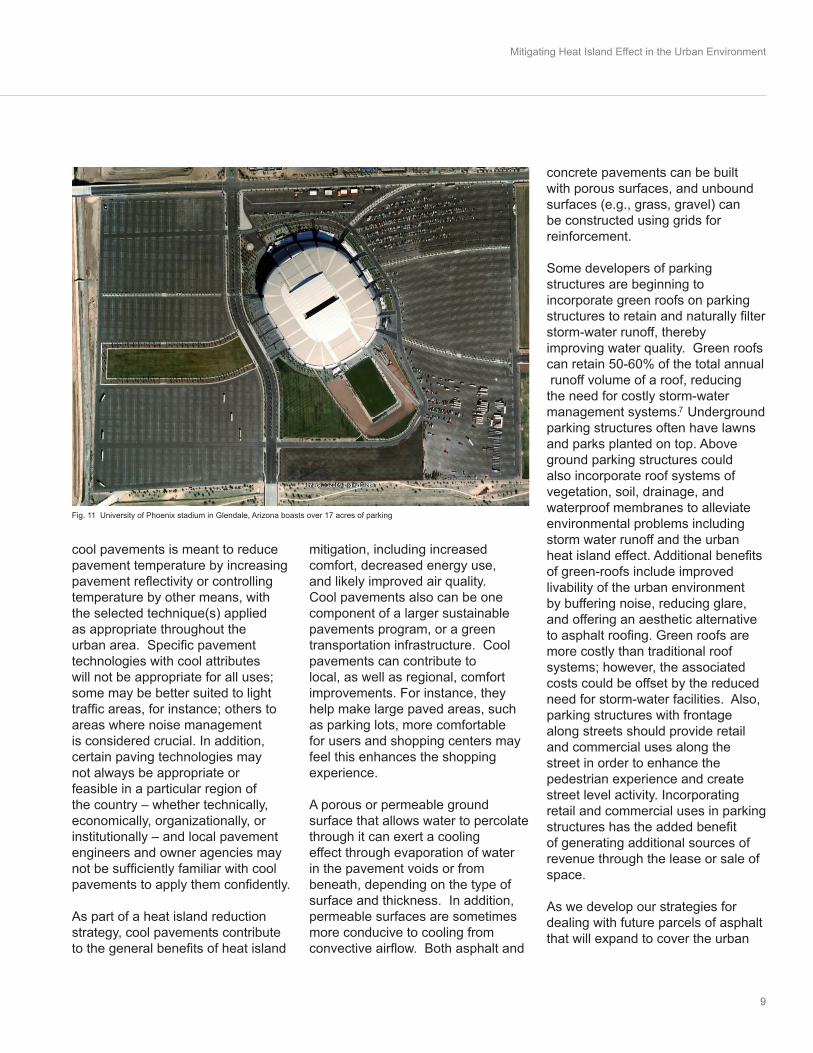
Fig. 11 University of Phoenix stadium in Glendale, Arizona boasts over 17 acres of parking
7
UTSoA - Seminar in Sustainable Architecture
10
area, we must also think about strategies that will mitigate the effect that our current surface parking lots have on the delicate ecosystem that surrounds them. As stated earlier these expansive parking surfaces can do more damage to the environment than what might be immediately perceivable. If, as a society, we see these places as absolutely necessary then we must employ them to work towards be more sustainable places, socially and environmentally. Looking at the expansive parking surfaces of most sports arenas and stadiums we can clearly see that there is an incredible amount of waste happening. As these parking lots cover more and more area of valuable earth we needto realize their impact. For example, a typical football stadium holding 60,000 or more people will have roughly 25,000 parking spaces available in the immediate area. This is an enormous amount
of asphalt, sometimes totaling more than 20 acres, adding to the already increased amount of storm-water runoff that has an unfortunate effect on our local environment. Even more incredible is that this parking lot is seldom used, typically less than 30 days a year counting all football games, as well as concerts and other entertainment events. That’s only 8% of the days in a given year. These stadiums have the highest degree of engineering and design associated with them, but somehow we clearly have overlooked ideas on dealing with parking related issues.
Moreover, you can imaginethe amount of carbon dioxide being released as 25,000+ running automobiles sit, waiting for their chance to leave the stadium confines. Although some of the facts that I have presented in this paper are overwhelming and saddening, I am excited for the future. If nothing
else this paper has proved to me that there are countless people, organizations and companies working right now towards improving these problems, things that will not, and cannot be changed over-night. As we move forward on this Earth we must all remember the impact that every one of us has on our immediate surroundings, as well as the entire planet.
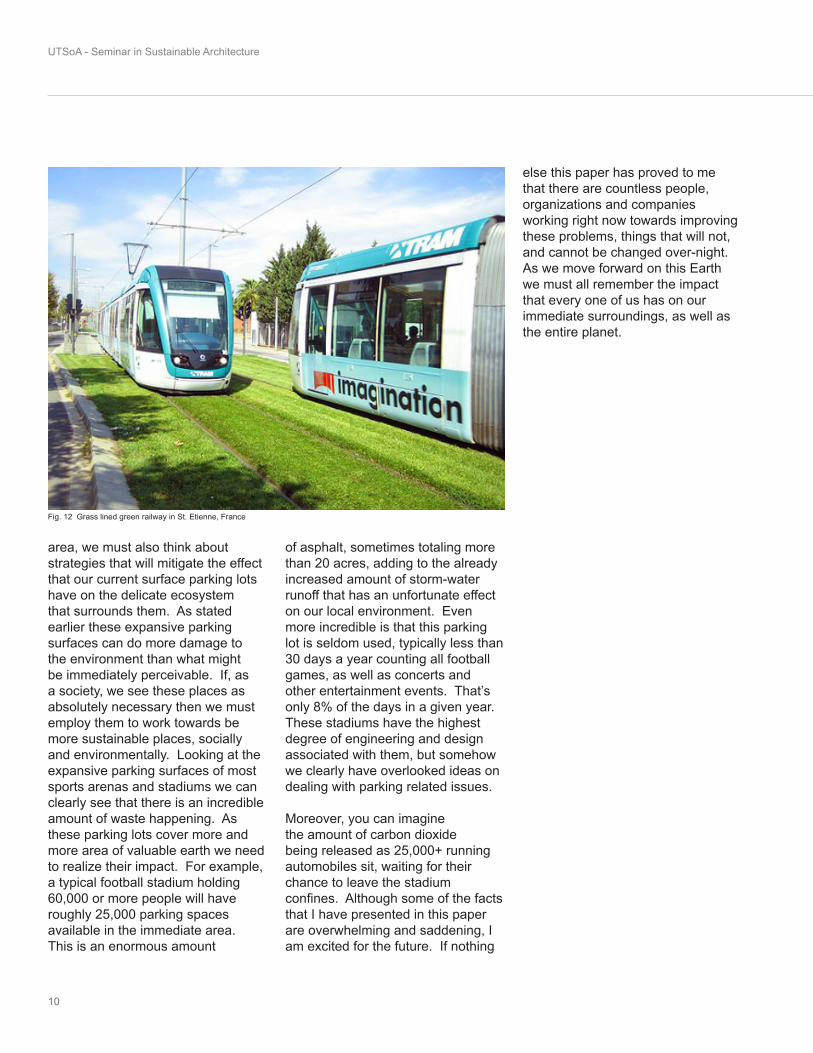
Fig. 12 Grass lined green railway in St. Etienne, France
Mitigating Heat Island Effect in the Urban Environment
11
Notes
1: Burba, George and Michael Pidwirny (Lead Authors); Debbie Swarthout (Contributing Author). 2007. “Transpiration.” In: Encyclopedia of Earth. Eds. Cutler J. Cleveland (Washington, D.C.: Environmental Information Coalition, National Council for Science and the Environment). First published in the Encyclopedia of Earth October 4, 2006; Last revised April 1, 2007 http://www.eoearth.org/article/Transpiration
2: Berdahl P. and S. Bretz. 1997. Preliminary survey of the solar reflectance of cool roofing materials. Energy and Buildings 25:149-158.
3: Akbari, H. 2005. Energy Saving Potentials and Air Quality Benefits of Urban Heat Island Mitigation (PDF) (19 pp, 251K). Lawrence Berkeley National Laboratory.
4: EPA. 2003. Beating the Heat: Mitigating Thermal Impacts. Nonpoint Source News-Notes. 72:23-26.
5: EPA. 2003. Beating the Heat: Mitigating Thermal Impacts. Nonpoint Source News-Notes. 72:23-26.
6: EPA. 2003. Beating the Heat: Mitigating Thermal Impacts. Nonpoint Source News-Notes. 72:23-26.
7: Zimbler, Robin. Driving Urban Environments: Smart Growth Parking Best Practices
Figures
1: View of downtown Austin, Texas. August 2009. Photographer: Joel Nolan
2: Redrawn from Bruce Ferguson’s “Introduction to Stormwater: Concept, Purpose, Design,” 1998
3: Redrawn from Cool Pavement Report, p. 12, 2005http://www.epa.gov/heatislands/resources/pdf/CoolPavementReport_Former%20Guide_complete.pdf
4: Redrawn from Cool Pavement Report, p. 5 2005http://www.epa.gov/heatislands/resources/pdf/CoolPavementReport_Former%20Guide_complete.pdf
5: Redrawn from Cool Pavement Report, p. 6 2005http://www.epa.gov/heatislands/resources/pdf/CoolPavementReport_Former%20Guide_complete.pdf
6: Source - Downtown Austin Parking Utilization Survey conducted by Wibur Smith Associates and Urban Design Group during March-April 2000http://www.ci.austin.tx.us/transplan/fig04rev.pdf
7: Photo taken from Google Earthhttp://www.panoramio.com/photo/8021196
8: Photo of permeable parking surface in Germanyhttp://picasaweb.google.com/lh/photo/QxMP7B0WWAv_FHUpjx_FhA
9: Source - Better Roads Magazine, November 2004
10: Ballet Valet Parking Garage and Retail Center, designed by Arquitectonica http://www.arquitectonica.com/
11: Source - Google Earth
12: Source - Europe’s Grass-Lined Green Railways = Good Urban Designby Bridgette Meinholdhttp://www.inhabitat.com/2009/01/27/europes-grass-lined-green-railways-good-urban-design/

Recommended