RESEARCH ARTICLE
Migration and habitat of white sharks (Carcharodon carcharias)in the eastern Pacific Ocean
Kevin C. Weng Æ Andre M. Boustany Æ Peter Pyle ÆScot D. Anderson Æ Adam Brown Æ Barbara A. Block
Received: 29 November 2006 / Accepted: 24 May 2007
� Springer-Verlag 2007
Abstract Satellite telemetry studies of 20 adult and sub-
adult white sharks (360–530 cm estimated total length
(TL)) in the eastern North Pacific during 1999–2005 re-
vealed long distance seasonal migrations from the coast of
California to an offshore focal area 2,500 km west of the
Baja Peninsula, as well as the Hawaii Islands. Three tags
were recovered allowing detailed behavioral analyses,
including one shark’s migration cycle from the coast to the
offshore focal area and back. While near pinniped rook-
eries in autumn and winter, sharks avoided the surface and
used water to 50 m depth, consistent with a silhouette-
based hunting strategy. Offshore migrations were initiated
during November–March and followed periods of
decreasing pinniped abundance. Migrations were highly
directed, taking 23 ± 5 days to reach the offshore focal
area along similar paths among sharks and years, defining a
migration corridor. Sharks exhibited a broad depth distri-
bution (0–644 m) in the offshore focal area, and remained
there for up to 167 days during spring and summer, though
primary productivity and fishery data suggest that forage
resources are scarcer there than in other regions of the
eastern North Pacific. Archival data from one shark re-
vealed intensive oscillatory movements while in the off-
shore focal area, a behavior that may be related to foraging
or mating. Sharks traveling to Hawaii remained near the
islands up to 122 days, potentially feeding on pelagic fishes
and marine mammals that concentrate around the islands.
Introduction
The sharks of the family Lamnidae are apex pelagic pre-
dators that range into temperate, tropical and polar oceans
(Compagno 1984), and comprise the shortfin mako shark
(Isurus oxyrhincus), the longfin mako shark (Isurus
paucus), the white shark (Carcharodon carcharias), the
salmon shark (Lamna ditropis) and the porbeagle shark
(Lamna nasus) (Compagno 1984). The Lamnidae are un-
ique among sharks due to the presence of counter-current
heat exchangers, centralized slow-twitch muscle and
elevated metabolic rates. These physiological attributes
Communicated by J.P. Grassle.
Electronic supplementary material The online version of thisarticle (doi:10.1007/s00227-007-0739-4) contains supplementarymaterial, which is available to authorized users.
K. C. Weng � A. M. Boustany � B. A. Block (&)
Tuna Research and Conservation Center,
Hopkins Marine Station of Stanford University,
120 Ocean View Boulevard, Pacific Grove, CA 93950, USA
e-mail: [email protected]
Present Address:K. C. Weng
School of Ocean and Earth Science and Technology,
University of Hawaii at Manoa, Honolulu, HI 96822, USA
Present Address:A. M. Boustany
Nicholas School of the Environment and Earth Sciences,
Duke University, Durham, NC 27708, USA
P. Pyle � A. Brown
PRBO Conservation Science, 3820 Cypress Drive #11,
Petaluma, CA 94954, USA
Present Address:P. Pyle
Institute for Bird Populations, P.O. Box 1346,
Point Reyes Station, CA 94956, USA
S. D. Anderson
P.O. Box 390, Inverness, CA 94937, USA
123
Mar Biol
DOI 10.1007/s00227-007-0739-4

enable lamnids to maintain warm body temperatures
(Carey et al. 1982; Graham et al. 1990), which may
underlie many of their ecological traits, including wide
thermal tolerance, high performance swimming (Bernal
et al. 2005), niche expansion into northern latitudes (Weng
et al. 2005) and the ability to capture marine mammals
(Ainley et al. 1985).
White sharks live in temperate and tropical waters with
a distribution that spans coastal to pelagic habitats. Adult
white sharks feed on fishes and marine mammals (Comp-
agno 1984). Aggregations of white sharks near pinniped
rookeries have been documented in a number of areas,
including northern California (Ainley et al. 1985), southern
Australia (Bruce 1992), eastern Canada (Brodie and Beck
1983) and South Africa (Ferreira and Ferreira 1996). White
sharks have been observed poleward of 50� in both hemi-
spheres and in tropical waters (Compagno 1984). Con-
ventional tagging studies have shown movements up to
1,445 km from the point of release (Kohler and Turner
2001), while photographic identification of individual
sharks has revealed movements of 700 km (Anderson and
Goldman 1996). Acoustic tracking studies have shown that
white sharks have average stomach temperature elevations
of 10.8�C in 15–18�C waters (Goldman 1997).
Recent satellite tracking studies have rapidly expanded
our knowledge of the horizontal movements and diving
behaviors of white sharks. Satellite tags placed on adult
white sharks in the Pacific and Indian Oceans (Boustany
et al. 2002; Bonfil et al. 2005; Bruce et al. 2006) have
provided new details of long-range movements and vertical
habitat distribution. Boustany et al. (2002) demonstrated
that white sharks tracked from the central California coast
moved into an offshore region between Hawaii and Baja,
as well as to the Hawaiian Islands. Bonfil et al. (2005)
reported a transoceanic migration from South Africa to
western Australia and back, as well as fine-scale coastal
movements off the coast of South Africa and Mozambique.
Bruce et al. (2006) showed that white sharks make long
distance movements along the west, south and east coasts
of the Australian continent, and reported one shark moving
from South Australia to the North Island of New Zealand.
These studies rejected the widely held belief that white
sharks were coastal or neritic, and raised a number of new
questions about their behaviors and life history, including
the importance of nearshore versus pelagic phases, the
portions of the year spent in each habitat, and the pre-
dictability of long distance movements.
In California, white sharks are known to aggregate at
pinniped rookeries during northern autumn (September–
November) and winter (December–February) when the
abundance of immature elephant seals is at a maximum
Ainley et al. (1985). However, little information existed
regarding their distribution during spring (March–May)
and summer (June–August). Their absence from these
rookeries during the spring influx of elephant seals was
thought to be a result of mature sharks moving into the
Southern California Bight to mate or give birth (Klimley
1985). Parturition in the Southern California Bight is sup-
ported by the existence of young-of-the-year sharks in that
region (Klimley 1985; Weng et al. 2007), but no pregnant
females have ever been observed there (Francis 1996). The
results of Boustany et al. (2002) were not consistent with
this hypothesis, and showed offshore movments, possibly
for parturition, mating, or foraging. Anderson and Pyle
(2003) found that females return to the Farallones on a 2-
year cycle, while males return annually, and speculated that
females may travel large distances to give birth.
The discovery that top–down processes can have fun-
damental structural impacts on ecosystems (Hunter and
Price 1992) highlights the need to understand the biology
of apex predators such as the white shark. The use of new
electronic tagging technologies to track pelagic animals has
yielded numerous insights into the biology of species such
as salmon sharks (Weng et al. 2005), bluefin tuna (Thunnus
thynnus) (Block et al. 2005), elephant seals (Mirounga
angustirostris) (DeLong et al. 1992) and marine birds
(Weimerskirch et al. 2002). Enhanced knowledge of the
long-range movements and aggregation areas of pelagic
species will improve our understanding of their life history,
and of their relations to the physical and biotic environ-
ment. This knowledge is essential to the management of
white shark populations, which are threatened globally
(Stevens et al. 2000). In this paper we investigate the
seasonal movements of eastern North Pacific white sharks,
compare their utilization of neritic and pelagic waters, and
discuss the biological functions that they may be fulfilling
in these distant habitats.
Materials and methods
Satellite telemetry
White sharks were tagged at Southeast Farallon Island
(37.70�N, 123.00�W), which lies 30 km west of the en-
trance to San Francisco Bay, CA, USA. Pop-up archival
transmitting tags (PAT tag firmware versions 2.0, 3.0 and
4.0; Wildlife Computers, Redmond, Washington, USA)
were deployed on white sharks during the autumn months
of 1999–2004. Each PAT tag was attached to a titanium
dart with a 20 cm segment of 136 kg monofilament line
(300 lb test Extra-hard Hi-catch, Momoi Manufacturing,
Japan) coated with shrink-wrap. The titanium dart was cus-
tom-made, measuring 59 · 13 · 1.5 mm, with the trailing
10 mm canted at a 17� angle. The dart was inserted 17 cm
into the dorsal musculature of the shark at the base of the
Mar Biol
123
first dorsal fin using a 2 m aluminum pole. Sharks were
not captured, but were tagged during predatory events as
they swam near the 4.3 m research boat. No chum was
used to attract sharks. Sizes were estimated and under-
water and above water video and photos were taken to
determine sex and aid in visual identification of individual
sharks.
PAT tags remain attached to a study animal for a pre-
determined duration, and then activate an electrolytic re-
lease mechanism, floating to the surface and transmitting
data to satellite-borne Argos receivers. PAT tags in this
study were programmed to record depth, temperature and
light measurements at 1- or 2-min intervals. If the tag was
recovered it was possible to download the entire archival
dataset. The archival data were compressed into bins of 12
or 24 h for transmission to Argos satellites. For each time
period the tag produced a depth-temperature profile and
two histograms, one of time-at-depth and one of time-at
temperature. In addition, 12-light level data points were
transmitted for both dawn and dusk of each day.
Data recovery
Of the 29 PAT tags deployed, 20 successfully transmitted
data on the movements and habitat preferences of white
sharks (Table 1), while nine did not report (Appendix 1).
Three PAT tags were recovered (2-M, 17-U and 18-F) and
the full archival records obtained (525 days total). Tag 2-M
detached and transmitted from waters near the Farallon
Islands, CA, drifted to shore and was found, yielding a
26 day archival record. Tag 17-U popped-up and trans-
mitted from waters near Ano Nuevo Island, California and
was recovered at sea, yielding a 305 day archival record.
Tag 18-F never transmitted, and was found near Sea
Ranch, California, yielding a 194 day archival record.
Subsequent analysis revealed that the battery of tag 18-F
failed during the track.
For all 20 sharks, the tracking duration (the time the
PAT tag remained attached to the shark) averaged
167 ± 96 days with a maximum tracking period of
367 days (Table 1). We obtained 19 satellite tag endpoint
locations from Argos, and 906 geolocations based on light-
based longitudes and SST-based latitudes, of which 395
were obtained from archival records. Including the known
deployment locations, the total location dataset includes
945 positions. Visually estimated total lengths (TL) for the
sharks in this study averaged 443 ± 49 cm. Using TL
maturity thresholds of 3.8 m for males (Pratt 1996) and
4.5 m for females (Francis 1996), we estimate that 68% of
the sharks we tracked were sexually mature, comprising
nine males, three females and one of unknown sex larger
than the female threshold. Of the remaining sharks, one
was an immature male, three were immature females and
two were of unknown sex (Table 1). Three of the 20 sharks
in this study (1-M, 2-M and 3-M) were included in an
earlier publication (Boustany et al. 2002).
Analysis
To determine the movements of each shark, we estimated
longitude for each day based on threshold techniques for
assessing position with ambient light levels (Hill and Braun
2001). Latitude was estimated for each day by comparing
sea surface temperature measured by the tag with that
measured by satellite sensors along the light-based longi-
tude estimation (Teo et al. 2004). A speed filter of 2 m/s
was used to discard points requiring movements that were
not biologically feasible, based on published speeds from
electronic tagging studies for white sharks of 1.2 m/s
(Klimley et al. 2001) and 1.3 m/s (Bonfil et al. 2005). Teo
et al. (2004) estimated the root mean square (RMS) error of
light-based longitude to be within 0.89�, and the RMS error
of SST-based latitude to be within 1.54�, for double tag-
ging experiments (PAT and SPOT) on salmon sharks and
blue sharks. We also directly estimated errors for white
sharks in this study by comparing known deployment or
endpoint locations to light/SST geolocations up to 1 day
away (Table 2). For the purposes of error estimation we did
not use a speed filter, so as to avoid artificially reducing
errors. The straightness of tracks was calculated using the
method of Batschelet (1981), in which the straightness
index is the ratio of the straight distance between two
points and the actual path traveled between them, such that
a straight line has a value of one. Straightness was calcu-
lated only for the tracks of the two sharks with archival
records that moved offshore. Sharks with transmitted
records had insufficient positions to calculate straightness
with confidence.
The habitat use of white sharks was quantified using the
kernel density method (Silverman 1986) implemented in
the animal movement extension (Hooge and Eichenlaub
1997) for ArcView 3.2 (ESRI, Inc., Redlands, CA, USA).
Kernel densities were calculated for each meteorological
season using a search radius equal to the mean latitude
position error for our tags (1.73�). Variability in the tem-
poral frequency of positions can bias density estimation
(Aebischer et al. 1993) so we regularized our tracks to one
position per day. We used the piecewise cubic hermite
interpolating polynomial (Matlab, The Mathworks, Natick,
MA, USA), which had the highest accuracy of available
methods in a recent study (Tremblay et al. 2006). Kernel
density was presented as percent of all positions, with 25,
50 and 95% contours overlaid on color-mapped data. The
25% contour was used to highlight core regions of occu-
pancy, while 50 and 95% contours showed regions of
decreasing usage.
Mar Biol
123
We classified our data into six phases according to
the movements of the sharks: nearshore, traveling, in the
offshore focal area, near Hawaii, traveling to the south of
Hawaii, and in an offshore focal area south of Hawaii.
Sharks were considered to be nearshore from the date of
tagging until they dove to 200 m or greater and were thus
off the continental shelf, signifying departure. A dive
threshold was used rather than light/SST geolocation
because dive data were more temporally continuous than
geoposition data. Sharks were considered to be traveling
while their longitude-time trajectory showed monotonic
westward motion, and to have reached their destination,
either in the offshore focal area or near Hawaii, at the first
inflection in this trajectory. The straight distance between
the departure and arrival positions was used to determine
speed, which was thus an estimate of minimum speed.
Longitude was used as an indicator of migration rather than
position, because we obtained far fewer latitudes than
longitudes, and thus had fewer positions than longitudes.
Sharks were considered to be offshore or near Hawaii until
another monotonic movement eastward occurred.
We characterized the depth and temperature preferences
of the sharks using the histograms transmitted by PAT tags,
which aggregated all observations into preprogrammed
intervals. The mean and standard deviation for each
interval were calculated from the mean value at that
interval for each shark, such that error bars represent var-
iation between individuals. Distributions were Gaussian, so
comparisons are made with parametric Student’s t-tests.
Estimates of surface mixed layer depth, ZML, were made
using the temperature, T. We used pressure–temperature
data collected by the tags to determine the local maximum
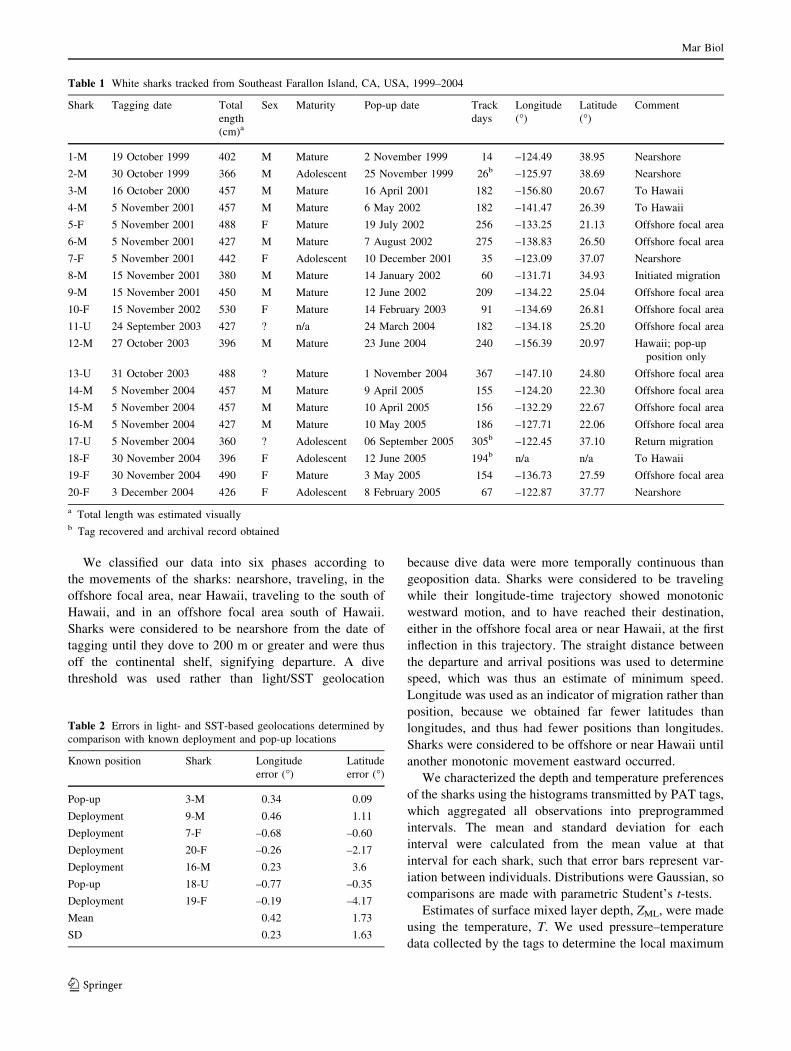
Table 1 White sharks tracked from Southeast Farallon Island, CA, USA, 1999–2004
Shark Tagging date Total
ength
(cm)a
Sex Maturity Pop-up date Track
days
Longitude
(�)
Latitude
(�)
Comment
1-M 19 October 1999 402 M Mature 2 November 1999 14 –124.49 38.95 Nearshore
2-M 30 October 1999 366 M Adolescent 25 November 1999 26b –125.97 38.69 Nearshore
3-M 16 October 2000 457 M Mature 16 April 2001 182 –156.80 20.67 To Hawaii
4-M 5 November 2001 457 M Mature 6 May 2002 182 –141.47 26.39 To Hawaii
5-F 5 November 2001 488 F Mature 19 July 2002 256 –133.25 21.13 Offshore focal area
6-M 5 November 2001 427 M Mature 7 August 2002 275 –138.83 26.50 Offshore focal area
7-F 5 November 2001 442 F Adolescent 10 December 2001 35 –123.09 37.07 Nearshore
8-M 15 November 2001 380 M Mature 14 January 2002 60 –131.71 34.93 Initiated migration
9-M 15 November 2001 450 M Mature 12 June 2002 209 –134.22 25.04 Offshore focal area
10-F 15 November 2002 530 F Mature 14 February 2003 91 –134.69 26.81 Offshore focal area
11-U 24 September 2003 427 ? n/a 24 March 2004 182 –134.18 25.20 Offshore focal area
12-M 27 October 2003 396 M Mature 23 June 2004 240 –156.39 20.97 Hawaii; pop-up
position only
13-U 31 October 2003 488 ? Mature 1 November 2004 367 –147.10 24.80 Offshore focal area
14-M 5 November 2004 457 M Mature 9 April 2005 155 –124.20 22.30 Offshore focal area
15-M 5 November 2004 457 M Mature 10 April 2005 156 –132.29 22.67 Offshore focal area
16-M 5 November 2004 427 M Mature 10 May 2005 186 –127.71 22.06 Offshore focal area
17-U 5 November 2004 360 ? Adolescent 06 September 2005 305b –122.45 37.10 Return migration
18-F 30 November 2004 396 F Adolescent 12 June 2005 194b n/a n/a To Hawaii
19-F 30 November 2004 490 F Mature 3 May 2005 154 –136.73 27.59 Offshore focal area
20-F 3 December 2004 426 F Adolescent 8 February 2005 67 –122.87 37.77 Nearshore
a Total length was estimated visuallyb Tag recovered and archival record obtained
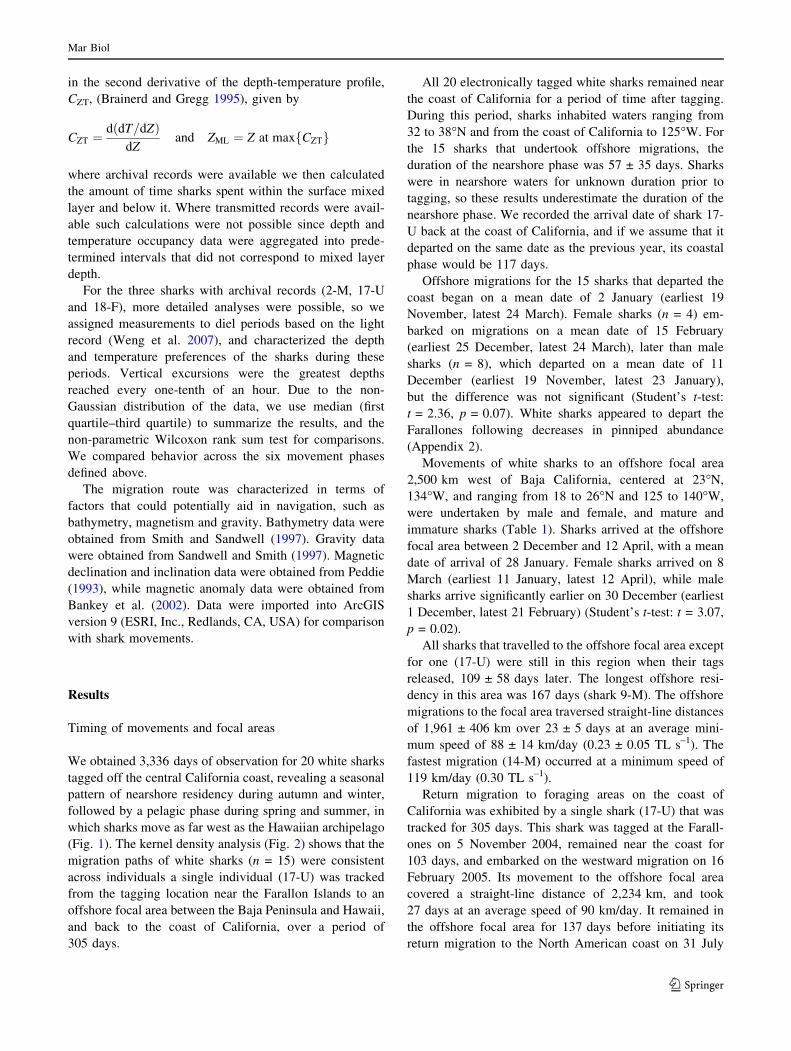
Table 2 Errors in light- and SST-based geolocations determined by
comparison with known deployment and pop-up locations
Known position Shark Longitude
error (�)
Latitude
error (�)
Pop-up 3-M 0.34 0.09
Deployment 9-M 0.46 1.11
Deployment 7-F –0.68 –0.60
Deployment 20-F –0.26 –2.17
Deployment 16-M 0.23 3.6
Pop-up 18-U –0.77 –0.35
Deployment 19-F –0.19 –4.17
Mean 0.42 1.73
SD 0.23 1.63
Mar Biol
123
in the second derivative of the depth-temperature profile,
CZT, (Brainerd and Gregg 1995), given by
CZT ¼d dT=dZð Þ
dZand ZML ¼ Z at maxfCZTg
where archival records were available we then calculated
the amount of time sharks spent within the surface mixed
layer and below it. Where transmitted records were avail-
able such calculations were not possible since depth and
temperature occupancy data were aggregated into prede-
termined intervals that did not correspond to mixed layer
depth.
For the three sharks with archival records (2-M, 17-U
and 18-F), more detailed analyses were possible, so we
assigned measurements to diel periods based on the light
record (Weng et al. 2007), and characterized the depth
and temperature preferences of the sharks during these
periods. Vertical excursions were the greatest depths
reached every one-tenth of an hour. Due to the non-
Gaussian distribution of the data, we use median (first
quartile–third quartile) to summarize the results, and the
non-parametric Wilcoxon rank sum test for comparisons.
We compared behavior across the six movement phases
defined above.
The migration route was characterized in terms of
factors that could potentially aid in navigation, such as
bathymetry, magnetism and gravity. Bathymetry data were
obtained from Smith and Sandwell (1997). Gravity data
were obtained from Sandwell and Smith (1997). Magnetic
declination and inclination data were obtained from Peddie
(1993), while magnetic anomaly data were obtained from
Bankey et al. (2002). Data were imported into ArcGIS
version 9 (ESRI, Inc., Redlands, CA, USA) for comparison
with shark movements.
Results
Timing of movements and focal areas
We obtained 3,336 days of observation for 20 white sharks
tagged off the central California coast, revealing a seasonal
pattern of nearshore residency during autumn and winter,
followed by a pelagic phase during spring and summer, in
which sharks move as far west as the Hawaiian archipelago
(Fig. 1). The kernel density analysis (Fig. 2) shows that the
migration paths of white sharks (n = 15) were consistent
across individuals a single individual (17-U) was tracked
from the tagging location near the Farallon Islands to an
offshore focal area between the Baja Peninsula and Hawaii,
and back to the coast of California, over a period of
305 days.
All 20 electronically tagged white sharks remained near
the coast of California for a period of time after tagging.
During this period, sharks inhabited waters ranging from
32 to 38�N and from the coast of California to 125�W. For
the 15 sharks that undertook offshore migrations, the
duration of the nearshore phase was 57 ± 35 days. Sharks
were in nearshore waters for unknown duration prior to
tagging, so these results underestimate the duration of the
nearshore phase. We recorded the arrival date of shark 17-
U back at the coast of California, and if we assume that it
departed on the same date as the previous year, its coastal
phase would be 117 days.
Offshore migrations for the 15 sharks that departed the
coast began on a mean date of 2 January (earliest 19
November, latest 24 March). Female sharks (n = 4) em-
barked on migrations on a mean date of 15 February
(earliest 25 December, latest 24 March), later than male
sharks (n = 8), which departed on a mean date of 11
December (earliest 19 November, latest 23 January),
but the difference was not significant (Student’s t-test:
t = 2.36, p = 0.07). White sharks appeared to depart the
Farallones following decreases in pinniped abundance
(Appendix 2).
Movements of white sharks to an offshore focal area
2,500 km west of Baja California, centered at 23�N,
134�W, and ranging from 18 to 26�N and 125 to 140�W,
were undertaken by male and female, and mature and
immature sharks (Table 1). Sharks arrived at the offshore
focal area between 2 December and 12 April, with a mean
date of arrival of 28 January. Female sharks arrived on 8
March (earliest 11 January, latest 12 April), while male
sharks arrive significantly earlier on 30 December (earliest
1 December, latest 21 February) (Student’s t-test: t = 3.07,
p = 0.02).
All sharks that travelled to the offshore focal area except
for one (17-U) were still in this region when their tags
released, 109 ± 58 days later. The longest offshore resi-
dency in this area was 167 days (shark 9-M). The offshore
migrations to the focal area traversed straight-line distances
of 1,961 ± 406 km over 23 ± 5 days at an average mini-
mum speed of 88 ± 14 km/day (0.23 ± 0.05 TL s–1). The
fastest migration (14-M) occurred at a minimum speed of
119 km/day (0.30 TL s–1).
Return migration to foraging areas on the coast of
California was exhibited by a single shark (17-U) that was
tracked for 305 days. This shark was tagged at the Farall-
ones on 5 November 2004, remained near the coast for
103 days, and embarked on the westward migration on 16
February 2005. Its movement to the offshore focal area
covered a straight-line distance of 2,234 km, and took
27 days at an average speed of 90 km/day. It remained in
the offshore focal area for 137 days before initiating its
return migration to the North American coast on 31 July
Mar Biol
123
2005, which occurred in 22 days, at an average speed of
75 km/day. The shark inhabited shallow nearshore waters
between 35 and 38�N from 21 August 2005 until the tag
released and transmitted on 6 September 2005, 10 km from
Ano Nuevo Island.
Directed movements to waters near the Hawaiian
Islands were undertaken by four white sharks, along routes
that did not pass through the offshore focal area, and
included male and female, mature and immature sharks
(Table 1). Sharks occupied waters from 18 to 23�N and
154 to 163�W. The migration to the islands covered
3713 ± 56 km and occurred in 37 ± 2 days at 101 ± 6 km/
day (0.27 ± 0.03 TL s–1) (n = 3). Sharks remained near
the Islands of Kauai, Maui, Lanai, Kahoolawe and Hawaii
for 62 ± 50 days. One shark (3-M) inhabited these waters
from 26 December 2000 until its tag released 122 days
later on 16 April 2001, when it was in the Kealaikahiki
Channel between Kahoolawe and Lanai (Boustany et al.
2002), 11 km from Lanai. Another shark (4-M) inhabited
waters of Molokai and Maui for 61 days from 15 January
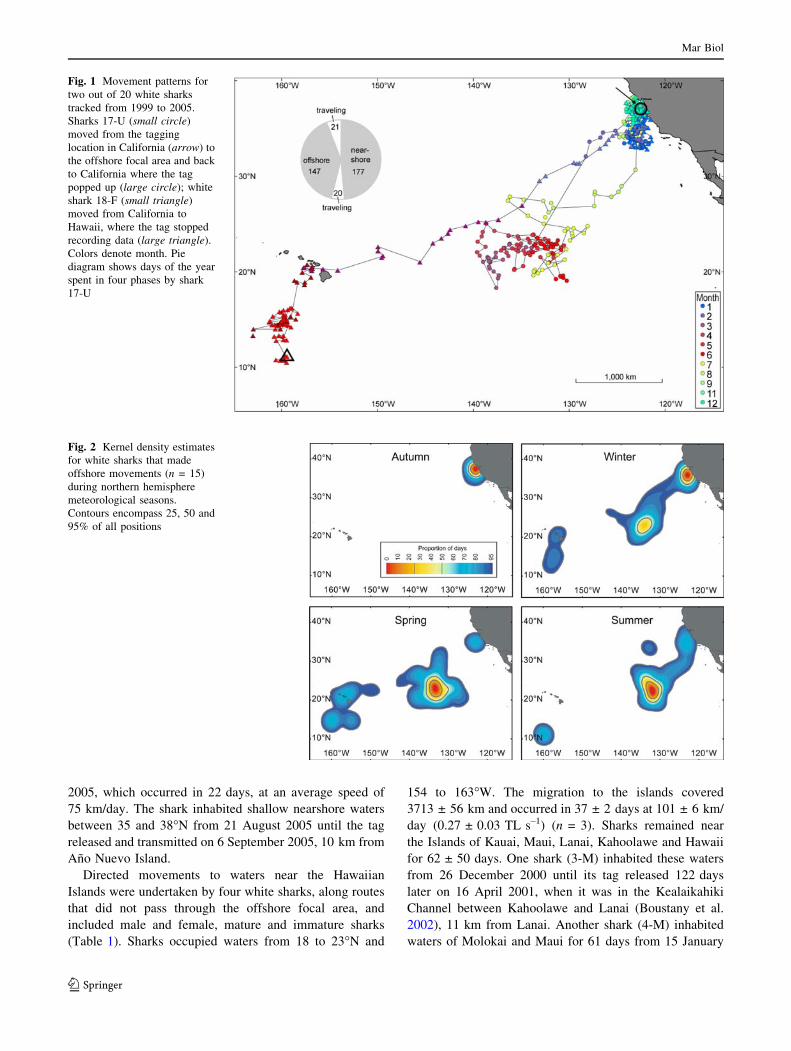
Fig. 1 Movement patterns for
two out of 20 white sharks
tracked from 1999 to 2005.
Sharks 17-U (small circle)
moved from the tagging
location in California (arrow) to
the offshore focal area and back
to California where the tag
popped up (large circle); white
shark 18-F (small triangle)
moved from California to
Hawaii, where the tag stopped
recording data (large triangle).
Colors denote month. Pie
diagram shows days of the year
spent in four phases by shark
17-U
Fig. 2 Kernel density estimates
for white sharks that made
offshore movements (n = 15)
during northern hemisphere
meteorological seasons.
Contours encompass 25, 50 and
95% of all positions
Mar Biol
123

to 17 March 2002, before heading east from the islands into
the offshore focal area, the only shark that visited both
offshore aggregation areas. The tag on a third-shark (12-M)
released and transmitted 5 km from the north shore of
Maui near Paia on 23 June 2004. Shark 18-F utilized waters
near Lanai and Kahoolawe for 13 days from 22 March to 4
April 2005, before moving south to a region 700 km to the
south of the island of Hawaii (Fig. 1). This southern
migration extended to 11�N, and the traveling period lasted
for 8 days, with a speed of 87 km/day (0.26 TL s–1). It was
in these waters for 57 days later when the battery failed.
Focal areas were strongly differentiated from migration
routes by the straightness of tracks, quantified using the
straightness index (Batschelet 1981), based on the tracks
for the two sharks with archival records that traveled into
offshore waters. Migration phases between the central
coast of California and the offshore focal area or the islands
of Hawaii had straightness indices (SI) of 0.78 ± 0.12,
significantly greater than the SI for the Farallones, the
offshore focal area and the Hawaiian Islands of 0.16 ± 0.21
(Student’s t-test, t = –5.88, p = 0.0003). Shark 17-U
inhabited three focal areas, the Farallones, the offshore
focal area, and Ano Nuevo (37.11�N, 122.34�W); and
undertook two migrations, one away from the coast of
California to the offshore focal area, and another returning
to the California coast. Shark 18-F utilized a focal area at
the Farallones, another near the Main Hawaiian Islands,
and a third 700 km south of Hawaii. The paths taken
by white sharks during migration did not show clear
relationships with magnetic features of the earth’s crust
(Appendix 3).
The errors in light- and SST-based geolocations were
estimated by comparison to known tagging positions and
satellite tag endpoint positions determined by the Argos
system (Table 2). Of the 20 white shark tags that reported
data, light and SST geolocation estimates were obtained
within 1 day of the start and endpoints for seven of 38
possible events.
Nearshore California
In nearshore California waters, white sharks (n = 16) spent
99 ± 3% of their time at depths shallower than 50 m, but
only 22 ± 16% of their time in 0–5 m depths (Figs. 3, 6a).
Sharks spent the majority (92 ± 10 %) of their time in
ambient temperatures of 10–14�C (Fig. 6b). Mixed layer
depths averaged 36 ± 18 m.
Archival records for sharks near the Farallon Islands
(n = 3) and Ano Nuevo Island (n = 1), California provided
a detailed look at these behavioral patterns. In comparison
to the other phases, the mixed layer near coastal California
was thinner and cooler; white sharks spent the greatest
amount of time in the mixed layer; and made the fewest
excursions below this layer (Table 3). There were no
strong diel patterns in behavior (Figs. 4a, 5a), and diel
differences in depth (Figs. 7a, e and 8a) and temperature
were not significant (Wilcoxon rank sum tests: depth,
W = 21.0, p = 0.47; temperature, W = 18.0, p = 1.00;
Table 4). Diel differences in the number of vertical excur-
sions were not significant (Wilcoxon rank sum tests: depth,
W = 17.0, p = 0.89; temperature, W = 16.5, p = 0.77; 5).
These patterns reflected their limited vertical movements,
as well as the rarity of visits to the surface.
Traveling
During migratory phases (n = 10) sharks spent 57 ± 7%
of their time shallower than 5 m, but also undertook dives
to 736 m, and spent 15 ± 10% of their time deeper than
300 m (Figs. 3 and 6c). Ambient temperatures showed a
broad distribution with 20 ± 14% of the time spent at
20–22�C and 19 ± 10% spent at 6–10�C, reflecting the
combination of surface swimming behavior and deep
diving (Fig. 6d). During the traveling phase sharks spent
significantly more time near the surface (Student’s t-test,
t = 7.64, p = 0.00) and more time deeper than 300 m
(Student’s t-test, t = 5.25, p = 0.00) than they did during
the nearshore phase (Fig. 6). Mixed layer depths averaged
110 ± 28 m.
Archival records for the migratory phase away from the
coast of California (n = 2) and the return migration back
to the coast of California (n = 1) were consistent with
transmitted PAT records reported above, and revealed that
sharks had a strong preference for the surface, which was
consistent through their initial westward migrations
through the California current (Figs. 4b, 5b) as well as the
later stages of migration in the subtropical gyre (Figs. 4c,
5c). Median depths were 2 m during both day and night
(Table 4), reflecting the behavior of returning to the surface
between vertical movements, and remaining there for
periods up to 1.5 days (shark 17-U). Diel differences
(Figs. 7b, 8b) were not significant for depth (Wilcoxon
rank sum test, W = 10.5, p = 1.00) or temperature (Wil-
coxon rank sum test, W = 12.5, p = 0.51). Vertical excur-
sions were far deeper than during the nearshore phase
(Table 5), and were not significantly different between day
and night for depth (Wilcoxon rank sum test, W = 13.0,
p = 0.38) or temperature (Wilcoxon rank sum test,
W = 6.0, p = 0.08).
Offshore focal area
Sharks in the offshore focal area (n = 9) occupied a broad
depth and temperature range (Fig. 3), spending 54 ± 18%
of the time shallower than 100 m, and 46 ± 22% of the
time deeper than 100 m (Fig. 6e). Sharks spent 58 ± 13%
Mar Biol
123

of the time in 20–24�C waters and 42 ± 13% of the time
in 4–20�C waters (Fig. 6f). Sharks spent 29 ± 10% of
the time in 0–5 m waters while in the offshore focal area,
significantly more than while traveling (Student’s t-test,
t = 7.74, p = 0.00). Mixed layer depths averaged
132 ± 20 m.
The archival record of shark 17-U revealed a remarkable
oscillatory behavior pattern when the shark was in the
offshore area, with vertical excursions occurring through-
out the diel cycle, from the surface to 644 m, ranging in
temperature from 5.4 to 24.2�C (Fig. 4d). The shark moved
below the surface mixed layer 30 times/day, up to a
maximum of 96 times/day (Fig. 4e; Table 3), and thus had
deeper median depths than during nearshore or traveling
phases (Appendix 4), reflecting the continuous movements
as well as the avoidance of near surface waters on some
nights. Median depths during the day (60 m) were signif-
icantly shallower (Wilcoxon rank sum test, W = 4.72,
p = 0.00; Table 4) than during the night (83 m), though
still within the mixed layer during both diel periods.
However, despite the deeper median position during night,
the depth of vertical excursions was significantly deeper
and cooler during day than night, and below the mixed
layer during both periods (Fig. 7c; Table 5; depth: Wil-
coxon rank sum test, W = 10.2, p = 0.00; temperature:
Wilcoxon rank sum test, W = 10.17, p = 0.00).
5 Nov 5 Dec 5 Jan 5 Feb 7 Mar 7 Apr 8 May 7 Jun 8 Jul 8 Aug
0
100
200
300
400
500
600
Dep
th (
m)
3 Dec 22 Dec 10 Jan 29 Jan 17 Feb 8 Mar 27 Mar 15 Apr 4 May 23 May
0
100
200
300
400
500
600
Nearshore Offshore focal area Nearsh.Travel Travel
Nearshore Hawaii Offshore south of HawaiiTravel Travel
(a)
(b)
(c)
31 Oct 2 Nov 5 Nov 7 Nov 10 Nov 12 Nov 15 Nov 17 Nov 20 Nov 22 Nov
0
10
20
30
40
50
60
70
Nearshore
Dep
th (
m)
Dep
th (
m)
2422
20
18
16
14
12
10
8
6
Tem
pera
ture
(C
)
24
2628
2220
181614
1210
8
6
Tem
pera
ture
(C
)
11 12 13 14Temperature (C)
Fig. 3 Ambient temperature-
depth profiles taken by a shark
17-U during movements from
the Farallones, California to the
offshore focal area and back to
Ano Nuevo, CA, 2004–2005;
b shark 18-F during movements
from the Farallones, California
to waters near the Hawaiian
Islands; and c shark 2-M while
near the Farallones, CA. Colordenotes ambient temperature;
black line shows median daily
depth of the shark
Mar Biol
123

Hawaii
Depth and temperature data were obtained for three of the
four sharks that moved to the Hawaiian Islands. These
sharks showed a broad depth distribution, spending
48 ± 27% of the time shallower than 100 m and 52 ± 27%
of the time deeper than 100 m, but avoided the surface,
spending only 7 ± 1% of the time in 0–5 m waters
(Fig. 6g). Surface mixed layer depths averaged 113 ± 17 m,
suggesting that equal division of time above and below the
pre-programmed 100 m histogram threshold corresponded
approximately to time in and below the mixed layer. The
time in 0–5 m waters in Hawaii (n = 3), where tempera-
tures were 24.8 ± 0.1�C, was significantly lower than
during the nearshore California phase (7 vs. 22%; Student’s
t-test, t = 3.60, p = 0.00); and time deeper than 50 m was
significantly higher (79 vs. 1%; Student’s t-test, t = –27.8,
p = 0.00). Temperature distribution was broad, with
36 ± 31% of the time spent in waters warmer than 24�C,
and 5 ± 8% of the time in waters cooler than 14�C
(Fig. 6h).
A single archival record was obtained (18-F) for the
Hawaiian focal area (Figs. 3b, 5d). Median depths were
within the surface mixed layer during both diel periods
(Fig. 5d), and were significantly shallower (Wilcoxon rank
sum test, W = 41.9, p = 0.00) and warmer (Wilcoxon rank
sum test, W = 38.4, p = 0.00) during daytime (Fig. 8c;
Table 4). During the nighttime, vertical excursions were
significantly deeper (Wilcoxon rank sum test, W = 6.8,
p = 0.00), and cooler (Wilcoxon rank sum test, W = 7.0,
p = 0.00), than during the daytime (Table 5). This diel
pattern was the opposite of that observed during all other
phases (Fig. 5d, Appendix 5).
Travel south of Hawaii
During movement from waters near Maui to the focal area
700 km to the south (centered at 11.20�N, 159.88�W),
shark 18-F used waters from the surface to 708 m, and
from 5.9 to 25.8�C (Figs. 3b, 5e). The shark had a signif-
icantly deeper and cooler median position during nighttime
than daytime (Fig. 8d; Table 4; depth: Wilcoxon rank sum
test, W = 10.3, p = 0.00; temperature: Wilcoxon rank sum
test, W = 2.3, p = 0.02), which was within the mixed layer
during both diel periods. During the daytime, vertical
excursions were significantly deeper (Wilcoxon rank sum
16 Feb 17 Feb 18 Feb 19 Feb 20 Feb 21 Feb 22 Feb600500400
300200100
0
4 Mar 5 Mar 6 Mar 7 Mar 8 Mar 9 Mar 10 Mar
22 Apr 23 Apr 24 Apr 25 Apr 26 Apr 27 Apr 28 Apr
600500400
3002001000
600
500400
300200100
0
Dep
th (
m)
Dep
th (
m)
Dep
th (
m)
26 Apr600
500400
300200100
0
Dep
th (
m)
(e)
(a)
(b)
(c)
(d)
0
25
50
75
100
Dep
th (
m)
3 Dec 4 Dec 5 Dec 6 Dec 7 Dec 8 Dec 9 Dec
Temperature (˚C)
0 10 15 20 25
Fig. 4 One week time series of depth (line) and temperature (color)
for white shark 17-U, 2004–2005: a Nearshore, of the Farallon
Islands, California, b traveling west through the California Current,
c traveling through the subtropical gyre, d in the offshore focal area,
and e a single day in the offshore area. Dark grey denotes nighttime,
light grey denotes twilight
Mar Biol
123
25 Mar 26 Mar 27 Mar 28 Mar 29 Mar 30 Mar 31 Mar250
200
150
100
50
0
6 Apr 7 Apr 8 Apr 9 Apr 10 Apr 11 Apr 12 Apr800
600
400
200
0
(d)
(e)
25 Feb 26 Feb 27 Feb 28 Feb 1 Mar 2 Mar 3 Mar700600500400300200100
0
13 Feb 14 Feb 15 Feb 16 Feb 17 Feb 18 Feb 19 Feb600500400300
200
1000
50
0
6 May 7 May 8 May 9 May 10 May 11 May 12 May600500400
300
200
1000
(b)
(c)
(f) 5 10 15 20 25
Temperature (°C)
Dep
th (
m)
Dep
th (
m)
Dep
th (
m)
Dep
th (
m)
Dep
th (
m)
4 Dec 5 Dec 6 Dec 7 Dec 8 Dec 9 Dec 10 Dec
40
302010
Dep
th (
m)
(a)
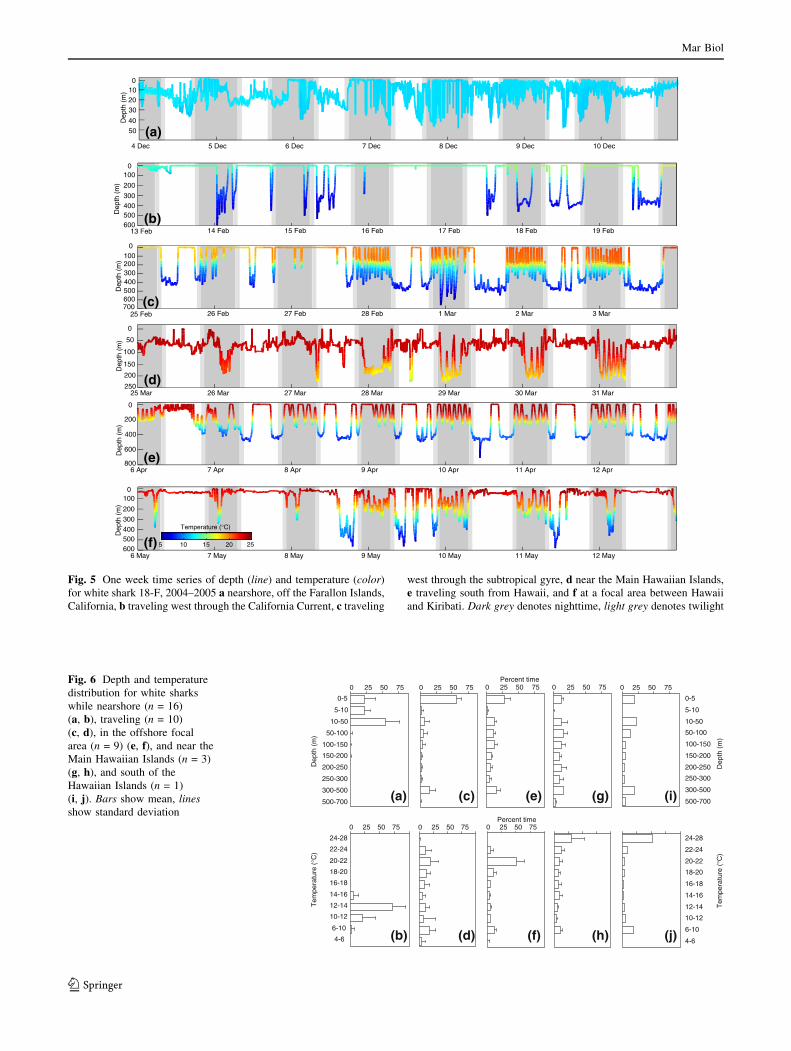
Fig. 5 One week time series of depth (line) and temperature (color)
for white shark 18-F, 2004–2005 a nearshore, off the Farallon Islands,
California, b traveling west through the California Current, c traveling
west through the subtropical gyre, d near the Main Hawaiian Islands,
e traveling south from Hawaii, and f at a focal area between Hawaii
and Kiribati. Dark grey denotes nighttime, light grey denotes twilight
Dep
th (
m)
Dep
th (
m)
Tem
pera
ture
(°C
)
Tem
pera
ture
(°C
)
0 25 50 75
0-5
5-10
10-50
50-100
100-150
150-200
200-250
250-300
300-500
500-700
0-5
5-10
10-50
50-100
100-150
150-200
200-250
250-300
300-500
500-700
4-6
6-10
10-12
12-14
14-16
16-18
18-20
20-22
22-24
24-28
4-6
6-10
10-12
12-14
14-16
16-18
18-20
20-22
22-24
24-28
0 25 50 75 0 25 50 75 0 25 50 75
0 25 50 75 0 25 50 75 0 25 50 75 0 25 50 75
(a) (c) (e) (g)
(b) (d) (f) (h)
(i)
(j)
Percent time
Percent time
Fig. 6 Depth and temperature
distribution for white sharks
while nearshore (n = 16)
(a, b), traveling (n = 10)
(c, d), in the offshore focal
area (n = 9) (e, f), and near the
Main Hawaiian Islands (n = 3)
(g, h), and south of the
Hawaiian Islands (n = 1)
(i, j). Bars show mean, linesshow standard deviation
Mar Biol
123

test, W = 10.7, p = 0.00), and cooler (Wilcoxon rank sum
test, W = 10.6, p = 0.00), than during the nighttime (Ta-
ble 5); all excursions went beneath the mixed layer during
both diel periods. The behavior of shark 18-F during this
travel phase was similar to the traveling periods from
California, as it returned to and remained at the surface
after vertical excursions, but surface periods were shorter
and median depth was much deeper than during migrations
from California during both day and night (Table 4).
Offshore focal area south of Hawaii
At the focal area centered 700 km south of Kauai, shark
18-F inhabited the warmest surface waters recorded in this
study, 27.2�C (Figs. 3b, 5f, 6i, j). The median daytime
distribution was significantly shallower (Wilcoxon rank
sum test, W = 6.8, p = 0.00) and warmer (Wilcoxon rank
sum test, W = 21.4, p = 0.00) than the median nighttime
distribution (Fig. 8e). During the daytime, vertical excur-
sions were significantly deeper (Wilcoxon rank sum test,
W = 10.3, p = 0.00), and cooler (Wilcoxon rank sum test,
W = 10.4, p = 0.00), than during the nighttime (Table 5).
On 24 April the shark made one movement deeper than the
limit of the depth sensor (980 m), where the temperature
was 4.5�C. This pattern of having a shallower median
position but deeper vertical excursions during the day, was
similar to that observed for shark 17-U in the offshore focal
area between California and Hawaii.
Discussion
White sharks electronically tagged in the waters off central
California, USA made long distance offshore movements
on a seasonal cycle, aggregating in the coastal waters of
central California during autumn and winter, and undertook
offshore migrations into oceanic waters during winter and
spring. Our results indicate that white sharks in the eastern
North Pacific occupy neritic zones for about half the year
and pelagic habitats for the remaining period. Between the
two phases we identify a migration of approximately
3 weeks that links the two habitats. The offshore focal area
used by white sharks is an area of low productivity and
may be a region used for foraging, mating or parturition.
We observed similar migration routes and destinations in
males and females, as well as mature and sub-adult sharks,
though there were sex-specific differences in migration
timing. The neritic-pelagic migration cycle observed in this
study differs from seasonal movement patterns of Austra-
lian sharks. Bruce et al. (2006) reported that white sharks
spent the majority of time near the coast, but reported a
single pelagic movement from Australia to New Zealand.
White sharks occupied the Great Australian Bight during
the southern spring and summer, made northward move-
ments during the southern autumn and winter along the east
coast through New South Wales and Queensland, and re-
turned to the southern region by early summer. Bonfil et al.
(2005) reported the movement of a white shark between
South Africa and Australia but further research is needed
before we will know if this is a rare movement or a sea-
sonal pattern.
Nearshore habitat
The coastal habitat of adult and sub-adult white sharks
appears to be important for foraging. The relationship be-
tween white shark movements to the Farallones and the
existence of pinniped rookeries is well known (Ainley et al.
1985), and individually identified sharks return in sub-
sequent years to this location (Anderson and Pyle 2003) as
well as to pinniped rookeries at Guadalupe Island, Mexico
(Domeier and Nasby-Lucas 2007) and Seal Island in South
Africa (Martin et al. 2005). White sharks begin to aggre-
gate at the Farallones in late August (Pyle et al. 1996) so
the duration of this phase is likely to be substantially longer
than the mean duration of 57 days in this study, since
sharks were at the Farallones for unknown duration prior to
tagging. The nearshore vertical behaviors of white sharks
observed in this study are consistent with a strategy for
hunting pinnipeds. The sharks rarely visit the surface wa-
ters, reflecting the behavior of looking for silhouettes from
below and attacking by surprise (Goldman and Anderson
Table 3 Mixed layer properties for sharks with archival records
Phase Mixed
layer (m)
Mixed
layer (�C)
Time in
ML (%)
Time below
ML (%)
Movements
below ML day–1Max movements
below ML day–1
Nearshore 26 ± 16 13.3 ± 0.2 82 ± 28 12.7 ± 0.4 2.9 ± 2.9 7.7 ± 6.7
Traveling 112 ± 37 18.9 ± 1.2 71 ± 5 10.8 ± 1.6 8.0 ± 3.9 23.7 ± 12.0
Offshore focal area 104 21.5 ± 1 55 14.3 ± 4.3 30.3 ± 19.2 96
Hawaii 100 24.4 ± 0.3 55 21.0 ± 2.1 3.5 ± 2.9 12
Travel south of Hawaii 120 25.0 ± 0.5 47 12.9 ± 4.9 6.2 ± 2.0 8
Offshore focal area
south of Hawaii
131 25.0 ± 0.9 60 12.4 ± 5.1 3.8 ± 2.5 11
Mar Biol
123
1999). Bruce et al. (2006) reported that white sharks for-
aging on teleosts and elasmobranchs in shallow regions
also swam along the bottom with few visits to the surface.
Sharks returning to the continental margin may forage
on harbor seals and sea lions prior to their arrival at ele-
phant seal rookeries. We recorded a white shark returning
to the California coast from the offshore focal area (17-U)
during August, and inhabiting waters between Bodega Bay,
CA and Big Sur, CA before the pop-up satellite tag
transmitted near Ano Nuevo Island, California. Long et al.
(1996) showed a peak in predation on harbor seals and sea
lions in August, which occurred in coastal areas away from
elephant seal rookeries.
Departure
The timing of departure of white sharks from the Farallones
may be related to the decline in abundance of pinnipeds. In
this study, electronically-tagged white sharks departed the
California coast on a mean date of 2 January, shortly after
the peak in abundance of young-of-the-year elephant seals
that use the islands for their first haul-out period and then
depart as adult male seals arrive to establish mating terri-
tories (Le Boeuf and Laws 1994). Sharks left after periods
of decreasing pinniped abundance that may have resulted in
decreased hunting success. In years where multiple shark
departures were recorded, we did not see a coordinated
departure of sharks following a single decline in abundance.
Female sharks departed the Farallones later than males,
consistent with a higher energy demand for females and
potentially a need to remain in the Farallones for additional
caloric benefit, given that the oligotrophic offshore focal
area may offer reduced foraging opportunities. Without
knowledge of arrival dates we do not know if females stay
near the Farallones longer, or are shifted later with respect
to males. Anderson and Pyle (2003) noted a biannual
hour2 4 6 8 10 12 14 16 18 20 22 24
56
112
168
224
280
336
392
448
504
560
hour2 4 6 8 10 12 14 16 18 20 22 24
56
112
168
224
280
336
392
448
504
560
hour
dept
h (m
)
2 4 6 8 10 12 14 16 18 20 22 24
10
20
30
40
50
60
70
80
90
100
hour2 4 6 8 10 12 14 16 18 20 22 24
56
112
168
224
280
336
392
448
504
560
(a) (b)
(c) (d)
37%
hour2 4 6 8 10 12 14 16 18 20 22 24
10
20
30
40
50
60
70
80
90
100(e)
0.1%
0.3%
1%
2%
5%
14%
Tim
e at
dep
th
(a) (b)
(c) (d)
(e)
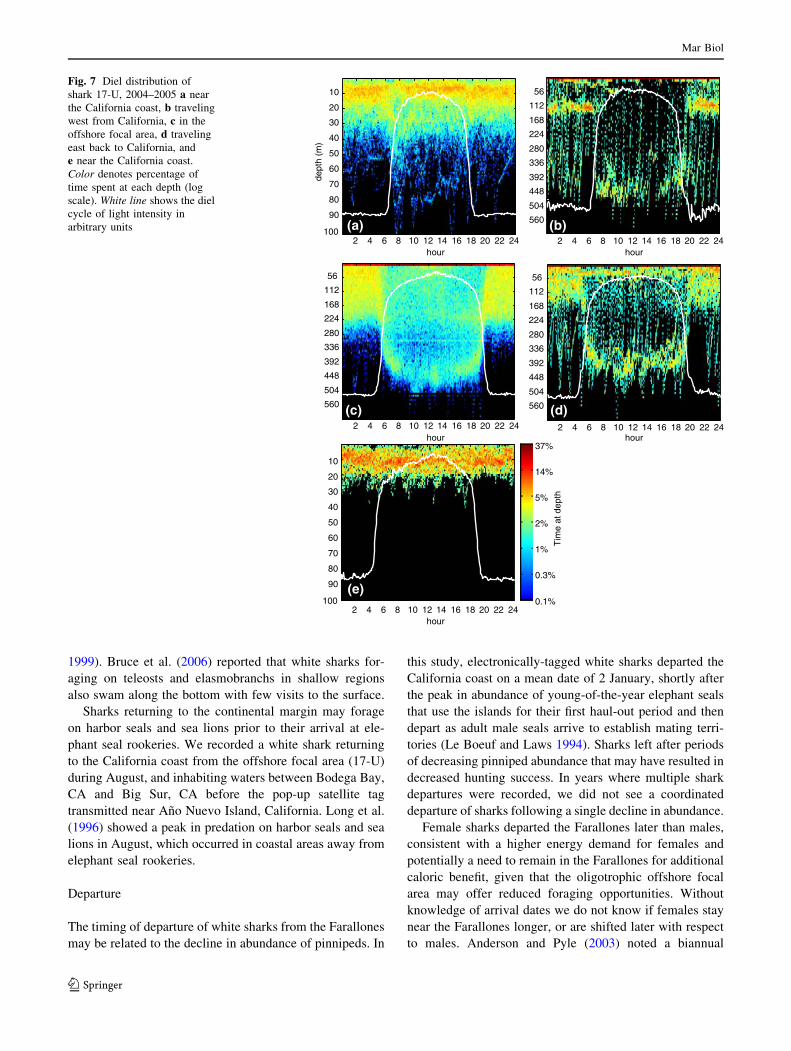
Fig. 7 Diel distribution of
shark 17-U, 2004–2005 a near
the California coast, b traveling
west from California, c in the
offshore focal area, d traveling
east back to California, and
e near the California coast.
Color denotes percentage of
time spent at each depth (log
scale). White line shows the diel
cycle of light intensity in
arbitrary units
Mar Biol
123
visitation of individually identified females to the Farall-
ones, suggesting a 2-year reproductive cycle, while Domeier
and Nasby-Lucas (2007) recorded smaller female sharks
visiting in consecutive years and larger visiting at multi-year
intervals.
Occasionally, the departure of white sharks from the
Farallones may be governed not by availability of forage or
the need to move to a breeding or parturition area, but by
predator avoidance. After an orca (Orcinus orca) killed a
large prey item believed to be a white shark on 19
hour2 4 6 8 10 12 14 16 18 20 22 24
56
112
168
224
280
336
392
448
504
560
hour2 4 6 8 10 12 14 16 18 20 22 24
hour2 4 6 8 10 12 14 16 18 20 22 24
56
112
168
224
280
336
392
448
504
560
dept
h (m
)
2 4 6 8 10 12 14 16 18 20 22 24
5
10
15
20
25
30
35
40
45
50
hour
0.1%
0.3%
1%
2%
5%
14%
37%
Tim
e at
dep
th
(a)
56
112
168
224
280
336
392
448
504
560
hour2 4 6 8 10 12 14 16 18 20 22 24
56
112
168
224
280
336
392
448
504
560 (b)
(c) (d)
(e)
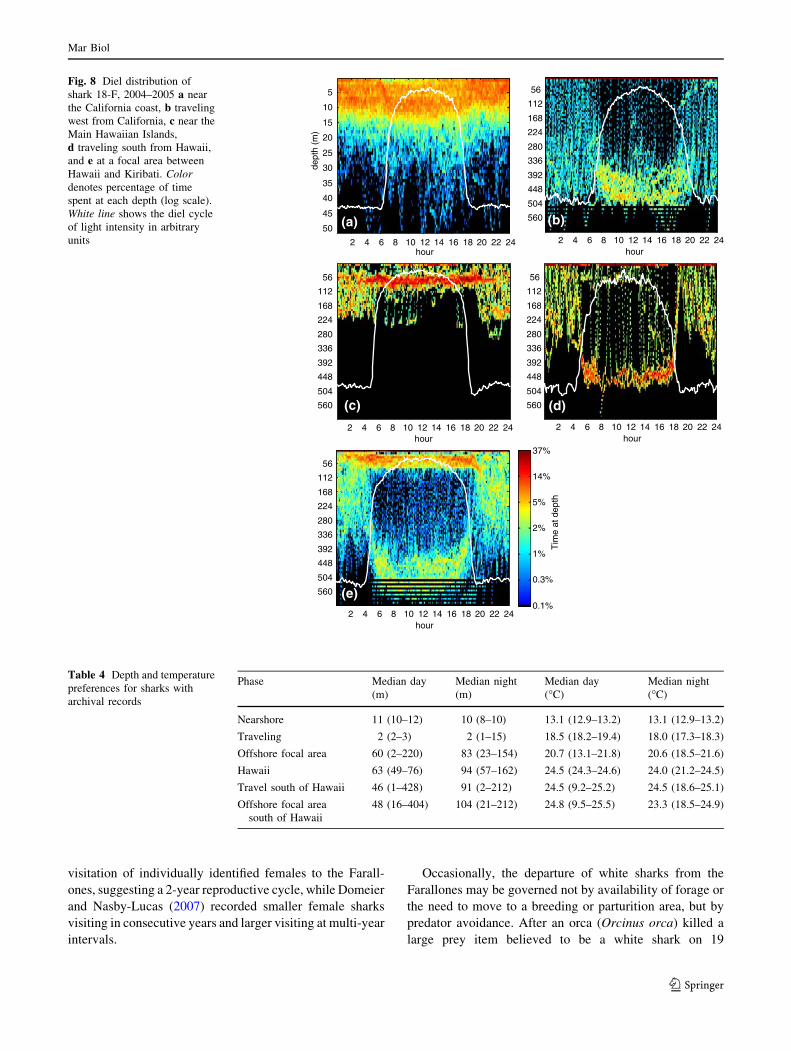
Fig. 8 Diel distribution of
shark 18-F, 2004–2005 a near
the California coast, b traveling
west from California, c near the
Main Hawaiian Islands,
d traveling south from Hawaii,
and e at a focal area between
Hawaii and Kiribati. Colordenotes percentage of time
spent at each depth (log scale).
White line shows the diel cycle
of light intensity in arbitrary
units
Table 4 Depth and temperature
preferences for sharks with
archival records
Phase Median day
(m)
Median night
(m)
Median day
(�C)
Median night
(�C)
Nearshore 11 (10–12) 10 (8–10) 13.1 (12.9–13.2) 13.1 (12.9–13.2)
Traveling 2 (2–3) 2 (1–15) 18.5 (18.2–19.4) 18.0 (17.3–18.3)
Offshore focal area 60 (2–220) 83 (23–154) 20.7 (13.1–21.8) 20.6 (18.5–21.6)
Hawaii 63 (49–76) 94 (57–162) 24.5 (24.3–24.6) 24.0 (21.2–24.5)
Travel south of Hawaii 46 (1–428) 91 (2–212) 24.5 (9.2–25.2) 24.5 (18.6–25.1)
Offshore focal area
south of Hawaii
48 (16–404) 104 (21–212) 24.8 (9.5–25.5) 23.3 (18.5–24.9)
Mar Biol
123
November 2000, no white sharks, attacks on pinnipeds, or
interactions with decoys were observed again until 10
December 2000 (Pyle and Anderson, unpublished). The
data for shark 3-M tagged on 16 October 2000 shows
depths shallower than 77 m until the day of the orca attack,
when a dive to 484 m occurred, indicating the shark had
left shelf waters close to the Farallones. Geolocation data
indicated that the shark (3-M) traveled to the west until it
reached the main Hawaiian Islands. These data are con-
sistent with the findings of (Pyle et al. 1999), who observed
an orca kill a white shark at the Farallones on 4 October
1997, and subsequently saw only two white sharks through
the duration of observations on 1 December 1997.
Traveling
Geolocation and speed data for 15 white sharks provide
evidence for a distinct migration corridor in the eastern
North Pacific that connects the coastal and pelagic aggre-
gation areas. Straightness and minimum velocity estimates
for the migratory phases of white sharks indicate directed
movements from coastal to offshore focal areas in the
eastern pacific and Hawaii, rather than sinuous or nomadic
movements. Straightness index for sharks that visited the
offshore focal area (17-U) and the main Hawaiian Islands
(18-F) were typical of directed migration while the sharks
were traveling between coastal and offshore focal areas,
compared to residency in focal areas. For comparison,
Atlantic bluefin tuna had SI of 0.84 ± 0.07 and 0.57 ± 0.13
during migration to, and breeding activity within, the Gulf
of Mexico, respectively (Teo et al. 2006). Wandering
albatrosses (Diomedea exulans) had SI of 0.65 ± 0.09 and
0.29 ± 0.08 while moving between and within foraging
regions, respectively (Weimerskirch et al. 2002). Bruce
et al. (2006) noted that white sharks in Australian waters
spend extended periods at a foraging area then switch to a
directed swimming behavior and use ‘common highways’
for travel to the next foraging area.
Estimates of minimum speed during the migratory phase
also indicate that movements were directed rather than
sinuous. To avoid bias caused by differences in shark size,
comparisons are made using relative speed in TL per
second. Our minimum speed estimates for the migration to
the offshore focal area and Hawaii are similar to speed
estimates from published acoustic and satellite tracking
studies. While following acoustically-tagged adult white
sharks, Carey et al. (1982) measured a speed of 0.19 TL s–1
(77 km/day), while Strong et al. (1992) obtained speeds of
0.21–0.25 TL s–1 (78 ± 41 km/day). Klimley et al. (2001)
used a radio-acoustic positioning array to measure swim-
ming speeds of 0.22 TL s–1 (104 km/day). Using a PAT
tag, Bonfil et al. (2005) measured a transoceanic migration
with a minimum speed of 0.34 TL s–1 (113 km/day), a
higher relative speed, but a lower absolute speed, than the
fastest migration in our study of 0.30 TL s–1 (119 km/day;
shark 14-M). Bruce et al. (2006) used fin-mounted satellite
transmitters on four white sharks with a mean traveling
speed of 0.31 TL s–1 (74 km/day). If the sharks in our
study had taken sinuous migration routes, their actual
speeds would have been considerably higher than our
estimates, and considerably higher than the published
values for white shark swimming speeds.
During offshore migrations, sharks passed from Cali-
fornia Current waters into transition zone waters, and
through the subtropical front (Roden 1991) and the tran-
sition zone chlorophyll front (Polovina et al. 2001). Syn-
optic ocean color measurements in this area show very low
surface chlorophyll concentration, but the region maintains
moderate productivity due to the sub duction of nutrient
rich waters from the north (Seki et al. 2002). Once white
sharks moved south of the south subtropical front they
entered the subtropical gyre, where they remained for the
duration of their offshore periods. In this region the mixed
layer deepens and as a result, there is a very low rate of
vertical advection of nutrients into the euphotic zone (Seki
et al. 2002). The subsurface chlorophyll peak weakens and
deepens considerably and primary production is extremely
low (Polovina et al. 2001). The lack of minor focal areas
during the migration phase suggests that white sharks did
not feed extensively en route.
During all traveling phases undertaken by the two sharks
with archival records, the sharks returned to and remained
directly at the surface after each vertical movement, in
contrast with their behaviors at neritic and pelagic focal
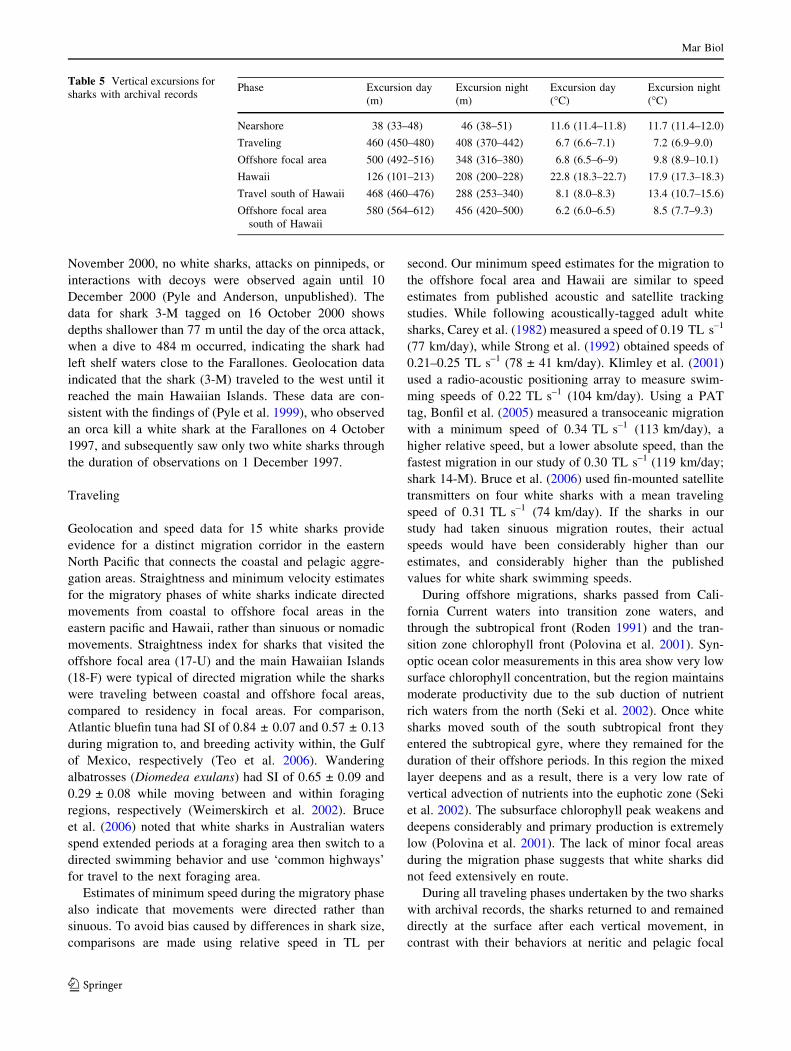
Table 5 Vertical excursions for
sharks with archival recordsPhase Excursion day
(m)
Excursion night
(m)
Excursion day
(�C)
Excursion night
(�C)
Nearshore 38 (33–48) 46 (38–51) 11.6 (11.4–11.8) 11.7 (11.4–12.0)
Traveling 460 (450–480) 408 (370–442) 6.7 (6.6–7.1) 7.2 (6.9–9.0)
Offshore focal area 500 (492–516) 348 (316–380) 6.8 (6.5–6–9) 9.8 (8.9–10.1)
Hawaii 126 (101–213) 208 (200–228) 22.8 (18.3–22.7) 17.9 (17.3–18.3)
Travel south of Hawaii 468 (460–476) 288 (253–340) 8.1 (8.0–8.3) 13.4 (10.7–15.6)
Offshore focal area
south of Hawaii
580 (564–612) 456 (420–500) 6.2 (6.0–6.5) 8.5 (7.7–9.3)
Mar Biol
123
areas. The frequent and long periods of time spent at the
surface could allow a shark to use celestial cues for navi-
gation (Able and Able 1990) and a similar behavior for a
migrating white shark was observed by Bonfil et al. (2005).
While returns to shallow, warm water following dives may
serve a thermoregulatory purpose (Brill and Bushnell
2001), such warming phases require only a return to the
mixed layer, not a return to the surface. No clear indication
of the use of geological features for navigation was evident.
Offshore focal area
The purpose of the migration to the offshore focal area is
unknown, and may be foraging, mating or parturition. Direct
evidence for any of these hypotheses is lacking, such as
observations of mating or parturition, and data on stomach
contents, or stomach temperature records. However, the
behavioral data in our study contrast this region strongly
from all other regions, and suggest either a foraging strategy
targeting a different prey or a non-foraging purpose.
The offshore migrations of white sharks took them from
the productive waters of the California current system into
the oligotrophic subtropical gyre, where food resources
appear to be sparse and pinnipeds are absent. The offshore
focal area is south of the pelagic regions used by elephant
seals, which feed in productive transition zone waters
to the north (Le Boeuf and Laws 1994). The area is west
of the migration routes of humpback whales between
Hawaiian breeding/calving grounds and sub-Arctic Pacific
feeding grounds (Mate et al. 1998). The area is south of a
trans-Pacific bluefin tuna migration corridor (Perle et al.
unpublished data).
Large pelagic fishes occur in this area, but at much lower
concentrations than in other parts of the eastern North
Pacific (Okamoto and Bayliff 2003). The dominant large
pelagic fishes in the area are albacore (Thunnus alalunga),
yellowfin (Thunnus albacares) and bigeye (Thunnus obe-
sus) tuna and swordfish (Xiphius gladius), with lower levels
of other billfishes and sharks (Okamoto and Bayliff 2003).
The abundances of tunas and swordfish peak in the winter
and spring when the white sharks are there, whereas the
abundance of billfish (Istiophorus, Makaira, Tetrapturus
spp.) peaks in summer and fall (Okamoto and Bayliff 2003).
Sharks include blue (Prionace glauca), silky (Carcharhinus
falciformis), oceanic whitetip (Carcharhinus longimanus),
shortfin mako, longfin mako, salmon shark, bigeye thresher
(Alopias superciliosus) and pelagic thresher (Alopias
pelagicus), with abundance peaking in the winter and spring
(Okamoto and Bayliff 2003). Recent long-line data suggests
that bigeye tuna fishermen have increased effort in these
regions (IATTC, 2006).
The area is southwest of the subtropical summer blooms
noted by Wilson (2003), and a developing food chain in
such a productivity center would not be advected into the
area, given the westerly currents in the region (Roden
1991). The region of temporally stable negative wind stress
curl where floating debris accumulates, and which may
concentrate whale carcasses, lies directly to the north of the
offshore focal area but does not overlap with it.
The oscillatory pattern of shark 17-U is consistent with a
searching pattern in which olfactory cues that disperse
along horizontal shear layers would be encountered with the
highest probability (Klimley et al. 2002). However, the
deep nocturnal diving differs from behaviors observed for
other upper trophic-level pelagic fishes. Whereas shark 17-
U made oscillatory movements at night, many large pelagic
fishes cease diving at night, remaining in shallow waters.
Such a pattern has been documented in tunas (Holland et al.
1992); billfishes (Carey and Robison 1981); and a variety of
other shark species (Weng and Block 2004). The shallow
nighttime distributions of most of these fishes are thought to
be the result of the shallow distribution of prey species
associated with the deep scattering layer, which approach
the surface at night (Josse et al. 1998). The pattern of white
shark 17-U suggests either a different foraging strategy
necessitated by a prey that does not ascend to the surface at
night, or a function other than foraging for the oscillatory
movements. If additional archival records of white shark
behavior in the offshore focal area are obtained, they will
help to determine if the single individual reported here is a
representative of this population of white sharks.
The offshore focal area may be used for parturition,
mating or both. The rapid oscillatory dives of shark 17-U
could be a courtship activity. Bluefin tuna show distinct
oscillatory diving while on their breeding grounds in the
Gulf of Mexico (Teo et al. 2006). The fact that both males
and females are in the focal area is not consistent with it
being solely a parturition area. In some shark species fe-
males mate shortly after giving birth, such that the same
region is used for both functions (Carrier et al. 2004). The
possibility of mating or parturition during annual visits to
the offshore focal area would be consistent with a 1-year
reproductive cycle; however, female sharks appear to visit
the Farallones biannually, providing evidence for a 2-year
cycle (Anderson and Pyle 2003). Based on the seasonality
of parturition, Francis (1996) hypothesized that the gesta-
tion period was more than 1 year; Mollet et al. (2000)
hypothesized an 18-month gestation cycle. The visitation of
the offshore focal area by sub-adult sharks is not consistent
with a purely reproductive function for the migration.
Hawaii and vicinity
The visitation of white sharks to the waters surrounding the
islands of Kauai, Maui, Lanai, Kahoolawe and Hawaii
indicates these areas may be used for foraging. While in
Mar Biol
123
this region, shark 18-F showed significantly deeper diving
during nighttime than daytime, in contrast to diel patterns
observed during other phases. The diel pattern of vertical
movements near Hawaii contrasts with most patterns ob-
served for a wide variety of pelagic sharks and fishes, in
which sharks make deeper movements during day than
night (Weng and Block 2004).
The pattern of shark 18-F is consistent with foraging in
nearshore waters during day, and moving away from land
at night. The pattern of aggregating during the day and
dispersing at night has been observed in tunas at fish
aggregating devices (Holland et al. 1990) and seamounts
(Klimley et al. 2003). However, due to the inherent limi-
tations in light- and SST-based geolocation, we do not
know the precise locations of the shark during daytime and
nighttime.Shark 18-F rarely visited the surface, which is
consistent with a silhouette-based hunting strategy, but the
median positions during day (63 m) and night (94 m) are
likely too deep to see silhouettes of animals at the surface.
White sharks have been observed near aggregation sites for
spinner dolphins (Stenella longirostris) on the west side of
Oahu, as well as near Hawaiian monk seal (Monachus
schauinslandi) colonies on Niihau, and their presence in
Hawaii corresponds to the timing of birth for humpback
whales (Megaptera novaeangliae), allowing for the possi-
bility of feeding on placentas (John Naughton, personal
communication). Sharks may also forage on fishes, sharks
and squids while near the Islands. Teleost and elasmo-
branch fishes are important food sources for white sharks
in Australian waters (Malcolm et al. 2001), and may also
be important in waters around Guadalupe Island, Mexico
(Domeier and Nasby-Lucas 2007). Bruce et al. (2006)
reported a similar pattern of shallow daytime and deep
nighttime swimming while a white shark was near the
Neptune Islands, where pinniped colonies occur.
While in the focal area south of Hawaii, shark 18-F
showed far less diving than shark 17-U in the offshore
focal area between Hawaii and Baja. In addition, the shape
of dives differed between the two regions. South of Hawaii
shark 18-F showed dive profiles with long basal periods,
consistent with a dive to a target depth followed by a period
of searching for prey (Josse et al. 1998), whereas shark 17-
U initiated ascent immediately upon reaching the maxi-
mum depth of a dive.
Population structure
Genetic studies comparing the southwest Pacific and
southwest Indian Oceans have shown separate populations
of white sharks based on mitochondrial markers, but a lack
of differentiation based on nuclear markers, leading to the
hypothesis of greater trans-oceanic movement by males
than females (Pardini et al. 2001). Satellite telemetry
showed a trans-oceanic movement between these white
shark populations by a female (Bonfil et al. 2005), raising
the possibility that long-distance transfer of male gametes
could occur through the movements of adult females. The
population structure of white sharks in the Pacific Ocean is
unknown, and no genetic studies have been published for
this ocean basin. The present study and others based in
Mexico (Domeier and Nasby-Lucas 2006) and the South-
ern California Bight (Weng et al. 2007) have recorded
movements via satellite telemetry. Adult and sub-adult
white sharks tracked from both Central California and
Guadalupe Island, Mexico have visited the offshore focal
area highlighted in this study, raising the possibility of
connections between these two groups. Juvenile white
sharks tracked from Los Angeles, CA have moved along
the coast northward to Point Reyes, CA, and southward to
Sebastian-Vizcaino Bay, BC, Mexico. The movements of
western Pacific white sharks are unknown, so it remains
possible that they make long-range movements into habi-
tats shared by eastern Pacific white sharks. Further research
into both the genetics and movements of white sharks is
required to elucidate the evolutionary and ecological rela-
tionships of white sharks globally and within the Pacific
basin, and to determine the role of the unusual movements
to the offshore focal area highlighted in this study.
Acknowledgments This research was supported by grants from the
Monterey Bay Aquarium Foundation, and by funding for the Tagging
of Pacific Pelagics Program from the Gordon and Betty Moore
Foundation, the Sloan Foundation, and the Office of Naval Research.
We thank C. Farwell, J. O’Sullivan, J. Ganong, A. Swithenbank,
R. Matteson, M. Castleton, S. Teo, R. Schallert, C. Perle, S. Jor-
gensen, G. Shillinger, G. Strout, D. Kohrs, B. Syderman, R. Ridge,
C. Wisner, T. O’Leary, R. Burnett, P. Capitolo, W. Richardson,
D. Spight, C. Garcia, G. Saxton and T. Keswick. The study was
conducted under permits from the California Department of Fish and
Game and the US Fish and Wildlife Service; and performed in
accordance with the Institutional Animal Care and Use Committee of
Stanford University (protocol 6957-6).
References
Able KP, Able MA (1990) Calibration of the magnetic compass of a
migratory bird by celestial rotation. Nature 347:378–380
Aebischer NJ, Robertson PA, Kenward RE (1993) Compositional
analysis of habitat use from animal radio-tracking data. Ecology
74:1313–1325
Ainley DG, Henderson RP, Huber HR, Boekelheide RJ, Allen SG,
McElroy TL (1985) Dynamics of white shark/pinniped interac-
tions in the Gulf of the Farallones. Mem South Calif Acad Sci
9:109–122
Anderson SD, Goldman KJ (1996) Photographic evidence of white
shark movements in California waters. Calif Fish Game 82:182–
186
Anderson S, Pyle P (2003) A temporal, sex-specific occurrence
pattern among white sharks at the South Farallon Islands,
California. Calif Fish Game 89:96–101
Mar Biol
123
Bankey V, Cuevas A, Daniels D, Finn CA, Hernandez I, Hill P, Kucks
R, Miles W, Pilkington M, Roberts C, Roest W, Rystrom V,
Shearer S, Snyder S, Sweeney R, Velez J (2002) Magnetic
Anomaly Map of North America. U.S. Geological Survey
Batschelet E (1981) Circular statistics in biology. Academic, London
Bernal D, Donley JM, Shadwick RE, Syme DA (2005) Mammal-like
muscles power swimming in a cold-water shark. Nature
437:1349–1352
Block BA, Teo SLH, Walli A, Boustany A, Stokesbury MJW, Farwell
CJ, Weng KC, Dewar H, Williams TD (2005) Electronic tagging
and population structure of Atlantic bluefin tuna. Nature
434:1121–1127
Bonfil R, Meyer M, Scholl MC, Johnson R, O’Brien S, Oosthuizen H,
Swanson S, Kotze D, Paterson M (2005) Transoceanic migra-
tion, spatial dynamics, and population linkages of white sharks.
Science 310:100–103
Boustany AM, Davis SF, Pyle P, Anderson SD, Le Boeuf BJ, Block
BA (2002) Satellite tagging: Expanded niche for white sharks.
Nature 415:35–36
Brainerd K, Gregg M (1995) Surface mixed and mixing layer depths.
Deep Sea Res I 42:1521–1543
Brill RW, Bushnell PG (2001) The cardiovascular system of tunas.
In: Block BA, Stevens ED (eds) Tunas: physiology, ecology and
evolution. Academic, San Diego, pp 79–120
Brodie P, Beck B (1983) Predation by sharks of the gray seal
(Halichoerus grypus) in eastern Canada. Can J Fish Aquat Sci
40:267–271
Bruce BD (1992) Preliminary observations on the biology of the
white shark Carcharodon carcharias in south Australian waters.
Aust J Mar Freshw Res 43:1–11
Bruce BD, Stevens JD, Malcolm H (2006) Movements and swimming
behaviour of white sharks (Carcharodon carcharias) in Austra-
lian waters. Mar Biol DOI 10.1007/s00227-006-0325-1:1–12
Carey F, Robison B (1981) Daily patterns in the activities of
swordfish, Xiphias gladius, observed by acoustic telemetry. Fish
Bull 79:277–292
Carey FG, Kanwisher JW, Brazier O, Gabrielson G, Casey JG, Pratt
HLJ (1982) Temperature and activities of a white shark,
Carcharodon carcharias. Copeia 1982:254–260
Carrier JC, Harold L, Pratt J, Castro JI (2004) Reproductive biology
of elasmobranchs. In: Carrier JC, Musick JA, Heithaus MR (eds)
Biology of sharks and their relatives. CRC: Boca Raton, pp 269–
286
Compagno LJV (1984) Vol. 4 Sharks of the World, Part 1
Hexanchiformes to Lamniformes. United Nations Development
Programme, Rome
DeLong R, Stewart B, Hill R (1992) Documenting migrations of
northern elephant seals using day length. Mar Mamm Sci 8:155–
159
Domeier M, Nasby-Lucas N (2007) Annual re-sightings of photo-
graphically identified white sharks (Carcharodon carcharias) at
an eastern Pacific aggregation site (Guadalupe Island, Mexico).
Mar Biol DOI 10.1007/s00227-006-0380-7
Ferreira CA, Ferreira TP (1996) Population dynamics of white sharks
in South Africa. In: Klimley AP, Ainley DG (eds) Great white
sharks: the biology of Carcharodon carcharias. Academic, San
Diego pp 381–391
Francis MP (1996) Observations on a pregnant white shark with a
review of reproductive biology. In: Klimley AP, Ainley DG
(eds) Great white sharks: the biology of Carcharodon carcha-rias. Academic, San Diego, pp 157–172
Goldman KJ (1997) Regulation of body temperature in the white shark,
Carcharodon carcharias. J Comp Physiol [B] 167:423–429
Goldman K, Anderson S (1999) Space utilization and swimming
depth of white sharks, Carcharodon carcharias, at the South
Farallon Islands, central California. Envi Biol Fish 56:351–364
Graham JB, Dewar H, Lai NC, Lowell WR, Arce SM (1990) Aspects
of shark swimming performance determined using a large water
tunnel. J Exp Biol 151:175–192
Hill RD, Braun MJ (2001) Geolocation by light-level. In: Sibert J,
Nielson J (eds) Electronic tagging and tracking in marine
fisheries research: methods and technologies. Kluwer Academic,
Dordrecht
Holland K, Brill R, Chang R (1990) Horizontal and vertical
movements of yellowfin and bigeye tuna associated with fish
aggregating devices. Fish Bull 88:493–507
Holland K, Brill R, Chang R, Sibert J, Fournier D (1992) Physio-
logical and behavioural thermoregulation in bigeye tuna (Thun-nus obesus). Nature 358:410–412
Hooge PN, Eichenlaub B (1997) Animal movement extension to
ArcView. Alaska Science Center––Biological Science Office.
U.S. Geological Survey, Anchorage, AK, USA
Hunter MD, Price PW (1992) Playing chutes and ladders: hetero-
geneity and the relative roles of bottom–up and top–down forces
in natural communities. Ecology 73:724–732
Josse E, Bach P, Dagorn L (1998) Simultaneous observations of tuna
movements and their prey by sonic tracking and acoustic
surveys. Hydrobiologia 371–372:61–69
Klimley AP (1985) The areal distribution and autecology of the white
shark, Carcharodon carcharias, off the West Coast of North
America. Mem South Calif Acad Sci 9:15–40
Klimley AP, Le Boeuf BJ, Cantara KM, Richert JE, Davis SF, Van
Sommeran S (2001) Radio-acoustic positioning as a tool for
studying site-specific behavior of the white shark and other large
marine species. Mar Biol 138:429–446
Klimley A, Beavers S, Curtis T, Jorgensen S (2002) Movements and
swimming behavior of three species of sharks in La Jolla
Canyon, California. Environ Biol Fishes 63:117–135
Klimley AP, Jorgensen SJ, Muhlia-Melo A, Beavers SC (2003) The
occurrence of yellowfin tuna (Thunnus albacares) at Espiritu
Santo Seamount in the Gulf of California. Fish Bull 101:684–
692
Kohler NE, Turner PA (2001) Shark tagging: a review of conven-
tional methods and studies. Environ Biol Fish 60:191–223
Le Boeuf BJ, Laws R (1994) Elephant seals: an introduction to the
genus. In: Le Boeuf BJ, Laws R (eds) Elephant seals: population
ecology, behavior, and physiology. University of California,
Berkeley, pp 1–28
Malcolm H, Bruce BD, Stevens JD (2001) A review of the biology
and status of white sharks in Australian waters. CSIRO Marine
Research, Hobart
Martin R, Hammerschlag N, Collier R, Fallows C (2005) Predatory
behaviour of white sharks (Carcharodon carcharias) at Seal
Island, South Africa. J Mar Biol Ass UK 85:1121–1135
Mate BR, Gisiner R, Mobley J (1998) Local and migratory
movements of Hawaiian humpback whales tracked by satellite
telemetry. Can J Zool 76:863–868
Mollet HF, Cliff G, Pratt HL Jr, Stevens JD (2000) Reproductive
biology of the female shortfin mako, Isurus oxyrinchus Rafin-
esque, 1810, with comments on the embryonic development of
lamnoids. Fish Bull 98:299–318
Okamoto H, Bayliff WH (2003) A review of the Japanese longline
fishery for tunas and billfishes in the eastern Pacific Ocean,
1993–1997. Inter-Am Trop Tuna Comm Bull 22:221–431
Pardini AT, Jones CS, Noble LR, Kreiser B, Malcolm H, Bruce BD,
Stevens JD, Cliff G, Scholl MC, Francis M, Duffy CAJ, Martin
AP (2001) Sex-biased dispersal of great white sharks. Nature:
139–140
Peddie N (1993) The magnetic field of the earth, 1990: inclination
chart. US Geological Survey
Polovina JJ, Howell E, Kobayashi DR, Seki MP (2001) The transition
zone chlorophyll front, a dynamic global feature defining
Mar Biol
123
migration and forage habitat for marine resources. Prog Ocea-
nogr 49:469–483
Pratt HL Jr (1996) Reproduction in the male white shark. In: Klimley
AP, Ainley DG (eds) Great white sharks: the biology of
Carcharodon carcharias. Academic, San Diego, pp 131–138
Pyle P, Anderson SD, Klimley AP, Henderson RP (1996) Environ-
mental factors affecting the occurrence and behavior of white
sharks at the Farallon Islands, California. In: Klimley AP, Ainley
DG (eds) Great white sharks: The biology of Carcharodoncarcharias. Academic, San Diego pp 281–291
Pyle P, Schramm MJ, Keiper C, Anderson SD (1999) Predation on a
white shark (Carcharodon carcharias) by a killer whale
(Orcinus orca) and a possible case of competitive displacement.
Mar Mamm Sci: 563–568
Roden G (1991) Subarctic-subtropical transition zone of the North
Pacific: large scale aspects and mesoscale structure. In: Weth-
erall J (ed) Biology, Oceanography, and Fisheries of the North
Pacific Transition Zone and Subarctic Frontal Zone. NOAA
Technical Report NMFS 105, pp 1–38
Sandwell D, Smith W (1997) Marine gravity anomaly from Geosat
and ERS-1 satellite altimetry. J Geophys Res B 102:10039–
10054
Seki MP, Polovina JJ, Kobayashi DR, Bidigare RR, Mitchum GT
(2002) An oceanographic characterization of swordfish (Xiphiasgladius) longline fishing grounds in the springtime subtropical
North Pacific. Fish Oceanog 11:251–266
Silverman B (1986) Density estimation for statistics and data analysis.
Chapman & Hall, London, New York
Smith W, Sandwell D (1997) Global Sea Floor Topography from
Satellite Altimetry and Ship Depth Soundings. Science
277:1956–1962
Stevens J, Bonfil R, Dulvy N, Walker P (2000) The effects of fishing
on sharks, rays, and chimaeras (chondrichthyans), and the
implications for marine ecosystems. ICES J Mar Sci 57:476–494
Strong WRJ, Murphy RC, Bruce BD, Nelson DR (1992) Movements
and associated observations of bait-attracted white sharks
Carcharodon carcharias: a preliminary report. Aust J Mar
Freshw Res 43:13–20
Teo SLH, Boustany A, Blackwell S, Walli A, Weng KC, Block BA
(2004) Validation of geolocation estimates based on light level
and sea surface temperature from electronic tags. Mar Ecol Prog
Ser 283:81–98
Teo SLH, Boustany A, Dewar H, Stokesbury MJW, Weng KC,
Beemer S, Seitz AC, Farwell CJ, Prince ED, Block BA (2006)
Annual migrations, diving behavior, and thermal biology of
Atlantic bluefin tuna, Thunnus thynnus, on their Gulf of Mexico
breeding grounds. Mar Biol DOI 10.1007/s00227-006–0447-5
Tremblay Y, Shaffer SA, Fowler SL, Kuhn CE, McDonald BI, Weise
MJ, Bost CA, Weimerskirch H, Crocker DE, Goebel ME, Costa
DR (2006) Interpolation of animal tracking data in a fluid
environment. J Exp Biol 209:128–140
Weimerskirch H, Bonadonna F, Bailleul F, Mabille G, Dell’Omo G,
Lipp HP (2002) GPS tracking of foraging albatrosses. Science
295:1259
Weng K, Block B (2004) Diel vertical migration of the bigeye
thresher shark (Alopias superciliosus), a species possessing
orbital retia mirabilia. Fish Bull 102:221–229
Weng KC, Castilho PC, Morrissette JM, Landiera-Fernandez A, Holts
DB, Schallert RJ, Goldman KJ, Block BA (2005) Satellite
Tagging and Cardiac Physiology Reveal Niche Expansion in
Salmon Sharks. Science 310:104–106
Weng KC, O’Sullivan JB, Lowe CG, Winkler CE, Dewar H, Block
BA (2007) Movements, behavior and habitat preferences of
juvenile white sharks in the eastern Pacific as revealed by
electronic tags. Mar Ecol Prog Ser
Wilson C (2003) Late Summer chlorophyll blooms in the oligotrophic
North Pacific Subtropical Gyre. Geophys Res Lett 30: 1942,
doi:1910.1029/2003GL017770
Mar Biol
123
Recommended