Intracellular calcium carbonate crystals as a possible protection against
acidification in Achromatium spp.
Tom Berben, University of Amsterdam
Final report in the Microbial Diversity 2014 summer course, Marine Biological Laboratory at Woods Hole,
MA.
Abstract Achromatium spp., sulfur-oxidizing bacteria within the Gammaproteobacteria, are remarkable for their
ability to accumulate huge crystals of calcite intracellularly, though the function of these crystals is
currently unknown. We aim to show that calcite can function as an intracellular buffer for acid produced
in sulfur oxidation in a marine population of Achromatium. The sediment in which the bacteria are
found was characterized in terms of oxygen and sulfide gradients using microelectrodes and the
dynamics in cell morphology as a function of sediment depth were investigated using SEM-EDS.
Preliminary data suggest that there is indeed a trend of increasing calcite accumulation with increasing
oxygen availability and increasing sulfur accumulation where sulfide is more abundant. Further research
is however necessary to conclusively link calcite to a buffering function within the cell.
Introduction Achromatium is a genus of giant sulfur-oxidizing bacteria within the class of Gammaproteobacteria. It
currently contains only a single species, A. oxaliferum, which was isolated from a freshwater body in
1892 (Schewiakoff, 1892). They have since been observed in several freshwater sources (Bersa, 1926; de
Boer et al, 1971; Devide, 1952; Glöckner et al., 1999; Gray et al., 1999b; Head et al., 1996; Kolkwitz,
1918; Nadson, 1913; West and Griffiths, 1909) as well as in the marine environment of Sippewissett salt
marsh on Cape Cod, MA (Lackey and Lackey, 1961). Their most distinctive feature is the intracellular
accumulation of calcium carbonate (calcite), which precipitates as crystals that take up the bulk of the
cell volume. Known as the largest single-celled bacteria, they are generally cylindrical or spherical, with a
typical size of 20 to 30 µm across. Despite the long history of the genus and the interest sparked by
their unusual morphology, no Achromatium species has been successfully cultured.
Likely due to their unculturability, very little is known about Achromatium physiology. It has been shown
by microradiography that they use sulfide as an electron donor and accumulate elemental sulfur as an
intermediate in the complete oxidation to sulfate (Gray et al., 1999a). Further physiological studies, such
as into a possible autotrophic lifestyle, have been complicated by the fact that Achromatium form
genetically and physiologically diverse communities that are not easily distinguishable. For example, it
was shown that populations from different geographical areas showed different carbon utilization
capabilities, with only one of the populations being capable of autotrophic growth. Furthermore, they
showed that even within a single population some cells were capable of acetate and protein hydrolysate
assimilation whereas others were not (Gray et al., 1999a/b). Similarly, there is some discussion on
whether Achromatium are aerobic or anaerobic and whether they are obligately or facultatively so. They
generally inhabit the micro-oxic zone of the sediment and are generally considered to be either aerobic
or microaerophilic, experiments with both oxic and anoxic microcosms performed by Gray et al. (2004)
have suggested that they are actually (facultative) anaerobes. Again, the population of Achromatium
may be subject to sympatry, making it difficult to make generalized statements about their physiology.
Even less is known about what is arguably the most interesting aspect of Achromatium morphology: the
calcite crystals. The exact method by which cells facilitate their formation is an enigma and their
function has been extensively spectulated about, but little substantiating evidence has so far been
presented. Hypotheses include the use of calcite as a buffer protecting the cell against the acidification
that occurs when sulfur is oxidized to sulfate, calcite being stockpile of inorganic carbon for autotrophic
growth and a possible function in the modulation of cell buoyancy. The plausibility of these hypotheses
has been reviewed by Head et al. (2000). This area of research is further complicated by the fact that
calcite accumulation by Achromatium is a unique phenotype. The only other known comparable
organism is a cyanobacterium belonging to the order of Gloeobacterales that has calcium-magnesium-
strontium-barium carbonate inclusions, similarly lacking an understanding of both the mechanism of
and reason for carbonate precipitation (Couradeau et al., 2012).
In this study, we aim at a better understanding of the dynamics of calcium and sulfur metabolism in the
marine Achromatium found in Sippewissett marsh. Sippewissett is an extremely dynamic habitat,
subject not only to the diurnal cycle that dictates photosynthetic activity, but also to tidal flooding. It is a
location well-known and well-studied for the presence of microbial mats consisting of diatoms,
cyanobacteria and the purple and green (non-)sulfur bacteria and for being the only known location
where pink and green ‘berries’ (macroscopic aggregates of purple sulfur bacteria and cyanobacteria,
respectively) are found. The central question of this project is: do Achromatium allow for complete
oxidation of sulfur to sulfate by accumulating calcite to use as a buffer against the protons produced in
this process?
Materials and methods
Core collection, storage and processing Sediment cores were taken in the Little Sippewissett Marsh (Falmouth, MA; United States). A pond with
active sulfur metabolism was chosen by the high abundance of pink berries (aggregates of purple sulfur
bacteria). The approximate co-ordinates of the pond are 41°34'33.1"N; 70°38'21.5"W. The cores were
taken from the ocean-facing side of the pond with core liners of approximately 6.5 cm diameter. The
core liners were plugged from the bottom with black rubber stoppers, with the top exposed to air and
excess water was removed by careful decanting. Daytime cores, taken in the early afternoon, were
exposed to light produced by two halogen lamps to stimulate photosynthetic activity and processed
immediately. The total light intensity was 240 µE cm-2. Nighttime cores, taken around midnight, were
wrapped in aluminum foil, left overnight at room temperature and processed in the morning.
Intact cores were used for microelectrode profiling (see below) after which the top layer was sectioned
in 1 cm slices, collected in Falcon tubes. Using a syringe with the end cut off, 2x 1 mL was taken from the
sections for cell counting and SEM sample preparation (see below). The sections were centrifuged for 30
minutes at 1500 RCF, after which the total volume was noted. 1 mL of overhead pore water was
removed for ion chromatography (see below), the rest was discarded. The sections were then weighed,
dried at 120˚C and weighed again. The pore water volume was calculated from this and the density of
pond water.
Cells for cell counting were collected by filtering a sediment sample through a mesh (average pore size
20-30 µm) in filter-sterilized pond water in a petri dish. Cells were then brought to the center of the
plate by swirling and removed using an elongated Pasteur pipette, washed in filtered pond water,
collected again and counted by eye.
Microelectrode profiling Microelectrodes (Unisense, Denmark) were used to measure the levels of oxygen (type OX-13191, 100
µm tip size) and sulfide (type H2S 3169, 100 µm tip size) in the intact cores, as well as the pH (PH 4485,
100µm tip size; a PH 4309 with tip size 200 µm was used from core 10 onwards due to equipment
failure). The sensor output was registered by a Unisense Multimeter (#5016) and sensor movement
along the z-axis was controlled using a Unisense motor controller (#3723). SensorTrace PRO 3.2.8 was
used for experimental setup and control. In all following experiments the air-water interface is defined
as 0 µm depth.
The oxygen electrode was calibrated according to the manufacturer’s instructions using air-sparged sea
water base (35‰ salinity) and an alkaline solution of ascorbate (0.1 M), the temperature was adjusted
to be approximately equal to the temperature of the cores. The sulfide sensor was calibrated to the
manufacturer’s instructions in acidified sea water base (pH 1.95) with sulfide concentrations at 0, 0.1,
0.3, 0.5, 1 and 2 mM respectively. The pH sensor was calibrated using provided standard buffer solutions
at pH 4, 7 and 10.
Oxygen profiles were captured from -300 to 15000 µm depth, or until no further change occurred. The
step size was set at 100 µm, with a 1.0 s wait before measurement and a measurement time of 3.0 s.
The sulfide and pH profiles were captured from a depth of 0 to 40000 µm, with a 100 µm step size (200
µm after failure of the 4485 sensor). Step size was adjusted to 500 µm if no further change in trend was
observed.
Medium throughput sorting of Achromatium In addition to the Pasteur pipette hand-picking ofAchromatium, two methods for medium throughput
sorting of cells were tested: isopycnic centrifugation and flow cytometry. For the centrifugation Percoll
was used as the medium. The density and osmolarity were adjusted using sodium chloride and sucrose
to densities of 1.18, 1.23 and 1.30 g mL-1 respectively, at 0.75 Osmol L-1. A small amount of resazurin dye
was added to the 1.23 g mL-1 medium for visualization of the gradient. A two-step discontinuous
gradient was established by carefully pipetting 500 µL of each layer in a 2 mL tube followed by 250 µL of
sample. This was centrifuged for 1 hour at 15000 rpm in a tabletop Eppendorf centrifuge. The layers
were then separated by pipetting and examined under a microscope.
For flow cytometry, cells picked out for counting were fixed in 2% gluteraldehyde for 1 hour after which
the solution was diluted to 0.5% for storage at 4˚C until measurement. A BD Accuri C6 equipped with
filters for emission detection at 533, 585, 670 and 675nm was run at maximum flow rate (100 µL min-1).
SEM-EDS Scanning Electron Microscopy (SEM) was performed using a Hitachi TM3030 microscope equipped with
a Brüker scan generator (#0678) coupled to an XFlash MIN SVE detector for Energy-Dispersive X-ray
Spectroscopy (EDS). The SEM was controlled by TM3030 software version 01-02-01; the EDS was
controlled by Brüker Quantax 70 software.
Samples were prepared by collecting cells as for counting, washing the cells once in demineralized
water, then placing them on a black carbon sticker. After allowing the cells to settle (this can be
monitored under a dissecting scope), the bulk of the water was withdrawn using a Pasteur pipette and
the stickers were left to dry in a 37˚C stove. After drying, the sticker was transferred to a metal stub and
a 100 µL drop of DI water was placed on top of the sticker in order to remove residual salt crystals. This
water was withdrawn using a paper towel and the sample was left to dry at 37˚C again. Samples were
stored in plastic petri dishes at room temperature before and after measurement.
The SEM stub was mounted on a stage and positioned so that the air gap from the lens system to the
sample was no more than 7 mm. An acceleration voltage of 15 kV was used for imaging and the EDX
energy setting was used for elemental analysis. Imaging and analysis were generally performed at 5000x
magnification. EDS signal analysis was confined to the smallest area containing the cell being imaged
and signal counting (on average at 3000 counts per second) was performed for at least 60 s. Finally, the
relative abundances of calcium, magnesium and sulfur were determined using the Quantax 70 software.
If necessary, the area used in quantification was confined to the largest area containing only the cell of
interest.
Ion chromatography After centrifugation of the core sections, 1 mL of overhead pore water was sampled (depending on the
porosity of the core, this was not possible for all sections), diluted in 9 mL demineralized water and
filter-sterilized (0.2 µm). Filtered samples were kept at 4˚C until measurement.
The ion chromatography machine used was a Dionex 2000 with an IonPac AS11 column. Calibration was
performed using a 7 ion standard solution (Thermo, #056933) at several dilutions (1:1, 1:2, 1:20, 1:100
and 1:200). The flow rate was 250 µL min-1 and a 10 - 45 mM potassium hydroxide gradient was created
in a total runtime of 32 minutes.
Results In order to characterize the habitat of marine Achromatium in detail, sediment cores were taken at Little
Sippewissett both during the day and at night. Cores one through six were taken at low tide, in the early
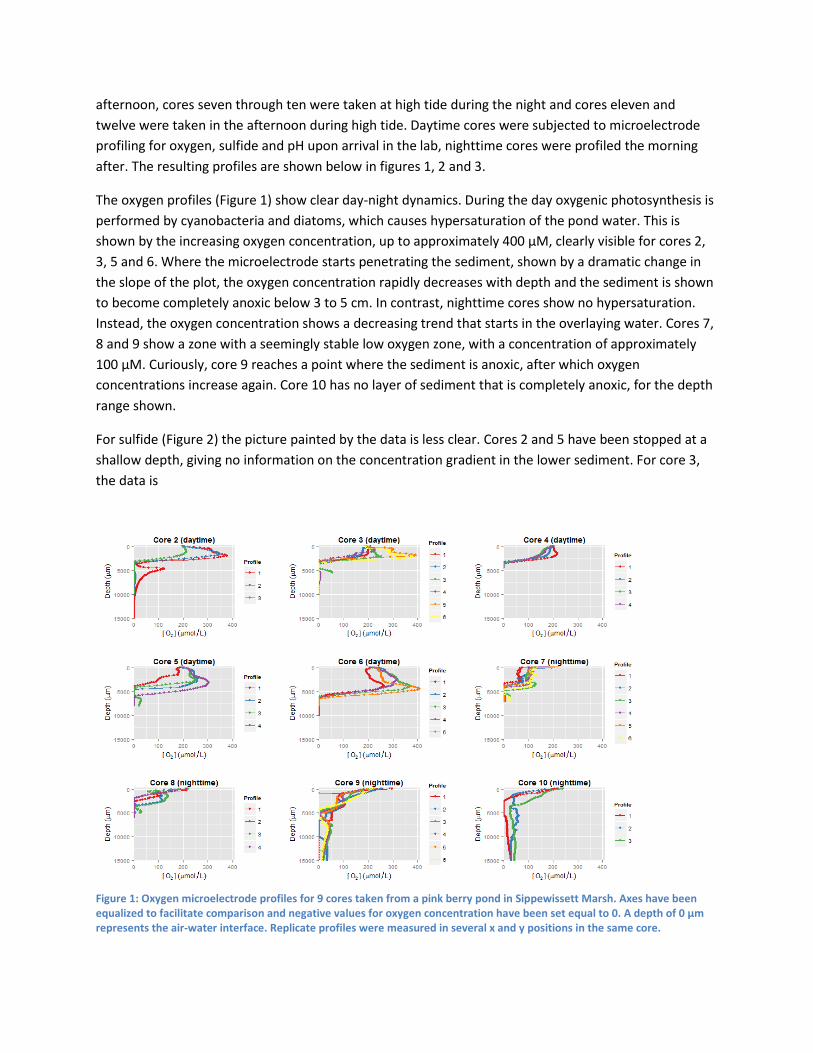
afternoon, cores seven through ten were taken at high tide during the night and cores eleven and
twelve were taken in the afternoon during high tide. Daytime cores were subjected to microelectrode
profiling for oxygen, sulfide and pH upon arrival in the lab, nighttime cores were profiled the morning
after. The resulting profiles are shown below in figures 1, 2 and 3.
The oxygen profiles (Figure 1) show clear day-night dynamics. During the day oxygenic photosynthesis is
performed by cyanobacteria and diatoms, which causes hypersaturation of the pond water. This is
shown by the increasing oxygen concentration, up to approximately 400 µM, clearly visible for cores 2,
3, 5 and 6. Where the microelectrode starts penetrating the sediment, shown by a dramatic change in
the slope of the plot, the oxygen concentration rapidly decreases with depth and the sediment is shown
to become completely anoxic below 3 to 5 cm. In contrast, nighttime cores show no hypersaturation.
Instead, the oxygen concentration shows a decreasing trend that starts in the overlaying water. Cores 7,
8 and 9 show a zone with a seemingly stable low oxygen zone, with a concentration of approximately
100 µM. Curiously, core 9 reaches a point where the sediment is anoxic, after which oxygen
concentrations increase again. Core 10 has no layer of sediment that is completely anoxic, for the depth
range shown.
For sulfide (Figure 2) the picture painted by the data is less clear. Cores 2 and 5 have been stopped at a
shallow depth, giving no information on the concentration gradient in the lower sediment. For core 3,
the data is
Figure 1: Oxygen microelectrode profiles for 9 cores taken from a pink berry pond in Sippewissett Marsh. Axes have been equalized to facilitate comparison and negative values for oxygen concentration have been set equal to 0. A depth of 0 µm represents the air-water interface. Replicate profiles were measured in several x and y positions in the same core.
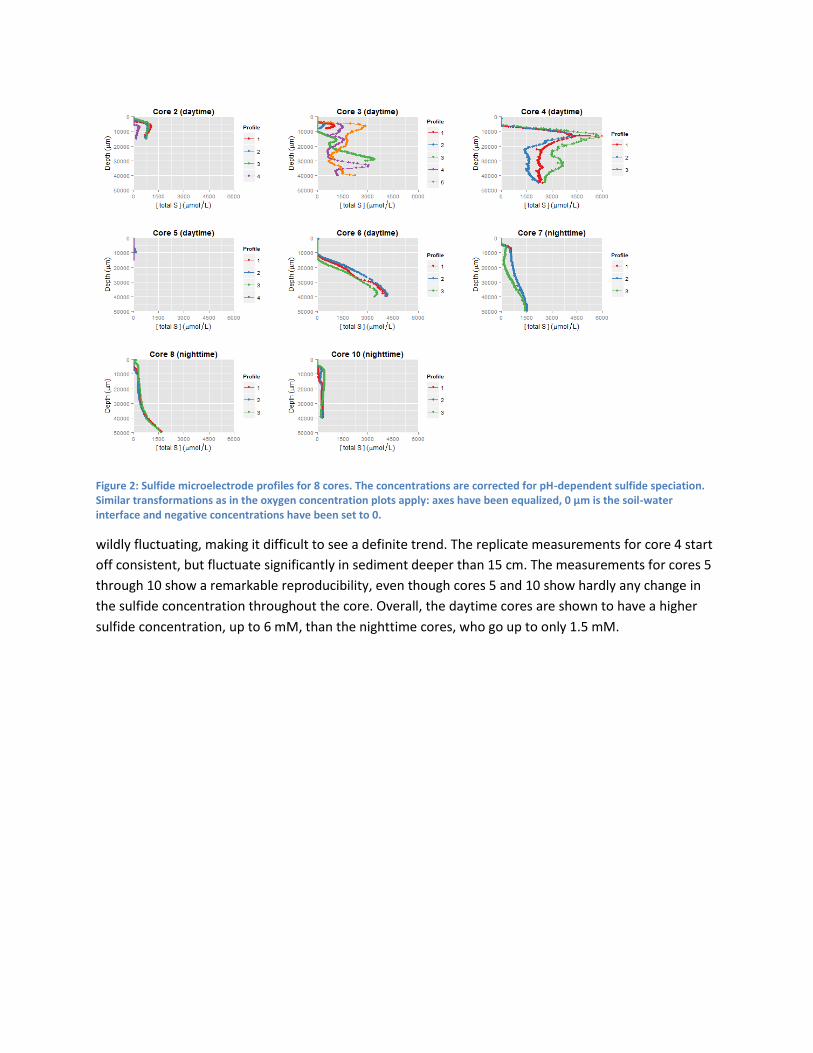
Figure 2: Sulfide microelectrode profiles for 8 cores. The concentrations are corrected for pH-dependent sulfide speciation. Similar transformations as in the oxygen concentration plots apply: axes have been equalized, 0 µm is the soil-water interface and negative concentrations have been set to 0.
wildly fluctuating, making it difficult to see a definite trend. The replicate measurements for core 4 start
off consistent, but fluctuate significantly in sediment deeper than 15 cm. The measurements for cores 5
through 10 show a remarkable reproducibility, even though cores 5 and 10 show hardly any change in
the sulfide concentration throughout the core. Overall, the daytime cores are shown to have a higher
sulfide concentration, up to 6 mM, than the nighttime cores, who go up to only 1.5 mM.
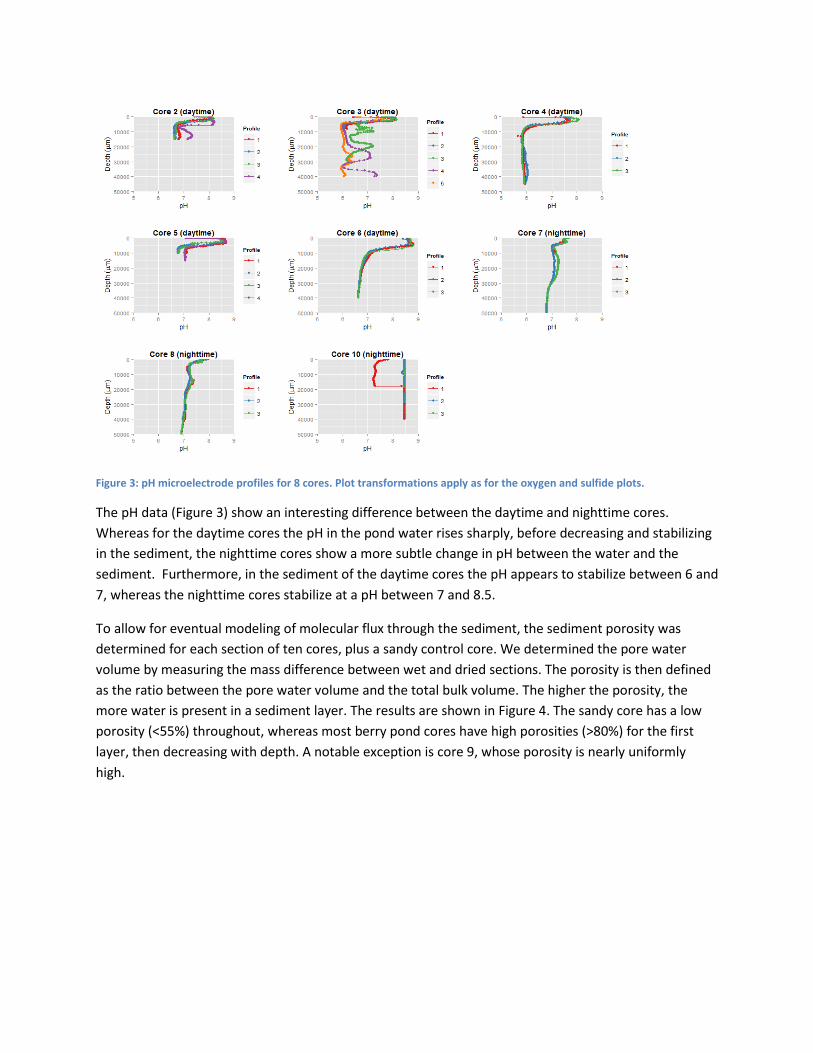
Figure 3: pH microelectrode profiles for 8 cores. Plot transformations apply as for the oxygen and sulfide plots.
The pH data (Figure 3) show an interesting difference between the daytime and nighttime cores.
Whereas for the daytime cores the pH in the pond water rises sharply, before decreasing and stabilizing
in the sediment, the nighttime cores show a more subtle change in pH between the water and the
sediment. Furthermore, in the sediment of the daytime cores the pH appears to stabilize between 6 and
7, whereas the nighttime cores stabilize at a pH between 7 and 8.5.
To allow for eventual modeling of molecular flux through the sediment, the sediment porosity was
determined for each section of ten cores, plus a sandy control core. We determined the pore water
volume by measuring the mass difference between wet and dried sections. The porosity is then defined
as the ratio between the pore water volume and the total bulk volume. The higher the porosity, the
more water is present in a sediment layer. The results are shown in Figure 4. The sandy core has a low
porosity (<55%) throughout, whereas most berry pond cores have high porosities (>80%) for the first
layer, then decreasing with depth. A notable exception is core 9, whose porosity is nearly uniformly
high.
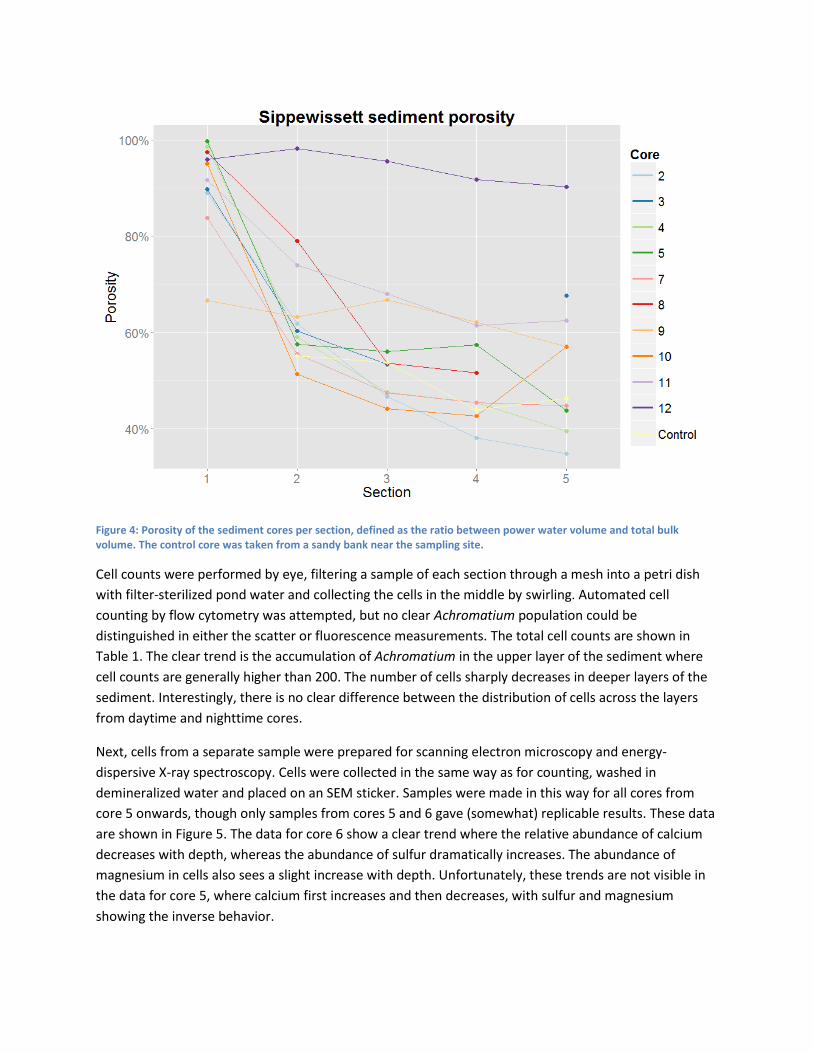
Figure 4: Porosity of the sediment cores per section, defined as the ratio between power water volume and total bulk volume. The control core was taken from a sandy bank near the sampling site.
Cell counts were performed by eye, filtering a sample of each section through a mesh into a petri dish
with filter-sterilized pond water and collecting the cells in the middle by swirling. Automated cell
counting by flow cytometry was attempted, but no clear Achromatium population could be
distinguished in either the scatter or fluorescence measurements. The total cell counts are shown in
Table 1. The clear trend is the accumulation of Achromatium in the upper layer of the sediment where
cell counts are generally higher than 200. The number of cells sharply decreases in deeper layers of the
sediment. Interestingly, there is no clear difference between the distribution of cells across the layers
from daytime and nighttime cores.
Next, cells from a separate sample were prepared for scanning electron microscopy and energy-
dispersive X-ray spectroscopy. Cells were collected in the same way as for counting, washed in
demineralized water and placed on an SEM sticker. Samples were made in this way for all cores from
core 5 onwards, though only samples from cores 5 and 6 gave (somewhat) replicable results. These data
are shown in Figure 5. The data for core 6 show a clear trend where the relative abundance of calcium
decreases with depth, whereas the abundance of sulfur dramatically increases. The abundance of
magnesium in cells also sees a slight increase with depth. Unfortunately, these trends are not visible in
the data for core 5, where calcium first increases and then decreases, with sulfur and magnesium
showing the inverse behavior.
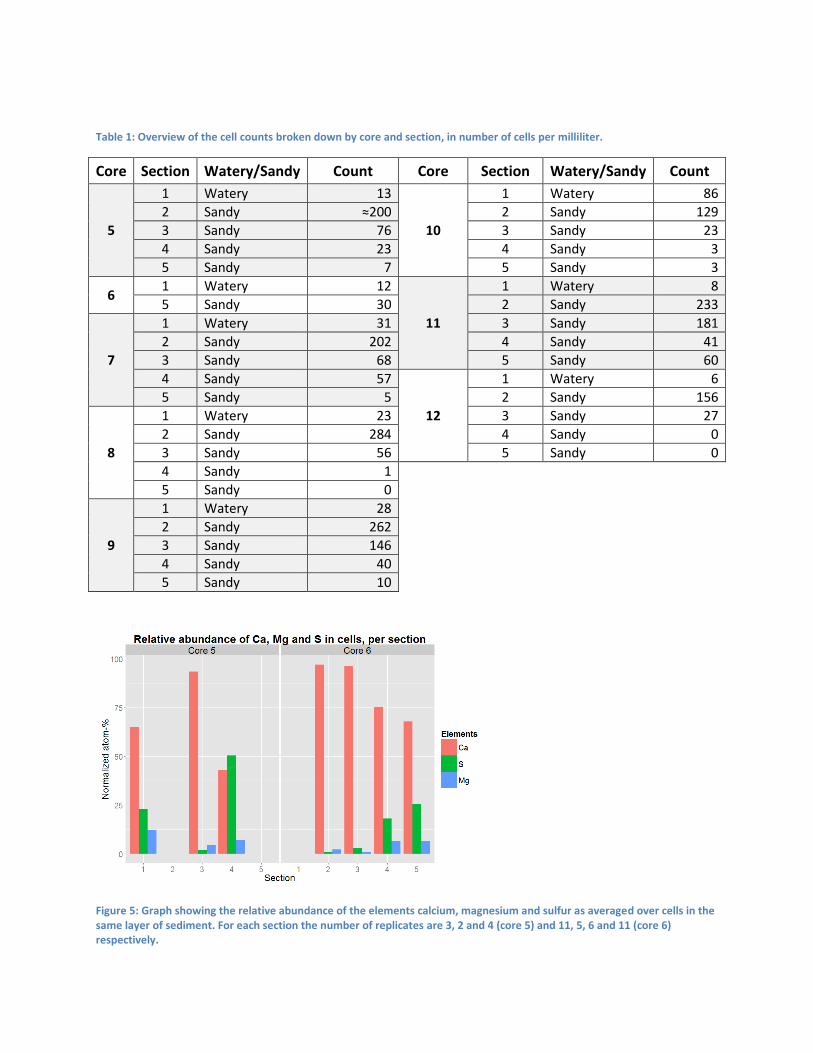
Table 1: Overview of the cell counts broken down by core and section, in number of cells per milliliter.
Core Section Watery/Sandy Count Core Section Watery/Sandy Count
5
1 Watery 13
10
1 Watery 86
2 Sandy ≈200 2 Sandy 129
3 Sandy 76 3 Sandy 23
4 Sandy 23 4 Sandy 3
5 Sandy 7 5 Sandy 3
6 1 Watery 12
11
1 Watery 8
5 Sandy 30 2 Sandy 233
7
1 Watery 31 3 Sandy 181
2 Sandy 202 4 Sandy 41
3 Sandy 68 5 Sandy 60
4 Sandy 57
12
1 Watery 6
5 Sandy 5 2 Sandy 156
8
1 Watery 23 3 Sandy 27
2 Sandy 284 4 Sandy 0
3 Sandy 56 5 Sandy 0
4 Sandy 1
5 Sandy 0
9
1 Watery 28
2 Sandy 262
3 Sandy 146
4 Sandy 40
5 Sandy 10
Figure 5: Graph showing the relative abundance of the elements calcium, magnesium and sulfur as averaged over cells in the same layer of sediment. For each section the number of replicates are 3, 2 and 4 (core 5) and 11, 5, 6 and 11 (core 6) respectively.
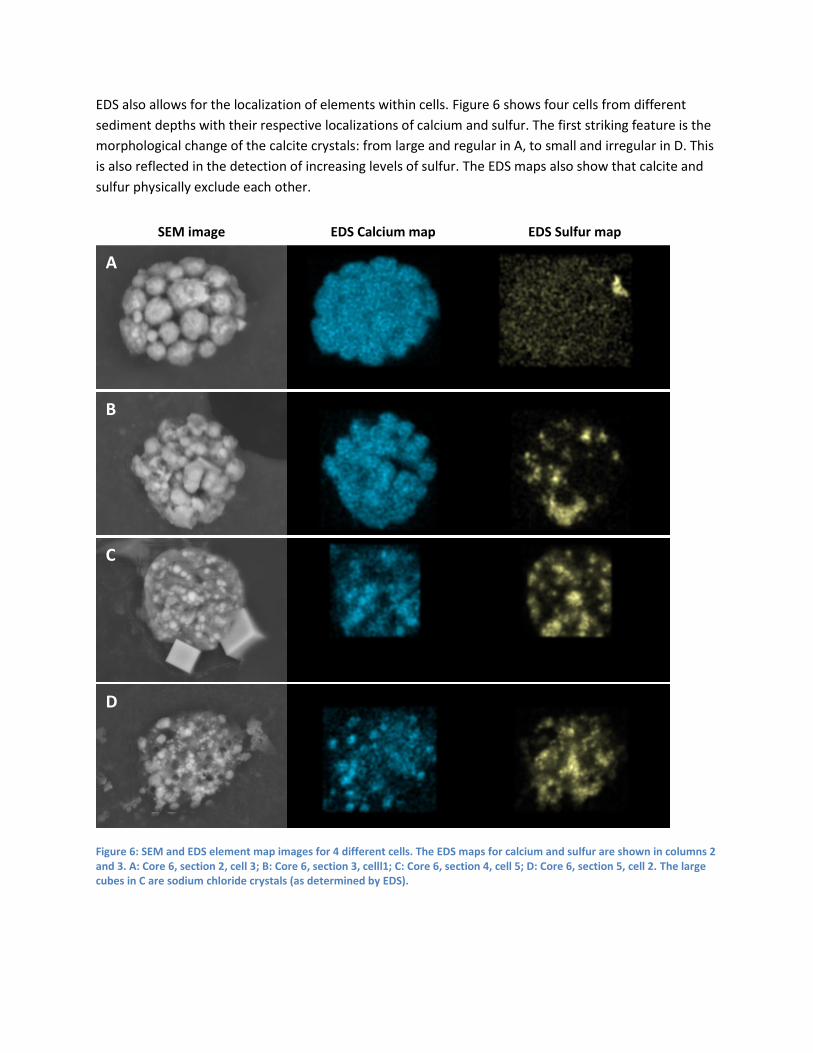
EDS also allows for the localization of elements within cells. Figure 6 shows four cells from different
sediment depths with their respective localizations of calcium and sulfur. The first striking feature is the
morphological change of the calcite crystals: from large and regular in A, to small and irregular in D. This
is also reflected in the detection of increasing levels of sulfur. The EDS maps also show that calcite and
sulfur physically exclude each other.
Figure 6: SEM and EDS element map images for 4 different cells. The EDS maps for calcium and sulfur are shown in columns 2 and 3. A: Core 6, section 2, cell 3; B: Core 6, section 3, celll1; C: Core 6, section 4, cell 5; D: Core 6, section 5, cell 2. The large cubes in C are sodium chloride crystals (as determined by EDS).
A
B
C
SEM image EDS Calcium map EDS Sulfur map
D
Discussion The characterization of Sippewissett marsh pond sediment was expected to yield a specific pattern in
oxygen and sulfide gradients. The oxygen profiles in the daytime cores follow this expectation most
clearly. They show hypersaturation in the overlaying water due to the activity of cyanobacteria, followed
by depletion of oxygen in the sediment. The oxygen profiles in the nighttime cores tend not to reach 0 in
deeper sediment layers, something that is inadequately explained by the presence of air bubbles in the
column. Sulfide profiles show an expected increase in deeper layers of the sediment, where anaerobic
sulfate-oxidizing bacteria degrade sunken organic matter. It was expected that the night-time cores
would show a stronger increase in sulfide concentration, but this is not observed. A possible explanation
could be the fact that these cores were left overnight before being measured. There could have been
sulfur-oxidizing activity by colorless sulfur bacteria, unaffected by covering the cores with aluminum foil.
Overall there is a large variability in the microelectrode profiles even when taken within the same core.
This reflects the heterogeneity of the habitat these organisms live in, but makes it difficult to draw
conclusions from the data.
The measurement of the porosity of the sediment will provide useful information for later stage
modeling of nutrient fluxes through the sediment, but in itself appears to provide little insight into the
dynamics governing the Sippewissett habitat. All but one core (12) converge to a similar porosity of
approximately 55 to 60%.
Achromatium have previously been reported to mainly inhabit the micro-oxic zone of the sediment and
this is largely supported by the data presented here. The majority of cells are found in the first
centimeter of sediment, where, according to the oxygen microelectrode measurements, oxygen is
rapidly depleted. In two cores (9, 11) there are significant amounts of bacteria in the second layer of
sediment and at least for core 9 this could be explained by the low concentration of oxygen that present
according to the microelectrode profiles (Figure 1).
The cells were expected to form a distinct population in the flow cytometer, with a high side scatter due
to the calcite and sulfur globules and a lack of autofluorescence distinguishing them from diatoms. This
was never observed for any samples fixed with gluteraldehyde and later it was shown that the
gluteraldehyde causes the calcite to be degraded. It may be possible to detect a distinct population with
unfixed Achromatium, but logistics made it difficult to perform flow cytometry on freshly extracted cells,
with the risk of the cell morphology changing as they waiting to be processed. Furthermore, it is easy to
distinguish Achromatium from other organisms in the core sediment filtrate and to collect all of the cells
for counting. We therefore consider manual counting to be a valid strategy.
The SEM-EDS measurements, at least for core six, show that there is a trend in the accumulation of
calcite and sulfur, depending on the depth of the organism in the soil. Whilst core 5 does fluctuate, it
must be noted that the number of cells found in that SEM run was much lower than that for core 6. The
EDS element localization maps show that there is a beautiful trend of smaller calcite crystals with
increasing depth and increasing sulfur accumulation. This is expected as the deeper sediment layers are
rich in sulfide and the calcite is needed in the oxic layer where, presumably, oxidation of elemental
sulfur to sulfate takes place.
Most importantly, these are preliminary data showing a promising trend. For all layers some cells could
be found that did not correspond to the elemental abundance profile expected for that depth, although
this is presumably due to cells moving, or being moved by tidal forces, through the sediment.
Furthermore, these data do not provide an explanation regarding the mechanism of calcite
crystallization, nor do they definitively show that calcite is used for buffering the acid production
inherent in sulfur oxidation.
Future work should focus on replicating the SEM-EDS results for more cores, to conclusively show the
presence of trends in calcite and sulfur accumulation and the ion chromatography experiments that
could not be performed due to column failure should be repeated. Then, the method of calcification
needs to be elucidated, by placing cells in conditions conducive or obstructive to calcite formation and
studying the response. Finally, an available genome sequence will be an invaluable tool in uncovering
the pathways involved in calcification, through genome mining and transcriptomics approaches.
Conclusion The goal of demonstrating the purpose, an intracellular buffer, calcite accumulation in Achromatium has
been partially met. The habitat has been described in some detail using microelectrode profiles and the
determination of a key physical property, porosity, and SEM-EDS measurements suggest opposite trends
in calcite and sulfur accumulation as a function of the depth in the sediment. Nevertheless, a definitive
link between sulfur oxidation and calcite has yet to be demonstrated. Several important questions
regarding this process fell outside of the scope of this project, such as the calcification mechanism and
the apparent preference of Achromatium for calcium over magnesium, despite the higher prevalence of
magnesium in seawater.
Acknowledgements Special thanks go out to Verena Salman, who provided me with this amazing project to work on in the
lab and in the field, and Kurt Hanselmann, for his tremendous help with the SEM and for asking the right
questions to provoke new insight in the data.
Many thanks to all the faculty and students in the MD2014 course, it was a great experience and I had a
great time doing science with all of you.
My participation in this course would not have been possible without generous financial support from
my PhD supervisor Prof. Gerard Muyzer, the Daniel S. and Edith T. Grosch Scholarship Fund and the
Holger & Friederun Jannasch Scholarship in Microbial Diversity.

Bibliography Bersa E (1926). Neue kalkführende Schwefelbakterien. Planta 24: 373-379.
Couradeau E, Benzerara K, Gérard E, Moreira D, Bernard S, Brown GE Jr., López-García P (2012) An Early-Branching
Microbialite Cyanobacterium Forms Intracellular Carbonates. Science 336: 459-462.
De Boer WE, La Riviere JWM, Schmidt K (1971). Some properties of Achromatium oxaliferum. Antonie van
Leeuwenhoek 37: 553-563.
Devide Z (1952). Zwei neue farblose Schwefelbakterien: Thiogloea ruttneri n. gen., n. sp. und Thiogloea ragusina n.
sp. Hydrobiologia 14: 446-455.
Glöckner FO, Babenzien HD, Wulf J, Amann R (1999). Phylogeny and diversity of Achromatium oxaliferum. Syst
Appl Microbiol 22: 28-38.
Gray ND, Howarth R, Pickup RW, Jones JG, Head IM (1999a). Substrate uptake by uncultured bacteria from the
genus Achromatium determined by microautoradiography. Appl Environ Microbiol 65: 5100-5106.
Gray ND, Howarth R, Rowan A, Pickup RW, Jones JG, Head IM (1999b). Natural communities of Achromatium
oxaliferum comprise genetically, morphologically, and ecologically distinct subpopulaitons. Appl Environ Microbiol
65: 5089-5099.
Gray ND, Comaskey D, Miskin IP, Pickup RW, Suzuki K, Head IM (2004). Adaptation of sympatric Achromatium spp.
to different redox conditions as a mechanism for coexistence of functionally similar sulphur bacteria. Environ
Microbiol 6: 669-677.
Head IM, Gray ND, Clarke KJ, Pickup RW, Jones JG (1996). The phylogenetic position and ultrastructure of the
uncultured bacterium Achromatium oxaliferum. Microbiol 142: 2341-2354.
Head IM, Gray ND, Howarth R, Pickup RW, Clarke KJ, Jones JG (2000). Achromatium oxaliferum : Understanding the
unmistakable. In: Advances in Microbial Ecology (ed. Schink B), vol. 16.
Kolkwitz R (1918). Über die Schwefelbakterienflora des Solgrabens von Arten. Berichte Deutsch Botanischen
Gesellsch 36: 218-224.
Lackey JB, Lackey EW (1961). The habitat and description of a new genus of sulphur bacterium. J Gen Appl
Microbiol 26: 29-39.
Nadson GA (1913). Ueber Schwefelmikroorganismen des Hapsaler Meerbusens. Bulletin du Jardin Impériale
Botanique de St-Pétersbourg 13: 106-112.
Schewiakoff W (1892). Ueber einen neuen bacterienähnlichen Organismus des Süsswassers. Habilitation thesis,
University Heidelberg, Heidelberg.
West GS, Griffiths BM (1909). Hillhousia mirabilis, a giant sulphur bacterium. Proc R Soc Lond B-Conta 81: 398-405.
Recommended


![· Ë) / Nicotinell Cool Mint 2mg Chewing Gum ('h Ë) / Nicotinell Cool Mint 4mg Chewing Gum N] ' nicotine 2mgÉÿ4mg 1] Gum Base, Calcium Carbonate, Sorbitol Powder, Xylitol Crystals,](https://img.dokumen.tips/doc/110x75/5e52ebe97e2be07548677a77/-nicotinell-cool-mint-2mg-chewing-gum-h-nicotinell-cool-mint-4mg-chewing.jpg)
![Regulation of the intracellular Ca2+. Regulation of intracellular [H]:](https://img.dokumen.tips/doc/110x75/5a4d1b717f8b9ab0599b56a5/regulation-of-the-intracellular-ca2-regulation-of-intracellular-h.jpg)


