RESEARCH ARTICLE
Dynamical characteristics of the tip vortex from a four-bladedrotor in hover
Swathi M. Mula • James H. Stephenson •
Charles E. Tinney • Jayant Sirohi
Received: 21 November 2012 / Revised: 30 August 2013 / Accepted: 10 September 2013
� Springer-Verlag Berlin Heidelberg 2013
Abstract Dynamical characteristics of tip vortices shed
from a 1 m diameter, four-bladed rotor in hover are
investigated using various aperiodicity correction tech-
niques. Data are acquired by way of stereo-particle image
velocimetry and comprises measurements up to 260� vor-
tex age with 10� offsets. The nominal operating condition
of the rotor corresponds to Rec = 248,000 and
M = 0.23 at the blade tip. With the collective pitch set to
7.2� and a rotor solidity of 0.147, blade loading (CT/r) is
estimated from blade element momentum theory to be
0.042. The findings reveal a noticeable, anisotropic, ape-
riodic vortex wandering pattern over all vortex ages mea-
sured. These findings are in agreement with recent
observations of a full-scale, four-bladed rotor in hover
operating under realistic blade loading. The principal axis
of wander is found to align itself perpendicular to the
slipstream boundary. Likewise, tip vortices trailing from
different blades show a wandering motion that is in phase
instantaneously with respect to one another, in every
direction and at every wake age in the measurement
envelope.
List of symbols
b Number of blades
c Blade chord
CT Coefficient of thrust
dr Pixel dimension
ds Diffraction limited spot diameter
Hw Normalized-helicity
l Turbulent length scale
Lm Measurement resolution
M Blade tip Mach number
Q Q method
rc Vortex core radius
R Blade radius
Rec Blade tip Reynolds number based on chord
T Rotor thrust
u = u, v, w Velocity vector with components in y, r, /ul Turbulent velocity scale
Vtip Blade tip velocity
Vh Swirl velocity
Vh,m Peak swirl velocity
y, r, / Fixed frame coordinates
y0; r0 Vortex frame coordinates
yH; rH Coordinates with respect to mean vortex
center
a Wander orientation with respect to
slipstream slope
b Helix pitch angle
C1 C1 method
e Rate of energy dissipation
h1deg Blade twist
K Symmetric part of velocity gradient tensor
k2 k2 method
r Gradient operator
m Kinematic viscosity
P Skew-symmetric part of velocity gradient
tensor
qf Fluid density
qp Particle density
r Rotor solidity
ri Standard of deviation of wander in
i direction
S. M. Mula (&) � J. H. Stephenson � C. E. Tinney � J. Sirohi
Aerospace Engineering and Engineering Mechanics Department,
The University of Texas at Austin, 1 University Station,
C0600, Austin, Texas 78712, USA
e-mail: [email protected]; [email protected]
123
Exp Fluids (2013) 54:1600
DOI 10.1007/s00348-013-1600-9

ry Standard of deviation of axial wander
rr Standard of deviation of radial wander
s Kolmogorov time scale
w Wake age in angular coordinates
wv Vortex age in angular coordinates
X Rotor speed
xw w component of vorticity vector
1 Introduction
Wandering motions of the blade tip vortex, subsequent to
its detachment from the blade surface, add formidable
complexity to the shape and behavior of a rotor’s wake. In
the classical sense, vortex wandering is defined as the
random displacement of the vortex core (Gursul and Xie
1999; Ramasamy et al. 2009) and is believed to be driven
by inflow unsteadiness, shear layer turbulence, cooperative
instabilities (e.g., Crow instability), or the propagation of
unsteadiness from the vehicle (Jacquin et al. 2001). This
wandering motion smears the statistical properties of the
tip vortex, thus making the growth, structure, turbulence,
merging, and break-down of these tip vortices difficult to
predict over a broad range of operating conditions (Baker
et al. 1974; Devenport et al. 1996; Heyes et al. 2004;
Bailey and Tavoularis 2008). A persistent difficulty to
accurately characterize these blade tip vortices is that it
requires whole field measurements. Time averaged single-
point measurements using constant temperature anemom-
eters (Iversen et al. 1978; Tung et al. 1981; Green and
Acosta 1991) or laser Doppler velocimetry (LDV) instru-
ments (Thompson et al. 1988; Leishman et al. 1996; Han
et al. 1997; Bhagwat and Leishman 2000) are corrupted by
vortex wandering, thus causing such measurements to be
weighted averages in both space and time. For example,
increases in the diameter of the vortex core accompanied
by reductions in the peak tangential and axial velocities are
attributed to wandering, which contributes to apparently
high levels of Reynolds stresses (Baker et al. 1974; Dev-
enport et al. 1996; Heyes et al. 2004; Bailey and Tavou-
laris 2008). Likewise, a premature breakdown of the vortex
is likely due to the susceptibility of the vortex to intrusive
probes (Green and Acosta 1991). This of course limits
reliable measurement techniques to laser-based systems
(LDV), which possess restrictions of their own, given the
random arrival of particles through the measurement vol-
ume and the corrections that must be applied thereafter.
While numerous studies have aimed to explore the aperi-
odicity, vortex wandering and turbulence characteristics of
vortices using point techniques (Bhagwat and Leishman
2000; Green and Acosta 1991; Gursul and Xie 1999; Le-
ishman 1998), they fall short of accurately capturing the
true dynamical characteristics of the tip vortex, especially
in the far-wake regions where wandering is excessive. This
is certainly no fault of the experimentalist, and so has
prompted a demand for spatially resolved measurement
tools, which have become more sophisticated over the past
decade with the advent of commercially available digital
particle image velocimetry (PIV) systems.
A unique feature of PIV is the instantaneous measure-
ment of an entire area, providing the velocity distribution
in a first post-processing step and allowing for estimates of
vorticity, Q, k2, etc. in further post-processing. The trade-
off, however, is tuned to the challenge of adequately
seeding the core of the blade tip vortex. Centrifugal forces
cause heavier particles to move outward from the vortex
center, thereby resulting in lower levels of scattered light
by remaining lighter weight particles residing close to the
center. This has prompted several undertakings aimed at
improving estimates for the vectors in the vortex core
(Ramasamy et al. 2011; Bhagwat and Ramasamy 2012).
In the current study, the trajectory and statistical char-
acteristics of the tip vortices from a four-bladed rotor
during hover are captured up to 260� vortex age by way of
stereo-PIV and then analyzed using several well-estab-
lished vortex methods. This is done in an effort to under-
stand the evolutionary characteristics of vortex wander,
which continues to be an outstanding question of practical
scientific interest (Baker et al. 1974; Devenport et al. 1996;
Jacquin et al. 2001; Leishman 1998). The development and
subsequent comparison between various vortex aperiodic-
ity correction techniques are certainly not new, and the
interested reader should review the work of McAlister
(2003), van der Wall and Richard (2006), Ramasamy et al.
(2009), Kindler et al. (2010), and Bhagwat and Ramasamy
(2012). Here, we employ an arsenal of methods simply to
provide confidence in our measurements; the principal
focus of this study is on the dynamical characteristics of
these blade tip vortices over extended vortex ages, which
has received very little attention aside from the work of
Kindler et al. (2010).
The outline of this manuscript is as follows. Details of
the rotor test stand and instrumentation are discussed in
Sect. 2 including an effort to quantify sources of experi-
mental error. The basic statistical properties of the rotor
wake are displayed in order to develop an intuition for this
complex, three-dimensional flow. Central to this study is
the implementation of several different vortex-tracking
schemes in Sect. 3, which comprise both divergence and
integral-based methods, as well as methods derived from
the geometrical properties of the vortex itself. Upon
implementation of these vortex-tracking schemes, the
slipstream boundary, the dynamics of vortex wander and
the rotor slipstream are discussed in Sect. 4, followed by an
overall summary of the findings in Sect. 5.
Page 2 of 14 Exp Fluids (2013) 54:1600
123
2 Experimental arrangement
2.1 Facility and instrumentation
The current study was conducted at the J.J. Pickle Research
Campus of the University of Texas at Austin in a room
measuring 6.5 9 8.0 9 6.5 rotor diameters. A custom
fabricated rotor test stand provided the necessary condi-
tions for characterizing the vortex trajectory from a four-
bladed rotor at various vortex ages. At the heart of this test
stand is a 9 kW electric motor capable of producing a
maximum rotational speed of 8,000 RPM (133 Hz) and a
maximum torque of 10 Nm. Two optical encoders are fixed
to the motor and allow both 1/rev and 60/rev positioning of
the rotor to be phase aligned with flow measurement
instruments.
As for the rotor assembly, a fully articulated, four-bla-
ded hub assembly with flap hinge was mounted on the rotor
shaft at a height of three rotor diameters above the ground.
The rotor was driven directly by the electric motor, without
a transmission. All four rotor blades comprised carbon fiber
NACA 0012 profiles with constant chord lengths of
58.5 mm and no twist. Each blade had square tips and a
small (\0.8 mm) blunt trailing edge. The diameter of the
entire assembly including blades, rotor hub and blade grips
was measured to be 1,010 mm; this resulted in a rotor
solidity of 0.147.
A collective pitch angle of 7.2� was investigated at a
rotor speed of X ¼ 1; 520 RPM (25.33 Hz) which resulted
in a blade tip speed of 80.33 m/s. This corresponded to
Rec = 248,000 and M = 0.23 at the blade tip. Blade
loading was estimated using blade element momentum
theory (BEMT): CT ¼ 0:0062; T ¼ 39:412 N and CT/
r = 0.042, which compares favorably to an integration of
the momentum in the rotors wake (Mula et al. 2011). In
order to accurately track the rotor blade, lead-lag positions
of the blades were fixed (rigid) and adjusted until the
blades were visually aligned using a 4/rev strobe. One
blade was slightly set behind others, within 5 % of the
blade chord, to enforce vortex tumbling as part of a sepa-
rate study (Stephenson et al. 2012). Often, the unsteady
aerodynamic environment in which the blade is moving
through causes blade flapping (Richard et al. 2006). This is
especially true for rotors operating in ground effect or in
small facilities where recirculation patterns cause the rotor
disk to re-ingest the unsteady wake. The effect was
inspected using the 1/rev strobe and a high resolution
digital camera, and revealed flapping motions in the blade
tip on the order of 1–2 mm. Similar findings were observed
by Sirohi and Lawson (2012) using a digital image corre-
lation technique of the same rotor blades and test stand.
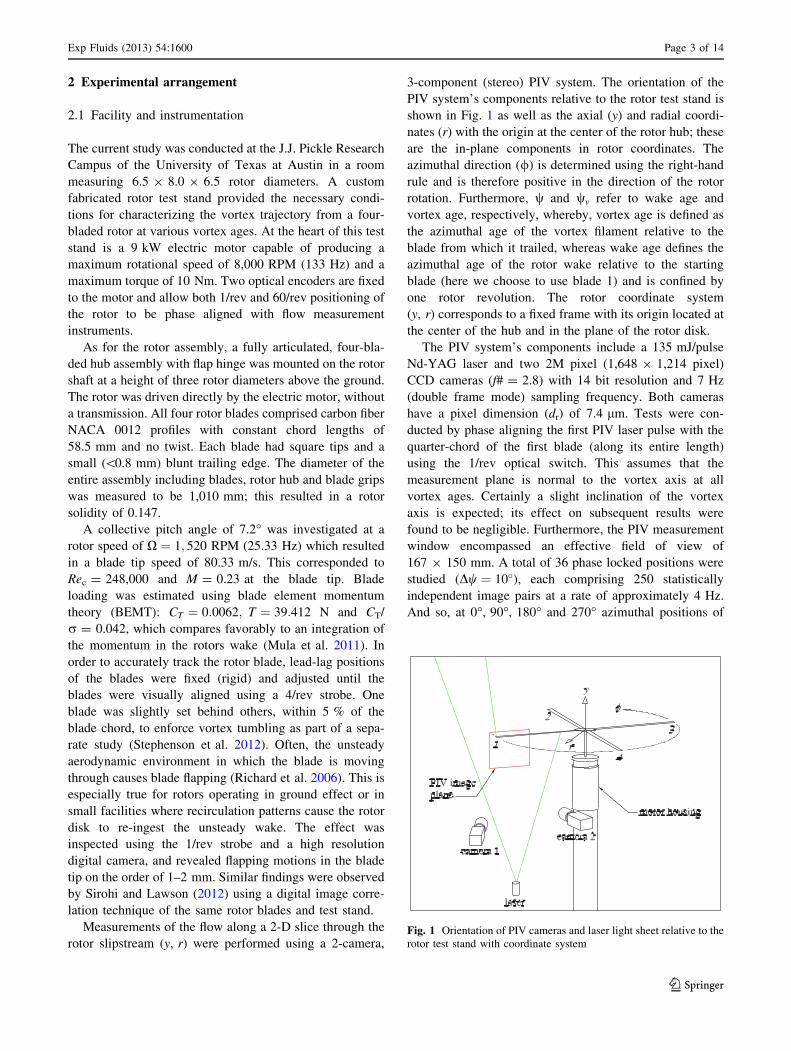
Measurements of the flow along a 2-D slice through the
rotor slipstream (y, r) were performed using a 2-camera,
3-component (stereo) PIV system. The orientation of the
PIV system’s components relative to the rotor test stand is
shown in Fig. 1 as well as the axial (y) and radial coordi-
nates (r) with the origin at the center of the rotor hub; these
are the in-plane components in rotor coordinates. The
azimuthal direction (/) is determined using the right-hand
rule and is therefore positive in the direction of the rotor
rotation. Furthermore, w and wv refer to wake age and
vortex age, respectively, whereby, vortex age is defined as
the azimuthal age of the vortex filament relative to the
blade from which it trailed, whereas wake age defines the
azimuthal age of the rotor wake relative to the starting
blade (here we choose to use blade 1) and is confined by
one rotor revolution. The rotor coordinate system
(y, r) corresponds to a fixed frame with its origin located at
the center of the hub and in the plane of the rotor disk.
The PIV system’s components include a 135 mJ/pulse
Nd-YAG laser and two 2M pixel (1,648 9 1,214 pixel)
CCD cameras (f# = 2.8) with 14 bit resolution and 7 Hz
(double frame mode) sampling frequency. Both cameras
have a pixel dimension (dr) of 7.4 lm. Tests were con-
ducted by phase aligning the first PIV laser pulse with the
quarter-chord of the first blade (along its entire length)
using the 1/rev optical switch. This assumes that the
measurement plane is normal to the vortex axis at all
vortex ages. Certainly a slight inclination of the vortex
axis is expected; its effect on subsequent results were
found to be negligible. Furthermore, the PIV measurement
window encompassed an effective field of view of
167 9 150 mm. A total of 36 phase locked positions were
studied (Dw ¼ 10�), each comprising 250 statistically
independent image pairs at a rate of approximately 4 Hz.
And so, at 0�, 90�, 180� and 270� azimuthal positions of
Fig. 1 Orientation of PIV cameras and laser light sheet relative to the
rotor test stand with coordinate system
Exp Fluids (2013) 54:1600 Page 3 of 14
123

the first blade, the laser sheet was aligned along the
quarter-chord of blades 1, 2, 3 and 4, respectively (blade
numbers are labeled below each blade tip in Fig. 1). For a
sample vortex age of 20�, the maximum azimuthal
velocity is on the order of 0.1Vtip, which falls rapidly to
about 0.03Vtip at vortex ages greater than 90�. Coupled
with an interframe timing rate of 110 ls and a 2 mm laser
sheet thickness, these result in a ratio between the laser
sheet thickness and the out-of-plane particle displacement
of 2.2 and 7.4, respectively. Likewise, the accuracy of the
measurement is to within 1� in azimuth based on the
rotation speed of the rotor and the interframe timing rate.
Seeding was provided by a PIVTEC 14 cascadable Laskin
nozzle olive oil seeder with particles ranging between 0.1
and 1 microns in diameter.
Calibration was performed using a plate with known
reference points and with calibration parameters being
extracted using a pinhole-based model. This was followed
by software-based corrections for differences in the view-
ing angles of the two cameras relative to the image plane.
Vector maps were generated using commercial software
DaVis v7.2 from LaVision GmbH. Initial interrogation
window sizes comprised 32 9 32 pixels that reduced
iteratively to a final window size of 16 9 16 pixels thereby
resulting in a measurement resolution of Lm = 2.2 mm.
Based on this setup, Lm/rc is estimated to be 0.75 (this
assumes rc = 0.05c (van der Wall and Richard 2006)),
which is slightly larger than the suggestions of (Grant
1997; Martin et al. 2000) whereby Lm/rc is expected to be
\0.2 for accurate measurements of the core radius rc.
Nevertheless, the focus of the study is on the wandering
motion of the vortex, as opposed to the effects of stretching
and viscous diffusion; the former of these does not demand
conservative values for Lm/rc. A 50 % overlap was
employed and resulted in a spatial grid resolution of
1.0983 mm (0.0187c); a 50 % overlap has been shown to
lead to errors for the core radius and peak swirl velocity of
up to 5 % (assuming Lm/rc \ 0.5) based on Vatistas’ model
(van der Wall and Richard 2006). The location of the
correlation peaks for valid vectors were estimated using a
three–point Gaussian fit. Additional details concerning PIV
measurement techniques and best practices can be found in
Raffel et al. (1998) and the references therein.
2.2 Sources of uncertainty
The principal sources of error in PIV measurements can be
categorized into (1) particle tracking, (2) particle imaging
and (3) image evaluation. Particle tracking errors are deter-
mined for large particle-to-fluid density ratios (q = qp/qf�1) following the analysis of Melling (1997) and Tinney et al.
(2008). Given that the rate of energy dissipation (e) at small
scales is equal to the production of energy at large turbulent
scales, e must be of the order of ul3/l, where l and ul are the
integral length and velocity scales of the large scale eddies.
Therefore, the time scales of the smallest eddies (Kol-
mogorov scales) are approximated by s ¼ ðmeÞ1=2. The val-
ues for l and ul that are associated with the turbulence in the
center of the slipstream are estimated from the mean width
and mean convection velocities, respectively, as illustrated
in Table 1. Hence, turbulence frequencies never exceed
8.0 kHz, and so, tracking errors for 1.0 lm size particles are
found to be within 12 % for the dissipative scales of this flow.
Aside from centrifugal forces in the vortex core, the seeding
medium chosen for this study reasonably tracks the flow.
A known difficulty with using particle-based techniques
to measure blade tip vortices is the lack of seed in the
vortex core due to centrifugal forces. A demonstration of
this is shown in Fig. 2a using a raw snap-shot at 250�vortex age alongside the resultant vector map in Fig. 2b
using vortex frame coordinates. In this snap-shot (and most
others), the vortex core comprised approximately 110
vectors. The locations of peak swirl velocities are indicated
by the black boundary to provide some reference regarding
the size of the vortex core relative to the region of poor
light scatter. Likewise, additional lines (horizontal and
vertical) have been drawn in Fig. 2b emanating from the
vortex center along which the signal to noise ratio (SNR)
was recorded and is shown in Fig. 3. SNR is based on the
ratio of the primary to secondary correlation peaks in the
cross-correlation. For this study, the SNR had to be greater
Table 1 Turbulence frequencies associated with the dissipative
scales of the flow at different axial positions below the rotor
y/R ul (m/s) l (mm) s-1 (kHz)
-0.05 2.26 25 5.43
-0.10 2.98 37 6.75
-0.15 3.13 44 6.67
-0.20 3.25 51 6.55
-0.25 3.68 57 7.47
(a) (b)
0
0
0
0
00 .
.
.
. 4
4
2
2
Fig. 2 a Raw PIV image at 250� vortex age and b its corresponding
vector map in PIV coordinates
Page 4 of 14 Exp Fluids (2013) 54:1600
123

than 1.3 for vectors to be considered valid, after which,
missing vectors were estimated using a nearest neighbor fit.
The SNR levels in Fig. 3 are shown to be well above the
specified threshold and for a large fraction of the vortex.
As for particle imaging errors, the measurement preci-
sion depends on the image sensor geometry relative to the
particle image diameter (ds). For a single lens with circular
aperture, the diffraction limited spot diameter is well
known and relies on an average lens magnification which is
found from the calibration to be 0.05. Westerweel (1998)
showed that error free estimates can be obtained when ds/
dr C 2 where dr is the pixel size. In the current experiment,
ds/dr is estimated to be 0.516, which is less than the rec-
ommended value of 2. A check for pixel locking effects
revealed that the particle image displacements were unbi-
ased by the integer pixel dimension.
2.3 Rotor wake features
Since the PIV measurements were performed over the
entire rotor revolution and along slices in the (y, r) plane,
vector maps could be stitched together to view average
velocity profiles along slices in the (r, /) plane in order to
check for consistency. In Fig. 4a, b, c, contours of the
axial, radial and azimuthal velocity components, respec-
tively, of the mean flow are illustrated at an axial position
of y/R = -0.05 using the raw data without corrections for
vortex wander. The center corresponds to the inner most
radial position of the PIV measurement window from the
rotor hub axis at r/R = 0.733. Because of laser blooming
effects (laser aligned with quarter-chord of the blade)
quality data was unavailable at 0�, 90�, 180� and 270�wake ages. Additional illustrations in Fig. 5 have been
included to aid in the discussion of the contours in Fig. 4.
These additional illustrations comprise instantaneous slices
along the (y, r) plane at 20� and 70� wake ages with a line
identifying the plane at y/R = -0.05 on which the con-
tours of Fig. 4 are viewed.
Concerning the contour levels in Fig. 4, the mean axial
(downwash) and radial (contraction) velocities are of
similar levels, as expected, since they collectively display
the features associated with vortex swirl. Likewise, as out-
of-plane velocities manifest contributions from the maxi-
mum axial velocity in the vortex core along with the global
swirl velocity (which is small), the out-of-plane velocities
are then expected to be smaller than the downwash and
contraction velocities, as seen in Fig. 4c.
Upon closer inspection of the contours in Fig. 4, several
features describing the trailed and shed wake are observed.
Foremost, at this particular y/R position, the principal
features in each quadrant are associated with two different
vortices. For example, if we consider the first quadrant only
(0�–90� wake age) and at 20� wake age, features depicted
between C2 and C3 are associated with the top portions of
the vortex emitted by blade 4, whereas motions corre-
sponding to the bottom portions of the vortex shed by blade
1 are depicted between C3 and C4 (the same lines corre-
sponding to C1, C2, C3 and C4 have also been drawn in
Fig. 5). In Fig. 4a, the axial velocity (depicting motions
parallel to the shaft axis) is negative between C2 and C3,
thereby indicating downward motions of the inner (high-
speed) portion of the vortex (shed from blade 4), whereas it
is positive between C3 and C4 to reflect upward motions of
the outer (low-speed) portion of the vortex from blade 1.
Downward motions are shown to be a factor of six larger in
amplitude due to larger convective forces in the higher
speed regions of the flow. Likewise, in Fig. 4b, the radial
velocity (depicting motions perpendicular to the shaft axis),
is negative between C2 and C3 within a 60� wake age to
reflect the top portion of the vortex from blade 4 rotating
toward the high-speed regions of the slipstream. Between
C3 and C4, and nearly 60�–90� wake age, the radial
velocity is positive and captures the bottom portion of the
vortex from blade 1 as it rotates outward toward the low-
speed regions of the flow. As for contours illustrating the
azimuthal component of velocity in Fig. 4c, this compo-
nent is dominant in both the shear layer and vortex core
regions of the flow; this is unlike the in-plane components
which are only dominant in the vortex core region. The
blade wake consistently passes through this y/R position at
30� wake age.
A high degree of similarity is observed between the
topographies of each quadrant, which confirms consistency
in the flow properties at this axial position. A more rigorous
examination at y/R = -0.05, -0.10 and -0.15 was per-
formed by Mula et al. (2012) and showed a slight break-
down at distances further away from the rotor plane. More
specifically, consistency was found to break first in the
radial velocity distribution at y/R = -0.10 and then in the
axial and out-of-plane components at y/R = -0.15. This
suggests that there are asymmetries present in the wake of
this rotor. Evidence of this will be demonstrated in sub-
sequent discussions pertaining to the slipstream boundary.
0 0.1 0.2 0.3 0.4 0.50
1
2
3
4
5
6
7SN
R
horizontalvertical
Fig. 3 SNR along the horizontal and vertical lines drawn in Fig. 2b
Exp Fluids (2013) 54:1600 Page 5 of 14
123

3 Analysis techniques
In an effort to track the location of the vortices from each
PIV snap-shot, a method for determining the location of the
vortex center is required. In this regard, a number of
schemes have been proposed for identifying vortex cores;
for a comprehensive review, see Chakraborty et al. (2005),
Cucitore et al. (1999), McAlister (2003) and van der Wall
and Richard (2006). Of particular interest are the well-
known Q and k2 criteria of Hunt et al. (1988) and Jeong
and Hussain (1995), respectively. Likewise, centroid of
vorticity and normalized-helicity (Levy et al. 1990) have
become common metrics for correcting for vortex wander;
a comparative study of these various techniques, as they
are applied to problems in rotorcraft, can be found in the
open literature (Ramasamy et al. 2009).
Because the aforementioned methods are based on
divergences of the velocity field, their accuracies in pin-
pointing the location of the vortex core have been the
subject of scrutiny. To this end, Graftieaux et al. (2001)
proposed a non-Galilean–invariant method which we will
(a)
1 0.95 0.9 0.85 0.8
−0.1
−0.05
0
yR
r R
V1
V4
C1C2C3C4
(b)
1 0.95 0.9 0.85 0.8
−0.1
−0.05
0
V1
V4
yR
r R
C1C2C3C4
Fig. 5 Average sub-sampled vector map at a 20� wake age and b 70�wake age. V1 and V4 denote the vortices shed from blades 1 and 4,
respectively. The line at y/R = -0.05 identifies the plane along
which the contours in Fig. 4 are generated
(a)
330
150
300
120
270
90
240
60
210
30
180 0
−0.12
−0.1
−0.08
−0.06
−0.04
−0.02
0
0.02
C1
C2
C3
C4
(b)
330
150
300
120
270
90
240
60
210
30
180 0
−0.12
−0.1
−0.08
−0.06
−0.04
−0.02
0
0.02
C1
C2
C3
C4
(c)
330
150
300
120
270
90
240
60
210
30
0081
0.01
0.02
0.03
0.04
0.05
0.06
C1
C2
C3
C4
Fig. 4 Contours of the a axial (u), b radial (v) and c azimuthal
(w) components of the mean velocity at axial position y/R = -0.05.
Contour levels are normalized by XR. Center corresponds to the radial
position: r/R = 0.733 with concentric circles (dashed lines) C1, C2,
C3, C4 corresponding to r/R = 0.799, r/R = 0.865, r/R = 0.931
and r/R = 0.997, respectively. The outer solid line identifies
r/R = 1.063, from the rotor hub axis
b
Page 6 of 14 Exp Fluids (2013) 54:1600
123

consider as part of our analysis. This C1-method, however,
possesses restrictions that are common to others. In par-
ticular, poor seeding levels in the core of the vortex
degrade the accuracy of the estimated vectors, thus making
corrections for aperiodicity problematic. In this regard, an
additional method based on the geometric center of the
vortex is employed, which considers only those regions of
the vortex where measurements are believed to be accurate.
By instituting a conservative level of filtering to the SNRs
of the PIV data, only regions in the vortex core residing in
close proximity to the peak swirl velocity are considered
valid. Corrections for vortex aperiodicity are then deter-
mined from an estimate of the geometric center using the
peak swirl velocity. In what follows, a brief outline of these
techniques is provided followed by a comparison of their
results.
3.1 Centroid of Q (CoQ)
The centroid of Q determines the area center of scalar Q as
described by van der Wall and Richard (2006). The second
invariant, Q, comprises the symmetric (K) and skew-
symmetric (P) components of the velocity gradient tensor,
defined as,
Q ¼ 1
2ðu2
i;i � ui;j uj;iÞ ¼ �1
2ðui;juj;iÞ ¼
1
2ðkPk2 � kKk2Þ
ð1Þ
where kPk ¼ tr½PPt�1=2; kKk ¼ tr½KKt�1=2and Kij ¼ 1
2
ðui;j þ uj;iÞ; Pij ¼ 12ðui;j � uj;iÞ. Subscripts are written to
define the derivative of the first subscript with respect to
the second where i, j = 1, 2, 3. Thus, the region of
vorticity intensity is identified by the region of positive
Q. If one wishes to pinpoint a center for the vortex core,
then they may choose to consider the centroid of the
positive Q region; hence, centroid of Q (van der Wall and
Richard 2006). Here the centroid of Q (Yc, Rc) is
determined as,
ðYc;RcÞ ¼P
yQðy; rÞP
Qðy; rÞ ;P
rQðy; rÞP
Qðy; rÞ
� �
: ð2Þ
This is analogous to the center of mass approach where
the numerator on the right-hand side of (2) would represent
the sum of mass moments about the respective axis while
the denominator would represent the total mass (Mula et al.
2011). For this centroid of Q approach, only those regions
with Q(y,r) [ 0 are considered.
3.2 Centroid of vorticity
The centroid of vorticity is similar to the CoQ method
previously described. However, the unavailability of
vorticity in all three directions reduces vorticity to the
following simplified expression,
xw ¼ov
oy� ou
or: ð3Þ
The vortex center using this method is identified as the
centroid of xw on 2-D slices (y, r) of the rotor slipstream
where measurements are performed.
3.3 Normalized-helicity
Helicity was first introduced by Levy et al. (1990) and is
defined as the cosine of the angle between velocity and
vorticity and is hence called normalized-helicity. Because
of the unavailability of vorticity in all three directions, the
expression for normalized-helicity reduces to,
Hw ¼w � xw
jujjxwj: ð4Þ
In the normalized-helicity method, vortex core lines are
identified by first locating maximal points of normalized-
helicity on cross-sectional planes from which a core line is
grown by tracing a streamline through maximal points. Hence,
in the current study, vortex centers, using normalized-helicity,
are identified as maximal normalized-helicity points on
each of the 2D slices through the rotor slipstream. For
the CoQ, centroid of vorticity and normalized-helicity
techniques, divergences are performed using first-order
central differencing.
3.4 C1-Method
The C1-method is a non-Galilean invariant approach
introduced by Graftieaux et al. (2001) which provides a
simple and robust way to identify centers of vortical
structures in a flow. This method defines a scalar function
C1 as,
C1ðPÞ ¼1
N
X
S
ðPM � UMÞ � ez
jPMjjUMj; ð5Þ
where PM defines the radius vector between a fixed point
P in the measurement domain and all other points M, for a
given estimate of C1ðPÞ. Likewise, S is the region
enclosing M; ez is the unit vector normal to the measure-
ment plane and UM is the total velocity vector at point
M. Details of the above expression can be found in Graf-
tieaux et al. (2001) and Kindler et al. (2010). The vortex
center is identified by a point where C1 is maximum. Being
an integral-based approach, the results are not corrupted by
noise introduced by divergences of the velocity field,
albeit, the vortex center still relies on an accurate assess-
ment of the velocity inside the vortex core where seeding is
poor.
Exp Fluids (2013) 54:1600 Page 7 of 14
123

3.5 Geometric center
Once again, poor seeding due to strong centrifugal forces
acting inside the vortex core results in the deletion of
displacement vectors that fail to meet a satisfactory SNR
threshold. Missing vectors are typically interpolated using
a nearest neighbor type approach which raises concerns
regarding the accuracy of the interpolation. However,
Fig. 3 illustrates acceptable SNR levels leading up to, and
outside, the peak swirl velocity. Therefore, in the geo-
metric center approach, the center of the vortex core is
based on the location of peak swirl velocity and not the
velocity inside the core. This provides confidence in the
bounds used to define the geometry of the vortex and hence
the location of the vortex core. A demonstration of this is
shown in Fig. 6 from a raw PIV vector map using lightly
shaded regions to identify where Q [ 0 with dark circles
depicting locations of peak swirl velocity. Remarkable
similarities in the boundaries of positive Q and the peak
swirl velocity are manifest. The geometric center is then
identified from the boundaries defined by the peak swirl
velocity and is done so using two different approaches. The
first of these applies a best fit ellipse to the bounds of the
peak swirl velocity whereby the geometric center is iden-
tified as the center of this ellipse (referred hereafter as GC-
ellipse). In the second approach, the geometric center is
identified as the average location of all points confined by
the bounds of the peak swirl velocity (referred hereafter as
GC-average). We will show later that these two approaches
produce indistinguishable results.
The location of the vortex center for each of the three
vortices in the measurement window captured by the PIV
system are analyzed separately. Figure 7 shows a sub-
sampled PIV vector map at 40� wake age with the vortex
centers identified using CoQ, maximum-normalized-heli-
city, centroid-of-vorticity, the C1-method and geometric
center (both approaches) to demonstrate the subtle differ-
ences among the techniques. All methods are applied to the
250 PIV snap–shots at every wake age from which the
position of each vortex is tracked. The results of this are
shown in Fig. 8 for a wake age of w = 40� using the
CoQ approach. Open circles mark the average location of
the vortices based on the 250 PIV snap-shots. It can be seen
from this illustration how the region of space over which the
vortex wanders increases with vortex age. Close inspection
reveals how vortex 3 encompasses nearly three times the
region of space as vortex 1. Heyes et al. (2004) showed how
wandering amplitudes of the tip vortex increase linearly
with streamwise distance; similar trends are observed here.
4 Discussion of results
4.1 Slipstream boundary
Based on a systematic series of measurements of a rotor in
hover, Landgrebe (1972) showed that the axial and radial
coordinate of the tip vortex could be estimated using the
following approximate relations:
y
R¼
k1wv; 0�wv� 2pb
yR
� �wv¼2p
b
þk2 wv � 2pb
� �; wv 2p
b
(
ð6Þ
r
R¼ Aþ ð1� AÞe�gwv ð7Þ
where b is the number of blades, the constant k1 is the
vertical transport velocity of the tip vortex divided by the
rotor tip speed and can be uniquely determined from
known values of CT/r as,
0 0.2 0.4
0
0.2
0.4
r c
yc
Fig. 6 Q method applied to a sample vortex at 250� vortex age. Dark
circles identify locations of peak swirl velocity
1 0.95 0.9 0.85
−0.2
−0.15
−0.1
−0.05
0
r R
yR
Fig. 7 Sub-sampled PIV vector map at 40� wake age. Vortex centers
detected using CoQ (circle), maximum-normalized-helicity (square),
centroid-of-vorticity (diamond), C1-method (triangle-up), GC-ellipse
(star) and GC-average (triangle-down)
Page 8 of 14 Exp Fluids (2013) 54:1600
123

k1 ¼ �0:25ðCT=rþ 0:001h1degÞ; ð8Þ
while the constant k2 is the tangent of the local pitch angle
of the contracted helix (bw) of the tip vortex in the stable
near-field region described by,
k2 ¼ �ð1:41þ 0:0141h1degÞffiffiffiffiffiffiffiffiffiffiffiffiffiffiffiðCT=2Þ
p: ð9Þ
Likewise, radial coordinates can be determined by
substituting A = 0.78 and g = 0.145 ? 27CT into Eq. (7).
With the blade loading estimated from BEMT and for
untwisted blades, h1deg = 0, the radial and axial
displacement measurements from the PIV surveys are
compared with the estimate provided by way of
Landgrebe’s model. The results from this are shown in
Fig. 9a with the axial and radial displacements of vortices
shedding from blades 2 and 3 agreeing well with Landgrebe
(1972). Differences in the displacements of vortices from
blades 1 and 4 are manifest and are attributed to the rotor
wake asymmetry produced by dissimilarities in blade
tracking; tumbling between vortices 1 and 4 are shown to
commence at a wake age of 210� (this corresponds to a
vortex age of 210� for vortex 1 and a vortex age of 300� for
vortex 4). Rotor wake asymmetry is also evident in the
vortex trajectories demonstrated in Fig. 9b and are difficult
to remove for multibladed rotor studies. Nevertheless, these
asymmetries were not found to impact the findings. Proof of
this will be demonstrated in subsequent analysis of the
dynamical characteristics of vortex wander in hover.
4.2 Dynamics of vortex wander
The principal motivation of this study is to develop an
understanding for the dynamical characteristics of the blade
tip vortex motion during hover. Previous studies on the
aperiodic characteristics of the tip vortex locations using
flow visualization and LDV techniques on one-bladed and
two-bladed rotors by Leishman (1998) showed that aperi-
odic fluctuations of the vortex core position at older wake
ages appeared slightly greater in the radial direction than in
the axial direction. Recent studies by Kindler et al. (2010)
using a stereo-PIV system on a full-scale four-bladed rotor,
found that the aperiodicity was not isotropic but was larger
in the normal direction than in the spanwise (radial) direc-
tion. The findings of Kindler et al. (2010) were confined to a
vortex age of 30� but were performed on a full-scale heli-
copter in hover while operating under realistic blade loading
and compressibility effects (M = 0.64). Likewise, Beresh
et al. (2010) found no Mach number dependence for speeds
ranging between Mach 0.5 and 0.8 of a fin trailing vortex
(fixed wing study). And so, for the time being, we expect the
results from this analysis to be independent of Reynolds
number and compressibility effects.
1 0.95 0.9 0.85
−0.2
−0.15
−0.1
−0.05
0
r R
yR
Vortex 1 ( v 40 )
Vortex 4 ( v 130 )
Vortex 3 ( v 220 )
Fig. 8 Location of vortex centers at 40� wake age using the
CoQ approach. Average centers are identified by large open circles
(a)
0 50 100 150 200 250 3000
0.2
0.4
0.6
0.8
1
ψv [deg]
Wak
edi
spla
cem
ents Radial displacements
Axial displacements
Vortex 1
Vortex 2
Vortex 3
Vortex 4
(b)
1 0.95 0.9 0.85−0.25
−0.2
−0.15
−0.1
−0.05
0
r R
yR
Vortex 1
Vortex 2
Vortex 3
Vortex 4
Fig. 9 a Estimates of radial (r/R) and axial (y/R) wake displacements
from the current measurements (diamonds, stars, squares and circles)
compared with the predictions from Landgrebe (1972) (dashed). The
ordinate axis has been normalized by the blade radius. b Slipstream
boundary from the current measurements
Exp Fluids (2013) 54:1600 Page 9 of 14
123

In Fig. 10, vortex wander, tracked by way of the
CoQ approach, is shown for the vortex shed from blade 2
and for vortex ages between 10�–80�, 100�–170� and 190�–
260� (similar findings were observed for vortices shed from
blades 1, 3 and 4 until vortex tumbling). (yH; rH) defines
coordinates from the mean vortex center as opposed to the
rotor hub. A clear pattern is manifest. At each vortex age,
the core has a preferred direction of wander which shows
that aperiodic fluctuations in the tip vortex locations are
anisotropic. The preferred direction of wander rotates with
increasing vortex age and the amount of wander increases
with increasing vortex age. The above analysis assumes
that the measurement plane was normal to the vortex axis.
This assumption was scrutinized by calculating the rotation
angles about the radial and axial axes as described by van
der Wall and Richard (2006) (required to determine the
plane normal to the true vortex axis). The corrections were
found to have an indistinguishable effect on the wander
pattern. These patterns persist up to a vortex age of
wv = 260�. Similar observations were found using max-
imum-normalized-helicity, centroid-of-vorticity, the C1–
method and both geometric center approaches; a more
comprehensive comparison of these various methods are
provided by Mula et al. (2012). These findings support the
observations of Kindler et al. (2010), however, we show
here that the anisotropic aperiodic motion of the tip vortex
persists at all vortex ages in the measurement envelope.
The exact mechanisms responsible for inducing the pre-
ferred wander direction and wander rotation are not clearly
understood. It is postulated that these are the consequence
of linear wake instabilities (Widnall 1972; Ohanian et al.
2012) that become excited by perturbations in the blade tip
motion.
Figure 11 demonstrates the vortex wander with the
95 % confidence region overlaid the mean slipstream
boundary for an arbitrarily chosen vortex (vortex shed
from blade 2) using the CoQ method. The illustration
shows that the principal wandering axis aligns itself
orthogonal to the mean slipstream boundary. In order to
determine this more definitively, the angle (a) between
the preferred direction of wander and the slope of the
slipstream boundary is determined at every vortex age,
following the schematic in Fig. 12a. The results of this
are shown in Fig. 12b. At any vortex age, the slope of the
slipstream boundary can be determined by the direction of
the velocity of the vortex at that age. It is evident from
Fig. 12b that the direction of wander is predominantly
orthogonal to the mean slipstream boundary. Here, we
have plotted the results using all methods to demonstrate
the insensitivity of this behavior to the analysis technique
used. Noticeable deviations from orthogonality at 10� and
80� vortex ages is attributed to the close proximity of the
vortex to the outgoing and oncoming blades, respectively,
which resulted in inaccurate slope estimates at these
vortex ages. Concurrent studies by Karpatne et al. (2012)
observed nearly identical results using a vortex ring
emitter model. Likewise, the consistency of these findings
for all vortices shed from the four blades was shown by
r R
yR
ψv 10
ψv 20
ψv 30
ψv 40
ψv 50
ψv 60
ψv 70
ψv 80
r R
yR
ψv 100
ψv 110
ψv 120
ψv 130
ψv 140
ψv 150
ψv 160
ψv 170
r R
yR
ψv 190
ψv 200
ψv 210
ψv 220
ψv 230
ψv 240
ψv 250
ψv 260
(a)
(b)
(c)
Fig. 10 Wander of vortex from blade 2 overlaid the 95 % confidence
region for vortex ages between a 10�–80�, b 100�–170�, c 190�–260�using CoQ. Dashed lines are separated by yH=R ¼ 0:03; rH=R ¼ 0:03
Page 10 of 14 Exp Fluids (2013) 54:1600
123

Mula et al. (2012) and suggests that aperiodic vortex
motion occurs irrespective of asymmetries in the
slipstream.
The shape of the vortex core at 220� vortex age (arbi-
trarily chosen) is shown in Fig. 13 with and without cor-
rections for aperiodicity. The boundaries of the corrected
and uncorrected vortices are defined using the Q criterion
using squares and circles to identify locations where Q [ 0,
respectively. These boundaries are restricted by the reso-
lution of the PIV vector map and so the vortex core is fitted
with a best possible ellipse. As expected, the size and shape
of the uncorrected vortex is remarkably different than that
of the corrected vortex (see Fig. 13) due to wandering.
As for the evolutionary characteristics of the vortex
wander, the ratio ri/c is plotted in Fig. 14 where ri is the
standard of deviation of vortex wander and is separated into
components acting normal (i = 1) and tangential (i = 2) to
the slipstream boundary. A third order least squares fit,
based on the average of all trends produced by the various
aperiodicity correction techniques, has been inserted to aid
in the interpretation. It is seen here how wandering motions
acting normal to the slipstream boundary develop much
earlier than the tangential wandering motions. By 180�vortex age, both normal and tangential wandering motions
appear to grow at similar rates. By 260�, the normal scatter
appears to be at its minimum rate of change, while the
tangential scatter is undergoing its maximum rate of
change. It is postulated that both will eventually converge
toward equal measures of spatial displacement further
downstream where the rotor wake no longer contracts, and
vortex wander can be assumed isentropic.
4.3 Dynamics of the rotor slipstream
The linear stability of a helical vortex filament to in-plane
sinusoidal perturbations (Widnall 1972) revealed three
1 0.95 0.9 0.85−0.25
−0.2
−0.15
−0.1
−0.05
0
r R
yR
Fig. 11 Mean slipstream boundary (stars: wv = 10�–80�, circles:
wv = 100�–170�, and squares: wv = 190�–260�) with the 95 %
confidence region at each vortex age using CoQ for the vortex from
blade 2
(a)
α
slipstream slope
mean slipstream boundary
major axis
95% confidence ellipse
minor axis
(b)
0 45 90 135 180 225 27030
60
90
120
150CoQHelicityVorticityΓ1GC -ellipseGC -average
ψv [deg.]
α[d
eg.]
Fig. 12 a Schematic used to describe the orientation of wander with
respect to the mean slipstream boundary. b Quantitative measure of
the wander orientation with respect to the mean slipstream boundary
for the vortex from blade 4 using various aperiodicity correction
techniques
−0.2 0 0.20.1−0.1
−0.2
−0.1
0
0.1
0.2
r c
yc
UncorrectedCorrected
Fig. 13 Boundaries of the vortex core identified by the Q criterion
for a vortex at 220� vortex age and fitted to a best possible ellipse
(dashed lines with square data points indicate before aperiodicity
correction, while solid lines and circles are designated for after
correction)
Exp Fluids (2013) 54:1600 Page 11 of 14
123

instability mode shapes: a short-wave mode, a mutual
inductance mode and a long-wave instability. And so, it is
highly likely that the shape of the slipstream is dynamic;
always undergoing rigid-body-like translation, expansion
and contraction effects or other wavenumber type motions.
If so, then one would expect the relative in-plane motion of
the vortices to act as indicators of this phenomenon.
In order to quantify the relative in-plane motion between
vortices, the radial and axial locations of the vortex center
for each of the vortices in the PIV measurement window
are analyzed separately using CoQ. Restrictions on the size
of the image plane, required for accurate PIV measure-
ments, limits the analysis to only three vortices at a given
near-field position (see Fig. 7). A schematic is shown in
Fig. 15 where (yH; rH) define the coordinates from the
mean vortex center. The three vortices depicted in Fig. 15
are labeled vortex 1, 4 and 3 as they form from blades 1, 4
and 3, respectively. Further, displacements are normalized
with the standard deviation (ry, rr) of the corresponding
component to eliminate the amplitude dependence brought
upon by the spatial growth in the wander motion with
increasing vortex age.
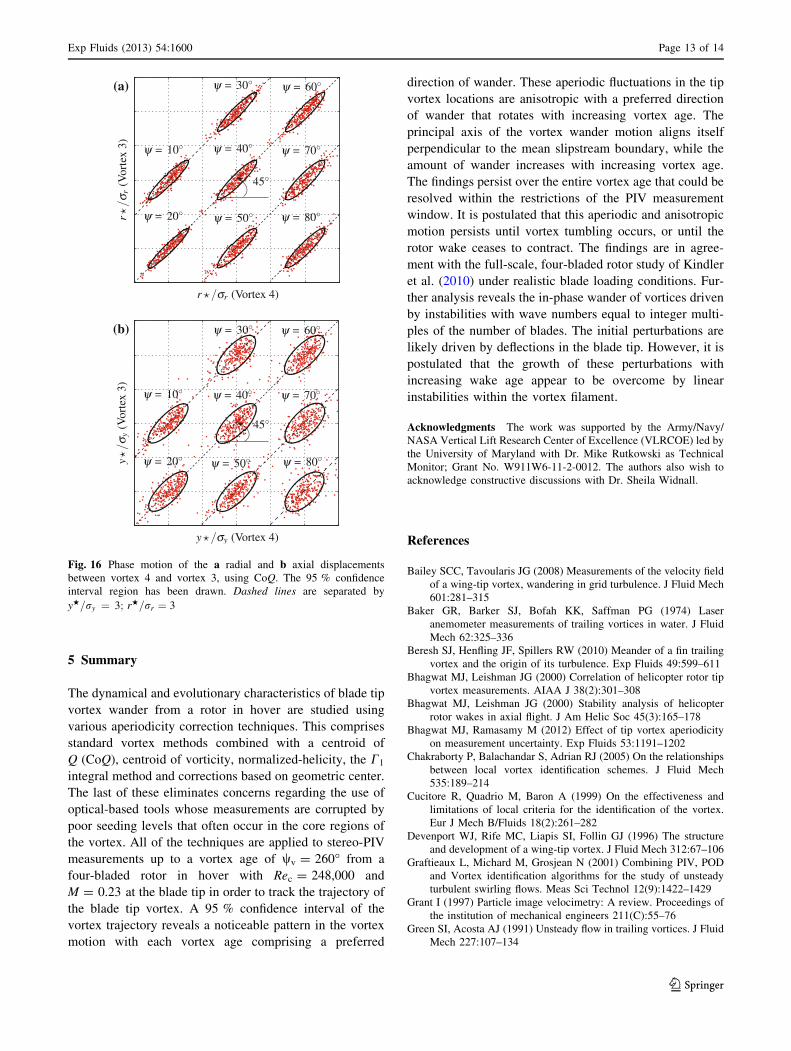
Figure 16a, b depict instantaneous displacements in the
axial and radial directions, respectively, of vortex 4 with
vortex 3 for wake ages between 10� and 80�. Once again, a
95 % confidence region is constructed which identifies a
preferred direction of orientation inclined at 45� to the
horizontal axis at all wake ages. Similar findings were
observed between vortex 1 and 4, and vortex 1 and 3 (Mula
et al. 2012). Because these displacements are confined to
an analysis between vortices within one quadrant of the
slipstream and up to only 260� vortex age, predictions
about the dynamics of the rotor slipstream beyond 260�vortex age are purely hypothetical. Hence, from Fig. 16, it
can be deduced that all three vortices in the measurement
window wander in phase instantaneously in the radial and
axial directions. This finding conveys a number of plausi-
ble scenarios concerning the dynamics of the slipstream.
The first of these is a semi-rigid-body translation of the
slipstream boundary driven by the formation of long-wave
instability modes. For this to be the case, non-integer
multiples of the mode number could be present so long as
the mode number is on the order of tenths; only one zero-
crossing per several revolutions of the helix. In other
words, non-integer number instabilities (which can form in
a helix) will cause in-plane motions of the vortex filament
to be spatially out of phase; Fig. 16 shows these motions to
be in phase. Likewise, small-wave instabilities comprising
mode numbers made up of integer multiples may also be
present and for the same reasons just described.
Bhagwat and Leishman (2000) applied linear stability
analysis to a free vortex wake model of a rotor in hover to
show that the blade tip vortex filament is dominated by two
types of instabilities. The first of these instabilities com-
prise wavenumbers with integer multiples of the number of
blades and are found in the near-field region prior to vortex
tumbling. The second of these, which they show to have a
stronger growth rate than the first, encompasses wave-
numbers with half integer multiples of the number of
blades and are responsible for vortex tumbling. Hence, the
in-phase wander of vortices observed here suggest the
dominance of wavenumbers in the measurement envelope
comprising integer multiples of the number of blades.
0 45 90 135 180 225 2700
0.02
0.04
0.06
0.08
0.1
0.12
0.14
0.16CoQHelicity
Vorticity
GammaGC -ellipse
GC -average
normaltangential
ψv [deg.]
σ ic
Fig. 14 Average variation in the normal (open symbols) and
tangential (closed symbols) displacements of the vortex relative to
the blade chord
y
r
Rotor disc plane
Vortex 1
Vortex 4
Vortex 3
Mean slipstream boundary
Instantaneous slipstream boundary
r
r
r
y
y
y
Fig. 15 Schematic of vortex wander and coordinate system (for in-
plane motions) with respect to the mean slipstream boundary
Page 12 of 14 Exp Fluids (2013) 54:1600
123
5 Summary
The dynamical and evolutionary characteristics of blade tip
vortex wander from a rotor in hover are studied using
various aperiodicity correction techniques. This comprises
standard vortex methods combined with a centroid of
Q (CoQ), centroid of vorticity, normalized-helicity, the C1
integral method and corrections based on geometric center.
The last of these eliminates concerns regarding the use of
optical-based tools whose measurements are corrupted by
poor seeding levels that often occur in the core regions of
the vortex. All of the techniques are applied to stereo-PIV
measurements up to a vortex age of wv = 260� from a
four-bladed rotor in hover with Rec = 248,000 and
M = 0.23 at the blade tip in order to track the trajectory of
the blade tip vortex. A 95 % confidence interval of the
vortex trajectory reveals a noticeable pattern in the vortex
motion with each vortex age comprising a preferred
direction of wander. These aperiodic fluctuations in the tip
vortex locations are anisotropic with a preferred direction
of wander that rotates with increasing vortex age. The
principal axis of the vortex wander motion aligns itself
perpendicular to the mean slipstream boundary, while the
amount of wander increases with increasing vortex age.
The findings persist over the entire vortex age that could be
resolved within the restrictions of the PIV measurement
window. It is postulated that this aperiodic and anisotropic
motion persists until vortex tumbling occurs, or until the
rotor wake ceases to contract. The findings are in agree-
ment with the full-scale, four-bladed rotor study of Kindler
et al. (2010) under realistic blade loading conditions. Fur-
ther analysis reveals the in-phase wander of vortices driven
by instabilities with wave numbers equal to integer multi-
ples of the number of blades. The initial perturbations are
likely driven by deflections in the blade tip. However, it is
postulated that the growth of these perturbations with
increasing wake age appear to be overcome by linear
instabilities within the vortex filament.
Acknowledgments The work was supported by the Army/Navy/
NASA Vertical Lift Research Center of Excellence (VLRCOE) led by
the University of Maryland with Dr. Mike Rutkowski as Technical
Monitor; Grant No. W911W6-11-2-0012. The authors also wish to
acknowledge constructive discussions with Dr. Sheila Widnall.
References
Bailey SCC, Tavoularis JG (2008) Measurements of the velocity field
of a wing-tip vortex, wandering in grid turbulence. J Fluid Mech
601:281–315
Baker GR, Barker SJ, Bofah KK, Saffman PG (1974) Laser
anemometer measurements of trailing vortices in water. J Fluid
Mech 62:325–336
Beresh SJ, Henfling JF, Spillers RW (2010) Meander of a fin trailing
vortex and the origin of its turbulence. Exp Fluids 49:599–611
Bhagwat MJ, Leishman JG (2000) Correlation of helicopter rotor tip
vortex measurements. AIAA J 38(2):301–308
Bhagwat MJ, Leishman JG (2000) Stability analysis of helicopter
rotor wakes in axial flight. J Am Helic Soc 45(3):165–178
Bhagwat MJ, Ramasamy M (2012) Effect of tip vortex aperiodicity
on measurement uncertainty. Exp Fluids 53:1191–1202
Chakraborty P, Balachandar S, Adrian RJ (2005) On the relationships
between local vortex identification schemes. J Fluid Mech
535:189–214
Cucitore R, Quadrio M, Baron A (1999) On the effectiveness and
limitations of local criteria for the identification of the vortex.
Eur J Mech B/Fluids 18(2):261–282
Devenport WJ, Rife MC, Liapis SI, Follin GJ (1996) The structure
and development of a wing-tip vortex. J Fluid Mech 312:67–106
Graftieaux L, Michard M, Grosjean N (2001) Combining PIV, POD
and Vortex identification algorithms for the study of unsteady
turbulent swirling flows. Meas Sci Technol 12(9):1422–1429
Grant I (1997) Particle image velocimetry: A review. Proceedings of
the institution of mechanical engineers 211(C):55–76
Green SI, Acosta AJ (1991) Unsteady flow in trailing vortices. J Fluid
Mech 227:107–134
r σr (Vortex 4)
rσ r
(Vor
tex
3) ψ 10
ψ 20
ψ 30
ψ 40
ψ 50
ψ 60
ψ 70
ψ 80
45
y σy (Vortex 4)
yσ y
(Vor
tex
3) ψ 10
ψ 20
ψ 30
ψ 40
ψ 50
ψ 60
ψ 70
ψ 80
45
(a)
(b)
Fig. 16 Phase motion of the a radial and b axial displacements
between vortex 4 and vortex 3, using CoQ. The 95 % confidence
interval region has been drawn. Dashed lines are separated by
yH=ry ¼ 3; rH=rr ¼ 3
Exp Fluids (2013) 54:1600 Page 13 of 14
123

Gursul I, Xie A (1999) Origin of vortex wandering over delta wings.
J Aircraft 37(2):348–350
Han YO, Leishman JG, Coyne AJ (1997) Measurements of the
velocity and turbulence structure of a rotor tip vortex. AIAA J
35(3):477–485
Heyes AL, Jones RF, Smith DAR (2004) Wandering of wing-tip
vortex. In: Proc 12th Int Symp Appl Laser Tech Fluid Mech,
Lisbon, Portugal
Hunt JCR, Wray AA, Moin P (1988) Eddies, stream, and convergence
zones in turbulent flows. Center for Turbulence Research Report:
CTR-S88:193–208
Iversen JD, Corsiglia VR, Park S, Backhus DR, Brickman RA (1978)
Hot-wire, laser-anemometer, and force measurements of inter-
acting trailing vortices. J Aircraft 16(7):448–454
Jacquin L, Fabre D, Geffroy P, Coustols E (2001) The properties of a
transport aircraft wake in the extended near field: an experi-
mental study. AIAA Paper 2001–1038
Jeong J, Hussain F (1995) On the identification of a vortex. J Fluid
Mech 285:69–94
Karpatne A, Sirohi J, Mula SM, Tinney CE (2012) Investigation of tip
vortex aperiodicity in hover. In: American helicopter society
68th annual forum, Fort Worth, USA, May 1–3
Kindler K, Mulleners K, Richard H, van der Wall BG, Raffel M
(2010) Aperiodicity in the near field of full-scale rotor blade tip
vortices. Exp Fluids 50(6):1601–1610
Landgrebe AJ (1972) The wake geometry of a hovering helicopter
rotor and its influence on rotor performance. J Am Helic Soc
17(4):3–15
Leishman JG (1998) Measurements of the aperiodic wake of a
hovering rotor. Exp Fluids 25:352–361
Leishman JG, Baker A, Coyne A (1996) Measurements of rotor tip
vortices using three-component laser doppler velocimetry. J Am
Helic Soc 41(4):342–353
Levy Y, Degani D, Seginer A (1990) Graphical visualization of
vortical flows by means of helicity. AIAA J 28(8):1347–1352
Martin PB, Leishman JG, Pugliese GJ, Anderson SL (2000)
Stereoscopic PIV measurements in the wake of a hovering rotor.
In: American helicopter society 56th annual forum, Virginia,
USA, May 2–4
McAlister KW (2003) Rotor wake development during the first
revolution. In: American helicopter society 59th annual forum,
Phoenix, USA, May 6–8
Melling A (1997) Tracer particles and seeding for particle image
velocimetry. Meas Sci Technol 8(12):1406–1416
Mula SM, Stephenson J, Tinney CE, Sirohi J (2011) Vortex jitter in
hover. In: American helicopter society southwest region techni-
cal specialists meeting, Fort Worth, USA, February 23–25
Mula SM, Stephenson J, Tinney CE, Sirohi J (2012) Dynamical and
evolutionary characteristics of the tip vortex from a four-bladed
rotor in hover. In: American helicopter society 68th annual
forum, Fort Worth, USA, May 1–3
Ohanian CV, McCauley GJ, Savas O (2012) A visual study of vortex
instabilities in the wake of a rotor in hover. J Amer Heli Soc
57(042005):1–8
Raffel M, Willert C, Kompenhans J (1998) Particle image velocime-
try - A practical guide. Springer, Berlin
Ramasamy M, Johnson B, Huismann T, Leishman JG (2009) Digital
particle image velocimetry measurements of tip vortex charac-
teristics using an improved aperiodicity correction. J Am Helic
Soc 54(012004):1–13
Ramasamy M, Paetzel R, Bhagwat WJ (2011) Aperiodicity correction
for rotor tip vortex measurements. In: American helicopter
society 67th annual forum, Virginia Beach, USA, May 3–5
Richard H, Bosbach J, Henning A, Raffel M, Willert C, van der Wall
G (2006) 2C and 3C PIV measurements on a rotor in hover
condition. In: Proc 13th Int Symp Appl Laser Tech Fluid Mech,
Lisbon, Portugal
Sirohi J, Lawson MS (2012) Measurement of helicopter rotor blade
deformation using digital image correlation. J Optical Eng
51(4):43603
Stephenson JH, Mula SM, Tinney CE, Sirohi J (2012) Far wake
rotorcraft vortex tumbling. In: 50th AIAA Aerospace sciences
meeting and exposition, Nashville, USA, 2012–0425.
Thompson TL, Komerath NM, Gray RB (1988) Visualization and
measurement of the tip vortex of a rotor blade in hover.
J Aircraft 25(12):1113–1121
Tinney CE, Glauser MN, Ukeiley LS (2008) Low-dimensional
characteristics of a transonic jet. Part 1: Proper orthogonal
decomposition. J Fluid Mech 612:107–141
Tung C, Pucci SL, Caradonna FX, Morse HA (1981) The structure of
trailing vortices generated by model rotor blades. NASA
Technical Memorandum 81316
van der Wall BG, Richard R (2006) Analysis methodology for 3C-
PIV data of rotary wing vortices. Exp Fluids 40:798–812
Westerweel J (1998) Effect of sensor geometry on the performance of
PIV interrogation. In: Proc 9th Int Symp Appl Laser Tech Fluid
Mech, Lisbon, Portugal
Widnall SE (1972) The stability of a helical vortex filament. J Fluid
Mech 54(4):641–663
Page 14 of 14 Exp Fluids (2013) 54:1600
123
Recommended