1
Development of a Simplified Soft-Donor
Technique for Trivalent Actinide-
Lanthanide Separations
A thesis submitted to the University of Manchester for the degree of Doctor
of Philosophy in the Faculty of Engineering and Physical Sciences
2015
Madeleine Hilton Langford Paden
School of Chemistry
2
List of Tables
List of Figures
Abstract
Declaration
Copyright Statement
Acknowledgements
List of Symbols amp Units
List of Abbreviations amp Acronyms
Amino Acid Abbreviations
1 Introduction
11 The Actinides and Lanthanides
111 Background
112 Sources of the Actinides and Lanthanides
113 Properties of the 4f Elements
114 Properties of the 5f Elements
115 Relativistic Effects
116 Lanthanide and Actinide Contraction
117 Co-ordination Chemistry of the Lanthanides and
Actinides in Solution
1171 Hydrolysis
1172 Monodentate Ligands
1173 Chelates and Macrocycles
12 Analytical Methods
121 NMR Spectroscopy
122 Luminescence Spectroscopy
1221 Fluorescence and Phosphorescence
1222 Lanthanide Luminescence
1223 Actinide Luminescence
1224 Sensitised Luminescence and The Antennae
Effect
1225 Russell-Saunders Coupling
1226 Quenching
1227 Quenching in Lanthanides and Actinides
10
14
24
25
26
27
29
31
34
35
35
35
35
36
37
39
40
40
41
42
42
43
43
43
43
44
45
46
47
48
48
3
1228 Suitable Solvents for Luminescent Complexes
13 Nuclear Theory
131 Nuclear Power
132 The Nuclear Fuel Cycle
133 Spent Nuclear Fuel and Reprocessing
134 Solvent Extraction
1341 PUREX
1342 TRUEX
1343 DIAMEX
1344 SANEX
1345 iSANEX
1346 GANEX
1347 TRPO
1348 LUCA
1349 EXAm
137 TALSPEAK
1371 The Process
138 Reprocessing Summary
14 Project Objectives and Thesis Outline
References
2 Complexation Studies of Ln amp An with DTPA and Buffers
under TALSPEAK Conditions
21 Introduction to An-DTPA and Ln-DTPA Complexes
211 Stability of Ln-DTPA and An-DTPA Complexes
212 Co-ordination Chemistry of Ln-DTPA and An-DTPA
Complexes
22 Ln-DTPA Complexation Studies
221 1H NMR Studies of Ln-DTPA
222 Luminescence Studies of Ln-DTPA
23 An-DTPA Complexation Studies
231 1H NMR Studies of An-DTPA
232 Luminescence Studies of An-DTPA
50
51
51
52
53
55
55
57
59
60
62
63
65
67
68
69
69
74
75
77
81
81
82
83
84
84
86
88
88
89
4
24 Introduction to Buffer Interaction with Ln3+
and Ln-DTPA
Complexes
241 Interaction of Lactate with Ln3+
and Ln-DTPA
Complexes
242 Interaction of Amino Acids with Ln3+
and Ln-DTPA
Complexes
25 Studies on Buffer Interaction with M3+
and [M(DTPA)]2-
251 1HNMR Studies on Buffer Interactions
252 Luminescence Studies on Buffer Interactions
2521 Sensitisation Tests
2522 Aqueous Phase Lanthanide Studies without
Na5DTPA
2523 Aqueous Phase Lanthanide Studies with
Na5DTPA
2524 Aqueous Phase Actinide Studies with
Na5DTPA
253 Radiolysis Studies on Amino Acid Buffered Systems
2531 Previous Studies at the INL
2532 Irradiation Studies using Amino Acid Buffers
254 Buffer Interaction Summary
References
3 Solvent Extraction and Optimisation Studies with Amino Acid
Buffers
31 Previous Work at INL
311 L-alanine Studies
3111 pH Studies on L-alanine
3112 Concentration Effects
3113 Studies at pH 2
312 Other Amino Acids
32 L-alanine System Optimisation at pH 2
321 [Na5DTPA] Dependence (EuAm)
322 [HDEHP] Dependence (EuAm)
323 L-alanine Optimisation Summary
33 Other Amino Acid Studies
90
90
92
93
93
95
95
96
98
99
100
100
102
105
106
108
108
108
108
110
111
111
113
114
116
118
119
5
331 Initial Tests with Other Amino Acids
332 Studies with L-Histidine
34 Summary of Separations with Amino Acid Buffers
References
4 Studies using L-Glutathione as a Buffer in a TALSPEAK
System
41 Solvent Extraction and Separation using GSH
411 [L-Glutathione] and pH Dependence
4111 [GSH] Dependence without Na5DTPA
4112 [GSH] and pH Dependence with
Na5DTPA
412 [Na5DTPA] Dependence at pH 4
413 [HDEHP] Dependence at pH 4
42 Luminescence Studies using GSH with Eu3+
421 [GSH] and pH Dependence without Na5DTPA
4211 Aqueous Phase Studies
4212 Extraction Studies
422 [GSH] and pH Dependence with Na5DTPA
4221 Aqueous Phase Studies
4222 Extraction Studies
423 [Na5DTPA] Dependence at pH 4
4231 Aqueous Phase Studies
4232 Extraction Studies
424 [HDEHP] Dependence at pH 4
43 Radiolysis Studies using GSH at pH 4
431 Aqueous Phase Studies
432 Extraction Studies
44 Luminescence Studies using GSH with Dy3+
441 Dy3+
Complexation Studies
442 pH Dependence Studies
45 Luminescence Studies using GSH with Mixed Ln3+
Systems at pH 4
451 Complexation Studies
452 pH Dependence Studies
119
120
121
123
124
127
127
127
127
132
133
136
137
137
139
140
140
143
145
145
148
149
151
151
153
154
155
156
157
157
160
6
46 ICP-MS Studies with GSH
47 1H NMR Studies on GSH Systems
48 Summary and Conclusion of Glutathione Work
References
5 Modified DTPA Ligands as Combined Buffers and Soft Donors
in a TALSPEAK System
51 Ligand Synthesis
52 Luminescence Studies on Ligand Systems at pH 2 3 and 4
521 Aqueous Phase Studies
522 Extraction Studies
53 Radiolysis Studies on Ligand Systems at pH 2
531 Aqueous Phase Studies
532 Extraction Studies
54 Separation Work on Ligand Systems
541 AmEu Separation in Ligand Systems
542 Ln Separation in Ligand Systems
55 Summary and Conclusion of Modified DTPA Ligand
Work
References
6 Summary Conclusions and Future Work
61 Summary amp Conclusions
62 Future Work
References
7 Experimental Section
71 Chemicals and Reagents
711 Handling Radioisotopes at INL
72 Complexation studies of Ln3+
amp An3+
with amino acids in
TALSPEAK systems
721 Preparation of samples for luminescence studies
7211 Stock solutions
7212 Preparation of aqueous samples
7213 Preparation of extracted samples
163
166
170
173
174
175
176
176
179
183
183
184
185
186
187
190
191
192
192
198
200
201
201
201
201
201
201
202
202
7
722 Radiolysis of samples
7221 Preparation of Fricke solution
7222 Calculating dose rates
73 Solvent extraction and separation studies using amino
acids and glutathione at INL
731 Preparation of samples
7311 Stock solutions for amino acid studies
7312 [Na5DTPA] dependence SX samples for
amino acid studies
7313 [HDEHP] dependence SX samples for
amino acid studies
7314 Other amino acid SX samples for amino
acid studies
7315 Stock solutions for glutathione studies
7316 [GSH] dependence SX samples without
Na5DTPA
7317 [GSH] and pH dependence SX samples
with Na5DTPA
7318 [Na5DTPA] dependence SX samples for
GSH studies
7319 [HDEHP] dependence SX samples for
amino acid studies
732 Gamma counting
733 ICP-MS
74 Luminescence studies and solvent extraction using
glutathione at UoM
741 Preparation of luminescence samples
7411 Stock solutions for GSH studies
7412 Preparation of aqueous samples
7413 Preparation of extracted samples
742 Radiolysis of GSH samples
74 Modified DTPA Ligands
751 Synthesis of modified DTPA ligands
752 Characterisation of modified DTPA ligands by
MALDI-MS
203
203
203
205
205
205
205
205
206
206
206
206
207
207
207
208
208
208
208
209
209
210
210
210
210
8
753 Characterisation of modified DTPA ligands by
NMR spectroscopy
7531 1H NMR Spectroscopy
7532 13
C NMR Spectroscopy
754 Characterisation of modified DTPA ligands by
elemental analysis
755 Luminescence studies with modified DTPA
ligands
7551 Stock solutions
7552 Preparation of aqueous samples
7553 Preparation of extracted samples
7554 Radiolysis of ligand samples
76 Instruments
761 FTS MODEL 812 System 60
Co Irradiator
762 Edinburgh Instrument FP920 Phosphorescence
Lifetime Spectrometer
763 Packard Cobra II Gamma Counter
764 Bruker UltrashieldTM
400 NMR Spectrometer
References
Appendices
Appendix 1 - Emission spectra for [GSH] pH dependence
studies with DTPA in H2O
Appendix 2 - SFLnAm for varying GSH concentration over a
pH range of 2-4 with 005 M Na5DTPA after
extraction with 02 M HDEHP in dodecane
Appendix 3 - Natural pH values for modified DTPA ligands
(005 M) with Eu(NO3)3 (1 mM)
Appendix 4 - APPENDIX 4 - Emission spectra for Eu(NO3)3
with modified DTPA ligands in H2O
Appendix 5 - Emission spectra for radiolysis studies on
Eu(NO3)3 in H2O with DTPA-di(amino acid)
ligands
Appendix 6 - MALDI-MS spectrum for DTPA-(AlaOMe)2
211
211
213
215
216
216
216
216
216
217
217
217
218
218
219
220
220
222
223
224
226
228
9
Appendix 7 - 1H NMR spectrum for DTPA-(AlaOMe)2
Appendix 8 - 1H NMR spectrum for GSH
Appendix 8a - 1H NMR spectrum for Eu(NO3)3 + GSH
Total Word Count 50439
229
230
231
10
LIST OF TABLES
Table 11 Electronic properties of the lanthanides
Table 12 Electronic properties of the actinides
Table 13 Available oxidation states of the actinides and colours of
ions in solution where applicable
Table 14 Luminescence of lanthanide ions
Table 15 Luminescence of actinide ions
Table 16 Approximate compositions of SNF in Light Water
Reactors (LWR)
Table 21 Luminescence lifetimes and q values for Eu3+
with amino
acidslactate
Table 22 Luminescence lifetimes and q values for [Eu(DTPA)]2-
with amino acidslactate
Table 23 Separation factors for Eu3+
Am3+
in the presence of L-
alanine at 05 M under TALSPEAK conditions when subjected
to different doses of γ-radiation
Table 24 Luminescence lifetimes for aqueous and organic phases for
[Eu(DTPA)]2-
systems before and after irradiation at pH 36
Table 25 Luminescence lifetimes and q values for [Eu(DTPA)]2-
systems before and after irradiation at pH 36
Table 31 Distribution ratios and separation factors for a number of
L-alanine buffered TALSPEAK systems as pH and buffer
concentration are varied compared to a traditional lactic acid
system
Table 32 Distribution ratios and separation factors for a number of
amino acid buffered TALSPEAK systems
Table 33 Separation factors for L-alanine optimisation studies
Table 34 DAm values for L-alanine optimisation studies
Table 35 Separation factors and DAmEu values for traditional
TALSPEAK systems with different buffers at varying pH
values
Table 41 Eu3+
Am3+
distribution and separation for [GSH]
dependence with 005 M Na5DTPA at pH 4
11
Table 42 Eu3+
Am3+
distribution and separation for [Na5DTPA]
dependence with 05 M GSH buffer at pH 4
Table 43 Eu3+
Am3+
distribution and separation for [HDEHP]
dependence with 03 M Na5DTPA and 05 M GSH buffer at
pH 4
Table 44 Eu3+
Am3+
distribution and separation for [HDEHP]
dependence with 04 M Na5DTPA and 05 M GSH buffer at
pH 4
Table 45 Luminescence lifetimes and q values for Eu3+
with GSH at
pHD 4
Table 46 J=1J=2 peak ratios and t-test results for Eu-DTPA at pD
2-4 over a GSH concentration range of 01-05 M following
excitation at 397 nm
Table 47 Luminescence lifetimes and q values for Eu-DTPA at pH
2-4 over a GSH concentration range of 01-05 M
Table 48 J=1J=2 peak ratios and t-test results for Eu-DTPA at pH
2-4 as [GSH] is varied
Table 49 J=1J=2 peak ratios and t-test results for Eu-DTPA with
05 M GSH in D2OH2O at pDpH 4 over a Na5DTPA
concentration range of 005-06 M
Table 410 Luminescence lifetimes and q values for Eu-DTPA with
05 M GSH at pH 4 over a Na5DTPA concentration range of
005-06 M following excitation at 397 nm
Table 411 J=1J=2 peak ratios and t-test results for Eu3+
in the
aqueous phase with 05 M GSH at pH 4 as [Na5DTPA] is
varied after extraction with 02 M HDEHP
Table 412 J=1J=2 peak ratios and t-test results for Eu3+
in the
aqueous phase with 05 M GSH and 03 M Na5DTPA at pH 4
as [HDEHP] is varied after extraction
Table 413 J=1J=2 peak ratios and t-test results for Eu-DTPA with
05 M GSH in D2OH2O at pDpH 4 over a Na5DTPA
concentration range of 01-06 M after irradiation with 7 kGy
γ-radiation
12
Table 414 Luminescence lifetimes and q values for Eu-DTPA with
05 M GSH at pH 4 over a Na5DTPA concentration range of
01-06 M after irradiation with 7 kGy γ-radiation
Table 414 Luminescence lifetimes and q values for Eu-DTPA with
05 M GSH at pH 4 over a Na5DTPA concentration range of
01-06 M after irradiation with 7 kGy γ-radiation
Table 415 J=1J=2 peak ratios and t-test results for Eu3+
in the
aqueous phase with 05 M GSH and at pH 4 as [Na5DTPA] is
varied after extraction with 02 M HDEHP in dodecane from
an aqueous phase irradiated at 7 kGy γ ndashradiation
Table 416 Luminescence lifetimes for lanthanide samples at pH 4
Table 417 Luminescence lifetimes and q values for Eu3+
and Tb3+
samples at pH 4
Table 418 Luminescence lifetimes for aqueous phases before
extraction over a pH range of 2-4
Table 419 Luminescence lifetimes and q values for Eu3+
and Tb3+
samples before extraction over a pH range of 2-4
Table 420 SFLnAm for varying GSH concentration over a pH range
of 2-4 with 005 M Na5DTPA after extraction with 02 M
HDEHP in dodecane
Table 51 J=1J=2 peak ratios and t-test results for Eu- DTPA-
bis(amino ester) complexes at pD 2-4
Table 52 Luminescence lifetimes and q values for Eu-DTPA-
bis(amino ester) complexes at pD 2-4 recorded at the emission
maximum (617 nm) following 397 nm excitation
Table 53 J=1J=2 peak ratios and t-test results for organic phases
after extraction after Eu3+
extraction aqueous phases
containing DTPA-bis(amino ester) ligands (50 mM) at pH 2-4
Table 54 J=1J=2 peak ratios and t-test results for Eu-DTPA-
bis(amino ester) complexes at pD 2 after irradiation with 7
kGy γ-radiation
Table 55 Luminescence lifetimes and q values for Eu-DTPA-
bis(amino ester) complexes at pD 2-4 after irradiation with 7
kGy γ-radiation
13
Table 56 J=1J=2 peak ratios and t-test results for the organic phases
after Eu3+
extraction from aqueous phases containing DTPA-
bis(amino ester) ligands (50 mM) at pH 2 one of which had
been irradiated with 7 kGy γ-radiation
Table 57 Luminescence lifetimes and q values for the organic
phases after Eu3+
extraction from aqueous phases containing
DTPA-bis(amino ester) ligands (50 mM) at pH 2 one of which
had been irradiated with 7 kGy γ-radiation
Table 71 Dose rates received at each sample position in the 60
Co
irradiator at DCF
Table 72 Elemental analysis results for modified DTPA ligands P =
predicted proportion present () A = actual proportion
present ()
Table 73 Emission and excitation wavelengths for Ln3+
ions
14
LIST OF FIGURES
Figure 11 Jablonski diagram showing fluorescence and
phosphorescence
Figure 12 Energy transfer pathway for sensitised luminescence of
Ln3+
complexes
Figure 13 Energy level diagram showing the ground and excited
states of a selection of lanthanides and vibrational oscillators
Figure 14 The energy gaps between the lowest emissive states and
ground states of a selection of lanthanides and actinides
Figure 15 Chain reaction generated by fission of 235
U into 92
Kr and
141
Ba
Figure 16 The Nuclear Fuel Cycle
Figure 17 Chemical structure of TBP (Tri-nbutyl phosphate)
Figure 18 PUREX flow diagram
Figure 19 Chemical structure of CMPO (NN-diisobutyl-2-
(octyl(phenyl)phosphoryl)acetamide)
Figure 110 TRUEX flow diagram
Figure 111 Chemical structure of DMDBTDMA
Figure 112 Chemical structure of DMDOHEMA
Figure 113 Example DIAMEX flow diagram
Figure 114 General chemical structure of BTPs
Figure 115 Chemical structure of TODGA
Figure 116 Chemical structure of HEDTA
Figure 117 SANEX flow diagram for TODGA process
Figure 118 General chemical structure of BTBPs
Figure 119 Chemical structure of CyMe4-BTBP
Figure 120 Chemical structure of CyMe4-BTPhen
Figure 121 GANEX flow diagram
Figure 122 Chemical structure of TRPO
Figure 123 Chemical structure of CYANEX 301
Figure 124 Chemical structure of TTHA
Figure 125 TRPO flow diagram using TTHA
Figure 126 TRPO flow diagram using HNO3 and oxalic acid
Figure 127 LUCA flow diagram
15
Figure 128 Chemical structure of TEDGA
Figure 129 Chemical structure of DTPA
Figure 130 Chemical structure of HDEHP
Figure 131 Chemical structure of HEH[ϕP]
Figure 132 Chemical structure of lactic acid pKa = 386
Figure 133 The solvent extraction process used in TALSPEAK Step
1 Binding of DTPA to M3+
in the aqueous phase at pH 36
buffered by lactic acid Step 2 Selective extraction of Ln3+
into the organic phase by HDEHP from the aqueous phase due
to preferential binding of DTPA to MA3+
Figure 134 Effect of Na5DTPA concentration on distribution ratios
of MA3+
and Ln3+
in TALSPEAK process using 1 M lactate
buffer and 03 M HDEHP in DIPB extractant
Figure 135 TALSPEAK flow diagram
Figure 21 XAS molecular structure of Gd(III)-DTPA
Figure 22 Chemical structure of [Eu(DTPA)]2-
Figure 23 1H NMR spectrum of [Eu(DTPA)]
2- in D2O at 278 K at
pD = 36
Figure 24 1H NMR spectra of DTPA in D2O at 278 K at varying pD
a) pD 7 [DTPA]5-
b) pD 36 [H3DTPA]2-
c) pD 2 [H5DTPA]
Figure 25 Emission spectrum of Eu3+
(aq) and [Eu(DTPA)]2-
in D2O
at pD 36
Figure 26 1H NMR spectrum for [Am(DTPA)xH2O]
2- in 41 vv
MeODD2O with NaOD over a temperature range at pH 3
Figure 27 Emission spectrum of Cm3+
and [Cm(DTPA)]2-
in
perchloric acid at pH 3 by direct excitation with a NdYAG
pumped dye laser at 3966 nm
Figure 28 Emission spectrum of Eu-lactate as a function of lactate
concentration
Figure 29 Co-ordination mode of lactate to Eu3+
Figure 210 Chemical structures of L-alanine (top) glycine (bottom
left) and L-serine (bottom right)
Figure 211 1H NMR spectrum of Eu(NO3)3xH2O (10 mM) with L-
alanine in D2O at 278 K
16
Figure 212 1H NMR spectrum of L-alanine in D2O at 278 K
Figure 213 1H NMR spectrum of [Eu(DTPA)]
2- (10 mM) with L-
alanine (1 M) in D2O at 278 K
Figure 214 Emission spectra of [Tb(DTPA)]2-
in D2O at pD 3 with
and without the presence of L-phenylalanine (05 M) excited at
250 nm and 379 nm Excitation spectrum of [Tb(DTPA)]2-
in
D2O at pD 3 with L-phenylalanine (05 M) at 545 nm
Figure 215 Chemical structure of L-phenylalanine
Figure 216 Emission spectra of Eu(NO3)3 in D2O at pD 36 with and
without the presence of amino acidslactate (1 M) excited at
395 nm at 298 K
Figure 217 Emission spectra of Eu-DTPA in D2O at pD 36 with and
without the presence of amino acidslactate (1 M) excited at
395 nm
Figure 218 Emission spectrum of [Cm(DTPA)]2-
in H2O with and
without L-alanine (25 mM) at pH 3 by direct excitation at 396
nm
Figure 219 Graph illustrating the rates of reaction of the middotOH radical
with L-alanine compared to lactic acid and the lactate ion
Figure 220 Distribution ratios for Ln3+
and Am3+
in the presence of
L-alanine at 05 M pH 2 at different doses of γ-radiation
Figure 221 Emission spectra of Eu3+
in D2O at pD 36 with and
without the presence of amino acidslactate excited at 395 nm
before 5 kGy γ-irradiation
Figure 222 Emission spectra of Eu3+
in D2O at pD 36 with and
without the presence of amino acidslactate excited at 395 nm
after 5 kGy γ-irradiation
Figure 31 The effect of pH on an L-alanine-buffered TALSPEAK
system
Figure 32 Distribution ratios of Ln3+
Y3+
in a TALSPEAK system 1
mM LnY3+
1 M lactate 005 M DTPA pH 7 extracted using
05 M HDEHP in 14-DIPB
Figure 33 The effect of buffer concentration on an L-alanine-
buffered TALSPEAK system
17
Figure 34 Chemical structures of L-arginine (top) L-histidine
(bottom left) and L-methionine (bottom right)
Figure 35 DTPA speciation as a function of pH modelled using
HySS sofware using literature pKa values
Figure 36 [Na5DTPA] dependence of L-alanine system (05 M) at
pH 2
Figure 37 Eu3+
Am3+
separation for [Na5DTPA] dependence of L-
alanine system (05 M) at pH 2
Figure 38 Eu3+
Am3+
separation for [HDEHP] dependence of L-
alanine system (05 M) at pH 2 using 02 M Na5DTPA
Figure 39 Eu3+
Am3+
separation for [HDEHP] dependence of L-
alanine system (05 M) at pH 2 using 03 M Na5DTPA
Figure 310 Eu3+
Am3+
separation for [HDEHP] dependence of L-
alanine system (05 M) at pH 2 using 04 M Na5DTPA
Figure 311 Distribution ratios of La3+
-Ho3+
and Am3+
with 05 M L-
histidine buffer at pH 2 and pH 3
Figure 41 Molecular structures of eisenin (top) and norophthalmic
acid (bottom)
Figure 42 Molecular structures of biotinvitamin B7 (top) and folic
acid vitamin B9 (bottom)
Figure 43 Molecular structure of L-glutathione (reduced form)
Figure 44 Eu3+
Am3+
distribution for [GSH] dependence with 005
M Na5DTPA at pH 2 extracted using 02 M HDEHP in
dodecane Results were averaged from 3 repeat tests
Figure 45 Eu3+
Am3+
distribution for [GSH] dependence with 005
M Na5DTPA at pH 3 extracted using 02 M HDEHP in
dodecane Results were averaged from 3 repeat tests
Figure 46 Eu3+
Am3+
distribution for [GSH] dependence with 005
M Na5DTPA at pH 4 Results were averaged from 3 repeat
tests
Figure 47 GSH speciation as a function of pH modelled using
HySS software using literature pKa values
Figure 48 H2GSH- species dominant in solution at pH 4
18
Figure 49 A ternary Nd DO3A-pyrazine amine carboxylate complex
reported by Faulkner at al (left) and anticipated bidentate
chelation of GSH with Am-DTPA at pH 4 (right)
Figure 410 Eu3+
and Am3+
distribution for [Na5DTPA] dependence
with 05 M GSH buffer at pH 4 curves fitted as polynominal
order 2 for both Am3+
and Eu3+
Results were averaged from 3
repeat tests
Figure 411 Eu3+
and Am3+
distribution for [HDEHP] dependence
with 03 M Na5DTPA and 05 M GSH buffer at pH 4 curve
for Eu3+
fitted as polynominal order 2 linear correlation for
Am3+
Results were averaged from 3 repeat tests
Figure 412 Eu3+
and Am3+
distribution for [HDEHP] dependence
with 04 M Na5DTPA and 05 M GSH buffer at pH 4 linear
correlation for both Am3+
and Eu3+
Results were averaged
from 3 repeat tests
Figure 413 Corrected emission spectra of Eu(NO3)3 (1 mM)
Eu(NO3)3 with GSH (05 M) and Eu(NO3)3 with Na5DTPA
(005 M) in H2O following excitation at 397 nm
Figure 414 Emission spectra of Eu(NO3)3 in H2O at pH 4 over a
GSH concentration range of 01 ndash 05 M following excitation
at 397 nm
Figure 415 Emission spectra of Eu(NO3)3 in D2O at pH 4 over a
GSH concentration range of 01 ndash 05 M following excitation
at 397 nm
Figure 416 Emission spectra of aqueous and organic phases after
Eu3+
extraction at pH 4 using a GSH concentration range of
01 ndash 05 M following excitation at 397 nm
Figure 417 Emission spectra of Eu3+
in D2O at pD 2 with 005 M
Na5DTPA over a GSH concentration range of 01 ndash 05 M
following excitation at 397 nm
Figure 418 Emission spectra of Eu3+
in D2O at pD 3 with 005 M
Na5DTPA over a GSH concentration range of 01 ndash 05 M
following excitation at 397 nm
19
Figure 419 Emission spectra of Eu3+
in D2O at pD 4 with 005 M
Na5DTPA over a GSH concentration range of 01 ndash 05 M
following excitation at 397 nm
Figure 420 Emission spectra of aqueous phases after Eu3+
extraction
at pH 2-4 over a GSH concentration range of 01-05 M
following excitation at 397 nm
Figure 421 Emission spectra of organic phases after Eu3+
extraction
at pH 2-4 over a GSH concentration range of 01-05 M
following excitation at 397 nm
Figure 422 Emission spectra of Eu(NO3)3 in D2O at pD 4 with 05
M GSH over a Na5DTPA concentration range of 005 ndash 06 M
following excitation at 397 nm
Figure 423 Emission spectra of Eu(NO3)3 in H2O at pH 4 with 05
M GSH over a Na5DTPA concentration range of 005 ndash 06 M
following excitation at 397 nm
Figure 424 Emission spectra of aqueous and organic phases after
Eu3+
extraction with 05 M GSH at pH 4 over a Na5DTPA
concentration range of 005-06 M following excitation at 397
nm
Figure 425 Emission spectra of aqueous phases after Eu3+
extraction
with 05 M GSH and 03 M Na5DTPA at pH 4 over an
HDEHP concentration range of 02-10 M following
excitation at 397 nm
Figure 426 Emission spectra of organic phases after Eu3+
extraction
with 05 M GSH and 03 M Na5DTPA at pH 4 over an
HDEHP concentration range of 02-10 M following
excitation at 397 nm
Figure 427 Emission spectra of Eu(NO3)3 in H2O at pH 4 with 05
M GSH over a Na5DTPA concentration range of 005 ndash 06 M
after irradiation with 7 kGy γ-radiation following excitation at
397 nm
Figure 428 Emission spectra of aqueous and organic phases after
Eu3+
extraction from irradiated aqueous phase at pH 4
containing 05 M GSH over a Na5DTPA concentration range
of 01-06 M
20
Figure 429 Emission spectra of Dy(NO3)3 Dy-DTPA and Dy(NO3)3
with GSH in H2O following excitation at 352 nm Note that
the tail of ligand emission can be seen in the Dy DTPA and
Dy GSH solutions at shorter wavelengths
Figure 430 Emission spectra of aqueous and organic phases of
Dy(NO3)3 Dy-DTPA and Dy(NO3)3 with GSH after extraction
with 10 M HDEHP following excitation at 352 nm
Figure 431 Emission spectra of aqueous and organic phases of
Dy(NO3)3 Dy-DTPA and Dy(NO3)3 with GSH after extraction
with 10 M HDEHP following 352 nm excitation
Figure 432 Emission spectra of Ln(NO3)3 (1 mM EuTbSm3+
10
mM Dy3+
) in H2O at pH 4 following direct excitation (405 nm
for Sm3+
397 nm for Eu3+
366 nm for Tb3+
and 352 nm for
Dy3+
)
Figure 433 Emission spectra of Ln(NO3)3 (1 mM EuTbSm3+
10
mM Dy3+
) with GSH (05 M) at pH 4 in H2O following direct
excitation (405 nm for Sm3+
397 nm for Eu3+
366 nm for Tb3+
and 352 nm for Dy3+
)
Figure 434 Emission spectra of Ln-DTPA (1 mM EuTbSm3+
10
mM Dy3+
005 M Na5DTPA) in H2O at pH 4 following direct
excitation (405 nm for Sm3+
397 nm for Eu3+
366 nm for Tb3+
and 352 nm for Dy3+
)
Figure 435 Emission spectra of Ln(NO3)3 (1 mM EuTbSm3+
10
mM Dy3+
) with GSH (05 M) and Na5DTPA (005 M)
following direct excitation (405 nm for Sm3+
397 nm for Eu3+
366 nm for Tb3+
and 352 nm for Dy3+
)
Figure 436 Emission spectra of aqueous and organic phases of Ln3+
with 05 M GSH and 005 M Na5DTPA after extraction with
10 M HDEHP at pH 2 following direct excitation (405 nm for
Sm3+
397 nm for Eu3+
366 nm for Tb3+
and 352 nm for Dy3+
)
Figure 437 Emission spectra of aqueous and organic phases of Ln3+
with 05 M GSH and 005 M Na5DTPA after extraction with
10 M HDEHP at pH 3 following direct excitation (405 nm for
Sm3+
397 nm for Eu3+
366 nm for Tb3+
and 352 nm for
Dy3+
)
21
Figure 438 Emission spectra of aqueous and organic phases of Ln3+
with 05 M GSH and 005 M Na5DTPA after extraction with
10 M HDEHP at pH 4 following direct excitation (405 nm for
Sm3+
397 nm for Eu3+
366 nm for Tb3+
and 352 nm for
Dy3+
)
Figure 439 DLn for varying GSH concentration at pH 2 with 005 M
Na5DTPA after extraction with 02 M HDEHP in dodecane
Figure 440 DLn for varying GSH concentration at pH 3 with 005 M
Na5DTPA after extraction with 02 M HDEHP in dodecane
Figure 441 1H NMR spectra for GSH in D2O under a range of
conditions at 298 K a) GSH b) GSH after irradiation with 7
kGy γ-radiation c) Eu(NO3)3 with GSH d) GSH with
Na5DTPA e) Eu-DTPA with GSH
Figure 442 1H
1NMR proton assignments for GSH (top) and γ-Glu-
Cys (bottom)
Figure 51 General structure of DTPA-amino acid ligands
Figure 52 Emission spectra of Eu(NO3)3 with DTPA-bis(amino
ester) ligands in D2O at pD 2 following excitation at 397 nm
Figure 53 Emission spectra of Eu(NO3)3 with DTPA-bis(amino
ester) ligands in D2O at pD 3 following excitation at 397 nm
Figure 54 Emission spectra of Eu(NO3)3 with DTPA-bis(amino
ester) ligands in D2O at pD 4 following excitation at 397 nm
Figure 55 Emission spectra of aqueous phases after Eu3+
extraction
from an aqueous phase containing DTPA-bis(amino ester)
ligands (50 mM) at pH 2 following excitation at 397 nm
Figure 56 Emission spectra of aqueous and organic phases after Eu3+
extraction from an aqueous phase containing DTPA-bis(amino
ester) ligands (50 mM) at pH 2 following excitation at 397
nm
Figure 57 Emission spectra of aqueous and organic phases after Eu3+
extraction from an aqueous phase containing DTPA-bis(amino
ester) ligands (50 mM) at pH 3 following excitation at 397
nm
22
Figure 58 Emission spectra of aqueous and organic phases after Eu3+
extraction from an aqueous phase containing DTPA-bis(amino
ester) ligands (50 mM) at pH 4 following excitation at 397
nm
Figure 59 Emission spectra of Eu(NO3)3 in D2O with DTPA-
bis(amino ester) ligands (50 mM) at pH 2 after irradiation
with 7 kGy γ- radiation and following excitation at 397 nm
Figure 510 Emission spectra of aqueous and organic phases after
Eu3+
extraction from an irradiated (7 kGy γ-radiation) aqueous
phase containing DTPA-bis(amino ester) ligands (50 mM) at
pH 2 following excitation at 397 nm
Figure 511 Separation factors and distribution ratios for Eu3+
Am3+
using DTPA-(ArgOMe)2 (005 M) at pH 1-2 extracted using
HDEHP (02 M) in kerosene
Figure 512 Separation factors and distribution ratios for Eu3+
Am3+
using DTPA-(SerOEt)2 (005 M) at pH 1-2 extracted using
HDEHP (02 M) in kerosene
Figure 513 Separation factors and distribution ratios for Eu3+
Am3+
using DTPA-(HisOMe)2 (005 M) at pH 1-2 extracted using
HDEHP (02 M) in kerosene
Figure 514 Distribution ratios for Ln3+
using DTPA-(ArgOMe)2
(005 M) at pH 1-2 extracted using HDEHP (02 M) in
kerosene
Figure 515 Distribution ratios for Ln3+
using DTPA-(SerOEt)2 (005
M) at pH 1-2 extracted using HDEHP (02 M) in kerosene
Figure 516 Distribution ratios for Ln3+
using DTPA-(HisOMe)2
(005 M) at pH 1-2 extracted using HDEHP (02 M) in
kerosene
Figure 61 Chemical structures of amino acids
Figure 71 1H NMR proton assignments for DTPA-(AlaOMe)2
Figure 72 1H NMR proton assignments for DTPA-(ArgOMe)2
Figure 73 1H NMR proton assignments for DTPA-(SerOEt)2
Figure 74 1H NMR proton assignments for DTPA-(HisOMe)2
Figure 75 13
C NMR carbon assignments for DTPA-(AlaOMe)2
Figure 76 13
C NMR carbon assignments for DTPA-(ArgOMe)2
23
Figure 77 13
C NMR carbon assignments for DTPA-(SerOEt)2
Figure 78 13
C NMR carbon assignments for DTPA-(HisOMe)2
Figure 79 60
Co Irradiator at DCF (left) sample holder (top right)
and sample holder inside the irradiator (bottom right)
24
ABSTRACT
The University of Manchester
Madeleine Hilton Langford Paden
PhD
Development of a Simplified Soft-Donor Technique for Trivalent Actinide-Lanthanide
Separations
2015
The necessity of reprocessing spent nuclear fuel has arisen from increasing
awareness and concern for the environment in addition to the potential of minimising
proliferation A number of different reprocessing techniques are currently being
developed around the world to allow useful spent nuclear fuel (SNF) to be recycled and
reused and the remaining waste to be treated One such technique currently being
developed in the USA is the TALSPEAK process an advanced reprocessing method for
the separation of trivalent lanthanide (Ln3+
) and minor actinide (MA3+
) components
This process developed in the 1960s at Oak Ridge National Laboratory uses DTPA to
act as a holdback reagent for MA3+
in a lactate buffered aqueous phase at pH 36
allowing Ln3+
to be selectively extracted by organophosphate HDEHP into an organic
phase of DIPB or dodecane
TALSPEAK is one of the most promising techniques being researched due to its
numerous advantages particularly its relative resistance to radiolysis and its ability to
be carried out without the need for high reagent concentrations Additionally it gives
high separation factors in the region of ~50-100 comparable to other advanced
reprocessing methods under development The chemistry of the process is very complex
and not particularly well understood so it would be advantageous to simplify the process
by removing the need for a separate holdback reagent and buffer
In collaboration with colleagues at the Idaho National Lab the use of amino
acids as a potential combined buffer and soft donor was investigated Although it was
found that amino acids do not act as holdback reagents in their own right optimisation
of an L-alanine buffered TALSPEAK system with DTPA was found to allow the
process to be carried out effectively at a lower pH of 2 which is more preferable for
industrial application
As an extension of this separation studies were carried out using the tripeptide
L-glutathione (GSH) to determine its potential for use as a combined buffer and soft-
donor As with the studies with amino acids it was found that GSH also does not act as
a holdback reagent in its own right however it does interact with Ln-DTPA complexes
at pH 4 When optimised at this pH separation factors of up to 1200 were achieved for
Eu3+
Am3+
whilst still maintaining low MA3+
partitioning However further studies by
ICP-MS and luminescence spectroscopy showed that a GSH buffered system was not
effective for extraction of heavier lanthanides although the results show the potential
for further investigation into other short and longer chain peptide buffered systems and
possibly lanthanide-lanthanide separations
Further studies were carried on amino acid appended DTPA ligands which were
synthesised in a one step reaction in order to create a combined buffer and soft donor
The ligands were found to self-buffer at around pH 2 and allow successful separation of
Eu3+
Am3+
(SF ~ 100) The results from initial investigations by luminescence
spectroscopy and solvent extraction are promising and are presented here Further work
is needed on these systems in order to optimise their extraction capability and minimise
Am3+
partitioning In the future this work could promote studies for better
understanding of TALSPEAK chemistry that could be used in industrial partitioning
processes
25
DECLARATION
No portion of the work referred to in the thesis has been submitted in support of an
application for another degree or qualification of this or any other university or other
institute of learning
26
COPYRIGHT STATEMENT
The author of this thesis (including any appendices andor schedules to this thesis) owns
certain copyright or related rights in it (the ldquoCopyrightrdquo) and she has given The
University of Manchester certain rights to use such Copyright including for
administrative purposes
ii Copies of this thesis either in full or in extracts and whether in hard or electronic
copy may be made only in accordance with the Copyright Designs and Patents Act
1988 (as amended) and regulations issued under it or where appropriate in accordance
with licensing agreements which the University has from time to time This page must
form part of any such copies made
iii The ownership of certain Copyright patents designs trade marks and other
intellectual property (the ldquoIntellectual Propertyrdquo) and any reproductions of copyright
works in the thesis for example graphs and tables (ldquoReproductionsrdquo) which may be
described in this thesis may not be owned by the author and may be owned by third
parties Such Intellectual Property and Reproductions cannot and must not be made
available for use without the prior written permission of the owner(s) of the relevant
Intellectual Property andor Reproductions
iv Further information on the conditions under which disclosure publication and
commercialisation of this thesis the Copyright and any Intellectual Property andor
Reproductions described in it may take place is available in the University IP Policy
(see httpdocumentsmanchesteracukDocuInfoaspxDocID=487) in any relevant
Thesis restriction declarations deposited in the University Library The University
Libraryrsquos regulations (see httpwwwmanchesteracuklibraryaboutusregulations) and
in The Universityrsquos policy on Presentation of Theses
27
ACKNOWLEDGEMENTS
Firstly I would like to thank my University supervisors Dr Louise Natrajan and
Dr Clint Sharrad for their support and encouragement during my PhD and for their help
and guidance when needed I would also like to thank Dr Leigh Martin my industrial
supervisor at the Idaho National Lab for the opportunity to work there and gain valuable
new experience
For all of his help in the lab general advice and knowledge on the TALSPEAK
process I would particularly like to thank Dr Travis Grimes from the INL - I could not
have done it without you - and for much of the help and advice I received in
Manchester (as well as lending an ear when I needed to vent) I would like to thank Dr
Adam Swinburne
Thank you also to Dr Andreas Geist for conducting some separation studies for
me at KIT-INE Your contributions have been very valuable and I am most grateful for
all of your help
Sarah Hendley Kevin Beal Andrew Alker and Adrien Moll as Masters and
placement students have helped with various parts of the work in this thesis and
deserve great thanks for their contributions Additionally thank you to Dr Michael
Andrews for helping Adrien so much in the lab whilst I was finishing off my
experiments and beginning to write up my thesis I appreciate the time you spent even
though you had so much to do yourself
Further thanks to Prof Simon Pimblott Greg Horne and Logan Barr for
accommodating me and my Masters students at DCF for irradiation studies and to Greg
especially for giving up your precious time to help us
Dr Tamara Griffiths and Dr Catherine Riddle made working in the lab at the
INL a very enjoyable experience for me and kept me sane and encouraged in times of
desperation Many thanks to you wonderful ladies Also thank you to the Aqueous
Separations and Radiochemistry group (Jack Leigh Peter Travis Rocky Dean Cathy
Bruce Guy and Brandi) Terry Todd and other staff at the INL (Steve Chris Jake all
of the radcons the Analytical group and other placement students) who likewise made
me feel very welcome in a place so far from home
I would additionally like to thank Teams NatrajanMillsSharrad (Sean Adam
Simon Lucy Lizzie Debbie Chloe Mike Pete Kathryn Toria Jen (honorary
member) Dr David Mills Ally Conrad Aruna Helen Tamara Kate Dan Chris
Dave Charles Peter Zana Rich Hugues and Tim) and the Centre for Radiochemistry
28
Research at the University of Manchester for general lab help and support and for
making Manchester a great place to work And to my conference buddies Tamara
Debbie Kate and Adam for making conferences as much about the social side as the
work
Thank you to the INL KIT and Diamond Light Source for the opportunities to
carry out work using their specialist equipment and to Dr Louise Natrajan Dr Sean
Woodall Dr Daniel Whittaker Dr Tamara Griffiths Dr Clint Sharrad Dr Leigh Martin
and Dr Travis Grimes for helping with some of the work carried out
I could not have done this PhD without funding from Batelle Energy Alliance
through the INL and the University of Manchester so thank you
On a personal note a big thank you to Steph my room mate for making my 9
months living in Idaho so much fun And also to Cathy and Glen Shelby Natalie and
Leigh and Marie for all the fun times too Lastly but not least I would like to give huge
thanks to my (non-chemistry non-Idaho) friends and family for their support over the
past 4 years especially my wonderful husband Lee - youre amazing and my rock as
always - and my parents for everything over the past 26 years
It was worth it in the end
29
LIST OF SYMBOLS amp UNITS
gt greater than
˂ less than
plusmn plus or minus
percent
degC degrees Celsius
α alpha
β beta
γ gamma
δ chemical shift
Δ change in
ε molar extinction coefficient
λ wavelength
microL microlitres
micros microseconds
ρ density
τ lifetime
ν frequency
ν= energy level
wavenumber
Aring angstroms
A proportionality constant for q taking into account the
inner hydration sphere
ABS optical density difference between ODi and ODb
amu atomic mass units
au arbitrary units
B correction factor for q taking into account the outer
hydration sphere
Bq Becquerel
cm centimetres
D (pD D2O MeOD) deuterium
dm3 decimetres cubed (litres)
E energy
F Faradays constant
30
g grams
G critical dose value
Gy Gray
h Plancks constant
Hz Hertz
J Joules
J= rotational energy level
K Kelvin
kBq kiloBecquerel
kg kilograms
kGy kiloGray
kJ kiloJoules
L litres
log β stability constant
M molar (moldm-3
)
mg milligrams
MHz megaHertz
min minute(s)
mL millilitres
mm millimetres
mM millimolar
mol moles
mmol millimoles
ms milliseconds
ng nanograms
nm nanometres
ns nanoseconds
ODi optical density of irradiated solution
ODb optical density of non-irradiated control solution
ppm parts per million
s seconds
t time
Zeff effective nuclear charge
31
LIST OF ABBREVIATIONS amp ACRONYMS
An actinides
aq aqueous
BT nack-energy Transfer
BTBP bis-triazinbipyridine
BTP bis-triazinylpyridine
CEA Commissariat agrave lrsquoEacutenergie Atomique et aux Eacutenergies
Alternatives
CE-ICP-MS capillary electrophoresis ndash inductively coupled plasma ndash
mass spectrometry
cf confer Latin compare
CMPO carbomoylmethylphosphine oxide
CP corrosion products
CYANEX 301 bis(244-trimethylpentyl)phosphinodithioic acid
CyMe4-BTBP 66-bis(5588-tetramethyl-5678-tetrahydrobenzo
[e][124]triazin-3-yl)-22-bipyridine
D distribution ratio
DCF Dalton Cumbrian Facility
DEPT distortionless enhancement by polarization transfer
DFT density functional theory
DIAMEX DIAMide EXtraxtion
DIPB diisopropyl benzene
DMDBTDMA dimethyldibutyltetradecylmalonamide
DMDOHEMA dimethyldicotylhexylethoxymalonamide
DMF dimethylformamide
DNA deoxyribonucleic acid
DO3A 147 tris(carboxymethyl) 14710 tetraazacyclododecane
DOTA 14710-tetraazacyclododecane-14710-tetraacetic acid
DTPA diethylenetriaminepentaacetic Acid
EC electron capture
EDTA ethylenediaminetetraacetic acid
eg exempli gratia Latin for example
ET electron transfer
32
et al et alli Latin and others
EURACT-NMR Transnational Access to Unique European Actinide and
Radiological NMR Facilities
EXAm EXtraction of Americium
FP fission products
GANEX Grouped ActiNide EXtraction
GSH glutathione
HDEHP (di-(2ethylhexyl)phosphoric acid
HEH[ΦP] (2-ethylhexyl)phenylphosphonic acid
HEH[EHP] (2-ethylhexyl)phosphonic acid mono-2-ethylhexyl ester
HEDTA (2-hydroxyethyl) ethylenediaminetatraacetic acid
HSQC heteronuclear single quantum correlation
I ionic strength
IC internal conversion
ICP-MS inductively coupled plasma ndash mass spectrometry
ie id est Latin that is
INL Idaho National Laboratory
IR infra-red
iSANEX Innovative SANEX
ISC inter-system crossing
KIT-INE Karlsruhe Institute of Technology - Institut fuumlr Nukleare
Entsorgung (Institute for Nuclear Waste Disposal)
Lac lactate
LASER light amplification by stimulated emission of radiation
LINAC linear accelerator
Ln lanthanides
LUCA Lanthaniden Und Curium Americium trennung
LWR light water reactor
M metal
MA minor actinides
MALDI-MS matrix-assisted laser desorption ionization mass
spectrometry
MOX mixed oxide
MRI magnetic resonance imaging
Nd-YAG neodymium-yttrium aluminium garnet
33
nIR near-infra-red
NMR nuclear magnetic resonance
NPH normal paraffinic hydrocarbon
NR non-radiative decay
org organic
PPE personal protective equipment
PUREX Plutonium and Uranium Refinement by EXtraction
q number of solvent molecules in the inner hydration sphere
SANEX Selective ActiNide EXtraction
SF separation factor
SNF spent nuclear fuel
SX solvent extraction
TALSPEAK Trivalent Actinide Lanthanide Separation by Phosphorus
reagent Extraction from Aqueous Complexation
TALSQuEAK Trivalent Actinide Lanthanide Separation using Quicker
Extractants and Aqueous Complexes
TBP tributyl phosphate
TEA triethylamine
TEDGA NNNrsquoNrsquo-tetraethyl-diglycolamide
TEHP tris(2-ethylhexyl)phosphate
TM transition metals
TODGA tetraoctyldiglycolamide
TPH tetrapropylene hydrogenated
TRLFS time-resolved LASER-induced fluorescence spectrocopy
TRPO trialkylphosphine oxide
TRUEX TRans-Uranic EXtraction
TTHA triethylenetetramine hexaacetate
SF spontaneous fission
SNF spent nuclear fuel
UoM The University of Manchester
UV ultra-violet
UV-vis ultra-violet-visible
vs versus Latin against
XAS x-ray absorption spectroscopy
34
AMINO ACID ABBREVIATIONS
Amino Acid 3 Letter Abbreviation
Alanine Ala
Arginine Arg
Asparagine Asn
Aspartic acid Asp
Cysteine Cys
Glutamic Acid Glu
Glutamine Gln
Glycine Gly
Histidine His
Isoleucine Ile
Leucine Leu
Lysine Lys
Methionine Met
Phenylalanine Phe
Proline Pro
Serine Ser
Threonine Thr
Tryptophan Trp
Tyrosine Tyr
Valine Val
35
1 INTRODUCTION
11 The Actinides and Lanthanides
111 Background
The ldquorare earthrdquo or lanthanide elements (Ln) can be found between barium and
hafnium in the periodic table in the first of the two rows containing the f-block
elements The f-block elements are all metallic and have 4f or 5f valence electron
subshells the lanthanides Ce-Lu are also often referred to as the ldquo4frdquo elements1
Although often considered to be part of the lanthanide series lanthanum is not usually
considered to be a ldquo4frdquo element as it has no f-electrons The 4f elements all have
relatively high abundances despite often being termed the ldquorare earthrdquo elements except
for promethium (Pm) which is radioactive and does not occur in nature2 All of the 4f
elements except promethium were discovered and had all successfully been isolated by
the early 20th
century Promethium was not discovered until 19473
The actinide elements (An) can be found between radium and rutherfordium in
the periodic table and are also known as the 5f elements as their valence shell is the 5f
shell They are all radioactive as none of them have any stable isotopes Although often
considered to be part of the actinide series actinium is not usually considered to be a
ldquo5frdquo element due to its electronic configuration of 5f 0 Despite this thorium which also
has a ground state electronic configuration of 5f 0 is considered to be a 5f element The
first actinide element to be discovered was uranium which was discovered in 1789 by
Klaproth in the mineral pitchblende Thorium and protactinium had also both been
discovered by 1913 but the later actinides were not synthesised until the Second World
War initially by Seaborg4
112 Sources of the Lanthanides and Actinides
The naturally occurring lanthanide elements are found in two minerals
primarily monazite and bastnaumlsite which are ores of mixed lanthanide metals and have
the general formulae LnPO4 and LnCO3F respectively Monazite also contains
radioactive thorium so is the less favourable of the two sources of lanthanides
commercially5
Ac Th Pa and U are the only naturally occurring actinide (An) elements
Uranium is less abundant than thorium (24 ppm vs 81 ppm) in the Earthrsquos crust but is
found in numerous minerals in oxide form including pitchblende (uraninite) and
36
carnotite Protactinium is one of the rarest elements in the world and is found at trace
levels in some uranium ores
The remaining 11 (Np-Lr) elements in the An series must be synthesised
Neptunium to fermium can be synthesised by neutron bombardment whereby a neutron
is captured by a heavy element atom and a γ-ray is emitted This is followed by the
emission of a β- particle in a β
- decay process to form a new element with an increased
atomic mass (see Scheme 11) However as this is a relatively improbable process
synthesis of the heaviest elements is impossible by this method and so synthesis of the
heavier elements is carried out by bombardment with light atoms although again this is
also an unfavourable reaction6
238U (n γ)
239U rarr
239Np rarr
239Pu (n γ)
240Pu (n γ)
241Pu rarr
241Am (n γ)
242mAm rarr
242Cm
Scheme 11 Formation of 242
Cm by a series of neutron capture and β- decay
processes6
113 Properties of the 4f Elements
The shapes of the f -orbitals have a variety of different representations dependent
on molecular symmetry The electron configurations for the metals and Ln3+
ions can be
seen in Table 11 along with values for the third and fourth ionisation energies
Gadolinium (Gd) and lutetuim (Lu) both have a 5d electron giving more stable half-full
or full 4f orbitals respectively Cerium (Ce) is also thought to possess a 5d electron The
most common oxidation state for the lanthanide ions is +3 whereby both of the 6s
electrons and either the 5d electron (if applicable) or one 4f electron are lost The first
two ionisation energies of the lanthanide elements are all relatively low corresponding
to the removal of the 6s electrons The third ionisation energy is also sufficiently low to
allow the generation of the Ln3+
ion in each case by removal of the 5d electron or a 4f
electron The fourth ionisation energies are generally significantly higher as the 4f
orbital becomes more stabilised as the first three electrons are removed This makes the
+4 oxidation state rare but can be formed by Ce Pr and Tb under certain conditions
Samarium (Sm) europium (Eu) and ytterbium (Yb) can form Ln2+
ions relatively
readily
β- β
- β
- β
-
23 mins 23 days 13 years 16 hours
37
Table 11 Electronic properties of the lanthanides 7
Symbol Name Electron
Configuration
(Metal)
Electron
Configuration
(Ln3+
)
3rd
Ionisation
Energy
(kJmol-1
)
4th
Ionisation
Energy
(kJmol-1
)
La Lanthanum [Xe]5d16s
2 [Xe] 1850 4819
Ce Cerium [Xe]4f15d
16s
2 [Xe]4f
1 1949 3547
Pr Praseodymium [Xe]4f36s
2 [Xe]4f
2 2086 3761
Nd Neodymium [Xe]4f46s
2 [Xe]4f
3 2130 3899
Pm Promethium [Xe]4f56s
2 [Xe]4f
4 2150 3970
Sm Samarium [Xe]4f66s
2 [Xe]4f
5 2260 3990
Eu Europium [Xe]4f76s
2 [Xe]4f
6 2404 4110
Gd Gadolinium [Xe]4f75d
16s
2 [Xe]4f
7 1990 4250
Tb Terbium [Xe]4f96s
2 [Xe]4f
8 2114 3839
Dy Dysprosium [Xe]4f10
6s2 [Xe]4f
9 2200 4001
Ho Holmium [Xe]4f11
6s2 [Xe]4f
10 2204 4100
Er Erbium [Xe]4f12
6s2 [Xe]4f
11 2194 4115
Tm Thulium [Xe]4f13
6s2 [Xe]4f
12 2285 4119
Yb Ytterbium [Xe]4f14
6s2 [Xe]4f
13 2415 4220
Lu Lutetium [Xe]4f14
5d16s
2 [Xe]4f
14 2022 4360
114 Properties of the 5f Elements
As previously stated the valence electron sub-shell for the actinides is the 5f
shell The electron configuration of the actinides is shown in Table 12 Thorium has no
5f electron but has 6d2 configuration as an empty 5f shell is more favoured Curium has
a 6d electron giving rise to a more stable half full 5f subshell
The actinide elements have a wide range of available oxidation states
particularly for the earlier metals For the heavier elements however the most common
oxidation state for the metal ions is +3 having lost both of the 7s electrons and either a
6d electron (if applicable) or one 5f electron The available oxidation states for each of
the actinides can be seen in Table 13 Ionisation energy values are not available for all
of the actinides although the standard electrode potentials for the reduction of An4+
to
An3+
and An3+
to An2+
can be used to give an indication of the ion stabilities The +4
38
oxidation state is the most favoured for Th as it gives rise to empty 6d and 7s shells but
An4+
generally becomes less favoured across the series and may only be found in
solution for americium and curium complexes Conversely the stability of the +2
oxidation state generally increases across the series with an irregularity at Cm which
does not have an available +2 oxidation state due to the stability of the half full 5f
subshell of Cm3+
The variety of oxidation states found in the earlier actinides suggests
that all of the valence electrons are available for bonding in these elements7
Table 12 Electronic properties of the actinides7
Symbol Name Electron
Config
(Metal)
Electron
Config
(An2+
)
Electron
Config
(An3+
)
Electron
Config
(An4+
)
Th Thorium [Rn]6d27s
2 NA [Rn]6d
1 [Rn]
Pa Protactinium [Rn]5f26d
17s
2 NA [Rn]5f
2 [Rn]5f
1
U Uranium [Rn]5f36d
17s
2 NA [Rn]5f
3 [Rn]5f
2
Np Neptunium [Rn]5f46d
17s
2 NA
[Rn]5f
4 [Rn]5f
3
Pu Plutonium [Rn]5f67s
2 NA [Rn]5f
5 [Rn]5f
4
Am Americium [Rn]5f77s
2 [Rn]5f
7 [Rn]5f
6 [Rn]5f
5
Cm Curium [Rn]5f76d
17s
2 NA [Rn]5f
7 [Rn]5f
6
Bk Berkelium [Rn]5f97s
2 NA [Rn]5f
8 [Rn]5f
7
Cf Californium [Rn]5f10
7s2 [Rn]5f
10 [Rn]5f
9 [Rn]5f
8
Es Einsteinium [Rn]5f11
7s2 [Rn]5f
11 [Rn]5f
10 [Rn]5f
9
Fm Fermium [Rn]5f12
7s2 [Rn]5f
12 [Rn]5f
11 [Rn]5f
10
Md Mendelevium [Rn]5f13
7s2 [Rn]5f
13 [Rn]5f
12 [Rn]5f
11
No Nobelium [Rn]5f14
7s2 [Rn]5f
14 [Rn]5f
13 NA
Lr Lawrencium [Rn]5f14
6d17s
2 NA [Rn]5f
14 NA
39
Table 13 Available oxidation states of the actinides and colours of ions in solution
where applicable Ions in black text are either not found in aqueous solution or are
unknown8
115 Relativistic Effects
Relativistic effects are much more important for heavy elements than light
elements as they are proportional to an atomrsquos mass The Special Theory of Relativity
as devised by Einstein shows that as the velocity (ν) of a particle increases towards the
speed of light (c) its mass (m) increases to infinity as shown in equation 11 where m0
is the rest mass of the particle This is the relativistic mass increase
Equation 11
For example the relativistic mass increase of a 1s electron in uranium (found to
be 135 me) can be calculated using the average radial velocity of the electrons (νrad)
which is roughly equivalent to the atomic number Z for 1s electrons and the rest mass
of an electron (me) This is shown in equation 12
Equation 12
This effect causes a contraction of 1s electron subshell due to the inverse
relationship between electron mass and the Bohr radius of an atom meaning that the
shell is held more closely to the nucleus and stabilised A similar effect is true for p
electrons The relationship can be seen in equation 13 where α0 is the Bohr radius e is
the elementary charge and ħ is the reduced Planckrsquos constant
Equation 13
7 NpO23+
PuO23+
AmO65-
6 UO22+
NpO22+
PuO22+
AmO22
+5 PaO2
+UO2
+NpO2
+PuO2
+AmO2
+
4 Th4+
Pa4+
U4+
Np4+
Pu4+
Am4+
Cm4+
Bk4+
Cf4+
3 Ac3+
Th3+
Pa3+
U3+
Np3+
Pu3+
Am3+
Cm3+
Bk3+
Cf3+
Es3+
Fm3+
Md3+
No3+
Lr3+
2 Am2+
Cf2+
Es2+
Fm2+
Md2+
No2+
Ac Th Pa U Np Pu Am Cm Bk Cf Es Fm Md No Lr
Most stable in aqueous solution Accessible Only found in solid complexes
40
This explains why relativistic effects are more significant for larger nuclei as the
mass increase is dependent on Z Conversely to the stabilisation of s and p electrons by
relativistic effects valence f and d orbitals are expanded further from the nucleus and
destabilised due to effective shielding of the s and p electrons of the nucleus The effect
is greater in the actinides due to the increased number of electrons and is responsible for
the variety of oxidation states exhibited by An as the valence 5f electrons are further
from the nucleus and are therefore more available for bonding Relativistic effects are
much less important for the lanthanides than the actinides as the actinides are more
destabilised by the effects7
116 Lanthanide and Actinide Contraction
There is a general decrease in the size of the metallic and ionic radii of the
lanthanides across the series explained by the fact that 4f electrons are considered to be
ldquocore-likerdquo so are not available for bonding This causes crystal field effects to be minor
in lanthanide complexes The ldquocore-likerdquo property of the 4f electrons prevents them
from shielding valence electrons in outer subshells from the nucleus allowing the
effective nuclear charge (Zeff) to increase and causing contraction of the atoms and ions
across the series The lanthanide contraction is responsible for the small size difference
between the second and third row transition metals
The ionic radii of the actinides for the +3 +4 and +5 oxidation states gradually
decrease in size across the series although the metallic radii do not follow the same
trend The effect of the trend on the chemistry of the elements is not well known as the
later elements cannot be made with large enough yields to study and they decay too
rapidly The gradual decrease is due to the fact that 5f-electrons are poor at shielding s
and p electrons from the nucleus due to their greater radial extension allowing the
effective nuclear charge (Zeff) to increase and the s and p electrons to be held more
closely to the nucleus
117 Co-ordination Chemistry of the Lanthanides and Actinides in Solution
Lanthanide ions are hard Lewis acids and so co-ordinate readily with hard bases
The core-like nature of the 4f electrons prevents them from interacting significantly with
ligand orbitals and means that lanthanide complexes are bonded electrostatically The
co-ordination geometry of complexes is therefore determined predominantly by the
steric interactions of the ligands The high charge density of the Ln3+
ions allows them
41
to form ionic bonds however this means that many lanthanide complexes are labile in
solution
Actinide ions are also hard Lewis acids co-ordinating easily with hard bases
The greater radial extension of the 5f electrons caused by relativistic effects gives rise
to greater chemical activity in the actinides than the lanthanides as the 5f electrons are
more available for bonding This also explains the tendency of the early actinides to
form covalent bonds however the later actinides mainly interact electrostatically like
the lanthanides
Actinide ions are found as An3+
for the later elements in the series except for
No which is found as No2+
and they behave much like the lanthanides However for
some of the early actinides linear actinyl ions (AnO2+ and AnO2
2+) can be observed in
addition to free ions and are often more stable particularly for U91011
Lanthanide and actinide complexes often have high co-ordination numbers
typically 8 or 9 in aqueous solution (although co-ordination numbers as high as 12 have
been reported) due to their large size The Ln3+
ion forms readily in aqueous solution
and the An3+
ion is the common form for the later actinides however the solution state
chemistry of the early actinide ions is complicated Americium is mainly found in the
+3 oxidation state in solution although it also forms the AmO22+
ion The Am7+
oxidation state has been known to exist but is unstable except in very alkaline
conditions
It is difficult to determine the exact co-ordination numbers and geometries of Ln
and An ion complexes in solution due to the lability of the complexes particularly for
lanthanides
1171 Hydrolysis
The solvation of metal cations by water particularly cations with a high charge
density such as Ln3+
and An3+
ions will result in some hydrolysis The cations polarise
the O-H bonds of the solvent allowing the hydrated metal cations to act as Broslashnsted
acids An example can be seen in Equation 14
Equation 14 [Eu(H2O)8]3+
+ H2O rarr [Eu(H2O)7(OH)]2+
+ H3O+
The acidity of the Ln3+
cations increases across the series as the charge density
increases For the An ions the acidity increases as follows
AnO2+ lt An
3+ lt AnO2
2+ lt An
4+
42
Generally the acidity increases with increasing charge density like Ln The
position of AnO22+
can be explained by the fact that the O2-
ions do not fully reduce the
charge on the An ion and so the effective charge of the ion is seen to be +331
1172 Monodentate Ligands
Substituting water for other monodentate ligands in aqueous solution is
challenging for lanthanides as the complexes are labile and the high charge density of
the ion and affinity for a polar environment means that it will often remain solvated
Isolating monodentate complexes from water is almost impossible as Ln3+
ions having a
high enthalpy of hydration making complex formation endothermic Complexation can
be achieved much more easily by the use of macrocyclic or chelating ligands
Conversely it is much easier to form monodentate actinide complexes in water
such as salts which will become hydrated rather than completely substituted by water
molecules However complexation is still much easier with macrocycles or chelates in
aqueous solution12
1173 Chelates and Macrocycles
When a chelate or macrocycle ligates to an ion the reaction entropy increases as
water molecules are eliminated from the complex (see Equation 15) which is
thermodynamically favourable As a chelating or macrocyclic ligand bonds to the metal
ion the remainder of the ligand is considered to be in close proximity to the ion giving
it an ldquoartificially highrdquo concentration and is therefore more likely to bond than
surrounding ions or ligands
Equation 15 [Eu(H2O)8]3+
+ EDTA4-
rarr [Eu(EDTA)(H2O)3]- + 6H2O
Chelating complexes increase in stability across lanthanide and actinide series
This is because the Coulombic attraction between the ligand and the metal increases
with charge density However there is a slight irregularity in this trend for the
lanthanides where a slight dip can be seen at Gd3+
as this is thought to be the point at
which the co-ordination number changes from 9 to 8 often referred to as the
lsquogadolinium breakrsquo12
43
12 Analytical Methods
121 NMR Spectroscopy
Most lanthanide and actinide complexes are paramagnetic as they have unpaired
electrons The nuclei of paramagnetic complexes are subjected to a local magnetic field
in addition to the field generated by the spectrometer causing the complexes to have
larger chemical shifts NMR spectra of paramagnetic complexes often have broad peaks
as they have faster spin-lattice relaxation times due to strong spin-orbit coupling13
The
relationship is explained by the Heisenberg Uncertainty Principle which links energy
(E) and time (t) in Equation 16 where h is Planckrsquos constant
Equation 16
Considering the relationship between energy and frequency (ν) in Equation 17
the Heisenberg equation can be rearranged to show the inverse relationship between the
change in frequency (Δν) or ldquospectral linewidthrdquo (defined as the peak width of the
signal at half of its maximum height) and the lifetime of the excited state or in this case
spin-lattice relaxation time (Δt) See Equation 1814
Equation 17
Equation 18
122 Luminescence Spectroscopy
1221 Fluorescence and Phosphorescence
Fluorescence and phosphorescence are both types of luminescence Radiation is
used to excite electrons into a higher electronic energy level which then emit photons
(light) as they relax back down to their ground state Fluorescence is a relatively fast
process (picoseconds to milliseconds) as it is an allowed transition by the spin selection
rule not involving a change in spin multiplicity Phosphorescence is a slower process
(milliseconds to seconds) as it does involve a change in electron spin from a singlet to a
triplet excited state ndash it is formally ldquospin-forbiddenrdquo The processes can be seen in the
Jablonski diagram in Figure 11 By contrast f-f transitions whereby f-electrons are
excited into other f-subshells are formally Laporte forbidden so direct excitation of the
4f electrons is unfavourable These rules are relaxed a little by vibronic (vibrational and
44
electronic) coupling in which a vibration in the molecule causes the temporary
lowering of the symmetry of the metal allowing the d and p orbitals to share symmetry
The transition has some drarrp character and so becomes more intense However for
vibronic coupling to take place the valence orbitals must interact with incoming
ligands For the transitions that occur in the visible region of the spectrum this explains
why the colours of Ln3+
ions are weak as the valence 4f shell interacts poorly with
ligands due to their core-like nature Vibronic coupling is greater in actinide ions
Figure 11 Jablonski diagram showing fluorescence and phosphorescence15
1222 Lanthanide Luminescence
Lanthanide ions in which f-f transitions can occur are luminescent and emit
across a range of the electromagnetic spectrum from the Ultra-Violet (UV) range to the
visible (vis) or near-infra-red (nIR) region of the spectrum (Table 14) La3+
does not
possess any f-electrons and Lu3+
has a full 4f shell so these two ions are not
luminescent
45
Table 14 Luminescence of lanthanide ions
Luminescent ions which emit
in the nIR region of the
spectrum
Colours of luminescent ions
which emit in the visible and
UV regions of the spectrum
Pr3+
Sm3+
Nd3+
Eu3+
Ho3+
Tb3+
Er3+
Dy3+
Yb3+
Tm3+
Gd3+
(UV)
Ce3+
(UV)
Lanthanide ions have long luminescence lifetimes as their transitions are
formally forbidden Since the interaction between the metal ion and the ligand is
negligible in lanthanides the emission spectra of lanthanide complexes have narrow
emission lines resembling the spectra of the free ions Solid lanthanide compounds and
complexes also tend to be luminescent1617
1223 Actinide Luminescence
Actinide ions in which f-f transitions can occur are luminescent and also emit
across a range of the electromagnetic spectrum from the UV range to the infra-red IR or
nIR region (Table 15) Ac3+
and Th4+
do not have any f-electrons and Lr3+
has a full 4f
shell so these two ions are not luminescent No luminescence studies have been
performed on Fm3+
Md3+
or No2+
The remaining An have luminescent ions but studies
have been most widely performed on UO22+
Am3+
and Cm3+
as these are the most
widely available have fewer problems associated with radioactivity and safety and are
the most well understood
46
Table 15 Luminescence of actinide ions
Luminescent ions which emit
in the IRnIR region of the
spectrum
Colours of luminescent ions which
emit in the visible and UV regions
of the spectrum
NpO22+
Pa4+
(UV) Pa4+
Pa4+
Pa4+
Pa4+
Am3+
U4+
(UV) U4+
Es3+
UO2+
UO22+
UO22+
UO22+
UO22+
Am3+
Am3+
Am3+
Am3+
Cm3+
Bk3+
Cf3+
Unlike lanthanides actinide emission spectra and lifetimes vary depending on
the species and bound species or counter ions although most lifetimes for An are short
(lt 20 ns) with the exceptions of the 5f0 species UO2
2+ (which has lifetimes varying
from 130 ns to 300 μs) and Cm3+
which has a lifetime of ~65 μs and is known to have
the highest luminescence quantum yield of the An ions allowing it to be studied in very
low concentrations which is useful due to its low availability Luminescence studies on
solid state An compounds are unreliable as they are susceptible to radioluminescence
whereby the energy released by radioactive decay can result in the generation of an
emissive excited state718
1224 Sensitised Luminescence and Antennae
Sensitisation of luminescence can occur if an ldquoantennardquo is present which is a
sensitising chromophore An electron is excited on the ion by energy transferred from
the chromophore The antenna must be in close proximity to the ion for energy transfer
to take place and so antennae are usually used as ligands
Antennae are predominantly organic aromatic materials bonded to macrocycles
(as these are easier to ligate to the metal ions in solution) During sensitisation an
electron from the chromophore is excited from its ground state to a singlet excited state
Energy may then be transferred to a triplet excited state by inter-system crossing (ISC)
where the potential curves of the two states intersect at similar energies Although this
spin forbidden spin orbit coupling makes it possible by slightly shifting the electronrsquos
energy levels Energy from the triplet state is then transferred to the metal ionrsquos excited
47
state The ion can then relax to its ground state by luminescence This is the most
common pathway for sensitised emission however it is possible to transfer energy
directly from the singlet excited state on the chromophore to the ion (Figure 12)
Figure 12 Energy transfer pathway for sensitised luminescence of Ln3+
complexes 1S
represents an excited singlet state 3T an excited triplet state and f and frsquo represent
excited states of the Ln3+
ion 19
1225 Russell-Saunders Coupling
ldquoTerm symbolsrdquo are used to label ground state and excited state energy levels
for lanthanide ions Term symbols are derived from Russell-Saunders coupling and
account for the net atomic orbital angular momentum and the net spin angular momenta
of the state determined from the sum of the individual angular momenta of an ionrsquos
electrons Term symbols take the form
(2S+1)LJ
where S is the spin multiplicity of the state L corresponds to the ldquolrdquo quantum number
for the state and J is the coupling of L and S Excited states have several possible J
values although the ground state always has a single J value which can be determined
by Hundrsquos rules The Russell-Saunders coupling scheme is only useful for lanthanide
ions and cannot be applied to actinide ions as spin-orbit coupling is much greater in An
and the 5f orbitals have different properties to the 4f orbitals in particular the greater
importance of relativistic effects (see Section 115) However Russell-Saunders terms
have been used as a basis for assigning ground and excited state terms20
F = Fluorescence P = Phosphorescence L = Luminescence NR = Non Radiative Decay ISC = Inter System Crossing ET = Energy Transfer BT = Back-energy Transfer IC = Internal Conversion
48
1226 Quenching
The excited states of the trivalent lanthanides and actinides are readily quenched
in solution Quenching occurs when the vibrational energy levels of high energy
oscillators (such as C-H N-H or O-H bonds) within the molecule or its environment
(solvent) have a similar energy to the excited state of an ion Inter-System Crossing
(ISC) from the excited state to these vibrational levels can occur causing non-radiative
decay preventing luminescence The efficiency of this non-radiative decay is dependent
upon the energy gap between the emissive state and the ground state of the ion and also
on the number of quanta (energy levels) of the oscillator If the non-radiative decay is
favourable and happens faster than luminescence quenching will occur Quenching
reduces the intensity lifetime and quantum yield of luminescence If the ionrsquos emissive
state is close in energy to the triplet excited state of the ligand (lt 20000 cm-1
) thermal
quenching may also occur whereby energy is transferred backwards to the triplet
excited state of the chromophore21
1227 Quenching in Lanthanides and Actinides
Tb3+
is less susceptible to vibrational quenching than other lanthanide ions as the
energy gap between the lowest emissive state and the ground state of Tb3+
is very high
(20500 cm-1
) It is however susceptible to thermal quenching and back energy transfer
Eu3+
also has a large energy gap (17250 cm-1
) This results in a relatively greater
emission intensity for these ions
Other lanthanide ions such as Pr3+
Ho3+
Er3+
Tm3+
Yb3+
Dy3+
and Sm3+
with
smaller energy gaps are more easily quenched giving less intense emission Er3+
has the
smallest energy gap close to the υ=0 energy level of O-H so is the most easily
quenched (see Figure 13) The lower energy levels of the oscillators provide better
overlap with the energy levels of the ions due to a better overlap with the wavefunction
therefore ions which have energy levels that overlap with the lower quanta of the
oscillators will also be more easily quenched Gd3+
has the highest energy gap of the
lanthanide ions (32000 cm-1
) and cannot be sensitised by conventional UV absorbing
chromophores
49
Nd3+Eu3+ Tb3+Yb3+ O-H O-DTm3+ Sm3+ Pr3+ Er3+
3H4
4I132
4I112
3H4
3H5
3H6
3H6
3H5
3H4
0
20000
4I92
4I112
4I132
4I152
4F32
2H92
4S32
4F92
2H112
4G52
4G72
4G92
(2D2P)32
4G1125D4
7F07F17F27F37F4
7F5
7F67F0
7F1
7F2
7F3
7F4
7F5
7F6
5D0
5D1
5D2
2F52
2F72
10000
6H52
6H72
6H92
6H112
6H132
4F32
4G52
4F32
4F12
4F52
4F72
4G72
4F92
4F112
3F2
3F4
3P0
3P1
3F3
1I6
1G4
4I92
4F92
4S32
4F72
3F4
3F3
3F2
1G4
E
cm
-1
=0
=1
=2
=3
=4
=5
=0
=1
=2
=3
=4
=5
=6
=7
2H112
1D2
Figure 13 Energy level diagram showing the ground and excited states of a selection
of lanthanides and vibrational oscillators Emissive states are shown in red The energy
levels of O-H and O-D oscillations are shown in blue22
Actinides are also susceptible to quenching even more so than the lanthanides
as all of them have smaller energy gaps between the lowest emissive state and the
ground state The energy gaps of some actinides compared to lanthanides can be seen in
Figure 14
50
Figure 14 The energy gaps between the lowest emissive states and ground
states of a selection of lanthanides and actinides represented by arrows23
1228 Suitable Solvents for Luminescent Complexes
In addition to quenching by vibrational oscillators on ligands luminescence can
also be quenched by solvents High energy oscillators must therefore be eliminated from
the solvent in order for luminescence to take place in the solution phase This is
generally achieved by using deuterated (or fluorinated) solvents such as D2O It is also
important to use strongly co-ordinating solvents that would replace the labile ligands
The Horrocks equation can be used to calculate the number of co-ordinated solvent
molecules (q) to an ion whether it is a free ion or co-ordinated to a ligand The original
Horrocks equation (Equation 19) and modified Horrocks equation for q lt 2 (Equation
110) are shown below
Equation 19
Equation 110
The Horrocks equation uses the emission lifetimes (τ) to determine q A is the
proportionality constant taking into account the inner hydration sphere and B is a
correction factor taking into account the outer hydration sphere A and B values are
experimentally determined constants and are available for Sm3+
Eu3+
Tb3+
Nd3+
Yb3+
Am3+
and Cm3+
Inner sphere hydration (q) values can be effectively determined from
51
solutions of water and methanol For the original Horrocks equation A = 105 for Eu3+
and A = 42 for Tb3+
and for the modified Horrocks equation (when q lt 2 ) A = 12 ms
and B = (025 ndash 0075x) ms-1
(where x = the number of exchangeable N-H oscillators)
for Eu3+
and A = 5 ms and B = 006 ms-1
for Tb3+
242526
13 Nuclear Theory
131 Nuclear Power
Currently all nuclear energy irrespective of use is generated by nuclear fission
Nuclear fission is the splitting of a fissile nucleus into two smaller nuclei often aided by
the collision of an incoming particle or neutron The nucleus captures the neutron
which makes it unstable and it breaks into two fragments The splitting process releases
more neutrons which may continue to cause fission of more nuclei generating a chain
reaction An example of a chain reaction caused by 235
U fission can be seen in Figure
15
Figure 15 Chain reaction generated by fission of 235
U into 92
Kr and 141
Ba27
Fission of heavy radioactive actinide elements is exothermic and a chain
reaction can occur if there are enough fissile nuclei present The amount of fissile
material required for a self-sustaining chain reaction is the ldquocritical massrdquo and any mass
above this is referred to as a ldquosupercritical massrdquo which if not controlled can lead to a
runaway chain reaction and a nuclear explosion
52
235U fission is used to generate nuclear power The fission products (FP) collide
with other atoms and their kinetic energy in converted into heat which is absorbed by
the cooling water and then used to drive steam turbines to generate electricity Control
rods are used in the reactor to control the neutron flux and prevent a runaway chain
reaction These are often made of boron nitride which is a neutron absorber
Moderators are also used to slow down the neutrons to the optimum energy for fission
(~2 kJ mol-1
) and these tend to be light nuclei (12
C or 2H)
132 The Nuclear Fuel Cycle
Uranium is mined in its ore form from the ground mainly in Middle Eastern
countries Canada Australia and Africa The ore is then milled to extract the uranium as
ldquoyellowcakerdquo which is mixed oxides of triuranium octoxide (U3O8) uranium dioxide
(UO2) and uranium trioxide (UO3) by leaching with acid or alkali followed by
precipitation The remaining ore ldquotailingsrdquo are disposed of as radioactive waste
The yellowcake is then further processed as only 07 of uranium is fissile
235U the dominant isotope is
238U The uranium oxide is enriched by increasing the ratio
of 235
U238
U to approximately 35-5 235
U This is done by converting all of the mixed
oxides into uranium dioxide and then to uranium hexafluoride (UF6) gas and separating
it into two streams ndash one of which is enriched in 235
U and the other depleted
The enriched UF6 is then converted back to UO2 which can be pressed and
heated to 1400 degC to form fuel pellets The depleted uranium is treated as waste The
fuel pellets are subsequently encased in metal rods which can then be used in a fuel
assembly in a reactor
After 18-36 months the build-up of fission products is such that the efficiency
of the fuel decreases so the fuel rods are removed and replaced The used fuel is then
stored for months or years in water which absorbs the heat until the radiation levels
decrease sufficiently for it to be disposed of or reprocessed As there are no disposal
facilities at present for nuclear fuel waste it is simply isolated from the environment
and left in storage until facilities become available28
A diagram of the Nuclear Fuel
Cycle can be seen in Figure 16
The once-through or ldquoopenrdquo fuel cycle whereby waste is stored for disposal is
favoured by a number of countries including Canada parts of Europe and the USA
presently although some research on reprocessing techniques is being carried out in
these areas as reprocessing is becoming increasingly important for the future of nuclear
power A ldquoclosedrdquo fuel cycle whereby the waste is recycled and reused is becoming
53
more and more favoured as a result of this and has been performed in some parts of the
world for many years including the UK and other parts of Europe Russia and Japan29
Figure 16 The Nuclear Fuel Cycle30
133 Spent Nuclear Fuel and Reprocessing
The reprocessing of spent nuclear fuel (SNF) is essential for preventing the
exhaustion of uranium supplies and reducing the volume and radiotoxicity of the waste
produced
Current reprocessing techniques involve the removal of re-usable uranium and
plutonium present in the waste which can be recycled and reused together in mixed
oxide (MOX) reactors to produce more nuclear power31
The amount of waste
remaining in storage at present worldwide that could be reprocessed is approximately
200000 tonnes with a global reprocessing capacity of around 4000 tonnes per year
90000 tonnes have been reprocessed over the last 50 years
In addition to the reusable U and Pu in the spent nuclear fuel (SNF) there are
also a variety of other fission products (FP) present such as minor actinides (MA) Np
Am and Cm Ln and transition metals (TM) in addition to corrosion products (CP)
54
from steel containers and pipes in the system as a result of radiolysis erosion and
ageing of equipment These are TM chiefly cobalt (Co) chromium (Cr) iron (Fe) and
manganese (Mn) The composition of SNF can be seen in Table 16 Recently research
into the removal of the other actinides from the waste has become important in order to
transmute them into shorter-lived radionuclides so that their radioactivity will not
persist for as long making the disposal process easier and faster This coupled with a
similar approach for any remaining plutonium will make the waste proliferation
resistant as it would not allow the Pu to be recovered from storage in the future for
proliferation purposes
Table 16 Approximate compositions of SNF in Light Water Reactors (LWR)32
Constituent of SNF
U 956
Stable FP (including Ln) 29
Pu 09
Cs amp Sr (FP) 03
I amp Tc (FP) 01
Other long-lived FP 01
MA 01
Although MA only make up 01 of fission products they are highly radiotoxic
and extremely long-lived and so it would be beneficial to separate MA from the
remaining fission products so that they can be transmutated into shorter lived
radionuclides by neutron bombardment The necessity of the separation arises from the
presence of Ln as Ln are known to be neutron scavengers or ldquoneutron poisonsrdquo 33
meaning that they have a high neutron cross section and are able to absorb neutrons
preventing transmutation of other species present
Neptunium is relatively simple to remove from the mixture of fission products
as it has a variety of oxidation states that can be utilised in the process34
However the
predominant trivalent minor actinides (MAs) Am and Cm are much more difficult to
separate from the remaining lanthanide waste due to the similarities in the chemistries
of the elements and the electrostatic nature of interactions of the hard Lewis acidic Ln3+
ions with ligands35
Much of this new research is focussed on separating Am3+
and
Cm3+
from Ln3+
55
134 Solvent Extraction
Currently there are no MA-Ln separation techniques employed commercially
although a number of different processes are being developed particularly in the USA
and Europe with a drive to implement a working process within the next 5 years
Despite differences in the chemistry between the techniques under development all of
them use solvent extraction as the ultimate separation technique
Solvent extraction is the process of separation of two (or more) species using
two immiscible liquids (usually an organic and aqueous phase) by the use of
complexing agents to selectively move only one species between phases This may or
may not be aided by the use of a complexing agent which binds preferentially to one of
the species36
The success of this technique varies between compounds and solvent systems
and can be determined using a separation factor (SF) This is a ratio based on the
distribution ratios (D) of the elements to be separated (Equations 111 and 112)
Equation 111
Equation 112
There are a number of existing methods for removing radiotoxic elements from
fission products these are discussed over the next few sections
1341 PUREX
PUREX (Plutonium and Uranium Refinement by Extraction) is the process used
by nuclear plants that carry out reprocessing to remove U and Pu from the waste in
order to reuse it (Figure 18) Strong nitric acid (~ 4M HNO3) is used to dissolve the
waste in an aqueous phase to form hydrated nitrate complexes of the corresponding
oxides of U and Pu (Equations 113 and 114) High concentrations of acid (2-6 M) are
used to increase the solubility of the oxides
Equation 113 UO22+
+ 2NO3- (aq) rarrUO2(NO3)2xH2O
Equation 114 PuO22+
+ 2NO3- (aq) rarrPuO2(NO3)2xH2O
56
The plutonium complex is then reduced using nitrogen tetroxide (N2O4) to the
corresponding Pu4+
complex and the solution is filtered to remove any precipitates
(Equation 115)
Equation 115 PuO2(NO3)2xH2O + N2O4 rarr Pu(NO3)4xH2O
The solution is then contacted with an organic phase (kerosene) containing tri-
nbutyl phosphate (TBP) as an extracting agent (Figure 17) which forms complexes
with the U and Pu nitrate hydrates to move them into the organic phase (Equations 116
and 117)
Equation 116 UO2(NO3)2xH2O + 2TBP rarr UO2(NO3)2(TBP)2
Equation 117 PuO2(NO3)2xH2O + 2TBP rarr Pu(NO3)4(TBP)2
However Tc and Np are also extracted at this point This is a disadvantage for
the purpose of the PUREX process but is advantageous for subsequent MA-Ln
separation processes which could follow The UO22+
and NpO2+ TBP complexes are
then separated from the Pu4+
and TcO4- complexes by reduction of Pu
4+ to Pu
3+ with
hydrazine (N2H4) and extraction back into water (Equations 118 and 119)3738
Equation 118 N2H4 + H2O harr N2H5+ + OH
-
Equation 119 Pu(NO3)4(TBP)2 + N2H5+ rarr Pu(NO3)3(TBP)2 + N2H5NO3
The Pu3+
and TcO4- are then separated from each other through another
extraction cycle and then a ldquostrippingrdquo solution of nitric acid hydroxylamine and
sulphuric acid to obtain pure Pu The UO22+
and NpO2+ are also extracted back into
aqueous solution and separated from each other through another extraction cycle Pure
U is obtained by using aqueous nitric acid for stripping (back-extraction)39
The process
has been proven to work well and it is an advantage that the organic phase can be reused
after stripping However the process has a few drawbacks ndash the need for high acid
concentrations makes it less environmentally friendly the need for redox control and
less stable oxidation states makes it longer and complicated and the use of phosphorus
reagents makes the products more difficult to dispose of as phosphorus waste is not
57
incinerable and so any radioactive waste must be separated from the phosphorus before
treatment40
Figure 17 Chemical structure of TBP (Tri-nbutyl phosphate)
Figure 18 PUREX flow diagram41
1342 TRUEX
TRUEX (TRansUranic EXtraction) is an example of advanced reprocessing
(removal of MA and Ln) that is being developed in the USA The principle of the
process is to selectively remove Am and Cm (MA) and Ln from the other fission
58
products left in the raffinate after the PUREX process (Figure 110) A combination of
extractants is used carbamoylmethylphosphine oxide (CMPO) (Figure 19) and TBP (as
in the PUREX process) The benefit of the combined extractant system is that the
process is effective over a range of acidities (07-5 M HNO3) The raffinate (in nitric
acid) from the PUREX process is contacted with the extractant in an organic phase of
normal paraffinic hydrocarbon (NPH) Oxalic acid is then added to prevent the co-
extraction of zirconium (Zr) and molybdenum (Mo) with the MA An additional wash is
also performed using sodium carbonate (Na2CO3) to prevent any other fission products
from being co-extracted The extractants selectively remove the MA and Ln into the
organic phase leaving the remaining fission products in the aqueous phase The MA
and Ln are then stripped using nitric acid and can be reprocessed further as required
However a main drawback is that the lanthanides are still present with the MA so
further reprocessing is required 42
Figure 19 Chemical structure of CMPO (NN-diisobutyl-2-
(octyl(phenyl)phosphoryl)acetamide)
59
Figure 110 TRUEX flow diagram
1343 DIAMEX
The DIAMEX (DIAMide Extraction) process is another example of advanced
reprocessing and is currently under development in France by the CEA (Commissariat agrave
lEnergie Atomique et aux Energies Alternatives) (Figure 113) It is similar to the
TRUEX process as the process selectively removes Am and Cm (MA) and Ln from the
PUREX raffinate The process is being researched using a variety of different diamides
as the extractant the most promising of which have been shown to be NNrsquo-dimethyl-
NNrsquo-dibutyl-tetradecylmalonamide (DMDBTDMA) (Figure 111) and NNrsquo-dimethyl-
NNrsquo-dioctyl-hexylethoxymalonamide (DMDOHEMA) (Figure 112)4344
The nitric
acid PUREX raffinate is contacted with the extractant in an organic phase of tetra-
propylene-hydrogenated (TPH) a synthetic branched form of dodecane45
Oxalic acid is
then added to prevent the co-extraction of Zr and Mo with the MA as in the TRUEX
process and the extractant selectively removes the MA and Ln into the organic phase
leaving behind the other fission products in the aqueous phase The MA and Ln are then
stripped using nitric acid and can be reprocessed further as required
The main benefit of this process compared to the TRUEX process is that the
organic waste only contains C H N and O as P reagents are not used so the waste can
be disposed of more easily However like the TRUEX process a main drawback is that
the lanthanides are still present with the MA so further reprocessing is required 46
Figure 111 Chemical structure of DMDBTDMA (N1N3-dibutyl-N1N3-
dimethyl-2-tetradecylmalonamide)
60
Figure 112 Chemical structure of DMDOHEMA (N1N3-dibutyl-2-(2-
(hexyloxy)ethyl)-N1N3-dimethylmalonamide)
Figure 113 Example DIAMEX flow diagram
1344 SANEX
SANEX (Selective ActiNide EXtraction) is another process being developed by
CEA and is intended to be coupled with a TRUEX or DIAMEX type process and is the
next step in the advanced reprocessing whereby the MA and Ln are separated from
each other so that the MA can be treated (Figure 117) Complexing agents such as bis-
triazinyl-pyridines BTPs and their bipyridine variants (BTBPs) (Figure 114) have been
widely studied with a more recent complexing agent tetraoctyldiglycolamide (TODGA)
(Figure 115) being studied47
The complexing agents have been found to preferentially
bind to the MA allow only the MA to be extracted into an organic phase using TBP
leaving the Ln in the aqueous phase Oxalic acid and (2-hydroxyethyl)-
61
ethylenediaminetriacetic acid (HEDTA) (Figure 116) are used to prevent the co-
extraction of any other fission products The chemistry of this process is poorly
understood however and more research is needed48
However many of these extractant
molecules suffered problems that preclude them from use in plant-scale extractions
including poor stability slow extraction kinetics the use of citric acid as a buffer and
inefficient back extraction due to high An3+ affinities
Figure 114 General chemical structure of BTPs (66-di(124-triazin-3-yl)-22-
bipyridine)
Figure 115 Chemical structure of TODGA (22-oxybis(NN-dioctylacetamide))
Figure 116 Chemical structure of HEDTA (22-((2-((carboxymethyl)(2-
hydroxyethyl)amino)ethyl)azanediyl)diacetic acid)
62
Figure 117 SANEX flow diagram for TODGA process
1345 i-SANEX
The innovative SANEX (or i-SANEX) process is also currently under
development at the CEA49
Essentially it is a modified DIAMEX process with selective
back extraction of Am3+
and Cm3+
from the organic phase The MA3+
and Ln3+
ions are
initially extracted from the PUREX raffinate using TODGA and then a hydrophilic
complexant that is selective for MA3+
is employed to back extract the minor actinides
from the loaded organic phase into the aqueous phase In order to retain the lanthanide
ions in the organic phase a nitrate salt is added to the stripping solution Hydrophilic
extracting agents that have been used to demonstrate this technique are DTPA
(diethylenetriaminepentaacetic acid) and the sulphonated BTP derivative 26-bis(56-
di(sulphophenyl)-124-triazin-3-yl)pyridine SFrsquos of up to 1000 are achievable in this
process50
One other option that has been suggested is to add a second stripping agent
such as HDEHP to the organic phase in order to retain the lanthanides in the organic
phase at low pH One major drawback of this process however is the limited operative
acidity range (ca pH 3) which means that buffering agents need to be added to the
aqueous phase in the back extraction step Another reprocessing concept currently under
investigation is the 1-cycle SANEX with the intention to directly extract the trivalent
actinides selectively from the PUREX raffinate A system consisting of 015 M
CyMe4BTBP and 0005 M TODGA in a mixture of 40 TPH and 60 1-octanol has
been proposed51
63
1346 GANEX
The GANEX (Grouped ActiNide EXtraction) process is relatively new and is a
complete separation process combining the principles of the PUREX and TRUEX
processes in order to separate all of the An (U Pu and MA) from the Ln and both from
the other fission products (Figure 121) A complexing agent bis-triazin-bipyridine
(BTBP) (Figure 118) and its variants (such as CyMe4-BTBP (Figure 119) and CyMe4-
BTPhen (Figure 120))52
have been tested and found to be effective in selectively
coordinating to and extracting MA high separation factors of Am3+
over Eu3+
gt 1000
have been documented In the proposed process BTBP is dissolved in cyclohexanone
(as it is soluble in this solvent and has faster extraction kinetics) and used alongside
TBP which extracts U and Pu and is stable against radiolysis and hydrolysis especially
the CyMe4 variant If proven to be successful this process would simplify reprocessing
making it much simpler however much more work is needed before this process could
become operational as co-extraction of fission products is currently a problem53
For the
most attractive candidate to date the CyMe4-BTBP extractant has been successfully
tested for the extraction of genuine actinidelanthanide feed through a 16-stage
centrifugal contactor setup with excellent recoveries for americium and curium
(gt999) but has been shown to undergo radiolytic degradation at doses that will be
encountered at the high minor actinide loadings obtained in the reprocessing of for
example fast reactor fuels The kinetics for actinide extraction with CyMe4-BTBP are
still relatively slow so the addition of a phase-transfer catalyst is necessary (eg NNprime-
dimethyl-NNprime-dioctylethylethoxymalonamide (DMDOHEMA)) if this extractant is to
be used for large- scale partitioning
Figure 118 General chemical structure of BTBPs (66rsquo-bis(124-triazin-3-yl)-22rsquo-
bipyridine)
64
Figure 119 Chemical structure of CyMe4-BTBP (66-bis(5588-tetramethyl-5678-
tetrahydrobenzo[e][124]triazin-3-yl)-22-bipyridine)
Figure 120 Chemical structure of CyMe4-BTPhen (29-bis-(124-triazin-3-yl)-110-
phenanthroline)
65
Figure 121 GANEX flow diagram
1347 TRPO
Another advanced reprocessing extraction process being developed in China is
the TRPO (TRialkyl Phosphine Oxide) process which involves the separation of all
actinides in stages to remove Np and Pu together AmCm and Ln together and isolate
U There are two processes being researched both of which use TRPO (Figure 122) as
the extractant but differ in the other reagents used One system uses TTHA (triethylene
tetramine hexaacetate) (Figure 124) as a complexing agent to selectively bind to
different actinides preferentially at different pH values to allow selective extraction
buffered by lactic acid (Figure 125) The other process uses nitric acid to extract MA
and Ln followed by oxalic acid to extract Pu and Np Both processes then use sodium
carbonate to strip the remaining U from solution (Figure 126) The main advantage of
the first system is that MA and Ln can subsequently be separated from each other using
CYANEX 301 (Figure 123) with the main disadvantage being the need for buffering
due to pH dependence The main advantage of the second system is that the separation
between components is excellent and virtually discrete but the main disadvantage is that
MA and Ln cannot be later separated from each other using CYANEX 301 due to the
high acidity of the solution54
66
Figure 124 Chemical structure of TTHA (3-(2-((2-
(bis(carboxymethyl)amino)ethyl)(carboxymethyl)amino)ethyl)-6-
(carboxymethyl)octanedioic acid)
Figure 125 TRPO flow diagram using TTHA
Figure 122 Chemical structure of TRPO
(trialkyl phosphine oxide R = C6 ndash C8)
Figure 123 Chemical structure of
CYANEX 301 (bis(244-
trimethylpentyl)phosphinodithioic acid)
67
Figure 126 TRPO flow diagram using HNO3 and oxalic acid
1348 LUCA
LUCA (Lanthaniden Und Curium Americium trennung lanthanide and curium
americium separation) is a relatively new process currently being developed in
Germany and is designed to follow the SANEX or DIAMEX processes The process
involves the selective separation of Am3+
from Cm3+
Cf3+
and Ln3+
after co-extraction
A combined extractant system of bis(chlorophenyl)dithiophosphinic acid
((ClPh)2PSSH) and tris(2-ethylhexyl)phosphate (TEHP) in isooctane and tert-butyl
benzene is used Advantages of the LUCA process include high recovery after stripping
and that the phosphinic acid is more stable to hydrolysis and radiolysis than CYANEX
301 however the phosphinic acid was found to be unstable in high HNO3
concentrations55
At present as with the majority of the MALn processes described the
exact origin of the selectivity remains unclear however it is clear that in general
simple extractant molecules are favourable
68
Figure 127 LUCA flow diagram
1349 EXAm
The EXAm (Extraction of Americium) process is another relatively new process
developed by the CEA for the extraction of only americium from a PUREX raffinate56
Americium is the main cause of heat emissions in SNF wastes and so selective removal
and reprocessing of Am is favourable for vitrified waste disposal Separation of Am3+
from Cm3+
was considered as Cm reprocessing would be difficult to implement due to
high neutron emissions which would require very thick shielding
The process uses a mixture of two extractants (DMDOHEMA and HDEHP) in
TPH from a 4-6 M HNO3 FP solution TEDGA (NNNrsquoNrsquo-tetraethyl-diglycolamide)
(Figure 128) is used as the complexing agent to selectively retain Cm3+
and Ln3+
in
solution allowing extraction of Am3+
Advantages of the process are that the use of
TEDGA over TODGA allows increased separation of Am3+
Cm3+
and TEDGA is
relatively resistant to radiolysis However the chemistry remains quite poorly
understood and separation factors are still quite low at ~25 due to the very similar
chemistry of the two metal ions57
Figure 128 Chemical structure of TEDGA (NNNrsquoNrsquo-tetraethyl-diglycolamide)
69
137 TALSPEAK
TALSPEAK (Trivalent Actinide Lanthanide Separation by Phosphorus reagent
Extraction from Aqueous Complexation) is a further effective method of advanced
reprocessing by solvent extraction The process was initially developed at Oak Ridge
National Laboratory in Tennessee USA during the 1960s and it is still being refined
The process is designed to allow the separation of MA3+
(Am3+
and Cm3+
) from
Ln3+
and yttrium (Y3+
) from the other fission products and from each other to allow MA
to be reprocessed further by transmutation Although it is still under development the
TALSPEAK process has a number of benefits over other similar processes discussed in
Section 126 The process is resistant to irradiation and allows the separation to be
carried out without the need for high acid and salt concentrations It also has added
benefits in that it has already been performed on a pilot plant scale and uses cost
effective readily available reagents58
Additionally it can be carried out using relatively
inexpensive stainless steel equipment The process is very promising despite its
potential disadvantage that it involves removing the major constituent from the minor
constituent as studies have shown the separation is effective enough for this not to be a
problem
1371 The Process
In the process the MA preferentially form complexes with an aminopolyacetic
acid chelate over the lanthanides This allows the lanthanides to be better extracted into
an organic phase by a mono-acidic organophosphate or phosphonate (Figures 132 and
134) The most effective complexing agent to date is DTPA (diethylenetriamine
pentaacetic acid) (Figure 129) in the pH 25-35 range giving relatively high SFs (~50
for Nd3+
the most difficult to extract Ln3+
ion) and the most effective extracting agents
are HDEHP (di(2-ethylhexyl)phosphoric acid) (Figure 130) and HEH[ϕP] (2-
ethylhexyl phenyl phosphonic acid) (Figure 131) The extraction can be carried out
without the use of a complexing agent although the separation is not as discrete and is
significantly enhanced by the addition of an aminopolyacetic acid such as DTPA
Without DTPA Eu3+
Am3+
separation factors using 03 M HDEHP are around 40 59
whereas SF ~90 can be achieved when the complexing agent is used with the extractant
Other aminopolyacetic acids have been tested such as TTHA and EDTA but are not as
effective or tend to be less soluble60
70
Figure 129 Chemical structure of DTPA (2222-
((((carboxymethyl)azanediyl)bis(ethane-21-diyl))bis(azanetriyl))tetraacetic acid)
TALSPEAK Process
1 The fission product mixture (1 M) is dissolved in a carboxylic acid which acts
as a buffer and a solubiliser for the complexing agent lactic acid is often used
for this (Figure 132) Lactic acid (pKa 386)61
has been found to be the best
buffer for the process as it gives the best phase separation Nitrate may be
present from the original raffinate but this has been found not to decrease
separation
2 The solution is ldquoscrubbedrdquo with a mixture of Na5DTPA (01 M) in the same
carboxylic acid (1 M) at pH 36 ndash 38 The DTPA5-
complexes to the MA3+
and
Ln3+
but binds more strongly to the MA3+
This pH range is the optimum pH for
DTPA5-
activity as it complexes more strongly at higher pH values but
separation is better in more acidic conditions
Figure 130 Chemical structure of
HDEHP (bis(2-ethylhexyl) hydrogen
phosphate)
Figure 131 Chemical structure of
HEH[ϕP] ((2-(2-
ethylhexyl)phenyl)phosphonic acid)
71
3 The extractant is dilute HDEHP (05 M) in a hydrocarbon solution such as
DIPB (diisopropyl benzene found to give the best separation) which is then
contacted with the aqueous solution containing the LnMA[DTPA]2-
The Ln3+
ions are extracted into the organic phase by the phosphate causing dissociation
of the DTPA5-
and leaving the free DTPA5-
in the aqueous solution The
MA[DTPA]2-
complexes remain in the aqueous solution as DTPA5-
is bound
strongly enough to MA3+
to prevent the complexes from dissociating HEH[ϕP]
gives a better extraction although it makes stripping more difficult
4 After the Ln3+
ions are removed a second scrub is carried out at lower pH (15)
and a lower concentration of the complexing agent (005 M Na5DTPA) in lactic
acid (1 M) in order to extract the MA3+
The lower pH increases the extraction
rate as the DTPA5-
binds less strongly to the MA3+
allowing them to be
extracted more easily at the phase boundary where DTPA5-
dissociates The
phosphate (03 M HDEHP) is dissolved in n-dodecane (a more favourable
diluent) for the second extraction to remove the MA3+
into the organic phase
The use of n-dodecane was found to give better extraction but poorer
separation If Ln3+
and Y3+
are the only fission products present in the original
raffinate solution the MA3+
can be recovered by precipitation with oxalate from
the raffinate
5 Stripping is then carried out using 1 M HNO3 Nitric acid prevents the use of
corrosive chlorides This process can also be used to extract Cf3+
and Es3+
but it
has been found that more concentrated acid is needed for heavier actinides
Figure 132 Chemical structure of lactic acid pKa = 386
72
Figure 133 The solvent extraction process used in TALSPEAK Step 1 Binding of
DTPA to M3+
in the aqueous phase at pH 36 buffered by lactic acid Step 2 Selective
extraction of Ln3+
into the organic phase by HDEHP from the aqueous phase due to
preferential binding of DTPA to MA3+
Additional Notes on the Process
Initial extraction data for the process reported by Weaver et al in 1964 was
obtained by adding isotopic tracers to the aqueous solutions contacting them with the
organic phase performing the separation and measuring the activity by scintillation
counting with a γ-detector Extractions were all repeated 2-3 times to verify the results
and the contact time was 20 minutes which was much longer than necessary
Extractions performed using Na5DTPA and H5DTPA were found to give the same
results at the same pH values although pH adjustment was needed as Na5DTPA is more
alkaline than H5DTPA but H5DTPA is much less soluble The extraction of heavier
lanthanides was found to be slower but did not affect the separation Increasing the
concentration of HDEHP was found to give better separation but made the initial
equilibration time too long and increasing the concentration of DTPA decreased the
separation (Figure 134)
1 2
73
Figure 134 Effect of Na5DTPA concentration on distribution ratios of MA3+
and Ln3+
in TALSPEAK process using 1 M lactate buffer and 03 M HDEHP in DIPB extractant
60
The process is based on the preferential binding of the complexant to the
trivalent actinides over lanthanides Initially this was thought to be due to the fact that
An3+
binding is more covalent than Ln3+
binding However this was found not to be the
sole reason and it is understood that the organic ligand plays a role in the selectivity
The chemistry of the complexation of the ions with the ligand is not yet fully
understood and much work is needed to gain an insight into this complicated
chemistry62
74
Figure 135 TALSPEAK flow diagram
138 Reprocessing Summary
The necessity of reprocessing has arisen from increasing awareness and concern
for the environment in addition to the potential of maximising finite resources whilst
minimising proliferation There are a number of different processes currently under
development none of which have yet been implemented on a commercial scale except
for the PUREX process
The principles of all these process are often very similar although extraction
techniques and reagents vary somewhat There are a number of factors which must be
considered when developing a suitable solvent extraction process for SNF reprocessing
including the ease of stripping (back-extraction) the need for low volatility non-
flammable solvents the potential of the process to be continuous how to minimise
waste production the resistance of the process to radiolysis and degradation
practicality and efficiency of the process and the economic viability63
While some of the chemistry is understood such as the redox chemistry in the
PUREX process much of it is not thus limiting the potential to develop an efficient
process The sheer complexity of the waste content makes partitioning very difficult
and without a full understanding of the chemistry involved in the processes designing
75
an effective working process will be very challenging All of the processes currently
under development have advantages and disadvantages but all are ultimately heading
towards the same goal separation of the actinides from the lanthanides in order allow
the transmutation of the actinides into shorter lived radionuclides for the purpose of
reducing the long-term radiotoxicity of the waste and the volume of waste building up
in storage
TALSPEAK is one of the most promising techniques being researched due to its
numerous advantages particularly its relative resistance to irradiation and ability to be
carried out without the need for high reagent concentrations Additionally it gives
separation factors of ~50-100 comparable to the SANEX process which uses BTP one
of the most effective complexing agents However its main disadvantage is the poor
understanding of the separation mechanisms and complexation chemistry surrounding
it The main focus of research here will be the TALSPEAK process with a view to
improving the understanding of this chemistry and modifying the process to improve its
practicality
14 Project Objectives and Thesis Outline
Recent studies have shown that complexants with soft donor atoms compared to
oxygen (such as N or S) can be used to separate the MA from Ln6465
Initial research in
this area was carried out by our collaborators at Idaho National Lab using amino acids
as a potential buffer and soft donor which if proven to be successful would be able to
eliminate the need for the separate complexing agent and buffer simplifying the process
if amino acids were found to preferentially bind to the MA66
Another benefit to this
change would be the scope for carrying out the process at a lower pH due to the lower
pKa values of the carboxylic acid groups of the amino acids than on DTPA enabling
the system to be buffered to pH 1-2 rather than ~35 Lower pH values are preferred by
industry as higher acid concentrations are easier to control on a large scale pH control
is essential for the distribution ratios for the separation and there is a strong correlation
between the two Low pH values have been found to increase D however DTPA
protonates and precipitates out of the solution at the lowest values The use of amino
acids in place of the complexing agent would allow a lower pH to be used as they would
not fully protonate increasing the SF and making the process more efficient as binding
constants and ligand affinities would be higher To this end several avenues of research
have been explored
76
Chapter 2 presents initial studies carried out using amino acids in a TALSPEAK
system the interaction of amino acids with lanthanide and actinide ions and their
complexes in solution and the susceptibility of amino acid systems to radiolysis
Chapter 3 discusses work carried out at the INL on an L-alanine-buffered
system optimisation of the alanine system at pH 2 in order to maximise separation
potential and the consideration of other amino acid buffers over a range of pH values
Chapter 4 is focussed on an L-glutathione (GSH) buffered system GSH is a
tripeptide showing promise for an improved TALSPEAK system the next step after
research using single amino acids Data was initially obtained via solvent extraction in
order to investigate the separation ability of GSH and conditions were then optimised in
order to achieve maximum separation Interaction of the buffer with various
components in solution including lanthanide ions was probed using various techniques
including luminescence spectroscopy which was also used in determining the
susceptibility of the buffer to -radiolysis
Chapter 5 details the synthesis of amino acid appended DTPA ligands and their
complexation with lanthanide ions as well as their extraction and separation abilities
under different conditions along with radiolysis resistant investigations
77
1 S Cotton Lanthanide and Actinide Chemistry ed D Woolins R Crabtree D
Atwood and G Meyer John Wiley amp Sons Chichester UK 2006 1 1-7
2 C H Evans Episodes from the History of the Rare Earth Elements Kluwer
Academic Publishers Dordrecht Netherlands 1996
3 S Cotton Education in Chemistry 1999 36 4 96 WR Wilmarth RG Haire JP
Young DW Ramey JR Peterson J Less Common Metals 1988 141 275
4 LR Morss NM Edelstein and J Fuger The Chemistry of the Actindie and
Transactinide Elements Springer The Netherlands 4th edn 2010
5 AP Jones F Wall CT Williams Rare Earth Minerals Chemistry Origin and Ore
Deposits ed AP Jones F Wall and CT Williams Chapman and Hall London UK
1966 1 6-10
6 JJ Katz and GT Seaborg The Chemistry of The Actinide Elements Methuen amp Co
Ltd The Pitman Press Great Britain 1957
7 N Kaltsoyannis and P Scott The f elements ed R G Compton S G Davies J
Evans and L F Gladden Oxford University Press United States 1st edn 1999
8 Greenwood NN and Earnshaw A Chemistry of the Elements Butterworth-
Heinemann Great Britain 2nd edn1997
9 MB Jones AJ Gaunt Chem Rev 2012 DOI 101021cr300198m
10 L Natrajan F Burdet J Peacutecaut M Mazzanti J Am Chem Soc 2006 128 7152
11 C Fillaux D Guillaumont J-C Berthet R Copping D Shuh T Tyliszczak C
Den Auwer Phys Chem Chem Phys 2010 12 14253
12 HC Aspinall Chemistry of the f-block Elements ed D Phillips P OrsquoBrien and S
Roberts Gordon and Breach Science Publishers Singapore 2001 vol 5
13 F Gendron K Sharkas and J Autschbach J Phys Chem Lett 2015 6 2183-
2188
14 VBE Thomsen J Chem Educ 1995 72 (7) 616-618
15 Dr Louise Natrajan School of Chemistry The University of Manchester
16 JP Leonard CB Nolan F Stomeo and T Gunnlaugsson Topics in Current
Chemistry 2007 vol 281 pp1-43
17 Y Ma and Y Wang Co-ord Chem Rev 2010 254 972-990
18 LS Natrajan AN Swinburne MB Andrews S Randall and SL Heath Coordin
Chem Rev 2014 266-267 171-193
19 A Bettencourt-Dias Dalton Trans 2007 2229-2241
20 E Hashem AN Swinburne C Schulzke JD Kelly RC Evans JA Platts A
Kerridge LS Natrajan and RJ Baker RSC Adv 2013 3 4350
78
21 C Turro PK Fu and PM Bradley Met Ions Biol Syst 2003 40 323-353
22 Dr Louise Natrajan School of Chemistry The University of Manchester
23 I Billard and G Geipel Springer Ser Fluoresc 2008 5 465-492
24 A Beeby IM Clarkson RS Dickins S Faulkner D Parker L Royle AS de
Sousa JAG Williams and M Woods J Chem Soc Perkin Trans 2 1999 493-504
25 WD Horrocks and DR Sudnick J Am Chem Soc 1979 101 334
26 RM Supkowski and WD Horrocks Inorg Chim Acta 2002 340 44-48
27 Dummiesreg Nuclear Fission Basics httpwwwdummiescomhow-
tocontentnuclear-fission-basicshtml 2015
28 PE Hodgson Nuclear Power Energy and the Environment Imperial College Press
Great Britain 1999
29 P Dyck and MJ Crijns Rising Needs IAEA Bulletin 1998 40 1
30 World Nuclear Association The Nuclear Fuel Cycle httpwwwworld-
nuclearorginfoinf03html 2011
31 Nuclearmatterscouk Re-use of Plutonium as MOX Fuel
httpnuclearmatterscouk201202re-use-of-plutonium-as-mox-fuel 2012
32 World Nuclear Association Processing of Used Nuclear Fuel 2012
httpwwwworld-nuclearorginfoinf69htmla
33 United States Nuclear Regulatory Commission Neutron poison httpwwwnrcgov
2012
34 K L Nash Solvent Extraction and Ion Exchange 1993 114 729-768
35 M P Jensen L R Morss J V Beitz and D D Ensor Journal of Alloys and
Compounds 2000 303-304 137-141
36 Advanced Separation Techniques for Nuclear Fuel Reprocessing and Radioactive
Waste Treatment ed KL Nash and GL Lumetta Woodhead Publishing 1st edn
Cambridge UK 2011
37 CS Dileep Poonam Jagasia PS Dhami PV Achuthan AD Moorthy U
Jambunathan SK Munshi PK Dey and BS Tomar BARC Newsletter 2007 285
130-134
38 H Schmieder G Petrich and A Hollmann J Inorg Nucl Chem 1981 43 (12)
3373-3376
39 SC Tripathi and A Ramanujam Sep Sci and Technol 2003 38 2307
40 G Thiollet and C Musikas Solv Extr Ion Exch 1989 7 813
41 GL De Poorter and CK Rofer-De Poorter 720872 1976 US Pat 4080273 1978
79
42 EP Horwitz DC Kalina H Diamond GF Vandegrift and WW Schulz Solv
Extr Ion Exch 1985 31 75-109
43 A Banc P Bauduin and O Diat Chem Phys Lett 2010 494 (4-6) 301-305
44 J Muller L Bethon N Zorz and J-P Simonin Proceedings of the First ACSEPT
International Workshop 2010
45 C Brassier-Lecarme P Baron JL Chevalier and C Madic Hydrometallurgy
1997 47 57-67
46 O Courson R Malmbeck G Pagliosa K Romer B Satmark J-P Glatz P Baron
and C Madic Radiochim Acta 2000 88 865-871
47 M Sypula A Wilden C Schreinemachers and G Modolo Proceedings of the First
ACSEPT International Workshop 2010
48 C Hill L Berthon P Bros J-P Dancausse and D Guillaneux Nuclear Energy
Agency 7th Information Exchange Meeting Session II 2002
49 S Bourg C Hill C Caravaca C Rhodes C Ekberg R Taylor A Geist G
Modolo L Cassayre G de Angelis A Espartero S Bouvet N Ouvrier Nucl Eng
Des 2011 241 3427 G Modolo A Wilden A Geist D Magnusson R Malmbeck
Radiochim Acta 2012 100 715
50 A Geist U Muumlllich D Magnusson P Kaden G Modolo A Wilden T Zevaco
Solv Extr Ion Exchange 2012 30 433
51 A Wilden C Schreinemachers M Sypula G Modolo Solv Extr Ion Exch 2011
29 190
52 FW Lewis LM Harwood MJ Hudson MGB Drew V Hubscher-Bruder V
Videva F Arnaud-Neu K Stamberg and S Vyas Inorg Chem 2013 52 4993-5005
53 E Aneheim C Ekberg A Fermvik M R St J Foreman T Retegan and G
Skarnemark Solv Extr Ion Exch 2010 284 437-458
54 M Wei X Liu and J Chen J Radioanal Nucl Chem 2012 291 717-723
55 G Modolo P Kluxen A Geist Radiochim Acta 2010 98 193
56 C Rostaing C Poinssot D Warin P Baron and B Lorrain Procedia Chem 2012
7 349-357
57 S Chapron C Marie G Arrachart M Miguirditchian and S Pellet-Rostaing Solv
Extraction and Ion Exchange 2015 33 236-248
58 M Milsson and K L Nash Solvent Extraction and Ion Exchange 2009 273 354-
377
59 G Lumetta AV Gelis and GF Vandegrift Solv Extraction and Ion Exchange
2010 28 3 287-312
80
60 B Weaver and T A Kappelmann Talspeak A new method of separating americium
and curium from the lanthanides by extraction from an aqueous solution of an
aminopolyacetic acid complex with a monoacidic organophosphate or phosphonate
Oak Ridge National Laboratory 1964 1-60
61 K W Raymond General Organic and Biological Chemistry An Integrated
Approach John Wiley amp Sons USA 3rd edn 2010 7 253
62 L Karmazin M Mazzanti C Gateau C Hill and J Peacutecaut Chem Commun 2002
2892-2893
63 KL Nash Actinide Solution Chemistry Proceedings of the Eighth Actinide
Conference Actinides 2005
64 M P Jensen and A H Bond J Am Chem Soc 2002 124 9870-9877
65 L R Martin B J Mincher and N C Schmitt J Radioanal Nucl Chem 2009
282 523-526
66 S Oumlzҫubukҫu K Mandal S Wegner M P Jensen and C He Inorg Chem 2011
50 7937-7939
81
2 COMPLEXATION STUDIES OF Ln amp An WITH DTPA AND BUFFERS
UNDER TALSPEAK CONDITIONS
DTPA (diethylenetriaminepentaacetic acid) is an amino polycarboxylic acid
used to act as a holdback reagent in the TALSPEAK process (Trivalent Actinide
Lanthanide Separation by Phosphorus reagent Extraction from Aqueous Complexation)
an advanced reprocessing technique currently being developed in the USA (Section
137) DTPA is the chelating agent used as it has been shown to complex more strongly
to trivalent minor actinide ions (MA3+
) than lanthanide ions (Ln3+
) in aqueous solution
allowing selective extraction of lanthanides into an organic phase by organophosphate
HDEHP (di-(2ethylhexyl)phosphoric acid) to separate the two components
21 Introduction to An-DTPA and Ln-DTPA Complexes
It is widely known that DTPA ligands bind very well to metal ions in aqueous
media It is commonly used to extract heavy metals from soils for environmental
reasons1 and to treat heavy metal poisoning through its ability to chelate to heavy
metals making them more water soluble and able to be removed from the body
naturally by excretion2 Lanthanide DTPA complexes have been well established
although there is actually very little structural data available on them Most literature
references to lanthanide DTPA complexes discuss their use as MRI contrast agents the
most common choice being Gd-DTPA3 Other reported applications of DTPA-based
lanthanide complexes are for use as biological luminescent probes particularly with Eu4
and Tb5 Due to the highly hygroscopic nature of Ln-DTPA complexes solid state
structural analysis has only been reported in two instances as molecular structures
determined by X-ray absorption spectroscopy (XAS) one for Gd(III)-DTPA (Figure
21) and one for Eu(II)-DTPA6 Most solution state structural analysis for lanthanide
DTPA complexes has been carried out recently in order to better understand MALn
separation and TALSPEAK chemistry The only literature available on An-DTPA
complexes is related to separations chemistry except for actinium-DTPA used in
radiotherapy7
82
Figure 21 XAS molecular structure of Gd(III)-DTPA8
211 Stability of Ln-DTPA and An-DTPA Complexes
Reports on the formation of trivalent actinide complexes with DTPA detail that
the stability of AnDTPA2-
complexes (the dominant DTPA species present at pH 36
which is the pH currently used in the TALSPEAK process) is greater than the stability
of LnDTPA2-
complexes allowing the selective extraction on Ln3+
to take place For
LnDTPA2-
complexes stability constants range from log β = 1948 for La increasing
across the series up to log β = 2283 for Dy (with a slight dip at Gd) decreasing slightly
for the heavier Ln3+
complexes
Stability constants in the literature for AnDTPA2-
have been determined by a
range of techniques including TRLFS CE-ICP-MS spectrophotometry and solvent
extraction and range from log β = 2257 to 2403 for AmDTPA2-
and from log β = 2238
- 2348 for CmDTPA2-
at an ionic strength (I) of 01 M However there is some dispute
on whether AnHDTPA- complexes are also present in solution and this needs to be
accounted for when calculating stability constants as some of these values have been
determined with and some without consideration of AnHDTPA-9101112
Studies conducted by Martin et al determined stability constants of log β =
2219 - 2085 for CmDTPA2-
at I = 1 M over a temperature range of 10-70 degC
compared to log β = 2131 - 2033 for EuDTPA2-
over the same temperature range The
complex EuHDTPA- was found to have a stability constant of log β = 227 - 210 under
TALSPEAK conditions Europium(III)is used as a standard comparison to Am3+
Cm3+
due to the close similarity in chemistry between the elements as a result of their
electronic structures This data clearly shows that the Cm3+
has a higher binding
83
strength to DTPA5-
than Eu3+
The greater exothermic enthalpy of complexation of
CmDTPA2-
than EuDTPA2-
(-407 kJ mol-1
vs -336 kJ mol-1
) determined by
microcalorimetry indicated stronger covalent bonding of Cm3+
to DTPA5-
than Eu3+
Luminescence spectroscopy carried out in support of these studies found that
CmDTPA2-
has a shorter luminescence lifetime than EuDTPA2-
(268 micros in H2O 815 micros
in D2O for Cm3+
cf 630 micros in H2O 6200 micros in D2O for Eu3+
) This along with the
biexponential decay pattern indicating the presence of two species for Cm3+
was
attributed to faster exchange between Eu3+
and the ligandsolvent than for Cm3+
suggesting that the exchange for Eu3+
is not distinguishable on the luminescence
timescale and therefore less susceptible to the associated quenching effects This may be
due to the more ionic bonding of Eu3+
to the ligand
The pKa for the protonation of MDTPA2-
to MHDTPA- (M = metal ion) is 227
for Eu and 025 for Cm indicating that CmHDTPA- is only likely to be present in
solutions of very low pH (pH ltlt 1) It was hypothesised that the presence of
LnHDTPA- facilitates the exchange between ligand and solvent explaining the
observed difference in luminescence lifetime data consistent with stronger
complexation of MA3+
to DTPA and slower kinetics of MA3+
extraction as the
MDTPA2-
is less likely to dissociate13
212 Co-ordination Chemistry of Ln-DTPA and An-DTPA Complexes
It is known that Ln3+
ions co-ordinate to DTPA5-
in aqueous solution at pH 36
through the 5 deprotonated carboxylate groups (COO-) on the molecule and through the
three nitrogen atoms on the DTPA backbone forming an octadentate complex with one
water molecule in its inner hydration sphere giving the Eu3+
ion a co-ordination number
of 9 in the shape of a distorted capped square antiprism This is also the case for the
LnHDTPA- species
Figure 22 Chemical structure of [Eu(DTPA)]2-
84
The co-ordination mode of DTPA5-
to MA3+
is the same as for Ln3+
octadentate
(Figure 21) with a co-ordination number of 9 due to 1 water molecule bound to the
metal ion Hydration numbers of 2 have been reported for Cm-DTPA complexes but
have been found not to be stable14
DFT optimisation of CmDTPA2-
and EuDTPA2-
structures conducted by Martin
et al found that the M-O bond lengths were similar for both metal ions but that the M-
N bond lengths were shorter for Cm3+
than Eu3+
(by 004-008 Aring) Considering that
Cm3+
has a larger ionic radius than Eu3+
this suggests that Cm3+
binds more strongly to
the intermediate N donors on the DTPA molecule Further optimisations showed that
significant changes in bond lengths upon protonation of MDTPA2-
to MHDTPA-
indicated that M-N interactions are weakened to a greater extent for Cm3+
than Eu3+
so
that MHDTPA- is less likely to form for Cm
3+ in solution than Eu
3+ This data is
consistent with the pKa data for the complexes (Section 211)
22 Ln-DTPA Complexation Studies
As a first experiment (in order to verify the experimental procedures for
subsequent studies) the complex [Eu(DTPA)H2O]2-
was formed from europium nitrate
(1 mM) and Na5DTPA (005 M) in H2O and D2O at pH 36 and characterised by 1H
NMR spectroscopy (for the complex in D2O) and luminescence spectroscopy (D2O and
H2O)
221 1H NMR Studies of Ln-DTPA
1H NMR spectra are difficult to fully assign for Ln
3+ DTPA complexes due to
both the paramagnetic nature of the ions and the (fast) chemical exchange of the CH2
carboxylate and ethylene diamine backbone protons which results in significant
spectral broadening However complex formation can be verified at lower temperatures
(here 5 degC) where this conformational exchange is slowed down so the paramagnetic
broadening and shifting of the CH2 DTPA proton resonances can be observed in the 1H
NMR spectrum (Figure 23) by comparison with uncomplexed DTPA (Figures 24a-c)
85
EUDTPAESP
15 10 5 0 -5 -10 -15 -20
Chemical Shift (ppm)
0
0005
0010
0015
0020
0025
0030
0035
0040
0045
0050
0055
Norm
alized Inte
nsity
152
8
99
196
6
88
4
53
7
42
536
033
528
7
15
8
-01
1
-16
1
-40
6
-57
3-6
33
-105
3
-126
8
-148
3
-170
2
-184
7
Figure 23 1H NMR spectrum of [Eu(DTPA)]
2- in D2O at 278 K at pD = 36
DTPA pH71resp
55 50 45 40 35 30 25 20
Chemical Shift (ppm)
0
0005
0010
0015
0020
0025
0030
0035
0040
0045
0050
0055
0060
Norm
alized Inte
nsity
199100215418
DEUTERIUM OXIDE
Water
38
1
34
033
833
632
8
30
630
530
3
a
86
DTPA pH361resp
55 50 45 40 35 30 25 20
Chemical Shift (ppm)
0
0005
0010
0015
0020
0025
0030
0035
0040
0045
0050
0055
0060
Norm
alized Inte
nsity
204206100421
Water
47
647
5
38
5
35
634
634
434
3
31
531
431
2
DTPA pH21resp
55 50 45 40 35 30 25 20
Chemical Shift (ppm)
0
0005
0010
0015
0020
0025
0030
0035
0040
0045
0050
0055
0060
Norm
alized Inte
nsity
202199100406
Water
47
5 46
9
39
0
35
4
34
033
933
7
31
130
930
8
Figure 24 1H NMR spectra of DTPA in D2O at 278 K at varying pD a) pD 7
[DTPA]5-
b) pD 36 [H3DTPA]2-
c) pD 2 [H5DTPA]
222 Luminescence Studies of Ln-DTPA
Emission spectra were recorded for Eu
3+ (1 mM) with and without DTPA
5- (005
M) present in aqueous solution (Figure 25) following 397 nm excitation directly into
the 5L6 f-f absorption band
15 The formation of [Eu(DTPA)]
2- can be observed by the
splitting of the peaks in the emission spectrum of the complex compared to the free
Eu3+
(aq) representing the 5D0 rarr
7FJ transitions where J = 0 1 2 3 and 4 This is due to
crystal field splitting caused by the ligand and is indicative of strong binding of the
ligand to Eu3+
ion at pH 361617
The emission intensity is also significantly enhanced
upon the complexation of Eu3+
to DTPA5-
as the chelating ligand forms an octadentate
b
c
87
complex significantly lowering the degree of quenching of the emission by surrounding
solvent molecules
Figure 25 Emission spectrum of Eu3+
(aq) and [Eu(DTPA)]2-
in D2O at pD 36
Additionally the luminescence lifetimes of the free Eu3+
(aq) and the
[Eu(DTPA)]2-
complex were measured in D2O and H2O This allows calculation of q
which represents the number of bound solvent molecules in the inner hydration sphere
of the metal ion The original Horrocks equation18
(Equation 19) and modified
Horrocks equation1920
for q lt 2 (Equation 110) are shown below
Equation 21
Equation 22
The Horrocks equation uses the emission lifetimes (τ) to determine q A is the
proportionality constant taking into account the inner hydration sphere and B is a
correction factor taking into account the outer hydration sphere A and B values are
experimentally determined constants and are available for Sm3+
Eu3+
Tb3+
Nd3+
Yb3+
Am3+
and Cm3+
The q values can be effectively determined from solutions of water and
methanol For the original Horrocksrsquo equation A = 105 for Eu3+
and A = 42 for Tb3+
and for the modified Horrocksrsquo equation (when q lt 2 ) A = 12 ms and B = (025 ndash
0
2
4
6
8
10
12
14
16
18
550 570 590 610 630 650 670 690 710
Emis
sio
n In
ten
sity
(au
) x
10
00
0
Wavelength (nm)
[Eu(DTPA)]2-
Eu3+
5D0 rarr 7F0
5D0 rarr 7F1
5D0 rarr 7F2
5D0 rarr 7F3
5D0 rarr 7F4
88
0075x) ms-1
(where x = the number of exchangeable N-H oscillators) for Eu3+
and A =
5 ms and B = 006 ms-1
for Tb3+
The q value was found to be 9 for Eu3+
(aq) suggesting that the Eu3+
ion is
surrounded by 9 solvent molecules forming [Eu(H2O)9]3+
in aqueous solution as
expected For [Eu(DTPA)]2-
formed at pH 36 q was found to be 14 plusmn 02 showing that
only 1 water molecule is bound to the metal ion This compares well to the literature
values reported at pH 7 where the lifetimes are similar and q = 1121
23 An-DTPA Complexation Studies
The aminopolycarboxylate DTPA5-
chelates even more strongly to An3+
ions
than Ln3+
ions Preliminary 1H NMR and luminescence analyses were carried out by
Louise Natrajan at KIT-INE in Karlsruhe Germany on Am3+
and Cm3+
complexation
with DTPA as part of the FP7 EURACT-NMR scheme (Scheme 21)
Scheme 21 Complexation of DTPA to Am3+
and Cm3+
231 1H NMR Studies of An-DTPA
The complex [Am(DTPA)xH2O]2-
was formed and analysed by 1H NMR in a
41 ratio of MeODD2O with an additional drop of NaOD to ensure complex formation
from a dried acidic americium nitrate stock salt and Na5DTPA The spectra were taken
over a temperature range of 210-365 K at ~ pD 3 (Figure 26) Note here that the exact
pD of the solution could not be accurately measured due to the high specific activity of
the 241
Am isotope used From the spectrum it can be seen that at pD 3 there is a DTPA
complex formed and that at higher temperatures there are some dynamic exchange
processes occurring as the resonances become broader and the spectrum becomes
simpler This is most likely due to conformational changes in the DTPA ligand
(movement of the carboxylates and the ethylene bridge protons analogous to DOTA
and DO3A derivatives)22
The Am3+
ion is essentially diamagnetic as it has a 7F0 ground state and the
magnetic moment is calculated as 0 based on the Russell Saunders coupling scheme
89
The same is true for the isoelectronic lanthanide analogue Eu3+
but in this ion
significant paramagnetism is induced at room temperature due to low-lying energy
levels that are thermally populated according to the Boltzmann distribution Thermal
mixing of J states induces a paramagnetic shift but in the case of Am3+
the second J
level lies much higher in energy (~ 4000 cm-1
higher) so may only be populated and
induce a paramagnetic shifting of proton resonances at higher temperatures2324
Indeed
a slight shift of the proton resonances with temperature is observed for
[Am(DTPA)xH2O]2-
potentially indicating a small contribution of the Am3+
7F1 excited
state to the chemical shift of the proton resonances
Figure 26 1H NMR spectrum for [Am(DTPA)xH2O]
2- in 41 vv MeODD2O with
NaOD over a temperature range at pH 3
232 Luminescence Studies of An-DTPA
Emission spectra were recorded for solutions of
243Cm
3+ (015 microM Cm
3+ in 32
mM HClO4 diluted to 1 mL with H2O) with and without Na5DTPA (02 M) present in
aqueous solution following direct excitation at 3966 nm into the f-f absorption band of
Cm3+
(Figure 27) The formation of [Cm(DTPA)]2-
can be observed by the immediate
formation of a new red shifted emission band at 607 nm attributed to the 6D72
8S72
transition in the complex compared to that in free Cm
3+(aq)
at 593 nm The f-f transitions
in Cm3+
are much more sensitive to the coordination environment than Ln3+
due to more
210 K
265 K
300 K
365 K
90
spin orbit coupling and the fact the 5f orbitals are more spatially diffuse than the 4f
orbitals resulting in a much greater difference in emission spectra upon complexation
for actinides than lanthanides
Figure 27 Emission spectrum of Cm3+
and [Cm(DTPA)]2-
in perchloric acid at pH 3
by direct excitation with a NdYAG pumped dye laser at 3966 nm
Similarly to Eu3+
the inner hydration sphere of the free Cm3+
ion is known to
contain 9 water molecules25
In 1998 Kimura and Choppin developed a modified
version of the Horrocks equation in order to allow q to be calculated from aqueousnon-
aqueous solvent mixtures (Equation 23)26
Equation 23
The lifetime of the [Cm(DTPA)]2-
complex in H2O is 510 micros and is significantly
longer than that of the aqua ion which is determined as 68 micros The radiative lifetime of
the complex can be directly inserted into this equation and indicates that there are 16
water molecules (between 1 and 2) co-ordinated to the metal ion again showing the
formation of an octadentate complex with DTPA ligand analogously to Eu3+
24 Introduction to Buffer Interaction with Ln3+
and Ln-DTPA Complexes
241 Interaction of Lactate with Ln3+
and Ln-DTPA Complexes
A lactic acidlactate buffer is used in the TALSPEAK process to buffer the
system to pH 36 Lactate (Lac) is known to co-ordinate to M3+
ions27
to form
40
45
50
55
60
65
70
75
80
570 590 610 630
Emis
sio
n In
ten
sity
(au
) Tho
usa
nd
s
Wavelength (nm)
Cm3+(aq)
[Cm(DTPA)]2-
91
M3+
(CH3CH(OH)COO-)3 Equations 24a-c show the formation of Eu
3+-lactate
complexes
Equation 24a-c
(a)
(b)
(c)
Stability constants for each of the species formed in Equations 24a-c were
determined by Martin et al over a temperature range of 0-70 degC Log β values were
found to be 290-281 for Eu(Lac)2+
log β = 490-449 for Eu(Lac)2+ and log β = 624-
633 for Eu(Lac)3 Luminescence spectroscopy of Eu-lactate formation showed that as
the concentration of lactate was increased from 0 mM to 73 mM the emission intensity
of the J=2 peak (5D0 rarr
7F2 transition) at 615-620 nm increased but the J=1 peak (
5D0 rarr
7F1 transition) at 590-600 nm was not significantly affected changing the J=1J=2 peak
ratio suggesting that the co-ordination mode of the lactate to the Eu3+
ion changes as a
function of lactate concentration as the J=1 peak is a magnetic dipole transition which is
insensitive to the co-ordination of the ion (Figure 28)28
Figure 28 Emission spectrum of Eu-lactate as a function of lactate concentration28
The luminescence lifetimes of Eu3+
in water also increased as the lactate
concentration was increased indicating that the number of water molecules directly co-
ordinated to the metal ion decreases from ~9 to ~5 due to complexation with lactate
Luminescence and thermodynamic data suggest that lactate co-ordinates in a bidentate
92
mode to Ln3+
ions through the deprotonated carboxylate group and also through the α-
hydroxyl group (Figure 29) making Ln-lactate complexes more stable than simple
monocarboxylates with monodentate co-ordination28
Figure 29 Co-ordination mode of lactate to Eu3+
28
The interaction of lactate ions with metal-DTPA complexes is less well
understood It is considered that there is an exchange between the Ln3+
ion and the
lactate and DTPA ligands The concentration of lactate has been shown by Nash et al to
affect the complexation and dissociation of [Ln(DTPA)]2-
however it is not understood
whether this is due to the changing pH with lactate concentration since extraction in the
TALSPEAK process is heavily dependent on pH29
TALSPEAK extractions using
lactate without DTPA show poor separation of Ln3+
over Am3+
DTPA is required to
achieve separation of MA3+
from Ln3+
as lactic acid acts only as a buffer and not a
holdback reagent
Research has shown previously that binary complexes are dominant in the
TALSPEAK process chiefly in the form of MDTPA2-
and M(Lac)n3-n
Studies carried
out using spectrophotometry luminescence spectroscopy and thermometric
experiments have shown that ternary M3+
-DTPA-lactate complexes with lactate co-
ordinated directly to the metal centre are only present in very small quantities and so
will have negligible effect on metal separation However it is possible that outer sphere
ternary M3+
-DTPA-lactate complexes may form where the lactate interacts with the
DTPA molecule although it is expected these would also be present only in minor
quantities and so would also have negligible effect on metal separation30
242 Interaction of Amino Acids with Ln3+
and Ln-DTPA Complexes
The potential of using amino acids as a combined buffer and soft donor was
considered as it was thought that the increased number of softer donors on amino acids
93
compared to lactate may remove the need for the separate buffer and DTPA holdback
reagent if amino acids were found to preferentially bind to MA3+
in solution There have
been few studies on the interaction of amino acids with lanthanide ions and none with
actinide ions or with DTPA Stability constants for amino acids with lanthanide ions31
can be found in the literature and like stability of lactate complexes with Ln3+
ions32
generally tend to increase across the lanthanide series from La-Lu as the Lewis acidity
of the metal ions increases The values are close to the stability constants for Ln-lactate
complexes averaging at around 5-6 depending on the metal ion and amino acid Log β
values for La-Sm with glycine range from 532-584 and with L-alanine log β = 582-
668
25 Studies on Buffer Interaction with M3+
and [M(DTPA)]2-
Initial studies in this area considered the interaction of various amino acids and
lactate with lanthanide ions in TALSPEAK systems The amino acids glycine L-alanine
and L-serine (Figure 210) were chosen to begin this research due to their similarity in
molecular structure to lactate and good solubility in water
Figure 210 Chemical structures of L-alanine (top) glycine (bottom left) and L-serine
(bottom right)
251 1H NMR Studies on Buffer Interactions
L-alanine (1 M) was added to Eu(NO3)3 (10 mM) in D2O and analysed by
1H
NMR spectroscopy (Figure 211) The spectrum shows that L-alanine complexes
weakly with the metal ion as there is minimal paramagnetic line broadening and only
slight shifting of the proton resonances from that of L-alanine itself (Figure 212)
94
New Eu Ala0011resp
55 50 45 40 35 30 25 20 15 10 05 0
Chemical Shift (ppm)
0
005
010
015
Norm
alized Inte
nsity
310100
CH3
CH
Water
47
147
1
35
5
12
712
6
Figure 211 1H NMR spectrum of Eu(NO3)3xH2O (10 mM) with L-alanine in D2O at
278 K
Ala1resp
55 50 45 40 35 30 25 20 15 10 05 0
Chemical Shift (ppm)
0
01
02
03
04
05
06
07
08
09
10
Norm
alized Inte
nsity
336100
CH3
CH
Water
36
536
336
2
13
3
Figure 212 1H NMR spectrum of L-alanine in D2O at 278 K
95
The interaction of L-alanine (1 M) with [Eu(DTPA)]2-
(10 mM) in D2O was also
investigated by 1H NMR spectroscopy (Figure 213) This spectrum shows that the L-
alanine does not bind to the europium DTPA complex on the experimental timescale as
there is no paramagnetic broadening or shifting of the amino acid peaks and the ligand
is present as uncomplexed ligand
EuDTPA Ala1esp
15 10 5 0 -5 -10 -15 -20
Chemical Shift (ppm)
0005
0010
0015
0020
0025
0030
0035
Norm
alized Inte
nsity
150
5 96
892
185
2
75
4
50
4
39
533
231
625
8
14
6
05
0
-13
1
-44
2
-63
3-6
86
-108
2
-127
6
-143
1
-169
0
-183
9
Figure 213 1H NMR spectrum of [Eu(DTPA)]
2- (10 mM) with L-alanine (1 M) in D2O
at 278 K
252 Luminescence Studies on Buffer Interactions
2521 Sensitisation Tests
Luminescence studies on a [Tb(DTPA)]2-
(1 mM) complex in the presence of
the amino acid L-phenylalanine (05 M) (Figure 215) at pH 3 were initially carried out
in order to determine if sensitised emission occurs whereby energy would be
transferred from the phenyl chromophore of the amino acid to the metal ion This could
potentially occur if the amino acid was in close proximity (ie bound) to the metal ion
and would give some indication into the interaction between the amino acid and the
metal ion However sensitised emission was found not to occur as when the complex
was excited in the region of the phenyl chromophore (250 nm) no emission occurred
When excited directly into the f-f region of the Tb3+
complex at 379 nm there was a
slight decrease in emission intensity upon the addition of L-phenylalanine however the
decrease is not significant The excitation spectrum was recorded of the emission at 545
96
nm and showed only the presence of f-f transitions and no contribution from the organic
region (Figure 214)
Figure 214 Emission spectra of [Tb(DTPA)]2-
in D2O at pD 3 with and without the
presence of L-phenylalanine (05 M) excited at 250 nm and 379 nm Excitation
spectrum of [Tb(DTPA)]2-
in D2O at pD 3 with L-phenylalanine (05 M) at 545 nm
Figure 215 Chemical structure of L-phenylalanine
2522 Aqueous Phase Lanthanide Studies without Na5DTPA
Emission spectra of Eu3+
(1 mM Eu(NO3)3) were taken in D2O and H2O with the
presence of different amino acidslactate (1 M) in order to determine whether the amino
acids bind to the metal ions at pH 36 (TALSPEAK pH) The emission spectrum of the
free metal ion in solution was also measured for comparison (Figure 216)
0
100
200
300
400
500
600
700
0
5
10
15
20
25
30
220 320 420 520 620
Ab
sorp
tio
n In
ten
sity
(au
) Th
ou
san
ds
Emis
sio
n In
ten
sity
(au
) Th
ou
san
ds
Wavelength (nm)
TbDTPA exc 379 nm
TbDTPA + Phe exc 250 nm
TbDTPA + Phe exc 379 nm
Excitation of TbDTPA + Phe at 545 nm
97
Figure 216 Emission spectra of Eu(NO3)3 in D2O at pD 36 with and without the
presence of amino acidslactate (1 M) excited at 395 nm at 298 K
The emission intensity increases upon the addition of amino acidslactate to Eu3+
in D2O This shows that the amino acids are interacting with the metal ion however the
emission spectra resemble that of the free aqua ion suggesting that the amino acids and
lactate are not binding to the metal ion The presence of the amino acids at such a high
concentration will reduce quenching effects from the surrounding solvent molecules
which may be one explanation for the increased emission intensity At pH 36 the
amino acids will be in their zwitterionic form (H3N+-CHR-COO
-) and so are likely to
co-ordinate with the free metal ion in the same manner as lactate however this co-
ordination appears to be very weak and they are probably in fast exchange with
surrounding water molecules
The q values of the Eu3+
ions were calculated from the luminescence lifetimes in
H2O and D2O using the original Horrocks equation (Equation 19) The results can be
seen in Table 21
0
2
4
6
8
10
12
14
550 570 590 610 630 650 670 690 710
Emis
sio
n In
ten
sity
(au
) x
10
00
0
Wavelength (nm)
Eu3+
Eu-Lactate
Eu-Gly
Eu-Ala
Eu-Ser
98
Table 21 Luminescence lifetimes and q values for Eu3+
with amino acidslactate
Estimated error on lifetimes = plusmn 10 and on q plusmn 02
The number of bound solvent molecules in the inner hydration sphere of Eu3+
decreases with the addition of amino acidslactate from 9 to approximately 6 This is
consistent with possible fast exchange of water molecules with co-ordinated amino
acids and shows that an average of 3 amino acidslactate ions are co-ordinating to the
metal
2523 Aqueous Phase Lanthanide Studies with Na5DTPA
Emission spectra of Eu(NO3)3 (1 mM) with Na5DTPA (01 M) were recorded in
D2O and H2O with the presence of different amino acidslactate (1 M) at pH 36 in order
to determine whether the amino acids bind to the complexed metal (Figure 217)
Figure 217 Emission spectra of Eu-DTPA in D2O at pD 36 with and without the
presence of amino acidslactate (1 M) excited at 395 nm
0
5
10
15
20
25
550 600 650 700
Emis
sio
n In
ten
sity
(au
) x
10
00
0
Wavelength (nm)
EuDTPA
EuDTPA-Lactate
EuDTPA-Gly
EuDTPA-Ala
EuDTPA-Ser
τ in H2O (ms) τ in D2O (ms) q
Eu3+
011 165 89
Eu Lactate 016 194 60
Eu Gly 016 183 60
Eu Ala 016 187 60
Eu Ser 019 147 48
99
The emission intensity does not change upon the addition of amino acidslactate
to [Eu(DTPA)]2-
in D2O These spectra also do not change shape and there is no
observable shift resembling that of the [Eu(DTPA)]2-
species suggesting that the amino
acids and lactate are not binding to the metal complex
The q values of the Eu3+
ions were calculated from the luminescence lifetimes in
H2O and D2O using the original Horrocks equation (Equation 19) The results can be
seen in Table 22
Table 22 Luminescence lifetimes and q values for [Eu(DTPA)]2-
with amino
acidslactate Estimated error on lifetimes = plusmn 10 and on q plusmn 02
From these kinetic data it is clear that q does not change for [Eu(DTPA)]2-
upon
the addition of amino acidslactate showing that there is no significant interaction with
the Eu3+
ion and they do not bind to the metal ion of the complex This may be due to
steric factors as the DTPA5-
is octadentate and fully complexed to the metal ion leaving
room for only 1-2 solvent molecules to bind to the ion and making it difficult for any
larger species to exchange
2524 Aqueous Phase Actinide Studies with Na5DTPA
In order to determine whether amino acids interacted any more with actinides
than lanthanides the emission spectrum of [Cm(DTPA)]2-
(1 mM) was taken with the
addition of L-alanine (25 mM) at KIT-INE Karlsruhe (Figure 218)
τ in H2O τ in D2O q
Eu DTPA 063 230 23
Eu DTPA Lactate 063 216 22
Eu DTPA Gly 065 203 20
Eu DTPA Ala 065 209 21
Eu DTPA Ser 065 208 21
100
Figure 218 Emission spectrum of [Cm(DTPA)]2-
in H2O with and without L-alanine
(25 mM) at pH 3 by direct excitation at 396 nm The spectra are reported uncorrected
for differences in the incident laser power for clarity
Upon addition of L-alanine there is no change in the emission spectrum - no red
shift or change in emission intensity (quantum yield) compared to complexation of
Cm3+
to DTPA5-
(Figure 26) Moreover the luminescence lifetime is the same as
[Cm(DTPA)]2-
and there is no change in the calculated value of q indicating either no
interaction of the L-alanine with the complex or a very weak interaction such as fast
exchange of the buffer and bound solvent molecules showing that the L-alanine does
not strongly interact with Cm3+
253 Radiolysis Studies on Amino Acid Buffered Systems
2531 Previous Studies at the INL
The TALSPEAK process is known to be relatively resistant to radiation effects
both alpha and gamma radiation when compared to the PUREX and SANEX
processes33
The use of lactic acid buffer has been shown to reduce the degradation of
DTPA by radiolysis34
although the chemistry of the lactic acidlactate ion interaction
with the system is still not clear α radiolysis experiments were carried out at INL by the
Martin group initially on lactic acid and then on an L-alanine system in order to
determine the temperature-dependent rate constants of the reaction of the hydroxyl
radical (middotOH) with the buffers at pH 3 (Figure 219) It is thought that at this pH
oxidising reactions are dominant since dissolved O2 in the solution would remove most
40
45
50
55
60
65
70
75
80
570 580 590 600 610 620 630 640
Emis
sio
n In
ten
sity
(au
) Tho
usa
nd
s
Wavelength (nm)
[Cm(DTPA)]2-
[Cm(DTPA)]2- + Ala
101
of the hydrated electrons (e-(aq)) and middotH radicals caused by radiolysis leaving middotOH
radicals present in solution The rate constants were measured using Linear Accelerator
(LINAC) electron pulse radiolysis
Measurements showed that the reaction rate of the middotOH radical with L-alanine is
slower than with lactic acid suggesting that a modified version of the TALSPEAK
process using amino acids would be more resistant to radiolysis
Figure 219 Graph illustrating the rates of reaction of the middotOH radical with L-
alanine compared to lactic acid and the lactate ion 35
Further studies at the INL were carried out on the L-alanine to measure the
effect of γ-radiation on the separation of Eu3+
from Am3+
These studies were carried
out by varying the γ radiation dose (5 ndash 50 kGy) the pH (2 ndash 3) and the L-alanine
concentration (05 ndash 15 M) The extraction of Ln3+
ions was found not to be affected by
increasing the dose to both phases and the extraction of Am3+
was found to increase
only slightly as the dose was increased (Figure 220) The results show that the effect of
γ-radiation on the separation factors is negligible with increasing dose (Table 23)
32 33 34 3517
18
19
20
21
Alanine (pH 30)
Lactate ion (pH 60)
Lactic acid (pH 10)
ToC k M
-1 s
-1Error
1046 59E7 49E6
306 849E7 421E6
305 832E7 419E6
402 102E8 816E6
Arrhenius OH amp lactate at pH 30
Int ln(A) = 2353 plusmn 115
Ea = 1333 plusmn 289 kJ mol-1
R2 = 0990
ln (
kM
-1 s
-1)
103Temp (K)
102
Figure 220 Distribution ratios for Ln3+
and Am3+
in the presence of L-alanine
at 05 M pH 2 at different doses of γ-radiation36
Table 23 Separation factors for Eu3+
Am3+
in the presence of L-alanine at 05 M under
TALSPEAK conditions when subjected to different doses of γ-radiationError Bookmark
not defined
Separation Factor EuAm
5 kGy 10 kGy 50 kGy 100 kGy
pH 2 5620 5519 5132 5103
pH 3 1595 1653 1589 1252
2532 Irradiation Studies using Amino Acid Buffers
The [Eu(DTPA)]2-
systems at pH 36 were irradiated with γ radiation using a
60Co irradiator at the Dalton Cumbrian Facility to determine the effect of radiation on a
range of amino acid buffers
103
Figure 221 Emission spectra of Eu3+
in D2O at pD 36 with and without the presence
of amino acidslactate excited at 395 nm before 5 kGy γ-irradiation
Figure 222 Emission spectra of Eu3+
in D2O at pD 36 with and without the presence
of amino acidslactate excited at 395 nm after 5 kGy γ-irradiation
The emission intensity of the irradiated samples (Figure 222) was lower than
before irradiation (Figure 221) which is likely to be due to quenching effects from
radicals produced by degradation of the solvent However the spectral profiles remain
0
50
100
150
200
250
550 600 650 700
Emis
sio
n In
ten
sity
(au
) Th
ou
san
ds
Wavelength (nm)
EuDTPA
EuDTPA-Lactate
EuDTPA-Gly
EuDTPA-Ala
EuDTPA-Ser
0
20
40
60
80
100
120
140
550 600 650 700
Emis
sio
n In
ten
sity
(au
) Th
ou
san
ds
Wavelength (nm)
EuDTPA
EuDTPA-Lactate
EuDTPA-Gly
EuDTPA-Ala
EuDTPA-Ser
104
the same and still resemble that of [Eu(DTPA)]2-
and t-tests showed that there was no
significant difference between the spectra of each of the buffers
The luminescence lifetimes were also measured for samples before and after
irradiation and before and after extraction into an organic phase (02 M HDEHP in
dodecane) (Table 24)
Table 24 Luminescence lifetimes for aqueous and organic phases for
[Eu(DTPA)]2-
systems before and after irradiation at pH 36 Estimated error on
lifetimes = plusmn 10
Table 25 Luminescence lifetimes and q values for [Eu(DTPA)]2-
systems before and
after irradiation at pH 36 Estimated error on lifetimes = plusmn 10 and on q = plusmn 02
τ of aqueous
phase
before
irradiation
(ms)
τ of aqueous
phase
after
irradiation
(ms)
τ of
organic
phase
before
irradiation
(ms)
τ of
organic
phase
after
irradiation
(ms)
Eu DTPA 063 066 222 262
Eu DTPA Lactate 063 063 241 251
Eu DTPA Gly 065 064 247 249
Eu DTPA Ala 065 065 211 238
Eu DTPA Ser 065 062 260 251
τ of
aqueous
phase
before
irr [H2O]
(ms)
τ of
aqueous
phase
after
irr[H2O]
(ms)
τ of
aqueous
phase
before irr
[D2O] (ms)
τ of
aqueous
phase
after irr
[D2O] (ms)
q
before
irr
q after
irr
Eu DTPA 063 066 230 227 11 10
Eu DTPA
Lactate
063 063 216 210 10 10
Eu DTPA
Gly
065 064 203 208 10 10
Eu DTPA
Ala
065 065 209 211 10 10
Eu DTPA
Ser
065 062 208 206 10 10
105
There was negligible change in luminescence lifetime before and after
irradiation for both aqueous and organic sample sets There was also no change in
hydration number q before and after irradiation of the aqueous phase (Table 25)
These data along with the consistent profiles of the emission spectra is analogous with
the radiolysis data from the INL and shows that the amino acid buffers glycine alanine
and serine are relatively resistant to -radiolysis
254 Buffer Interaction Summary
The potential of using amino acids as a combined buffer and soft donor was
initially investigated by considering the interaction of the buffers glycine L-alanine L-
serine L-phenylalanine and lactate (for comparison) with Eu3+
and [Eu(DTPA)]2-
systems It was found by 1H NMR and luminescence spectroscopies that amino acids
and lactate do not form stable complexes with either the free metal ion or the metal-
DTPA complex and that the buffers may be in fast exchange with surrounding solvent
molecules Luminescence studies on L-phenylalanine showed that this amino acid does
not bind to the metal ion as there was no sensitised emission from Tb3+
ion when
excited into the phenyl chromophore of the amino acid when the two components were
in solution Emission spectra of Eu3+
and Cm3+
aqua ions and their corresponding
DTPA complexes showed no change (no peak splitting or shifting) upon the addition of
amino acidslactate
The number of water molecules in the inner hydration sphere (q) of Eu3+
was
reduced from 9 to ~6 when buffers were added to the aqua ion in solution suggesting
that the amino acids are interacting with the metal ion but are likely to be in fast
exchange with surrounding solvent molecules There was no change in q when buffers
were added to metal-DTPA complexes in solution for Eu3+
or Cm3+
Radiolysis studies were carried out on lactate and amino acid buffered
[Eu(DTPA)]2-
systems and it was found that the systems are relatively resistant to γ-
radiation when exposed to 5 kGy This is consistent with previous work conducted by
the INL showing that separation systems using L-alanine as a buffer are more resistant
to radiolysis than the original TALSPEAK process using lactate
106
1 G Muumlhlbachovaacute Rostlinnaaacute Vyacuteroba 2002 48 12 536ndash542
2 JSF Swaran and V Pachauri Int J Environ Res Public Health 2010 7 7 2745-
2788
3 M Regueiro-Figueroa and C Platas-Iglesias J Phys Chem A 2015 119 6436-
6445
4 N Mignet Q de Chermont T Randrianarivelo J Seguin C Richard M Bessodes
and D Scherman Eur Biophys J 2006 35 155-161
5 CL Davies and A-K Duhme-Klair Tetrahedron Lett 2011 52 4515-4517
6 G Moreau L Burai L Helm J Purans and AE Merbach J Phys Chem A 2003
107 758-769
7 KA Deal IA Davis S Mirzadeh SJ Kennel and MW Brechbiel J Med Chem
1999 42 15 2988ndash2992
8 S Beacutenazeth J Purans M-C Chalbot MK Nguyen-van-Duong L Nicolas K
Keller amp A Gaudemer Inorg Chem 1998 37 3667-3674
9 A Delle Site RD Baybarz J Inorg Nucl Chem 1969 31 2201
10 IA Lebedev VT Filimonov AB Shalinets GN Yakovlev Sov Radiochem
1968 10 94
11 I Bayat KFK
Berichte-1291 Karlsruhe Germany 1970
12 P Thakur JL Conca CJ Dodge AJ Francis GR Choppin Radiochim Acta
2013 101 221
13 G Tian LR Martin and LRao Inorg Chem 2015 54 1232-1239
14 S Leguay T Vercouter S Topin J Aupais D Guillaumont M Miguirditchian P
Moisy and C Le Naour Inorg Chem 2012 51 12638-12649
15 M Nazarov and D Young Noh New Generation of Europium and Terbium
Activated Phosphors 2011 247
16 K N Shinde S J Dhoble H C Swart and K Park Phosphate Phosphors for Solid
State Lighting Springer Series in Materials Science Springer 2012 174 41-59
17 K S Wong T Sun X-L Liu J Pei and W Huang Thin Solid Films 2002 417 85-
89
18 WD Horrocks and DR Sudnick J Am Chem Soc 1979 101 334
19 A Beeby IM Clarkson RS Dickins S Faulkner D Parker L Royle AS de
Sousa JAG Williams and M Woods J Chem Soc Perkin Trans 2 1999 493-504
20 RM Supkowski and WD Horrocks Inorg Chim Acta 2002 340 44-48
107
21 CF Geraldes AD Sherry WP Cacheris KT Kuan RD 3rd Brown SH
Koenig and M Spiller Magn Reson Med 1988 8 2 191-9
22 E Csajboacutek I Baacutenyai and E Bruumlcher Dalton Trans 2004 14 2152-2156
23 JJ Howland and M Calvin J Chem Phys 1950 83 239
24 J E Sansonetti and W C Martin Handbook of Basic Atomic Spectroscopic Data
httpphysicsnistgovPhysRefDataHandbookTables National Institute of Science
and Technology USA 2005
25 T Kimura and G R Choppin J Alloys Compounds 1994 213 313
26 T Kimura Y Kato H Takeishi and G R Choppin J Alloys Compounds 1998
271273 719
27 T L Griffiths Investigations of Ternary Complexes Relevant to the Nuclear Fuel
Cycle 2011 The University of Manchester PhD Thesis
28 G Tian LR Martin and L Rao Inorg Chem 2010 49 10598-10605
29 K L Nash D Brigham T C Shehee and A Martin Dalton Trans 2012 41
14547-14556
30 CJ Leggett G Liu and MP Jensen Solv Extraction and Ion Exchange 2010 28
313-334
31 A Miličević and N Raos Acta Chim Slov 2014 61 904-908
32 VV Nikonorov J Anal Chem 2010 65 4 359-365
33 D Magnusson B Christiansen R Malmbeck and JP Glatz Radiochim Acta 2009
97 9 497-502
34 B Weaver and T A Kappelmann Talspeak A new method of separating americium
and curium from the lanthanides by extraction from an aqueous solution of an
aminopolyacetic acid complex with a monoacidic organophosphate or phosphonate
Oak Ridge National Laboratory 1964 1-60
35 LR Martin S P Mezyk and BJ Mincher J Phys Chem A 2009 113 141-145
36 Dr Leigh Martin Idaho National Laboratory unpublished results
108
3 SOLVENT EXTRACTION AND OPTIMISATION STUDIES WITH AMINO
ACID BUFFERS
As discussed in Chapter 2 the potential of using amino acids as a combined
buffer and soft donor to replace the lactate buffer and holdback reagent DTPA
(diethylenetriaminepentaacetic acid) in the TALSPEAK process (Trivalent Actinide
Lanthanide Separation by Phosphorus reagent Extraction from Aqueous Complexation)
was investigated Initial complexation studies by 1H NMR and luminescence
spectroscopies showed that amino acids do not form stable complexes with actinide or
lanthanide ions or AnLn-DTPA complexes in aqueous solution and that like lactate
they are in fast exchange with surrounding water molecules Separation studies were
carried out by our collaborators at the Idaho National Lab (Travis Grimes Richard
Tillotson and Leigh Martin) to determine whether amino acids could be used as buffers
or as combined bufferssoft-donors to facilitate Ln3+
MA3+
separation A summary of
this work can be found below in Section 31 Their initial studies were used as the basis
for the work conducted as part of this research project (Sections 32 and 33)
31 Previous work at the INL1
311 L-alanine Studies
3111 pH Studies on L-alanine
L-alanine was initially chosen as a potential replacement for lactic acid as a
buffer as the two molecules differ only by the α-group (α-amino on L-alanine compared
to α-hydroxy group on lactic acid) The pKa values of the compounds are 24-26 for L-
alanine and 36-38 for lactic acid depending on the background electrolyte Studies
carried out on the L-alanine found that the separation factors were in fact reduced
compared to the traditional TALSPEAK method when L-alanine was used as a buffer at
pH 2 and pH 3 in place of lactic acid The separation factors were generally lower as the
distribution ratios for Am3+
(DAm) were significantly increased (2 orders of magnitude
higher) when L-alanine was used at pH 3 (DAm 012) and pH 2 (DAm 038-047)
compared to lactic acid at pH 3 (DAm 0009) However the studies carried out at pH 2
resembled a typical TALSPEAK curve and gave overall the best separation of
lanthanides over Am3+
as can be seen in Figure 31 Although separation occurs in the
L-alanine system at pH 3 the separation is better at pH 2 At pH 3 it can be seen that
separation is decreased for the heavier lanthanides This is due to slow phase-transfer
kinetics previously reported by Weaver and Kappelmann2 and Kolarik
3 A pH 1 system
109
does not allow separation of the earlier lanthanides from americium The distribution
ratios for lanthanides in a typical TALSPEAK system can be seen in Figure 32 for
comparison
086 088 09 092 094 096 098 1
10-2
10-1
100
101
102
5x10²
086 088 09 092 094 096 098 1
10-2
10-1
100
101
102
5x10²
pH 1
pH 2
pH 3
Am pH 1
Am pH 2
Am pH 3
[Alanine] = 05 M
[DTPA] = 0050 M
[HDEHP] = 02 M
Organic Diluent
Dodecane
DM
1r Aring
DM
15 M Alanine
10 M Alanine
05 M Alanine
Am 15 M Alanine
Am 10 M Alanine
Am 05 M Alanine
[DTPA] = 0050 M
[HDEHP] = 02 M
Organic Diluent
Dodecane
pH 2
1r Aring
Figure 31 The effect of pH on an L-alanine-buffered TALSPEAK system
Figure 32 Distribution ratios of Ln3+
Y3+
in a TALSPEAK system 1 mM LnY3+
1 M
lactate 005 M DTPA pH 7 extracted using 05 M HDEHP in 14-DIPB4
110
3112 Concentration Effects
The effect of the concentration of L-alanine was also considered and it was
found that the effect on the trend of separation factors across the lanthanide series was
the same as for lactate and the changes were negligible as can be seen from Figure 33
Slower extraction rates were observed for the heaviest lanthanides at lower buffer
concentrations (05 M than 10 or 15 M) for both L-alanine and lactic acid Since it was
found that there was no benefit to changing the L-alanine buffer concentration further
studies were carried out to investigate the potential of using the amino acid to carry out
the process at the lower pH of 2 as although the separation factors are lower than in
lactic acid buffered systems the values are still high enough to give sufficient
separation (see Table 31)
086 088 09 092 094 096 098 1
10-2
10-1
100
101
102
5x10²
086 088 09 092 094 096 098 1
10-2
10-1
100
101
102
5x10²
pH 1
pH 2
pH 3
Am pH 1
Am pH 2
Am pH 3
[Alanine] = 05 M
[DTPA] = 0050 M
[HDEHP] = 02 M
Organic Diluent
Dodecane
DM
1r Aring
DM
15 M Alanine
10 M Alanine
05 M Alanine
Am 15 M Alanine
Am 10 M Alanine
Am 05 M Alanine
[DTPA] = 0050 M
[HDEHP] = 02 M
Organic Diluent
Dodecane
pH 2
1r Aring
Figure 33 The effect of buffer concentration on an L-alanine-buffered TALSPEAK
system
111
Table 31 Distribution ratios and separation factors for a number of L-alanine buffered
TALSPEAK systems as pH and buffer concentration are varied compared to a
traditional lactic acid system
Conc pH DAm Separation Factors (SF)
(M) LaAm CeAm NdAm EuAm
L-Alanine 15 2 038 plusmn 001 165 plusmn 5 61 plusmn 1 28 plusmn 1 64 plusmn 1
L-Alanine 10 2 039 plusmn 002 176 plusmn 10 54 plusmn 3 24 plusmn 1 55 plusmn 3
L-Alanine 05 2 047 plusmn 006 165 plusmn 24 64 plusmn 3 28 plusmn 8 66 plusmn 8
L-Alanine 05 3 012 plusmn 001 147 plusmn 17 45 plusmn 5 9 plusmn 1 25 plusmn 3
Lactic
Acid
10 3 0009 380 140 mdash 91
3113 Studies at pH 2
Further investigations at pH 2 into the potential of using amino acids as a
combined buffer and soft donor showed that no separation occurs when DTPA is not
present indicating that amino acids do not act as holdback reagents in their own right
Previous work by Tanner and Choppin5 showed that at low pH the glycine zwitterion
forms inner-sphere monodentate complexes with M3+
ions including Ln3+
and An3+
Aziz et al67
later showed the same is true for L-alanine with Eu3+
and Am3+
at pH 36
whereby weak monodentate complexes form Krishnan and Plane8 showed that glycine
complexes metal ions solely through the COO- group on the amino acid No co-
ordination through the amino group has been reported
312 Other Amino Acids
Other amino acids L-arginine L-histidine and L-methionine were also
considered and further investigations were carried out (Figure 34) These three amino
acids are larger and more hydrophobic than L-alanine and are therefore less soluble at
higher concentrations (lt05 M) at pH values greater than pH 1 Again no separation
was observed when the amino acids were used without DTPA With Na5DTPA it was
found that the DAm values for Arg and Met were lower than those for L-alanine leading
to an increase in separation factor possibly due to co-ordination of the Am3+
ion with
soft donor atoms on the amino acids (Table 32) The DAm in the His system however
was similar to the Ala system suggesting that there is no coordination of the metal ion
112
with the α-amine or imidazole groups It is not known if the amino acids are co-
ordinating or chelating through soft donor atoms to the metal ion Further studies are
currently being carried out at the INL to determine stability constants and to use time-
resolved fluorescence to probe inner co-ordination sphere changes in order to
investigate the interactions of amino acids with the trivalent metal ions
Figure 34 Chemical structures of L-arginine (top) L-histidine (bottom left)
and L-methionine (bottom right)
Table 32 Distribution ratios and separation factors for a number of amino acid
buffered TALSPEAK systems
When extended further studies on these amino acids found that the kinetic
issues which affected separation of the heavier lanthanides using L-alanine at pH 3
(Figure 31) were also affecting separation with L-arginine at pH 2 as well as pH 3
Conc pH pKa DAm3+ Separation Factors (SF)
(M) LaAm CeAm NdAm EuAm
L- Arg 05 2 182 027 plusmn 001 184 plusmn 26 40 plusmn 3 27 plusmn 2 72 plusmn 4
L- His 05 2 180 040 plusmn 001 208 plusmn 8 95 plusmn 3 24 plusmn 5 83 plusmn 1
L-Met 05 2 213 017 plusmn 001 271 plusmn 18 97 plusmn 3 26 plusmn 1 60 plusmn 3
113
suggesting that longer chain amino acids may not suitable replacements for lactate
Based on these data the most promising replacement buffer is L-alanine at pH 2
32 L-alanine System Optimisation at pH 2
Following from the initial work carried out by Grimes et al at the INL further
studies were begun for this research project The speciation of DTPA was modelled
using HySS (Hyperquad Simulation and Speciation) software using literature pKa
values (Figure 35)9 At pH 1 the dominant DTPA species present in solution are
H7DTPA2+
and H6DTPA+ which both repel MA
3+ and Ln
3+ ions and so the species are
ineffective as holdback reagents At pH 2 the dominant species are H5DTPA (65 )
H4DTPA- (24 ) and H3DTPA
2- (11 ) The species with the greatest electrostatic
attraction under these conditions is to MA3+
Ln3+
ions is H3DTPA2-
At pH 3 a much
higher proportion of this species is present (87 ) than at pH 2 making pH 2 less
favourable for effective separation However the conditions can be optimised in order
to maximise separation by changing the concentrations of extractant and holdback
reagent For industrial purposes conducting the process at a lower pH is preferable as it
is easier for process operators to control higher acid concentrations Optimisation
studies using L-alanine as a buffer at pH 2 were carried out during a placement at the
INL
114
Figure 35 DTPA speciation as a function of pH modelled using HySS sofware using
literature pKa values
321 [Na5DTPA] Dependence
The concentration of Na5DTPA used in traditional TALSPEAK systems is 005
M Initial optimisation studies were carried out using a [Na5DTPA] range of 006 M to
010 M in increments of 001 M The L-alanine concentration was 05 M
115
Figure 36 [Na5DTPA] dependence of L-alanine system (05 M) at pH 2
Experiments were carried out using traditional TALSPEAK methods at pH 2
The extractant was HDEHP (02 M) in dodecane Separations were conducted to
measure the separation of Eu3+
over Am3+
A graph of log[DTPA] vs logDEuAm can be
seen in Figure 36 The slope of the line for Am3+
is approximately -1 indicating that
the metal ions are each bound to 1 DTPA5-
molecule The R2 value is close to 1 and the
errors are small The slope of the line for Eu3+
is also approximately -1 Separation
factors for the data were between 66 and 80 and the DAm were between 026 and 042
which are still 2 orders of magnitude higher than that for a traditional TALSPEAK
system (DAm = 0009) The Na5DTPA concentration was therefore increased further in
order to bring the DAm lower to prevent as much Am3+
being partitioned into the organic
phase
y = -09383x - 15277 Rsup2 = 09854
y = -11258x + 01381 Rsup2 = 09289
-10
-05
00
05
10
15
20
-125 -12 -115 -11 -105 -1 -095
log
DEu
Am
log [Na5DTPA]
Am Extraction
Eu Extraction
116
Figure 37 Eu3+
Am3+
separation for [Na5DTPA] dependence of L-alanine system (05
M) at pH 2
Experiments were carried out as before but using Na5DTPA concentrations of
02 M 03 M 04 M and 05 M A graph of log[DTPA] vs logDEuAm was plotted
(Figure 37) At 05 M [Na5DTPA] H5DTPA began to precipitate out due to the low pH
used and so data for this concentration is unreliable and was not plotted on the graph
The data is good as the R2 values are close to 1 and the errors are small However the
slope is not exactly -1 (slope = -080 for Eu and -085 for Am) this is likely to be due to
competition and activity effects from the increased [Na5DTPA] and therefore increased
Na+ concentration Separation factors for the data were around the same (between 65
and 72) but the DAm values decreased to 008 for the 04 M Na5DTPA meaning much
less Am3+
is being partitioned into the organic phase
322 [HDEHP] Dependence
Experiments were carried out as for the [Na5DTPA] dependence but using
HDEHP extractant concentrations of 04 M 06 M 08 M and 10 M in dodecane for
each of the Na5DTPA concentrations 02 M 03 M and 04 M Graphs of log[DTPA] vs
logDEuAm were plotted (Figures 38-310)
y = -08451x - 14757 Rsup2 = 09936
y = -07958x + 03998 Rsup2 = 0998
-15
-10
-05
00
05
10
15
-11 -1 -09 -08 -07 -06 -05 -04 -03
log
DEu
Am
log [Na5DTPA]
Am Extraction Eu Extraction
117
Figure 38 Eu3+
Am3+
separation for [HDEHP] dependence of L-alanine system (05
M) at pH 2 using 02 M Na5DTPA
Figure 39 Eu3+
Am3+
separation for [HDEHP] dependence of L-alanine system (05
M) at pH 2 using 03 M Na5DTPA
y = 13522x + 02972 Rsup2 = 09283
y = 09682x + 19794 Rsup2 = 09561
-05
00
05
10
15
20
25
-05 -04 -03 -02 -01 0 01
log
DEu
Am
log [HDEHP]
Am Extraction
Eu Extraction
y = 14702x + 00193 Rsup2 = 09981
y = 11892x + 17129 Rsup2 = 09713
-10
-05
00
05
10
15
20
-05 -04 -03 -02 -01 0 01
log
DEu
Am
log [HDEHP]
Am Extraction
Eu Extraction
118
Figure 310 Eu3+
Am3+
separation for [HDEHP] dependence of L-alanine system (05
M) at pH 2 using 04 M Na5DTPA
The R2 values for these data are close to 1 and the errors are generally small
making the data good quality The slope of each data set should be +3 indicating that
the metal ions are each bound to 3 HDEHP molecules in the organic phase1011
However the slopes are not quite +3 this is likely to be due to activity effects and
competition from the increased Na+ concentration as a result of increasing the
Na5DTPA concentration
323 L-alanine Optimisation Summary
The results of the optimisation of a TALSPEAK system using 05 M L-alanine
as a buffer are summarised in Tables 33 and 34
Table 33 Separation factors for L-alanine optimisation studies
[HDEHP] (M)
[Na5DTPA]
(M)
02 04 06 08 10
02 72 plusmn 3 70 plusmn 6 43 plusmn 6 61 plusmn 9 49 plusmn 2
03 70 plusmn 1 62 plusmn 7 59 plusmn 9 56 plusmn 5 46 plusmn 8
04 71 plusmn 5 60 plusmn 4 74 plusmn 4 70 plusmn 7 67 plusmn 1
y = 11522x - 00047 Rsup2 = 09867
y = 12575x + 18424 Rsup2 = 09976
-10
-05
00
05
10
15
20
25
-05 -04 -03 -02 -01 0 01
log
DEu
Am
log [HDEHP]
Am Extraction
Eu Extraction
119
Table 34 DAm values for L-alanine optimisation studies Error plusmn 001
[HDEHP] (M)
[Na5DTPA]
(M)
02 04 06 08 10
02 012 053 121 126 203
03 010 027 050 077 102
04 008 036 051 077 102
Table 33 shows the separation factors are generally similar for each condition
and there is no particular set of conditions that gives the highest value although the
better separation factors tend to be achieved at the lower extractant concentrations The
DAm values (Table 34) are best at the lowest extractant concentrations and highest
holdback concentration as would be expected The best set of conditions is 04 M
Na5DTPA and 02 M HDEHP with the best DAm achievable being 008 and best SF 71 plusmn
5 Despite optimisation the L-alanine system is still not as efficient as the traditional
lactate system as the distribution of Am3+
is one order of magnitude higher and the
separation is lower however the L-alanine system allows the separation to be carried
out at a lower pH which is beneficial for an industrial process
33 Other Amino Acid Studies
331 Initial Tests with Other Amino Acids
Several initial tests were carried out using other amino acids as buffers It had
been found previously that L-arginine at pH 2 gave poor separation of the heavier
lanthanides (Section 312) so further studies were carried out using 05 M L-methionine
and L-histidine to see how effective these amino acids could be as potential buffers
Results from initial tests using TALSEPAK conditions at varied pH values can be seen
in Table 35
120
Table 35 Separation factors and DAmEu values for traditional TALSPEAK systems
with different buffers at varying pH values
From Table 35 it can be seen that L-histidine gives good separation data at pH
3 The DAm of 007 is comparable to the optimised L-alanine system in Section 32 and
the separation factor is high at 99 comparable to the original lactate TALSPEAK
system Further investigations were subsequently carried out in order to determine if the
same kinetic issues arise with L-histidine as with L-arginine and L-alanine L-
methionine was not investigated further as the separation data at pH 2 was not very
promising and it is insoluble at 05 M at pH 3
332 Studies with L-Histidine
The distribution ratios of La-Ho were determined by ICP-MS for a 05 M L-
histidine system at pH 2 and pH 3 (Figure 311)
Buffer pH DAm
DEu
SF
Lactic Acid 3 0009 0819 91
L-Methionine 1 547 6017 11
2 018 1016 57
L-Histidine 1 468 9579 20
2 053 4463 84
3 007 660 99
121
Figure 311 Distribution ratios of La3+
-Ho3+
and Am3+
with 05 M L-histidine buffer at
pH 2 and pH 3
The distribution ratios for the L-histidine system at pH 2 generally resemble
those on a traditional TALSPEAK curve at pH 3 with the D values decreasing towards
neodymium and then increasing with the later lanthanides However the pH 3 L-
histidine system exhibits decreasing D values with the heavier lanthanide elements
demonstrating the same kinetic problems as the L-alanine and L-arginine systems at
higher pH
34 Summary of Separations with Amino Acid Buffers
Previous work carried out at the Idaho National Laboratory by Grimes showed
that amino acids do not act as holdback reagents in their own right and no separation of
Ln3+
Am3+
is achieved when they are used without Na5DTPA in solution However
investigations showed that when used alongside Na5DTPA good separation can be
attained when using 05 M L-alanine at pH 2 pH 2 is less favourable than pH 3 for
separations using DTPA as more protonated forms of the molecule are present in
solution and the holdback reagent is not able to bind as strongly to metal ions However
optimisation of the system in order to maximise the separation whilst keeping Am3+
partitioning to a minimum by changing the concentrations of holdback reagent and
extractant proved to be successful The best conditions were found to be 04 M
Na5DTPA and 02 M HDEHP giving a separation factor of 71 plusmn 5 with a DAm value of
008 Although this separation is not as good as a traditional lactate TALSPEAK
001
01
1
10
56 57 58 59 60 61 62 63 64 65 66 67 68
Dis
trib
uti
on
Rat
io
Atomic Number
His pH 2
His pH 3
Am pH 2
Am pH 3
122
system the use of L-alanine as a buffer allows the process to be carried out at pH 2
which is a much more preferable pH for industry
When investigations were carried out using other amino acids at varying pH
values it was found that L-methionine was too poorly soluble at pH 3 and did not give
very good separation data at pH 2 L-arginine was found to have kinetic issues at pH 2
and 3 giving poor separation of the heavier lanthanides However L-histidine gave
good separation data at pH 3 with a SFEuAm of 99 comparable to that of the original
TALSPEAK process and a DAm of 007 comparable to the optimised alanine system
Studies of the lanthanides La-Ho using L-histidine at pH 3 however showed that the
same kinetic problems arise as for L-arginine and L-alanine as the DLn decreases for
later lanthanides indicating that L-histidine is no more promising as a buffer than the
other amino acids
123
1 TS Grimes RD Tillotson and LR Martin Solv Extraction and Ion Exchange
2014 32 378-390
2 B Weaver and T A Kappelmann Talspeak A new method of separating americium
and curium from the lanthanides by extraction from an aqueous solution of an
aminopolyacetic acid complex with a monoacidic organophosphate or phosphonate
Oak Ridge National Laboratory 1964 1-60
3 Z Kolarik G Koch and W Kuhn J Inorg Nucl Chem 1974 36 905-909
4 KL Nash Solv Extraction and Ion Exchange 2015 33 1-55
5 S P Tanner and G R Choppin Inorg Chem 1968 7 2046-2048
6 A Aziz and S J Lyle J Inorg Nucl Chem 1971 33 3407-3408
7 A Aziz S J Lyle and J E Newbery J Inorg Nucl Chem 1971 33 1757-1764
8 K Krishnan and R Plane Inorg Chem 1967 6 55-60
9 NJ Bridges LE Roy and CL Klug Computation and Spectroscopic Investigation of
the DTPA Complexes US Department of Energy 2012
10 TS Grimes G Tian L Rao and KL Nash Inorg Chem 2012 51 6299-6307
11 G Lumetta AV Gelis and GF Vandegrift Solv Extraction and Ion Exchange
2010 28 3 287-312
124
4 STUDIES USING L-GLUTATHIONE AS A BUFFER IN A TALSPEAK
SYSTEM
The TALSPEAK process (Trivalent Actinide Lanthanide Separation by
Phosphorus reagent Extraction from Aqueous Complexation) which is currently being
developed in the USA for separation of minor actinides (MA) from lanthanides (Ln)
from nuclear waste uses lactic acid as a buffer (pH 36) and the chelator DTPA
(diethylenetriaminepentaacetic acid) as a holdback reagent to retain Am3+
in an aqueous
phase allowing Ln3+
to be extracted by phosphate extractant HDEHP (di-
(2ethylhexyl)phosphoric acid) into an organic phase Studies have been carried out on
the potential of using amino acids as a combined buffer and soft-donor in order to
simplify the TALSPEAK process (Chapters 2 amp 3) however it was found that amino
acids do not act as holdback reagents in their own right although they have been shown
to allow the pH of the process to be lowered to pH 2 which is more favourable for an
industrial process
Although amino acids have been shown not to act as holdback reagents and are
therefore unable to replace lactic acid and DTPA5-
as a combined buffer and soft donor
based on the data obtained from the individual amino acid studies it was considered
that larger ligands with more soft donors such as short-chain peptides may be more
suitable A range of potential molecules were considered including a selection of simple
peptides including eisenin (pGlu-Gln-Ala-OH) and norophthalmic acid (γ-Glu-Ala-
Gly) (Figure 41) and B vitamins including biotin (B7) and folic acid (B9) (Figure
42)
125
Figure 41 Molecular structures of eisenin (top) and norophthalmic acid
(bottom)
Figure 42 Molecular structures of biotinvitamin B7 (top) and folic acid
vitamin B9 (bottom)
The tripeptide L-glutathione (reduced form) was chosen for further study as it
has a fairly simple structure contains several soft-donor atoms and its amino acid
constituents showed promise for buffer activity It is also relatively cheap and easy to
procure L-glutathione (GSH) consists of a chain comprising three amino acids L-
cysteinemdashL-glutamic acidmdashglycine (Figure 43)
126
Figure 43 Molecular structure of L-glutathione (reduced form)
Glutathione is naturally produced in all cells in the human body It is an
antioxidant with numerous functions most of which are related to the ability of its
sulphur atom to scavenge free radicals or donate electrons GSH regulates cell growth
and division by absorbing oxide radicals present in the cell which would prevent cell
growth repairs DNA by donating electrons removed from DNA strands by free radicals
aiding in DNA synthesis assists in protein synthesis by reacting (sulphur atom) with
undesirable S-S bonds to break them and allow for the correct pairing metabolises
toxins by co-ordinating with them through the S atom making them more water soluble
for excretion and recycles other antioxidants (such as vitamins C and E) by donating
electrons1 As a cysteine-containing tripeptide it is also a provider of the amino acid
cysteine in the body and is involved in amino acid transport in and out of cells
Properties of glutathione which are of particular interest to MA3+
Ln3+
separation
studies are its ability to conjugate to heavy metals (to allow them to be removed from
the body like DTPA23
and its resistance to radiation (due to its ability to scavenge free
radicals) which decreases radiation damage in the body45
but also would be beneficial
for spent nuclear fuel (SNF) reprocessing where free radicals and high levels of
radiation are present
As is the case for lactate6 and amino acid
7 complexes of lanthanides stability
constants of Ln-GSH complexes increase across the lanthanide series from La-Lu as the
Lewis acidity of the metal ions increases Log β values range from 556 for La3+
to 751
for Ho3+
with GSH indicating slightly higher stability of Ln-GSH complexes than of
lactate and amino acid complexes of Ln3+
with log β = 633 for Ln(lactate)3 formation
and values ranging from 582-665 for L-alanine with Ln3+
when Ln = La-Sm (Section
242) Garg et al also reported that the stability of Ln-GSH complexes was found to
decrease as ionic strength increases and that the optimum stability of the complexes was
in solutions within the pH range of 340-348 (77 complex formation)8
127
Solvent extraction experiments were initially performed in order to investigate
the separation ability of GSH with Am3+
and Eu3+
and conditions were then optimised
in order to achieve maximum separation Interaction of the buffer with various
components in solution including lanthanide ions was probed using various techniques
including luminescence spectroscopy which was also used in determining the
susceptibility of the buffer to radiolysis and ICP-MS
41 Solvent Extraction and Separation using GSH
411 [L-Glutathione] and pH Dependence
4111 [GSH] Dependence without Na5DTPA at pH 4
L-glutathione has pKa values of 212 (COOH) 359 (COOH) 875 (NH2) and
965 (SH)9 and so with two pKa values below 4 and optimum stability at pH 34 initial
studies were carried out at pH 4 as it would be expected that the glutathione would
complex to metal ions most effectively around this pH and be more likely to act as a
holdback reagent Although pH 4 is a higher pH than that used currently in the
TALSPEAK process and therefore less desirable if proven to improve the process it
may still have potential if satisfactory separation is achieved
Initial studies using L-glutathione as a buffer without the presence of Na5DTPA
in the system showed that as with amino acids GSH is ineffective as a holdback
reagent on its own as there was no separation observed between Eu3+
and Am3+
Over a
GSH concentration range of 01 M to 05 M the separation factors ranged from 038-
585 plusmn 108 Glutathione is insoluble at concentrations above 05 M at pH 4 at room
temperature
4112 [GSH] and pH Dependence with Na5DTPA
Further experiments were then carried out using GSH as a buffer in the presence
of Na5DTPA in order to see if there was any improvement in the separation with this
buffer over the traditional lactic acid buffer The experiments used 005 M Na5DTPA
and 01-05 M GSH over a pH range of 2-4 under TALSPEAK conditions (02 M
HDEHP in n-dodecane)
128
Figure 44 Eu3+
Am3+
distribution for [GSH] dependence with 005 M Na5DTPA at pH
2 extracted using 02 M HDEHP in dodecane Results were averaged from 3 repeat
tests
Figure 45 Eu3+
Am3+
distribution for [GSH] dependence with 005 M Na5DTPA at pH
3 extracted using 02 M HDEHP in dodecane Results were averaged from 3 repeat
tests
Plots of log[GSH] vs logDEuAm for systems at pH 2 and 3 are displayed in
Figures 44 and 45 The graphs show that increasing the concentration of GSH does not
affect the separation of Eu3+
over Am3+
since the distribution ratios for each remain
-02
0
02
04
06
08
1
12
14
16
18
-11 -09 -07 -05 -03
log
DEu
Am
log [GSH]
Am Extraction
Eu Extraction
-1
-08
-06
-04
-02
0
02
04
06
08
1
12
14
-11 -09 -07 -05 -03
log
DEu
Am
log [GSH]
Am Extraction
Eu Extraction
129
relatively constant At pH 2 the average DAm is 103 and DEu is 3013 giving an
average separation factor of 29 plusmn 8 At pH 3 the extraction of both metals is lower with
DAm averaging at 018 and DEu at 1423 giving an average separation of 79 plusmn 13 Both
data sets for pH2 and pH 3 show a slope of almost zero suggesting that the metal ions
are not bound to any GSH molecules which would be consistent with the L-glutathione
just acting as a buffer These separation factors are lower than for the original
TALSPEAK buffered system using lactate (SF = 91 at pH 36) However at pH 4 the
slopes change on the graph and a difference in separation can be observed as the molar
concentration of GSH is increased
Figure 46 Eu3+
Am3+
distribution for [GSH] dependence with 005 M Na5DTPA at pH
4 Results were averaged from 3 repeat tests
At pH 4 as the concentration of L-glutathione is increased the separation factor
increases (Figure 46) The value DEu initially increases as the GSH concentration is
increased from 01-02 M but then remains constant at ~6 However DAm values
decrease linearly as the buffer concentration is increased from 01-05 M giving rise to
increased partitioning and separation values The results from the extraction
experiments at pH 4 are given in Table 41
-15
-10
-05
00
05
10
-11 -09 -07 -05 -03
log
DEu
Am
log [GSH]
Am Extraction
Eu Extraction
130
Table 41 Eu3+
Am3+
distribution and separation for [GSH] dependence with 005 M
Na5DTPA at pH 4
[GSH] (M) DAm DEu SF
01 073 plusmn 027 100 plusmn 041 14 plusmn 13
02 021 plusmn 011 658 plusmn 054 31 plusmn 14
03 016 plusmn 005 578 plusmn 097 37 plusmn 19
04 007 plusmn 002 590 plusmn 043 82 plusmn 19
05 006 plusmn 001 617 plusmn 097 104 plusmn 33
The results show that the L-glutathione is interacting with the DTPA in some
way at pH 4 to allow the separation to increase as a function of GSH concentration only
in the presence of Na5DTPA up to a SF of 104 at 05 M GSH concentration
comparable to separation achieved in the original lactate buffered TALSPEAK process
Figure 47 GSH speciation as a function of pH modelled using HySS software using
literature pKa values of 212 (COOH) 359 (COOH) 875 (NH2) and 965 (SH)9
131
Figure 48 H2GSH- species dominant in solution at pH 4
The speciation of GSH at pH 4 was modelled using HySS (Hyperquad Simulation and
Speciation) software using literature pKa values (Figure 47) At pH 4 the dominant
GSH species is the H2GSH- species (Figure 48) with both carboxylic acids
deprotonated This suggests that deprotonation of the second COOH group allows the
ligand to interact through the COO- to the metal complex Indeed several studies by
Faulkner et al have shown that molecules containing carboxylate functionalities
readily bind with 7-coordinate lanthanide(III) polyaminocarboxylate complexes in a
bidentate manner here DO3A (DO3A = [4710-tris-carboxymethyl-14710-tetraaza-
cyclododec-1-yl]-acetic acid) (Figure 49) and a similar binding interaction with the
related DTPA actinide(III)lanthanide(III) may be anticipated
Figure 49 A ternary Nd DO3A-pyrazine amine carboxylate complex reported by
Faulkner at al (left) and anticipated bidentate chelation of GSH with Am-DTPA at pH
4 (right)10
132
412 [Na5DTPA] Dependence at pH 4
The highest concentration of buffer (05 M) gave the highest separation factors
in the [GSH] dependence study at pH 4 so this concentration was chosen for the next
study on [Na5DTPA] dependence (Figure 410) Relatively high concentrations of
Na5DTPA were chosen (005-06 M) to make the results comparable to those obtained
in the optimisation of the L-alanine system (Section 32) The graphs plotted for the
[Na5DTPA] dependence were not plotted as log plots as it is not known how the
Na5DTPA and GSH interact and what competition effects may be present so the direct
correlation between the complexant concentration and D values have been plotted to
make interpretation more simple
Figure 410 Eu3+
and Am3+
distribution for [Na5DTPA] dependence with 05 M GSH
buffer at pH 4 curves fitted as polynominal order 2 for both Am3+
and Eu3+
Results
were averaged from 3 repeat tests
y = 19018x2 - 23123x + 72258 Rsup2 = 09937
y = 0442x2 - 03543x + 00659 Rsup2 = 0781
00
00
01
01
02
-20
-10
00
10
20
30
40
50
60
70
-01 26E-15 01 02 03 04 05 06 D
Am
DEu
[Na5DTPA] (M)
Eu extraction
Am extraction
133
Table 42 Eu3+
Am3+
distribution and separation for [Na5DTPA] dependence with 05
M GSH buffer at pH 4
[Na5DTPA] (M) DAm DEu SF
005 00650 plusmn ˂0001 624 plusmn 076 96 plusmn 11
01 00196 plusmn ˂0001 480 plusmn 057 245 plusmn 29
02 00039 plusmn ˂0001 361 plusmn 052 917 plusmn 133
03 00020 plusmn ˂0001 207 plusmn 017 1037 plusmn 85
04 00010 plusmn ˂0001 084 plusmn 008 833 plusmn 80
05 00060 plusmn ˂0001 042 plusmn 005 70 plusmn 9
06 00058 plusmn ˂0001 024 plusmn 005 41 plusmn 7
These data show that as the concentration of Na5DTPA is increased the
separation factor increases dramatically up to 03 M Na5DTPA with a maximum of
1037 85 (Table 42) After this peak there is a rapid decrease in separation as the
concentration of Na5DTPA is increased further up to 06 M The DAm decreases at a
steady rate as [Na5DTPA] is increased from 005 M to 04 M after which the DAm
increases slightly and remains fairly constant The DEu decreases at a slower rate
between 005 M and 02 M complexant decreasing more rapidly from 02 M to 06 M
The SF significantly decreases as the concentration of Na5DTPA is increased from 04
to 05 M Although it is unclear why this is without detailed structural analysis the
stoichiometry of DTPAGSH becomes 11 at 05 M which may alter the interaction
between the two constituents The separation factors achieved here are extremely high
(a factor of 10 higher than the current TALSPEAK system and the optimised alanine
system (Chapter 3)) whilst still maintaining low extraction of Am3+
413 [HDEHP] Dependence at pH 4
The extractant concentration dependence was measured for the systems
containing 05 M buffer and 03 M and 04 M Na5DTPA These Na5DTPA
concentrations were chosen for comparison as the 03 M was found to give the highest
separation factor and 04 M seemed to be the point where the separation began to
decrease The graphs plotted for the [HDEHP] dependence have also been plotted by
direct correlation between the extractant concentration and D values
134
Figure 411 Eu3+
and Am3+
distribution for [HDEHP] dependence with 03 M
Na5DTPA and 05 M GSH buffer at pH 4 curve for Eu3+
fitted as polynominal order 2
linear correlation for Am3+
Results were averaged from 3 repeat tests
Table 43 Eu3+
Am3+
distribution and separation for [HDEHP] dependence with 03 M
Na5DTPA and 05 M GSH buffer at pH 4
[HDEHP] (M) DAm DEu SF
02 00020 plusmn ˂0001 207 plusmn 017 1037 plusmn 85
04 00018 plusmn ˂0001 223 plusmn 003 1238 plusmn 17
06 00022 plusmn ˂0001 239 plusmn 006 1097 plusmn 15
08 00024 plusmn ˂0001 218 plusmn 005 906 plusmn 21
10 00031 plusmn ˂0001 165 plusmn 003 535 plusmn 9
At 03 M Na5DTPA the separation factor increases as the extractant
concentration is increased from 02 to 04 M after which the SF begins to decrease
again (Figure 411) The DAm increases slightly as the HDEHP concentration is
increased but the DEu increases and then decreases like the SF The separation factors
for the lower concentrations of extractant are very high with the optimum separation at
04 M giving a SF of 1238 (Table 43)
y = -30649x2 + 3243x + 15029 Rsup2 = 09467
y = 00013x + 00015 Rsup2 = 08028
0000
0002
0004
0006
0008
0010
0012
0014
00
05
10
15
20
25
30
0 02 04 06 08 1 12
DA
m
DEu
[HDEHP] (M)
Eu extraction
Am extraction
135
Figure 412 Eu3+
and Am3+
distribution for [HDEHP] dependence with 04 M
Na5DTPA and 05 M GSH buffer at pH 4 linear correlation for both Am3+
and Eu3+
Results were averaged from 3 repeat tests
Table 44 Eu3+
Am3+
distribution and separation for [HDEHP] dependence with 04 M
Na5DTPA and 05 M GSH buffer at pH 4
[HDEHP] (M) DAm DEu SF
02 0001 plusmn ˂0001 084 plusmn 008 833 plusmn 80
04 0251 plusmn ˂0001 081 plusmn 003 454 plusmn 30
06 0698 plusmn 0014 077 plusmn 001 110 plusmn 010
08 1026 plusmn 0009 078 plusmn 004 076 plusmn 005
10 1410 plusmn 0022 067 plusmn 003 047 plusmn 003
At 04 M Na5DTPA the separation factor decreases rapidly as the extractant
concentration is increased The DAm increases by a factor of 1000 but the DEu only
decreases slightly making the SF decrease significantly (Figure 412 and Table 44)
This would be consistent with the complexant and buffer interacting at higher
Na5DTPA concentrations as the stoichiometry nears 11 possibly forming an adduct
which no longer successfully holds back Am3+
Further structural studies are needed on
these systems in order to determine the complexation mechanisms in the solution under
these conditions
y = -01882x + 08847 Rsup2 = 08326
y = 17968x - 04007 Rsup2 = 09946
-0500
0000
0500
1000
1500
2000
00
01
02
03
04
05
06
07
08
09
10
0 02 04 06 08 1 12
DA
m
DEu
[HDEHP] (M)
Eu extraction
Am extraction
136
42 Luminescence Studies using GSH with Eu3+
Further studies on the glutathione systems were carried out on lanthanide
systems in order to gain some insight into the co-ordination of the buffer with the ions
with and without Na5DTPA present Control measurements were taken of Eu(NO3)3 in
water with no other reagents Eu(NO3)3 with Na5DTPA with no GSH and Eu(NO3)3
with GSH without Na5DTPA for comparison purposes (Figure 413) All luminescence
spectra were recorded and averaged from 5 repeat measurements
Figure 413 Corrected emission spectra of Eu(NO3)3 (1 mM) Eu(NO3)3 with GSH (05
M) and Eu(NO3)3 with Na5DTPA (005 M) in H2O following excitation at 397 nm
A first set of experiments was then carried out to mimic the separation and
solvent extraction studies performed at the INL (Section 41) At the same concentration
of Eu(NO3)3 the J=2 band of Eu3+
increases in intensity upon the addition of GSH
indicating a change in symmetrycrystal field and a weak but detectable interaction with
GSH (the J=1 and J=4 bands are the same intensity with and without GSH) Upon the
addition of Na5DTPA to the system the crystal field changes and the J=4 band shifts
position slightly indicating that a different species is forming which is consistent with
the formation of [EuDTPA]2-
0
1
2
3
4
5
6
550 600 650 700
Emis
sio
n In
ten
sity
(au
) x
10
00
0
Wavelength (nm)
Eu3+ in H2O
Eu with GSH
Eu with DTPA
137
421 [GSH] and pH Dependence without DTPA at pH 4
4211 Aqueous Phase Studies
Emission spectra of Eu3+
(1 mM Eu(NO3)3) in H2O and D2O were measured at
pHpD 4 as the concentration of [GSH] was varied from 01 M to 05 M The spectra
can be seen in Figures 414 and 415
Figure 414 Emission spectra of Eu(NO3)3 in H2O at pH 4 over a GSH concentration
range of 01 ndash 05 M following excitation at 397 nm
The spectra show an increase in emission intensity of the J=2 band as the GSH
concentration is increased from 01-02 M followed by a decrease at 03 M and a
further increase at 04 and 05 M whereas the opposite trend is observed with the J=4
peak The J=1J=2 peak ratios were determined and a t-test was carried out on them to
determine whether they were significantly different and hence whether the co-ordination
mode of the GSH to the Eu3+
changed as the buffer concentration was increased The
J=1J=2 values ranged from 0364-0718 and were found to be significantly different
The spectra are similar to that recorded for the free ion in solution but the J=1J=2
ratios vary slightly and there are some differences in the fine structure of the emission
bands This indicates that GSH is interacting with Eu3+
under these conditions albeit
weakly and the surrounding water molecules are in fast exchange with the buffer
molecules The solution dynamics were investigated further and the spectra were
recorded in D2O in order to minimise quenching caused by fast exchange of O-H
oscillators and to determine the inner sphere hydration number of Eu3+
in each case (q)
00
01
02
03
04
05
06
07
550 600 650 700
Emis
sio
n In
ten
sity
(au
) x
10
00
0
Wavelength (nm)
01 M GSH
02 M GSH
03 M GSH
04 M GSH
05 M GSH
138
Figure 415 Emission spectra of Eu(NO3)3 in D2O at pH 4 over a GSH concentration
range of 01 ndash 05 M following excitation at 397 nm
In D2O it can be seen that the emission intensity increases as the GSH
concentration is increased from 01-03 M followed by a decrease at 04 M and a slight
increase at 05 M This time the J=1J=2 values ranged from 0324-0748 but were
found not to be significantly different suggesting that the co-ordination mode of the
GSH to the metal ion is not changing as the concentration is increased which would be
expected as the buffer is not forming a stable complex with the ion and is in exchange
with surrounding solvent molecules
The number of water molecules bound to the Eu3+
ion (q) was calculated for
each of the samples using the Horrocks equations (Equations 19 and 110) The results
can be found in Table 45 There is a large range in q between different concentrations
with no clear pattern to the lifetimes or number of bound water molecules other than
generally q tends to increase from around 1 to 5 at the highest concentrations of GSH
This could be explained by the increasing ionic strength decreasing the stability of any
Eu-GSH complex and the solvent molecules are also in fast exchange with the buffer
00
02
04
06
08
10
12
550 600 650 700
Emis
sio
n In
ten
sity
(au
) x
10
00
0
Wavelength (nm)
01 M GSH
02 M GSH
03 M GSH
04 M GSH
05 M GSH
139
Table 45 Luminescence lifetimes and q values for Eu3+
with GSH at pHD 4
Error on lifetimes plusmn 10
[GSH]
(M)
τ D2O (μs) τ H2O (μs) q plusmn 02
01 1487 428 17
02 785 353 16
03 829 440 11
04 1545 161 58
05 1016 168 52
4211 Extraction Studies
Extractions were carried out on the Eu3+
samples containing GSH using 02 M
HDEHP in dodecane for the organic phase The emission spectra of both the aqueous
and organic phases post-extraction can be seen in Figure 416
Figure 416 Emission spectra of aqueous and organic phases after Eu3+
extraction at
pH 4 using a GSH concentration range of 01 ndash 05 M following excitation at 397 nm
The Eu-HDEHP complex formed in the organic phase has different symmetry to
Eu3+
complexes in the aqueous phase as can be seen by the different profile of the
emission spectra of the organic phases The spectra show good extraction of the Eu3+
into the organic phase for all concentrations of GSH with little or no metal ion left in the
aqueous phase The J=1J=2 values ranged from 0794-1214 for the organic phase and
were found not to be significantly different as expected as the buffer is unlikely to
00
01
01
02
02
03
03
550 600 650 700
Emis
sio
n In
ten
sity
(au
) x
10
00
0
Wavelength (nm)
01 M GSH Aq 02 M GSH Aq 03 M GSH Aq 04 M GSH Aq 05 M GSH Aq 01 M GSH Org 02 M GSH Org 03 M GSH Org 04 M GSH Org 05 M GSH Org
140
affect the co-ordination of metal ion in the organic phase as the Eu3+
ion is extracted as
the HDEHP complex seen by the different emission profile in the organic phase
spectrum11
422 [GSH] and pH Dependence with DTPA
4221 Aqueous Phase Studies
Emission spectra of Eu3+
(1 mM Eu(NO3)3) in H2O and D2O with 005 M
Na5DTPA were measured over a pHpD range of 2-4 as the concentration of [GSH] was
varied from 01 M to 05 M The D2O spectra can be seen in Figures 417 to 419 The
H2O spectra closely resemble those recorded in D2O but with lower relative emission
intensites as expected (Appendix 1)
Figure 417 Emission spectra of Eu3+
in D2O at pD 2 with 005 M Na5DTPA over a
GSH concentration range of 01 ndash 05 M following excitation at 397 nm
00
02
04
06
08
10
12
14
16
550 600 650 700
Emis
sio
n In
ten
sity
(au
) x
10
00
0
Wavelength (nm)
01 M GSH
02 M GSH
03 M GSH
04 M GSH
05 M GSH
141
Figure 418 Emission spectra of Eu3+
in D2O at pD 3 with 005 M Na5DTPA over a
GSH concentration range of 01 ndash 05 M following excitation at 397 nm
Figure 419 Emission spectra of Eu3+
in D2O at pD 4 with 005 M Na5DTPA over a
GSH concentration range of 01 ndash 05 M following excitation at 397 nm
It can be seen that in all samples a Eu-DTPA complex has formed The spectra
are all almost identical for each pD and for each buffer concentration with the emission
intensity being slightly higher for pD 3 and 4 with the same concentration of Eu3+
00
02
04
06
08
10
12
14
16
550 600 650 700
Emis
sio
n In
ten
sity
(au
) x
10
00
0
Wavelength (nm)
01 M GSH
02 M GSH
03 M GSH
04 M GSH
05 M GSH
00
02
04
06
08
10
12
14
16
550 600 650 700
Emis
sio
n In
ten
sity
(au
) x
10
00
0
Wavelength (nm)
01 M GSH
02 M GSH
03 M GSH
04 M GSH
05 M GSH
142
Table 46 J=1J=2 peak ratios and t-test results for Eu-DTPA at pD 2-4 over a GSH
concentration range of 01-05 M following excitation at 397 nm
J=1J=2
[GSH] (M)
01 02 03 04 05 st dev t-test
pD 2 0335 0399 0379 0375 0361 0024 No sig diff
pD 3 0440 0433 0451 0439 0419 0012 No sig diff
pD 4 0438 0467 0413 0469 0454 0023 No sig diff
st dev 0060 0034 0036 0048 0047
t-test Sig diff Sig diff Sig diff Sig diff Sig diff
The J=1J=2 peak height ratios were recorded for each emission spectrum and t-
tests were carried out on the peak ratios using the t-test data analysis tool in Microsoft
Excel accounting for the standard deviations between the ratios (Table 46) For each
pH as the concentration of GSH is increased the range in the ratios remains small and
there is no significant difference between the values suggesting that there is no change
in the co-ordination mode of the buffer to the metal ion as the concentration of GSH is
increased However a significant difference was observed between the data sets upon
changing pH as the J=1J=2 ratio increases from pD 2 to pD 4 indicating that the co-
ordination mode of glutathione is different at different pH values This is consistent
with the pKa values of GSH as at pH 2 both of the carboxylate groups will be
protonated with the dominant species present in solution shifting from 5050
H3GSHH2GSH to 5050 H4GSHH3GSH (Figure 47)
The luminescence lifetimes of each sample were recorded in H2O and D2O in
order to determine the q value of the complexes using the modified Horrocks equation
(Equation 110) These results are summarised in Table 47
143
Table 47 Luminescence lifetimes and q values for Eu-DTPA at pH 2-4 over a GSH
concentration range of 01-05 M
[GSH] (M) τ D2O (μs) τ H2O (μs) q plusmn 02
pH 2 01 1699 plusmn 7 607 plusmn 9 10
pH 2 02 1692 plusmn 10 619 plusmn 10 09
pH 2 03 1686 plusmn 9 629 plusmn 9 09
pH 2 04 1636 plusmn 12 607 plusmn 13 09
pH 2 05 1596 plusmn 11 629 plusmn 13 09
pH 3 01 1755 plusmn 14 626 plusmn 7 09
pH 3 02 1737 plusmn 13 626 plusmn 15 09
pH 3 03 1723 plusmn 5 626 plusmn 13 09
pH 3 04 1720 plusmn 14 635 plusmn 17 09
pH 3 05 1677 plusmn 9 641 plusmn 14 09
pH 4 01 1778 plusmn 14 593 plusmn 16 10
pH 4 02 1747 plusmn 13 640 plusmn 15 09
pH 4 03 1679 plusmn 15 669 plusmn 18 08
pH 4 04 1689 plusmn 14 623 plusmn 15 09
pH 4 05 1679 plusmn 13 652 plusmn 19 08
All of the complexes have approximately 1 water molecule in the inner
hydration sphere This is consistent with the formation of a [Eu(DTPA)]2-
complex The
values are only slightly less than 1 (compared to [Eu(DTPA)]2-
itself where q = 11)
and in most cases is not significantly different This indicates that any interaction of
GSH with the Eu3+
centre is very weak and that the buffer may be in fast exchange with
the bound water molecule
4222 Extraction Studies
Extractions were carried out on the samples using 02 M HDEHP in dodecane
for the organic phase in the absence of DTPA The emission spectra of both the aqueous
and organic phases post-extraction can be seen in Figures 420 and 421
144
Figure 420 Emission spectra of aqueous phases after Eu3+
extraction at pH 2-4 over a
GSH concentration range of 01-05 M following excitation at 397 nm
Figure 421 Emission spectra of organic phases after Eu3+
extraction at pH 2-4 over a
GSH concentration range of 01-05 M following excitation at 397 nm
The extraction data show that the best Eu3+
extraction occurs at pH 3 under these
conditions although as seen from the separation data obtained at INL (Section 41) this
is not the best pH for separation of metal ions The J=1J=2 peak height ratios were
recorded for each emission spectrum and t-tests were carried out on the peak ratios
using the t-test data analysis tool in Microsoft Excel accounting for the standard
deviations between the ratios The J=1J=2 peak ratios for the aqueous phases show no
significant difference within the pH 4 data as the GSH concentration is increased and
00
05
10
15
20
25
30
35
40
45
50
550 600 650 700
Emis
sio
n In
ten
sity
(au
) H
un
dre
ds
Wavelength (nm)
01 M GSH pH 4 Aq
03 M GSH pH 4 Aq
05 M GSH pH 4 Aq
05 M GSH pH 3 Aq
05 M GSH pH 2 Aq
00
02
04
06
08
10
12
14
550 600 650 700
Emis
sio
n In
ten
sity
(au
) H
un
dre
ds
Wavelength (nm)
01 M GSH pH 4 Org
03 M GSH pH 4 Org
05 M GSH pH 4 Org
05 M GSH pH 3 Org
05 M GSH pH 2 Org
145
the standard deviation is small (Table 48) however a significant difference is observed
between each of the pH values for the same buffer concentration 05 M which is again
consistent with the co-ordination mode of glutathione changing with pH Interestingly
under these experimental conditions the extraction of Eu3+
as the HDEHPDEHP
organic soluble complexes is not very efficient since the emission intensities are
unusually low This suggests that in the absence of competing Am3+
ions GSH is
interacting relatively strongly with the Eu3+
ion in aqueous solution
Table 48 J=1J=2 peak ratios and t-test results for Eu-DTPA at pH 2-4 as [GSH] is
varied
J=1J=2
[GSH] (M)
01 03 05 st dev t-test
pD 4 0202 0276 0247 0037 No sig diff
pD 3 - - 0100 - -
pD 2 - - 0500 - -
st dev - - 0202
t-test - - Sig diff
423 [Na5DTPA] Dependence at pH 4
4231 Aqueous Phase Studies
The [Na5DTPA] dependence study carried out at the INL was also repeated in
order to gain luminescence data for the experiment The conditions used were pH 4 05
M GSH and [Na5DTPA] concentrations ranging from 005 ndash 06 M The emission
spectra can be seen in Figure 422
146
Figure 422 Emission spectra of Eu(NO3)3 in D2O at pD 4 with 05 M GSH over a
Na5DTPA concentration range of 005 ndash 06 M following excitation at 397 nm
The emission intensity of the complex decreases as the concentration of
Na5DTPA is increased from 005 M to 06 M This is likely to be due to the introduction
of more O-H oscillators and therefore increased quenching as the Na5DTPA stock
solution is aqueous and there is no deuterated alternative available The emission
spectra in water do not show this decrease in intensity (Figure 423)
Figure 423 Emission spectra of Eu(NO3)3 in H2O at pH 4 with 05 M GSH over a
Na5DTPA concentration range of 005 ndash 06 M following excitation at 397 nm
0
5
10
15
20
25
30
35
550 600 650 700
Emis
sio
n In
ten
sity
(au
) x
10
00
0
Wavelength (nm)
005 M DTPA
01 M DTPA
02 M DTPA
03 M DTPA
04 M DTPA
05 M DTPA
06 M DTPA
0
2
4
6
8
10
12
14
16
550 600 650 700
Emis
sio
n In
ten
sity
(au
) x
10
00
0
Wavelength (nm)
005 M DTPA
01 M DTPA
02 M DTPA
03 M DTPA
04 M DTPA
05 M DTPA
06 M DTPA
147
Table 49 J=1J=2 peak ratios and t-test results for Eu-DTPA with 05 M GSH in
D2OH2O at pDpH 4 over a Na5DTPA concentration range of 005-06 M
J=1J=2
[Na5DTPA] (M)
005 01 02 03 04 05 06 stdev t-test
D2O 0437 0441 0431 0437 0428 0425 0403 0013
No sig
diff
H2O 0450 0440 0437 0449 0422 0424 0428 0011
No sig
diff
The J=1J=2 peak height ratios were recorded for each emission spectrum and t-
tests were carried out on the peak ratios using the t-test data analysis tool in Microsoft
Excel accounting for the standard deviations between the ratios The J=1J=2 peak
ratios show no significant difference for either the D2O or H2O samples as the
Na5DTPA concentration is increased (Table 49) suggesting that the co-ordination
mode of the DTPA does not change as the concentration is increased The luminescence
lifetimes of the samples show a decrease across the D2O samples as the concentration of
Na5DTPA increases This is consistent with the decreased emission intensity due to
greater quenching of the samples as more water is introduced However there is a slight
increase across the H2O samples as the holdback concentration increased as quenching
is reduced in these samples due to the chelating effect of the DTPA molecules therefore
the results obtained in water for this study are likely to be most accurate The lifetimes
and q values are tabulated in Table 410 Although the q values are likely to be
unreliable especially for the highest Na5DTPA concentrations it can be seen that there
is still approximately 1 H2O molecule in the inner hydration sphere of the complexes
consistent with [Eu(DTPA)]2-
formation again implying very little or weak binding
with GSH
148
Table 410 Luminescence lifetimes and q values for Eu-DTPA with 05 M GSH at pH
4 over a Na5DTPA concentration range of 005-06 M following excitation at 397 nm
[Na5DTPA]
(M)
τ D2O (μs) τ H2O (μs) q plusmn 02
005 1679 plusmn 3 652 plusmn 2 08
01 1549 plusmn 4 659 plusmn 2 10
02 1348 plusmn 4 666 plusmn 3 09
03 1179 plusmn 4 665 plusmn 3 08
04 1076 plusmn 4 674 plusmn 4 07
05 978 plusmn 4 698 plusmn 4 05
06 916 plusmn 5 714 plusmn 5 03
4232 Extraction Studies
Extractions were carried out on the samples using 02 M HDEHP in dodecane
for the organic phase The emission spectra of both the aqueous and organic phases
post-extraction can be seen in Figure 424
Figure 424 Emission spectra of aqueous and organic phases after Eu3+
extraction with
05 M GSH at pH 4 over a Na5DTPA concentration range of 005-06 M following
excitation at 397 nm
0
1
2
3
4
5
6
7
550 600 650 700
Emis
sio
n In
ten
sity
(au
) H
un
dre
ds
Wavelength (nm)
01 M DTPA Aq
03 M DTPA Aq
05 M DTPA Aq
01 M DTPA Org
03 M DTPA Org
05 M DTPA Org
149
As expected the extraction data show that the best Eu3+
extraction occurs with
01 M Na5DTPA the lowest concentration of holdback reagent and that very little
extraction occurs at 03 M and 05 M Na5DTPA under these conditions The J=1J=2
peak ratios for the aqueous phases show no significant difference as the Na5DTPA
concentration is increased (Table 411) Unfortunately here the extraction is too weak
and the emission intensity too low to obtain reliable J=1J=2 peak ratios for the organic
phase
Table 411 J=1J=2 peak ratios and t-test results for Eu3+
in the aqueous phase with 05
M GSH at pH 4 as [Na5DTPA] is varied after extraction with 02 M HDEHP
Na5DTPA (M) 01 03 05 st dev t-test
J=1J=2 0552 0578 0502 0039 No sig
diff
424 [HDEHP] Dependence at pH 4
An HDEHP concentration dependence study was carried out under the same
conditions as the study at INL 05 M GSH 03 M Na5DTPA pH 4 and an extractant
concentration range of 04-10 M HDEHP in dodecane Equilibration time was for 30
minutes The emission spectra of the phases after extraction can be seen in Figures 425
and 426
150
Figure 425 Emission spectra of aqueous phases after Eu3+
extraction with 05 M GSH
and 03 M Na5DTPA at pH 4 over an HDEHP concentration range of 02-10 M
following excitation at 397 nm
The J=1J=2 peak ratios for the aqueous phases show no significant difference as
the HDEHP concentration is increased (Table 412) as expected since the co-ordination
mode of the aqueous phase should be unaffected by the organic phase Unfortunately
again the extraction is too weak and the emission intensity too low to obtain reliable
J=1J=2 peak ratios for the organic phase
Table 412 J=1J=2 peak ratios and t-test results for Eu3+
in the aqueous phase with 05
M GSH and 03 M Na5DTPA at pH 4 as [HDEHP] is varied after extraction
HDEHP (M) 04 06 08 10 st dev t-test
J=1J=2 0472 0499 0455 0510 0025 No sig
diff
00
02
04
06
08
10
12
550 600 650 700
Emis
sio
n In
ten
sity
(au
) x
10
00
0
Wavelength (nm)
04 M HDEHP Aq
06 M HDEHP Aq
08 M HDEHP Aq
10 M HDEHP Aq
151
Figure 426 Emission spectra of organic phases after Eu3+
extraction with 05 M GSH
and 03 M Na5DTPA at pH 4 over an HDEHP concentration range of 02-10 M
following excitation at 397 nm
The lowest Eu3+
extraction is with 04 M HDEHP with better extraction at
higher HDEHP concentrations Although better extraction is obtained at higher
concentrations Am3+
is also extracted to a higher extent decreasing the separation
factor (Section 413)
43 Radiolysis Studies using GSH at pH 4
431 Aqueous Phase Studies
In order to determine how resistant the glutathione buffered system is to
radiolysis a selection of aqueous samples at pHpD 4 containing 05 M GSH and a
Na5DTPA concentration range of 005-06 M were irradiated at the Dalton Cumbrian
Facility using a 60
Co irradiator The samples were exposed to 7 kGy γ-radiation and
analysed by luminescence spectroscopy The emission spectra of the samples can be
seen in Figure 427
00
00
00
01
01
01
01
550 600 650 700
Emis
sio
n In
ten
sity
(au
) x
10
00
0
Wavelength (nm)
04 M HDEHP Org
06 M HDEHP Org
08 M HDEHP Org
10 M HDEHP Org
152
Figure 427 Emission spectra of Eu(NO3)3 in H2O at pH 4 with 05 M GSH over a
Na5DTPA concentration range of 005 ndash 06 M after irradiation with 7 kGy γ-radiation
following excitation at 397 nm
The spectra of the samples show a lower emission intensity after irradiation
(Figure 427) than beforehand (Figure 423) but the profile remains the same indicating
that the radiation has little or no degrading effect on the complex in the aqueous phase
The decreased intensity is likely to be due to increased quenching effects caused by
residual radicals present as a result of irradiating the solvent The J=1J=2 ratios and co-
ordination mode remained unchanged (Table 413) as did the luminescence lifetimes of
the samples and the q values (Table 414)
00
01
01
02
02
03
03
04
550 600 650 700
Emis
sio
n In
ten
sity
(au
) x
10
00
0
Wavelength (nm)
005 M DTPA
01 M DTPA
02 M DTPA
03 M DTPA
04 M DTPA
05 M DTPA
06 M DTPA
153
Table 413 J=1J=2 peak ratios and t-test results for Eu-DTPA with 05 M GSH in
D2OH2O at pDpH 4 over a Na5DTPA concentration range of 01-06 M after
irradiation with 7 kGy γ-radiation
[Na5DTPA] (M)
01 02 03 04 05 06 st
dev
t-test
J=1J=2 0477 0481 0452 0401 0407 0411 0036
No sig
diff
Table 414 Luminescence lifetimes and q values for Eu-DTPA with 05 M
GSH at pH 4 over a Na5DTPA concentration range of 01-06 M after irradiation with 7
kGy γ-radiation
[Na5DTPA] (M) τ H2O (μs) τ D2O (μs) q plusmn 02
01 648 plusmn 4 1895 plusmn 12 10
02 661 plusmn 6 1678 plusmn 10 09
03 670 plusmn 6 1536 plusmn 11 08
04 679 plusmn 5 1462 plusmn 9 07
05 701 plusmn 7 1328 plusmn 10 05
06 696 plusmn 6 1211 plusmn 8 03
432 Extraction Studies
Extractions were then carried out on a selection of the irradiated samples using
02 M HDEHP in dodecane with Eu3+
The resultant emission spectra of both the
aqueous and organic phases post-extraction can be seen in Figure 428
154
Figure 428 Emission spectra of aqueous and organic phases after Eu3+
extraction from
irradiated aqueous phase at pH 4 containing 05 M GSH over a Na5DTPA concentration
range of 01-06 M
As expected the extraction data show that the best Eu3+
extraction occurs with
01 M Na5DTPA the lowest concentration of holdback reagent and that very little
extraction occurs at 03 M and 05 M Na5DTPA under these conditions With the
exception of the 01 M Na5DTPA sample for which the extraction decreases after
irradiation the emission intensity remains relatively constant for each of the phases of
the samples after irradiation The J=1J=2 ratios and co-ordination mode for the aqueous
phase remained unchanged (Table 415) Again the extraction is too weak and the
emission intensity too low to obtain reliable J=1J=2 peak ratios for the organic phase
Table 415 J=1J=2 peak ratios and t-test results for Eu3+
in the aqueous phase with 05
M GSH and at pH 4 as [Na5DTPA] is varied after extraction with 02 M HDEHP in
dodecane from an aqueous phase irradiated at 7 kGy γ ndashradiation
Na5DTPA (M) 01 03 05 st dev t-test
J=1J=2 0505 0563 0551 0031 No sig diff
44 Luminescence Studies using GSH with Dy3+
As well as obtaining primary extraction data for GSH with Eu3+
under a variety
of conditions it is also important to consider the behaviour and extraction of other Ln3+
ions with the buffer in order to achieve effective lanthanide-actinide separation
0
1
2
3
4
5
6
7
8
9
10
550 600 650 700
Emis
sio
n In
ten
sity
(au
) Hu
nd
red
s
Wavelength (nm)
01 M DTPA Aq
03 M DTPA Aq
05 M DTPA Aq
01 M DTPA Org
03 M DTPA Org
05 M DTPA Org
155
Dysprosium(III) was chosen for a preliminary study as it is later in the lanthanide series
representing the heavier metal ions and how they may behave under such conditions
Also like Eu3+
it is emissive in the visible region of the electromagnetic spectrum and
so may be easily analysed by luminescence spectroscopy
441 Dy3+
Complexation Studies
Initial data were obtained for Dy3+
and emission spectra were recorded for the
free ion from Dy(NO3)3 Dy-DTPA (005 M Na5DTPA) and Dy(NO3)3 with GSH (05
M) all in aqueous solution (Figure 429) A concentration of 005 M Na5DTPA was
chosen for the dysprosium experiments as the emission intensity of Dy3+
is relatively
weak and this technique is not sensitive enough to observe any extraction of the metal
from high Na5DTPA concentrations
Figure 429 Emission spectra of Dy(NO3)3 (10 mM) Dy-DTPA (10 mM Dy(NO3)3
005 M Na5DTPA) and Dy(NO3)3 (10 mM) with GSH (05 M) in H2O following
excitation at 352 nm Note that the tail of ligand emission can be seen in the Dy DTPA
and Dy GSH solutions at shorter wavelengths
The spectra show that the emission intensity of the 7F92 rarr
6H152 and
7F92 rarr
6H132 transitions is slightly higher when GSH buffer is present in solution than for the
free ion alone and the intensity is much greater when Na5DTPA is present in the
solution showing formation of a Dy-DTPA complex Interestingly evidence for
binding of GSH and DTPA with Dy3+
is further manifested in the emission spectra by
the presence of residual ligand emission at higher energy These samples were then
00
02
04
06
08
10
12
14
16
425 475 525 575 625 675
Emis
sio
n In
ten
sity
(au
) x
10
00
0
Wavelength (nm)
Dy H2O
Dy DTPA
Dy GSH
7F92 rarr
6H152
7F92 rarr
6H132
156
extracted into an organic phase of 10 M HDEHP in dodecane (Figure 430) as 02 M
extractant was found to be too low to observe any Dy3+
extraction due to the overall
weak emission of the ion relative to Eu3+
Figure 430 Emission spectra of aqueous and organic phases of Dy(NO3)3 Dy-DTPA
and Dy(NO3)3 with GSH after extraction with 10 M HDEHP following excitation at
352 nm
The spectra show that without Na5DTPA present the Dy3+
is extracted into the
organic phase but for the Dy-DTPA complex little or no metal extraction is observed in
the absence of competitive binding with Am3+
This may indicate that the metal is not
being extracted into the organic phase and that the heavier lanthanides may suffer the
same kinetic issues present for amino acid buffers at higher pH (Section 332) or that
this technique is not sensitive enough to obtain good extraction data for less emissive
lanthanides
442 pH Dependence Studies
To attempt to determine whether kinetic issues arise for heavier lanthanides with
GSH buffer at higher pH values a pH study was carried out on Dy-DTPA systems
containing 005 M Na5DTPA and 05 M GSH over a pH range of 2-4 One sample
containing 03 M Na5DTPA was also measured analogous to the europium data sets
The extraction data can be seen in Figure 431
00
02
04
06
08
10
12
14
425 475 525 575 625 675
Emis
sio
n In
ten
sity
(au
) x
10
00
0
Wavelength (nm)
Dy H2O Aq
Dy DTPA Aq
Dy GSH Aq
Dy H2O Org
Dy DTPA Org
Dy GSH Org
157
Figure 431 Emission spectra of aqueous and organic phases of Dy(NO3)3 Dy-DTPA
and Dy(NO3)3 with GSH after extraction with 10 M HDEHP following 352 nm
excitation
The extraction is lowest for the sample with the highest Na5DTPA
concentration as would be expected As the pH increases the extraction of Dy3+
decreases suggesting that the same kinetic issues may also be present in for the GSH
system Further investigation using a more sensitive technique such as ICP-MS is
necessary to confirm this (Section 46)
45 Luminescence Studies using GSH with Mixed Ln3+
Systems at pH 4
The Dy3+
luminescence work was extended to solutions of a mixture of 4
luminescent lanthanide ions (Sm3+
Eu3+
Tb3+
and Dy3+
) to be able to probe the relative
extraction of different lanthanides from a mixture relevant to a real TALSPEAK type
process The spectra are colour coded to each ionrsquos luminescent colour under UV light
irradiation
451 Complexation Studies
Initial data were obtained for each lanthanide ion and emission spectra were
recorded for Ln(NO3)3 Ln-DTPA (005 M Na5DTPA) and Ln(NO3)3 with GSH (05
M) all in aqueous solution (Figures 432-434) analogous to the Dy3+
data
00
01
02
03
04
05
06
07
08
09
10
550 560 570 580 590
Emis
sio
n In
ten
sity
(au
) x 1
00
00
Wavelength (nm)
pH 2 Aq
pH 3 Aq
pH 4 Aq
pH 4 (03 M DTPA) Aq
pH 2 Org
pH 3 Org
pH 4 Org
pH 4 (03 M DTPA) Org
158
Figure 432 Emission spectra of Ln(NO3)3 (1 mM EuTbSm3+
10 mM Dy3+
) in H2O
at pH 4 following direct excitation (405 nm for Sm3+
397 nm for Eu3+
366 nm for Tb3+
and 352 nm for Dy3+
)
Figure 433 Emission spectra of Ln(NO3)3 (1 mM EuTbSm3+
10 mM Dy3+
) with
GSH (05 M) at pH 4 in H2O following direct excitation (405 nm for Sm3+
397 nm for
Eu3+
366 nm for Tb3+
and 352 nm for Dy3+
)
0
5
10
15
20
25
30
35
40
45
50
450 500 550 600 650 700 750
Emis
sio
n In
ten
sity
(au
) H
un
dre
ds
Wavelength (nm)
Sm
Eu
Tb
Dy
0
2
4
6
8
10
12
14
16
18
20
450 500 550 600 650 700 750
Emis
sio
n In
ten
sity
(au
) Th
ou
san
ds
Wavelength (nm)
Sm
Eu
Tb
Dy
159
Figure 434 Emission spectra of Ln-DTPA (1 mM EuTbSm3+
10 mM Dy3+
005 M
Na5DTPA) in H2O at pH 4 following direct excitation (405 nm for Sm3+
397 nm for
Eu3+
366 nm for Tb3+
and 352 nm for Dy3+
)
For all of the metal ions the emission intensity is greater in the sample with
GSH than for the free ions in solution due to reduced quenching by the presence of the
buffer The profiles of all of the spectra remain the same showing that although the
glutathione may be in exchange with surrounding water molecules a stable complex
between the buffer and metal ions is not being formed The emission intensity is much
greater for each of the metal ions with Na5DTPA due to the formation of a Ln-DTPA
complex in each case and the peak splitting observed for the Eu3+
complex can also be
seen for the Tb3+
complex as the emission spectra of these ions are more sensitive to
their co-ordination environment than Sm3+
or Dy3+
Table 416 Luminescence lifetimes for lanthanide samples at pH 4
Sample Lifetime (μs)
Sm(III) Eu (III) Tb(III) Dy (III)
Ln3+
341 plusmn 1 121 plusmn 25 394 plusmn 19 525 plusmn 1
Ln3+
with
GSH
686 plusmn 1 184 plusmn 8 558 plusmn 28 830 plusmn 1
Ln-DTPA 11 plusmn 1 671 plusmn 4 1930 plusmn 20 14 plusmn 1
0
1
2
3
4
5
6
7
450 500 550 600 650 700 750
Emis
sio
n In
ten
sity
(au
) x
10
00
0
Wavelength (nm)
Sm
Eu
Tb
Dy
160
The luminescence lifetimes of all the metal ions (Table 416) are in the expected
ranges for these ions in aqueous solutions and exhibit the same pattern as the emission
intensities increasing as GSH is added to the metal solutions and being greatest for the
Ln-DTPA complexes The q values were calculated for Eu3+
and Tb3+
as calculations of
q for Sm3+
and Dy3+
are unreliable and were as expected with a hydration number of
around 8 for the M3+
ion in solution co-ordination of around 5 for the M3+
ion with
GSH (consistent with the [GSH] dependence studies in Section 421) and 1 water
molecule bound to the Ln-DTPA complex
Table 417 Luminescence lifetimes and q values for Eu3+
and Tb3+
samples at pH 4
Sample Lifetime (μs) q
Eu (III)
H2O
Eu (III)
D2O
Tb(III)
H2O
Tb (III)
D2O
Eu(III) Tb(III)
Ln3+
121 plusmn 25 2309 plusmn 38 394 plusmn 19 1698 plusmn 16 82 82
Ln3+
with
GSH
184 plusmn 8 1658 plusmn 26 558 plusmn 28 1889 plusmn 12 52 53
Ln-DTPA 671 plusmn 4 2066 plusmn 15 1930 plusmn 20 3546 plusmn 27 09 09
452 pH Dependence Studies
As with the dysprosium study extractions were carried out on the mixed
lanthanide samples under the same conditions The aqueous phases contained 005 M
Na5DTPA and 05 M GSH over a pH range of 2-4 The emission spectra of each
aqueous sample before extraction were also recorded but were found to be the same for
each pH The luminescence lifetimes of the samples were also very similar (Table 418)
consistent with the Eu3+
data (Section 422) The q values for Eu3+
and Tb3+
are as
expected with 1 water molecule bound to each Ln-DTPA complex (Table 419) As a
representative example the spectra for the pH 4 sample can be seen in Figure 435
161
Figure 435 Emission spectra of Ln(NO3)3 (1 mM EuTbSm3+
10 mM Dy3+
) with
GSH (05 M) and Na5DTPA (005 M) following direct excitation (405 nm for Sm3+
397
nm for Eu3+
366 nm for Tb3+
and 352 nm for Dy3+
)
Table 418 Luminescence lifetimes for aqueous phases before extraction over a
pH range of 2-4
Sample Lifetime (μs)
Sm(III) Eu (III) Tb(III) Dy (III)
pH 2 12 plusmn 1 677 plusmn 9 1851 plusmn 21 14 plusmn 1
pH 3 12 plusmn 1 715 plusmn 9 1934 plusmn 21 13 plusmn 1
pH 4 12 plusmn 1 699 plusmn 7 1912 plusmn 26 14 plusmn 1
Table 419 Luminescence lifetimes and q values for Eu3+
and Tb3+
samples before
extraction over a pH range of 2-4
Sample Lifetime (μs) q
Eu (III)
H2O
Eu (III)
D2O
Tb(III)
H2O
Tb (III)
D2O
Eu(III) Tb(III)
pH 2 677 plusmn 9 2897 plusmn 27 1851 plusmn 21 3765 plusmn 31 09 10
pH 3 715 plusmn 9 3011 plusmn 13 1934 plusmn 21 3705 plusmn 22 08 09
pH 4 699 plusmn 7 3032 plusmn 15 1912 plusmn 26 3815 plusmn 16 09 10
00
10
20
30
40
50
60
70
450 500 550 600 650 700 750
Emis
sio
n In
ten
sity
(au
) x
10
00
0
Wavelength (nm)
Sm
Eu
Tb
Dy
162
The spectra for the aqueous and organic phases after extraction with 10 M
HDEHP in dodecane (in order to ensure sufficient enough extraction to be observed by
this technique) are plotted in Figures 436-438
Figure 436 Emission spectra of aqueous and organic phases of Ln3+
with 05 M GSH
and 005 M Na5DTPA after extraction with 10 M HDEHP at pH 2 following direct
excitation (405 nm for Sm3+
397 nm for Eu3+
366 nm for Tb3+
and 352 nm for Dy3+
)
Figure 437 Emission spectra of aqueous and organic phases of Ln3+
with 05 M GSH
and 005 M Na5DTPA after extraction with 10 M HDEHP at pH 3 following direct
excitation (405 nm for Sm3+
397 nm for Eu3+
366 nm for Tb3+
and 352 nm for Dy3+
)
00
05
10
15
20
25
30
450 500 550 600 650 700 750
Emis
sio
n In
ten
sity
(au
) x
10
00
0
Wavelength (nm)
Sm Aq
Eu Aq
Tb Aq
Dy Aq
Sm Org
Eu Org
Tb Org
Dy Org
00
05
10
15
20
25
30
450 500 550 600 650 700 750
Emis
sio
n In
ten
sity
(au
) x
10
00
0
Wavelength (nm)
Sm Aq
Eu Aq
Tb Aq
Dy Aq
Sm Org
Eu Org
Tb Org
Dy Org
163
Figure 438 Emission spectra of aqueous and organic phases of Ln3+
with 05 M GSH
and 005 M Na5DTPA after extraction with 10 M HDEHP at pH 4 following direct
excitation (405 nm for Sm3+
397 nm for Eu3+
366 nm for Tb3+
and 352 nm for Dy3+
)
At all three pH values the order of extractability is Sm gt Eu gt Tb gt Dy
showing that the heavier lanthanides are the most difficult to extract The above data
demonstrate that extraction of Ln3+
is reasonably good at pH 2 and 3 but slightly lower
at pH 3 However at pH 4 extraction of all lanthanide ions is drastically reduced
particularly for Tb3+
and Dy3+
which have very low relative concentrations in the
organic phase Although the extraction of Sm3+
and Eu3+
is also greatly reduced there is
still some extraction of these metals into the organic phase This is consistent with the
previously obtained dysprosium results suggesting that there may be kinetic issues
present for heavier lanthanides at high pH The trend in relative extraction efficiency of
the Ln3+
ions approximately follows the relative stability constants of GSH-Ln
complexes Lighter Ln-GSH complexes are less stable an effect of charge density of the
Ln3+
cations so are extracted more efficiently This was investigated further by ICP-
MS
46 ICP-MS Studies with GSH
In order to determine whether a TALSPEAK type system using glutathione as a
buffer had the same kinetic issues as the amino acid systems whereby poor separation of
the heavier lanthanides was observed ICP-MS was carried out on extracted samples
containing 10 lanthanides (La-Ho with the exception of Pm) at pH 2 3 and 4 to
00
05
10
15
20
25
30
35
450 500 550 600 650 700 750
Emis
sio
n In
ten
sity
(au
) x
10
00
0
Wavelength (nm)
Sm Aq
Eu Aq
Tb Aq
Dy Aq
Sm Org
Eu Org
Tb Org
Dy Org
164
determine the distribution pattern of the series using GSH as a buffer The DLn values
can be seen in Figures 439 and 440 for the pH 2 and pH 3 data sets
Figure 439 DLn for varying GSH concentration at pH 2 with 005 M Na5DTPA after
extraction with 02 M HDEHP in dodecane
Figure 440 DLn for varying GSH concentration at pH 3 with 005 M Na5DTPA after
extraction with 02 M HDEHP in dodecane
0
5
10
15
20
25
30
35
40
56 57 58 59 60 61 62 63 64 65 66 67 68
Dis
trib
uti
on
Rat
io
Atomic Number
01 M GSH
02 M GSH
03 M GSH
04 M GSH
05 M GSH
Am3+
0
5
10
15
20
25
30
35
56 57 58 59 60 61 62 63 64 65 66 67 68
Dis
trib
uti
on
Rat
io
Atomic Number
01 M GSH
02 M GSH
03 M GSH
04 M GSH
05 M GSH
Am3+
165
The data set for pH 2 resembles a typical TALSPEAK curve as also
demonstrated by amino acids at pH 2 (Section 3) However at pH 3 the distribution of
the metal ions continues to decrease across the lanthanide series indicating that higher
pH is less favourable for extraction of the heavier lanthanides This may be explained
by the fact that the stability of Ln-GSH complexes is lower at lower pH values making
the metal ions easier to extract The analysis was also repeated for samples at pH 4 but
for some of the later lanthanides in the series the quantity of metal ion present was
below the limit of detection of the technique (004 ng mL-1
) so the data could not
accurately be plotted Corresponding separation factors can be seen in Table 420 and
plotted in Appendix 2 (for pH 2 and 3) Separation factors for all lanthanides are fairly
low at pH 2 compared to the original TALSPEAK process (SFEuAm = 91) The data also
show that for the earlier lanthanides as the pH is increased very high separation factors
can be achieved but separation is much lower for later lanthanides with increasing pH
This indicates that unfortunately the same kinetic issues are likely to be a problem at
higher pH for the glutathione buffered system as for the amino acid systems
166
Table 420 SFLnAm for varying GSH concentration over a pH range of 2-4 with
005 M Na5DTPA after extraction with 02 M HDEHP in dodecane
pH
[GSH]
(M)
SF
La Ce Pr Nd Sm Eu Gd Tb Dy Ho
2 01 234 171 148 107 136 158 216 222 237 234
2 02 244 176 145 103 134 146 215 229 239 244
2 03 263 183 145 105 137 165 243 244 281 289
2 04 239 170 151 111 145 168 218 237 259 265
2 05 278 197 164 117 162 189 257 269 300 314
3 01 1735 972 477 276 163 104 112 53 41 38
3 02 1953 841 433 256 320 266 290 130 89 77
3 03 1898 785 388 220 152 90 95 39 28 24
3 04 2046 812 412 243 196 121 126 53 38 34
3 05 2145 705 312 139 36 16 20 04 02 00
4 01 3777 141 12 - - - - - - -
4 02 5548 231 36 06 - - - - - -
4 03 2768 239 27 - - - - - - -
4 04 1620 150 21 01 - - - - - -
4 05 1589 286 48 11 - - - - - -
47 1H NMR Studies on GSH Systems
The glutathione systems were additionally studied by 1H NMR spectroscopy in
order to confirm the complexation observed by luminescence spectroscopy Spectra
were recorded in D2O for GSH GSH after irradiation Eu(NO3)3 with GSH (150)
Na5DTPA with GSH (110) and Eu-DTPA with GSH (1550
Eu(NO3)3Na5DTPAGSH) (Figures 441 a-e)
167
GSH0011resp
45 40 35 30 25 20 15 10
Chemical Shift (ppm)
0
005
010
Norm
alized Inte
nsity
197201200100200099
c
d
gb
i
f
44
944
844
6
38
9
37
637
437
2
28
628
628
528
4
24
924
824
724
624
524
4
21
120
920
720
5
GSH Irradiated0011resp
45 40 35 30 25 20 15 10
Chemical Shift (ppm)
0
005
010
015
020
025
Norm
alized Inte
nsity
133151244272014101206498131111059100
m
c
d
n
g
q
b
l
i
p
f
47
0
44
7 44
544
442
942
841
641
541
140
940
940
738
137
737
537
3
36
736
6
29
929
728
428
328
1
26
7
24
6
24
424
324
223
823
022
822
6
20
720
520
419
6
19
519
419
319
1
a
b
168
Eu GSH0011resp
45 40 35 30 25 20 15 10
Chemical Shift (ppm)
005
010
015
Norm
alized Inte
nsity
035183050206177050088216024026100
d
g
b
i
f
c
45
044
844
7
42
0 41
841
741
341
241
138
0 37
837
737
136
9 30
230
1
28
928
728
628
428
328
1
25
124
924
724
624
424
2 23
3 23
122
921
020
820
720
519
919
819
719
6
GSH DTPA0011resp
45 40 35 30 25 20 15 10
Chemical Shift (ppm)
0
005
010
015
Norm
alized Inte
nsity
032158045179156092075366021025099
c
d
g
DTPA
DTPA
DTPA
b
DTPA
i
f
45
044
9 44
744
6
41
941
841
741
241
141
0
37
937
737
537
036
8
34
133
633
5
30
730
530
1
28
928
628
528
428
228
0
25
024
824
624
524
324
1 23
223
022
821
020
820
620
419
719
5
c
d
169
EuDTPA GSH0011resp
45 40 35 30 25 20 15 10
Chemical Shift (ppm)
0
0005
0010
0015
0020
0025
0030
0035
0040
0045
0050
0055
Norm
alized Inte
nsity
180181200200212103673021100
47
0
44
244
1
38
4
36
836
3
32
832
0 30
230
129
9 28
628
528
328
1
24
724
624
524
424
3
20
820
720
520
3
Figure 441 1H NMR spectra for GSH in D2O under a range of conditions at 298 K a)
GSH b) GSH after irradiation with 7 kGy γ-radiation c) Eu(NO3)3 with GSH d) GSH
with Na5DTPA e) Eu-DTPA with GSH
Figure 442 1H
1NMR proton assignments for GSH (top) and γ-Glu-Cys (bottom)
It can be seen from spectra ldquoardquo and ldquobrdquo that there is some degradation of GSH
after irradiation with 7 kGy γ-radiation from a 60
Co irradiator shown by the presence of
e
170
γ-Glu-Cys fragments12
(Figure 442) The buffer seems to be susceptible to γ-radiolysis
and the integration ratios show that the γ-Glu-Cys fragments are present in a significant
quantity as the ratios are comparable to those of the intact GSH Spectrum ldquocrdquo shows
that the buffer does not form a stable complex with Eu3+
as there is only slight shifting
of the peaks indicating weak interaction and perhaps fast dynamic exchange on the
timescale of the NMR experiment There is also no notable paramagnetic broadening as
would be expected if a Eu3+
complex is formed Spectrum ldquoerdquo does show slight
paramagnetic broadening relative to spectrum ldquodrdquo (Na5DTPA with GSH) confirming
the formation of the Eu-DTPA complex seen in previous emission spectra (Section
422)
48 Summary and Conclusion of Glutathione Work
Since amino acids have not been shown to act as holdback reagents by
themselves the potential of using the tripeptide L-glutathione was investigated Initial
separation studies were carried out using glutathione at pH 4 as is was anticipated that
based on its pKa values glutathione would be most likely to act as a successful
holdback reagent at this pH despite the unfavourable increase of pH Preliminary
investigations found that like amino acids GSH is ineffective as a holdback reagent on
its own as there was no separation observed between Eu3+
and Am3+
when used without
Na5DTPA
Subsequent investigations were carried out using GSH alongside Na5DTPA to
determine whether separation was improved with the tripeptide buffer At pH 2 and pH
3 it was found that the glutathione acts solely as a buffer as the separation factor in each
case was independent of GSH concentration However at pH 4 separation between
Eu3+
and Am3+
was found to increase as the buffer concentration was increased
suggesting that the glutathione is interacting with the Ln-DTPA complexes at this pH
This could be explained by the increase in stability of Ln-GSH complexes as the pH is
increased A buffer concentration of 05 M was then used for all further optimisation
experiments
At 05 M GSH the separation factor was found to increase dramatically as a
function of Na5DTPA concentration up to 03 M Na5DTPA After this peak there was
a rapid decrease in separation as the concentration is increased further up to 06 M
Na5DTPA as the stoichiometry is close to 11 GSHDTPA The separation factors
achieved here were extremely high (~1000) ndash a factor of 10 higher than the current
171
TALSPEAK system and the optimised alanine system whilst still maintaining low Am3+
extraction
At 03 M Na5DTPA the separation factor then increased as the extractant
concentration was increased from 02 to 04 M HDEHP in dodecane after which the SF
began to decrease again with the optimum separation at 04 M giving a SF of 1238 At
04 M Na5DTPA however the separation factor decreases rapidly as the extractant
concentration is increased due to the DAm increasing by a factor of 1000 consistent with
the complexant and buffer possibly forming some kind of adduct which no longer
successfully holds back Am3+
at higher Na5DTPA concentrations
Luminescence experiments mimicking the separation studies showed that the
glutathione does not form a stable complex with the Eu3+
ion and is in exchange with
surrounding solvent molecules even at the highest buffer concentrations preventing the
GSH from acting as a holdback reagent and allowing extraction of the metal into the
organic phase Proton NMR spectroscopy confirmed that although the glutathione may
be in exchange with surrounding water molecules no stable complexes between the
buffer and metal ions are formed (Appendix 8)
In samples containing Na5DTPA a Eu-DTPA complex can be clearly observed
in the emission spectra with or without the presence of GSH over a pH range of 2-4
The J=1J=2 peak ratios showed that there is no change in the co-ordination mode of the
buffer to the metal ion as the concentration of GSH is increased for each pH However
across the data sets the co-ordination mode of glutathione was found to be different at
different pH values as expected based on pKa values and increasing stability constant
with pH
At 05 M GSH the co-ordination mode of the Eu-DTPA complex in the aqueous
phase was found not to change as [Na5DTPA] was changed with metal extraction
typically decreasing as the holdback reagent increases and at 03 M Na5DTPA with 05
M GSH extraction was found to increase as HDEHP concentration increased as
expected Unfortunately luminescence spectroscopy does not seem to be a sensitive
enough technique to gain much information from samples post-extraction using these
conditions
In order to determine how resistant the glutathione buffered system is to
radiolysis a selection of samples were irradiated with 7 kGy γ-radiation and analysed
by luminescence and 1H NMR spectroscopies The radiation was seen to have some
degrading effect on the buffer in the aqueous phase with slightly decreased
luminescence emission intensity of complexes post-irradiation and evidence of
172
significant quantities of γ-Glu-Cys fragments present in the 1H NMR spectrum
However the emission profiles co-ordination mode and luminescence lifetimes of the
samples remained unchanged Extraction also seemed to be unaffected with the
emission remaining relatively constant for each of the phases of the samples after
irradiation
Initial data obtained on the glutathione system with europium(III) and
americium(III) seemed promising as after optimisation very high separation factors
were achieved and despite the buffer being susceptible to radiolysis extraction of
lanthanide ions was still high after irradiation However in order to be a successful
alternative to the current TALSPEAK system it is essential that effective separation of
all lanthanides from MA3+
can occur Further luminescence experiments were carried
out firstly on an analogous dysprosium system in order to represent heavier lanthanide
elements followed by a mixture of 4 lanthanide metals in the same samples
For the dysprosium study as the pH was increased from 2-4 the extraction of
Dy3+
decreased suggesting that the same kinetic issues noted for heavier lanthanides in
the amino acid systems may also be present for the GSH system at higher pH values In
the mixed samples the same pattern was observed with extraction of Ln3+
decreasing as
pH was increased At pH 4 extraction of all lanthanide ions was very low particularly
for Tb3+
and Dy3+
which are both heavier than Sm3+
and Eu3+
ICP-MS was carried out
on a series of samples containing a mixture of 10 lanthanides in order to confirm
whether the heavier lanthanides are in fact subject to kinetic issues with GSH
ICP-MS data was consistent with the luminescence data showing decreased
extraction of heavier lanthanides as pH increases from 2 to 4 The quantity of metal
extracted was so low it was below the limit of detection for some of the heavier metals
at pH 4 forcing the conclusion that unfortunately the same kinetic issues are a problem
at higher pH for the glutathione buffered system as for the amino acid systems Further
optimisation of the system to exploit the combined liquid-liquid extraction efficiencies
as a function of atomic number may allow the development of an extraction process of
lighter over heavier lanthanides for rare earth recycling which is currently a
strategically important goal13
173
1 ImmuneHealthSciencecom What Glutathione (GSH) is and how it affects your
immune health httpwwwimmunehealthsciencecomglutathionehtml 2015
2 ME Sears Scientific World Journal 2013 2013 219840
3 L Patrick Mercury toxicity and antioxidants Part I Role of glutathione and alpha-
lipoic acid in the treatment of mercury toxicity Alternative Medicine 2002
4 EA Bump and JM Brown Pharmacol Ther 1990 47 1 117-136
5 JB Mitchell and A Russo Br J Cancer 1987 55 Suppl VIII 96-104
6 VV Nikonorov J Anal Chem 2010 65 4 359-365
7 A Miličević and N Raos Acta Chim Slov 2014 61 904-908
8 BS Garg BK Singh DN Kumar and PK Sing Indian J Chem 2003 42A 79-83
9 Sigma Aldrich Product Information
httpwwwsigmaaldrichcometcmedialibdocsSigma-AldrichProduct_Information_
Sheetg4251pisPar0001Filetmpg4251pispdf
10 SJA Pope BP Burton-Pye R Berridge T Khan PJ Skabara and S Faulkner
Dalton Trans 2006 2907-2912
11 TS Grimes MP Jensen L Debeer-Schmidt K Littrell and KL Nash J Phys
Chem B 2012 116 46 13722-13730
12 RJ Hopkinson PS Barlow CJ Schofield and TDW Claridge Org Biomol
Chem 2010 8 4915-4920
13 LS Natrajan and MH Langford Paden f-Block Elements Recovery in A Hunt ed
Element Recovery and Sustainability RSC 2013 6 140-184
174
5 MODIFIED DTPA LIGANDS AS COMBINED BUFFERS AND SOFT
DONORS IN A TALSPEAK SYSTEM
Amino acids and the tripeptide L-glutathione have been shown not to be suitable
as a combined buffer and soft-donor for potential replacement of DTPA
(diethylenetriaminepentaacetic acid) and the lactate buffer used in the TALSPEAK
process (Trivalent Actinide Lanthanide Separation by Phosphorus reagent Extraction
from Aqueous Complexation) an advanced reprocessing technique currently being
developed in the USA They do not act as holdback reagents in their own right as they
do not bind preferentially to minor actinide (MA3+
) over lanthanide (Ln3+
) ions
preventing enhanced selective extraction of Ln3+
by HDEHP (di-
(2ethylhexyl)phosphoric acid) into an organic phase The possibility of synthesising a
combined buffer and soft-donor with DTPA and amino acid functionality was therefore
considered
By incorporating additional soft donors onto the DTPA structural framework
from amino acids the overall system would be simplified to just two components rather
than three This could be achieved by incorporating an amino acid or other soft donor
compounds into the DTPA scaffold itself (Figure 51) This strategy may increase the
complexation affinity binding constants and associated thermodynamic parameters to
the MA3+
ion improving the separation and slowing down the kinetics of the exchange
processes if the ligand has a significant specificity for MA3+
over Ln3+
This is
especially true if two of the carboxylic acid moieties are replaced by relatively softer
donors here amide groups
A report on bis(methionine)-appended DTPA was published by Hazari et al in
2010 on the use of Tc-DTPA-bis(methionine) in tumour imaging1 however there are no
literature reports on the synthesis or use of amino acid appended or any modified DTPA
ligands for solvent extraction and separation studies
The work described in this chapter was performed in collaboration with an
MChem student a summer student and the Institute for Waste disposal (INE)
Karlsruhe Germany The initial ligand syntheses were carried out jointly between
myself and the MChem student and all luminescence analysis was performed jointly
The refining of the syntheses and characterisation of the ligands was carried out by a
summer student All separation work using the ligands was carried out by colleagues at
INE
175
Figure 51 General structure of DTPA-amino acid ligands
51 Ligand Synthesis and Characterisation
A route for the synthesis of DTPA-bis(amino acids) was devised involving ring
opening of the anhydride of DTPA with an amine group of the amino acid in question
whereby the amino acid is incorporated onto two of the side arms of the DTPA
according to Scheme1234
Initially the reaction was attempted using the acid forms of
the amino acid L-alanine however the reaction was found to be unsuccessful since only
an amino acid dimer could be isolated In order to allow optimisation of the reaction
conditions whilst avoiding competitive side reactions the reactions were repeated using
the methyl or ethyl ester protected forms of the amino acids Here commercially
available methyl esters of L-alanine L-arginine and L-histidine and the ethyl ester of L-
serine were used The amide coupling reactions with these amino acid derivatives using
triethylamine as the base proceeded in high yield However isolation and purification of
the products was found to be quite difficult as the reaction products are very
hygroscopic and stubbornly retain residual triethylamine salts Therefore the relatively
impure ligands were isolated for further studies following multiple re-precipitations and
re-crystallisation All the ligands were characterised by 1H NMR spectroscopy
MALDI-MS and elemental analysis (Section 742)
Scheme 1 Synthesis of DTPA-bis(amino) alkyl esters
Protected
Protected Protected
176
52 Luminescence Studies on Ligand Systems at pH 2 3 and 4
521 Aqueous Phase Studies
The DTPA-amino acid ligands synthesised were studied by luminescence
spectroscopy in a TALSPEAK type system The ligands self-buffer at approximately
pH 2 at 50 mM concentration but to ensure consistency in studies the pH of systems
were adjusted to exact pH values (plusmn 01) Aqueous phases were prepared containing 50
mM ligand and 1 mM Eu(NO3)3 at pHpD 2 3 and 4 for each of the four synthesised
ligands Samples were measured in D2O and H2O The emission spectra of the D2O
samples can be seen in Figures 52-54 The spectra for the samples in H2O are identical
but with lower relative emission intensities
Figure 52 Emission spectra of Eu(NO3)3 with DTPA-bis(amino ester) ligands in D2O
at pD 2 following excitation at 397 nm
0
5
10
15
20
25
30
35
550 575 600 625 650 675 700
Emis
sio
n In
ten
sity
(au
) x
10
00
0
Wavelength (nm)
Ala-DTPA
Arg-DTPA
His-DTPA
Ser-DTPA
177
Figure 53 Emission spectra of Eu(NO3)3 with DTPA-bis(amino ester) ligands in D2O
at pD 3 following excitation at 397 nm
Figure 54 Emission spectra of Eu(NO3)3 with DTPA-bis(amino ester) ligands in D2O
at pD 4 following excitation at 397 nm
The emission spectra are all very similar and show clear complexation of the
Eu3+
ion with each ligand There is little difference in emission intensity and form of the
spectra across all of the samples which indicates that all of the ligands present the same
coordination environment to the Eu3+
centre as expected
Table 51 J=1J=2 peak ratios and t-test results for Eu- DTPA-bis(amino ester)
complexes at pD 2-4
0
5
10
15
20
25
30
35
550 575 600 625 650 675 700
Emis
sio
n In
ten
sity
(au
) x
10
00
0
Wavelength (nm)
Ala-DTPA
Arg-DTPA
His-DTPA
Ser-DTPA
0
5
10
15
20
25
30
550 575 600 625 650 675 700
Emis
sio
n In
ten
sity
(au
) x
10
00
0
Wavelength (nm)
Ala-DTPA
Arg-DTPA
His-DTPA
Ser-DTPA
178
DTPA-
(AlaOMe)2
DTPA-
(ArgOMe)2
DTPA-
(HisOMe)2
DTPA-
(SerOEt)2
st dev t-test
pD 2 0359 0381 0404 0353 0023
No sig
diff
pD 3 0394 0425 0417 0381 0020
No sig
diff
pD 4 0391 0427 0432 0423 0019
No sig
diff
st dev 0019 0026 0014 0035
t-test No sig
diff
No sig
diff
No sig
diff
No sig
diff
The J=1J=2 peak height ratios were recorded for each emission spectrum and t-
tests were carried out on the peak ratios using the t-test data analysis tool in Microsoft
Excel accounting for the standard deviations between the ratios (Table 51) For each
data set the range in the ratios is small and there is no significant difference between
the values again suggesting that the co-ordination mode of the each of the ligands to the
metal ion is the same Across the data sets unlike the glutathione system (Chapter 4)
no significant difference was observed either as pD increases from pD 2 to pD 4
indicating that the co-ordination mode of the complexes is not changing with pH
The luminescence lifetimes of each sample were recorded in H2O and D2O in
order to determine the q value of the complexes using the modified Horrocks equation
(Equation 110) These results are summarised in Table 52
179
Table 52 Luminescence lifetimes and q values for Eu-DTPA-bis(amino ester)
complexes at pD 2-4 recorded at the emission maximum (617 nm) following 397 nm
excitation
pH amp Ligand τ D2O (μs) τ H2O (μs) q plusmn 02
pH 2 DTPA-(AlaOMe)2 1794 plusmn 7 587 plusmn 8 09
pH 2 DTPA-(ArgOMe)2 1828 plusmn 12 626 plusmn 10 08
pH 2 DTPA-(HisOMe)2 1816 plusmn 10 614 plusmn 9 09
pH 2 DTPA-(SerOEt)2 1759 plusmn 9 563 plusmn 11 10
pH 3 DTPA-(AlaOMe)2 1981 plusmn 12 587 plusmn 11 10
pH 3 DTPA-(ArgOMe)2 2335 plusmn 16 604 plusmn 12 10
pH 3 DTPA-(HisOMe)2 1963 plusmn 8 607 plusmn 13 09
pH 3 DTPA-(SerOEt)2 1839 plusmn 13 588 plusmn 12 09
pH 4 DTPA-(AlaOMe)2 1908 plusmn 17 608 plusmn 11 09
pH 4 DTPA-(ArgOMe)2 1907 plusmn 13 601 plusmn 17 09
pH 4 DTPA-(HisOMe)2 1905 plusmn 14 604 plusmn 15 09
pH 4 DTPA-(SerOEt)2 1890 plusmn 10 609 plusmn 16 09
All of the complexes have approximately 1 water molecule in the inner
hydration sphere This is consistent with the formation of a Eu-DTPA-amide ligand
complex The values are generally slightly less than 1 in contrast to [Eu-DTPA]2-
itself
where q = 11 indicating the likely fast exchange of the bound water molecule with
other surrounding water molecules and that the amino ester appendage may inhibit the
close approach of more than one water molecule due to steric reasons
522 Extraction Studies
Extractions were carried out on the samples using 06 M HDEHP in dodecane
for the organic phase The emission spectra of both the aqueous and organic phases
post-extraction can be seen in Figures 55-58
180
Figure 55 Emission spectra of aqueous phases after Eu3+
extraction from an aqueous
phase containing DTPA-bis(amino ester) ligands (50 mM) at pH 2 following excitation
at 397 nm
Figure 56 Emission spectra of aqueous and organic phases after Eu3+
extraction from
an aqueous phase containing DTPA-bis(amino ester) ligands (50 mM) at pH 2
following excitation at 397 nm
0
0
0
0
0
1
1
550 575 600 625 650 675 700
Emis
sio
n In
ten
sity
(au
) Th
ou
san
ds
Wavelength (nm)
Ala-DTPA Aq
Arg-DTPA Aq
His-DTPA Aq
Ser-DTPA Aq
0
10
20
30
40
50
60
70
550 575 600 625 650 675 700
Emis
sio
n In
ten
sity
(au
) Th
ou
san
ds
Wavelength (nm)
Ala-DTPA Aq Arg-DTPA Aq His-DTPA Aq Ser-DTPA Aq Ala-DTPA Org Arg-DTPA Org His-DTPA Org Ser-DTPA Org
181
Figure 57 Emission spectra of aqueous and organic phases after Eu3+
extraction from
an aqueous phase containing DTPA-bis(amino ester) ligands (50 mM) at pH 3
following excitation at 397 nm
Figure 58 Emission spectra of aqueous and organic phases after Eu3+
extraction from
an aqueous phase containing DTPA-bis(amino ester) ligands (50 mM) at pH 4
following excitation at 397 nm
0
2
4
6
8
10
12
550 575 600 625 650 675 700
Emis
sio
n In
ten
sity
(au
) x
10
00
0
Wavelength (nm)
Ala-DTPA Aq Arg-DTPA Aq His-DTPA Aq Ser-DTPA Aq Ala-DTPA Org Arg-DTPA Org His-DTPA Org Ser-DTPA Org
0
1
2
3
4
5
6
7
550 575 600 625 650 675 700
Emis
sio
n In
ten
sity
(au
) x
10
00
0
Wavelength (nm)
Ala-DTPA Aq
Arg-DTPA Aq
His-DTPA Aq
Ser-DTPA Aq
Ala-DTPA Org
Arg-DTPA Org
His-DTPA Org
Ser-DTPA Org
182
The Eu-HDEHP complex formed in the organic phase has different symmetry to
Eu-DTPA complexes in the aqueous phase as can be seen be the different profile of the
emission spectra of the organic phases The extraction data show that the best Eu3+
extraction occurs at pH 2 under these conditions as there is complete metal extraction
into the organic phase for all of the ligands and very little or no metal remaining in the
aqueous phase Above pH 2 the extraction of Eu3+
decreases leaving some of the metal
ion in the aqueous phase at pH 3 and an even higher proportion at pH 4 At pH 3
extraction is relatively higher with the DTPA-(SerOEt)2 ligand than any of the other
ligands and at pH 4 extraction is higher with DTPA-(HisOMe)2 and DTPA-(ArgOMe)2
The J=1J=2 peak ratios for the organic phases (Table 53) show no significant
difference in co-ordination mode within the pH 2 or pH 4 data for each ligand however
the co-ordination can be seen to change slightly with each ligand at pH 3 Also no
significant difference is observed as pH is changed for DTPA-(ArgOMe)2 and DTPA-
(AlaOMe)2 however there is a significant difference observed for DTPA-(SerOEt)2 and
DTPA-(HisOMe)2 as pH is changed Each emission spectrum was recorded 5 times and
an average taken and repeat measurements were also taken so whilst the data is
reproducible it appears to be inconsistent and difficult to explain without further
investigation into the co-ordination environment at different pH values by means other
than luminescence spectroscopy although it can be seen that pH 2 is optimum for
extraction using these ligands
Table 53 J=1J=2 peak ratios and t-test results for organic phases after extraction after
Eu3+
extraction aqueous phases containing DTPA-bis(amino ester) ligands (50 mM) at
pH 2-4
DTPA-
(AlaOMe)2
DTPA-
(ArgOMe)2
DTPA-
(HisOMe)2
DTPA-
(SerOEt)2
st dev t-test
pH 2 0208 0207 0198 0208 0005 No sig diff
pH 3 0210 0213 0311 0347 0069 Sig diff
pH 4 0182 0210 0206 0205 0013 No sig diff
st dev 0016 0003 0063 0081
t-test No sig diff No sig diff Sig diff Sig diff
183
53 Radiolysis Studies on Ligand Systems at pH 2
531 Aqueous Phase Studies
In order to determine how resistant the ligand are to radiolysis a selection of
samples at pHpD 2 containing 50 m M ligand and 1 mM Eu(NO3)3 were irradiated at
the Dalton Cumbrian Facility using a 60
Co irradiator The samples were exposed to 7
kGy γ-radiation and analysed by luminescence spectroscopy The emission spectra of
the D2O samples can be seen in Figure 59 The spectra for the samples in H2O are the
same but with lower emission intensity
Figure 59 Emission spectra of Eu(NO3)3 in D2O with DTPA-bis(amino ester) ligands
(50 mM) at pH 2 after irradiation with 7 kGy γ-radiation and following excitation at
397 nm
The spectra of the samples are the same after irradiation as beforehand
indicating that the radiation has little or no degrading effect on the complexes in the
aqueous phase The J=1J=2 ratios and co-ordination mode remained unchanged (Table
54) as do the luminescence lifetimes and q values of the samples (Table 55)
0
5
10
15
20
25
30
35
550 575 600 625 650 675 700
Emis
sio
n In
ten
sity
(au
) Th
ou
san
ds
Wavelength (nm)
Ala-DTPA
Arg-DTPA
His-DTPA
Ser-DTPA
184
Table 54 J=1J=2 peak ratios and t-test results for Eu-DTPA-bis(amino ester)
complexes at pD 2 after irradiation with 7 kGy γ-radiation
DTPA-
(AlaOMe)2
DTPA-
(ArgOMe)2
DTPA-
(HisOMe)2
DTPA-
(SerOEt)2 st dev t-test
J=1J=2 0357 0395 0412 0362 0026 No sig
diff
Table 55 Luminescence lifetimes and q values for Eu-DTPA-bis(amino ester)
complexes at pD 2-4 after irradiation with 7 kGy γ-radiation
Ligand τ D2O (μs) τ H2O (μs) q plusmn 02
DTPA-(AlaOMe)2 1818 plusmn 7 613 plusmn 8 09
DTPA-(ArgOMe)2 1843 plusmn 12 586 plusmn 10 10
DTPA-(HisOMe)2 1803 plusmn 10 629 plusmn 9 08
DTPA-(SerOEt)2 1809 plusmn 9 598 plusmn 11 09
532 Extraction Studies
Extractions were then carried out on some of the irradiated samples using 06 M
HDEHP in dodecane The emission spectra of both the aqueous and organic phases
post-extraction can be seen in Figure 510
Figure 510 Emission spectra of aqueous and organic phases after Eu3+
extraction from
an irradiated (7 kGy γ-radiation) aqueous phase containing DTPA-bis(amino ester)
ligands (50 mM) at pH 2 following excitation at 397 nm
0
1
2
3
4
5
6
550 575 600 625 650 675 700
Emis
sio
n In
ten
sity
(au
) Th
ou
san
ds
Wavelength (nm)
Ala-DTPA Aq Arg-DTPA Aq His-DTPA Aq Ser-DTPA Aq Ala-DTPA Org Arg-DTPA Org His-DTPA Org
185
The emission profiles of the samples are the same after irradiation as
beforehand indicating that the radiation has little or no degrading effect on the
complexes in the aqueous phase The emission intensity is lower for the organic phases
after irradiation than beforehand possibly due to increased quenching effects caused by
radicals present as a result of irradiating the solvents The J=1J=2 ratios and co-
ordination mode for the organic phase remained unchanged (Table 56) and the
luminescence lifetimes can be seen to decrease only slightly after irradiation consistent
with the decrease in emission intensity (Table 57)
Table 56 J=1J=2 peak ratios and t-test results for the organic phases after Eu3+
extraction from aqueous phases containing DTPA-bis(amino ester) ligands (50 mM) at
pH 2 one of which had been irradiated with 7 kGy γ-radiation
DTPA-
(AlaOMe)2
DTPA-
(ArgOMe)2
DTPA-
(HisOMe)2
DTPA-
(SerOEt)2
st dev t-test
J=1J=2 0241 0233 0198 0231 0019
No sig
diff
Table 57 Luminescence lifetimes and q values for the organic phases after Eu3+
extraction from aqueous phases containing DTPA-bis(amino ester) ligands (50 mM) at
pH 2 one of which had been irradiated with 7 kGy γ-radiation
Ligand τ organic phase
without irradiation
(micros)
τ organic phase after
irradiation
DTPA-(AlaOMe)2 2151 plusmn 21 1829 plusmn 18
DTPA-(ArgOMe)2 1881 plusmn 19 1821 plusmn 17
DTPA-(HisOMe)2 2265 plusmn 18 2227 plusmn 18
DTPA-(SerOEt)2 1856 plusmn 20 1777 plusmn 19
54 Separation Work on Ligand Systems
Some separation work using these ligands was carried out with the help of
Andreas Geist at KIT-INE in Germany Extractions were performed under TALSPEAK
conditions but using kerosene as the organic phase due to availability
186
541 AmEu Separation in Ligand Systems
A stock spiking solution of 241
Am + 152
Eu (1 kBq mL-1
) was added to a solution
of yttrium and lanthanides (10 mgdm3 of each Ln(NO3)3) with each ligand (50 mM) for
DTPA-(ArgOMe)2 DTPA-(SerOEt)2 DTPA-(HisOMe)2 at pH 1-2 The aqueous phases
were contacted with HDEHP (02 M) in kerosene and shaken for 30 minutes The
phases were then separated and the Am3+
and Eu3+
concentrations in each phase were
determined by Gamma counting The separation factors for all ligands under these
conditions were found to be approximately 100 across the pH range measured Graphs
of these data are plotted in Figures 511-513 These values are comparable with the
original TALSPEAK process using lactate (SF = 91) Although the TALSPEAK
process uses dodecane rather than kerosene and as such the results are therefore not
directly comparable they still show selectivity between Am3+
and Eu3+
for these
ligands However the DAm using these ligands is 2-3 orders of magnitude higher than in
the original TALSPEAK process (~025-200 compared to 0009) indicating that Am3+
is not being held back sufficiently by the ligand for this to be a viable process and that
more work is needed to decrease the partitioning of Am3+
into the organic phase This
may be possible with optimisation of the systems by varying the pH concentration of
ligand concentration of extractant and by modifying the solubility of the ligands ie by
cleavage of the methyl and ethyl ester groups to generate the amino acid Nevertheless
these results are particularly encouraging
Figure 511 Separation factors and distribution ratios for Eu3+
Am3+
using DTPA-
(ArgOMe)2 (005 M) at pH 1-2 extracted using HDEHP (02 M) in kerosene
187
Figure 512 Separation factors and distribution ratios for Eu3+
Am3+
using DTPA-
(SerOEt)2 (005 M) at pH 1-2 extracted using HDEHP (02 M) in kerosene
Figure 513 Separation factors and distribution ratios for Eu3+
Am3+
using DTPA-
(HisOMe)2 (005 M) at pH 1-2 extracted using HDEHP (02 M) in kerosene
542 Ln Separation in Ligand Systems
In addition to the Eu3+
Am3+
separation studies carried out at KIT-INE using
these amino ester appended DTPA ligands further experiments were conducted to
observe the separation across the lanthanide series by ICP-MS under the same
conditions The graphs of the distribution ratios for each Ln3+
and Am3+
can be seen in
Figures 514-516 for each ligand as well as the separation factor for Nd3+
Am3+
(as
188
Nd3+
is the most difficult lanthanide to extract) The SFNdAm in each case is 30-40 over
the pH range 1-2 These separation factors are good only slightly lower than the
original lactate-buffered TALSPEAK process (SFNdAm ~ 55) and the distribution ratios
for the heavier lanthanides are particularly high higher than the original process with a
greater proportion of them having D values of over 1000 (Figures 514-516)
Figure 514 Distribution ratios for Ln3+
using DTPA-(ArgOMe)2 (005 M) at pH 1-2
extracted using HDEHP (02 M) in kerosene
189
Figure 515 Distribution ratios for Ln3+
using DTPA-(SerOEt)2 (005 M) at pH 1-2
extracted using HDEHP (02 M) in kerosene
Figure 516 Distribution ratios for Ln3+
using DTPA-(HisOMe)2 (005 M) at pH 1-2
extracted using HDEHP (02 M) in kerosene
190
55 Summary and Conclusion of Modified DTPA Ligand Work
After initial difficulties synthesising amino acid appended DTPA ligands the
ligands were successfully synthesised in good yields (~60 ) for DTPA-(AlaOMe)2
DTPA-(ArgOMe)2 DTPA-(SerOEt)2 and DTPA-(HisOMe)2 using ester protected
versions of the amino acids The ligands were shown by luminescence spectroscopy to
complex to Eu3+
at pH 2 3 and 4 forming Eu-DTPA-bis(amino ester) adduct with 1
water molecule in fast exchange in the inner hydration sphere Under TALSPEAK
conditions the ligands were found to be more effective holdback reagents at the lower
pH of 2 but also effectively extract Eu3+
over Am3+
as low as pH 15 This is in stark
contrast to the original TALSPEAK process The co-ordination mode of the ligands to
the metal ion was consistent for all of the ligands but was found to change slightly upon
changing pH although the overall coordination number of Eu3+
with the ligands
remained as approximately 8 (with the 9th
coordination site being completed by one
water molecule) Studies showed that the ligands are relatively resistant to radiolysis
when subjected to 7 kGy γ radiation as there was no change in their luminescence
emission profile co-ordination mode or hydration number after irradiation
Results from separation studies conducted at KIT-INE using gamma counting
and ICP-MS showed that the modified DTPA ligands successfully allowed separation
between Ln3+
Am3+
giving good separation factors comparable to the original lactate-
buffered TALSPEAK process (SFEuAm ~100) even for Nd3+
which is the most difficult
lanthanide to extract in the process (SFNdAm ~30-40) The extraction efficiency of all the
ligands broadly relates to the atomic number of the lanthanide ions (apart from La3+
Ce3+
and Pr3+
) with the heavier ions being preferentially extracted as expected The
separation factors of individual lanthanide pairs range from approximately 25 to gt 100
and for the Dy3+
Nd3+
pair of particular economic importance are quite reasonable SF
DyNd ~ 30
However the distibution ratio for Am3+
is higher than desired (025-200 vs
0009) and so optimisation of the systems would be necessary to try to reduce DAm for
the combined buffer soft-donor system to be viable Another step would also be to try to
deprotect the amino acids on the ligands hydrolysing the esters back to carboxylic acid
groups to see if that would increase the holdback ability of the ligands and possibly
decrease the distribution ratio of Am3+
191
1 PP Hazari G Shukla V Goel K Chuttani N Kumar R Sharma and AK Mishra
Bioconjugate Chem 2010 21 229-239
2 X Wang X Wang Y Wang and Z Guo Chem Comm 2011 47 8127-8129 ESI
3 SJ Pope BJ Coe S Faulkner and R H Laye Dalton Trans 2005 1482-1490
4 S J Pope B J Coe and S Faulkner Chem Commun 2004 1550-1551
192
6 SUMMARY CONCLUSIONS amp FUTURE WORK
61 Summary amp Conclusions
One technique for reprocessing SNF currently being developed in the USA is
the TALSPEAK process an advanced reprocessing method for the separation of Ln3+
and MA3+
components The traditional process developed in the 1960s uses DTPA to
act as a holdback reagent for MA3+
in a lactate buffered aqueous phase at pH 36
allowing Ln3+
to be selectively extracted by organophosphate HDEHP into an organic
phase of DIPB or dodecane TALSPEAK is one of the most promising techniques being
researched due to its numerous advantages particularly its relative resistance to
irradiation and ability to be carried out without the need for high reagent concentrations
Additionally it gives high separation factors in the region of ~50-100 which is
comparable to other advanced reprocessing methods currently being developed1 Since
the chemistry of the process is very complex and not particularly well understood it
would be an advantage to simplify the process by removing the need for a separate
holdback reagent and buffer
Recent studies have shown that complexants with soft donor atoms such as N or
S (relative to O) can be used to separate MA3+
from Ln3+
23
Initial research was carried
out by our collaborators at the Idaho National Lab testing the suitability of amino acids
(L-alanine L-arginine L-histidine and L-methionine) as a potential combined buffer
and soft donor by determining whether amino acids preferentially bind to MA3+
Another benefit to using amino acids would be the scope for carrying out the process at
a lower pH (~ pH 2) due to the lower pKa values of the carboxylic acid groups of the
amino acids than on DTPA Lower pH values are preferred by industry as higher acid
concentrations are easier to control on a large scale and are also known to increase the
Ln3+
distribution coefficients4
This work carried out by Grimes5 showed that amino acids do not act as
holdback reagents in their own right and that no separation of Ln3+
Am3+
is achieved
when they are used without Na5DTPA in solution However investigations showed that
when used alongside Na5DTPA good separation (SFEuAm ~ 66) can be achieved when
using 05 M L-alanine at pH 2 (cf ~25 at pH 3) however the DAm value was relatively
high than at the lower pH (DAm 047 at pH 2 cf 012 at pH 3) as more protonated forms
of the DTPA molecule are present in solution at low pH and the holdback reagent is not
able to bind as strongly to metal ions allowing more Am3+
to be partitioned into the
organic phase
193
However optimisation of the system in order to maximise the separation whilst
keeping Am3+
partitioning to a minimum by changing the concentrations of holdback
reagent and extractant proved to be successful The optimum conditions were found to
be 04 M Na5DTPA and 02 M HDEHP giving a separation factor of 71 plusmn 5 with a DAm
value of 008 Although this separation is not as good as a traditional lactate
TALSPEAK system (SF = 91 DAm = 0009) the use of L-alanine (pKa = 235) as a
buffer would allow the process to be carried out at pH 2 which is a much more
preferable pH for industry
Separations were carried out using other amino acids at varying pH values and it
was found that L-methionine was too poorly soluble at pH 3 and did not give very good
separation data at pH 2 L-arginine was found to have kinetic issues at pH 2 and 3
giving poor separation of the heavier lanthanides The amino acid L-histidine (pKa =
182) however gave good separation data at pH 3 with a SFEuAm of 99 comparable to
that of the original TALSPEAK process and a DAm of 007 comparable to the optimised
L-alanine system Unfortunately ICP-MS studies on lanthanides La-Ho using L-
histidine at pH 3 showed that the same kinetic problems arise for this system as for L-
alanine at pH 3 and L-arginine at pH 2 and 3 as the DLn value decreases for later
lanthanides
The interaction of the buffers glycine L-alanine L-serine L-phenylalanine and
lactate (for comparison) with Eu3+
and [Eu(DTPA)]2-
systems was investigated by
luminescence and 1H NMR spectroscopies As expected it was found that amino acids
and lactate do not form stable complexes with either the free metal ion or the metal-
DTPA complex and that the buffers are likely to be in fast exchange with surrounding
solvent molecules as the number of water molecules in the inner hydration sphere (q) of
Eu3+
was reduced from 9 to ~6 when buffers were added to the aqua ion in solution
Luminescence studies on L-phenylalanine (like other amino acids) showed that it does
not bind to the metal ion as there was no sensitised emission from Tb3+
ion when
excited into the phenyl chromophore of the amino acid when the two components were
in solution Emission spectra of Eu3+
and Cm3+
aqua ions and their corresponding
DTPA complexes showed no change in emission profile upon the addition of amino
acidslactate There was also no change in q when buffers were added to metal-DTPA
complexes in solution for Eu3+
or Cm3+
Radiolysis studies carried out on lactate and amino acid buffered [Eu(DTPA)]2-
systems showed that the systems are relatively resistant to γ-radiation when exposed to
5 kGy γ-radiation This is consistent with previous work conducted by the INL showing
194
that separation systems using L-alanine as a buffer are more resistant to radiolysis than
the original TALSPEAK process using lactate67
A 05 M L-alanine buffered
TALSPEAK system using 04 M Na5DTPA and 02 M HDEHP at pH 2 can therefore
be seen to be a promising alternative to the traditional lactate buffered system as it has
been shown to give good separation data with fairly low extraction of Am3+
and the
buffer is also more resistant to radiolysis than lactate Additionally it allows the process
to be carried out at a lower pH of 2 which is much more practical for industrial
operation
Since amino acids were found not to act as holdback reagents in their own right
the potential of using the larger tripeptide L-glutathione (GSH) was investigated Initial
separation studies carried out using glutathione at pH 4 (as GSH has 2 pKa values
below 4 and Garg et al reported that the optimum stability for Ln-GSH complexes
occurs in solutions between pH 34-348)8 Preliminary investigations found that as
with the amino acids studied GSH is ineffective as a holdback reagent on its own as
there was no separation observed between Eu3+
and Am3+
when used without
Na5DTPA
Analogous to the amino acid studies subsequent investigations were carried out
using GSH alongside Na5DTPA to determine whether separation was improved with the
tripeptide buffer A pH dependence study found that at pH 2 and pH 3 the glutathione
acts solely as a buffer in the systems as the separation factor in each case was
independent of GSH concentration However at pH 4 interestingly separation between
Eu3+
and Am3+
was found to increase as the buffer concentration was increased up to
05 M suggesting that the glutathione is interacting with the Ln-DTPA complexes at
this pH This could be explained by the increase in stability of Ln-GSH complexes as
the pH is increased
Using 05 M GSH the separation factor was found to increase dramatically as a
function of Na5DTPA concentration up to 03 M Na5DTPA After this peak there was
a rapid decrease in separation as the concentration was increased further up to 06 M
Na5DTPA as the stoichiometry is close to 11 GSHDTPA The separation factors
achieved here were extremely high (~1000) ndash a factor of 10 higher than the current
TALSPEAK system and the optimised L-alanine system whilst still maintaining low
Am3+
extraction (DAm = 0002 with 03 M Na5DTPA) lower than in the traditional
TALSPEAK process
At 03 M Na5DTPA the separation factor then increased as the extractant
concentration was increased from 02 to 04 M HDEHP in dodecane after which the SF
195
began to decrease again with the optimum separation at 04 M extractant giving a SF
of 1238 (DAm = 00018) At 04 M Na5DTPA however the separation factor decreases
rapidly as the extractant concentration is increased due to the DAm increasing by a
factor of 1000 consistent with the complexant and buffer possibly forming an adduct
which no longer successfully holds back Am3+
at higher Na5DTPA concentrations
Luminescence experiments mimicking the separation studies showed that the
glutathione does not form a stable complex with the Eu3+
ion and is in exchange with
surrounding solvent molecules comparable to the amino acid buffer studies even at the
highest buffer concentrations 1H NMR spectroscopy confirmed that although the
glutathione may be in exchange with surrounding water molecules no kinetically stable
complexes between the buffer and metal ions are formed In samples containing
Na5DTPA a Eu-DTPA complex can be clearly observed in the emission spectra with
or without the presence of GSH over a pH range of 2-4 The J=1J=2 peak ratios
showed that there is no change in the co-ordination mode of the buffer to the metal ion
as the concentration of GSH is increased for each pH however across the data sets the
co-ordination mode of glutathione was found to be different at different pH values as
expected based on pKa values and increasing stability constant with pH
The co-ordination mode of the Eu-DTPA in the aqueous phase with 05 M GSH
was found not to change as [Na5DTPA] was changed with metal extraction typically
decreasing as the holdback reagent increases and at 03 M Na5DTPA with 05 M GSH
extraction was found to increase as HDEHP concentration increased as expected
The GSH buffered system was found to be susceptible to radiolysis when
subjected 7 kGy γ-radiation from a 60
Co irradiator and seen to degrade into γ-Glu-Cys
fragments However the degradation was seen to have little effect on the extraction of
metal ions from the aqueous phase when analysed by luminescence spectroscopy with
only slightly decreased emission intensity post-irradiation The emission profiles co-
ordination mode and luminescent lifetimes of the samples remained unchanged
In order to be a successful alternative to the current TALSPEAK system it is
essential that effective separation of all lanthanides from MA3+
can occur Further
luminescence experiments were carried out firstly on analogous dysprosium systems in
order to represent heavier lanthanide elements followed by a mixture of four different
lanthanide metals in the same samples (Sm3+
Eu3+
Tb3+
and Dy3+
) For the dysprosium
study as the pH was increased from 2-4 the extraction of Dy3+
decreased suggesting
that the same kinetic issues noted for heavier lanthanides in the amino acid systems may
also be present for the GSH system at higher pH values In the mixed samples the same
196
pattern was observed with extraction of Ln3+
decreasing as pH was increased At pH 4
extraction of all lanthanide ions was very low particularly for Tb3+
and Dy3+
which are
both heavier than Sm3+
and Eu3+
ICP-MS carried out on a series of samples containing
a mixture of 10 lanthanides (La3+
-Ho3+
) was consistent with the luminescence data
showing decreased extraction of heavier lanthanides as pH increases from 2 to 4 The
quantity of metal extracted was so low it was below the limit of detection for some of
the heavier metals at pH 4 forcing the conclusion that unfortunately the same kinetic
issues are a problem at higher pH for the glutathione buffered system as for the amino
acid systems
Initial data obtained on the glutathione system with europium(III) and
americium(III) seemed promising as after optimisation very high separation factors for
Eu3+
Am3+
were achieved (~1000) with very low Am3+
partitioning (DAm ~0002) and
although the buffer was found to be susceptible to radiolysis extraction of lanthanide
ions still remained high after irradiation However subsequent studies with heavier
lanthanides showed that the GSH buffered system is subject to the same kinetic
problems as some of the amino acid systems
Based on the results from studies using amino acid and glutathione buffered
systems demonstrating that Ln3+
MA3+
separation cannot be achieved without the
presence of DTPA and a buffer the possibility of synthesising a combined buffer and
soft-donor was considered Amino acids were appended onto DTPA through reaction of
amino acid esters with DTPA dianhydride to form DTPA-(AlaOMe)2 DTPA-
(ArgOMe)2 DTPA-(SerOEt)2 and DTPA-(HisOMe)2 in good yields (~ 60 ) The
ligands were shown by luminescence spectroscopy to complex to Eu3+
at pH 2 3 and 4
forming Eu-DTPA-AA2 adducts with 1 water molecule in fast exchange in the inner
hydration sphere Under TALSPEAK conditions the ligands were found to be more
effective holdback reagents at the lower pH of 2 and even at pH 15 The co-ordination
mode of the ligands to the metal ion was consistent for all of the ligands being typical
of lanthanide DTPA-amide ligands known in the literature910
but was found to change
upon changing pH These ligands were also found to be relatively resistant to radiolysis
when subjected to 7 kGy γ radiation from a 60
Co irradiator as there was no change in
their luminescent emission profile co-ordination mode or hydration number after
irradiation
Results from separation studies conducted at KIT-INE using gamma counting
and ICP-MS showed that the modified DTPA ligands successfully allowed separation
between Ln3+
Am3+
giving good separation factors comparable to the original lactate-
197
buffered TALSPEAK process (SFEuAm ~100) even for Nd3+
which is the most difficult
lanthanide to extract in the process (SFNdAm ~30-40) The extraction efficiency of all the
ligands broadly relates to the atomic number of the lanthanide ions (apart from La3+
Ce3+
and Pr3+
) with the heavier ions being preferentially extracted as expected The
separation factors of individual lanthanide pairs range from approximately 25 to gt 100
and for the Dy3+
Nd3+
pair of particular economic importance are quite reasonable SF
DyNd ~ 30
However the distibution ratio for Am3+
is much higher than desired for the
modified DTPA ligands (DAm = 025-200 vs DAm 0009) and so optimisation of the
systems would be necessary to try to reduce DAm for the combined buffer soft-donor
system to be viable Initial studies on combined DTPA-bis(amino ester) ligands is
promising allowing the TALSPEAK process chemistry to be simplified and providing a
system which could be buffered to a lower pH (pH 2) as preferred by industry The
synthesis of the ligands is quite moisture sensitive and the products are very
hygroscopic and difficult to purify making the application of them on an industrial
scale potentially problematic but the simplification of the process on a laboratory scale
would allow the chemistry of the TALSPEAK process to be further investigated and
better understood for future developments
Although there are a number of variations of the TALSPEAK process being
developed including the TALSQuEAK (Trivalent Actinide Lanthanide Separation
using Quicker Extractants and Aqueous Complexes) process11
which uses alternative
extractant HEH[EHP]12
and alternative holdback reagent HEDTA13
the use of amino
acid and short-chain peptide buffers is unique to this project in collaboration with the
Idaho National Laboratory There has been some investigation into the use of malonate
buffers for TALSPEAK14
but there are no other reports of the use of amino acids or
peptides in the literature Additionally there are few published reports on the use of
luminescence spectroscopy in TALSPEAK studies chiefly on the complexation of Eu3+
with lactate15
complexation of Eu3+
Cm3+
with DTPA16
and complexation of Eu3+
with
HDEHP in the organic phase17
There is no literature on systems as a whole
A report on bis(methionine)-appended DTPA was published by Hazari et al in
2010 on the use of Tc-DTPA-bis(methionine) in tumour imaging18
however there are
no literature reports on the synthesis or use of amino acid appended or any modified
DTPA ligands for solvent extraction and separation studies
198
62 Future Work
As only a small selection of amino acids have been tested as buffers it would be
interesting to try more of them The original selections were made on the basis of their
chemical structures solubilities and previous work conducted at INL plus presence of
any soft donor atoms L-alanine was selected as it has the most similar structure to lactic
acid although glycine may be worth considering as well based on its also very similar
structure and high aqueous solubility Results with L-arginine and L-methionine were
not very promising possibly due to their longer chain backbones so it may be worth
considering the similar shorter-chain amino acids L-cysteine and L-threonine as these
have similar structures to L-serine which along with glycine was one of the amino
acids investigated by luminescence spectroscopy Although L-cysteine has poor
solubility like L-methionine it would be interesting to see how these amino acids
behave as buffers when subjected to the same separation and optimisation tests as L-
alanine Similarly medium length chain amino acids L-glutamic acid L-aspartic acid
L-asparagine and L-glutamine may also be worth considering (Figure 61)
Figure 61 Chemical structures of amino acids taken from reference 1919
199
In addition to investigating other amino acid buffer systems as discussed in
Chapter 4 there may be some benefit to carrying out experiments with other short chain
peptides such as eisenin and norophthalmic acid as well as some of the B vitamins that
were considered (vitamins B7 and 9) before L-glutathione was selected From the
results obtained with L-glutathione demonstrating that the tripeptide interacts with the
Ln-DTPA complex under certain conditions it is possible that these other peptides may
also interact and potentially aid in extraction of Ln3+
or selective holdback of MA3+
Although the desired result was not achieved with L-glutathione as it seems to
suffer the same kinetic issues which have been common with amino acids causing very
good extraction of the lighter lanthanides but very poor extraction of the heavier
lanthanides further optimisation of the GSH system to exploit the combined liquid-
liquid extraction efficiencies as a function of atomic number may allow the
development of an extraction process of lighter over heavier lanthanides for rare earth
recycling which is currently a strategically important goal20
Initial studies on the modified DTPA ligands showed promising results for a
combined buffer and soft-donor although there is still much work to be done in this
area It would be useful to determine the stability constants of the ligands with
lanthanides and with Am3+
and Cm3+
if possible preferably by potentiomenty which
has proven to be the most reliable method for determining stability constants for these
types of complexes21
The next step in process development with the ligands would be
to optimise the systems (as was done for the L-alanine and GSH buffered systems) in
order to reduce the partitioning of Am3+
and decrease DAm as much as possible ideally
to the same of magnitude of the lactate and GSH buffered systems by altering pH
concentration of ligand and concentration of extractant to maximise separation and
minimise americium distribution
A further step would also be to try to deprotect the amino acids on the DTPA-
amino ester ligands hydrolysing the esters back to carboxylic acid groups to see if that
would increase the holdback ability of the ligands and possibly decrease the distribution
ratio of Am3+
It is envisioned that the research presented in this thesis could be applied to
current and new technologies and challenges faced in the future of the nuclear industry
in particular towards the development of a TALSPEAK-style advanced reprocessing
procedure for implementation in the USA within the near future
200
1 G Modolo A Geist and M Miguirditchian Minor actinide separations in the
reprocessing of spent nuclear fuels recent advances in Europe in R Taylor ed
Reprocessing and Recycling of Spent Nuclear Fuel Woodhead Publishing UK 2015
10 245-279
2 M P Jensen and A H Bond J Am Chem Soc 2002 124 9870-9877
3 L R Martin B J Mincher and N C Schmitt J Radioanal Nucl Chem 2009 282
523-526
4 B Weaver and T A Kappelmann Talspeak A new method of separating americium
and curium from the lanthanides by extraction from an aqueous solution of an
aminopolyacetic acid complex with a monoacidic organophosphate or phosphonate
Oak Ridge National Laboratory 1964 1-60
5 TS Grimes RD Tillotson and LR Martin Solv Extraction and Ion Exchange
2014 32 378-390
6 Dr Leigh Martin Idaho National Laboratory unpublished results
7 LR Martin S P Mezyk and BJ Mincher J Phys Chem A 2009 113 141-145
8 BS Garg BK Singh DN Kumar and PK Sing Indian J Chem 2003 42A 79-83
9 C L Davies N G Housden and A-K Duhme-Klair Angew Chem Int Ed Engl 2008
47 8856
10 SJA Pope Polyhedron 2007 26 17 4818-4824
11 JC Braley JC Carter SI Sinkov KL Nash and GJ Lumetta J Coord Chem
2012 65 16 2862-2876
12 GJ Lumetta AJ Casella BM Rapko TG Levitskaia NK Pence JC Carter
CM Niver and MR Smoot Solv Extraction Ion Exchange 2015 33 346-361
13 JC Braley TS Grimes and KL Nash Ind Eng Chem Res 2012 15 629-638
14 JL Lapka and KL Nash Solv Extraction Ion Exchange 2015 33 346-361
15 G Tian LR Martin and L Rao Inorg Chem 2010 49 10598-10605
16 G Tian LR Martin and L Rao Inorg Chem 2015 54 1232-1239
17 TS Grimes G Tian L Rao and KL Nash Inorg Chem 2012 51 6299-6307
18 PP Hazari G Shukla V Goel K Chuttani N Kumar R Sharma and AK
Mishra Bioconjugate Chem 2010 21 229-239
19 DWhite Wisegeek What are Amino Acids httpwwwwisegeekorgwhat-are-
amino-acidshtm 2015
20 LS Natrajan and MH Langford Paden f-Block Elements Recovery in A Hunt ed
Element Recovery and Sustainability RSC 2013 6 140-184
21 G Tian LR Martin and LRao Inorg Chem 2015 54 1232-1239
201
7 EXPERIMENTAL SECTION
71 Chemicals and Reagents
All chemicals and solvents were purchased from Sigma-Aldrich chemical
company and were used as received Radioisotopes were supplied by the Idaho National
Laboratory or the Institute for Nuclear Waste Disposal (INE) and were used in
accordance with the local rules for manipulation of high specific activity materials
711 Handling Radioisotopes at INL
In order to handle radioisotopes at INL it was necessary to compete the
RadWorker 2 training and theory and practical examinations Upon entering a radiation
area (laboratory) it was a requirement to sign onto the dosimetry record system and
collect a dosimeter which was to be worn on the chest at all times in the area When
handling radioactive material within the designated controlled areas (fume hoods) extra
layers of PPE (personal protective equipment) such as triple layered shoulder length
gloves were to be worn and disposed of immediately upon leaving the controlled area in
designated radioactive waste bins It was then a requirement to monitor the upper body
area carefully with an alpha and a beta radiation detector Whilst working in the
controlled area any potentially contaminated PPE or samples had to be disposed of and
immediately replaced in the case of PPE After preparing sealed samples in the
controlled areas a Radiological Control worker would assist with swabbing each
sample to check for contamination before it could be removed from the area for further
analysis Samples were not to be opened outside of controlled areas and were returned
to the controlled area fume hood to be disposed of by solidification Upon leaving
radiation areas a full body scan was conducted and dose records updated as dosimeters
were returned
72 Complexation studies of Ln3+
amp An3+
with amino acids in TALSPEAK systems
721 Preparation of samples for luminescence studies
7211 Stock solutions
Stock solutions (10 mM 10 mL) were made up for each lanthanide (EuTb)
using the corresponding lanthanide nitrate salt Ln(NO3)3xH2O in H2O or D2O as
required A stock solution of Na5DTPA in H2OD2O (1 M 50 mL) was made up from a
40 wv Na5DTPA solution in H2O by dilution (2517 g into 50 mL) Stock solutions
of amino acids (Gly L-Ala L-Ser) in H2OD2O (125 M 20 mL) were prepared from
202
the crystalline form of each amino acid and a stock solution of DL-lactic acid was
prepared by dilution (225 g in 20 mL) For the sensitisation study with L-Phe due to
poor solubility of L-Phe a 0625 M stock solution in D2O was made using the powdered
form of the amino acid Additionally a stock solution of HDEHP in n-dodecane (645 g
in 100 mL 02 M) was prepared All reagents were purchased from Sigma-Aldrich
Stock solutions
10 mM EuTb(NO3)3 in H2OD2O
1 M Na5DTPA in H2OD2O
125 M GlyL-AlaL-SerLactate in H2OD2O
0625 M L-Phe in D2O
02 M HDEHP in n-dodecane
7212 Preparation of aqueous samples
5 mL samples were prepared using the stock solutions above Ln(NO3)3xH2O
(05 mL) was added to each amino acid solution (4 mL) with either Na5DTPA solution
(05 mL) or H2OD2O (05 mL) depending on whether the samples contained DTPA
This produced individual samples with concentrations of 1 mM Ln3+
1 M amino
acidlactate (05 M for L-Phe) and 01 M Na5DTPA if applicable The pHpD of
samples was adjusted individually with concentrated HNO3 and NaOH to minimise
change in volume using a Mettler Toledo Seven Compact pHion Meter pD (-log10
deuterium ion concentration) was calculated using Equation 71 to account for the
activity coefficient difference between the different isotopes of the hydrogen ion where
pH = the meter reading from a calibrated pH electrode All samples were repeated in
triplicate analagous to the solvent extraction samples performed at INL
Equation 71
7213 Preparation of extracted samples
Aqueous samples were prepared using the stock solutions above Na5DTPA
solution (05 mL) was added to amino acid solution (4 mL) and the mixture was pre-
equilibrated by contacting with n-dodecane and shaken using a Scientific Industries
Vortex Genie 2 Mixer and Shaker for 15 minutes The phases were allowed to separate
and the organic layer was discarded Ln(NO3)3 solution (05 mL) was added to the
aqueous phase and the pH was adjusted individually with concentrated HNO3 and
NaOH to minimise change in volume using a Mettler Toledo Seven Compact pHion
203
Meter The pD was calculated using Equation 71 The aqueous phases were contacted
with HDEHP in n-dodecane (5 mL 02 M) The solutions were then shaken again for 15
minutes left to settle and separated into the two phases for analysis All samples were
repeated in triplicate analagous to the solvent extraction samples performed at INL
722 Radiolysis of samples
Fricke dosimetry can be used to determine dose rates from radiation sources
such as from a 60
Co irradiator used to irradiate samples for radiolysis studies at the
Dalton Cumbrian Facility An aerated iron(II) sulphate solution is irradiated to give free
radicals according to the following reactions
H2O rarr H + OH
OH + Fe2+
rarr Fe3+
+ HO-
H + O2 rarr HO2
H+ + Fe
2+ + HO2 rarr Fe
3+ + H2O2
H2O2 + Fe2+
rarr Fe(OH)2+
+ OH
HO2 + Fe3+
rarr Fe2+
+ O2 + H+
This means that each H radical causes the oxidation of 3 Fe2+
ions to Fe3+
The amount
of Fe3+
present can then be measured using UV-visible spectroscopy and the dose rate
calculated from this1
7221 Preparation of Fricke solution
A Fricke solution was needed for the first set of radiolysis experiments carried
out using the 60
Co irradiator at the DCF as it allows the amount of exposure to be
calculated for each sample position during irradiation
FeSO47H2O (020206 g 133 mM) NaCl (003031 g 052 mM) and H2SO4 (95-98
11 mL) were added to deionised water (500 mL) The resulting Fricke solution was
then air-saturated and stored away from natural and artificial light sources
7222 Calculating dose rates
The UV-vis spectra of Fricke solution was then read before and after irradiation
and the following equation used to work out the dose rate
The dose can be calculated from the equation designed by Spinks and Woods (Equation
72)2
204
Equation 72
Where
F (Faradayrsquos constant) = 0965 x 109 A mol
-1
εFe(III) = Fe(III) molar extinction coefficient = 2174 M-1
cm-1
ρ = Fricke solution density = 1204 g mL-1
G = Critical Dose Value for Fe3+
= 148 molecules per 100 eV for x-rays
V = Volume of sample (mL) = 1
ODi = Optical density of irradiated solution
ODb = Optical density of non-irradiated control
The Spinks and Woods equation is specific to X-rays and must be adjusted so that it can
be applied to the use of γ-rays (Equation 73)
For γ-rays
εFe(III) = 2197 M-1
cm-1
G = 162 molecules per eV
Equation 73
Equation 74
Due to the design of the irradiator different positions in the machine receive
slightly different dose rates resulting in each sample receiving slightly different
amounts of radiation although the variation in dose is not significant and each sample
was calculated to receive an average of 114 Gy min-1
205
Table 71 Dose rates received at each sample position in the 60
Co irradiator at DCF
Position Dose Rate (Gy
min-1
)
1 1084678
2 1171864
3 1183066
4 1103841
73 Solvent extraction and separation studies using amino acids and glutathione at
INL
731 Preparation of samples
7311 Stock solutions for amino acid studies
A stock solution of Na5DTPA in H2O (1 M 100 mL) was made up from a 40
wv Na5DTPA solution in H2O by dilution (2517 g into 50 mL) A stock solution of L-
alanine in H2O (1 M 200 mL) was prepared from its crystalline form Additionally a
stock solution of HDEHP in n-dodecane (3224 g in 100 mL 1 M) was prepared This
was subsequently diluted with n-dodecane to prepare stock solutions of 02 04 06 and
08 M HDEHP in n-dodecane stock solutions as well
Stock solutions
1 M Na5DTPA in H2O
1 M L-Ala in H2O
10 08 06 04 02 M HDEHP in n-dodecane
7312 [Na5DTPA] dependence SX samples for amino acid studies
5 mL aqueous samples were prepared using the stock solutions above L-alanine
solution (25 mL) was added to a calculated volume of Na5DTPA solution to produce
samples with the desired DTPA concentration (006 007 008 009 01 02 03 04
05 M) when made up to 5 mL with water The pH of samples was adjusted individually
with concentrated HNO3 and NaOH to minimise change in volume using a Mettler
Toledo Seven Compact pHion Meter 02 M HDEHP in n-dodecane was used for the
solvent extraction All samples were repeated in triplicate
7313 [HDEHP] dependence SX samples for amino acid studies
5 mL aqueous samples were prepared using the stock solutions above L-alanine
solution (25 mL) was added to a calculated volume of Na5DTPA solution to produce
samples with the desired DTPA concentration (01 02 03 04 05 M) when made up
206
to 5 mL with water The pH of samples was adjusted individually with concentrated
HNO3 and NaOH to minimise change in volume using a Mettler Toledo Seven
Compact pHion Meter 02 04 06 08 and 10 M HDEHP in n-dodecane was used for
the solvent extraction All samples were repeated in triplicate
7314 Other amino acid SX samples for amino acid studies
5 mL aqueous samples were prepared for L-His and L-Met buffered systems
The Na5DTPA stock solution (025 mL) was added to L-His (0388 g) and L-Met (0373
g) separately to make samples with concentrations of 005 M Na5DTPA and 05 M
amino acid when made up to 5 mL with water The powdered forms of the amino acids
were used due to their poor solubility The pH of samples was adjusted individually
with concentrated HNO3 and NaOH to minimise change in volume using a Mettler
Toledo Seven Compact pHion Meter 02 M HDEHP in n-dodecane was used for the
solvent extraction All samples were repeated in triplicate
7315 Stock solutions for glutathione studies
A stock solution of Na5DTPA in H2O (1 M 100 mL) was made up from a 40
wv Na5DTPA solution in H2O by dilution (2517 g into 50 mL) Additionally a stock
solution of HDEHP in n-dodecane (3224g in 100mL 1 M) was prepared This was
subsequently diluted with n-dodecane to prepare stock solutions of 02 04 06 and 08
M HDEHP in n-dodecane stock solutions as well
Stock solutions
1 M Na5DTPA in H2O
10 08 06 04 02 M HDEHP in n-dodecane
7316 [GSH] dependence SX samples without Na5DTPA
GSH (0768 g) was dissolved in water (5 mL) to make a 05 M solution The
powdered form of the peptide was used due to its poor solubility The pH of sample was
adjusted with concentrated HNO3 and NaOH to minimise change in volume using a
Mettler Toledo Seven Compact pHion Meter 02 M HDEHP in n-dodecane was used
for the solvent extraction All samples were repeated in triplicate
7317 [GSH] and pH dependence SX samples with Na5DTPA
5 mL aqueous samples were prepared for GSH buffered systems The Na5DTPA
stock solution (025 mL) was added to varying quantities of GSH to make samples with
207
concentrations of 005 M Na5DTPA and the desired concentration of GSH (01 02 03
04 05 M) when made up to 5 mL with water The pH of samples was adjusted
individually with concentrated HNO3 and NaOH to minimise change in volume using
a Mettler Toledo Seven Compact pHion Meter 02 M HDEHP in n-dodecane was used
for the solvent extraction All samples were repeated in triplicate
7318 [Na5DTPA] dependence SX samples for GSH studies
5 mL aqueous samples were prepared for GSH buffered systems GSH (0768 g)
was added to a calculated volume of Na5DTPA solution to produce samples with
concentrations of 05 M GSH and the desired DTPA concentration (005 01 02 03
04 05 06 M) when made up to 5 mL with water The pH of samples was adjusted
individually with concentrated HNO3 and NaOH to minimise change in volume using
a Mettler Toledo Seven Compact pHion Meter 02 M HDEHP in n-dodecane was used
for the solvent extraction All samples were repeated in triplicate
7319 [HDEHP] dependence SX samples for amino acid studies
5 mL aqueous samples were prepared for GSH buffered systems GSH (0768 g)
was added to a calculated volume of Na5DTPA solution to produce samples with the
concentrations of 05 M GSH and the desired DTPA concentration (03 M and 04 M)
when made up to 5 mL with water The pH of samples was adjusted individually with
concentrated HNO3 and NaOH to minimise change in volume using a Mettler Toledo
Seven Compact pHion Meter 02 04 06 08 and 10 M HDEHP in n-dodecane was
used for the solvent extraction All samples were repeated in triplicate
732 Gamma counting
2 mL of each sample was transferred into a 4 mL sample vial in duplicate One
of the duplicate sets of samples was contacted with 2 mL n-dodecane to pre-equilibrate
the aqueous phase and the other duplicate set was contacted with the stock solution of
HDEHP in n-dodecane to pre-equilibrate the organic phase All of the samples were
then shaken using a VWR Multi-Tube Vortexer for 15 minutes Samples were then
placed in a Boeco S-8 Centrifuge for 5 minutes at 5400 rpm to separate the layers
The organic phase of the pre-equilibrated aqueous phase was discarded and the
aqueous phase of the pre-equilibrated organic phase was discarded 05 mL each
retained phase was then contacted in a 2 mL sample vial in triplicate and spiked with 10
microL 241
Am or 154
Eu stock solutions (1 kBq mL-1
) Samples were then shaken again using
208
a VWR Multi-Tube Vortexer for another 30 minutes before being placed in a Boeco S-
8 Centrifuge for 5 minutes at 5400 rpm to separate the layers
300 microL of each organic phase was transferred into counting tubes and 300 microL of
each aqueous phase was transferred into separate tubes Control tubes containing 300
microL HNO3 spiked with 10 microL 241
Am or 154
Eu stock solutions (1 kBq mL-1
) were also
prepared γ counting was performed on the samples using a Packard Cobra II Gamma
Counter Results were averaged from each of the samples in triplicate
733 ICP-MS
Samples were made up as for SX samples with other amino acids for L-His and
(Section 7314) and for GSH (Section 7318) 2 mL of each sample was transferred
into a 4 mL sample vial 10 microL mixed Ln 110 stock solution (5 mgL-1
of each of La
Ce Pr Nd Sm Eu Gd Tb Dy Ho) was spiked into each sample and samples were
contacted with 2 mL HDEHP in n-dodecane (02 M) All of the samples were then
shaken using a VWR Multi-Tube Vortexer for 15 minutes Samples were then placed in
a Boeco S-8 Centrifuge for 5 minutes at 5400 rpm to separate the layers
The organic phase was discarded and 10 microL of the aqueous phase was
transferred into ICP-MS vials containing 10 mL 2 HNO3 in triplicate Control tubes
containing 10 mL 2 HNO3 spiked with 10 microL mixed Ln 110 stock solution were
also prepared ICP-MS was carried out to determine the concentration of each
lanthanide in the organic and aqueous phase Results were averaged from each of the
samples in triplicate
74 Luminescence studies and solvent extraction using glutathione at UoM
741 Preparation of luminescence samples
7411 Stock solutions for GSH studies
Stock solutions (10 mM (100 mM for Dy3+
) 10 mL) were made up for each
lanthanide (EuTbDySm) using the corresponding lanthanide nitrate salt
Ln(NO3)3xH2O in H2O or D2O as required A mixed lanthanide solution was also made
up to contain the same concentrations of each of the lanthanides above A stock solution
of Na5DTPA in H2OD2O (1 M 50 mL) was made up from a 40 wv Na5DTPA
solution in H2O by dilution (2517 g into 50 mL) Additionally a stock solution of
HDEHP in n-dodecane (3224 g in 100 mL 1 M) was prepared This was subsequently
diluted with n-dodecane to prepare stock solutions of 02 04 06 and 08 M HDEHP in
n-dodecane stock solutions as well All reagents were purchased from Sigma-Aldrich
209
Stock solutions
10 mM EuTbSm(NO3)3 in H2OD2O
100 mM Dy(NO3)3 in H2OD2O
Mixed Ln solution with 10 mM EuTbSm(NO3)3 in H2OD2O and 100 mM Dy(NO3)3
1 M Na5DTPA in H2OD2O
10 08 06 04 02 M HDEHP in n-dodecane
7412 Preparation of aqueous samples
Samples were made up using the stock solutions above in the same way as for
the solvent extraction and separation studies carried out at INL (Sections 7312 to
7319) pD was calculated using Equation 71
7413 Preparation of extracted samples
5 mL aqueous samples were prepared using the stock solutions above GSH
(0768 g) was added to a calculated volume of Na5DTPA solution to produce samples
with the concentrations of 05 M GSH and the desired DTPA concentration (varied
according to the study) when made up to 5 mL with water The mixture was pre-
equilibrated by contacting with n-dodecane and shaken using a Scientific Industries
Vortex Genie 2 Mixer and Shaker for 15 minutes The phases were allowed to separate
and the organic layer was discarded Ln(NO3)3 solution (05 mL) was added to the
aqueous phase and the pH was adjusted individually with concentrated HNO3 and
NaOH to minimise change in volume using a Mettler Toledo Seven Compact pHion
Meter pD was calculated using Equation 71 The aqueous phases were contacted with
5 mL HDEHP in n-dodecane (varied according to the study) The solutions were then
shaken again for 15 minutes left to settle and separated into the two phases for analysis
All samples were repeated in triplicate analagous to the solvent extraction samples
performed at INL
742 Radiolysis of GSH samples
Radiolysis experiments on GSH buffered systems were carried out using the
60Co irradiator at DCF These irradiations were undertaken at a later date than the initial
amino acid radiolysis studies (Section 722) using a new calibrated sample holder with
known dose rates and so preparation and use of a Fricke solution was not necessary
Samples received an average of 7 kGy γ radiation
210
75 Modified DTPA Ligands
751 Synthesis of modified DTPA ligands
L-alanine methyl ester hydrochloride (0837 g 62 mmol) was dissolved in DMF
(15 mL) and added dropwise to DTPA dianhydride (107 g 3 mmol) in DMF (75 mL)
and 3 mL triethylamine (TEA) with stirring under nitrogen in an ice bath at 0 degC The
ice bath was removed after 2 hours and the reaction was left to stir at room temperature
for 48 hours The reaction was quenched with H2O (75 mL) and the solvent evaporated
to ~10 mL The resulting yellow oil was added dropwise to acetone (100 mL) with
stirring and the product precipitated The product was collected by sinter filtration
(porosity 3) under nitrogen as a crude white powder (yield 132 g 78) It was washed
with diethyl ether (3 x 20 mL) chloroform (3 x 20 mL) and diethyl ether again (3 x 20
mL) This was then dried under vacuum to give a white micro-crystalline product
(yield 1031 g 61 ) Multiple re-precipitations were performed to reduce the amount
of associated ammonium salts in the product Samples were dried under vacuum and
freeze-dried but water and solvent impurities continued to remain present
The synthesis was repeated using L-arginine methyl ester dihydrochloride (157 g 6
mmol) L-serine ethyl ester hydrochloride (102 g 6 mmol) and L-histidine methyl ester
(145 g 6 mmol)
Yields
DTPA-(AlaOMe)2 132 g 78 (MW 56356 gmol-1
)
DTPA-(ArgOMe)2 1331 g 60 (MW 73378 gmol-1
)
DTPA-(SerOEt)2 1053 g 56 (MW 62361 gmol-1
)
DTPA-(HisOMe)2 1730 g 83 (MW 69569 gmol-1
)
752 Characterisation of modified DTPA ligands by MALDI-MS
MALDI-MS was used to characterise the synthesised ligands Samples were
dissolved in methanol for analysis These analyses confirm that the ligands are the
desired ones as the protonated monomolecular ion [M+H]+ is visible in each case The
[M+Na]+ and [M+K]
+ ions can also be found in each spectrum The range begins at mz
= 200 so it is therefore not possible to verify the presence of triethylamine (M =
10119gmol) the amino acid starting material or any solvents using this technique The
spectra show a numerous peaks indicating that the ligands have decomposed during
analysis making interpretation difficult The spectrum for DTPA-(AlaOMe)2 can be
found in Appendix 6
211
DTPA-(AlaOMe)2 mz 565 (100) [M+H]+ 587 (37) [M+Na]
+ 603 (39) [M+K]
+
DTPA-(ArgOMe)2 mz 734 (100) [M+H]+ 756 (18) [M+Na]
+ 772 (9) [M+K]
+
DTPA-(SerOEt)2 mz 624 (100) [M+H]+ 646 (60) [M+Na]
+ 662 (15) [M+K]
+
DTPA-(HisOMe)2 mz 697 (100) [M+H]+ 719 (22) [M+Na]
+ 735 (10) [M+K]
+
753 Characterisation of modified DTPA ligands by NMR spectroscopy
NMR spectroscopy was performed on ligand samples in D2O (9992 atom D
Sigma Aldrich) at 400 MHz The 1H NMR spectra of DTPA-(AlaOMe)2 with suggested
peak assignments can be found in Appendix 7
The 1H NMR spectra are difficult to interpret and assign due to the number of
peaks and their proximity to each other There are also impurities observable in the
spectra 13
C NMR spectra were also recorded and were simpler to interpret due to the
DEPT 135 spectra and enabled the quaternary CH CH2 and CH3 carbons to be
distinguished 1H NMR assignments were made using HSQC relating each peak in a
1H
spectrum to its corresponding carbon Solvent impurities were determined from known
solvent shifts (DMF acetone ethanol chloroform andor diethyl ether)3 DMF is the
most prevalent impurity due to it being the most difficult solvent to remove Some
starting material from amino acid esters can also be observed in small quantities
Triethylammonium chloride is also present in a small amount (11 ppm and 30 pmm)
7531 1H NMR Spectroscopy
1H NMR Shifts (400 mHz D2O)
DTPA-(AlaOMe)2 δ ppm 125 (d 3JHH =734 Hz 6 H H8) 311 (t
3JHH =100 Hz 4 H
H5) 323 (t 3JHH =569 Hz 4 H H4) 348 - 355 (m 2 H H6 and H7) 362 - 369 (m
4 H H2) 375 - 387 (m 4 H H3) 418 - 425 (m 2 H H1)
DTPA-(ArgOMe)2 δ ppm 154 (dq 2JHH =1449 Hz
3JHH 730 Hz 4 H H9) 169 - 189
(m 4 H H8) 302 - 317 (m 4 H H10 ) 325 (s 8 H H4 and H5) 362 (s 4 H H2)
365 (s 6 H H7) 368 (s 2 H H6) 375 - 384 (m 4 H H3) 436 - 444 (m 2 H H1)
DTPA-(SerOEt)2 δ ppm 117 (t 3JHH =706 Hz 6 H H7) 327 (s 8 H H4 and H5)
364 - 372 (m 6 H H2 and H6) 378 - 393 (m 9 H) H3 and H9) 414 (q 3JHH =706
Hz 4 H H8) 452 (dd 3JHH =479 378 Hz 2 H H1)
DTPA-(HisOMe)2 δ ppm 297 - 323 (m 12 H H4 H5 and H8) 331 (s 4 H H2) 349
(s 4 H H3) 358 (s 6 H H7) 362 (m 2 H H6) 370 - 375 (m 1 H H3) 464 - 466
(m 2 H H1) 714 (s 2 H H9) 843 (s 2 H H10)
212
Figure 71 1H NMR proton assignments for DTPA-(AlaOMe)2
Figure 72 1H NMR proton assignments for DTPA-(ArgOMe)2
Figure 73 1H NMR proton assignments for DTPA-(SerOEt)2
213
Figure 74 1H NMR proton assignments for DTPA-(HisOMe)2
7532 13
C NMR Spectroscopy
13CNMR Shifts (400 mHz D2O)
DTPA-(AlaOMe)2 δ ppm 158 (CH3 C12) 485 (CH C1) 511 (CH2 C5) 514 (CH2
C4) 529 (CH3 C7) 543 (CH2 C6) 563 (CH2 C2) 564 (CH2 C3) 1686 (q-C C9)
1718 (q-C C11) 1721 (q-C C10) 1746 (q-C C8)
DTPA-(ArgOMe)2 δ ppm 243 (CH2 C13) 275 (CH2 C12) 404 (CH2 C14) 512
(CH2 C5) 518 (CH2 C4) 523 (CH C1) 530 (CH3 C7) 548 (CH2 C6) 564 (CH2
C2) 568 (CH2 C3) 1567 (q-C C15) 1698 (q-C C9) 1716 (q-C C11) 1728 (q-C
C10) 1735 (q-C C8)
DTPA-(SerOEt)2 δ ppm 132 (CH3 C8) 512 (CH2 C5) 514 (CH2 C4) 545 (CH2
C6) 549 (CH C1) 563 (CH2 C2) 565 (CH2 C3) 607 (CH2 C13) 628 (CH2 C7)
1693 (q-C C9) 1712 (q-C C10) 1717 (q-c C11) 1723 (CH3 C8)
DTPA-(HisOMe)2 δ ppm 257 (CH2 C12) 505 (CH2 C5) 517 (CH C1) 525 (CH2
C4) 531 (CH3 C7) 551 (CH2 C6) 568 (CH2 C2) 572 (CH2 C3) 1170 (CH C14)
1286 (q-C C13) 1333 (CH C15) 1711 (q-C C9) 1714 (q-C C11) 1716 (q-C
C10) 1746 (q-C C8)
214
Figure 75 13
C NMR carbon assignments for DTPA-(AlaOMe)2
Figure 76 13
C NMR carbon assignments for DTPA-(ArgOMe)2
Figure 77 13
C NMR carbon assignments for DTPA-(SerOEt)2
215
Figure 78 13
C NMR carbon assignments for DTPA-(HisOMe)2
754 Characterisation of modified DTPA ligands by elemental analysis
Elemental analysis was also performed on the ligands for characterisation Since
the ligands do contain impurities despite several purification steps the elemental
analysis is not quite as predicted for pure samples Chlorine was found to also be
present from residual triethylammonium chloride as identified by NMR spectroscopy in
addition to residual solvents despite prolonged drying under vacuum
Table 72 Elemental analysis results for modified DTPA ligands P = predicted
proportion present () A = actual proportion present ()
C () H () N () Cl () Na ()
Ligand P A P A P A P A P A
DTPA-(AlaOMe)2
4689 4224 662 685 1243 1146 0 475 0 0
DTPA-(ArgOMe)2
4583 3896 701 637 2100 1643 0 1427 0 0
DTPA-(SerOEt)2
4622 4300 663 755 1123 1041 0 240 0 0
DTPA-(HisOMe)2
4834 3985 594 668 1812 1458 0 595 0 0
216
755 Luminescence studies with modified DTPA ligands
7551 Stock solutions
A stock solution (10 mM 10 mL) was made up for Eu(NO3)3xH2O in H2O or
D2O as required Additionally a stock solution of HDEHP in n-dodecane (1935 g in
100 mL 06 M) was prepared All reagents were purchased from Sigma-Aldrich
Stock solutions
10 mM EuTb(NO3)3 in H2OD2O
06 M HDEHP in n-dodecane
7552 Preparation of aqueous samples
2 mL samples were prepared for aqueous phases The Eu(NO3)3 stock solution
(02 mL) was added calculated quantities of each ligand to make samples with
concentrations of 1 mM Eu(NO3)3 and 005 M ligand when made up to 2 mL with H2O
or D2O The pH of samples was adjusted individually with concentrated HNO3 and
NaOH to minimise change in volume using a Mettler Toledo Seven Compact pHion
Meter pD was calculated using Equation 71
7553 Preparation of extracted samples
Aqueous samples were prepared as above (Section 7413) Due to the small
quantities of ligand available pre-equilibration was not possible as the same samples
used for aqueous phase studies were subsequently used for extraction studies The
aqueous phases were contacted with HDEHP in n-dodecane (2 mL 06 M) The
solutions were then shaken using a Scientific Industries Vortex Genie 2 Mixer and
Shaker for 15 minutes left to settle and separated into the two phases for analysis
7554 Radiolysis of ligand samples
Radiolysis experiments on modified DTPA ligand systems were carried out
using the 60
Co irradiator at DCF These irradiations were undertaken at the same time as
the GSH irradiations at a later date than the initial amino acid radiolysis studies
(Section 722) using the new calibrated sample holder with known dose rates and so
preparation and use of a Fricke solution was not necessary Samples received an average
of 7 kGy γ radiation
217
76 Instruments
761 FTS MODEL 812 System 60
Co Irradiator
All irradiations at the Dalton Cumbrian Facility were carried out using a 60
Co
irradiator which can allow multiple dose rates as it comprises two individual source
rods Radiation is generated by the decay of 60
Co to 60
Ni causing emission of β-
particles and γ-rays
Samples (5 mL for amino acid and GSH systems 2 mL for modified DTPA
ligand systems) were transferred into glass vials with plastic screw tops and placed
inside the irradiator mounted on a pre-designed rig Multiple samples were able to be
irradiated at once due to the design of the sample holder (Figure 79)
Figure 79 60
Co Irradiator at DCF (left) sample holder (top right) and sample holder
inside the irradiator (bottom right)
762 Edinburgh Instrument FP920 Phosphorescence Lifetime Spectrometer
All luminescence studies were carried out using an Edinburgh Instrument FP920
Phosphorescence Lifetime Spectrometer Steady state emission and excitation spectra
were recorded in quartz cuvettes on an Edinburgh Instrument FP920 Phosphorescence
Lifetime Spectrometer equipped with a 5 watt microsecond pulsed xenon flashlamp
(with single 300 mm focal length excitation and emission monochromators in Czerny
Turner configuration) and a red sensitive photomultiplier in peltier (air cooled) housing
(Hamamatsu R928P) Lifetime data were recorded following excitation with the
flashlamp and using time correlated single photon counting (PCS900 plug-in PC card
for fast photon counting) Lifetimes were obtained by tail fit on the data obtained
218
Table 73 Emission and excitation wavelengths for Ln3+
ions
763 Packard Cobra II Gamma Counter
Activity in separation samples prepared at the INL was measured using a Cobra
II Gamma Counter an automated gamma counter Background samples were counted in
addition in order allow correction for background radiation levels Samples run on
automated protocols run until the counting error is within 1 or the sample has run for
20 minutes
764 Bruker UltrashieldTM
400 NMR Spectrometer
NMR measurements were carried out using a Bruker UltrashieldTM
400
spectrometer of operating frequency 400 MHz (1H) and 162 MHz (
13C) with a variable
temperature unit set at 295 K unless otherwise stated The instrument was controlled
remotely using Bruker Topspin 21 software
Ln3+
Emission (nm) Excitation (nm)
Eu 617 395
Tb 545 379
Sm 600 403
Dy 575 352
219
1 CB Şenvar Chemical Dosimetry of Gamma Rays Neutrons and Accelerated
Electrons University of Ankara 1959 1-28
2 JWT Spinks and RJ Woods An Introduction to Radiation Chemistry Wiley-
Interscience Canada 3rd edn 1990
3 HE Gottlieb V Kotlyar and A Nudelman J Org Chem 1997 62 7512-7515
220
APPENDICES
APPENDIX 1 - Emission spectra for [GSH] pH dependence studies with DTPA in H2O
Figure A Emission spectra of Eu3+
in H2O at pH 2 with 005 M Na5DTPA over a GSH
concentration range of 01 ndash 05 M following excitation at 397 nm
Figure B Emission spectra of Eu3+
in H2O at pH 3 with 005 M Na5DTPA over a GSH
concentration range of 01 ndash 05 M following excitation at 397 nm
00
02
04
06
08
10
12
14
550 600 650 700
Emis
sio
n In
ten
sity
(au
) x
10
00
0
Wavelength (nm)
01 M GSH
02 M GSH
03 M GSH
04 M GSH
05 M GSH
00
02
04
06
08
10
12
14
550 600 650 700
Emis
sio
n In
ten
sity
(au
) x
10
00
0
Wavelength (nm)
01 M GSH
02 M GSH
03 M GSH
04 M GSH
05 M GSH
221
Figure C Emission spectra of Eu3+
in H2O at pH 4 with 005 M Na5DTPA over a GSH
concentration range of 01 ndash 05 M following excitation at 397 nm
00
02
04
06
08
10
12
14
550 600 650 700
Emis
sio
n In
ten
sity
(au
) x
10
00
0
Wavelength (nm)
01 M GSH
02 M GSH
03 M GSH
04 M GSH
05 M GSH
222
APPENDIX 2 - SFLnAm for varying GSH concentration over a pH range of 2-4 with
005 M Na5DTPA after extraction with 02 M HDEHP in dodecane
Figure D SFLnAm for varying GSH concentration at pH 2 with 005 M Na5DTPA after
extraction with 02 M HDEHP in dodecane
Figure E SFLnAm for varying GSH concentration at pH 3 with 005 M Na5DTPA after
extraction with 02 M HDEHP in dodecane
0
5
10
15
20
25
30
35
40
56 57 58 59 60 61 62 63 64 65 66 67 68
Sep
arat
ion
Fac
tor
Atomic Number
01 M GSH
02 M GSH
03 M GSH
04 M GSH
05 M GSH
0
50
100
150
200
250
56 57 58 59 60 61 62 63 64 65 66 67 68
Sep
arat
ion
Fac
tor
Atomic Number
01 M GSH
02 M GSH
03 M GSH
04 M GSH
05 M GSH
223
APPENDIX 3 - Natural pH values for modified DTPA ligands (005 M) with Eu(NO3)3
(1 mM)
Table F Natural pH values for modified DTPA ligands (005 M) with Eu(NO3)3 (1
mM)
Ligand Natural pH with Eu(NO3)3
DTPA-(AlaOMe)2 243
DTPA-(ArgOMe)2 238
DTPA-(SerOEt)2 240
DTPA-(HisOMe)2 286
224
APPENDIX 4 - Emission spectra for Eu(NO3)3 with modified DTPA ligands in H2O
Figure G Emission spectra for Eu(NO3)3 with modified DTPA ligands in H2O at pH 2
Figure H Emission spectra for Eu(NO3)3 with modified DTPA ligands in H2O at pH 3
0
2
4
6
8
10
12
550 575 600 625 650 675 700
Emis
sio
n In
ten
sity
(au
) x
10
00
0
Wavelength (nm)
Ala-DTPA
Arg-DTPA
Hist-DTPA
Ser-DTPA
0
2
4
6
8
10
12
14
550 575 600 625 650 675 700
Emis
sio
n In
ten
sity
(au
) x
10
00
0
Wavelength (nm)
Ala-DTPA
Arg-DTPA
Hist-DTPA
Ser-DTPA
225
Figure I Emission spectra for Eu(NO3)3 with modified DTPA ligands in H2O at pH 4
0
1
2
3
4
5
6
7
8
9
10
550 575 600 625 650 675 700
Emis
sio
n In
ten
sity
(au
) x
10
00
0
Wavelength (nm)
Ala-DTPA
Arg-DTPA
Hist-DTPA
Ser-DTPA
226
APPENDIX 5 - Emission spectra for radiolysis studies on Eu(NO3)3 in H2O with
DTPA-di(amino acid) ligands
Figure J Emission spectra for Eu(NO3)3 in H2O with DTPA-di(amino acid) ligands
(005 M) at pH 2 after irradiation with 7 kGy γ-radiation
Figure K Emission spectra for Eu(NO3)3 in H2O with DTPA-di(amino acid) ligands
(005 M) at pH 3 after irradiation with 7 kGy γ-radiation
00
05
10
15
20
25
550 575 600 625 650 675 700
Emis
sio
n In
tem
sity
(au
) x
10
00
0
Wavelength (nm)
Ala-DTPA
Arg-DTPA
Hist-DTPA
Ser-DTPA
00
05
10
15
20
25
550 575 600 625 650 675 700
Emis
sio
n In
ten
sity
(au
) x
10
00
0
Wavelength (nm)
Ala-DTPA
Arg-DTPA
Hist-DTPA
Ser-DTPA
227
Figure L Emission spectra for Eu(NO3)3 in H2O with DTPA-di(amino acid) ligands
(005 M) at pH 4 after irradiation with 7 kGy γ-radiation
00
05
10
15
20
25
550 575 600 625 650 675 700
Emis
sio
n In
ten
sity
(au
) x
10
00
0
Wavelength (nm)
Ala-DTPA
Arg-DTPA
Hist-DTPA
Ser-DTPA
228
APPENDIX 6 - MALDI-MS spectrum for DTPA-(AlaOMe)2
[M+H]+
[M+Na]+ [M+K]
+
229
AP
PE
ND
IX 7
- 1H N
MR
spectru
m fo
r DT
PA
-(AlaO
Me)
2
230
GSH1ESP
45 40 35 30 25 20 15
Chemical Shift (ppm)
01
02
03
04
05
06
07
08
09
Norm
alize
d In
tensi
ty
Water
44
944
844
6
38
9
37
6 37
437
2 28
628
628
528
4
24
924
8 24
724
624
524
4
21
1 20
920
720
5
AP
PE
ND
IX 8
- 1H N
MR
spectru
m fo
r GS
H
231
EUGSHESP
45 40 35 30 25 20 15
Chemical Shift (ppm)
01
02
03
04
05
06
07
08
09
Norm
alized Inte
nsity
Water
45
044
844
7
41
8
38
037
837
7
37
136
9
30
230
1
28
7 28
628
4
24
9 24
724
624
423
323
1
21
020
820
720
5
AP
PE
ND
IX 8
a - 1H N
MR
spectru
m fo
r Eu(N
O3 )
3 + G
SH
232

2
List of Tables
List of Figures
Abstract
Declaration
Copyright Statement
Acknowledgements
List of Symbols amp Units
List of Abbreviations amp Acronyms
Amino Acid Abbreviations
1 Introduction
11 The Actinides and Lanthanides
111 Background
112 Sources of the Actinides and Lanthanides
113 Properties of the 4f Elements
114 Properties of the 5f Elements
115 Relativistic Effects
116 Lanthanide and Actinide Contraction
117 Co-ordination Chemistry of the Lanthanides and
Actinides in Solution
1171 Hydrolysis
1172 Monodentate Ligands
1173 Chelates and Macrocycles
12 Analytical Methods
121 NMR Spectroscopy
122 Luminescence Spectroscopy
1221 Fluorescence and Phosphorescence
1222 Lanthanide Luminescence
1223 Actinide Luminescence
1224 Sensitised Luminescence and The Antennae
Effect
1225 Russell-Saunders Coupling
1226 Quenching
1227 Quenching in Lanthanides and Actinides
10
14
24
25
26
27
29
31
34
35
35
35
35
36
37
39
40
40
41
42
42
43
43
43
43
44
45
46
47
48
48
3
1228 Suitable Solvents for Luminescent Complexes
13 Nuclear Theory
131 Nuclear Power
132 The Nuclear Fuel Cycle
133 Spent Nuclear Fuel and Reprocessing
134 Solvent Extraction
1341 PUREX
1342 TRUEX
1343 DIAMEX
1344 SANEX
1345 iSANEX
1346 GANEX
1347 TRPO
1348 LUCA
1349 EXAm
137 TALSPEAK
1371 The Process
138 Reprocessing Summary
14 Project Objectives and Thesis Outline
References
2 Complexation Studies of Ln amp An with DTPA and Buffers
under TALSPEAK Conditions
21 Introduction to An-DTPA and Ln-DTPA Complexes
211 Stability of Ln-DTPA and An-DTPA Complexes
212 Co-ordination Chemistry of Ln-DTPA and An-DTPA
Complexes
22 Ln-DTPA Complexation Studies
221 1H NMR Studies of Ln-DTPA
222 Luminescence Studies of Ln-DTPA
23 An-DTPA Complexation Studies
231 1H NMR Studies of An-DTPA
232 Luminescence Studies of An-DTPA
50
51
51
52
53
55
55
57
59
60
62
63
65
67
68
69
69
74
75
77
81
81
82
83
84
84
86
88
88
89
4
24 Introduction to Buffer Interaction with Ln3+
and Ln-DTPA
Complexes
241 Interaction of Lactate with Ln3+
and Ln-DTPA
Complexes
242 Interaction of Amino Acids with Ln3+
and Ln-DTPA
Complexes
25 Studies on Buffer Interaction with M3+
and [M(DTPA)]2-
251 1HNMR Studies on Buffer Interactions
252 Luminescence Studies on Buffer Interactions
2521 Sensitisation Tests
2522 Aqueous Phase Lanthanide Studies without
Na5DTPA
2523 Aqueous Phase Lanthanide Studies with
Na5DTPA
2524 Aqueous Phase Actinide Studies with
Na5DTPA
253 Radiolysis Studies on Amino Acid Buffered Systems
2531 Previous Studies at the INL
2532 Irradiation Studies using Amino Acid Buffers
254 Buffer Interaction Summary
References
3 Solvent Extraction and Optimisation Studies with Amino Acid
Buffers
31 Previous Work at INL
311 L-alanine Studies
3111 pH Studies on L-alanine
3112 Concentration Effects
3113 Studies at pH 2
312 Other Amino Acids
32 L-alanine System Optimisation at pH 2
321 [Na5DTPA] Dependence (EuAm)
322 [HDEHP] Dependence (EuAm)
323 L-alanine Optimisation Summary
33 Other Amino Acid Studies
90
90
92
93
93
95
95
96
98
99
100
100
102
105
106
108
108
108
108
110
111
111
113
114
116
118
119
5
331 Initial Tests with Other Amino Acids
332 Studies with L-Histidine
34 Summary of Separations with Amino Acid Buffers
References
4 Studies using L-Glutathione as a Buffer in a TALSPEAK
System
41 Solvent Extraction and Separation using GSH
411 [L-Glutathione] and pH Dependence
4111 [GSH] Dependence without Na5DTPA
4112 [GSH] and pH Dependence with
Na5DTPA
412 [Na5DTPA] Dependence at pH 4
413 [HDEHP] Dependence at pH 4
42 Luminescence Studies using GSH with Eu3+
421 [GSH] and pH Dependence without Na5DTPA
4211 Aqueous Phase Studies
4212 Extraction Studies
422 [GSH] and pH Dependence with Na5DTPA
4221 Aqueous Phase Studies
4222 Extraction Studies
423 [Na5DTPA] Dependence at pH 4
4231 Aqueous Phase Studies
4232 Extraction Studies
424 [HDEHP] Dependence at pH 4
43 Radiolysis Studies using GSH at pH 4
431 Aqueous Phase Studies
432 Extraction Studies
44 Luminescence Studies using GSH with Dy3+
441 Dy3+
Complexation Studies
442 pH Dependence Studies
45 Luminescence Studies using GSH with Mixed Ln3+
Systems at pH 4
451 Complexation Studies
452 pH Dependence Studies
119
120
121
123
124
127
127
127
127
132
133
136
137
137
139
140
140
143
145
145
148
149
151
151
153
154
155
156
157
157
160
6
46 ICP-MS Studies with GSH
47 1H NMR Studies on GSH Systems
48 Summary and Conclusion of Glutathione Work
References
5 Modified DTPA Ligands as Combined Buffers and Soft Donors
in a TALSPEAK System
51 Ligand Synthesis
52 Luminescence Studies on Ligand Systems at pH 2 3 and 4
521 Aqueous Phase Studies
522 Extraction Studies
53 Radiolysis Studies on Ligand Systems at pH 2
531 Aqueous Phase Studies
532 Extraction Studies
54 Separation Work on Ligand Systems
541 AmEu Separation in Ligand Systems
542 Ln Separation in Ligand Systems
55 Summary and Conclusion of Modified DTPA Ligand
Work
References
6 Summary Conclusions and Future Work
61 Summary amp Conclusions
62 Future Work
References
7 Experimental Section
71 Chemicals and Reagents
711 Handling Radioisotopes at INL
72 Complexation studies of Ln3+
amp An3+
with amino acids in
TALSPEAK systems
721 Preparation of samples for luminescence studies
7211 Stock solutions
7212 Preparation of aqueous samples
7213 Preparation of extracted samples
163
166
170
173
174
175
176
176
179
183
183
184
185
186
187
190
191
192
192
198
200
201
201
201
201
201
201
202
202
7
722 Radiolysis of samples
7221 Preparation of Fricke solution
7222 Calculating dose rates
73 Solvent extraction and separation studies using amino
acids and glutathione at INL
731 Preparation of samples
7311 Stock solutions for amino acid studies
7312 [Na5DTPA] dependence SX samples for
amino acid studies
7313 [HDEHP] dependence SX samples for
amino acid studies
7314 Other amino acid SX samples for amino
acid studies
7315 Stock solutions for glutathione studies
7316 [GSH] dependence SX samples without
Na5DTPA
7317 [GSH] and pH dependence SX samples
with Na5DTPA
7318 [Na5DTPA] dependence SX samples for
GSH studies
7319 [HDEHP] dependence SX samples for
amino acid studies
732 Gamma counting
733 ICP-MS
74 Luminescence studies and solvent extraction using
glutathione at UoM
741 Preparation of luminescence samples
7411 Stock solutions for GSH studies
7412 Preparation of aqueous samples
7413 Preparation of extracted samples
742 Radiolysis of GSH samples
74 Modified DTPA Ligands
751 Synthesis of modified DTPA ligands
752 Characterisation of modified DTPA ligands by
MALDI-MS
203
203
203
205
205
205
205
205
206
206
206
206
207
207
207
208
208
208
208
209
209
210
210
210
210
8
753 Characterisation of modified DTPA ligands by
NMR spectroscopy
7531 1H NMR Spectroscopy
7532 13
C NMR Spectroscopy
754 Characterisation of modified DTPA ligands by
elemental analysis
755 Luminescence studies with modified DTPA
ligands
7551 Stock solutions
7552 Preparation of aqueous samples
7553 Preparation of extracted samples
7554 Radiolysis of ligand samples
76 Instruments
761 FTS MODEL 812 System 60
Co Irradiator
762 Edinburgh Instrument FP920 Phosphorescence
Lifetime Spectrometer
763 Packard Cobra II Gamma Counter
764 Bruker UltrashieldTM
400 NMR Spectrometer
References
Appendices
Appendix 1 - Emission spectra for [GSH] pH dependence
studies with DTPA in H2O
Appendix 2 - SFLnAm for varying GSH concentration over a
pH range of 2-4 with 005 M Na5DTPA after
extraction with 02 M HDEHP in dodecane
Appendix 3 - Natural pH values for modified DTPA ligands
(005 M) with Eu(NO3)3 (1 mM)
Appendix 4 - APPENDIX 4 - Emission spectra for Eu(NO3)3
with modified DTPA ligands in H2O
Appendix 5 - Emission spectra for radiolysis studies on
Eu(NO3)3 in H2O with DTPA-di(amino acid)
ligands
Appendix 6 - MALDI-MS spectrum for DTPA-(AlaOMe)2
211
211
213
215
216
216
216
216
216
217
217
217
218
218
219
220
220
222
223
224
226
228
9
Appendix 7 - 1H NMR spectrum for DTPA-(AlaOMe)2
Appendix 8 - 1H NMR spectrum for GSH
Appendix 8a - 1H NMR spectrum for Eu(NO3)3 + GSH
Total Word Count 50439
229
230
231
10
LIST OF TABLES
Table 11 Electronic properties of the lanthanides
Table 12 Electronic properties of the actinides
Table 13 Available oxidation states of the actinides and colours of
ions in solution where applicable
Table 14 Luminescence of lanthanide ions
Table 15 Luminescence of actinide ions
Table 16 Approximate compositions of SNF in Light Water
Reactors (LWR)
Table 21 Luminescence lifetimes and q values for Eu3+
with amino
acidslactate
Table 22 Luminescence lifetimes and q values for [Eu(DTPA)]2-
with amino acidslactate
Table 23 Separation factors for Eu3+
Am3+
in the presence of L-
alanine at 05 M under TALSPEAK conditions when subjected
to different doses of γ-radiation
Table 24 Luminescence lifetimes for aqueous and organic phases for
[Eu(DTPA)]2-
systems before and after irradiation at pH 36
Table 25 Luminescence lifetimes and q values for [Eu(DTPA)]2-
systems before and after irradiation at pH 36
Table 31 Distribution ratios and separation factors for a number of
L-alanine buffered TALSPEAK systems as pH and buffer
concentration are varied compared to a traditional lactic acid
system
Table 32 Distribution ratios and separation factors for a number of
amino acid buffered TALSPEAK systems
Table 33 Separation factors for L-alanine optimisation studies
Table 34 DAm values for L-alanine optimisation studies
Table 35 Separation factors and DAmEu values for traditional
TALSPEAK systems with different buffers at varying pH
values
Table 41 Eu3+
Am3+
distribution and separation for [GSH]
dependence with 005 M Na5DTPA at pH 4
11
Table 42 Eu3+
Am3+
distribution and separation for [Na5DTPA]
dependence with 05 M GSH buffer at pH 4
Table 43 Eu3+
Am3+
distribution and separation for [HDEHP]
dependence with 03 M Na5DTPA and 05 M GSH buffer at
pH 4
Table 44 Eu3+
Am3+
distribution and separation for [HDEHP]
dependence with 04 M Na5DTPA and 05 M GSH buffer at
pH 4
Table 45 Luminescence lifetimes and q values for Eu3+
with GSH at
pHD 4
Table 46 J=1J=2 peak ratios and t-test results for Eu-DTPA at pD
2-4 over a GSH concentration range of 01-05 M following
excitation at 397 nm
Table 47 Luminescence lifetimes and q values for Eu-DTPA at pH
2-4 over a GSH concentration range of 01-05 M
Table 48 J=1J=2 peak ratios and t-test results for Eu-DTPA at pH
2-4 as [GSH] is varied
Table 49 J=1J=2 peak ratios and t-test results for Eu-DTPA with
05 M GSH in D2OH2O at pDpH 4 over a Na5DTPA
concentration range of 005-06 M
Table 410 Luminescence lifetimes and q values for Eu-DTPA with
05 M GSH at pH 4 over a Na5DTPA concentration range of
005-06 M following excitation at 397 nm
Table 411 J=1J=2 peak ratios and t-test results for Eu3+
in the
aqueous phase with 05 M GSH at pH 4 as [Na5DTPA] is
varied after extraction with 02 M HDEHP
Table 412 J=1J=2 peak ratios and t-test results for Eu3+
in the
aqueous phase with 05 M GSH and 03 M Na5DTPA at pH 4
as [HDEHP] is varied after extraction
Table 413 J=1J=2 peak ratios and t-test results for Eu-DTPA with
05 M GSH in D2OH2O at pDpH 4 over a Na5DTPA
concentration range of 01-06 M after irradiation with 7 kGy
γ-radiation
12
Table 414 Luminescence lifetimes and q values for Eu-DTPA with
05 M GSH at pH 4 over a Na5DTPA concentration range of
01-06 M after irradiation with 7 kGy γ-radiation
Table 414 Luminescence lifetimes and q values for Eu-DTPA with
05 M GSH at pH 4 over a Na5DTPA concentration range of
01-06 M after irradiation with 7 kGy γ-radiation
Table 415 J=1J=2 peak ratios and t-test results for Eu3+
in the
aqueous phase with 05 M GSH and at pH 4 as [Na5DTPA] is
varied after extraction with 02 M HDEHP in dodecane from
an aqueous phase irradiated at 7 kGy γ ndashradiation
Table 416 Luminescence lifetimes for lanthanide samples at pH 4
Table 417 Luminescence lifetimes and q values for Eu3+
and Tb3+
samples at pH 4
Table 418 Luminescence lifetimes for aqueous phases before
extraction over a pH range of 2-4
Table 419 Luminescence lifetimes and q values for Eu3+
and Tb3+
samples before extraction over a pH range of 2-4
Table 420 SFLnAm for varying GSH concentration over a pH range
of 2-4 with 005 M Na5DTPA after extraction with 02 M
HDEHP in dodecane
Table 51 J=1J=2 peak ratios and t-test results for Eu- DTPA-
bis(amino ester) complexes at pD 2-4
Table 52 Luminescence lifetimes and q values for Eu-DTPA-
bis(amino ester) complexes at pD 2-4 recorded at the emission
maximum (617 nm) following 397 nm excitation
Table 53 J=1J=2 peak ratios and t-test results for organic phases
after extraction after Eu3+
extraction aqueous phases
containing DTPA-bis(amino ester) ligands (50 mM) at pH 2-4
Table 54 J=1J=2 peak ratios and t-test results for Eu-DTPA-
bis(amino ester) complexes at pD 2 after irradiation with 7
kGy γ-radiation
Table 55 Luminescence lifetimes and q values for Eu-DTPA-
bis(amino ester) complexes at pD 2-4 after irradiation with 7
kGy γ-radiation
13
Table 56 J=1J=2 peak ratios and t-test results for the organic phases
after Eu3+
extraction from aqueous phases containing DTPA-
bis(amino ester) ligands (50 mM) at pH 2 one of which had
been irradiated with 7 kGy γ-radiation
Table 57 Luminescence lifetimes and q values for the organic
phases after Eu3+
extraction from aqueous phases containing
DTPA-bis(amino ester) ligands (50 mM) at pH 2 one of which
had been irradiated with 7 kGy γ-radiation
Table 71 Dose rates received at each sample position in the 60
Co
irradiator at DCF
Table 72 Elemental analysis results for modified DTPA ligands P =
predicted proportion present () A = actual proportion
present ()
Table 73 Emission and excitation wavelengths for Ln3+
ions
14
LIST OF FIGURES
Figure 11 Jablonski diagram showing fluorescence and
phosphorescence
Figure 12 Energy transfer pathway for sensitised luminescence of
Ln3+
complexes
Figure 13 Energy level diagram showing the ground and excited
states of a selection of lanthanides and vibrational oscillators
Figure 14 The energy gaps between the lowest emissive states and
ground states of a selection of lanthanides and actinides
Figure 15 Chain reaction generated by fission of 235
U into 92
Kr and
141
Ba
Figure 16 The Nuclear Fuel Cycle
Figure 17 Chemical structure of TBP (Tri-nbutyl phosphate)
Figure 18 PUREX flow diagram
Figure 19 Chemical structure of CMPO (NN-diisobutyl-2-
(octyl(phenyl)phosphoryl)acetamide)
Figure 110 TRUEX flow diagram
Figure 111 Chemical structure of DMDBTDMA
Figure 112 Chemical structure of DMDOHEMA
Figure 113 Example DIAMEX flow diagram
Figure 114 General chemical structure of BTPs
Figure 115 Chemical structure of TODGA
Figure 116 Chemical structure of HEDTA
Figure 117 SANEX flow diagram for TODGA process
Figure 118 General chemical structure of BTBPs
Figure 119 Chemical structure of CyMe4-BTBP
Figure 120 Chemical structure of CyMe4-BTPhen
Figure 121 GANEX flow diagram
Figure 122 Chemical structure of TRPO
Figure 123 Chemical structure of CYANEX 301
Figure 124 Chemical structure of TTHA
Figure 125 TRPO flow diagram using TTHA
Figure 126 TRPO flow diagram using HNO3 and oxalic acid
Figure 127 LUCA flow diagram
15
Figure 128 Chemical structure of TEDGA
Figure 129 Chemical structure of DTPA
Figure 130 Chemical structure of HDEHP
Figure 131 Chemical structure of HEH[ϕP]
Figure 132 Chemical structure of lactic acid pKa = 386
Figure 133 The solvent extraction process used in TALSPEAK Step
1 Binding of DTPA to M3+
in the aqueous phase at pH 36
buffered by lactic acid Step 2 Selective extraction of Ln3+
into the organic phase by HDEHP from the aqueous phase due
to preferential binding of DTPA to MA3+
Figure 134 Effect of Na5DTPA concentration on distribution ratios
of MA3+
and Ln3+
in TALSPEAK process using 1 M lactate
buffer and 03 M HDEHP in DIPB extractant
Figure 135 TALSPEAK flow diagram
Figure 21 XAS molecular structure of Gd(III)-DTPA
Figure 22 Chemical structure of [Eu(DTPA)]2-
Figure 23 1H NMR spectrum of [Eu(DTPA)]
2- in D2O at 278 K at
pD = 36
Figure 24 1H NMR spectra of DTPA in D2O at 278 K at varying pD
a) pD 7 [DTPA]5-
b) pD 36 [H3DTPA]2-
c) pD 2 [H5DTPA]
Figure 25 Emission spectrum of Eu3+
(aq) and [Eu(DTPA)]2-
in D2O
at pD 36
Figure 26 1H NMR spectrum for [Am(DTPA)xH2O]
2- in 41 vv
MeODD2O with NaOD over a temperature range at pH 3
Figure 27 Emission spectrum of Cm3+
and [Cm(DTPA)]2-
in
perchloric acid at pH 3 by direct excitation with a NdYAG
pumped dye laser at 3966 nm
Figure 28 Emission spectrum of Eu-lactate as a function of lactate
concentration
Figure 29 Co-ordination mode of lactate to Eu3+
Figure 210 Chemical structures of L-alanine (top) glycine (bottom
left) and L-serine (bottom right)
Figure 211 1H NMR spectrum of Eu(NO3)3xH2O (10 mM) with L-
alanine in D2O at 278 K
16
Figure 212 1H NMR spectrum of L-alanine in D2O at 278 K
Figure 213 1H NMR spectrum of [Eu(DTPA)]
2- (10 mM) with L-
alanine (1 M) in D2O at 278 K
Figure 214 Emission spectra of [Tb(DTPA)]2-
in D2O at pD 3 with
and without the presence of L-phenylalanine (05 M) excited at
250 nm and 379 nm Excitation spectrum of [Tb(DTPA)]2-
in
D2O at pD 3 with L-phenylalanine (05 M) at 545 nm
Figure 215 Chemical structure of L-phenylalanine
Figure 216 Emission spectra of Eu(NO3)3 in D2O at pD 36 with and
without the presence of amino acidslactate (1 M) excited at
395 nm at 298 K
Figure 217 Emission spectra of Eu-DTPA in D2O at pD 36 with and
without the presence of amino acidslactate (1 M) excited at
395 nm
Figure 218 Emission spectrum of [Cm(DTPA)]2-
in H2O with and
without L-alanine (25 mM) at pH 3 by direct excitation at 396
nm
Figure 219 Graph illustrating the rates of reaction of the middotOH radical
with L-alanine compared to lactic acid and the lactate ion
Figure 220 Distribution ratios for Ln3+
and Am3+
in the presence of
L-alanine at 05 M pH 2 at different doses of γ-radiation
Figure 221 Emission spectra of Eu3+
in D2O at pD 36 with and
without the presence of amino acidslactate excited at 395 nm
before 5 kGy γ-irradiation
Figure 222 Emission spectra of Eu3+
in D2O at pD 36 with and
without the presence of amino acidslactate excited at 395 nm
after 5 kGy γ-irradiation
Figure 31 The effect of pH on an L-alanine-buffered TALSPEAK
system
Figure 32 Distribution ratios of Ln3+
Y3+
in a TALSPEAK system 1
mM LnY3+
1 M lactate 005 M DTPA pH 7 extracted using
05 M HDEHP in 14-DIPB
Figure 33 The effect of buffer concentration on an L-alanine-
buffered TALSPEAK system
17
Figure 34 Chemical structures of L-arginine (top) L-histidine
(bottom left) and L-methionine (bottom right)
Figure 35 DTPA speciation as a function of pH modelled using
HySS sofware using literature pKa values
Figure 36 [Na5DTPA] dependence of L-alanine system (05 M) at
pH 2
Figure 37 Eu3+
Am3+
separation for [Na5DTPA] dependence of L-
alanine system (05 M) at pH 2
Figure 38 Eu3+
Am3+
separation for [HDEHP] dependence of L-
alanine system (05 M) at pH 2 using 02 M Na5DTPA
Figure 39 Eu3+
Am3+
separation for [HDEHP] dependence of L-
alanine system (05 M) at pH 2 using 03 M Na5DTPA
Figure 310 Eu3+
Am3+
separation for [HDEHP] dependence of L-
alanine system (05 M) at pH 2 using 04 M Na5DTPA
Figure 311 Distribution ratios of La3+
-Ho3+
and Am3+
with 05 M L-
histidine buffer at pH 2 and pH 3
Figure 41 Molecular structures of eisenin (top) and norophthalmic
acid (bottom)
Figure 42 Molecular structures of biotinvitamin B7 (top) and folic
acid vitamin B9 (bottom)
Figure 43 Molecular structure of L-glutathione (reduced form)
Figure 44 Eu3+
Am3+
distribution for [GSH] dependence with 005
M Na5DTPA at pH 2 extracted using 02 M HDEHP in
dodecane Results were averaged from 3 repeat tests
Figure 45 Eu3+
Am3+
distribution for [GSH] dependence with 005
M Na5DTPA at pH 3 extracted using 02 M HDEHP in
dodecane Results were averaged from 3 repeat tests
Figure 46 Eu3+
Am3+
distribution for [GSH] dependence with 005
M Na5DTPA at pH 4 Results were averaged from 3 repeat
tests
Figure 47 GSH speciation as a function of pH modelled using
HySS software using literature pKa values
Figure 48 H2GSH- species dominant in solution at pH 4
18
Figure 49 A ternary Nd DO3A-pyrazine amine carboxylate complex
reported by Faulkner at al (left) and anticipated bidentate
chelation of GSH with Am-DTPA at pH 4 (right)
Figure 410 Eu3+
and Am3+
distribution for [Na5DTPA] dependence
with 05 M GSH buffer at pH 4 curves fitted as polynominal
order 2 for both Am3+
and Eu3+
Results were averaged from 3
repeat tests
Figure 411 Eu3+
and Am3+
distribution for [HDEHP] dependence
with 03 M Na5DTPA and 05 M GSH buffer at pH 4 curve
for Eu3+
fitted as polynominal order 2 linear correlation for
Am3+
Results were averaged from 3 repeat tests
Figure 412 Eu3+
and Am3+
distribution for [HDEHP] dependence
with 04 M Na5DTPA and 05 M GSH buffer at pH 4 linear
correlation for both Am3+
and Eu3+
Results were averaged
from 3 repeat tests
Figure 413 Corrected emission spectra of Eu(NO3)3 (1 mM)
Eu(NO3)3 with GSH (05 M) and Eu(NO3)3 with Na5DTPA
(005 M) in H2O following excitation at 397 nm
Figure 414 Emission spectra of Eu(NO3)3 in H2O at pH 4 over a
GSH concentration range of 01 ndash 05 M following excitation
at 397 nm
Figure 415 Emission spectra of Eu(NO3)3 in D2O at pH 4 over a
GSH concentration range of 01 ndash 05 M following excitation
at 397 nm
Figure 416 Emission spectra of aqueous and organic phases after
Eu3+
extraction at pH 4 using a GSH concentration range of
01 ndash 05 M following excitation at 397 nm
Figure 417 Emission spectra of Eu3+
in D2O at pD 2 with 005 M
Na5DTPA over a GSH concentration range of 01 ndash 05 M
following excitation at 397 nm
Figure 418 Emission spectra of Eu3+
in D2O at pD 3 with 005 M
Na5DTPA over a GSH concentration range of 01 ndash 05 M
following excitation at 397 nm
19
Figure 419 Emission spectra of Eu3+
in D2O at pD 4 with 005 M
Na5DTPA over a GSH concentration range of 01 ndash 05 M
following excitation at 397 nm
Figure 420 Emission spectra of aqueous phases after Eu3+
extraction
at pH 2-4 over a GSH concentration range of 01-05 M
following excitation at 397 nm
Figure 421 Emission spectra of organic phases after Eu3+
extraction
at pH 2-4 over a GSH concentration range of 01-05 M
following excitation at 397 nm
Figure 422 Emission spectra of Eu(NO3)3 in D2O at pD 4 with 05
M GSH over a Na5DTPA concentration range of 005 ndash 06 M
following excitation at 397 nm
Figure 423 Emission spectra of Eu(NO3)3 in H2O at pH 4 with 05
M GSH over a Na5DTPA concentration range of 005 ndash 06 M
following excitation at 397 nm
Figure 424 Emission spectra of aqueous and organic phases after
Eu3+
extraction with 05 M GSH at pH 4 over a Na5DTPA
concentration range of 005-06 M following excitation at 397
nm
Figure 425 Emission spectra of aqueous phases after Eu3+
extraction
with 05 M GSH and 03 M Na5DTPA at pH 4 over an
HDEHP concentration range of 02-10 M following
excitation at 397 nm
Figure 426 Emission spectra of organic phases after Eu3+
extraction
with 05 M GSH and 03 M Na5DTPA at pH 4 over an
HDEHP concentration range of 02-10 M following
excitation at 397 nm
Figure 427 Emission spectra of Eu(NO3)3 in H2O at pH 4 with 05
M GSH over a Na5DTPA concentration range of 005 ndash 06 M
after irradiation with 7 kGy γ-radiation following excitation at
397 nm
Figure 428 Emission spectra of aqueous and organic phases after
Eu3+
extraction from irradiated aqueous phase at pH 4
containing 05 M GSH over a Na5DTPA concentration range
of 01-06 M
20
Figure 429 Emission spectra of Dy(NO3)3 Dy-DTPA and Dy(NO3)3
with GSH in H2O following excitation at 352 nm Note that
the tail of ligand emission can be seen in the Dy DTPA and
Dy GSH solutions at shorter wavelengths
Figure 430 Emission spectra of aqueous and organic phases of
Dy(NO3)3 Dy-DTPA and Dy(NO3)3 with GSH after extraction
with 10 M HDEHP following excitation at 352 nm
Figure 431 Emission spectra of aqueous and organic phases of
Dy(NO3)3 Dy-DTPA and Dy(NO3)3 with GSH after extraction
with 10 M HDEHP following 352 nm excitation
Figure 432 Emission spectra of Ln(NO3)3 (1 mM EuTbSm3+
10
mM Dy3+
) in H2O at pH 4 following direct excitation (405 nm
for Sm3+
397 nm for Eu3+
366 nm for Tb3+
and 352 nm for
Dy3+
)
Figure 433 Emission spectra of Ln(NO3)3 (1 mM EuTbSm3+
10
mM Dy3+
) with GSH (05 M) at pH 4 in H2O following direct
excitation (405 nm for Sm3+
397 nm for Eu3+
366 nm for Tb3+
and 352 nm for Dy3+
)
Figure 434 Emission spectra of Ln-DTPA (1 mM EuTbSm3+
10
mM Dy3+
005 M Na5DTPA) in H2O at pH 4 following direct
excitation (405 nm for Sm3+
397 nm for Eu3+
366 nm for Tb3+
and 352 nm for Dy3+
)
Figure 435 Emission spectra of Ln(NO3)3 (1 mM EuTbSm3+
10
mM Dy3+
) with GSH (05 M) and Na5DTPA (005 M)
following direct excitation (405 nm for Sm3+
397 nm for Eu3+
366 nm for Tb3+
and 352 nm for Dy3+
)
Figure 436 Emission spectra of aqueous and organic phases of Ln3+
with 05 M GSH and 005 M Na5DTPA after extraction with
10 M HDEHP at pH 2 following direct excitation (405 nm for
Sm3+
397 nm for Eu3+
366 nm for Tb3+
and 352 nm for Dy3+
)
Figure 437 Emission spectra of aqueous and organic phases of Ln3+
with 05 M GSH and 005 M Na5DTPA after extraction with
10 M HDEHP at pH 3 following direct excitation (405 nm for
Sm3+
397 nm for Eu3+
366 nm for Tb3+
and 352 nm for
Dy3+
)
21
Figure 438 Emission spectra of aqueous and organic phases of Ln3+
with 05 M GSH and 005 M Na5DTPA after extraction with
10 M HDEHP at pH 4 following direct excitation (405 nm for
Sm3+
397 nm for Eu3+
366 nm for Tb3+
and 352 nm for
Dy3+
)
Figure 439 DLn for varying GSH concentration at pH 2 with 005 M
Na5DTPA after extraction with 02 M HDEHP in dodecane
Figure 440 DLn for varying GSH concentration at pH 3 with 005 M
Na5DTPA after extraction with 02 M HDEHP in dodecane
Figure 441 1H NMR spectra for GSH in D2O under a range of
conditions at 298 K a) GSH b) GSH after irradiation with 7
kGy γ-radiation c) Eu(NO3)3 with GSH d) GSH with
Na5DTPA e) Eu-DTPA with GSH
Figure 442 1H
1NMR proton assignments for GSH (top) and γ-Glu-
Cys (bottom)
Figure 51 General structure of DTPA-amino acid ligands
Figure 52 Emission spectra of Eu(NO3)3 with DTPA-bis(amino
ester) ligands in D2O at pD 2 following excitation at 397 nm
Figure 53 Emission spectra of Eu(NO3)3 with DTPA-bis(amino
ester) ligands in D2O at pD 3 following excitation at 397 nm
Figure 54 Emission spectra of Eu(NO3)3 with DTPA-bis(amino
ester) ligands in D2O at pD 4 following excitation at 397 nm
Figure 55 Emission spectra of aqueous phases after Eu3+
extraction
from an aqueous phase containing DTPA-bis(amino ester)
ligands (50 mM) at pH 2 following excitation at 397 nm
Figure 56 Emission spectra of aqueous and organic phases after Eu3+
extraction from an aqueous phase containing DTPA-bis(amino
ester) ligands (50 mM) at pH 2 following excitation at 397
nm
Figure 57 Emission spectra of aqueous and organic phases after Eu3+
extraction from an aqueous phase containing DTPA-bis(amino
ester) ligands (50 mM) at pH 3 following excitation at 397
nm
22
Figure 58 Emission spectra of aqueous and organic phases after Eu3+
extraction from an aqueous phase containing DTPA-bis(amino
ester) ligands (50 mM) at pH 4 following excitation at 397
nm
Figure 59 Emission spectra of Eu(NO3)3 in D2O with DTPA-
bis(amino ester) ligands (50 mM) at pH 2 after irradiation
with 7 kGy γ- radiation and following excitation at 397 nm
Figure 510 Emission spectra of aqueous and organic phases after
Eu3+
extraction from an irradiated (7 kGy γ-radiation) aqueous
phase containing DTPA-bis(amino ester) ligands (50 mM) at
pH 2 following excitation at 397 nm
Figure 511 Separation factors and distribution ratios for Eu3+
Am3+
using DTPA-(ArgOMe)2 (005 M) at pH 1-2 extracted using
HDEHP (02 M) in kerosene
Figure 512 Separation factors and distribution ratios for Eu3+
Am3+
using DTPA-(SerOEt)2 (005 M) at pH 1-2 extracted using
HDEHP (02 M) in kerosene
Figure 513 Separation factors and distribution ratios for Eu3+
Am3+
using DTPA-(HisOMe)2 (005 M) at pH 1-2 extracted using
HDEHP (02 M) in kerosene
Figure 514 Distribution ratios for Ln3+
using DTPA-(ArgOMe)2
(005 M) at pH 1-2 extracted using HDEHP (02 M) in
kerosene
Figure 515 Distribution ratios for Ln3+
using DTPA-(SerOEt)2 (005
M) at pH 1-2 extracted using HDEHP (02 M) in kerosene
Figure 516 Distribution ratios for Ln3+
using DTPA-(HisOMe)2
(005 M) at pH 1-2 extracted using HDEHP (02 M) in
kerosene
Figure 61 Chemical structures of amino acids
Figure 71 1H NMR proton assignments for DTPA-(AlaOMe)2
Figure 72 1H NMR proton assignments for DTPA-(ArgOMe)2
Figure 73 1H NMR proton assignments for DTPA-(SerOEt)2
Figure 74 1H NMR proton assignments for DTPA-(HisOMe)2
Figure 75 13
C NMR carbon assignments for DTPA-(AlaOMe)2
Figure 76 13
C NMR carbon assignments for DTPA-(ArgOMe)2
23
Figure 77 13
C NMR carbon assignments for DTPA-(SerOEt)2
Figure 78 13
C NMR carbon assignments for DTPA-(HisOMe)2
Figure 79 60
Co Irradiator at DCF (left) sample holder (top right)
and sample holder inside the irradiator (bottom right)
24
ABSTRACT
The University of Manchester
Madeleine Hilton Langford Paden
PhD
Development of a Simplified Soft-Donor Technique for Trivalent Actinide-Lanthanide
Separations
2015
The necessity of reprocessing spent nuclear fuel has arisen from increasing
awareness and concern for the environment in addition to the potential of minimising
proliferation A number of different reprocessing techniques are currently being
developed around the world to allow useful spent nuclear fuel (SNF) to be recycled and
reused and the remaining waste to be treated One such technique currently being
developed in the USA is the TALSPEAK process an advanced reprocessing method for
the separation of trivalent lanthanide (Ln3+
) and minor actinide (MA3+
) components
This process developed in the 1960s at Oak Ridge National Laboratory uses DTPA to
act as a holdback reagent for MA3+
in a lactate buffered aqueous phase at pH 36
allowing Ln3+
to be selectively extracted by organophosphate HDEHP into an organic
phase of DIPB or dodecane
TALSPEAK is one of the most promising techniques being researched due to its
numerous advantages particularly its relative resistance to radiolysis and its ability to
be carried out without the need for high reagent concentrations Additionally it gives
high separation factors in the region of ~50-100 comparable to other advanced
reprocessing methods under development The chemistry of the process is very complex
and not particularly well understood so it would be advantageous to simplify the process
by removing the need for a separate holdback reagent and buffer
In collaboration with colleagues at the Idaho National Lab the use of amino
acids as a potential combined buffer and soft donor was investigated Although it was
found that amino acids do not act as holdback reagents in their own right optimisation
of an L-alanine buffered TALSPEAK system with DTPA was found to allow the
process to be carried out effectively at a lower pH of 2 which is more preferable for
industrial application
As an extension of this separation studies were carried out using the tripeptide
L-glutathione (GSH) to determine its potential for use as a combined buffer and soft-
donor As with the studies with amino acids it was found that GSH also does not act as
a holdback reagent in its own right however it does interact with Ln-DTPA complexes
at pH 4 When optimised at this pH separation factors of up to 1200 were achieved for
Eu3+
Am3+
whilst still maintaining low MA3+
partitioning However further studies by
ICP-MS and luminescence spectroscopy showed that a GSH buffered system was not
effective for extraction of heavier lanthanides although the results show the potential
for further investigation into other short and longer chain peptide buffered systems and
possibly lanthanide-lanthanide separations
Further studies were carried on amino acid appended DTPA ligands which were
synthesised in a one step reaction in order to create a combined buffer and soft donor
The ligands were found to self-buffer at around pH 2 and allow successful separation of
Eu3+
Am3+
(SF ~ 100) The results from initial investigations by luminescence
spectroscopy and solvent extraction are promising and are presented here Further work
is needed on these systems in order to optimise their extraction capability and minimise
Am3+
partitioning In the future this work could promote studies for better
understanding of TALSPEAK chemistry that could be used in industrial partitioning
processes
25
DECLARATION
No portion of the work referred to in the thesis has been submitted in support of an
application for another degree or qualification of this or any other university or other
institute of learning
26
COPYRIGHT STATEMENT
The author of this thesis (including any appendices andor schedules to this thesis) owns
certain copyright or related rights in it (the ldquoCopyrightrdquo) and she has given The
University of Manchester certain rights to use such Copyright including for
administrative purposes
ii Copies of this thesis either in full or in extracts and whether in hard or electronic
copy may be made only in accordance with the Copyright Designs and Patents Act
1988 (as amended) and regulations issued under it or where appropriate in accordance
with licensing agreements which the University has from time to time This page must
form part of any such copies made
iii The ownership of certain Copyright patents designs trade marks and other
intellectual property (the ldquoIntellectual Propertyrdquo) and any reproductions of copyright
works in the thesis for example graphs and tables (ldquoReproductionsrdquo) which may be
described in this thesis may not be owned by the author and may be owned by third
parties Such Intellectual Property and Reproductions cannot and must not be made
available for use without the prior written permission of the owner(s) of the relevant
Intellectual Property andor Reproductions
iv Further information on the conditions under which disclosure publication and
commercialisation of this thesis the Copyright and any Intellectual Property andor
Reproductions described in it may take place is available in the University IP Policy
(see httpdocumentsmanchesteracukDocuInfoaspxDocID=487) in any relevant
Thesis restriction declarations deposited in the University Library The University
Libraryrsquos regulations (see httpwwwmanchesteracuklibraryaboutusregulations) and
in The Universityrsquos policy on Presentation of Theses
27
ACKNOWLEDGEMENTS
Firstly I would like to thank my University supervisors Dr Louise Natrajan and
Dr Clint Sharrad for their support and encouragement during my PhD and for their help
and guidance when needed I would also like to thank Dr Leigh Martin my industrial
supervisor at the Idaho National Lab for the opportunity to work there and gain valuable
new experience
For all of his help in the lab general advice and knowledge on the TALSPEAK
process I would particularly like to thank Dr Travis Grimes from the INL - I could not
have done it without you - and for much of the help and advice I received in
Manchester (as well as lending an ear when I needed to vent) I would like to thank Dr
Adam Swinburne
Thank you also to Dr Andreas Geist for conducting some separation studies for
me at KIT-INE Your contributions have been very valuable and I am most grateful for
all of your help
Sarah Hendley Kevin Beal Andrew Alker and Adrien Moll as Masters and
placement students have helped with various parts of the work in this thesis and
deserve great thanks for their contributions Additionally thank you to Dr Michael
Andrews for helping Adrien so much in the lab whilst I was finishing off my
experiments and beginning to write up my thesis I appreciate the time you spent even
though you had so much to do yourself
Further thanks to Prof Simon Pimblott Greg Horne and Logan Barr for
accommodating me and my Masters students at DCF for irradiation studies and to Greg
especially for giving up your precious time to help us
Dr Tamara Griffiths and Dr Catherine Riddle made working in the lab at the
INL a very enjoyable experience for me and kept me sane and encouraged in times of
desperation Many thanks to you wonderful ladies Also thank you to the Aqueous
Separations and Radiochemistry group (Jack Leigh Peter Travis Rocky Dean Cathy
Bruce Guy and Brandi) Terry Todd and other staff at the INL (Steve Chris Jake all
of the radcons the Analytical group and other placement students) who likewise made
me feel very welcome in a place so far from home
I would additionally like to thank Teams NatrajanMillsSharrad (Sean Adam
Simon Lucy Lizzie Debbie Chloe Mike Pete Kathryn Toria Jen (honorary
member) Dr David Mills Ally Conrad Aruna Helen Tamara Kate Dan Chris
Dave Charles Peter Zana Rich Hugues and Tim) and the Centre for Radiochemistry
28
Research at the University of Manchester for general lab help and support and for
making Manchester a great place to work And to my conference buddies Tamara
Debbie Kate and Adam for making conferences as much about the social side as the
work
Thank you to the INL KIT and Diamond Light Source for the opportunities to
carry out work using their specialist equipment and to Dr Louise Natrajan Dr Sean
Woodall Dr Daniel Whittaker Dr Tamara Griffiths Dr Clint Sharrad Dr Leigh Martin
and Dr Travis Grimes for helping with some of the work carried out
I could not have done this PhD without funding from Batelle Energy Alliance
through the INL and the University of Manchester so thank you
On a personal note a big thank you to Steph my room mate for making my 9
months living in Idaho so much fun And also to Cathy and Glen Shelby Natalie and
Leigh and Marie for all the fun times too Lastly but not least I would like to give huge
thanks to my (non-chemistry non-Idaho) friends and family for their support over the
past 4 years especially my wonderful husband Lee - youre amazing and my rock as
always - and my parents for everything over the past 26 years
It was worth it in the end
29
LIST OF SYMBOLS amp UNITS
gt greater than
˂ less than
plusmn plus or minus
percent
degC degrees Celsius
α alpha
β beta
γ gamma
δ chemical shift
Δ change in
ε molar extinction coefficient
λ wavelength
microL microlitres
micros microseconds
ρ density
τ lifetime
ν frequency
ν= energy level
wavenumber
Aring angstroms
A proportionality constant for q taking into account the
inner hydration sphere
ABS optical density difference between ODi and ODb
amu atomic mass units
au arbitrary units
B correction factor for q taking into account the outer
hydration sphere
Bq Becquerel
cm centimetres
D (pD D2O MeOD) deuterium
dm3 decimetres cubed (litres)
E energy
F Faradays constant
30
g grams
G critical dose value
Gy Gray
h Plancks constant
Hz Hertz
J Joules
J= rotational energy level
K Kelvin
kBq kiloBecquerel
kg kilograms
kGy kiloGray
kJ kiloJoules
L litres
log β stability constant
M molar (moldm-3
)
mg milligrams
MHz megaHertz
min minute(s)
mL millilitres
mm millimetres
mM millimolar
mol moles
mmol millimoles
ms milliseconds
ng nanograms
nm nanometres
ns nanoseconds
ODi optical density of irradiated solution
ODb optical density of non-irradiated control solution
ppm parts per million
s seconds
t time
Zeff effective nuclear charge
31
LIST OF ABBREVIATIONS amp ACRONYMS
An actinides
aq aqueous
BT nack-energy Transfer
BTBP bis-triazinbipyridine
BTP bis-triazinylpyridine
CEA Commissariat agrave lrsquoEacutenergie Atomique et aux Eacutenergies
Alternatives
CE-ICP-MS capillary electrophoresis ndash inductively coupled plasma ndash
mass spectrometry
cf confer Latin compare
CMPO carbomoylmethylphosphine oxide
CP corrosion products
CYANEX 301 bis(244-trimethylpentyl)phosphinodithioic acid
CyMe4-BTBP 66-bis(5588-tetramethyl-5678-tetrahydrobenzo
[e][124]triazin-3-yl)-22-bipyridine
D distribution ratio
DCF Dalton Cumbrian Facility
DEPT distortionless enhancement by polarization transfer
DFT density functional theory
DIAMEX DIAMide EXtraxtion
DIPB diisopropyl benzene
DMDBTDMA dimethyldibutyltetradecylmalonamide
DMDOHEMA dimethyldicotylhexylethoxymalonamide
DMF dimethylformamide
DNA deoxyribonucleic acid
DO3A 147 tris(carboxymethyl) 14710 tetraazacyclododecane
DOTA 14710-tetraazacyclododecane-14710-tetraacetic acid
DTPA diethylenetriaminepentaacetic Acid
EC electron capture
EDTA ethylenediaminetetraacetic acid
eg exempli gratia Latin for example
ET electron transfer
32
et al et alli Latin and others
EURACT-NMR Transnational Access to Unique European Actinide and
Radiological NMR Facilities
EXAm EXtraction of Americium
FP fission products
GANEX Grouped ActiNide EXtraction
GSH glutathione
HDEHP (di-(2ethylhexyl)phosphoric acid
HEH[ΦP] (2-ethylhexyl)phenylphosphonic acid
HEH[EHP] (2-ethylhexyl)phosphonic acid mono-2-ethylhexyl ester
HEDTA (2-hydroxyethyl) ethylenediaminetatraacetic acid
HSQC heteronuclear single quantum correlation
I ionic strength
IC internal conversion
ICP-MS inductively coupled plasma ndash mass spectrometry
ie id est Latin that is
INL Idaho National Laboratory
IR infra-red
iSANEX Innovative SANEX
ISC inter-system crossing
KIT-INE Karlsruhe Institute of Technology - Institut fuumlr Nukleare
Entsorgung (Institute for Nuclear Waste Disposal)
Lac lactate
LASER light amplification by stimulated emission of radiation
LINAC linear accelerator
Ln lanthanides
LUCA Lanthaniden Und Curium Americium trennung
LWR light water reactor
M metal
MA minor actinides
MALDI-MS matrix-assisted laser desorption ionization mass
spectrometry
MOX mixed oxide
MRI magnetic resonance imaging
Nd-YAG neodymium-yttrium aluminium garnet
33
nIR near-infra-red
NMR nuclear magnetic resonance
NPH normal paraffinic hydrocarbon
NR non-radiative decay
org organic
PPE personal protective equipment
PUREX Plutonium and Uranium Refinement by EXtraction
q number of solvent molecules in the inner hydration sphere
SANEX Selective ActiNide EXtraction
SF separation factor
SNF spent nuclear fuel
SX solvent extraction
TALSPEAK Trivalent Actinide Lanthanide Separation by Phosphorus
reagent Extraction from Aqueous Complexation
TALSQuEAK Trivalent Actinide Lanthanide Separation using Quicker
Extractants and Aqueous Complexes
TBP tributyl phosphate
TEA triethylamine
TEDGA NNNrsquoNrsquo-tetraethyl-diglycolamide
TEHP tris(2-ethylhexyl)phosphate
TM transition metals
TODGA tetraoctyldiglycolamide
TPH tetrapropylene hydrogenated
TRLFS time-resolved LASER-induced fluorescence spectrocopy
TRPO trialkylphosphine oxide
TRUEX TRans-Uranic EXtraction
TTHA triethylenetetramine hexaacetate
SF spontaneous fission
SNF spent nuclear fuel
UoM The University of Manchester
UV ultra-violet
UV-vis ultra-violet-visible
vs versus Latin against
XAS x-ray absorption spectroscopy
34
AMINO ACID ABBREVIATIONS
Amino Acid 3 Letter Abbreviation
Alanine Ala
Arginine Arg
Asparagine Asn
Aspartic acid Asp
Cysteine Cys
Glutamic Acid Glu
Glutamine Gln
Glycine Gly
Histidine His
Isoleucine Ile
Leucine Leu
Lysine Lys
Methionine Met
Phenylalanine Phe
Proline Pro
Serine Ser
Threonine Thr
Tryptophan Trp
Tyrosine Tyr
Valine Val
35
1 INTRODUCTION
11 The Actinides and Lanthanides
111 Background
The ldquorare earthrdquo or lanthanide elements (Ln) can be found between barium and
hafnium in the periodic table in the first of the two rows containing the f-block
elements The f-block elements are all metallic and have 4f or 5f valence electron
subshells the lanthanides Ce-Lu are also often referred to as the ldquo4frdquo elements1
Although often considered to be part of the lanthanide series lanthanum is not usually
considered to be a ldquo4frdquo element as it has no f-electrons The 4f elements all have
relatively high abundances despite often being termed the ldquorare earthrdquo elements except
for promethium (Pm) which is radioactive and does not occur in nature2 All of the 4f
elements except promethium were discovered and had all successfully been isolated by
the early 20th
century Promethium was not discovered until 19473
The actinide elements (An) can be found between radium and rutherfordium in
the periodic table and are also known as the 5f elements as their valence shell is the 5f
shell They are all radioactive as none of them have any stable isotopes Although often
considered to be part of the actinide series actinium is not usually considered to be a
ldquo5frdquo element due to its electronic configuration of 5f 0 Despite this thorium which also
has a ground state electronic configuration of 5f 0 is considered to be a 5f element The
first actinide element to be discovered was uranium which was discovered in 1789 by
Klaproth in the mineral pitchblende Thorium and protactinium had also both been
discovered by 1913 but the later actinides were not synthesised until the Second World
War initially by Seaborg4
112 Sources of the Lanthanides and Actinides
The naturally occurring lanthanide elements are found in two minerals
primarily monazite and bastnaumlsite which are ores of mixed lanthanide metals and have
the general formulae LnPO4 and LnCO3F respectively Monazite also contains
radioactive thorium so is the less favourable of the two sources of lanthanides
commercially5
Ac Th Pa and U are the only naturally occurring actinide (An) elements
Uranium is less abundant than thorium (24 ppm vs 81 ppm) in the Earthrsquos crust but is
found in numerous minerals in oxide form including pitchblende (uraninite) and
36
carnotite Protactinium is one of the rarest elements in the world and is found at trace
levels in some uranium ores
The remaining 11 (Np-Lr) elements in the An series must be synthesised
Neptunium to fermium can be synthesised by neutron bombardment whereby a neutron
is captured by a heavy element atom and a γ-ray is emitted This is followed by the
emission of a β- particle in a β
- decay process to form a new element with an increased
atomic mass (see Scheme 11) However as this is a relatively improbable process
synthesis of the heaviest elements is impossible by this method and so synthesis of the
heavier elements is carried out by bombardment with light atoms although again this is
also an unfavourable reaction6
238U (n γ)
239U rarr
239Np rarr
239Pu (n γ)
240Pu (n γ)
241Pu rarr
241Am (n γ)
242mAm rarr
242Cm
Scheme 11 Formation of 242
Cm by a series of neutron capture and β- decay
processes6
113 Properties of the 4f Elements
The shapes of the f -orbitals have a variety of different representations dependent
on molecular symmetry The electron configurations for the metals and Ln3+
ions can be
seen in Table 11 along with values for the third and fourth ionisation energies
Gadolinium (Gd) and lutetuim (Lu) both have a 5d electron giving more stable half-full
or full 4f orbitals respectively Cerium (Ce) is also thought to possess a 5d electron The
most common oxidation state for the lanthanide ions is +3 whereby both of the 6s
electrons and either the 5d electron (if applicable) or one 4f electron are lost The first
two ionisation energies of the lanthanide elements are all relatively low corresponding
to the removal of the 6s electrons The third ionisation energy is also sufficiently low to
allow the generation of the Ln3+
ion in each case by removal of the 5d electron or a 4f
electron The fourth ionisation energies are generally significantly higher as the 4f
orbital becomes more stabilised as the first three electrons are removed This makes the
+4 oxidation state rare but can be formed by Ce Pr and Tb under certain conditions
Samarium (Sm) europium (Eu) and ytterbium (Yb) can form Ln2+
ions relatively
readily
β- β
- β
- β
-
23 mins 23 days 13 years 16 hours
37
Table 11 Electronic properties of the lanthanides 7
Symbol Name Electron
Configuration
(Metal)
Electron
Configuration
(Ln3+
)
3rd
Ionisation
Energy
(kJmol-1
)
4th
Ionisation
Energy
(kJmol-1
)
La Lanthanum [Xe]5d16s
2 [Xe] 1850 4819
Ce Cerium [Xe]4f15d
16s
2 [Xe]4f
1 1949 3547
Pr Praseodymium [Xe]4f36s
2 [Xe]4f
2 2086 3761
Nd Neodymium [Xe]4f46s
2 [Xe]4f
3 2130 3899
Pm Promethium [Xe]4f56s
2 [Xe]4f
4 2150 3970
Sm Samarium [Xe]4f66s
2 [Xe]4f
5 2260 3990
Eu Europium [Xe]4f76s
2 [Xe]4f
6 2404 4110
Gd Gadolinium [Xe]4f75d
16s
2 [Xe]4f
7 1990 4250
Tb Terbium [Xe]4f96s
2 [Xe]4f
8 2114 3839
Dy Dysprosium [Xe]4f10
6s2 [Xe]4f
9 2200 4001
Ho Holmium [Xe]4f11
6s2 [Xe]4f
10 2204 4100
Er Erbium [Xe]4f12
6s2 [Xe]4f
11 2194 4115
Tm Thulium [Xe]4f13
6s2 [Xe]4f
12 2285 4119
Yb Ytterbium [Xe]4f14
6s2 [Xe]4f
13 2415 4220
Lu Lutetium [Xe]4f14
5d16s
2 [Xe]4f
14 2022 4360
114 Properties of the 5f Elements
As previously stated the valence electron sub-shell for the actinides is the 5f
shell The electron configuration of the actinides is shown in Table 12 Thorium has no
5f electron but has 6d2 configuration as an empty 5f shell is more favoured Curium has
a 6d electron giving rise to a more stable half full 5f subshell
The actinide elements have a wide range of available oxidation states
particularly for the earlier metals For the heavier elements however the most common
oxidation state for the metal ions is +3 having lost both of the 7s electrons and either a
6d electron (if applicable) or one 5f electron The available oxidation states for each of
the actinides can be seen in Table 13 Ionisation energy values are not available for all
of the actinides although the standard electrode potentials for the reduction of An4+
to
An3+
and An3+
to An2+
can be used to give an indication of the ion stabilities The +4
38
oxidation state is the most favoured for Th as it gives rise to empty 6d and 7s shells but
An4+
generally becomes less favoured across the series and may only be found in
solution for americium and curium complexes Conversely the stability of the +2
oxidation state generally increases across the series with an irregularity at Cm which
does not have an available +2 oxidation state due to the stability of the half full 5f
subshell of Cm3+
The variety of oxidation states found in the earlier actinides suggests
that all of the valence electrons are available for bonding in these elements7
Table 12 Electronic properties of the actinides7
Symbol Name Electron
Config
(Metal)
Electron
Config
(An2+
)
Electron
Config
(An3+
)
Electron
Config
(An4+
)
Th Thorium [Rn]6d27s
2 NA [Rn]6d
1 [Rn]
Pa Protactinium [Rn]5f26d
17s
2 NA [Rn]5f
2 [Rn]5f
1
U Uranium [Rn]5f36d
17s
2 NA [Rn]5f
3 [Rn]5f
2
Np Neptunium [Rn]5f46d
17s
2 NA
[Rn]5f
4 [Rn]5f
3
Pu Plutonium [Rn]5f67s
2 NA [Rn]5f
5 [Rn]5f
4
Am Americium [Rn]5f77s
2 [Rn]5f
7 [Rn]5f
6 [Rn]5f
5
Cm Curium [Rn]5f76d
17s
2 NA [Rn]5f
7 [Rn]5f
6
Bk Berkelium [Rn]5f97s
2 NA [Rn]5f
8 [Rn]5f
7
Cf Californium [Rn]5f10
7s2 [Rn]5f
10 [Rn]5f
9 [Rn]5f
8
Es Einsteinium [Rn]5f11
7s2 [Rn]5f
11 [Rn]5f
10 [Rn]5f
9
Fm Fermium [Rn]5f12
7s2 [Rn]5f
12 [Rn]5f
11 [Rn]5f
10
Md Mendelevium [Rn]5f13
7s2 [Rn]5f
13 [Rn]5f
12 [Rn]5f
11
No Nobelium [Rn]5f14
7s2 [Rn]5f
14 [Rn]5f
13 NA
Lr Lawrencium [Rn]5f14
6d17s
2 NA [Rn]5f
14 NA
39
Table 13 Available oxidation states of the actinides and colours of ions in solution
where applicable Ions in black text are either not found in aqueous solution or are
unknown8
115 Relativistic Effects
Relativistic effects are much more important for heavy elements than light
elements as they are proportional to an atomrsquos mass The Special Theory of Relativity
as devised by Einstein shows that as the velocity (ν) of a particle increases towards the
speed of light (c) its mass (m) increases to infinity as shown in equation 11 where m0
is the rest mass of the particle This is the relativistic mass increase
Equation 11
For example the relativistic mass increase of a 1s electron in uranium (found to
be 135 me) can be calculated using the average radial velocity of the electrons (νrad)
which is roughly equivalent to the atomic number Z for 1s electrons and the rest mass
of an electron (me) This is shown in equation 12
Equation 12
This effect causes a contraction of 1s electron subshell due to the inverse
relationship between electron mass and the Bohr radius of an atom meaning that the
shell is held more closely to the nucleus and stabilised A similar effect is true for p
electrons The relationship can be seen in equation 13 where α0 is the Bohr radius e is
the elementary charge and ħ is the reduced Planckrsquos constant
Equation 13
7 NpO23+
PuO23+
AmO65-
6 UO22+
NpO22+
PuO22+
AmO22
+5 PaO2
+UO2
+NpO2
+PuO2
+AmO2
+
4 Th4+
Pa4+
U4+
Np4+
Pu4+
Am4+
Cm4+
Bk4+
Cf4+
3 Ac3+
Th3+
Pa3+
U3+
Np3+
Pu3+
Am3+
Cm3+
Bk3+
Cf3+
Es3+
Fm3+
Md3+
No3+
Lr3+
2 Am2+
Cf2+
Es2+
Fm2+
Md2+
No2+
Ac Th Pa U Np Pu Am Cm Bk Cf Es Fm Md No Lr
Most stable in aqueous solution Accessible Only found in solid complexes
40
This explains why relativistic effects are more significant for larger nuclei as the
mass increase is dependent on Z Conversely to the stabilisation of s and p electrons by
relativistic effects valence f and d orbitals are expanded further from the nucleus and
destabilised due to effective shielding of the s and p electrons of the nucleus The effect
is greater in the actinides due to the increased number of electrons and is responsible for
the variety of oxidation states exhibited by An as the valence 5f electrons are further
from the nucleus and are therefore more available for bonding Relativistic effects are
much less important for the lanthanides than the actinides as the actinides are more
destabilised by the effects7
116 Lanthanide and Actinide Contraction
There is a general decrease in the size of the metallic and ionic radii of the
lanthanides across the series explained by the fact that 4f electrons are considered to be
ldquocore-likerdquo so are not available for bonding This causes crystal field effects to be minor
in lanthanide complexes The ldquocore-likerdquo property of the 4f electrons prevents them
from shielding valence electrons in outer subshells from the nucleus allowing the
effective nuclear charge (Zeff) to increase and causing contraction of the atoms and ions
across the series The lanthanide contraction is responsible for the small size difference
between the second and third row transition metals
The ionic radii of the actinides for the +3 +4 and +5 oxidation states gradually
decrease in size across the series although the metallic radii do not follow the same
trend The effect of the trend on the chemistry of the elements is not well known as the
later elements cannot be made with large enough yields to study and they decay too
rapidly The gradual decrease is due to the fact that 5f-electrons are poor at shielding s
and p electrons from the nucleus due to their greater radial extension allowing the
effective nuclear charge (Zeff) to increase and the s and p electrons to be held more
closely to the nucleus
117 Co-ordination Chemistry of the Lanthanides and Actinides in Solution
Lanthanide ions are hard Lewis acids and so co-ordinate readily with hard bases
The core-like nature of the 4f electrons prevents them from interacting significantly with
ligand orbitals and means that lanthanide complexes are bonded electrostatically The
co-ordination geometry of complexes is therefore determined predominantly by the
steric interactions of the ligands The high charge density of the Ln3+
ions allows them
41
to form ionic bonds however this means that many lanthanide complexes are labile in
solution
Actinide ions are also hard Lewis acids co-ordinating easily with hard bases
The greater radial extension of the 5f electrons caused by relativistic effects gives rise
to greater chemical activity in the actinides than the lanthanides as the 5f electrons are
more available for bonding This also explains the tendency of the early actinides to
form covalent bonds however the later actinides mainly interact electrostatically like
the lanthanides
Actinide ions are found as An3+
for the later elements in the series except for
No which is found as No2+
and they behave much like the lanthanides However for
some of the early actinides linear actinyl ions (AnO2+ and AnO2
2+) can be observed in
addition to free ions and are often more stable particularly for U91011
Lanthanide and actinide complexes often have high co-ordination numbers
typically 8 or 9 in aqueous solution (although co-ordination numbers as high as 12 have
been reported) due to their large size The Ln3+
ion forms readily in aqueous solution
and the An3+
ion is the common form for the later actinides however the solution state
chemistry of the early actinide ions is complicated Americium is mainly found in the
+3 oxidation state in solution although it also forms the AmO22+
ion The Am7+
oxidation state has been known to exist but is unstable except in very alkaline
conditions
It is difficult to determine the exact co-ordination numbers and geometries of Ln
and An ion complexes in solution due to the lability of the complexes particularly for
lanthanides
1171 Hydrolysis
The solvation of metal cations by water particularly cations with a high charge
density such as Ln3+
and An3+
ions will result in some hydrolysis The cations polarise
the O-H bonds of the solvent allowing the hydrated metal cations to act as Broslashnsted
acids An example can be seen in Equation 14
Equation 14 [Eu(H2O)8]3+
+ H2O rarr [Eu(H2O)7(OH)]2+
+ H3O+
The acidity of the Ln3+
cations increases across the series as the charge density
increases For the An ions the acidity increases as follows
AnO2+ lt An
3+ lt AnO2
2+ lt An
4+
42
Generally the acidity increases with increasing charge density like Ln The
position of AnO22+
can be explained by the fact that the O2-
ions do not fully reduce the
charge on the An ion and so the effective charge of the ion is seen to be +331
1172 Monodentate Ligands
Substituting water for other monodentate ligands in aqueous solution is
challenging for lanthanides as the complexes are labile and the high charge density of
the ion and affinity for a polar environment means that it will often remain solvated
Isolating monodentate complexes from water is almost impossible as Ln3+
ions having a
high enthalpy of hydration making complex formation endothermic Complexation can
be achieved much more easily by the use of macrocyclic or chelating ligands
Conversely it is much easier to form monodentate actinide complexes in water
such as salts which will become hydrated rather than completely substituted by water
molecules However complexation is still much easier with macrocycles or chelates in
aqueous solution12
1173 Chelates and Macrocycles
When a chelate or macrocycle ligates to an ion the reaction entropy increases as
water molecules are eliminated from the complex (see Equation 15) which is
thermodynamically favourable As a chelating or macrocyclic ligand bonds to the metal
ion the remainder of the ligand is considered to be in close proximity to the ion giving
it an ldquoartificially highrdquo concentration and is therefore more likely to bond than
surrounding ions or ligands
Equation 15 [Eu(H2O)8]3+
+ EDTA4-
rarr [Eu(EDTA)(H2O)3]- + 6H2O
Chelating complexes increase in stability across lanthanide and actinide series
This is because the Coulombic attraction between the ligand and the metal increases
with charge density However there is a slight irregularity in this trend for the
lanthanides where a slight dip can be seen at Gd3+
as this is thought to be the point at
which the co-ordination number changes from 9 to 8 often referred to as the
lsquogadolinium breakrsquo12
43
12 Analytical Methods
121 NMR Spectroscopy
Most lanthanide and actinide complexes are paramagnetic as they have unpaired
electrons The nuclei of paramagnetic complexes are subjected to a local magnetic field
in addition to the field generated by the spectrometer causing the complexes to have
larger chemical shifts NMR spectra of paramagnetic complexes often have broad peaks
as they have faster spin-lattice relaxation times due to strong spin-orbit coupling13
The
relationship is explained by the Heisenberg Uncertainty Principle which links energy
(E) and time (t) in Equation 16 where h is Planckrsquos constant
Equation 16
Considering the relationship between energy and frequency (ν) in Equation 17
the Heisenberg equation can be rearranged to show the inverse relationship between the
change in frequency (Δν) or ldquospectral linewidthrdquo (defined as the peak width of the
signal at half of its maximum height) and the lifetime of the excited state or in this case
spin-lattice relaxation time (Δt) See Equation 1814
Equation 17
Equation 18
122 Luminescence Spectroscopy
1221 Fluorescence and Phosphorescence
Fluorescence and phosphorescence are both types of luminescence Radiation is
used to excite electrons into a higher electronic energy level which then emit photons
(light) as they relax back down to their ground state Fluorescence is a relatively fast
process (picoseconds to milliseconds) as it is an allowed transition by the spin selection
rule not involving a change in spin multiplicity Phosphorescence is a slower process
(milliseconds to seconds) as it does involve a change in electron spin from a singlet to a
triplet excited state ndash it is formally ldquospin-forbiddenrdquo The processes can be seen in the
Jablonski diagram in Figure 11 By contrast f-f transitions whereby f-electrons are
excited into other f-subshells are formally Laporte forbidden so direct excitation of the
4f electrons is unfavourable These rules are relaxed a little by vibronic (vibrational and
44
electronic) coupling in which a vibration in the molecule causes the temporary
lowering of the symmetry of the metal allowing the d and p orbitals to share symmetry
The transition has some drarrp character and so becomes more intense However for
vibronic coupling to take place the valence orbitals must interact with incoming
ligands For the transitions that occur in the visible region of the spectrum this explains
why the colours of Ln3+
ions are weak as the valence 4f shell interacts poorly with
ligands due to their core-like nature Vibronic coupling is greater in actinide ions
Figure 11 Jablonski diagram showing fluorescence and phosphorescence15
1222 Lanthanide Luminescence
Lanthanide ions in which f-f transitions can occur are luminescent and emit
across a range of the electromagnetic spectrum from the Ultra-Violet (UV) range to the
visible (vis) or near-infra-red (nIR) region of the spectrum (Table 14) La3+
does not
possess any f-electrons and Lu3+
has a full 4f shell so these two ions are not
luminescent
45
Table 14 Luminescence of lanthanide ions
Luminescent ions which emit
in the nIR region of the
spectrum
Colours of luminescent ions
which emit in the visible and
UV regions of the spectrum
Pr3+
Sm3+
Nd3+
Eu3+
Ho3+
Tb3+
Er3+
Dy3+
Yb3+
Tm3+
Gd3+
(UV)
Ce3+
(UV)
Lanthanide ions have long luminescence lifetimes as their transitions are
formally forbidden Since the interaction between the metal ion and the ligand is
negligible in lanthanides the emission spectra of lanthanide complexes have narrow
emission lines resembling the spectra of the free ions Solid lanthanide compounds and
complexes also tend to be luminescent1617
1223 Actinide Luminescence
Actinide ions in which f-f transitions can occur are luminescent and also emit
across a range of the electromagnetic spectrum from the UV range to the infra-red IR or
nIR region (Table 15) Ac3+
and Th4+
do not have any f-electrons and Lr3+
has a full 4f
shell so these two ions are not luminescent No luminescence studies have been
performed on Fm3+
Md3+
or No2+
The remaining An have luminescent ions but studies
have been most widely performed on UO22+
Am3+
and Cm3+
as these are the most
widely available have fewer problems associated with radioactivity and safety and are
the most well understood
46
Table 15 Luminescence of actinide ions
Luminescent ions which emit
in the IRnIR region of the
spectrum
Colours of luminescent ions which
emit in the visible and UV regions
of the spectrum
NpO22+
Pa4+
(UV) Pa4+
Pa4+
Pa4+
Pa4+
Am3+
U4+
(UV) U4+
Es3+
UO2+
UO22+
UO22+
UO22+
UO22+
Am3+
Am3+
Am3+
Am3+
Cm3+
Bk3+
Cf3+
Unlike lanthanides actinide emission spectra and lifetimes vary depending on
the species and bound species or counter ions although most lifetimes for An are short
(lt 20 ns) with the exceptions of the 5f0 species UO2
2+ (which has lifetimes varying
from 130 ns to 300 μs) and Cm3+
which has a lifetime of ~65 μs and is known to have
the highest luminescence quantum yield of the An ions allowing it to be studied in very
low concentrations which is useful due to its low availability Luminescence studies on
solid state An compounds are unreliable as they are susceptible to radioluminescence
whereby the energy released by radioactive decay can result in the generation of an
emissive excited state718
1224 Sensitised Luminescence and Antennae
Sensitisation of luminescence can occur if an ldquoantennardquo is present which is a
sensitising chromophore An electron is excited on the ion by energy transferred from
the chromophore The antenna must be in close proximity to the ion for energy transfer
to take place and so antennae are usually used as ligands
Antennae are predominantly organic aromatic materials bonded to macrocycles
(as these are easier to ligate to the metal ions in solution) During sensitisation an
electron from the chromophore is excited from its ground state to a singlet excited state
Energy may then be transferred to a triplet excited state by inter-system crossing (ISC)
where the potential curves of the two states intersect at similar energies Although this
spin forbidden spin orbit coupling makes it possible by slightly shifting the electronrsquos
energy levels Energy from the triplet state is then transferred to the metal ionrsquos excited
47
state The ion can then relax to its ground state by luminescence This is the most
common pathway for sensitised emission however it is possible to transfer energy
directly from the singlet excited state on the chromophore to the ion (Figure 12)
Figure 12 Energy transfer pathway for sensitised luminescence of Ln3+
complexes 1S
represents an excited singlet state 3T an excited triplet state and f and frsquo represent
excited states of the Ln3+
ion 19
1225 Russell-Saunders Coupling
ldquoTerm symbolsrdquo are used to label ground state and excited state energy levels
for lanthanide ions Term symbols are derived from Russell-Saunders coupling and
account for the net atomic orbital angular momentum and the net spin angular momenta
of the state determined from the sum of the individual angular momenta of an ionrsquos
electrons Term symbols take the form
(2S+1)LJ
where S is the spin multiplicity of the state L corresponds to the ldquolrdquo quantum number
for the state and J is the coupling of L and S Excited states have several possible J
values although the ground state always has a single J value which can be determined
by Hundrsquos rules The Russell-Saunders coupling scheme is only useful for lanthanide
ions and cannot be applied to actinide ions as spin-orbit coupling is much greater in An
and the 5f orbitals have different properties to the 4f orbitals in particular the greater
importance of relativistic effects (see Section 115) However Russell-Saunders terms
have been used as a basis for assigning ground and excited state terms20
F = Fluorescence P = Phosphorescence L = Luminescence NR = Non Radiative Decay ISC = Inter System Crossing ET = Energy Transfer BT = Back-energy Transfer IC = Internal Conversion
48
1226 Quenching
The excited states of the trivalent lanthanides and actinides are readily quenched
in solution Quenching occurs when the vibrational energy levels of high energy
oscillators (such as C-H N-H or O-H bonds) within the molecule or its environment
(solvent) have a similar energy to the excited state of an ion Inter-System Crossing
(ISC) from the excited state to these vibrational levels can occur causing non-radiative
decay preventing luminescence The efficiency of this non-radiative decay is dependent
upon the energy gap between the emissive state and the ground state of the ion and also
on the number of quanta (energy levels) of the oscillator If the non-radiative decay is
favourable and happens faster than luminescence quenching will occur Quenching
reduces the intensity lifetime and quantum yield of luminescence If the ionrsquos emissive
state is close in energy to the triplet excited state of the ligand (lt 20000 cm-1
) thermal
quenching may also occur whereby energy is transferred backwards to the triplet
excited state of the chromophore21
1227 Quenching in Lanthanides and Actinides
Tb3+
is less susceptible to vibrational quenching than other lanthanide ions as the
energy gap between the lowest emissive state and the ground state of Tb3+
is very high
(20500 cm-1
) It is however susceptible to thermal quenching and back energy transfer
Eu3+
also has a large energy gap (17250 cm-1
) This results in a relatively greater
emission intensity for these ions
Other lanthanide ions such as Pr3+
Ho3+
Er3+
Tm3+
Yb3+
Dy3+
and Sm3+
with
smaller energy gaps are more easily quenched giving less intense emission Er3+
has the
smallest energy gap close to the υ=0 energy level of O-H so is the most easily
quenched (see Figure 13) The lower energy levels of the oscillators provide better
overlap with the energy levels of the ions due to a better overlap with the wavefunction
therefore ions which have energy levels that overlap with the lower quanta of the
oscillators will also be more easily quenched Gd3+
has the highest energy gap of the
lanthanide ions (32000 cm-1
) and cannot be sensitised by conventional UV absorbing
chromophores
49
Nd3+Eu3+ Tb3+Yb3+ O-H O-DTm3+ Sm3+ Pr3+ Er3+
3H4
4I132
4I112
3H4
3H5
3H6
3H6
3H5
3H4
0
20000
4I92
4I112
4I132
4I152
4F32
2H92
4S32
4F92
2H112
4G52
4G72
4G92
(2D2P)32
4G1125D4
7F07F17F27F37F4
7F5
7F67F0
7F1
7F2
7F3
7F4
7F5
7F6
5D0
5D1
5D2
2F52
2F72
10000
6H52
6H72
6H92
6H112
6H132
4F32
4G52
4F32
4F12
4F52
4F72
4G72
4F92
4F112
3F2
3F4
3P0
3P1
3F3
1I6
1G4
4I92
4F92
4S32
4F72
3F4
3F3
3F2
1G4
E
cm
-1
=0
=1
=2
=3
=4
=5
=0
=1
=2
=3
=4
=5
=6
=7
2H112
1D2
Figure 13 Energy level diagram showing the ground and excited states of a selection
of lanthanides and vibrational oscillators Emissive states are shown in red The energy
levels of O-H and O-D oscillations are shown in blue22
Actinides are also susceptible to quenching even more so than the lanthanides
as all of them have smaller energy gaps between the lowest emissive state and the
ground state The energy gaps of some actinides compared to lanthanides can be seen in
Figure 14
50
Figure 14 The energy gaps between the lowest emissive states and ground
states of a selection of lanthanides and actinides represented by arrows23
1228 Suitable Solvents for Luminescent Complexes
In addition to quenching by vibrational oscillators on ligands luminescence can
also be quenched by solvents High energy oscillators must therefore be eliminated from
the solvent in order for luminescence to take place in the solution phase This is
generally achieved by using deuterated (or fluorinated) solvents such as D2O It is also
important to use strongly co-ordinating solvents that would replace the labile ligands
The Horrocks equation can be used to calculate the number of co-ordinated solvent
molecules (q) to an ion whether it is a free ion or co-ordinated to a ligand The original
Horrocks equation (Equation 19) and modified Horrocks equation for q lt 2 (Equation
110) are shown below
Equation 19
Equation 110
The Horrocks equation uses the emission lifetimes (τ) to determine q A is the
proportionality constant taking into account the inner hydration sphere and B is a
correction factor taking into account the outer hydration sphere A and B values are
experimentally determined constants and are available for Sm3+
Eu3+
Tb3+
Nd3+
Yb3+
Am3+
and Cm3+
Inner sphere hydration (q) values can be effectively determined from
51
solutions of water and methanol For the original Horrocks equation A = 105 for Eu3+
and A = 42 for Tb3+
and for the modified Horrocks equation (when q lt 2 ) A = 12 ms
and B = (025 ndash 0075x) ms-1
(where x = the number of exchangeable N-H oscillators)
for Eu3+
and A = 5 ms and B = 006 ms-1
for Tb3+
242526
13 Nuclear Theory
131 Nuclear Power
Currently all nuclear energy irrespective of use is generated by nuclear fission
Nuclear fission is the splitting of a fissile nucleus into two smaller nuclei often aided by
the collision of an incoming particle or neutron The nucleus captures the neutron
which makes it unstable and it breaks into two fragments The splitting process releases
more neutrons which may continue to cause fission of more nuclei generating a chain
reaction An example of a chain reaction caused by 235
U fission can be seen in Figure
15
Figure 15 Chain reaction generated by fission of 235
U into 92
Kr and 141
Ba27
Fission of heavy radioactive actinide elements is exothermic and a chain
reaction can occur if there are enough fissile nuclei present The amount of fissile
material required for a self-sustaining chain reaction is the ldquocritical massrdquo and any mass
above this is referred to as a ldquosupercritical massrdquo which if not controlled can lead to a
runaway chain reaction and a nuclear explosion
52
235U fission is used to generate nuclear power The fission products (FP) collide
with other atoms and their kinetic energy in converted into heat which is absorbed by
the cooling water and then used to drive steam turbines to generate electricity Control
rods are used in the reactor to control the neutron flux and prevent a runaway chain
reaction These are often made of boron nitride which is a neutron absorber
Moderators are also used to slow down the neutrons to the optimum energy for fission
(~2 kJ mol-1
) and these tend to be light nuclei (12
C or 2H)
132 The Nuclear Fuel Cycle
Uranium is mined in its ore form from the ground mainly in Middle Eastern
countries Canada Australia and Africa The ore is then milled to extract the uranium as
ldquoyellowcakerdquo which is mixed oxides of triuranium octoxide (U3O8) uranium dioxide
(UO2) and uranium trioxide (UO3) by leaching with acid or alkali followed by
precipitation The remaining ore ldquotailingsrdquo are disposed of as radioactive waste
The yellowcake is then further processed as only 07 of uranium is fissile
235U the dominant isotope is
238U The uranium oxide is enriched by increasing the ratio
of 235
U238
U to approximately 35-5 235
U This is done by converting all of the mixed
oxides into uranium dioxide and then to uranium hexafluoride (UF6) gas and separating
it into two streams ndash one of which is enriched in 235
U and the other depleted
The enriched UF6 is then converted back to UO2 which can be pressed and
heated to 1400 degC to form fuel pellets The depleted uranium is treated as waste The
fuel pellets are subsequently encased in metal rods which can then be used in a fuel
assembly in a reactor
After 18-36 months the build-up of fission products is such that the efficiency
of the fuel decreases so the fuel rods are removed and replaced The used fuel is then
stored for months or years in water which absorbs the heat until the radiation levels
decrease sufficiently for it to be disposed of or reprocessed As there are no disposal
facilities at present for nuclear fuel waste it is simply isolated from the environment
and left in storage until facilities become available28
A diagram of the Nuclear Fuel
Cycle can be seen in Figure 16
The once-through or ldquoopenrdquo fuel cycle whereby waste is stored for disposal is
favoured by a number of countries including Canada parts of Europe and the USA
presently although some research on reprocessing techniques is being carried out in
these areas as reprocessing is becoming increasingly important for the future of nuclear
power A ldquoclosedrdquo fuel cycle whereby the waste is recycled and reused is becoming
53
more and more favoured as a result of this and has been performed in some parts of the
world for many years including the UK and other parts of Europe Russia and Japan29
Figure 16 The Nuclear Fuel Cycle30
133 Spent Nuclear Fuel and Reprocessing
The reprocessing of spent nuclear fuel (SNF) is essential for preventing the
exhaustion of uranium supplies and reducing the volume and radiotoxicity of the waste
produced
Current reprocessing techniques involve the removal of re-usable uranium and
plutonium present in the waste which can be recycled and reused together in mixed
oxide (MOX) reactors to produce more nuclear power31
The amount of waste
remaining in storage at present worldwide that could be reprocessed is approximately
200000 tonnes with a global reprocessing capacity of around 4000 tonnes per year
90000 tonnes have been reprocessed over the last 50 years
In addition to the reusable U and Pu in the spent nuclear fuel (SNF) there are
also a variety of other fission products (FP) present such as minor actinides (MA) Np
Am and Cm Ln and transition metals (TM) in addition to corrosion products (CP)
54
from steel containers and pipes in the system as a result of radiolysis erosion and
ageing of equipment These are TM chiefly cobalt (Co) chromium (Cr) iron (Fe) and
manganese (Mn) The composition of SNF can be seen in Table 16 Recently research
into the removal of the other actinides from the waste has become important in order to
transmute them into shorter-lived radionuclides so that their radioactivity will not
persist for as long making the disposal process easier and faster This coupled with a
similar approach for any remaining plutonium will make the waste proliferation
resistant as it would not allow the Pu to be recovered from storage in the future for
proliferation purposes
Table 16 Approximate compositions of SNF in Light Water Reactors (LWR)32
Constituent of SNF
U 956
Stable FP (including Ln) 29
Pu 09
Cs amp Sr (FP) 03
I amp Tc (FP) 01
Other long-lived FP 01
MA 01
Although MA only make up 01 of fission products they are highly radiotoxic
and extremely long-lived and so it would be beneficial to separate MA from the
remaining fission products so that they can be transmutated into shorter lived
radionuclides by neutron bombardment The necessity of the separation arises from the
presence of Ln as Ln are known to be neutron scavengers or ldquoneutron poisonsrdquo 33
meaning that they have a high neutron cross section and are able to absorb neutrons
preventing transmutation of other species present
Neptunium is relatively simple to remove from the mixture of fission products
as it has a variety of oxidation states that can be utilised in the process34
However the
predominant trivalent minor actinides (MAs) Am and Cm are much more difficult to
separate from the remaining lanthanide waste due to the similarities in the chemistries
of the elements and the electrostatic nature of interactions of the hard Lewis acidic Ln3+
ions with ligands35
Much of this new research is focussed on separating Am3+
and
Cm3+
from Ln3+
55
134 Solvent Extraction
Currently there are no MA-Ln separation techniques employed commercially
although a number of different processes are being developed particularly in the USA
and Europe with a drive to implement a working process within the next 5 years
Despite differences in the chemistry between the techniques under development all of
them use solvent extraction as the ultimate separation technique
Solvent extraction is the process of separation of two (or more) species using
two immiscible liquids (usually an organic and aqueous phase) by the use of
complexing agents to selectively move only one species between phases This may or
may not be aided by the use of a complexing agent which binds preferentially to one of
the species36
The success of this technique varies between compounds and solvent systems
and can be determined using a separation factor (SF) This is a ratio based on the
distribution ratios (D) of the elements to be separated (Equations 111 and 112)
Equation 111
Equation 112
There are a number of existing methods for removing radiotoxic elements from
fission products these are discussed over the next few sections
1341 PUREX
PUREX (Plutonium and Uranium Refinement by Extraction) is the process used
by nuclear plants that carry out reprocessing to remove U and Pu from the waste in
order to reuse it (Figure 18) Strong nitric acid (~ 4M HNO3) is used to dissolve the
waste in an aqueous phase to form hydrated nitrate complexes of the corresponding
oxides of U and Pu (Equations 113 and 114) High concentrations of acid (2-6 M) are
used to increase the solubility of the oxides
Equation 113 UO22+
+ 2NO3- (aq) rarrUO2(NO3)2xH2O
Equation 114 PuO22+
+ 2NO3- (aq) rarrPuO2(NO3)2xH2O
56
The plutonium complex is then reduced using nitrogen tetroxide (N2O4) to the
corresponding Pu4+
complex and the solution is filtered to remove any precipitates
(Equation 115)
Equation 115 PuO2(NO3)2xH2O + N2O4 rarr Pu(NO3)4xH2O
The solution is then contacted with an organic phase (kerosene) containing tri-
nbutyl phosphate (TBP) as an extracting agent (Figure 17) which forms complexes
with the U and Pu nitrate hydrates to move them into the organic phase (Equations 116
and 117)
Equation 116 UO2(NO3)2xH2O + 2TBP rarr UO2(NO3)2(TBP)2
Equation 117 PuO2(NO3)2xH2O + 2TBP rarr Pu(NO3)4(TBP)2
However Tc and Np are also extracted at this point This is a disadvantage for
the purpose of the PUREX process but is advantageous for subsequent MA-Ln
separation processes which could follow The UO22+
and NpO2+ TBP complexes are
then separated from the Pu4+
and TcO4- complexes by reduction of Pu
4+ to Pu
3+ with
hydrazine (N2H4) and extraction back into water (Equations 118 and 119)3738
Equation 118 N2H4 + H2O harr N2H5+ + OH
-
Equation 119 Pu(NO3)4(TBP)2 + N2H5+ rarr Pu(NO3)3(TBP)2 + N2H5NO3
The Pu3+
and TcO4- are then separated from each other through another
extraction cycle and then a ldquostrippingrdquo solution of nitric acid hydroxylamine and
sulphuric acid to obtain pure Pu The UO22+
and NpO2+ are also extracted back into
aqueous solution and separated from each other through another extraction cycle Pure
U is obtained by using aqueous nitric acid for stripping (back-extraction)39
The process
has been proven to work well and it is an advantage that the organic phase can be reused
after stripping However the process has a few drawbacks ndash the need for high acid
concentrations makes it less environmentally friendly the need for redox control and
less stable oxidation states makes it longer and complicated and the use of phosphorus
reagents makes the products more difficult to dispose of as phosphorus waste is not
57
incinerable and so any radioactive waste must be separated from the phosphorus before
treatment40
Figure 17 Chemical structure of TBP (Tri-nbutyl phosphate)
Figure 18 PUREX flow diagram41
1342 TRUEX
TRUEX (TRansUranic EXtraction) is an example of advanced reprocessing
(removal of MA and Ln) that is being developed in the USA The principle of the
process is to selectively remove Am and Cm (MA) and Ln from the other fission
58
products left in the raffinate after the PUREX process (Figure 110) A combination of
extractants is used carbamoylmethylphosphine oxide (CMPO) (Figure 19) and TBP (as
in the PUREX process) The benefit of the combined extractant system is that the
process is effective over a range of acidities (07-5 M HNO3) The raffinate (in nitric
acid) from the PUREX process is contacted with the extractant in an organic phase of
normal paraffinic hydrocarbon (NPH) Oxalic acid is then added to prevent the co-
extraction of zirconium (Zr) and molybdenum (Mo) with the MA An additional wash is
also performed using sodium carbonate (Na2CO3) to prevent any other fission products
from being co-extracted The extractants selectively remove the MA and Ln into the
organic phase leaving the remaining fission products in the aqueous phase The MA
and Ln are then stripped using nitric acid and can be reprocessed further as required
However a main drawback is that the lanthanides are still present with the MA so
further reprocessing is required 42
Figure 19 Chemical structure of CMPO (NN-diisobutyl-2-
(octyl(phenyl)phosphoryl)acetamide)
59
Figure 110 TRUEX flow diagram
1343 DIAMEX
The DIAMEX (DIAMide Extraction) process is another example of advanced
reprocessing and is currently under development in France by the CEA (Commissariat agrave
lEnergie Atomique et aux Energies Alternatives) (Figure 113) It is similar to the
TRUEX process as the process selectively removes Am and Cm (MA) and Ln from the
PUREX raffinate The process is being researched using a variety of different diamides
as the extractant the most promising of which have been shown to be NNrsquo-dimethyl-
NNrsquo-dibutyl-tetradecylmalonamide (DMDBTDMA) (Figure 111) and NNrsquo-dimethyl-
NNrsquo-dioctyl-hexylethoxymalonamide (DMDOHEMA) (Figure 112)4344
The nitric
acid PUREX raffinate is contacted with the extractant in an organic phase of tetra-
propylene-hydrogenated (TPH) a synthetic branched form of dodecane45
Oxalic acid is
then added to prevent the co-extraction of Zr and Mo with the MA as in the TRUEX
process and the extractant selectively removes the MA and Ln into the organic phase
leaving behind the other fission products in the aqueous phase The MA and Ln are then
stripped using nitric acid and can be reprocessed further as required
The main benefit of this process compared to the TRUEX process is that the
organic waste only contains C H N and O as P reagents are not used so the waste can
be disposed of more easily However like the TRUEX process a main drawback is that
the lanthanides are still present with the MA so further reprocessing is required 46
Figure 111 Chemical structure of DMDBTDMA (N1N3-dibutyl-N1N3-
dimethyl-2-tetradecylmalonamide)
60
Figure 112 Chemical structure of DMDOHEMA (N1N3-dibutyl-2-(2-
(hexyloxy)ethyl)-N1N3-dimethylmalonamide)
Figure 113 Example DIAMEX flow diagram
1344 SANEX
SANEX (Selective ActiNide EXtraction) is another process being developed by
CEA and is intended to be coupled with a TRUEX or DIAMEX type process and is the
next step in the advanced reprocessing whereby the MA and Ln are separated from
each other so that the MA can be treated (Figure 117) Complexing agents such as bis-
triazinyl-pyridines BTPs and their bipyridine variants (BTBPs) (Figure 114) have been
widely studied with a more recent complexing agent tetraoctyldiglycolamide (TODGA)
(Figure 115) being studied47
The complexing agents have been found to preferentially
bind to the MA allow only the MA to be extracted into an organic phase using TBP
leaving the Ln in the aqueous phase Oxalic acid and (2-hydroxyethyl)-
61
ethylenediaminetriacetic acid (HEDTA) (Figure 116) are used to prevent the co-
extraction of any other fission products The chemistry of this process is poorly
understood however and more research is needed48
However many of these extractant
molecules suffered problems that preclude them from use in plant-scale extractions
including poor stability slow extraction kinetics the use of citric acid as a buffer and
inefficient back extraction due to high An3+ affinities
Figure 114 General chemical structure of BTPs (66-di(124-triazin-3-yl)-22-
bipyridine)
Figure 115 Chemical structure of TODGA (22-oxybis(NN-dioctylacetamide))
Figure 116 Chemical structure of HEDTA (22-((2-((carboxymethyl)(2-
hydroxyethyl)amino)ethyl)azanediyl)diacetic acid)
62
Figure 117 SANEX flow diagram for TODGA process
1345 i-SANEX
The innovative SANEX (or i-SANEX) process is also currently under
development at the CEA49
Essentially it is a modified DIAMEX process with selective
back extraction of Am3+
and Cm3+
from the organic phase The MA3+
and Ln3+
ions are
initially extracted from the PUREX raffinate using TODGA and then a hydrophilic
complexant that is selective for MA3+
is employed to back extract the minor actinides
from the loaded organic phase into the aqueous phase In order to retain the lanthanide
ions in the organic phase a nitrate salt is added to the stripping solution Hydrophilic
extracting agents that have been used to demonstrate this technique are DTPA
(diethylenetriaminepentaacetic acid) and the sulphonated BTP derivative 26-bis(56-
di(sulphophenyl)-124-triazin-3-yl)pyridine SFrsquos of up to 1000 are achievable in this
process50
One other option that has been suggested is to add a second stripping agent
such as HDEHP to the organic phase in order to retain the lanthanides in the organic
phase at low pH One major drawback of this process however is the limited operative
acidity range (ca pH 3) which means that buffering agents need to be added to the
aqueous phase in the back extraction step Another reprocessing concept currently under
investigation is the 1-cycle SANEX with the intention to directly extract the trivalent
actinides selectively from the PUREX raffinate A system consisting of 015 M
CyMe4BTBP and 0005 M TODGA in a mixture of 40 TPH and 60 1-octanol has
been proposed51
63
1346 GANEX
The GANEX (Grouped ActiNide EXtraction) process is relatively new and is a
complete separation process combining the principles of the PUREX and TRUEX
processes in order to separate all of the An (U Pu and MA) from the Ln and both from
the other fission products (Figure 121) A complexing agent bis-triazin-bipyridine
(BTBP) (Figure 118) and its variants (such as CyMe4-BTBP (Figure 119) and CyMe4-
BTPhen (Figure 120))52
have been tested and found to be effective in selectively
coordinating to and extracting MA high separation factors of Am3+
over Eu3+
gt 1000
have been documented In the proposed process BTBP is dissolved in cyclohexanone
(as it is soluble in this solvent and has faster extraction kinetics) and used alongside
TBP which extracts U and Pu and is stable against radiolysis and hydrolysis especially
the CyMe4 variant If proven to be successful this process would simplify reprocessing
making it much simpler however much more work is needed before this process could
become operational as co-extraction of fission products is currently a problem53
For the
most attractive candidate to date the CyMe4-BTBP extractant has been successfully
tested for the extraction of genuine actinidelanthanide feed through a 16-stage
centrifugal contactor setup with excellent recoveries for americium and curium
(gt999) but has been shown to undergo radiolytic degradation at doses that will be
encountered at the high minor actinide loadings obtained in the reprocessing of for
example fast reactor fuels The kinetics for actinide extraction with CyMe4-BTBP are
still relatively slow so the addition of a phase-transfer catalyst is necessary (eg NNprime-
dimethyl-NNprime-dioctylethylethoxymalonamide (DMDOHEMA)) if this extractant is to
be used for large- scale partitioning
Figure 118 General chemical structure of BTBPs (66rsquo-bis(124-triazin-3-yl)-22rsquo-
bipyridine)
64
Figure 119 Chemical structure of CyMe4-BTBP (66-bis(5588-tetramethyl-5678-
tetrahydrobenzo[e][124]triazin-3-yl)-22-bipyridine)
Figure 120 Chemical structure of CyMe4-BTPhen (29-bis-(124-triazin-3-yl)-110-
phenanthroline)
65
Figure 121 GANEX flow diagram
1347 TRPO
Another advanced reprocessing extraction process being developed in China is
the TRPO (TRialkyl Phosphine Oxide) process which involves the separation of all
actinides in stages to remove Np and Pu together AmCm and Ln together and isolate
U There are two processes being researched both of which use TRPO (Figure 122) as
the extractant but differ in the other reagents used One system uses TTHA (triethylene
tetramine hexaacetate) (Figure 124) as a complexing agent to selectively bind to
different actinides preferentially at different pH values to allow selective extraction
buffered by lactic acid (Figure 125) The other process uses nitric acid to extract MA
and Ln followed by oxalic acid to extract Pu and Np Both processes then use sodium
carbonate to strip the remaining U from solution (Figure 126) The main advantage of
the first system is that MA and Ln can subsequently be separated from each other using
CYANEX 301 (Figure 123) with the main disadvantage being the need for buffering
due to pH dependence The main advantage of the second system is that the separation
between components is excellent and virtually discrete but the main disadvantage is that
MA and Ln cannot be later separated from each other using CYANEX 301 due to the
high acidity of the solution54
66
Figure 124 Chemical structure of TTHA (3-(2-((2-
(bis(carboxymethyl)amino)ethyl)(carboxymethyl)amino)ethyl)-6-
(carboxymethyl)octanedioic acid)
Figure 125 TRPO flow diagram using TTHA
Figure 122 Chemical structure of TRPO
(trialkyl phosphine oxide R = C6 ndash C8)
Figure 123 Chemical structure of
CYANEX 301 (bis(244-
trimethylpentyl)phosphinodithioic acid)
67
Figure 126 TRPO flow diagram using HNO3 and oxalic acid
1348 LUCA
LUCA (Lanthaniden Und Curium Americium trennung lanthanide and curium
americium separation) is a relatively new process currently being developed in
Germany and is designed to follow the SANEX or DIAMEX processes The process
involves the selective separation of Am3+
from Cm3+
Cf3+
and Ln3+
after co-extraction
A combined extractant system of bis(chlorophenyl)dithiophosphinic acid
((ClPh)2PSSH) and tris(2-ethylhexyl)phosphate (TEHP) in isooctane and tert-butyl
benzene is used Advantages of the LUCA process include high recovery after stripping
and that the phosphinic acid is more stable to hydrolysis and radiolysis than CYANEX
301 however the phosphinic acid was found to be unstable in high HNO3
concentrations55
At present as with the majority of the MALn processes described the
exact origin of the selectivity remains unclear however it is clear that in general
simple extractant molecules are favourable
68
Figure 127 LUCA flow diagram
1349 EXAm
The EXAm (Extraction of Americium) process is another relatively new process
developed by the CEA for the extraction of only americium from a PUREX raffinate56
Americium is the main cause of heat emissions in SNF wastes and so selective removal
and reprocessing of Am is favourable for vitrified waste disposal Separation of Am3+
from Cm3+
was considered as Cm reprocessing would be difficult to implement due to
high neutron emissions which would require very thick shielding
The process uses a mixture of two extractants (DMDOHEMA and HDEHP) in
TPH from a 4-6 M HNO3 FP solution TEDGA (NNNrsquoNrsquo-tetraethyl-diglycolamide)
(Figure 128) is used as the complexing agent to selectively retain Cm3+
and Ln3+
in
solution allowing extraction of Am3+
Advantages of the process are that the use of
TEDGA over TODGA allows increased separation of Am3+
Cm3+
and TEDGA is
relatively resistant to radiolysis However the chemistry remains quite poorly
understood and separation factors are still quite low at ~25 due to the very similar
chemistry of the two metal ions57
Figure 128 Chemical structure of TEDGA (NNNrsquoNrsquo-tetraethyl-diglycolamide)
69
137 TALSPEAK
TALSPEAK (Trivalent Actinide Lanthanide Separation by Phosphorus reagent
Extraction from Aqueous Complexation) is a further effective method of advanced
reprocessing by solvent extraction The process was initially developed at Oak Ridge
National Laboratory in Tennessee USA during the 1960s and it is still being refined
The process is designed to allow the separation of MA3+
(Am3+
and Cm3+
) from
Ln3+
and yttrium (Y3+
) from the other fission products and from each other to allow MA
to be reprocessed further by transmutation Although it is still under development the
TALSPEAK process has a number of benefits over other similar processes discussed in
Section 126 The process is resistant to irradiation and allows the separation to be
carried out without the need for high acid and salt concentrations It also has added
benefits in that it has already been performed on a pilot plant scale and uses cost
effective readily available reagents58
Additionally it can be carried out using relatively
inexpensive stainless steel equipment The process is very promising despite its
potential disadvantage that it involves removing the major constituent from the minor
constituent as studies have shown the separation is effective enough for this not to be a
problem
1371 The Process
In the process the MA preferentially form complexes with an aminopolyacetic
acid chelate over the lanthanides This allows the lanthanides to be better extracted into
an organic phase by a mono-acidic organophosphate or phosphonate (Figures 132 and
134) The most effective complexing agent to date is DTPA (diethylenetriamine
pentaacetic acid) (Figure 129) in the pH 25-35 range giving relatively high SFs (~50
for Nd3+
the most difficult to extract Ln3+
ion) and the most effective extracting agents
are HDEHP (di(2-ethylhexyl)phosphoric acid) (Figure 130) and HEH[ϕP] (2-
ethylhexyl phenyl phosphonic acid) (Figure 131) The extraction can be carried out
without the use of a complexing agent although the separation is not as discrete and is
significantly enhanced by the addition of an aminopolyacetic acid such as DTPA
Without DTPA Eu3+
Am3+
separation factors using 03 M HDEHP are around 40 59
whereas SF ~90 can be achieved when the complexing agent is used with the extractant
Other aminopolyacetic acids have been tested such as TTHA and EDTA but are not as
effective or tend to be less soluble60
70
Figure 129 Chemical structure of DTPA (2222-
((((carboxymethyl)azanediyl)bis(ethane-21-diyl))bis(azanetriyl))tetraacetic acid)
TALSPEAK Process
1 The fission product mixture (1 M) is dissolved in a carboxylic acid which acts
as a buffer and a solubiliser for the complexing agent lactic acid is often used
for this (Figure 132) Lactic acid (pKa 386)61
has been found to be the best
buffer for the process as it gives the best phase separation Nitrate may be
present from the original raffinate but this has been found not to decrease
separation
2 The solution is ldquoscrubbedrdquo with a mixture of Na5DTPA (01 M) in the same
carboxylic acid (1 M) at pH 36 ndash 38 The DTPA5-
complexes to the MA3+
and
Ln3+
but binds more strongly to the MA3+
This pH range is the optimum pH for
DTPA5-
activity as it complexes more strongly at higher pH values but
separation is better in more acidic conditions
Figure 130 Chemical structure of
HDEHP (bis(2-ethylhexyl) hydrogen
phosphate)
Figure 131 Chemical structure of
HEH[ϕP] ((2-(2-
ethylhexyl)phenyl)phosphonic acid)
71
3 The extractant is dilute HDEHP (05 M) in a hydrocarbon solution such as
DIPB (diisopropyl benzene found to give the best separation) which is then
contacted with the aqueous solution containing the LnMA[DTPA]2-
The Ln3+
ions are extracted into the organic phase by the phosphate causing dissociation
of the DTPA5-
and leaving the free DTPA5-
in the aqueous solution The
MA[DTPA]2-
complexes remain in the aqueous solution as DTPA5-
is bound
strongly enough to MA3+
to prevent the complexes from dissociating HEH[ϕP]
gives a better extraction although it makes stripping more difficult
4 After the Ln3+
ions are removed a second scrub is carried out at lower pH (15)
and a lower concentration of the complexing agent (005 M Na5DTPA) in lactic
acid (1 M) in order to extract the MA3+
The lower pH increases the extraction
rate as the DTPA5-
binds less strongly to the MA3+
allowing them to be
extracted more easily at the phase boundary where DTPA5-
dissociates The
phosphate (03 M HDEHP) is dissolved in n-dodecane (a more favourable
diluent) for the second extraction to remove the MA3+
into the organic phase
The use of n-dodecane was found to give better extraction but poorer
separation If Ln3+
and Y3+
are the only fission products present in the original
raffinate solution the MA3+
can be recovered by precipitation with oxalate from
the raffinate
5 Stripping is then carried out using 1 M HNO3 Nitric acid prevents the use of
corrosive chlorides This process can also be used to extract Cf3+
and Es3+
but it
has been found that more concentrated acid is needed for heavier actinides
Figure 132 Chemical structure of lactic acid pKa = 386
72
Figure 133 The solvent extraction process used in TALSPEAK Step 1 Binding of
DTPA to M3+
in the aqueous phase at pH 36 buffered by lactic acid Step 2 Selective
extraction of Ln3+
into the organic phase by HDEHP from the aqueous phase due to
preferential binding of DTPA to MA3+
Additional Notes on the Process
Initial extraction data for the process reported by Weaver et al in 1964 was
obtained by adding isotopic tracers to the aqueous solutions contacting them with the
organic phase performing the separation and measuring the activity by scintillation
counting with a γ-detector Extractions were all repeated 2-3 times to verify the results
and the contact time was 20 minutes which was much longer than necessary
Extractions performed using Na5DTPA and H5DTPA were found to give the same
results at the same pH values although pH adjustment was needed as Na5DTPA is more
alkaline than H5DTPA but H5DTPA is much less soluble The extraction of heavier
lanthanides was found to be slower but did not affect the separation Increasing the
concentration of HDEHP was found to give better separation but made the initial
equilibration time too long and increasing the concentration of DTPA decreased the
separation (Figure 134)
1 2
73
Figure 134 Effect of Na5DTPA concentration on distribution ratios of MA3+
and Ln3+
in TALSPEAK process using 1 M lactate buffer and 03 M HDEHP in DIPB extractant
60
The process is based on the preferential binding of the complexant to the
trivalent actinides over lanthanides Initially this was thought to be due to the fact that
An3+
binding is more covalent than Ln3+
binding However this was found not to be the
sole reason and it is understood that the organic ligand plays a role in the selectivity
The chemistry of the complexation of the ions with the ligand is not yet fully
understood and much work is needed to gain an insight into this complicated
chemistry62
74
Figure 135 TALSPEAK flow diagram
138 Reprocessing Summary
The necessity of reprocessing has arisen from increasing awareness and concern
for the environment in addition to the potential of maximising finite resources whilst
minimising proliferation There are a number of different processes currently under
development none of which have yet been implemented on a commercial scale except
for the PUREX process
The principles of all these process are often very similar although extraction
techniques and reagents vary somewhat There are a number of factors which must be
considered when developing a suitable solvent extraction process for SNF reprocessing
including the ease of stripping (back-extraction) the need for low volatility non-
flammable solvents the potential of the process to be continuous how to minimise
waste production the resistance of the process to radiolysis and degradation
practicality and efficiency of the process and the economic viability63
While some of the chemistry is understood such as the redox chemistry in the
PUREX process much of it is not thus limiting the potential to develop an efficient
process The sheer complexity of the waste content makes partitioning very difficult
and without a full understanding of the chemistry involved in the processes designing
75
an effective working process will be very challenging All of the processes currently
under development have advantages and disadvantages but all are ultimately heading
towards the same goal separation of the actinides from the lanthanides in order allow
the transmutation of the actinides into shorter lived radionuclides for the purpose of
reducing the long-term radiotoxicity of the waste and the volume of waste building up
in storage
TALSPEAK is one of the most promising techniques being researched due to its
numerous advantages particularly its relative resistance to irradiation and ability to be
carried out without the need for high reagent concentrations Additionally it gives
separation factors of ~50-100 comparable to the SANEX process which uses BTP one
of the most effective complexing agents However its main disadvantage is the poor
understanding of the separation mechanisms and complexation chemistry surrounding
it The main focus of research here will be the TALSPEAK process with a view to
improving the understanding of this chemistry and modifying the process to improve its
practicality
14 Project Objectives and Thesis Outline
Recent studies have shown that complexants with soft donor atoms compared to
oxygen (such as N or S) can be used to separate the MA from Ln6465
Initial research in
this area was carried out by our collaborators at Idaho National Lab using amino acids
as a potential buffer and soft donor which if proven to be successful would be able to
eliminate the need for the separate complexing agent and buffer simplifying the process
if amino acids were found to preferentially bind to the MA66
Another benefit to this
change would be the scope for carrying out the process at a lower pH due to the lower
pKa values of the carboxylic acid groups of the amino acids than on DTPA enabling
the system to be buffered to pH 1-2 rather than ~35 Lower pH values are preferred by
industry as higher acid concentrations are easier to control on a large scale pH control
is essential for the distribution ratios for the separation and there is a strong correlation
between the two Low pH values have been found to increase D however DTPA
protonates and precipitates out of the solution at the lowest values The use of amino
acids in place of the complexing agent would allow a lower pH to be used as they would
not fully protonate increasing the SF and making the process more efficient as binding
constants and ligand affinities would be higher To this end several avenues of research
have been explored
76
Chapter 2 presents initial studies carried out using amino acids in a TALSPEAK
system the interaction of amino acids with lanthanide and actinide ions and their
complexes in solution and the susceptibility of amino acid systems to radiolysis
Chapter 3 discusses work carried out at the INL on an L-alanine-buffered
system optimisation of the alanine system at pH 2 in order to maximise separation
potential and the consideration of other amino acid buffers over a range of pH values
Chapter 4 is focussed on an L-glutathione (GSH) buffered system GSH is a
tripeptide showing promise for an improved TALSPEAK system the next step after
research using single amino acids Data was initially obtained via solvent extraction in
order to investigate the separation ability of GSH and conditions were then optimised in
order to achieve maximum separation Interaction of the buffer with various
components in solution including lanthanide ions was probed using various techniques
including luminescence spectroscopy which was also used in determining the
susceptibility of the buffer to -radiolysis
Chapter 5 details the synthesis of amino acid appended DTPA ligands and their
complexation with lanthanide ions as well as their extraction and separation abilities
under different conditions along with radiolysis resistant investigations
77
1 S Cotton Lanthanide and Actinide Chemistry ed D Woolins R Crabtree D
Atwood and G Meyer John Wiley amp Sons Chichester UK 2006 1 1-7
2 C H Evans Episodes from the History of the Rare Earth Elements Kluwer
Academic Publishers Dordrecht Netherlands 1996
3 S Cotton Education in Chemistry 1999 36 4 96 WR Wilmarth RG Haire JP
Young DW Ramey JR Peterson J Less Common Metals 1988 141 275
4 LR Morss NM Edelstein and J Fuger The Chemistry of the Actindie and
Transactinide Elements Springer The Netherlands 4th edn 2010
5 AP Jones F Wall CT Williams Rare Earth Minerals Chemistry Origin and Ore
Deposits ed AP Jones F Wall and CT Williams Chapman and Hall London UK
1966 1 6-10
6 JJ Katz and GT Seaborg The Chemistry of The Actinide Elements Methuen amp Co
Ltd The Pitman Press Great Britain 1957
7 N Kaltsoyannis and P Scott The f elements ed R G Compton S G Davies J
Evans and L F Gladden Oxford University Press United States 1st edn 1999
8 Greenwood NN and Earnshaw A Chemistry of the Elements Butterworth-
Heinemann Great Britain 2nd edn1997
9 MB Jones AJ Gaunt Chem Rev 2012 DOI 101021cr300198m
10 L Natrajan F Burdet J Peacutecaut M Mazzanti J Am Chem Soc 2006 128 7152
11 C Fillaux D Guillaumont J-C Berthet R Copping D Shuh T Tyliszczak C
Den Auwer Phys Chem Chem Phys 2010 12 14253
12 HC Aspinall Chemistry of the f-block Elements ed D Phillips P OrsquoBrien and S
Roberts Gordon and Breach Science Publishers Singapore 2001 vol 5
13 F Gendron K Sharkas and J Autschbach J Phys Chem Lett 2015 6 2183-
2188
14 VBE Thomsen J Chem Educ 1995 72 (7) 616-618
15 Dr Louise Natrajan School of Chemistry The University of Manchester
16 JP Leonard CB Nolan F Stomeo and T Gunnlaugsson Topics in Current
Chemistry 2007 vol 281 pp1-43
17 Y Ma and Y Wang Co-ord Chem Rev 2010 254 972-990
18 LS Natrajan AN Swinburne MB Andrews S Randall and SL Heath Coordin
Chem Rev 2014 266-267 171-193
19 A Bettencourt-Dias Dalton Trans 2007 2229-2241
20 E Hashem AN Swinburne C Schulzke JD Kelly RC Evans JA Platts A
Kerridge LS Natrajan and RJ Baker RSC Adv 2013 3 4350
78
21 C Turro PK Fu and PM Bradley Met Ions Biol Syst 2003 40 323-353
22 Dr Louise Natrajan School of Chemistry The University of Manchester
23 I Billard and G Geipel Springer Ser Fluoresc 2008 5 465-492
24 A Beeby IM Clarkson RS Dickins S Faulkner D Parker L Royle AS de
Sousa JAG Williams and M Woods J Chem Soc Perkin Trans 2 1999 493-504
25 WD Horrocks and DR Sudnick J Am Chem Soc 1979 101 334
26 RM Supkowski and WD Horrocks Inorg Chim Acta 2002 340 44-48
27 Dummiesreg Nuclear Fission Basics httpwwwdummiescomhow-
tocontentnuclear-fission-basicshtml 2015
28 PE Hodgson Nuclear Power Energy and the Environment Imperial College Press
Great Britain 1999
29 P Dyck and MJ Crijns Rising Needs IAEA Bulletin 1998 40 1
30 World Nuclear Association The Nuclear Fuel Cycle httpwwwworld-
nuclearorginfoinf03html 2011
31 Nuclearmatterscouk Re-use of Plutonium as MOX Fuel
httpnuclearmatterscouk201202re-use-of-plutonium-as-mox-fuel 2012
32 World Nuclear Association Processing of Used Nuclear Fuel 2012
httpwwwworld-nuclearorginfoinf69htmla
33 United States Nuclear Regulatory Commission Neutron poison httpwwwnrcgov
2012
34 K L Nash Solvent Extraction and Ion Exchange 1993 114 729-768
35 M P Jensen L R Morss J V Beitz and D D Ensor Journal of Alloys and
Compounds 2000 303-304 137-141
36 Advanced Separation Techniques for Nuclear Fuel Reprocessing and Radioactive
Waste Treatment ed KL Nash and GL Lumetta Woodhead Publishing 1st edn
Cambridge UK 2011
37 CS Dileep Poonam Jagasia PS Dhami PV Achuthan AD Moorthy U
Jambunathan SK Munshi PK Dey and BS Tomar BARC Newsletter 2007 285
130-134
38 H Schmieder G Petrich and A Hollmann J Inorg Nucl Chem 1981 43 (12)
3373-3376
39 SC Tripathi and A Ramanujam Sep Sci and Technol 2003 38 2307
40 G Thiollet and C Musikas Solv Extr Ion Exch 1989 7 813
41 GL De Poorter and CK Rofer-De Poorter 720872 1976 US Pat 4080273 1978
79
42 EP Horwitz DC Kalina H Diamond GF Vandegrift and WW Schulz Solv
Extr Ion Exch 1985 31 75-109
43 A Banc P Bauduin and O Diat Chem Phys Lett 2010 494 (4-6) 301-305
44 J Muller L Bethon N Zorz and J-P Simonin Proceedings of the First ACSEPT
International Workshop 2010
45 C Brassier-Lecarme P Baron JL Chevalier and C Madic Hydrometallurgy
1997 47 57-67
46 O Courson R Malmbeck G Pagliosa K Romer B Satmark J-P Glatz P Baron
and C Madic Radiochim Acta 2000 88 865-871
47 M Sypula A Wilden C Schreinemachers and G Modolo Proceedings of the First
ACSEPT International Workshop 2010
48 C Hill L Berthon P Bros J-P Dancausse and D Guillaneux Nuclear Energy
Agency 7th Information Exchange Meeting Session II 2002
49 S Bourg C Hill C Caravaca C Rhodes C Ekberg R Taylor A Geist G
Modolo L Cassayre G de Angelis A Espartero S Bouvet N Ouvrier Nucl Eng
Des 2011 241 3427 G Modolo A Wilden A Geist D Magnusson R Malmbeck
Radiochim Acta 2012 100 715
50 A Geist U Muumlllich D Magnusson P Kaden G Modolo A Wilden T Zevaco
Solv Extr Ion Exchange 2012 30 433
51 A Wilden C Schreinemachers M Sypula G Modolo Solv Extr Ion Exch 2011
29 190
52 FW Lewis LM Harwood MJ Hudson MGB Drew V Hubscher-Bruder V
Videva F Arnaud-Neu K Stamberg and S Vyas Inorg Chem 2013 52 4993-5005
53 E Aneheim C Ekberg A Fermvik M R St J Foreman T Retegan and G
Skarnemark Solv Extr Ion Exch 2010 284 437-458
54 M Wei X Liu and J Chen J Radioanal Nucl Chem 2012 291 717-723
55 G Modolo P Kluxen A Geist Radiochim Acta 2010 98 193
56 C Rostaing C Poinssot D Warin P Baron and B Lorrain Procedia Chem 2012
7 349-357
57 S Chapron C Marie G Arrachart M Miguirditchian and S Pellet-Rostaing Solv
Extraction and Ion Exchange 2015 33 236-248
58 M Milsson and K L Nash Solvent Extraction and Ion Exchange 2009 273 354-
377
59 G Lumetta AV Gelis and GF Vandegrift Solv Extraction and Ion Exchange
2010 28 3 287-312
80
60 B Weaver and T A Kappelmann Talspeak A new method of separating americium
and curium from the lanthanides by extraction from an aqueous solution of an
aminopolyacetic acid complex with a monoacidic organophosphate or phosphonate
Oak Ridge National Laboratory 1964 1-60
61 K W Raymond General Organic and Biological Chemistry An Integrated
Approach John Wiley amp Sons USA 3rd edn 2010 7 253
62 L Karmazin M Mazzanti C Gateau C Hill and J Peacutecaut Chem Commun 2002
2892-2893
63 KL Nash Actinide Solution Chemistry Proceedings of the Eighth Actinide
Conference Actinides 2005
64 M P Jensen and A H Bond J Am Chem Soc 2002 124 9870-9877
65 L R Martin B J Mincher and N C Schmitt J Radioanal Nucl Chem 2009
282 523-526
66 S Oumlzҫubukҫu K Mandal S Wegner M P Jensen and C He Inorg Chem 2011
50 7937-7939
81
2 COMPLEXATION STUDIES OF Ln amp An WITH DTPA AND BUFFERS
UNDER TALSPEAK CONDITIONS
DTPA (diethylenetriaminepentaacetic acid) is an amino polycarboxylic acid
used to act as a holdback reagent in the TALSPEAK process (Trivalent Actinide
Lanthanide Separation by Phosphorus reagent Extraction from Aqueous Complexation)
an advanced reprocessing technique currently being developed in the USA (Section
137) DTPA is the chelating agent used as it has been shown to complex more strongly
to trivalent minor actinide ions (MA3+
) than lanthanide ions (Ln3+
) in aqueous solution
allowing selective extraction of lanthanides into an organic phase by organophosphate
HDEHP (di-(2ethylhexyl)phosphoric acid) to separate the two components
21 Introduction to An-DTPA and Ln-DTPA Complexes
It is widely known that DTPA ligands bind very well to metal ions in aqueous
media It is commonly used to extract heavy metals from soils for environmental
reasons1 and to treat heavy metal poisoning through its ability to chelate to heavy
metals making them more water soluble and able to be removed from the body
naturally by excretion2 Lanthanide DTPA complexes have been well established
although there is actually very little structural data available on them Most literature
references to lanthanide DTPA complexes discuss their use as MRI contrast agents the
most common choice being Gd-DTPA3 Other reported applications of DTPA-based
lanthanide complexes are for use as biological luminescent probes particularly with Eu4
and Tb5 Due to the highly hygroscopic nature of Ln-DTPA complexes solid state
structural analysis has only been reported in two instances as molecular structures
determined by X-ray absorption spectroscopy (XAS) one for Gd(III)-DTPA (Figure
21) and one for Eu(II)-DTPA6 Most solution state structural analysis for lanthanide
DTPA complexes has been carried out recently in order to better understand MALn
separation and TALSPEAK chemistry The only literature available on An-DTPA
complexes is related to separations chemistry except for actinium-DTPA used in
radiotherapy7
82
Figure 21 XAS molecular structure of Gd(III)-DTPA8
211 Stability of Ln-DTPA and An-DTPA Complexes
Reports on the formation of trivalent actinide complexes with DTPA detail that
the stability of AnDTPA2-
complexes (the dominant DTPA species present at pH 36
which is the pH currently used in the TALSPEAK process) is greater than the stability
of LnDTPA2-
complexes allowing the selective extraction on Ln3+
to take place For
LnDTPA2-
complexes stability constants range from log β = 1948 for La increasing
across the series up to log β = 2283 for Dy (with a slight dip at Gd) decreasing slightly
for the heavier Ln3+
complexes
Stability constants in the literature for AnDTPA2-
have been determined by a
range of techniques including TRLFS CE-ICP-MS spectrophotometry and solvent
extraction and range from log β = 2257 to 2403 for AmDTPA2-
and from log β = 2238
- 2348 for CmDTPA2-
at an ionic strength (I) of 01 M However there is some dispute
on whether AnHDTPA- complexes are also present in solution and this needs to be
accounted for when calculating stability constants as some of these values have been
determined with and some without consideration of AnHDTPA-9101112
Studies conducted by Martin et al determined stability constants of log β =
2219 - 2085 for CmDTPA2-
at I = 1 M over a temperature range of 10-70 degC
compared to log β = 2131 - 2033 for EuDTPA2-
over the same temperature range The
complex EuHDTPA- was found to have a stability constant of log β = 227 - 210 under
TALSPEAK conditions Europium(III)is used as a standard comparison to Am3+
Cm3+
due to the close similarity in chemistry between the elements as a result of their
electronic structures This data clearly shows that the Cm3+
has a higher binding
83
strength to DTPA5-
than Eu3+
The greater exothermic enthalpy of complexation of
CmDTPA2-
than EuDTPA2-
(-407 kJ mol-1
vs -336 kJ mol-1
) determined by
microcalorimetry indicated stronger covalent bonding of Cm3+
to DTPA5-
than Eu3+
Luminescence spectroscopy carried out in support of these studies found that
CmDTPA2-
has a shorter luminescence lifetime than EuDTPA2-
(268 micros in H2O 815 micros
in D2O for Cm3+
cf 630 micros in H2O 6200 micros in D2O for Eu3+
) This along with the
biexponential decay pattern indicating the presence of two species for Cm3+
was
attributed to faster exchange between Eu3+
and the ligandsolvent than for Cm3+
suggesting that the exchange for Eu3+
is not distinguishable on the luminescence
timescale and therefore less susceptible to the associated quenching effects This may be
due to the more ionic bonding of Eu3+
to the ligand
The pKa for the protonation of MDTPA2-
to MHDTPA- (M = metal ion) is 227
for Eu and 025 for Cm indicating that CmHDTPA- is only likely to be present in
solutions of very low pH (pH ltlt 1) It was hypothesised that the presence of
LnHDTPA- facilitates the exchange between ligand and solvent explaining the
observed difference in luminescence lifetime data consistent with stronger
complexation of MA3+
to DTPA and slower kinetics of MA3+
extraction as the
MDTPA2-
is less likely to dissociate13
212 Co-ordination Chemistry of Ln-DTPA and An-DTPA Complexes
It is known that Ln3+
ions co-ordinate to DTPA5-
in aqueous solution at pH 36
through the 5 deprotonated carboxylate groups (COO-) on the molecule and through the
three nitrogen atoms on the DTPA backbone forming an octadentate complex with one
water molecule in its inner hydration sphere giving the Eu3+
ion a co-ordination number
of 9 in the shape of a distorted capped square antiprism This is also the case for the
LnHDTPA- species
Figure 22 Chemical structure of [Eu(DTPA)]2-
84
The co-ordination mode of DTPA5-
to MA3+
is the same as for Ln3+
octadentate
(Figure 21) with a co-ordination number of 9 due to 1 water molecule bound to the
metal ion Hydration numbers of 2 have been reported for Cm-DTPA complexes but
have been found not to be stable14
DFT optimisation of CmDTPA2-
and EuDTPA2-
structures conducted by Martin
et al found that the M-O bond lengths were similar for both metal ions but that the M-
N bond lengths were shorter for Cm3+
than Eu3+
(by 004-008 Aring) Considering that
Cm3+
has a larger ionic radius than Eu3+
this suggests that Cm3+
binds more strongly to
the intermediate N donors on the DTPA molecule Further optimisations showed that
significant changes in bond lengths upon protonation of MDTPA2-
to MHDTPA-
indicated that M-N interactions are weakened to a greater extent for Cm3+
than Eu3+
so
that MHDTPA- is less likely to form for Cm
3+ in solution than Eu
3+ This data is
consistent with the pKa data for the complexes (Section 211)
22 Ln-DTPA Complexation Studies
As a first experiment (in order to verify the experimental procedures for
subsequent studies) the complex [Eu(DTPA)H2O]2-
was formed from europium nitrate
(1 mM) and Na5DTPA (005 M) in H2O and D2O at pH 36 and characterised by 1H
NMR spectroscopy (for the complex in D2O) and luminescence spectroscopy (D2O and
H2O)
221 1H NMR Studies of Ln-DTPA
1H NMR spectra are difficult to fully assign for Ln
3+ DTPA complexes due to
both the paramagnetic nature of the ions and the (fast) chemical exchange of the CH2
carboxylate and ethylene diamine backbone protons which results in significant
spectral broadening However complex formation can be verified at lower temperatures
(here 5 degC) where this conformational exchange is slowed down so the paramagnetic
broadening and shifting of the CH2 DTPA proton resonances can be observed in the 1H
NMR spectrum (Figure 23) by comparison with uncomplexed DTPA (Figures 24a-c)
85
EUDTPAESP
15 10 5 0 -5 -10 -15 -20
Chemical Shift (ppm)
0
0005
0010
0015
0020
0025
0030
0035
0040
0045
0050
0055
Norm
alized Inte
nsity
152
8
99
196
6
88
4
53
7
42
536
033
528
7
15
8
-01
1
-16
1
-40
6
-57
3-6
33
-105
3
-126
8
-148
3
-170
2
-184
7
Figure 23 1H NMR spectrum of [Eu(DTPA)]
2- in D2O at 278 K at pD = 36
DTPA pH71resp
55 50 45 40 35 30 25 20
Chemical Shift (ppm)
0
0005
0010
0015
0020
0025
0030
0035
0040
0045
0050
0055
0060
Norm
alized Inte
nsity
199100215418
DEUTERIUM OXIDE
Water
38
1
34
033
833
632
8
30
630
530
3
a
86
DTPA pH361resp
55 50 45 40 35 30 25 20
Chemical Shift (ppm)
0
0005
0010
0015
0020
0025
0030
0035
0040
0045
0050
0055
0060
Norm
alized Inte
nsity
204206100421
Water
47
647
5
38
5
35
634
634
434
3
31
531
431
2
DTPA pH21resp
55 50 45 40 35 30 25 20
Chemical Shift (ppm)
0
0005
0010
0015
0020
0025
0030
0035
0040
0045
0050
0055
0060
Norm
alized Inte
nsity
202199100406
Water
47
5 46
9
39
0
35
4
34
033
933
7
31
130
930
8
Figure 24 1H NMR spectra of DTPA in D2O at 278 K at varying pD a) pD 7
[DTPA]5-
b) pD 36 [H3DTPA]2-
c) pD 2 [H5DTPA]
222 Luminescence Studies of Ln-DTPA
Emission spectra were recorded for Eu
3+ (1 mM) with and without DTPA
5- (005
M) present in aqueous solution (Figure 25) following 397 nm excitation directly into
the 5L6 f-f absorption band
15 The formation of [Eu(DTPA)]
2- can be observed by the
splitting of the peaks in the emission spectrum of the complex compared to the free
Eu3+
(aq) representing the 5D0 rarr
7FJ transitions where J = 0 1 2 3 and 4 This is due to
crystal field splitting caused by the ligand and is indicative of strong binding of the
ligand to Eu3+
ion at pH 361617
The emission intensity is also significantly enhanced
upon the complexation of Eu3+
to DTPA5-
as the chelating ligand forms an octadentate
b
c
87
complex significantly lowering the degree of quenching of the emission by surrounding
solvent molecules
Figure 25 Emission spectrum of Eu3+
(aq) and [Eu(DTPA)]2-
in D2O at pD 36
Additionally the luminescence lifetimes of the free Eu3+
(aq) and the
[Eu(DTPA)]2-
complex were measured in D2O and H2O This allows calculation of q
which represents the number of bound solvent molecules in the inner hydration sphere
of the metal ion The original Horrocks equation18
(Equation 19) and modified
Horrocks equation1920
for q lt 2 (Equation 110) are shown below
Equation 21
Equation 22
The Horrocks equation uses the emission lifetimes (τ) to determine q A is the
proportionality constant taking into account the inner hydration sphere and B is a
correction factor taking into account the outer hydration sphere A and B values are
experimentally determined constants and are available for Sm3+
Eu3+
Tb3+
Nd3+
Yb3+
Am3+
and Cm3+
The q values can be effectively determined from solutions of water and
methanol For the original Horrocksrsquo equation A = 105 for Eu3+
and A = 42 for Tb3+
and for the modified Horrocksrsquo equation (when q lt 2 ) A = 12 ms and B = (025 ndash
0
2
4
6
8
10
12
14
16
18
550 570 590 610 630 650 670 690 710
Emis
sio
n In
ten
sity
(au
) x
10
00
0
Wavelength (nm)
[Eu(DTPA)]2-
Eu3+
5D0 rarr 7F0
5D0 rarr 7F1
5D0 rarr 7F2
5D0 rarr 7F3
5D0 rarr 7F4
88
0075x) ms-1
(where x = the number of exchangeable N-H oscillators) for Eu3+
and A =
5 ms and B = 006 ms-1
for Tb3+
The q value was found to be 9 for Eu3+
(aq) suggesting that the Eu3+
ion is
surrounded by 9 solvent molecules forming [Eu(H2O)9]3+
in aqueous solution as
expected For [Eu(DTPA)]2-
formed at pH 36 q was found to be 14 plusmn 02 showing that
only 1 water molecule is bound to the metal ion This compares well to the literature
values reported at pH 7 where the lifetimes are similar and q = 1121
23 An-DTPA Complexation Studies
The aminopolycarboxylate DTPA5-
chelates even more strongly to An3+
ions
than Ln3+
ions Preliminary 1H NMR and luminescence analyses were carried out by
Louise Natrajan at KIT-INE in Karlsruhe Germany on Am3+
and Cm3+
complexation
with DTPA as part of the FP7 EURACT-NMR scheme (Scheme 21)
Scheme 21 Complexation of DTPA to Am3+
and Cm3+
231 1H NMR Studies of An-DTPA
The complex [Am(DTPA)xH2O]2-
was formed and analysed by 1H NMR in a
41 ratio of MeODD2O with an additional drop of NaOD to ensure complex formation
from a dried acidic americium nitrate stock salt and Na5DTPA The spectra were taken
over a temperature range of 210-365 K at ~ pD 3 (Figure 26) Note here that the exact
pD of the solution could not be accurately measured due to the high specific activity of
the 241
Am isotope used From the spectrum it can be seen that at pD 3 there is a DTPA
complex formed and that at higher temperatures there are some dynamic exchange
processes occurring as the resonances become broader and the spectrum becomes
simpler This is most likely due to conformational changes in the DTPA ligand
(movement of the carboxylates and the ethylene bridge protons analogous to DOTA
and DO3A derivatives)22
The Am3+
ion is essentially diamagnetic as it has a 7F0 ground state and the
magnetic moment is calculated as 0 based on the Russell Saunders coupling scheme
89
The same is true for the isoelectronic lanthanide analogue Eu3+
but in this ion
significant paramagnetism is induced at room temperature due to low-lying energy
levels that are thermally populated according to the Boltzmann distribution Thermal
mixing of J states induces a paramagnetic shift but in the case of Am3+
the second J
level lies much higher in energy (~ 4000 cm-1
higher) so may only be populated and
induce a paramagnetic shifting of proton resonances at higher temperatures2324
Indeed
a slight shift of the proton resonances with temperature is observed for
[Am(DTPA)xH2O]2-
potentially indicating a small contribution of the Am3+
7F1 excited
state to the chemical shift of the proton resonances
Figure 26 1H NMR spectrum for [Am(DTPA)xH2O]
2- in 41 vv MeODD2O with
NaOD over a temperature range at pH 3
232 Luminescence Studies of An-DTPA
Emission spectra were recorded for solutions of
243Cm
3+ (015 microM Cm
3+ in 32
mM HClO4 diluted to 1 mL with H2O) with and without Na5DTPA (02 M) present in
aqueous solution following direct excitation at 3966 nm into the f-f absorption band of
Cm3+
(Figure 27) The formation of [Cm(DTPA)]2-
can be observed by the immediate
formation of a new red shifted emission band at 607 nm attributed to the 6D72
8S72
transition in the complex compared to that in free Cm
3+(aq)
at 593 nm The f-f transitions
in Cm3+
are much more sensitive to the coordination environment than Ln3+
due to more
210 K
265 K
300 K
365 K
90
spin orbit coupling and the fact the 5f orbitals are more spatially diffuse than the 4f
orbitals resulting in a much greater difference in emission spectra upon complexation
for actinides than lanthanides
Figure 27 Emission spectrum of Cm3+
and [Cm(DTPA)]2-
in perchloric acid at pH 3
by direct excitation with a NdYAG pumped dye laser at 3966 nm
Similarly to Eu3+
the inner hydration sphere of the free Cm3+
ion is known to
contain 9 water molecules25
In 1998 Kimura and Choppin developed a modified
version of the Horrocks equation in order to allow q to be calculated from aqueousnon-
aqueous solvent mixtures (Equation 23)26
Equation 23
The lifetime of the [Cm(DTPA)]2-
complex in H2O is 510 micros and is significantly
longer than that of the aqua ion which is determined as 68 micros The radiative lifetime of
the complex can be directly inserted into this equation and indicates that there are 16
water molecules (between 1 and 2) co-ordinated to the metal ion again showing the
formation of an octadentate complex with DTPA ligand analogously to Eu3+
24 Introduction to Buffer Interaction with Ln3+
and Ln-DTPA Complexes
241 Interaction of Lactate with Ln3+
and Ln-DTPA Complexes
A lactic acidlactate buffer is used in the TALSPEAK process to buffer the
system to pH 36 Lactate (Lac) is known to co-ordinate to M3+
ions27
to form
40
45
50
55
60
65
70
75
80
570 590 610 630
Emis
sio
n In
ten
sity
(au
) Tho
usa
nd
s
Wavelength (nm)
Cm3+(aq)
[Cm(DTPA)]2-
91
M3+
(CH3CH(OH)COO-)3 Equations 24a-c show the formation of Eu
3+-lactate
complexes
Equation 24a-c
(a)
(b)
(c)
Stability constants for each of the species formed in Equations 24a-c were
determined by Martin et al over a temperature range of 0-70 degC Log β values were
found to be 290-281 for Eu(Lac)2+
log β = 490-449 for Eu(Lac)2+ and log β = 624-
633 for Eu(Lac)3 Luminescence spectroscopy of Eu-lactate formation showed that as
the concentration of lactate was increased from 0 mM to 73 mM the emission intensity
of the J=2 peak (5D0 rarr
7F2 transition) at 615-620 nm increased but the J=1 peak (
5D0 rarr
7F1 transition) at 590-600 nm was not significantly affected changing the J=1J=2 peak
ratio suggesting that the co-ordination mode of the lactate to the Eu3+
ion changes as a
function of lactate concentration as the J=1 peak is a magnetic dipole transition which is
insensitive to the co-ordination of the ion (Figure 28)28
Figure 28 Emission spectrum of Eu-lactate as a function of lactate concentration28
The luminescence lifetimes of Eu3+
in water also increased as the lactate
concentration was increased indicating that the number of water molecules directly co-
ordinated to the metal ion decreases from ~9 to ~5 due to complexation with lactate
Luminescence and thermodynamic data suggest that lactate co-ordinates in a bidentate
92
mode to Ln3+
ions through the deprotonated carboxylate group and also through the α-
hydroxyl group (Figure 29) making Ln-lactate complexes more stable than simple
monocarboxylates with monodentate co-ordination28
Figure 29 Co-ordination mode of lactate to Eu3+
28
The interaction of lactate ions with metal-DTPA complexes is less well
understood It is considered that there is an exchange between the Ln3+
ion and the
lactate and DTPA ligands The concentration of lactate has been shown by Nash et al to
affect the complexation and dissociation of [Ln(DTPA)]2-
however it is not understood
whether this is due to the changing pH with lactate concentration since extraction in the
TALSPEAK process is heavily dependent on pH29
TALSPEAK extractions using
lactate without DTPA show poor separation of Ln3+
over Am3+
DTPA is required to
achieve separation of MA3+
from Ln3+
as lactic acid acts only as a buffer and not a
holdback reagent
Research has shown previously that binary complexes are dominant in the
TALSPEAK process chiefly in the form of MDTPA2-
and M(Lac)n3-n
Studies carried
out using spectrophotometry luminescence spectroscopy and thermometric
experiments have shown that ternary M3+
-DTPA-lactate complexes with lactate co-
ordinated directly to the metal centre are only present in very small quantities and so
will have negligible effect on metal separation However it is possible that outer sphere
ternary M3+
-DTPA-lactate complexes may form where the lactate interacts with the
DTPA molecule although it is expected these would also be present only in minor
quantities and so would also have negligible effect on metal separation30
242 Interaction of Amino Acids with Ln3+
and Ln-DTPA Complexes
The potential of using amino acids as a combined buffer and soft donor was
considered as it was thought that the increased number of softer donors on amino acids
93
compared to lactate may remove the need for the separate buffer and DTPA holdback
reagent if amino acids were found to preferentially bind to MA3+
in solution There have
been few studies on the interaction of amino acids with lanthanide ions and none with
actinide ions or with DTPA Stability constants for amino acids with lanthanide ions31
can be found in the literature and like stability of lactate complexes with Ln3+
ions32
generally tend to increase across the lanthanide series from La-Lu as the Lewis acidity
of the metal ions increases The values are close to the stability constants for Ln-lactate
complexes averaging at around 5-6 depending on the metal ion and amino acid Log β
values for La-Sm with glycine range from 532-584 and with L-alanine log β = 582-
668
25 Studies on Buffer Interaction with M3+
and [M(DTPA)]2-
Initial studies in this area considered the interaction of various amino acids and
lactate with lanthanide ions in TALSPEAK systems The amino acids glycine L-alanine
and L-serine (Figure 210) were chosen to begin this research due to their similarity in
molecular structure to lactate and good solubility in water
Figure 210 Chemical structures of L-alanine (top) glycine (bottom left) and L-serine
(bottom right)
251 1H NMR Studies on Buffer Interactions
L-alanine (1 M) was added to Eu(NO3)3 (10 mM) in D2O and analysed by
1H
NMR spectroscopy (Figure 211) The spectrum shows that L-alanine complexes
weakly with the metal ion as there is minimal paramagnetic line broadening and only
slight shifting of the proton resonances from that of L-alanine itself (Figure 212)
94
New Eu Ala0011resp
55 50 45 40 35 30 25 20 15 10 05 0
Chemical Shift (ppm)
0
005
010
015
Norm
alized Inte
nsity
310100
CH3
CH
Water
47
147
1
35
5
12
712
6
Figure 211 1H NMR spectrum of Eu(NO3)3xH2O (10 mM) with L-alanine in D2O at
278 K
Ala1resp
55 50 45 40 35 30 25 20 15 10 05 0
Chemical Shift (ppm)
0
01
02
03
04
05
06
07
08
09
10
Norm
alized Inte
nsity
336100
CH3
CH
Water
36
536
336
2
13
3
Figure 212 1H NMR spectrum of L-alanine in D2O at 278 K
95
The interaction of L-alanine (1 M) with [Eu(DTPA)]2-
(10 mM) in D2O was also
investigated by 1H NMR spectroscopy (Figure 213) This spectrum shows that the L-
alanine does not bind to the europium DTPA complex on the experimental timescale as
there is no paramagnetic broadening or shifting of the amino acid peaks and the ligand
is present as uncomplexed ligand
EuDTPA Ala1esp
15 10 5 0 -5 -10 -15 -20
Chemical Shift (ppm)
0005
0010
0015
0020
0025
0030
0035
Norm
alized Inte
nsity
150
5 96
892
185
2
75
4
50
4
39
533
231
625
8
14
6
05
0
-13
1
-44
2
-63
3-6
86
-108
2
-127
6
-143
1
-169
0
-183
9
Figure 213 1H NMR spectrum of [Eu(DTPA)]
2- (10 mM) with L-alanine (1 M) in D2O
at 278 K
252 Luminescence Studies on Buffer Interactions
2521 Sensitisation Tests
Luminescence studies on a [Tb(DTPA)]2-
(1 mM) complex in the presence of
the amino acid L-phenylalanine (05 M) (Figure 215) at pH 3 were initially carried out
in order to determine if sensitised emission occurs whereby energy would be
transferred from the phenyl chromophore of the amino acid to the metal ion This could
potentially occur if the amino acid was in close proximity (ie bound) to the metal ion
and would give some indication into the interaction between the amino acid and the
metal ion However sensitised emission was found not to occur as when the complex
was excited in the region of the phenyl chromophore (250 nm) no emission occurred
When excited directly into the f-f region of the Tb3+
complex at 379 nm there was a
slight decrease in emission intensity upon the addition of L-phenylalanine however the
decrease is not significant The excitation spectrum was recorded of the emission at 545
96
nm and showed only the presence of f-f transitions and no contribution from the organic
region (Figure 214)
Figure 214 Emission spectra of [Tb(DTPA)]2-
in D2O at pD 3 with and without the
presence of L-phenylalanine (05 M) excited at 250 nm and 379 nm Excitation
spectrum of [Tb(DTPA)]2-
in D2O at pD 3 with L-phenylalanine (05 M) at 545 nm
Figure 215 Chemical structure of L-phenylalanine
2522 Aqueous Phase Lanthanide Studies without Na5DTPA
Emission spectra of Eu3+
(1 mM Eu(NO3)3) were taken in D2O and H2O with the
presence of different amino acidslactate (1 M) in order to determine whether the amino
acids bind to the metal ions at pH 36 (TALSPEAK pH) The emission spectrum of the
free metal ion in solution was also measured for comparison (Figure 216)
0
100
200
300
400
500
600
700
0
5
10
15
20
25
30
220 320 420 520 620
Ab
sorp
tio
n In
ten
sity
(au
) Th
ou
san
ds
Emis
sio
n In
ten
sity
(au
) Th
ou
san
ds
Wavelength (nm)
TbDTPA exc 379 nm
TbDTPA + Phe exc 250 nm
TbDTPA + Phe exc 379 nm
Excitation of TbDTPA + Phe at 545 nm
97
Figure 216 Emission spectra of Eu(NO3)3 in D2O at pD 36 with and without the
presence of amino acidslactate (1 M) excited at 395 nm at 298 K
The emission intensity increases upon the addition of amino acidslactate to Eu3+
in D2O This shows that the amino acids are interacting with the metal ion however the
emission spectra resemble that of the free aqua ion suggesting that the amino acids and
lactate are not binding to the metal ion The presence of the amino acids at such a high
concentration will reduce quenching effects from the surrounding solvent molecules
which may be one explanation for the increased emission intensity At pH 36 the
amino acids will be in their zwitterionic form (H3N+-CHR-COO
-) and so are likely to
co-ordinate with the free metal ion in the same manner as lactate however this co-
ordination appears to be very weak and they are probably in fast exchange with
surrounding water molecules
The q values of the Eu3+
ions were calculated from the luminescence lifetimes in
H2O and D2O using the original Horrocks equation (Equation 19) The results can be
seen in Table 21
0
2
4
6
8
10
12
14
550 570 590 610 630 650 670 690 710
Emis
sio
n In
ten
sity
(au
) x
10
00
0
Wavelength (nm)
Eu3+
Eu-Lactate
Eu-Gly
Eu-Ala
Eu-Ser
98
Table 21 Luminescence lifetimes and q values for Eu3+
with amino acidslactate
Estimated error on lifetimes = plusmn 10 and on q plusmn 02
The number of bound solvent molecules in the inner hydration sphere of Eu3+
decreases with the addition of amino acidslactate from 9 to approximately 6 This is
consistent with possible fast exchange of water molecules with co-ordinated amino
acids and shows that an average of 3 amino acidslactate ions are co-ordinating to the
metal
2523 Aqueous Phase Lanthanide Studies with Na5DTPA
Emission spectra of Eu(NO3)3 (1 mM) with Na5DTPA (01 M) were recorded in
D2O and H2O with the presence of different amino acidslactate (1 M) at pH 36 in order
to determine whether the amino acids bind to the complexed metal (Figure 217)
Figure 217 Emission spectra of Eu-DTPA in D2O at pD 36 with and without the
presence of amino acidslactate (1 M) excited at 395 nm
0
5
10
15
20
25
550 600 650 700
Emis
sio
n In
ten
sity
(au
) x
10
00
0
Wavelength (nm)
EuDTPA
EuDTPA-Lactate
EuDTPA-Gly
EuDTPA-Ala
EuDTPA-Ser
τ in H2O (ms) τ in D2O (ms) q
Eu3+
011 165 89
Eu Lactate 016 194 60
Eu Gly 016 183 60
Eu Ala 016 187 60
Eu Ser 019 147 48
99
The emission intensity does not change upon the addition of amino acidslactate
to [Eu(DTPA)]2-
in D2O These spectra also do not change shape and there is no
observable shift resembling that of the [Eu(DTPA)]2-
species suggesting that the amino
acids and lactate are not binding to the metal complex
The q values of the Eu3+
ions were calculated from the luminescence lifetimes in
H2O and D2O using the original Horrocks equation (Equation 19) The results can be
seen in Table 22
Table 22 Luminescence lifetimes and q values for [Eu(DTPA)]2-
with amino
acidslactate Estimated error on lifetimes = plusmn 10 and on q plusmn 02
From these kinetic data it is clear that q does not change for [Eu(DTPA)]2-
upon
the addition of amino acidslactate showing that there is no significant interaction with
the Eu3+
ion and they do not bind to the metal ion of the complex This may be due to
steric factors as the DTPA5-
is octadentate and fully complexed to the metal ion leaving
room for only 1-2 solvent molecules to bind to the ion and making it difficult for any
larger species to exchange
2524 Aqueous Phase Actinide Studies with Na5DTPA
In order to determine whether amino acids interacted any more with actinides
than lanthanides the emission spectrum of [Cm(DTPA)]2-
(1 mM) was taken with the
addition of L-alanine (25 mM) at KIT-INE Karlsruhe (Figure 218)
τ in H2O τ in D2O q
Eu DTPA 063 230 23
Eu DTPA Lactate 063 216 22
Eu DTPA Gly 065 203 20
Eu DTPA Ala 065 209 21
Eu DTPA Ser 065 208 21
100
Figure 218 Emission spectrum of [Cm(DTPA)]2-
in H2O with and without L-alanine
(25 mM) at pH 3 by direct excitation at 396 nm The spectra are reported uncorrected
for differences in the incident laser power for clarity
Upon addition of L-alanine there is no change in the emission spectrum - no red
shift or change in emission intensity (quantum yield) compared to complexation of
Cm3+
to DTPA5-
(Figure 26) Moreover the luminescence lifetime is the same as
[Cm(DTPA)]2-
and there is no change in the calculated value of q indicating either no
interaction of the L-alanine with the complex or a very weak interaction such as fast
exchange of the buffer and bound solvent molecules showing that the L-alanine does
not strongly interact with Cm3+
253 Radiolysis Studies on Amino Acid Buffered Systems
2531 Previous Studies at the INL
The TALSPEAK process is known to be relatively resistant to radiation effects
both alpha and gamma radiation when compared to the PUREX and SANEX
processes33
The use of lactic acid buffer has been shown to reduce the degradation of
DTPA by radiolysis34
although the chemistry of the lactic acidlactate ion interaction
with the system is still not clear α radiolysis experiments were carried out at INL by the
Martin group initially on lactic acid and then on an L-alanine system in order to
determine the temperature-dependent rate constants of the reaction of the hydroxyl
radical (middotOH) with the buffers at pH 3 (Figure 219) It is thought that at this pH
oxidising reactions are dominant since dissolved O2 in the solution would remove most
40
45
50
55
60
65
70
75
80
570 580 590 600 610 620 630 640
Emis
sio
n In
ten
sity
(au
) Tho
usa
nd
s
Wavelength (nm)
[Cm(DTPA)]2-
[Cm(DTPA)]2- + Ala
101
of the hydrated electrons (e-(aq)) and middotH radicals caused by radiolysis leaving middotOH
radicals present in solution The rate constants were measured using Linear Accelerator
(LINAC) electron pulse radiolysis
Measurements showed that the reaction rate of the middotOH radical with L-alanine is
slower than with lactic acid suggesting that a modified version of the TALSPEAK
process using amino acids would be more resistant to radiolysis
Figure 219 Graph illustrating the rates of reaction of the middotOH radical with L-
alanine compared to lactic acid and the lactate ion 35
Further studies at the INL were carried out on the L-alanine to measure the
effect of γ-radiation on the separation of Eu3+
from Am3+
These studies were carried
out by varying the γ radiation dose (5 ndash 50 kGy) the pH (2 ndash 3) and the L-alanine
concentration (05 ndash 15 M) The extraction of Ln3+
ions was found not to be affected by
increasing the dose to both phases and the extraction of Am3+
was found to increase
only slightly as the dose was increased (Figure 220) The results show that the effect of
γ-radiation on the separation factors is negligible with increasing dose (Table 23)
32 33 34 3517
18
19
20
21
Alanine (pH 30)
Lactate ion (pH 60)
Lactic acid (pH 10)
ToC k M
-1 s
-1Error
1046 59E7 49E6
306 849E7 421E6
305 832E7 419E6
402 102E8 816E6
Arrhenius OH amp lactate at pH 30
Int ln(A) = 2353 plusmn 115
Ea = 1333 plusmn 289 kJ mol-1
R2 = 0990
ln (
kM
-1 s
-1)
103Temp (K)
102
Figure 220 Distribution ratios for Ln3+
and Am3+
in the presence of L-alanine
at 05 M pH 2 at different doses of γ-radiation36
Table 23 Separation factors for Eu3+
Am3+
in the presence of L-alanine at 05 M under
TALSPEAK conditions when subjected to different doses of γ-radiationError Bookmark
not defined
Separation Factor EuAm
5 kGy 10 kGy 50 kGy 100 kGy
pH 2 5620 5519 5132 5103
pH 3 1595 1653 1589 1252
2532 Irradiation Studies using Amino Acid Buffers
The [Eu(DTPA)]2-
systems at pH 36 were irradiated with γ radiation using a
60Co irradiator at the Dalton Cumbrian Facility to determine the effect of radiation on a
range of amino acid buffers
103
Figure 221 Emission spectra of Eu3+
in D2O at pD 36 with and without the presence
of amino acidslactate excited at 395 nm before 5 kGy γ-irradiation
Figure 222 Emission spectra of Eu3+
in D2O at pD 36 with and without the presence
of amino acidslactate excited at 395 nm after 5 kGy γ-irradiation
The emission intensity of the irradiated samples (Figure 222) was lower than
before irradiation (Figure 221) which is likely to be due to quenching effects from
radicals produced by degradation of the solvent However the spectral profiles remain
0
50
100
150
200
250
550 600 650 700
Emis
sio
n In
ten
sity
(au
) Th
ou
san
ds
Wavelength (nm)
EuDTPA
EuDTPA-Lactate
EuDTPA-Gly
EuDTPA-Ala
EuDTPA-Ser
0
20
40
60
80
100
120
140
550 600 650 700
Emis
sio
n In
ten
sity
(au
) Th
ou
san
ds
Wavelength (nm)
EuDTPA
EuDTPA-Lactate
EuDTPA-Gly
EuDTPA-Ala
EuDTPA-Ser
104
the same and still resemble that of [Eu(DTPA)]2-
and t-tests showed that there was no
significant difference between the spectra of each of the buffers
The luminescence lifetimes were also measured for samples before and after
irradiation and before and after extraction into an organic phase (02 M HDEHP in
dodecane) (Table 24)
Table 24 Luminescence lifetimes for aqueous and organic phases for
[Eu(DTPA)]2-
systems before and after irradiation at pH 36 Estimated error on
lifetimes = plusmn 10
Table 25 Luminescence lifetimes and q values for [Eu(DTPA)]2-
systems before and
after irradiation at pH 36 Estimated error on lifetimes = plusmn 10 and on q = plusmn 02
τ of aqueous
phase
before
irradiation
(ms)
τ of aqueous
phase
after
irradiation
(ms)
τ of
organic
phase
before
irradiation
(ms)
τ of
organic
phase
after
irradiation
(ms)
Eu DTPA 063 066 222 262
Eu DTPA Lactate 063 063 241 251
Eu DTPA Gly 065 064 247 249
Eu DTPA Ala 065 065 211 238
Eu DTPA Ser 065 062 260 251
τ of
aqueous
phase
before
irr [H2O]
(ms)
τ of
aqueous
phase
after
irr[H2O]
(ms)
τ of
aqueous
phase
before irr
[D2O] (ms)
τ of
aqueous
phase
after irr
[D2O] (ms)
q
before
irr
q after
irr
Eu DTPA 063 066 230 227 11 10
Eu DTPA
Lactate
063 063 216 210 10 10
Eu DTPA
Gly
065 064 203 208 10 10
Eu DTPA
Ala
065 065 209 211 10 10
Eu DTPA
Ser
065 062 208 206 10 10
105
There was negligible change in luminescence lifetime before and after
irradiation for both aqueous and organic sample sets There was also no change in
hydration number q before and after irradiation of the aqueous phase (Table 25)
These data along with the consistent profiles of the emission spectra is analogous with
the radiolysis data from the INL and shows that the amino acid buffers glycine alanine
and serine are relatively resistant to -radiolysis
254 Buffer Interaction Summary
The potential of using amino acids as a combined buffer and soft donor was
initially investigated by considering the interaction of the buffers glycine L-alanine L-
serine L-phenylalanine and lactate (for comparison) with Eu3+
and [Eu(DTPA)]2-
systems It was found by 1H NMR and luminescence spectroscopies that amino acids
and lactate do not form stable complexes with either the free metal ion or the metal-
DTPA complex and that the buffers may be in fast exchange with surrounding solvent
molecules Luminescence studies on L-phenylalanine showed that this amino acid does
not bind to the metal ion as there was no sensitised emission from Tb3+
ion when
excited into the phenyl chromophore of the amino acid when the two components were
in solution Emission spectra of Eu3+
and Cm3+
aqua ions and their corresponding
DTPA complexes showed no change (no peak splitting or shifting) upon the addition of
amino acidslactate
The number of water molecules in the inner hydration sphere (q) of Eu3+
was
reduced from 9 to ~6 when buffers were added to the aqua ion in solution suggesting
that the amino acids are interacting with the metal ion but are likely to be in fast
exchange with surrounding solvent molecules There was no change in q when buffers
were added to metal-DTPA complexes in solution for Eu3+
or Cm3+
Radiolysis studies were carried out on lactate and amino acid buffered
[Eu(DTPA)]2-
systems and it was found that the systems are relatively resistant to γ-
radiation when exposed to 5 kGy This is consistent with previous work conducted by
the INL showing that separation systems using L-alanine as a buffer are more resistant
to radiolysis than the original TALSPEAK process using lactate
106
1 G Muumlhlbachovaacute Rostlinnaaacute Vyacuteroba 2002 48 12 536ndash542
2 JSF Swaran and V Pachauri Int J Environ Res Public Health 2010 7 7 2745-
2788
3 M Regueiro-Figueroa and C Platas-Iglesias J Phys Chem A 2015 119 6436-
6445
4 N Mignet Q de Chermont T Randrianarivelo J Seguin C Richard M Bessodes
and D Scherman Eur Biophys J 2006 35 155-161
5 CL Davies and A-K Duhme-Klair Tetrahedron Lett 2011 52 4515-4517
6 G Moreau L Burai L Helm J Purans and AE Merbach J Phys Chem A 2003
107 758-769
7 KA Deal IA Davis S Mirzadeh SJ Kennel and MW Brechbiel J Med Chem
1999 42 15 2988ndash2992
8 S Beacutenazeth J Purans M-C Chalbot MK Nguyen-van-Duong L Nicolas K
Keller amp A Gaudemer Inorg Chem 1998 37 3667-3674
9 A Delle Site RD Baybarz J Inorg Nucl Chem 1969 31 2201
10 IA Lebedev VT Filimonov AB Shalinets GN Yakovlev Sov Radiochem
1968 10 94
11 I Bayat KFK
Berichte-1291 Karlsruhe Germany 1970
12 P Thakur JL Conca CJ Dodge AJ Francis GR Choppin Radiochim Acta
2013 101 221
13 G Tian LR Martin and LRao Inorg Chem 2015 54 1232-1239
14 S Leguay T Vercouter S Topin J Aupais D Guillaumont M Miguirditchian P
Moisy and C Le Naour Inorg Chem 2012 51 12638-12649
15 M Nazarov and D Young Noh New Generation of Europium and Terbium
Activated Phosphors 2011 247
16 K N Shinde S J Dhoble H C Swart and K Park Phosphate Phosphors for Solid
State Lighting Springer Series in Materials Science Springer 2012 174 41-59
17 K S Wong T Sun X-L Liu J Pei and W Huang Thin Solid Films 2002 417 85-
89
18 WD Horrocks and DR Sudnick J Am Chem Soc 1979 101 334
19 A Beeby IM Clarkson RS Dickins S Faulkner D Parker L Royle AS de
Sousa JAG Williams and M Woods J Chem Soc Perkin Trans 2 1999 493-504
20 RM Supkowski and WD Horrocks Inorg Chim Acta 2002 340 44-48
107
21 CF Geraldes AD Sherry WP Cacheris KT Kuan RD 3rd Brown SH
Koenig and M Spiller Magn Reson Med 1988 8 2 191-9
22 E Csajboacutek I Baacutenyai and E Bruumlcher Dalton Trans 2004 14 2152-2156
23 JJ Howland and M Calvin J Chem Phys 1950 83 239
24 J E Sansonetti and W C Martin Handbook of Basic Atomic Spectroscopic Data
httpphysicsnistgovPhysRefDataHandbookTables National Institute of Science
and Technology USA 2005
25 T Kimura and G R Choppin J Alloys Compounds 1994 213 313
26 T Kimura Y Kato H Takeishi and G R Choppin J Alloys Compounds 1998
271273 719
27 T L Griffiths Investigations of Ternary Complexes Relevant to the Nuclear Fuel
Cycle 2011 The University of Manchester PhD Thesis
28 G Tian LR Martin and L Rao Inorg Chem 2010 49 10598-10605
29 K L Nash D Brigham T C Shehee and A Martin Dalton Trans 2012 41
14547-14556
30 CJ Leggett G Liu and MP Jensen Solv Extraction and Ion Exchange 2010 28
313-334
31 A Miličević and N Raos Acta Chim Slov 2014 61 904-908
32 VV Nikonorov J Anal Chem 2010 65 4 359-365
33 D Magnusson B Christiansen R Malmbeck and JP Glatz Radiochim Acta 2009
97 9 497-502
34 B Weaver and T A Kappelmann Talspeak A new method of separating americium
and curium from the lanthanides by extraction from an aqueous solution of an
aminopolyacetic acid complex with a monoacidic organophosphate or phosphonate
Oak Ridge National Laboratory 1964 1-60
35 LR Martin S P Mezyk and BJ Mincher J Phys Chem A 2009 113 141-145
36 Dr Leigh Martin Idaho National Laboratory unpublished results
108
3 SOLVENT EXTRACTION AND OPTIMISATION STUDIES WITH AMINO
ACID BUFFERS
As discussed in Chapter 2 the potential of using amino acids as a combined
buffer and soft donor to replace the lactate buffer and holdback reagent DTPA
(diethylenetriaminepentaacetic acid) in the TALSPEAK process (Trivalent Actinide
Lanthanide Separation by Phosphorus reagent Extraction from Aqueous Complexation)
was investigated Initial complexation studies by 1H NMR and luminescence
spectroscopies showed that amino acids do not form stable complexes with actinide or
lanthanide ions or AnLn-DTPA complexes in aqueous solution and that like lactate
they are in fast exchange with surrounding water molecules Separation studies were
carried out by our collaborators at the Idaho National Lab (Travis Grimes Richard
Tillotson and Leigh Martin) to determine whether amino acids could be used as buffers
or as combined bufferssoft-donors to facilitate Ln3+
MA3+
separation A summary of
this work can be found below in Section 31 Their initial studies were used as the basis
for the work conducted as part of this research project (Sections 32 and 33)
31 Previous work at the INL1
311 L-alanine Studies
3111 pH Studies on L-alanine
L-alanine was initially chosen as a potential replacement for lactic acid as a
buffer as the two molecules differ only by the α-group (α-amino on L-alanine compared
to α-hydroxy group on lactic acid) The pKa values of the compounds are 24-26 for L-
alanine and 36-38 for lactic acid depending on the background electrolyte Studies
carried out on the L-alanine found that the separation factors were in fact reduced
compared to the traditional TALSPEAK method when L-alanine was used as a buffer at
pH 2 and pH 3 in place of lactic acid The separation factors were generally lower as the
distribution ratios for Am3+
(DAm) were significantly increased (2 orders of magnitude
higher) when L-alanine was used at pH 3 (DAm 012) and pH 2 (DAm 038-047)
compared to lactic acid at pH 3 (DAm 0009) However the studies carried out at pH 2
resembled a typical TALSPEAK curve and gave overall the best separation of
lanthanides over Am3+
as can be seen in Figure 31 Although separation occurs in the
L-alanine system at pH 3 the separation is better at pH 2 At pH 3 it can be seen that
separation is decreased for the heavier lanthanides This is due to slow phase-transfer
kinetics previously reported by Weaver and Kappelmann2 and Kolarik
3 A pH 1 system
109
does not allow separation of the earlier lanthanides from americium The distribution
ratios for lanthanides in a typical TALSPEAK system can be seen in Figure 32 for
comparison
086 088 09 092 094 096 098 1
10-2
10-1
100
101
102
5x10²
086 088 09 092 094 096 098 1
10-2
10-1
100
101
102
5x10²
pH 1
pH 2
pH 3
Am pH 1
Am pH 2
Am pH 3
[Alanine] = 05 M
[DTPA] = 0050 M
[HDEHP] = 02 M
Organic Diluent
Dodecane
DM
1r Aring
DM
15 M Alanine
10 M Alanine
05 M Alanine
Am 15 M Alanine
Am 10 M Alanine
Am 05 M Alanine
[DTPA] = 0050 M
[HDEHP] = 02 M
Organic Diluent
Dodecane
pH 2
1r Aring
Figure 31 The effect of pH on an L-alanine-buffered TALSPEAK system
Figure 32 Distribution ratios of Ln3+
Y3+
in a TALSPEAK system 1 mM LnY3+
1 M
lactate 005 M DTPA pH 7 extracted using 05 M HDEHP in 14-DIPB4
110
3112 Concentration Effects
The effect of the concentration of L-alanine was also considered and it was
found that the effect on the trend of separation factors across the lanthanide series was
the same as for lactate and the changes were negligible as can be seen from Figure 33
Slower extraction rates were observed for the heaviest lanthanides at lower buffer
concentrations (05 M than 10 or 15 M) for both L-alanine and lactic acid Since it was
found that there was no benefit to changing the L-alanine buffer concentration further
studies were carried out to investigate the potential of using the amino acid to carry out
the process at the lower pH of 2 as although the separation factors are lower than in
lactic acid buffered systems the values are still high enough to give sufficient
separation (see Table 31)
086 088 09 092 094 096 098 1
10-2
10-1
100
101
102
5x10²
086 088 09 092 094 096 098 1
10-2
10-1
100
101
102
5x10²
pH 1
pH 2
pH 3
Am pH 1
Am pH 2
Am pH 3
[Alanine] = 05 M
[DTPA] = 0050 M
[HDEHP] = 02 M
Organic Diluent
Dodecane
DM
1r Aring
DM
15 M Alanine
10 M Alanine
05 M Alanine
Am 15 M Alanine
Am 10 M Alanine
Am 05 M Alanine
[DTPA] = 0050 M
[HDEHP] = 02 M
Organic Diluent
Dodecane
pH 2
1r Aring
Figure 33 The effect of buffer concentration on an L-alanine-buffered TALSPEAK
system
111
Table 31 Distribution ratios and separation factors for a number of L-alanine buffered
TALSPEAK systems as pH and buffer concentration are varied compared to a
traditional lactic acid system
Conc pH DAm Separation Factors (SF)
(M) LaAm CeAm NdAm EuAm
L-Alanine 15 2 038 plusmn 001 165 plusmn 5 61 plusmn 1 28 plusmn 1 64 plusmn 1
L-Alanine 10 2 039 plusmn 002 176 plusmn 10 54 plusmn 3 24 plusmn 1 55 plusmn 3
L-Alanine 05 2 047 plusmn 006 165 plusmn 24 64 plusmn 3 28 plusmn 8 66 plusmn 8
L-Alanine 05 3 012 plusmn 001 147 plusmn 17 45 plusmn 5 9 plusmn 1 25 plusmn 3
Lactic
Acid
10 3 0009 380 140 mdash 91
3113 Studies at pH 2
Further investigations at pH 2 into the potential of using amino acids as a
combined buffer and soft donor showed that no separation occurs when DTPA is not
present indicating that amino acids do not act as holdback reagents in their own right
Previous work by Tanner and Choppin5 showed that at low pH the glycine zwitterion
forms inner-sphere monodentate complexes with M3+
ions including Ln3+
and An3+
Aziz et al67
later showed the same is true for L-alanine with Eu3+
and Am3+
at pH 36
whereby weak monodentate complexes form Krishnan and Plane8 showed that glycine
complexes metal ions solely through the COO- group on the amino acid No co-
ordination through the amino group has been reported
312 Other Amino Acids
Other amino acids L-arginine L-histidine and L-methionine were also
considered and further investigations were carried out (Figure 34) These three amino
acids are larger and more hydrophobic than L-alanine and are therefore less soluble at
higher concentrations (lt05 M) at pH values greater than pH 1 Again no separation
was observed when the amino acids were used without DTPA With Na5DTPA it was
found that the DAm values for Arg and Met were lower than those for L-alanine leading
to an increase in separation factor possibly due to co-ordination of the Am3+
ion with
soft donor atoms on the amino acids (Table 32) The DAm in the His system however
was similar to the Ala system suggesting that there is no coordination of the metal ion
112
with the α-amine or imidazole groups It is not known if the amino acids are co-
ordinating or chelating through soft donor atoms to the metal ion Further studies are
currently being carried out at the INL to determine stability constants and to use time-
resolved fluorescence to probe inner co-ordination sphere changes in order to
investigate the interactions of amino acids with the trivalent metal ions
Figure 34 Chemical structures of L-arginine (top) L-histidine (bottom left)
and L-methionine (bottom right)
Table 32 Distribution ratios and separation factors for a number of amino acid
buffered TALSPEAK systems
When extended further studies on these amino acids found that the kinetic
issues which affected separation of the heavier lanthanides using L-alanine at pH 3
(Figure 31) were also affecting separation with L-arginine at pH 2 as well as pH 3
Conc pH pKa DAm3+ Separation Factors (SF)
(M) LaAm CeAm NdAm EuAm
L- Arg 05 2 182 027 plusmn 001 184 plusmn 26 40 plusmn 3 27 plusmn 2 72 plusmn 4
L- His 05 2 180 040 plusmn 001 208 plusmn 8 95 plusmn 3 24 plusmn 5 83 plusmn 1
L-Met 05 2 213 017 plusmn 001 271 plusmn 18 97 plusmn 3 26 plusmn 1 60 plusmn 3
113
suggesting that longer chain amino acids may not suitable replacements for lactate
Based on these data the most promising replacement buffer is L-alanine at pH 2
32 L-alanine System Optimisation at pH 2
Following from the initial work carried out by Grimes et al at the INL further
studies were begun for this research project The speciation of DTPA was modelled
using HySS (Hyperquad Simulation and Speciation) software using literature pKa
values (Figure 35)9 At pH 1 the dominant DTPA species present in solution are
H7DTPA2+
and H6DTPA+ which both repel MA
3+ and Ln
3+ ions and so the species are
ineffective as holdback reagents At pH 2 the dominant species are H5DTPA (65 )
H4DTPA- (24 ) and H3DTPA
2- (11 ) The species with the greatest electrostatic
attraction under these conditions is to MA3+
Ln3+
ions is H3DTPA2-
At pH 3 a much
higher proportion of this species is present (87 ) than at pH 2 making pH 2 less
favourable for effective separation However the conditions can be optimised in order
to maximise separation by changing the concentrations of extractant and holdback
reagent For industrial purposes conducting the process at a lower pH is preferable as it
is easier for process operators to control higher acid concentrations Optimisation
studies using L-alanine as a buffer at pH 2 were carried out during a placement at the
INL
114
Figure 35 DTPA speciation as a function of pH modelled using HySS sofware using
literature pKa values
321 [Na5DTPA] Dependence
The concentration of Na5DTPA used in traditional TALSPEAK systems is 005
M Initial optimisation studies were carried out using a [Na5DTPA] range of 006 M to
010 M in increments of 001 M The L-alanine concentration was 05 M
115
Figure 36 [Na5DTPA] dependence of L-alanine system (05 M) at pH 2
Experiments were carried out using traditional TALSPEAK methods at pH 2
The extractant was HDEHP (02 M) in dodecane Separations were conducted to
measure the separation of Eu3+
over Am3+
A graph of log[DTPA] vs logDEuAm can be
seen in Figure 36 The slope of the line for Am3+
is approximately -1 indicating that
the metal ions are each bound to 1 DTPA5-
molecule The R2 value is close to 1 and the
errors are small The slope of the line for Eu3+
is also approximately -1 Separation
factors for the data were between 66 and 80 and the DAm were between 026 and 042
which are still 2 orders of magnitude higher than that for a traditional TALSPEAK
system (DAm = 0009) The Na5DTPA concentration was therefore increased further in
order to bring the DAm lower to prevent as much Am3+
being partitioned into the organic
phase
y = -09383x - 15277 Rsup2 = 09854
y = -11258x + 01381 Rsup2 = 09289
-10
-05
00
05
10
15
20
-125 -12 -115 -11 -105 -1 -095
log
DEu
Am
log [Na5DTPA]
Am Extraction
Eu Extraction
116
Figure 37 Eu3+
Am3+
separation for [Na5DTPA] dependence of L-alanine system (05
M) at pH 2
Experiments were carried out as before but using Na5DTPA concentrations of
02 M 03 M 04 M and 05 M A graph of log[DTPA] vs logDEuAm was plotted
(Figure 37) At 05 M [Na5DTPA] H5DTPA began to precipitate out due to the low pH
used and so data for this concentration is unreliable and was not plotted on the graph
The data is good as the R2 values are close to 1 and the errors are small However the
slope is not exactly -1 (slope = -080 for Eu and -085 for Am) this is likely to be due to
competition and activity effects from the increased [Na5DTPA] and therefore increased
Na+ concentration Separation factors for the data were around the same (between 65
and 72) but the DAm values decreased to 008 for the 04 M Na5DTPA meaning much
less Am3+
is being partitioned into the organic phase
322 [HDEHP] Dependence
Experiments were carried out as for the [Na5DTPA] dependence but using
HDEHP extractant concentrations of 04 M 06 M 08 M and 10 M in dodecane for
each of the Na5DTPA concentrations 02 M 03 M and 04 M Graphs of log[DTPA] vs
logDEuAm were plotted (Figures 38-310)
y = -08451x - 14757 Rsup2 = 09936
y = -07958x + 03998 Rsup2 = 0998
-15
-10
-05
00
05
10
15
-11 -1 -09 -08 -07 -06 -05 -04 -03
log
DEu
Am
log [Na5DTPA]
Am Extraction Eu Extraction
117
Figure 38 Eu3+
Am3+
separation for [HDEHP] dependence of L-alanine system (05
M) at pH 2 using 02 M Na5DTPA
Figure 39 Eu3+
Am3+
separation for [HDEHP] dependence of L-alanine system (05
M) at pH 2 using 03 M Na5DTPA
y = 13522x + 02972 Rsup2 = 09283
y = 09682x + 19794 Rsup2 = 09561
-05
00
05
10
15
20
25
-05 -04 -03 -02 -01 0 01
log
DEu
Am
log [HDEHP]
Am Extraction
Eu Extraction
y = 14702x + 00193 Rsup2 = 09981
y = 11892x + 17129 Rsup2 = 09713
-10
-05
00
05
10
15
20
-05 -04 -03 -02 -01 0 01
log
DEu
Am
log [HDEHP]
Am Extraction
Eu Extraction
118
Figure 310 Eu3+
Am3+
separation for [HDEHP] dependence of L-alanine system (05
M) at pH 2 using 04 M Na5DTPA
The R2 values for these data are close to 1 and the errors are generally small
making the data good quality The slope of each data set should be +3 indicating that
the metal ions are each bound to 3 HDEHP molecules in the organic phase1011
However the slopes are not quite +3 this is likely to be due to activity effects and
competition from the increased Na+ concentration as a result of increasing the
Na5DTPA concentration
323 L-alanine Optimisation Summary
The results of the optimisation of a TALSPEAK system using 05 M L-alanine
as a buffer are summarised in Tables 33 and 34
Table 33 Separation factors for L-alanine optimisation studies
[HDEHP] (M)
[Na5DTPA]
(M)
02 04 06 08 10
02 72 plusmn 3 70 plusmn 6 43 plusmn 6 61 plusmn 9 49 plusmn 2
03 70 plusmn 1 62 plusmn 7 59 plusmn 9 56 plusmn 5 46 plusmn 8
04 71 plusmn 5 60 plusmn 4 74 plusmn 4 70 plusmn 7 67 plusmn 1
y = 11522x - 00047 Rsup2 = 09867
y = 12575x + 18424 Rsup2 = 09976
-10
-05
00
05
10
15
20
25
-05 -04 -03 -02 -01 0 01
log
DEu
Am
log [HDEHP]
Am Extraction
Eu Extraction
119
Table 34 DAm values for L-alanine optimisation studies Error plusmn 001
[HDEHP] (M)
[Na5DTPA]
(M)
02 04 06 08 10
02 012 053 121 126 203
03 010 027 050 077 102
04 008 036 051 077 102
Table 33 shows the separation factors are generally similar for each condition
and there is no particular set of conditions that gives the highest value although the
better separation factors tend to be achieved at the lower extractant concentrations The
DAm values (Table 34) are best at the lowest extractant concentrations and highest
holdback concentration as would be expected The best set of conditions is 04 M
Na5DTPA and 02 M HDEHP with the best DAm achievable being 008 and best SF 71 plusmn
5 Despite optimisation the L-alanine system is still not as efficient as the traditional
lactate system as the distribution of Am3+
is one order of magnitude higher and the
separation is lower however the L-alanine system allows the separation to be carried
out at a lower pH which is beneficial for an industrial process
33 Other Amino Acid Studies
331 Initial Tests with Other Amino Acids
Several initial tests were carried out using other amino acids as buffers It had
been found previously that L-arginine at pH 2 gave poor separation of the heavier
lanthanides (Section 312) so further studies were carried out using 05 M L-methionine
and L-histidine to see how effective these amino acids could be as potential buffers
Results from initial tests using TALSEPAK conditions at varied pH values can be seen
in Table 35
120
Table 35 Separation factors and DAmEu values for traditional TALSPEAK systems
with different buffers at varying pH values
From Table 35 it can be seen that L-histidine gives good separation data at pH
3 The DAm of 007 is comparable to the optimised L-alanine system in Section 32 and
the separation factor is high at 99 comparable to the original lactate TALSPEAK
system Further investigations were subsequently carried out in order to determine if the
same kinetic issues arise with L-histidine as with L-arginine and L-alanine L-
methionine was not investigated further as the separation data at pH 2 was not very
promising and it is insoluble at 05 M at pH 3
332 Studies with L-Histidine
The distribution ratios of La-Ho were determined by ICP-MS for a 05 M L-
histidine system at pH 2 and pH 3 (Figure 311)
Buffer pH DAm
DEu
SF
Lactic Acid 3 0009 0819 91
L-Methionine 1 547 6017 11
2 018 1016 57
L-Histidine 1 468 9579 20
2 053 4463 84
3 007 660 99
121
Figure 311 Distribution ratios of La3+
-Ho3+
and Am3+
with 05 M L-histidine buffer at
pH 2 and pH 3
The distribution ratios for the L-histidine system at pH 2 generally resemble
those on a traditional TALSPEAK curve at pH 3 with the D values decreasing towards
neodymium and then increasing with the later lanthanides However the pH 3 L-
histidine system exhibits decreasing D values with the heavier lanthanide elements
demonstrating the same kinetic problems as the L-alanine and L-arginine systems at
higher pH
34 Summary of Separations with Amino Acid Buffers
Previous work carried out at the Idaho National Laboratory by Grimes showed
that amino acids do not act as holdback reagents in their own right and no separation of
Ln3+
Am3+
is achieved when they are used without Na5DTPA in solution However
investigations showed that when used alongside Na5DTPA good separation can be
attained when using 05 M L-alanine at pH 2 pH 2 is less favourable than pH 3 for
separations using DTPA as more protonated forms of the molecule are present in
solution and the holdback reagent is not able to bind as strongly to metal ions However
optimisation of the system in order to maximise the separation whilst keeping Am3+
partitioning to a minimum by changing the concentrations of holdback reagent and
extractant proved to be successful The best conditions were found to be 04 M
Na5DTPA and 02 M HDEHP giving a separation factor of 71 plusmn 5 with a DAm value of
008 Although this separation is not as good as a traditional lactate TALSPEAK
001
01
1
10
56 57 58 59 60 61 62 63 64 65 66 67 68
Dis
trib
uti
on
Rat
io
Atomic Number
His pH 2
His pH 3
Am pH 2
Am pH 3
122
system the use of L-alanine as a buffer allows the process to be carried out at pH 2
which is a much more preferable pH for industry
When investigations were carried out using other amino acids at varying pH
values it was found that L-methionine was too poorly soluble at pH 3 and did not give
very good separation data at pH 2 L-arginine was found to have kinetic issues at pH 2
and 3 giving poor separation of the heavier lanthanides However L-histidine gave
good separation data at pH 3 with a SFEuAm of 99 comparable to that of the original
TALSPEAK process and a DAm of 007 comparable to the optimised alanine system
Studies of the lanthanides La-Ho using L-histidine at pH 3 however showed that the
same kinetic problems arise as for L-arginine and L-alanine as the DLn decreases for
later lanthanides indicating that L-histidine is no more promising as a buffer than the
other amino acids
123
1 TS Grimes RD Tillotson and LR Martin Solv Extraction and Ion Exchange
2014 32 378-390
2 B Weaver and T A Kappelmann Talspeak A new method of separating americium
and curium from the lanthanides by extraction from an aqueous solution of an
aminopolyacetic acid complex with a monoacidic organophosphate or phosphonate
Oak Ridge National Laboratory 1964 1-60
3 Z Kolarik G Koch and W Kuhn J Inorg Nucl Chem 1974 36 905-909
4 KL Nash Solv Extraction and Ion Exchange 2015 33 1-55
5 S P Tanner and G R Choppin Inorg Chem 1968 7 2046-2048
6 A Aziz and S J Lyle J Inorg Nucl Chem 1971 33 3407-3408
7 A Aziz S J Lyle and J E Newbery J Inorg Nucl Chem 1971 33 1757-1764
8 K Krishnan and R Plane Inorg Chem 1967 6 55-60
9 NJ Bridges LE Roy and CL Klug Computation and Spectroscopic Investigation of
the DTPA Complexes US Department of Energy 2012
10 TS Grimes G Tian L Rao and KL Nash Inorg Chem 2012 51 6299-6307
11 G Lumetta AV Gelis and GF Vandegrift Solv Extraction and Ion Exchange
2010 28 3 287-312
124
4 STUDIES USING L-GLUTATHIONE AS A BUFFER IN A TALSPEAK
SYSTEM
The TALSPEAK process (Trivalent Actinide Lanthanide Separation by
Phosphorus reagent Extraction from Aqueous Complexation) which is currently being
developed in the USA for separation of minor actinides (MA) from lanthanides (Ln)
from nuclear waste uses lactic acid as a buffer (pH 36) and the chelator DTPA
(diethylenetriaminepentaacetic acid) as a holdback reagent to retain Am3+
in an aqueous
phase allowing Ln3+
to be extracted by phosphate extractant HDEHP (di-
(2ethylhexyl)phosphoric acid) into an organic phase Studies have been carried out on
the potential of using amino acids as a combined buffer and soft-donor in order to
simplify the TALSPEAK process (Chapters 2 amp 3) however it was found that amino
acids do not act as holdback reagents in their own right although they have been shown
to allow the pH of the process to be lowered to pH 2 which is more favourable for an
industrial process
Although amino acids have been shown not to act as holdback reagents and are
therefore unable to replace lactic acid and DTPA5-
as a combined buffer and soft donor
based on the data obtained from the individual amino acid studies it was considered
that larger ligands with more soft donors such as short-chain peptides may be more
suitable A range of potential molecules were considered including a selection of simple
peptides including eisenin (pGlu-Gln-Ala-OH) and norophthalmic acid (γ-Glu-Ala-
Gly) (Figure 41) and B vitamins including biotin (B7) and folic acid (B9) (Figure
42)
125
Figure 41 Molecular structures of eisenin (top) and norophthalmic acid
(bottom)
Figure 42 Molecular structures of biotinvitamin B7 (top) and folic acid
vitamin B9 (bottom)
The tripeptide L-glutathione (reduced form) was chosen for further study as it
has a fairly simple structure contains several soft-donor atoms and its amino acid
constituents showed promise for buffer activity It is also relatively cheap and easy to
procure L-glutathione (GSH) consists of a chain comprising three amino acids L-
cysteinemdashL-glutamic acidmdashglycine (Figure 43)
126
Figure 43 Molecular structure of L-glutathione (reduced form)
Glutathione is naturally produced in all cells in the human body It is an
antioxidant with numerous functions most of which are related to the ability of its
sulphur atom to scavenge free radicals or donate electrons GSH regulates cell growth
and division by absorbing oxide radicals present in the cell which would prevent cell
growth repairs DNA by donating electrons removed from DNA strands by free radicals
aiding in DNA synthesis assists in protein synthesis by reacting (sulphur atom) with
undesirable S-S bonds to break them and allow for the correct pairing metabolises
toxins by co-ordinating with them through the S atom making them more water soluble
for excretion and recycles other antioxidants (such as vitamins C and E) by donating
electrons1 As a cysteine-containing tripeptide it is also a provider of the amino acid
cysteine in the body and is involved in amino acid transport in and out of cells
Properties of glutathione which are of particular interest to MA3+
Ln3+
separation
studies are its ability to conjugate to heavy metals (to allow them to be removed from
the body like DTPA23
and its resistance to radiation (due to its ability to scavenge free
radicals) which decreases radiation damage in the body45
but also would be beneficial
for spent nuclear fuel (SNF) reprocessing where free radicals and high levels of
radiation are present
As is the case for lactate6 and amino acid
7 complexes of lanthanides stability
constants of Ln-GSH complexes increase across the lanthanide series from La-Lu as the
Lewis acidity of the metal ions increases Log β values range from 556 for La3+
to 751
for Ho3+
with GSH indicating slightly higher stability of Ln-GSH complexes than of
lactate and amino acid complexes of Ln3+
with log β = 633 for Ln(lactate)3 formation
and values ranging from 582-665 for L-alanine with Ln3+
when Ln = La-Sm (Section
242) Garg et al also reported that the stability of Ln-GSH complexes was found to
decrease as ionic strength increases and that the optimum stability of the complexes was
in solutions within the pH range of 340-348 (77 complex formation)8
127
Solvent extraction experiments were initially performed in order to investigate
the separation ability of GSH with Am3+
and Eu3+
and conditions were then optimised
in order to achieve maximum separation Interaction of the buffer with various
components in solution including lanthanide ions was probed using various techniques
including luminescence spectroscopy which was also used in determining the
susceptibility of the buffer to radiolysis and ICP-MS
41 Solvent Extraction and Separation using GSH
411 [L-Glutathione] and pH Dependence
4111 [GSH] Dependence without Na5DTPA at pH 4
L-glutathione has pKa values of 212 (COOH) 359 (COOH) 875 (NH2) and
965 (SH)9 and so with two pKa values below 4 and optimum stability at pH 34 initial
studies were carried out at pH 4 as it would be expected that the glutathione would
complex to metal ions most effectively around this pH and be more likely to act as a
holdback reagent Although pH 4 is a higher pH than that used currently in the
TALSPEAK process and therefore less desirable if proven to improve the process it
may still have potential if satisfactory separation is achieved
Initial studies using L-glutathione as a buffer without the presence of Na5DTPA
in the system showed that as with amino acids GSH is ineffective as a holdback
reagent on its own as there was no separation observed between Eu3+
and Am3+
Over a
GSH concentration range of 01 M to 05 M the separation factors ranged from 038-
585 plusmn 108 Glutathione is insoluble at concentrations above 05 M at pH 4 at room
temperature
4112 [GSH] and pH Dependence with Na5DTPA
Further experiments were then carried out using GSH as a buffer in the presence
of Na5DTPA in order to see if there was any improvement in the separation with this
buffer over the traditional lactic acid buffer The experiments used 005 M Na5DTPA
and 01-05 M GSH over a pH range of 2-4 under TALSPEAK conditions (02 M
HDEHP in n-dodecane)
128
Figure 44 Eu3+
Am3+
distribution for [GSH] dependence with 005 M Na5DTPA at pH
2 extracted using 02 M HDEHP in dodecane Results were averaged from 3 repeat
tests
Figure 45 Eu3+
Am3+
distribution for [GSH] dependence with 005 M Na5DTPA at pH
3 extracted using 02 M HDEHP in dodecane Results were averaged from 3 repeat
tests
Plots of log[GSH] vs logDEuAm for systems at pH 2 and 3 are displayed in
Figures 44 and 45 The graphs show that increasing the concentration of GSH does not
affect the separation of Eu3+
over Am3+
since the distribution ratios for each remain
-02
0
02
04
06
08
1
12
14
16
18
-11 -09 -07 -05 -03
log
DEu
Am
log [GSH]
Am Extraction
Eu Extraction
-1
-08
-06
-04
-02
0
02
04
06
08
1
12
14
-11 -09 -07 -05 -03
log
DEu
Am
log [GSH]
Am Extraction
Eu Extraction
129
relatively constant At pH 2 the average DAm is 103 and DEu is 3013 giving an
average separation factor of 29 plusmn 8 At pH 3 the extraction of both metals is lower with
DAm averaging at 018 and DEu at 1423 giving an average separation of 79 plusmn 13 Both
data sets for pH2 and pH 3 show a slope of almost zero suggesting that the metal ions
are not bound to any GSH molecules which would be consistent with the L-glutathione
just acting as a buffer These separation factors are lower than for the original
TALSPEAK buffered system using lactate (SF = 91 at pH 36) However at pH 4 the
slopes change on the graph and a difference in separation can be observed as the molar
concentration of GSH is increased
Figure 46 Eu3+
Am3+
distribution for [GSH] dependence with 005 M Na5DTPA at pH
4 Results were averaged from 3 repeat tests
At pH 4 as the concentration of L-glutathione is increased the separation factor
increases (Figure 46) The value DEu initially increases as the GSH concentration is
increased from 01-02 M but then remains constant at ~6 However DAm values
decrease linearly as the buffer concentration is increased from 01-05 M giving rise to
increased partitioning and separation values The results from the extraction
experiments at pH 4 are given in Table 41
-15
-10
-05
00
05
10
-11 -09 -07 -05 -03
log
DEu
Am
log [GSH]
Am Extraction
Eu Extraction
130
Table 41 Eu3+
Am3+
distribution and separation for [GSH] dependence with 005 M
Na5DTPA at pH 4
[GSH] (M) DAm DEu SF
01 073 plusmn 027 100 plusmn 041 14 plusmn 13
02 021 plusmn 011 658 plusmn 054 31 plusmn 14
03 016 plusmn 005 578 plusmn 097 37 plusmn 19
04 007 plusmn 002 590 plusmn 043 82 plusmn 19
05 006 plusmn 001 617 plusmn 097 104 plusmn 33
The results show that the L-glutathione is interacting with the DTPA in some
way at pH 4 to allow the separation to increase as a function of GSH concentration only
in the presence of Na5DTPA up to a SF of 104 at 05 M GSH concentration
comparable to separation achieved in the original lactate buffered TALSPEAK process
Figure 47 GSH speciation as a function of pH modelled using HySS software using
literature pKa values of 212 (COOH) 359 (COOH) 875 (NH2) and 965 (SH)9
131
Figure 48 H2GSH- species dominant in solution at pH 4
The speciation of GSH at pH 4 was modelled using HySS (Hyperquad Simulation and
Speciation) software using literature pKa values (Figure 47) At pH 4 the dominant
GSH species is the H2GSH- species (Figure 48) with both carboxylic acids
deprotonated This suggests that deprotonation of the second COOH group allows the
ligand to interact through the COO- to the metal complex Indeed several studies by
Faulkner et al have shown that molecules containing carboxylate functionalities
readily bind with 7-coordinate lanthanide(III) polyaminocarboxylate complexes in a
bidentate manner here DO3A (DO3A = [4710-tris-carboxymethyl-14710-tetraaza-
cyclododec-1-yl]-acetic acid) (Figure 49) and a similar binding interaction with the
related DTPA actinide(III)lanthanide(III) may be anticipated
Figure 49 A ternary Nd DO3A-pyrazine amine carboxylate complex reported by
Faulkner at al (left) and anticipated bidentate chelation of GSH with Am-DTPA at pH
4 (right)10
132
412 [Na5DTPA] Dependence at pH 4
The highest concentration of buffer (05 M) gave the highest separation factors
in the [GSH] dependence study at pH 4 so this concentration was chosen for the next
study on [Na5DTPA] dependence (Figure 410) Relatively high concentrations of
Na5DTPA were chosen (005-06 M) to make the results comparable to those obtained
in the optimisation of the L-alanine system (Section 32) The graphs plotted for the
[Na5DTPA] dependence were not plotted as log plots as it is not known how the
Na5DTPA and GSH interact and what competition effects may be present so the direct
correlation between the complexant concentration and D values have been plotted to
make interpretation more simple
Figure 410 Eu3+
and Am3+
distribution for [Na5DTPA] dependence with 05 M GSH
buffer at pH 4 curves fitted as polynominal order 2 for both Am3+
and Eu3+
Results
were averaged from 3 repeat tests
y = 19018x2 - 23123x + 72258 Rsup2 = 09937
y = 0442x2 - 03543x + 00659 Rsup2 = 0781
00
00
01
01
02
-20
-10
00
10
20
30
40
50
60
70
-01 26E-15 01 02 03 04 05 06 D
Am
DEu
[Na5DTPA] (M)
Eu extraction
Am extraction
133
Table 42 Eu3+
Am3+
distribution and separation for [Na5DTPA] dependence with 05
M GSH buffer at pH 4
[Na5DTPA] (M) DAm DEu SF
005 00650 plusmn ˂0001 624 plusmn 076 96 plusmn 11
01 00196 plusmn ˂0001 480 plusmn 057 245 plusmn 29
02 00039 plusmn ˂0001 361 plusmn 052 917 plusmn 133
03 00020 plusmn ˂0001 207 plusmn 017 1037 plusmn 85
04 00010 plusmn ˂0001 084 plusmn 008 833 plusmn 80
05 00060 plusmn ˂0001 042 plusmn 005 70 plusmn 9
06 00058 plusmn ˂0001 024 plusmn 005 41 plusmn 7
These data show that as the concentration of Na5DTPA is increased the
separation factor increases dramatically up to 03 M Na5DTPA with a maximum of
1037 85 (Table 42) After this peak there is a rapid decrease in separation as the
concentration of Na5DTPA is increased further up to 06 M The DAm decreases at a
steady rate as [Na5DTPA] is increased from 005 M to 04 M after which the DAm
increases slightly and remains fairly constant The DEu decreases at a slower rate
between 005 M and 02 M complexant decreasing more rapidly from 02 M to 06 M
The SF significantly decreases as the concentration of Na5DTPA is increased from 04
to 05 M Although it is unclear why this is without detailed structural analysis the
stoichiometry of DTPAGSH becomes 11 at 05 M which may alter the interaction
between the two constituents The separation factors achieved here are extremely high
(a factor of 10 higher than the current TALSPEAK system and the optimised alanine
system (Chapter 3)) whilst still maintaining low extraction of Am3+
413 [HDEHP] Dependence at pH 4
The extractant concentration dependence was measured for the systems
containing 05 M buffer and 03 M and 04 M Na5DTPA These Na5DTPA
concentrations were chosen for comparison as the 03 M was found to give the highest
separation factor and 04 M seemed to be the point where the separation began to
decrease The graphs plotted for the [HDEHP] dependence have also been plotted by
direct correlation between the extractant concentration and D values
134
Figure 411 Eu3+
and Am3+
distribution for [HDEHP] dependence with 03 M
Na5DTPA and 05 M GSH buffer at pH 4 curve for Eu3+
fitted as polynominal order 2
linear correlation for Am3+
Results were averaged from 3 repeat tests
Table 43 Eu3+
Am3+
distribution and separation for [HDEHP] dependence with 03 M
Na5DTPA and 05 M GSH buffer at pH 4
[HDEHP] (M) DAm DEu SF
02 00020 plusmn ˂0001 207 plusmn 017 1037 plusmn 85
04 00018 plusmn ˂0001 223 plusmn 003 1238 plusmn 17
06 00022 plusmn ˂0001 239 plusmn 006 1097 plusmn 15
08 00024 plusmn ˂0001 218 plusmn 005 906 plusmn 21
10 00031 plusmn ˂0001 165 plusmn 003 535 plusmn 9
At 03 M Na5DTPA the separation factor increases as the extractant
concentration is increased from 02 to 04 M after which the SF begins to decrease
again (Figure 411) The DAm increases slightly as the HDEHP concentration is
increased but the DEu increases and then decreases like the SF The separation factors
for the lower concentrations of extractant are very high with the optimum separation at
04 M giving a SF of 1238 (Table 43)
y = -30649x2 + 3243x + 15029 Rsup2 = 09467
y = 00013x + 00015 Rsup2 = 08028
0000
0002
0004
0006
0008
0010
0012
0014
00
05
10
15
20
25
30
0 02 04 06 08 1 12
DA
m
DEu
[HDEHP] (M)
Eu extraction
Am extraction
135
Figure 412 Eu3+
and Am3+
distribution for [HDEHP] dependence with 04 M
Na5DTPA and 05 M GSH buffer at pH 4 linear correlation for both Am3+
and Eu3+
Results were averaged from 3 repeat tests
Table 44 Eu3+
Am3+
distribution and separation for [HDEHP] dependence with 04 M
Na5DTPA and 05 M GSH buffer at pH 4
[HDEHP] (M) DAm DEu SF
02 0001 plusmn ˂0001 084 plusmn 008 833 plusmn 80
04 0251 plusmn ˂0001 081 plusmn 003 454 plusmn 30
06 0698 plusmn 0014 077 plusmn 001 110 plusmn 010
08 1026 plusmn 0009 078 plusmn 004 076 plusmn 005
10 1410 plusmn 0022 067 plusmn 003 047 plusmn 003
At 04 M Na5DTPA the separation factor decreases rapidly as the extractant
concentration is increased The DAm increases by a factor of 1000 but the DEu only
decreases slightly making the SF decrease significantly (Figure 412 and Table 44)
This would be consistent with the complexant and buffer interacting at higher
Na5DTPA concentrations as the stoichiometry nears 11 possibly forming an adduct
which no longer successfully holds back Am3+
Further structural studies are needed on
these systems in order to determine the complexation mechanisms in the solution under
these conditions
y = -01882x + 08847 Rsup2 = 08326
y = 17968x - 04007 Rsup2 = 09946
-0500
0000
0500
1000
1500
2000
00
01
02
03
04
05
06
07
08
09
10
0 02 04 06 08 1 12
DA
m
DEu
[HDEHP] (M)
Eu extraction
Am extraction
136
42 Luminescence Studies using GSH with Eu3+
Further studies on the glutathione systems were carried out on lanthanide
systems in order to gain some insight into the co-ordination of the buffer with the ions
with and without Na5DTPA present Control measurements were taken of Eu(NO3)3 in
water with no other reagents Eu(NO3)3 with Na5DTPA with no GSH and Eu(NO3)3
with GSH without Na5DTPA for comparison purposes (Figure 413) All luminescence
spectra were recorded and averaged from 5 repeat measurements
Figure 413 Corrected emission spectra of Eu(NO3)3 (1 mM) Eu(NO3)3 with GSH (05
M) and Eu(NO3)3 with Na5DTPA (005 M) in H2O following excitation at 397 nm
A first set of experiments was then carried out to mimic the separation and
solvent extraction studies performed at the INL (Section 41) At the same concentration
of Eu(NO3)3 the J=2 band of Eu3+
increases in intensity upon the addition of GSH
indicating a change in symmetrycrystal field and a weak but detectable interaction with
GSH (the J=1 and J=4 bands are the same intensity with and without GSH) Upon the
addition of Na5DTPA to the system the crystal field changes and the J=4 band shifts
position slightly indicating that a different species is forming which is consistent with
the formation of [EuDTPA]2-
0
1
2
3
4
5
6
550 600 650 700
Emis
sio
n In
ten
sity
(au
) x
10
00
0
Wavelength (nm)
Eu3+ in H2O
Eu with GSH
Eu with DTPA
137
421 [GSH] and pH Dependence without DTPA at pH 4
4211 Aqueous Phase Studies
Emission spectra of Eu3+
(1 mM Eu(NO3)3) in H2O and D2O were measured at
pHpD 4 as the concentration of [GSH] was varied from 01 M to 05 M The spectra
can be seen in Figures 414 and 415
Figure 414 Emission spectra of Eu(NO3)3 in H2O at pH 4 over a GSH concentration
range of 01 ndash 05 M following excitation at 397 nm
The spectra show an increase in emission intensity of the J=2 band as the GSH
concentration is increased from 01-02 M followed by a decrease at 03 M and a
further increase at 04 and 05 M whereas the opposite trend is observed with the J=4
peak The J=1J=2 peak ratios were determined and a t-test was carried out on them to
determine whether they were significantly different and hence whether the co-ordination
mode of the GSH to the Eu3+
changed as the buffer concentration was increased The
J=1J=2 values ranged from 0364-0718 and were found to be significantly different
The spectra are similar to that recorded for the free ion in solution but the J=1J=2
ratios vary slightly and there are some differences in the fine structure of the emission
bands This indicates that GSH is interacting with Eu3+
under these conditions albeit
weakly and the surrounding water molecules are in fast exchange with the buffer
molecules The solution dynamics were investigated further and the spectra were
recorded in D2O in order to minimise quenching caused by fast exchange of O-H
oscillators and to determine the inner sphere hydration number of Eu3+
in each case (q)
00
01
02
03
04
05
06
07
550 600 650 700
Emis
sio
n In
ten
sity
(au
) x
10
00
0
Wavelength (nm)
01 M GSH
02 M GSH
03 M GSH
04 M GSH
05 M GSH
138
Figure 415 Emission spectra of Eu(NO3)3 in D2O at pH 4 over a GSH concentration
range of 01 ndash 05 M following excitation at 397 nm
In D2O it can be seen that the emission intensity increases as the GSH
concentration is increased from 01-03 M followed by a decrease at 04 M and a slight
increase at 05 M This time the J=1J=2 values ranged from 0324-0748 but were
found not to be significantly different suggesting that the co-ordination mode of the
GSH to the metal ion is not changing as the concentration is increased which would be
expected as the buffer is not forming a stable complex with the ion and is in exchange
with surrounding solvent molecules
The number of water molecules bound to the Eu3+
ion (q) was calculated for
each of the samples using the Horrocks equations (Equations 19 and 110) The results
can be found in Table 45 There is a large range in q between different concentrations
with no clear pattern to the lifetimes or number of bound water molecules other than
generally q tends to increase from around 1 to 5 at the highest concentrations of GSH
This could be explained by the increasing ionic strength decreasing the stability of any
Eu-GSH complex and the solvent molecules are also in fast exchange with the buffer
00
02
04
06
08
10
12
550 600 650 700
Emis
sio
n In
ten
sity
(au
) x
10
00
0
Wavelength (nm)
01 M GSH
02 M GSH
03 M GSH
04 M GSH
05 M GSH
139
Table 45 Luminescence lifetimes and q values for Eu3+
with GSH at pHD 4
Error on lifetimes plusmn 10
[GSH]
(M)
τ D2O (μs) τ H2O (μs) q plusmn 02
01 1487 428 17
02 785 353 16
03 829 440 11
04 1545 161 58
05 1016 168 52
4211 Extraction Studies
Extractions were carried out on the Eu3+
samples containing GSH using 02 M
HDEHP in dodecane for the organic phase The emission spectra of both the aqueous
and organic phases post-extraction can be seen in Figure 416
Figure 416 Emission spectra of aqueous and organic phases after Eu3+
extraction at
pH 4 using a GSH concentration range of 01 ndash 05 M following excitation at 397 nm
The Eu-HDEHP complex formed in the organic phase has different symmetry to
Eu3+
complexes in the aqueous phase as can be seen by the different profile of the
emission spectra of the organic phases The spectra show good extraction of the Eu3+
into the organic phase for all concentrations of GSH with little or no metal ion left in the
aqueous phase The J=1J=2 values ranged from 0794-1214 for the organic phase and
were found not to be significantly different as expected as the buffer is unlikely to
00
01
01
02
02
03
03
550 600 650 700
Emis
sio
n In
ten
sity
(au
) x
10
00
0
Wavelength (nm)
01 M GSH Aq 02 M GSH Aq 03 M GSH Aq 04 M GSH Aq 05 M GSH Aq 01 M GSH Org 02 M GSH Org 03 M GSH Org 04 M GSH Org 05 M GSH Org
140
affect the co-ordination of metal ion in the organic phase as the Eu3+
ion is extracted as
the HDEHP complex seen by the different emission profile in the organic phase
spectrum11
422 [GSH] and pH Dependence with DTPA
4221 Aqueous Phase Studies
Emission spectra of Eu3+
(1 mM Eu(NO3)3) in H2O and D2O with 005 M
Na5DTPA were measured over a pHpD range of 2-4 as the concentration of [GSH] was
varied from 01 M to 05 M The D2O spectra can be seen in Figures 417 to 419 The
H2O spectra closely resemble those recorded in D2O but with lower relative emission
intensites as expected (Appendix 1)
Figure 417 Emission spectra of Eu3+
in D2O at pD 2 with 005 M Na5DTPA over a
GSH concentration range of 01 ndash 05 M following excitation at 397 nm
00
02
04
06
08
10
12
14
16
550 600 650 700
Emis
sio
n In
ten
sity
(au
) x
10
00
0
Wavelength (nm)
01 M GSH
02 M GSH
03 M GSH
04 M GSH
05 M GSH
141
Figure 418 Emission spectra of Eu3+
in D2O at pD 3 with 005 M Na5DTPA over a
GSH concentration range of 01 ndash 05 M following excitation at 397 nm
Figure 419 Emission spectra of Eu3+
in D2O at pD 4 with 005 M Na5DTPA over a
GSH concentration range of 01 ndash 05 M following excitation at 397 nm
It can be seen that in all samples a Eu-DTPA complex has formed The spectra
are all almost identical for each pD and for each buffer concentration with the emission
intensity being slightly higher for pD 3 and 4 with the same concentration of Eu3+
00
02
04
06
08
10
12
14
16
550 600 650 700
Emis
sio
n In
ten
sity
(au
) x
10
00
0
Wavelength (nm)
01 M GSH
02 M GSH
03 M GSH
04 M GSH
05 M GSH
00
02
04
06
08
10
12
14
16
550 600 650 700
Emis
sio
n In
ten
sity
(au
) x
10
00
0
Wavelength (nm)
01 M GSH
02 M GSH
03 M GSH
04 M GSH
05 M GSH
142
Table 46 J=1J=2 peak ratios and t-test results for Eu-DTPA at pD 2-4 over a GSH
concentration range of 01-05 M following excitation at 397 nm
J=1J=2
[GSH] (M)
01 02 03 04 05 st dev t-test
pD 2 0335 0399 0379 0375 0361 0024 No sig diff
pD 3 0440 0433 0451 0439 0419 0012 No sig diff
pD 4 0438 0467 0413 0469 0454 0023 No sig diff
st dev 0060 0034 0036 0048 0047
t-test Sig diff Sig diff Sig diff Sig diff Sig diff
The J=1J=2 peak height ratios were recorded for each emission spectrum and t-
tests were carried out on the peak ratios using the t-test data analysis tool in Microsoft
Excel accounting for the standard deviations between the ratios (Table 46) For each
pH as the concentration of GSH is increased the range in the ratios remains small and
there is no significant difference between the values suggesting that there is no change
in the co-ordination mode of the buffer to the metal ion as the concentration of GSH is
increased However a significant difference was observed between the data sets upon
changing pH as the J=1J=2 ratio increases from pD 2 to pD 4 indicating that the co-
ordination mode of glutathione is different at different pH values This is consistent
with the pKa values of GSH as at pH 2 both of the carboxylate groups will be
protonated with the dominant species present in solution shifting from 5050
H3GSHH2GSH to 5050 H4GSHH3GSH (Figure 47)
The luminescence lifetimes of each sample were recorded in H2O and D2O in
order to determine the q value of the complexes using the modified Horrocks equation
(Equation 110) These results are summarised in Table 47
143
Table 47 Luminescence lifetimes and q values for Eu-DTPA at pH 2-4 over a GSH
concentration range of 01-05 M
[GSH] (M) τ D2O (μs) τ H2O (μs) q plusmn 02
pH 2 01 1699 plusmn 7 607 plusmn 9 10
pH 2 02 1692 plusmn 10 619 plusmn 10 09
pH 2 03 1686 plusmn 9 629 plusmn 9 09
pH 2 04 1636 plusmn 12 607 plusmn 13 09
pH 2 05 1596 plusmn 11 629 plusmn 13 09
pH 3 01 1755 plusmn 14 626 plusmn 7 09
pH 3 02 1737 plusmn 13 626 plusmn 15 09
pH 3 03 1723 plusmn 5 626 plusmn 13 09
pH 3 04 1720 plusmn 14 635 plusmn 17 09
pH 3 05 1677 plusmn 9 641 plusmn 14 09
pH 4 01 1778 plusmn 14 593 plusmn 16 10
pH 4 02 1747 plusmn 13 640 plusmn 15 09
pH 4 03 1679 plusmn 15 669 plusmn 18 08
pH 4 04 1689 plusmn 14 623 plusmn 15 09
pH 4 05 1679 plusmn 13 652 plusmn 19 08
All of the complexes have approximately 1 water molecule in the inner
hydration sphere This is consistent with the formation of a [Eu(DTPA)]2-
complex The
values are only slightly less than 1 (compared to [Eu(DTPA)]2-
itself where q = 11)
and in most cases is not significantly different This indicates that any interaction of
GSH with the Eu3+
centre is very weak and that the buffer may be in fast exchange with
the bound water molecule
4222 Extraction Studies
Extractions were carried out on the samples using 02 M HDEHP in dodecane
for the organic phase in the absence of DTPA The emission spectra of both the aqueous
and organic phases post-extraction can be seen in Figures 420 and 421
144
Figure 420 Emission spectra of aqueous phases after Eu3+
extraction at pH 2-4 over a
GSH concentration range of 01-05 M following excitation at 397 nm
Figure 421 Emission spectra of organic phases after Eu3+
extraction at pH 2-4 over a
GSH concentration range of 01-05 M following excitation at 397 nm
The extraction data show that the best Eu3+
extraction occurs at pH 3 under these
conditions although as seen from the separation data obtained at INL (Section 41) this
is not the best pH for separation of metal ions The J=1J=2 peak height ratios were
recorded for each emission spectrum and t-tests were carried out on the peak ratios
using the t-test data analysis tool in Microsoft Excel accounting for the standard
deviations between the ratios The J=1J=2 peak ratios for the aqueous phases show no
significant difference within the pH 4 data as the GSH concentration is increased and
00
05
10
15
20
25
30
35
40
45
50
550 600 650 700
Emis
sio
n In
ten
sity
(au
) H
un
dre
ds
Wavelength (nm)
01 M GSH pH 4 Aq
03 M GSH pH 4 Aq
05 M GSH pH 4 Aq
05 M GSH pH 3 Aq
05 M GSH pH 2 Aq
00
02
04
06
08
10
12
14
550 600 650 700
Emis
sio
n In
ten
sity
(au
) H
un
dre
ds
Wavelength (nm)
01 M GSH pH 4 Org
03 M GSH pH 4 Org
05 M GSH pH 4 Org
05 M GSH pH 3 Org
05 M GSH pH 2 Org
145
the standard deviation is small (Table 48) however a significant difference is observed
between each of the pH values for the same buffer concentration 05 M which is again
consistent with the co-ordination mode of glutathione changing with pH Interestingly
under these experimental conditions the extraction of Eu3+
as the HDEHPDEHP
organic soluble complexes is not very efficient since the emission intensities are
unusually low This suggests that in the absence of competing Am3+
ions GSH is
interacting relatively strongly with the Eu3+
ion in aqueous solution
Table 48 J=1J=2 peak ratios and t-test results for Eu-DTPA at pH 2-4 as [GSH] is
varied
J=1J=2
[GSH] (M)
01 03 05 st dev t-test
pD 4 0202 0276 0247 0037 No sig diff
pD 3 - - 0100 - -
pD 2 - - 0500 - -
st dev - - 0202
t-test - - Sig diff
423 [Na5DTPA] Dependence at pH 4
4231 Aqueous Phase Studies
The [Na5DTPA] dependence study carried out at the INL was also repeated in
order to gain luminescence data for the experiment The conditions used were pH 4 05
M GSH and [Na5DTPA] concentrations ranging from 005 ndash 06 M The emission
spectra can be seen in Figure 422
146
Figure 422 Emission spectra of Eu(NO3)3 in D2O at pD 4 with 05 M GSH over a
Na5DTPA concentration range of 005 ndash 06 M following excitation at 397 nm
The emission intensity of the complex decreases as the concentration of
Na5DTPA is increased from 005 M to 06 M This is likely to be due to the introduction
of more O-H oscillators and therefore increased quenching as the Na5DTPA stock
solution is aqueous and there is no deuterated alternative available The emission
spectra in water do not show this decrease in intensity (Figure 423)
Figure 423 Emission spectra of Eu(NO3)3 in H2O at pH 4 with 05 M GSH over a
Na5DTPA concentration range of 005 ndash 06 M following excitation at 397 nm
0
5
10
15
20
25
30
35
550 600 650 700
Emis
sio
n In
ten
sity
(au
) x
10
00
0
Wavelength (nm)
005 M DTPA
01 M DTPA
02 M DTPA
03 M DTPA
04 M DTPA
05 M DTPA
06 M DTPA
0
2
4
6
8
10
12
14
16
550 600 650 700
Emis
sio
n In
ten
sity
(au
) x
10
00
0
Wavelength (nm)
005 M DTPA
01 M DTPA
02 M DTPA
03 M DTPA
04 M DTPA
05 M DTPA
06 M DTPA
147
Table 49 J=1J=2 peak ratios and t-test results for Eu-DTPA with 05 M GSH in
D2OH2O at pDpH 4 over a Na5DTPA concentration range of 005-06 M
J=1J=2
[Na5DTPA] (M)
005 01 02 03 04 05 06 stdev t-test
D2O 0437 0441 0431 0437 0428 0425 0403 0013
No sig
diff
H2O 0450 0440 0437 0449 0422 0424 0428 0011
No sig
diff
The J=1J=2 peak height ratios were recorded for each emission spectrum and t-
tests were carried out on the peak ratios using the t-test data analysis tool in Microsoft
Excel accounting for the standard deviations between the ratios The J=1J=2 peak
ratios show no significant difference for either the D2O or H2O samples as the
Na5DTPA concentration is increased (Table 49) suggesting that the co-ordination
mode of the DTPA does not change as the concentration is increased The luminescence
lifetimes of the samples show a decrease across the D2O samples as the concentration of
Na5DTPA increases This is consistent with the decreased emission intensity due to
greater quenching of the samples as more water is introduced However there is a slight
increase across the H2O samples as the holdback concentration increased as quenching
is reduced in these samples due to the chelating effect of the DTPA molecules therefore
the results obtained in water for this study are likely to be most accurate The lifetimes
and q values are tabulated in Table 410 Although the q values are likely to be
unreliable especially for the highest Na5DTPA concentrations it can be seen that there
is still approximately 1 H2O molecule in the inner hydration sphere of the complexes
consistent with [Eu(DTPA)]2-
formation again implying very little or weak binding
with GSH
148
Table 410 Luminescence lifetimes and q values for Eu-DTPA with 05 M GSH at pH
4 over a Na5DTPA concentration range of 005-06 M following excitation at 397 nm
[Na5DTPA]
(M)
τ D2O (μs) τ H2O (μs) q plusmn 02
005 1679 plusmn 3 652 plusmn 2 08
01 1549 plusmn 4 659 plusmn 2 10
02 1348 plusmn 4 666 plusmn 3 09
03 1179 plusmn 4 665 plusmn 3 08
04 1076 plusmn 4 674 plusmn 4 07
05 978 plusmn 4 698 plusmn 4 05
06 916 plusmn 5 714 plusmn 5 03
4232 Extraction Studies
Extractions were carried out on the samples using 02 M HDEHP in dodecane
for the organic phase The emission spectra of both the aqueous and organic phases
post-extraction can be seen in Figure 424
Figure 424 Emission spectra of aqueous and organic phases after Eu3+
extraction with
05 M GSH at pH 4 over a Na5DTPA concentration range of 005-06 M following
excitation at 397 nm
0
1
2
3
4
5
6
7
550 600 650 700
Emis
sio
n In
ten
sity
(au
) H
un
dre
ds
Wavelength (nm)
01 M DTPA Aq
03 M DTPA Aq
05 M DTPA Aq
01 M DTPA Org
03 M DTPA Org
05 M DTPA Org
149
As expected the extraction data show that the best Eu3+
extraction occurs with
01 M Na5DTPA the lowest concentration of holdback reagent and that very little
extraction occurs at 03 M and 05 M Na5DTPA under these conditions The J=1J=2
peak ratios for the aqueous phases show no significant difference as the Na5DTPA
concentration is increased (Table 411) Unfortunately here the extraction is too weak
and the emission intensity too low to obtain reliable J=1J=2 peak ratios for the organic
phase
Table 411 J=1J=2 peak ratios and t-test results for Eu3+
in the aqueous phase with 05
M GSH at pH 4 as [Na5DTPA] is varied after extraction with 02 M HDEHP
Na5DTPA (M) 01 03 05 st dev t-test
J=1J=2 0552 0578 0502 0039 No sig
diff
424 [HDEHP] Dependence at pH 4
An HDEHP concentration dependence study was carried out under the same
conditions as the study at INL 05 M GSH 03 M Na5DTPA pH 4 and an extractant
concentration range of 04-10 M HDEHP in dodecane Equilibration time was for 30
minutes The emission spectra of the phases after extraction can be seen in Figures 425
and 426
150
Figure 425 Emission spectra of aqueous phases after Eu3+
extraction with 05 M GSH
and 03 M Na5DTPA at pH 4 over an HDEHP concentration range of 02-10 M
following excitation at 397 nm
The J=1J=2 peak ratios for the aqueous phases show no significant difference as
the HDEHP concentration is increased (Table 412) as expected since the co-ordination
mode of the aqueous phase should be unaffected by the organic phase Unfortunately
again the extraction is too weak and the emission intensity too low to obtain reliable
J=1J=2 peak ratios for the organic phase
Table 412 J=1J=2 peak ratios and t-test results for Eu3+
in the aqueous phase with 05
M GSH and 03 M Na5DTPA at pH 4 as [HDEHP] is varied after extraction
HDEHP (M) 04 06 08 10 st dev t-test
J=1J=2 0472 0499 0455 0510 0025 No sig
diff
00
02
04
06
08
10
12
550 600 650 700
Emis
sio
n In
ten
sity
(au
) x
10
00
0
Wavelength (nm)
04 M HDEHP Aq
06 M HDEHP Aq
08 M HDEHP Aq
10 M HDEHP Aq
151
Figure 426 Emission spectra of organic phases after Eu3+
extraction with 05 M GSH
and 03 M Na5DTPA at pH 4 over an HDEHP concentration range of 02-10 M
following excitation at 397 nm
The lowest Eu3+
extraction is with 04 M HDEHP with better extraction at
higher HDEHP concentrations Although better extraction is obtained at higher
concentrations Am3+
is also extracted to a higher extent decreasing the separation
factor (Section 413)
43 Radiolysis Studies using GSH at pH 4
431 Aqueous Phase Studies
In order to determine how resistant the glutathione buffered system is to
radiolysis a selection of aqueous samples at pHpD 4 containing 05 M GSH and a
Na5DTPA concentration range of 005-06 M were irradiated at the Dalton Cumbrian
Facility using a 60
Co irradiator The samples were exposed to 7 kGy γ-radiation and
analysed by luminescence spectroscopy The emission spectra of the samples can be
seen in Figure 427
00
00
00
01
01
01
01
550 600 650 700
Emis
sio
n In
ten
sity
(au
) x
10
00
0
Wavelength (nm)
04 M HDEHP Org
06 M HDEHP Org
08 M HDEHP Org
10 M HDEHP Org
152
Figure 427 Emission spectra of Eu(NO3)3 in H2O at pH 4 with 05 M GSH over a
Na5DTPA concentration range of 005 ndash 06 M after irradiation with 7 kGy γ-radiation
following excitation at 397 nm
The spectra of the samples show a lower emission intensity after irradiation
(Figure 427) than beforehand (Figure 423) but the profile remains the same indicating
that the radiation has little or no degrading effect on the complex in the aqueous phase
The decreased intensity is likely to be due to increased quenching effects caused by
residual radicals present as a result of irradiating the solvent The J=1J=2 ratios and co-
ordination mode remained unchanged (Table 413) as did the luminescence lifetimes of
the samples and the q values (Table 414)
00
01
01
02
02
03
03
04
550 600 650 700
Emis
sio
n In
ten
sity
(au
) x
10
00
0
Wavelength (nm)
005 M DTPA
01 M DTPA
02 M DTPA
03 M DTPA
04 M DTPA
05 M DTPA
06 M DTPA
153
Table 413 J=1J=2 peak ratios and t-test results for Eu-DTPA with 05 M GSH in
D2OH2O at pDpH 4 over a Na5DTPA concentration range of 01-06 M after
irradiation with 7 kGy γ-radiation
[Na5DTPA] (M)
01 02 03 04 05 06 st
dev
t-test
J=1J=2 0477 0481 0452 0401 0407 0411 0036
No sig
diff
Table 414 Luminescence lifetimes and q values for Eu-DTPA with 05 M
GSH at pH 4 over a Na5DTPA concentration range of 01-06 M after irradiation with 7
kGy γ-radiation
[Na5DTPA] (M) τ H2O (μs) τ D2O (μs) q plusmn 02
01 648 plusmn 4 1895 plusmn 12 10
02 661 plusmn 6 1678 plusmn 10 09
03 670 plusmn 6 1536 plusmn 11 08
04 679 plusmn 5 1462 plusmn 9 07
05 701 plusmn 7 1328 plusmn 10 05
06 696 plusmn 6 1211 plusmn 8 03
432 Extraction Studies
Extractions were then carried out on a selection of the irradiated samples using
02 M HDEHP in dodecane with Eu3+
The resultant emission spectra of both the
aqueous and organic phases post-extraction can be seen in Figure 428
154
Figure 428 Emission spectra of aqueous and organic phases after Eu3+
extraction from
irradiated aqueous phase at pH 4 containing 05 M GSH over a Na5DTPA concentration
range of 01-06 M
As expected the extraction data show that the best Eu3+
extraction occurs with
01 M Na5DTPA the lowest concentration of holdback reagent and that very little
extraction occurs at 03 M and 05 M Na5DTPA under these conditions With the
exception of the 01 M Na5DTPA sample for which the extraction decreases after
irradiation the emission intensity remains relatively constant for each of the phases of
the samples after irradiation The J=1J=2 ratios and co-ordination mode for the aqueous
phase remained unchanged (Table 415) Again the extraction is too weak and the
emission intensity too low to obtain reliable J=1J=2 peak ratios for the organic phase
Table 415 J=1J=2 peak ratios and t-test results for Eu3+
in the aqueous phase with 05
M GSH and at pH 4 as [Na5DTPA] is varied after extraction with 02 M HDEHP in
dodecane from an aqueous phase irradiated at 7 kGy γ ndashradiation
Na5DTPA (M) 01 03 05 st dev t-test
J=1J=2 0505 0563 0551 0031 No sig diff
44 Luminescence Studies using GSH with Dy3+
As well as obtaining primary extraction data for GSH with Eu3+
under a variety
of conditions it is also important to consider the behaviour and extraction of other Ln3+
ions with the buffer in order to achieve effective lanthanide-actinide separation
0
1
2
3
4
5
6
7
8
9
10
550 600 650 700
Emis
sio
n In
ten
sity
(au
) Hu
nd
red
s
Wavelength (nm)
01 M DTPA Aq
03 M DTPA Aq
05 M DTPA Aq
01 M DTPA Org
03 M DTPA Org
05 M DTPA Org
155
Dysprosium(III) was chosen for a preliminary study as it is later in the lanthanide series
representing the heavier metal ions and how they may behave under such conditions
Also like Eu3+
it is emissive in the visible region of the electromagnetic spectrum and
so may be easily analysed by luminescence spectroscopy
441 Dy3+
Complexation Studies
Initial data were obtained for Dy3+
and emission spectra were recorded for the
free ion from Dy(NO3)3 Dy-DTPA (005 M Na5DTPA) and Dy(NO3)3 with GSH (05
M) all in aqueous solution (Figure 429) A concentration of 005 M Na5DTPA was
chosen for the dysprosium experiments as the emission intensity of Dy3+
is relatively
weak and this technique is not sensitive enough to observe any extraction of the metal
from high Na5DTPA concentrations
Figure 429 Emission spectra of Dy(NO3)3 (10 mM) Dy-DTPA (10 mM Dy(NO3)3
005 M Na5DTPA) and Dy(NO3)3 (10 mM) with GSH (05 M) in H2O following
excitation at 352 nm Note that the tail of ligand emission can be seen in the Dy DTPA
and Dy GSH solutions at shorter wavelengths
The spectra show that the emission intensity of the 7F92 rarr
6H152 and
7F92 rarr
6H132 transitions is slightly higher when GSH buffer is present in solution than for the
free ion alone and the intensity is much greater when Na5DTPA is present in the
solution showing formation of a Dy-DTPA complex Interestingly evidence for
binding of GSH and DTPA with Dy3+
is further manifested in the emission spectra by
the presence of residual ligand emission at higher energy These samples were then
00
02
04
06
08
10
12
14
16
425 475 525 575 625 675
Emis
sio
n In
ten
sity
(au
) x
10
00
0
Wavelength (nm)
Dy H2O
Dy DTPA
Dy GSH
7F92 rarr
6H152
7F92 rarr
6H132
156
extracted into an organic phase of 10 M HDEHP in dodecane (Figure 430) as 02 M
extractant was found to be too low to observe any Dy3+
extraction due to the overall
weak emission of the ion relative to Eu3+
Figure 430 Emission spectra of aqueous and organic phases of Dy(NO3)3 Dy-DTPA
and Dy(NO3)3 with GSH after extraction with 10 M HDEHP following excitation at
352 nm
The spectra show that without Na5DTPA present the Dy3+
is extracted into the
organic phase but for the Dy-DTPA complex little or no metal extraction is observed in
the absence of competitive binding with Am3+
This may indicate that the metal is not
being extracted into the organic phase and that the heavier lanthanides may suffer the
same kinetic issues present for amino acid buffers at higher pH (Section 332) or that
this technique is not sensitive enough to obtain good extraction data for less emissive
lanthanides
442 pH Dependence Studies
To attempt to determine whether kinetic issues arise for heavier lanthanides with
GSH buffer at higher pH values a pH study was carried out on Dy-DTPA systems
containing 005 M Na5DTPA and 05 M GSH over a pH range of 2-4 One sample
containing 03 M Na5DTPA was also measured analogous to the europium data sets
The extraction data can be seen in Figure 431
00
02
04
06
08
10
12
14
425 475 525 575 625 675
Emis
sio
n In
ten
sity
(au
) x
10
00
0
Wavelength (nm)
Dy H2O Aq
Dy DTPA Aq
Dy GSH Aq
Dy H2O Org
Dy DTPA Org
Dy GSH Org
157
Figure 431 Emission spectra of aqueous and organic phases of Dy(NO3)3 Dy-DTPA
and Dy(NO3)3 with GSH after extraction with 10 M HDEHP following 352 nm
excitation
The extraction is lowest for the sample with the highest Na5DTPA
concentration as would be expected As the pH increases the extraction of Dy3+
decreases suggesting that the same kinetic issues may also be present in for the GSH
system Further investigation using a more sensitive technique such as ICP-MS is
necessary to confirm this (Section 46)
45 Luminescence Studies using GSH with Mixed Ln3+
Systems at pH 4
The Dy3+
luminescence work was extended to solutions of a mixture of 4
luminescent lanthanide ions (Sm3+
Eu3+
Tb3+
and Dy3+
) to be able to probe the relative
extraction of different lanthanides from a mixture relevant to a real TALSPEAK type
process The spectra are colour coded to each ionrsquos luminescent colour under UV light
irradiation
451 Complexation Studies
Initial data were obtained for each lanthanide ion and emission spectra were
recorded for Ln(NO3)3 Ln-DTPA (005 M Na5DTPA) and Ln(NO3)3 with GSH (05
M) all in aqueous solution (Figures 432-434) analogous to the Dy3+
data
00
01
02
03
04
05
06
07
08
09
10
550 560 570 580 590
Emis
sio
n In
ten
sity
(au
) x 1
00
00
Wavelength (nm)
pH 2 Aq
pH 3 Aq
pH 4 Aq
pH 4 (03 M DTPA) Aq
pH 2 Org
pH 3 Org
pH 4 Org
pH 4 (03 M DTPA) Org
158
Figure 432 Emission spectra of Ln(NO3)3 (1 mM EuTbSm3+
10 mM Dy3+
) in H2O
at pH 4 following direct excitation (405 nm for Sm3+
397 nm for Eu3+
366 nm for Tb3+
and 352 nm for Dy3+
)
Figure 433 Emission spectra of Ln(NO3)3 (1 mM EuTbSm3+
10 mM Dy3+
) with
GSH (05 M) at pH 4 in H2O following direct excitation (405 nm for Sm3+
397 nm for
Eu3+
366 nm for Tb3+
and 352 nm for Dy3+
)
0
5
10
15
20
25
30
35
40
45
50
450 500 550 600 650 700 750
Emis
sio
n In
ten
sity
(au
) H
un
dre
ds
Wavelength (nm)
Sm
Eu
Tb
Dy
0
2
4
6
8
10
12
14
16
18
20
450 500 550 600 650 700 750
Emis
sio
n In
ten
sity
(au
) Th
ou
san
ds
Wavelength (nm)
Sm
Eu
Tb
Dy
159
Figure 434 Emission spectra of Ln-DTPA (1 mM EuTbSm3+
10 mM Dy3+
005 M
Na5DTPA) in H2O at pH 4 following direct excitation (405 nm for Sm3+
397 nm for
Eu3+
366 nm for Tb3+
and 352 nm for Dy3+
)
For all of the metal ions the emission intensity is greater in the sample with
GSH than for the free ions in solution due to reduced quenching by the presence of the
buffer The profiles of all of the spectra remain the same showing that although the
glutathione may be in exchange with surrounding water molecules a stable complex
between the buffer and metal ions is not being formed The emission intensity is much
greater for each of the metal ions with Na5DTPA due to the formation of a Ln-DTPA
complex in each case and the peak splitting observed for the Eu3+
complex can also be
seen for the Tb3+
complex as the emission spectra of these ions are more sensitive to
their co-ordination environment than Sm3+
or Dy3+
Table 416 Luminescence lifetimes for lanthanide samples at pH 4
Sample Lifetime (μs)
Sm(III) Eu (III) Tb(III) Dy (III)
Ln3+
341 plusmn 1 121 plusmn 25 394 plusmn 19 525 plusmn 1
Ln3+
with
GSH
686 plusmn 1 184 plusmn 8 558 plusmn 28 830 plusmn 1
Ln-DTPA 11 plusmn 1 671 plusmn 4 1930 plusmn 20 14 plusmn 1
0
1
2
3
4
5
6
7
450 500 550 600 650 700 750
Emis
sio
n In
ten
sity
(au
) x
10
00
0
Wavelength (nm)
Sm
Eu
Tb
Dy
160
The luminescence lifetimes of all the metal ions (Table 416) are in the expected
ranges for these ions in aqueous solutions and exhibit the same pattern as the emission
intensities increasing as GSH is added to the metal solutions and being greatest for the
Ln-DTPA complexes The q values were calculated for Eu3+
and Tb3+
as calculations of
q for Sm3+
and Dy3+
are unreliable and were as expected with a hydration number of
around 8 for the M3+
ion in solution co-ordination of around 5 for the M3+
ion with
GSH (consistent with the [GSH] dependence studies in Section 421) and 1 water
molecule bound to the Ln-DTPA complex
Table 417 Luminescence lifetimes and q values for Eu3+
and Tb3+
samples at pH 4
Sample Lifetime (μs) q
Eu (III)
H2O
Eu (III)
D2O
Tb(III)
H2O
Tb (III)
D2O
Eu(III) Tb(III)
Ln3+
121 plusmn 25 2309 plusmn 38 394 plusmn 19 1698 plusmn 16 82 82
Ln3+
with
GSH
184 plusmn 8 1658 plusmn 26 558 plusmn 28 1889 plusmn 12 52 53
Ln-DTPA 671 plusmn 4 2066 plusmn 15 1930 plusmn 20 3546 plusmn 27 09 09
452 pH Dependence Studies
As with the dysprosium study extractions were carried out on the mixed
lanthanide samples under the same conditions The aqueous phases contained 005 M
Na5DTPA and 05 M GSH over a pH range of 2-4 The emission spectra of each
aqueous sample before extraction were also recorded but were found to be the same for
each pH The luminescence lifetimes of the samples were also very similar (Table 418)
consistent with the Eu3+
data (Section 422) The q values for Eu3+
and Tb3+
are as
expected with 1 water molecule bound to each Ln-DTPA complex (Table 419) As a
representative example the spectra for the pH 4 sample can be seen in Figure 435
161
Figure 435 Emission spectra of Ln(NO3)3 (1 mM EuTbSm3+
10 mM Dy3+
) with
GSH (05 M) and Na5DTPA (005 M) following direct excitation (405 nm for Sm3+
397
nm for Eu3+
366 nm for Tb3+
and 352 nm for Dy3+
)
Table 418 Luminescence lifetimes for aqueous phases before extraction over a
pH range of 2-4
Sample Lifetime (μs)
Sm(III) Eu (III) Tb(III) Dy (III)
pH 2 12 plusmn 1 677 plusmn 9 1851 plusmn 21 14 plusmn 1
pH 3 12 plusmn 1 715 plusmn 9 1934 plusmn 21 13 plusmn 1
pH 4 12 plusmn 1 699 plusmn 7 1912 plusmn 26 14 plusmn 1
Table 419 Luminescence lifetimes and q values for Eu3+
and Tb3+
samples before
extraction over a pH range of 2-4
Sample Lifetime (μs) q
Eu (III)
H2O
Eu (III)
D2O
Tb(III)
H2O
Tb (III)
D2O
Eu(III) Tb(III)
pH 2 677 plusmn 9 2897 plusmn 27 1851 plusmn 21 3765 plusmn 31 09 10
pH 3 715 plusmn 9 3011 plusmn 13 1934 plusmn 21 3705 plusmn 22 08 09
pH 4 699 plusmn 7 3032 plusmn 15 1912 plusmn 26 3815 plusmn 16 09 10
00
10
20
30
40
50
60
70
450 500 550 600 650 700 750
Emis
sio
n In
ten
sity
(au
) x
10
00
0
Wavelength (nm)
Sm
Eu
Tb
Dy
162
The spectra for the aqueous and organic phases after extraction with 10 M
HDEHP in dodecane (in order to ensure sufficient enough extraction to be observed by
this technique) are plotted in Figures 436-438
Figure 436 Emission spectra of aqueous and organic phases of Ln3+
with 05 M GSH
and 005 M Na5DTPA after extraction with 10 M HDEHP at pH 2 following direct
excitation (405 nm for Sm3+
397 nm for Eu3+
366 nm for Tb3+
and 352 nm for Dy3+
)
Figure 437 Emission spectra of aqueous and organic phases of Ln3+
with 05 M GSH
and 005 M Na5DTPA after extraction with 10 M HDEHP at pH 3 following direct
excitation (405 nm for Sm3+
397 nm for Eu3+
366 nm for Tb3+
and 352 nm for Dy3+
)
00
05
10
15
20
25
30
450 500 550 600 650 700 750
Emis
sio
n In
ten
sity
(au
) x
10
00
0
Wavelength (nm)
Sm Aq
Eu Aq
Tb Aq
Dy Aq
Sm Org
Eu Org
Tb Org
Dy Org
00
05
10
15
20
25
30
450 500 550 600 650 700 750
Emis
sio
n In
ten
sity
(au
) x
10
00
0
Wavelength (nm)
Sm Aq
Eu Aq
Tb Aq
Dy Aq
Sm Org
Eu Org
Tb Org
Dy Org
163
Figure 438 Emission spectra of aqueous and organic phases of Ln3+
with 05 M GSH
and 005 M Na5DTPA after extraction with 10 M HDEHP at pH 4 following direct
excitation (405 nm for Sm3+
397 nm for Eu3+
366 nm for Tb3+
and 352 nm for Dy3+
)
At all three pH values the order of extractability is Sm gt Eu gt Tb gt Dy
showing that the heavier lanthanides are the most difficult to extract The above data
demonstrate that extraction of Ln3+
is reasonably good at pH 2 and 3 but slightly lower
at pH 3 However at pH 4 extraction of all lanthanide ions is drastically reduced
particularly for Tb3+
and Dy3+
which have very low relative concentrations in the
organic phase Although the extraction of Sm3+
and Eu3+
is also greatly reduced there is
still some extraction of these metals into the organic phase This is consistent with the
previously obtained dysprosium results suggesting that there may be kinetic issues
present for heavier lanthanides at high pH The trend in relative extraction efficiency of
the Ln3+
ions approximately follows the relative stability constants of GSH-Ln
complexes Lighter Ln-GSH complexes are less stable an effect of charge density of the
Ln3+
cations so are extracted more efficiently This was investigated further by ICP-
MS
46 ICP-MS Studies with GSH
In order to determine whether a TALSPEAK type system using glutathione as a
buffer had the same kinetic issues as the amino acid systems whereby poor separation of
the heavier lanthanides was observed ICP-MS was carried out on extracted samples
containing 10 lanthanides (La-Ho with the exception of Pm) at pH 2 3 and 4 to
00
05
10
15
20
25
30
35
450 500 550 600 650 700 750
Emis
sio
n In
ten
sity
(au
) x
10
00
0
Wavelength (nm)
Sm Aq
Eu Aq
Tb Aq
Dy Aq
Sm Org
Eu Org
Tb Org
Dy Org
164
determine the distribution pattern of the series using GSH as a buffer The DLn values
can be seen in Figures 439 and 440 for the pH 2 and pH 3 data sets
Figure 439 DLn for varying GSH concentration at pH 2 with 005 M Na5DTPA after
extraction with 02 M HDEHP in dodecane
Figure 440 DLn for varying GSH concentration at pH 3 with 005 M Na5DTPA after
extraction with 02 M HDEHP in dodecane
0
5
10
15
20
25
30
35
40
56 57 58 59 60 61 62 63 64 65 66 67 68
Dis
trib
uti
on
Rat
io
Atomic Number
01 M GSH
02 M GSH
03 M GSH
04 M GSH
05 M GSH
Am3+
0
5
10
15
20
25
30
35
56 57 58 59 60 61 62 63 64 65 66 67 68
Dis
trib
uti
on
Rat
io
Atomic Number
01 M GSH
02 M GSH
03 M GSH
04 M GSH
05 M GSH
Am3+
165
The data set for pH 2 resembles a typical TALSPEAK curve as also
demonstrated by amino acids at pH 2 (Section 3) However at pH 3 the distribution of
the metal ions continues to decrease across the lanthanide series indicating that higher
pH is less favourable for extraction of the heavier lanthanides This may be explained
by the fact that the stability of Ln-GSH complexes is lower at lower pH values making
the metal ions easier to extract The analysis was also repeated for samples at pH 4 but
for some of the later lanthanides in the series the quantity of metal ion present was
below the limit of detection of the technique (004 ng mL-1
) so the data could not
accurately be plotted Corresponding separation factors can be seen in Table 420 and
plotted in Appendix 2 (for pH 2 and 3) Separation factors for all lanthanides are fairly
low at pH 2 compared to the original TALSPEAK process (SFEuAm = 91) The data also
show that for the earlier lanthanides as the pH is increased very high separation factors
can be achieved but separation is much lower for later lanthanides with increasing pH
This indicates that unfortunately the same kinetic issues are likely to be a problem at
higher pH for the glutathione buffered system as for the amino acid systems
166
Table 420 SFLnAm for varying GSH concentration over a pH range of 2-4 with
005 M Na5DTPA after extraction with 02 M HDEHP in dodecane
pH
[GSH]
(M)
SF
La Ce Pr Nd Sm Eu Gd Tb Dy Ho
2 01 234 171 148 107 136 158 216 222 237 234
2 02 244 176 145 103 134 146 215 229 239 244
2 03 263 183 145 105 137 165 243 244 281 289
2 04 239 170 151 111 145 168 218 237 259 265
2 05 278 197 164 117 162 189 257 269 300 314
3 01 1735 972 477 276 163 104 112 53 41 38
3 02 1953 841 433 256 320 266 290 130 89 77
3 03 1898 785 388 220 152 90 95 39 28 24
3 04 2046 812 412 243 196 121 126 53 38 34
3 05 2145 705 312 139 36 16 20 04 02 00
4 01 3777 141 12 - - - - - - -
4 02 5548 231 36 06 - - - - - -
4 03 2768 239 27 - - - - - - -
4 04 1620 150 21 01 - - - - - -
4 05 1589 286 48 11 - - - - - -
47 1H NMR Studies on GSH Systems
The glutathione systems were additionally studied by 1H NMR spectroscopy in
order to confirm the complexation observed by luminescence spectroscopy Spectra
were recorded in D2O for GSH GSH after irradiation Eu(NO3)3 with GSH (150)
Na5DTPA with GSH (110) and Eu-DTPA with GSH (1550
Eu(NO3)3Na5DTPAGSH) (Figures 441 a-e)
167
GSH0011resp
45 40 35 30 25 20 15 10
Chemical Shift (ppm)
0
005
010
Norm
alized Inte
nsity
197201200100200099
c
d
gb
i
f
44
944
844
6
38
9
37
637
437
2
28
628
628
528
4
24
924
824
724
624
524
4
21
120
920
720
5
GSH Irradiated0011resp
45 40 35 30 25 20 15 10
Chemical Shift (ppm)
0
005
010
015
020
025
Norm
alized Inte
nsity
133151244272014101206498131111059100
m
c
d
n
g
q
b
l
i
p
f
47
0
44
7 44
544
442
942
841
641
541
140
940
940
738
137
737
537
3
36
736
6
29
929
728
428
328
1
26
7
24
6
24
424
324
223
823
022
822
6
20
720
520
419
6
19
519
419
319
1
a
b
168
Eu GSH0011resp
45 40 35 30 25 20 15 10
Chemical Shift (ppm)
005
010
015
Norm
alized Inte
nsity
035183050206177050088216024026100
d
g
b
i
f
c
45
044
844
7
42
0 41
841
741
341
241
138
0 37
837
737
136
9 30
230
1
28
928
728
628
428
328
1
25
124
924
724
624
424
2 23
3 23
122
921
020
820
720
519
919
819
719
6
GSH DTPA0011resp
45 40 35 30 25 20 15 10
Chemical Shift (ppm)
0
005
010
015
Norm
alized Inte
nsity
032158045179156092075366021025099
c
d
g
DTPA
DTPA
DTPA
b
DTPA
i
f
45
044
9 44
744
6
41
941
841
741
241
141
0
37
937
737
537
036
8
34
133
633
5
30
730
530
1
28
928
628
528
428
228
0
25
024
824
624
524
324
1 23
223
022
821
020
820
620
419
719
5
c
d
169
EuDTPA GSH0011resp
45 40 35 30 25 20 15 10
Chemical Shift (ppm)
0
0005
0010
0015
0020
0025
0030
0035
0040
0045
0050
0055
Norm
alized Inte
nsity
180181200200212103673021100
47
0
44
244
1
38
4
36
836
3
32
832
0 30
230
129
9 28
628
528
328
1
24
724
624
524
424
3
20
820
720
520
3
Figure 441 1H NMR spectra for GSH in D2O under a range of conditions at 298 K a)
GSH b) GSH after irradiation with 7 kGy γ-radiation c) Eu(NO3)3 with GSH d) GSH
with Na5DTPA e) Eu-DTPA with GSH
Figure 442 1H
1NMR proton assignments for GSH (top) and γ-Glu-Cys (bottom)
It can be seen from spectra ldquoardquo and ldquobrdquo that there is some degradation of GSH
after irradiation with 7 kGy γ-radiation from a 60
Co irradiator shown by the presence of
e
170
γ-Glu-Cys fragments12
(Figure 442) The buffer seems to be susceptible to γ-radiolysis
and the integration ratios show that the γ-Glu-Cys fragments are present in a significant
quantity as the ratios are comparable to those of the intact GSH Spectrum ldquocrdquo shows
that the buffer does not form a stable complex with Eu3+
as there is only slight shifting
of the peaks indicating weak interaction and perhaps fast dynamic exchange on the
timescale of the NMR experiment There is also no notable paramagnetic broadening as
would be expected if a Eu3+
complex is formed Spectrum ldquoerdquo does show slight
paramagnetic broadening relative to spectrum ldquodrdquo (Na5DTPA with GSH) confirming
the formation of the Eu-DTPA complex seen in previous emission spectra (Section
422)
48 Summary and Conclusion of Glutathione Work
Since amino acids have not been shown to act as holdback reagents by
themselves the potential of using the tripeptide L-glutathione was investigated Initial
separation studies were carried out using glutathione at pH 4 as is was anticipated that
based on its pKa values glutathione would be most likely to act as a successful
holdback reagent at this pH despite the unfavourable increase of pH Preliminary
investigations found that like amino acids GSH is ineffective as a holdback reagent on
its own as there was no separation observed between Eu3+
and Am3+
when used without
Na5DTPA
Subsequent investigations were carried out using GSH alongside Na5DTPA to
determine whether separation was improved with the tripeptide buffer At pH 2 and pH
3 it was found that the glutathione acts solely as a buffer as the separation factor in each
case was independent of GSH concentration However at pH 4 separation between
Eu3+
and Am3+
was found to increase as the buffer concentration was increased
suggesting that the glutathione is interacting with the Ln-DTPA complexes at this pH
This could be explained by the increase in stability of Ln-GSH complexes as the pH is
increased A buffer concentration of 05 M was then used for all further optimisation
experiments
At 05 M GSH the separation factor was found to increase dramatically as a
function of Na5DTPA concentration up to 03 M Na5DTPA After this peak there was
a rapid decrease in separation as the concentration is increased further up to 06 M
Na5DTPA as the stoichiometry is close to 11 GSHDTPA The separation factors
achieved here were extremely high (~1000) ndash a factor of 10 higher than the current
171
TALSPEAK system and the optimised alanine system whilst still maintaining low Am3+
extraction
At 03 M Na5DTPA the separation factor then increased as the extractant
concentration was increased from 02 to 04 M HDEHP in dodecane after which the SF
began to decrease again with the optimum separation at 04 M giving a SF of 1238 At
04 M Na5DTPA however the separation factor decreases rapidly as the extractant
concentration is increased due to the DAm increasing by a factor of 1000 consistent with
the complexant and buffer possibly forming some kind of adduct which no longer
successfully holds back Am3+
at higher Na5DTPA concentrations
Luminescence experiments mimicking the separation studies showed that the
glutathione does not form a stable complex with the Eu3+
ion and is in exchange with
surrounding solvent molecules even at the highest buffer concentrations preventing the
GSH from acting as a holdback reagent and allowing extraction of the metal into the
organic phase Proton NMR spectroscopy confirmed that although the glutathione may
be in exchange with surrounding water molecules no stable complexes between the
buffer and metal ions are formed (Appendix 8)
In samples containing Na5DTPA a Eu-DTPA complex can be clearly observed
in the emission spectra with or without the presence of GSH over a pH range of 2-4
The J=1J=2 peak ratios showed that there is no change in the co-ordination mode of the
buffer to the metal ion as the concentration of GSH is increased for each pH However
across the data sets the co-ordination mode of glutathione was found to be different at
different pH values as expected based on pKa values and increasing stability constant
with pH
At 05 M GSH the co-ordination mode of the Eu-DTPA complex in the aqueous
phase was found not to change as [Na5DTPA] was changed with metal extraction
typically decreasing as the holdback reagent increases and at 03 M Na5DTPA with 05
M GSH extraction was found to increase as HDEHP concentration increased as
expected Unfortunately luminescence spectroscopy does not seem to be a sensitive
enough technique to gain much information from samples post-extraction using these
conditions
In order to determine how resistant the glutathione buffered system is to
radiolysis a selection of samples were irradiated with 7 kGy γ-radiation and analysed
by luminescence and 1H NMR spectroscopies The radiation was seen to have some
degrading effect on the buffer in the aqueous phase with slightly decreased
luminescence emission intensity of complexes post-irradiation and evidence of
172
significant quantities of γ-Glu-Cys fragments present in the 1H NMR spectrum
However the emission profiles co-ordination mode and luminescence lifetimes of the
samples remained unchanged Extraction also seemed to be unaffected with the
emission remaining relatively constant for each of the phases of the samples after
irradiation
Initial data obtained on the glutathione system with europium(III) and
americium(III) seemed promising as after optimisation very high separation factors
were achieved and despite the buffer being susceptible to radiolysis extraction of
lanthanide ions was still high after irradiation However in order to be a successful
alternative to the current TALSPEAK system it is essential that effective separation of
all lanthanides from MA3+
can occur Further luminescence experiments were carried
out firstly on an analogous dysprosium system in order to represent heavier lanthanide
elements followed by a mixture of 4 lanthanide metals in the same samples
For the dysprosium study as the pH was increased from 2-4 the extraction of
Dy3+
decreased suggesting that the same kinetic issues noted for heavier lanthanides in
the amino acid systems may also be present for the GSH system at higher pH values In
the mixed samples the same pattern was observed with extraction of Ln3+
decreasing as
pH was increased At pH 4 extraction of all lanthanide ions was very low particularly
for Tb3+
and Dy3+
which are both heavier than Sm3+
and Eu3+
ICP-MS was carried out
on a series of samples containing a mixture of 10 lanthanides in order to confirm
whether the heavier lanthanides are in fact subject to kinetic issues with GSH
ICP-MS data was consistent with the luminescence data showing decreased
extraction of heavier lanthanides as pH increases from 2 to 4 The quantity of metal
extracted was so low it was below the limit of detection for some of the heavier metals
at pH 4 forcing the conclusion that unfortunately the same kinetic issues are a problem
at higher pH for the glutathione buffered system as for the amino acid systems Further
optimisation of the system to exploit the combined liquid-liquid extraction efficiencies
as a function of atomic number may allow the development of an extraction process of
lighter over heavier lanthanides for rare earth recycling which is currently a
strategically important goal13
173
1 ImmuneHealthSciencecom What Glutathione (GSH) is and how it affects your
immune health httpwwwimmunehealthsciencecomglutathionehtml 2015
2 ME Sears Scientific World Journal 2013 2013 219840
3 L Patrick Mercury toxicity and antioxidants Part I Role of glutathione and alpha-
lipoic acid in the treatment of mercury toxicity Alternative Medicine 2002
4 EA Bump and JM Brown Pharmacol Ther 1990 47 1 117-136
5 JB Mitchell and A Russo Br J Cancer 1987 55 Suppl VIII 96-104
6 VV Nikonorov J Anal Chem 2010 65 4 359-365
7 A Miličević and N Raos Acta Chim Slov 2014 61 904-908
8 BS Garg BK Singh DN Kumar and PK Sing Indian J Chem 2003 42A 79-83
9 Sigma Aldrich Product Information
httpwwwsigmaaldrichcometcmedialibdocsSigma-AldrichProduct_Information_
Sheetg4251pisPar0001Filetmpg4251pispdf
10 SJA Pope BP Burton-Pye R Berridge T Khan PJ Skabara and S Faulkner
Dalton Trans 2006 2907-2912
11 TS Grimes MP Jensen L Debeer-Schmidt K Littrell and KL Nash J Phys
Chem B 2012 116 46 13722-13730
12 RJ Hopkinson PS Barlow CJ Schofield and TDW Claridge Org Biomol
Chem 2010 8 4915-4920
13 LS Natrajan and MH Langford Paden f-Block Elements Recovery in A Hunt ed
Element Recovery and Sustainability RSC 2013 6 140-184
174
5 MODIFIED DTPA LIGANDS AS COMBINED BUFFERS AND SOFT
DONORS IN A TALSPEAK SYSTEM
Amino acids and the tripeptide L-glutathione have been shown not to be suitable
as a combined buffer and soft-donor for potential replacement of DTPA
(diethylenetriaminepentaacetic acid) and the lactate buffer used in the TALSPEAK
process (Trivalent Actinide Lanthanide Separation by Phosphorus reagent Extraction
from Aqueous Complexation) an advanced reprocessing technique currently being
developed in the USA They do not act as holdback reagents in their own right as they
do not bind preferentially to minor actinide (MA3+
) over lanthanide (Ln3+
) ions
preventing enhanced selective extraction of Ln3+
by HDEHP (di-
(2ethylhexyl)phosphoric acid) into an organic phase The possibility of synthesising a
combined buffer and soft-donor with DTPA and amino acid functionality was therefore
considered
By incorporating additional soft donors onto the DTPA structural framework
from amino acids the overall system would be simplified to just two components rather
than three This could be achieved by incorporating an amino acid or other soft donor
compounds into the DTPA scaffold itself (Figure 51) This strategy may increase the
complexation affinity binding constants and associated thermodynamic parameters to
the MA3+
ion improving the separation and slowing down the kinetics of the exchange
processes if the ligand has a significant specificity for MA3+
over Ln3+
This is
especially true if two of the carboxylic acid moieties are replaced by relatively softer
donors here amide groups
A report on bis(methionine)-appended DTPA was published by Hazari et al in
2010 on the use of Tc-DTPA-bis(methionine) in tumour imaging1 however there are no
literature reports on the synthesis or use of amino acid appended or any modified DTPA
ligands for solvent extraction and separation studies
The work described in this chapter was performed in collaboration with an
MChem student a summer student and the Institute for Waste disposal (INE)
Karlsruhe Germany The initial ligand syntheses were carried out jointly between
myself and the MChem student and all luminescence analysis was performed jointly
The refining of the syntheses and characterisation of the ligands was carried out by a
summer student All separation work using the ligands was carried out by colleagues at
INE
175
Figure 51 General structure of DTPA-amino acid ligands
51 Ligand Synthesis and Characterisation
A route for the synthesis of DTPA-bis(amino acids) was devised involving ring
opening of the anhydride of DTPA with an amine group of the amino acid in question
whereby the amino acid is incorporated onto two of the side arms of the DTPA
according to Scheme1234
Initially the reaction was attempted using the acid forms of
the amino acid L-alanine however the reaction was found to be unsuccessful since only
an amino acid dimer could be isolated In order to allow optimisation of the reaction
conditions whilst avoiding competitive side reactions the reactions were repeated using
the methyl or ethyl ester protected forms of the amino acids Here commercially
available methyl esters of L-alanine L-arginine and L-histidine and the ethyl ester of L-
serine were used The amide coupling reactions with these amino acid derivatives using
triethylamine as the base proceeded in high yield However isolation and purification of
the products was found to be quite difficult as the reaction products are very
hygroscopic and stubbornly retain residual triethylamine salts Therefore the relatively
impure ligands were isolated for further studies following multiple re-precipitations and
re-crystallisation All the ligands were characterised by 1H NMR spectroscopy
MALDI-MS and elemental analysis (Section 742)
Scheme 1 Synthesis of DTPA-bis(amino) alkyl esters
Protected
Protected Protected
176
52 Luminescence Studies on Ligand Systems at pH 2 3 and 4
521 Aqueous Phase Studies
The DTPA-amino acid ligands synthesised were studied by luminescence
spectroscopy in a TALSPEAK type system The ligands self-buffer at approximately
pH 2 at 50 mM concentration but to ensure consistency in studies the pH of systems
were adjusted to exact pH values (plusmn 01) Aqueous phases were prepared containing 50
mM ligand and 1 mM Eu(NO3)3 at pHpD 2 3 and 4 for each of the four synthesised
ligands Samples were measured in D2O and H2O The emission spectra of the D2O
samples can be seen in Figures 52-54 The spectra for the samples in H2O are identical
but with lower relative emission intensities
Figure 52 Emission spectra of Eu(NO3)3 with DTPA-bis(amino ester) ligands in D2O
at pD 2 following excitation at 397 nm
0
5
10
15
20
25
30
35
550 575 600 625 650 675 700
Emis
sio
n In
ten
sity
(au
) x
10
00
0
Wavelength (nm)
Ala-DTPA
Arg-DTPA
His-DTPA
Ser-DTPA
177
Figure 53 Emission spectra of Eu(NO3)3 with DTPA-bis(amino ester) ligands in D2O
at pD 3 following excitation at 397 nm
Figure 54 Emission spectra of Eu(NO3)3 with DTPA-bis(amino ester) ligands in D2O
at pD 4 following excitation at 397 nm
The emission spectra are all very similar and show clear complexation of the
Eu3+
ion with each ligand There is little difference in emission intensity and form of the
spectra across all of the samples which indicates that all of the ligands present the same
coordination environment to the Eu3+
centre as expected
Table 51 J=1J=2 peak ratios and t-test results for Eu- DTPA-bis(amino ester)
complexes at pD 2-4
0
5
10
15
20
25
30
35
550 575 600 625 650 675 700
Emis
sio
n In
ten
sity
(au
) x
10
00
0
Wavelength (nm)
Ala-DTPA
Arg-DTPA
His-DTPA
Ser-DTPA
0
5
10
15
20
25
30
550 575 600 625 650 675 700
Emis
sio
n In
ten
sity
(au
) x
10
00
0
Wavelength (nm)
Ala-DTPA
Arg-DTPA
His-DTPA
Ser-DTPA
178
DTPA-
(AlaOMe)2
DTPA-
(ArgOMe)2
DTPA-
(HisOMe)2
DTPA-
(SerOEt)2
st dev t-test
pD 2 0359 0381 0404 0353 0023
No sig
diff
pD 3 0394 0425 0417 0381 0020
No sig
diff
pD 4 0391 0427 0432 0423 0019
No sig
diff
st dev 0019 0026 0014 0035
t-test No sig
diff
No sig
diff
No sig
diff
No sig
diff
The J=1J=2 peak height ratios were recorded for each emission spectrum and t-
tests were carried out on the peak ratios using the t-test data analysis tool in Microsoft
Excel accounting for the standard deviations between the ratios (Table 51) For each
data set the range in the ratios is small and there is no significant difference between
the values again suggesting that the co-ordination mode of the each of the ligands to the
metal ion is the same Across the data sets unlike the glutathione system (Chapter 4)
no significant difference was observed either as pD increases from pD 2 to pD 4
indicating that the co-ordination mode of the complexes is not changing with pH
The luminescence lifetimes of each sample were recorded in H2O and D2O in
order to determine the q value of the complexes using the modified Horrocks equation
(Equation 110) These results are summarised in Table 52
179
Table 52 Luminescence lifetimes and q values for Eu-DTPA-bis(amino ester)
complexes at pD 2-4 recorded at the emission maximum (617 nm) following 397 nm
excitation
pH amp Ligand τ D2O (μs) τ H2O (μs) q plusmn 02
pH 2 DTPA-(AlaOMe)2 1794 plusmn 7 587 plusmn 8 09
pH 2 DTPA-(ArgOMe)2 1828 plusmn 12 626 plusmn 10 08
pH 2 DTPA-(HisOMe)2 1816 plusmn 10 614 plusmn 9 09
pH 2 DTPA-(SerOEt)2 1759 plusmn 9 563 plusmn 11 10
pH 3 DTPA-(AlaOMe)2 1981 plusmn 12 587 plusmn 11 10
pH 3 DTPA-(ArgOMe)2 2335 plusmn 16 604 plusmn 12 10
pH 3 DTPA-(HisOMe)2 1963 plusmn 8 607 plusmn 13 09
pH 3 DTPA-(SerOEt)2 1839 plusmn 13 588 plusmn 12 09
pH 4 DTPA-(AlaOMe)2 1908 plusmn 17 608 plusmn 11 09
pH 4 DTPA-(ArgOMe)2 1907 plusmn 13 601 plusmn 17 09
pH 4 DTPA-(HisOMe)2 1905 plusmn 14 604 plusmn 15 09
pH 4 DTPA-(SerOEt)2 1890 plusmn 10 609 plusmn 16 09
All of the complexes have approximately 1 water molecule in the inner
hydration sphere This is consistent with the formation of a Eu-DTPA-amide ligand
complex The values are generally slightly less than 1 in contrast to [Eu-DTPA]2-
itself
where q = 11 indicating the likely fast exchange of the bound water molecule with
other surrounding water molecules and that the amino ester appendage may inhibit the
close approach of more than one water molecule due to steric reasons
522 Extraction Studies
Extractions were carried out on the samples using 06 M HDEHP in dodecane
for the organic phase The emission spectra of both the aqueous and organic phases
post-extraction can be seen in Figures 55-58
180
Figure 55 Emission spectra of aqueous phases after Eu3+
extraction from an aqueous
phase containing DTPA-bis(amino ester) ligands (50 mM) at pH 2 following excitation
at 397 nm
Figure 56 Emission spectra of aqueous and organic phases after Eu3+
extraction from
an aqueous phase containing DTPA-bis(amino ester) ligands (50 mM) at pH 2
following excitation at 397 nm
0
0
0
0
0
1
1
550 575 600 625 650 675 700
Emis
sio
n In
ten
sity
(au
) Th
ou
san
ds
Wavelength (nm)
Ala-DTPA Aq
Arg-DTPA Aq
His-DTPA Aq
Ser-DTPA Aq
0
10
20
30
40
50
60
70
550 575 600 625 650 675 700
Emis
sio
n In
ten
sity
(au
) Th
ou
san
ds
Wavelength (nm)
Ala-DTPA Aq Arg-DTPA Aq His-DTPA Aq Ser-DTPA Aq Ala-DTPA Org Arg-DTPA Org His-DTPA Org Ser-DTPA Org
181
Figure 57 Emission spectra of aqueous and organic phases after Eu3+
extraction from
an aqueous phase containing DTPA-bis(amino ester) ligands (50 mM) at pH 3
following excitation at 397 nm
Figure 58 Emission spectra of aqueous and organic phases after Eu3+
extraction from
an aqueous phase containing DTPA-bis(amino ester) ligands (50 mM) at pH 4
following excitation at 397 nm
0
2
4
6
8
10
12
550 575 600 625 650 675 700
Emis
sio
n In
ten
sity
(au
) x
10
00
0
Wavelength (nm)
Ala-DTPA Aq Arg-DTPA Aq His-DTPA Aq Ser-DTPA Aq Ala-DTPA Org Arg-DTPA Org His-DTPA Org Ser-DTPA Org
0
1
2
3
4
5
6
7
550 575 600 625 650 675 700
Emis
sio
n In
ten
sity
(au
) x
10
00
0
Wavelength (nm)
Ala-DTPA Aq
Arg-DTPA Aq
His-DTPA Aq
Ser-DTPA Aq
Ala-DTPA Org
Arg-DTPA Org
His-DTPA Org
Ser-DTPA Org
182
The Eu-HDEHP complex formed in the organic phase has different symmetry to
Eu-DTPA complexes in the aqueous phase as can be seen be the different profile of the
emission spectra of the organic phases The extraction data show that the best Eu3+
extraction occurs at pH 2 under these conditions as there is complete metal extraction
into the organic phase for all of the ligands and very little or no metal remaining in the
aqueous phase Above pH 2 the extraction of Eu3+
decreases leaving some of the metal
ion in the aqueous phase at pH 3 and an even higher proportion at pH 4 At pH 3
extraction is relatively higher with the DTPA-(SerOEt)2 ligand than any of the other
ligands and at pH 4 extraction is higher with DTPA-(HisOMe)2 and DTPA-(ArgOMe)2
The J=1J=2 peak ratios for the organic phases (Table 53) show no significant
difference in co-ordination mode within the pH 2 or pH 4 data for each ligand however
the co-ordination can be seen to change slightly with each ligand at pH 3 Also no
significant difference is observed as pH is changed for DTPA-(ArgOMe)2 and DTPA-
(AlaOMe)2 however there is a significant difference observed for DTPA-(SerOEt)2 and
DTPA-(HisOMe)2 as pH is changed Each emission spectrum was recorded 5 times and
an average taken and repeat measurements were also taken so whilst the data is
reproducible it appears to be inconsistent and difficult to explain without further
investigation into the co-ordination environment at different pH values by means other
than luminescence spectroscopy although it can be seen that pH 2 is optimum for
extraction using these ligands
Table 53 J=1J=2 peak ratios and t-test results for organic phases after extraction after
Eu3+
extraction aqueous phases containing DTPA-bis(amino ester) ligands (50 mM) at
pH 2-4
DTPA-
(AlaOMe)2
DTPA-
(ArgOMe)2
DTPA-
(HisOMe)2
DTPA-
(SerOEt)2
st dev t-test
pH 2 0208 0207 0198 0208 0005 No sig diff
pH 3 0210 0213 0311 0347 0069 Sig diff
pH 4 0182 0210 0206 0205 0013 No sig diff
st dev 0016 0003 0063 0081
t-test No sig diff No sig diff Sig diff Sig diff
183
53 Radiolysis Studies on Ligand Systems at pH 2
531 Aqueous Phase Studies
In order to determine how resistant the ligand are to radiolysis a selection of
samples at pHpD 2 containing 50 m M ligand and 1 mM Eu(NO3)3 were irradiated at
the Dalton Cumbrian Facility using a 60
Co irradiator The samples were exposed to 7
kGy γ-radiation and analysed by luminescence spectroscopy The emission spectra of
the D2O samples can be seen in Figure 59 The spectra for the samples in H2O are the
same but with lower emission intensity
Figure 59 Emission spectra of Eu(NO3)3 in D2O with DTPA-bis(amino ester) ligands
(50 mM) at pH 2 after irradiation with 7 kGy γ-radiation and following excitation at
397 nm
The spectra of the samples are the same after irradiation as beforehand
indicating that the radiation has little or no degrading effect on the complexes in the
aqueous phase The J=1J=2 ratios and co-ordination mode remained unchanged (Table
54) as do the luminescence lifetimes and q values of the samples (Table 55)
0
5
10
15
20
25
30
35
550 575 600 625 650 675 700
Emis
sio
n In
ten
sity
(au
) Th
ou
san
ds
Wavelength (nm)
Ala-DTPA
Arg-DTPA
His-DTPA
Ser-DTPA
184
Table 54 J=1J=2 peak ratios and t-test results for Eu-DTPA-bis(amino ester)
complexes at pD 2 after irradiation with 7 kGy γ-radiation
DTPA-
(AlaOMe)2
DTPA-
(ArgOMe)2
DTPA-
(HisOMe)2
DTPA-
(SerOEt)2 st dev t-test
J=1J=2 0357 0395 0412 0362 0026 No sig
diff
Table 55 Luminescence lifetimes and q values for Eu-DTPA-bis(amino ester)
complexes at pD 2-4 after irradiation with 7 kGy γ-radiation
Ligand τ D2O (μs) τ H2O (μs) q plusmn 02
DTPA-(AlaOMe)2 1818 plusmn 7 613 plusmn 8 09
DTPA-(ArgOMe)2 1843 plusmn 12 586 plusmn 10 10
DTPA-(HisOMe)2 1803 plusmn 10 629 plusmn 9 08
DTPA-(SerOEt)2 1809 plusmn 9 598 plusmn 11 09
532 Extraction Studies
Extractions were then carried out on some of the irradiated samples using 06 M
HDEHP in dodecane The emission spectra of both the aqueous and organic phases
post-extraction can be seen in Figure 510
Figure 510 Emission spectra of aqueous and organic phases after Eu3+
extraction from
an irradiated (7 kGy γ-radiation) aqueous phase containing DTPA-bis(amino ester)
ligands (50 mM) at pH 2 following excitation at 397 nm
0
1
2
3
4
5
6
550 575 600 625 650 675 700
Emis
sio
n In
ten
sity
(au
) Th
ou
san
ds
Wavelength (nm)
Ala-DTPA Aq Arg-DTPA Aq His-DTPA Aq Ser-DTPA Aq Ala-DTPA Org Arg-DTPA Org His-DTPA Org
185
The emission profiles of the samples are the same after irradiation as
beforehand indicating that the radiation has little or no degrading effect on the
complexes in the aqueous phase The emission intensity is lower for the organic phases
after irradiation than beforehand possibly due to increased quenching effects caused by
radicals present as a result of irradiating the solvents The J=1J=2 ratios and co-
ordination mode for the organic phase remained unchanged (Table 56) and the
luminescence lifetimes can be seen to decrease only slightly after irradiation consistent
with the decrease in emission intensity (Table 57)
Table 56 J=1J=2 peak ratios and t-test results for the organic phases after Eu3+
extraction from aqueous phases containing DTPA-bis(amino ester) ligands (50 mM) at
pH 2 one of which had been irradiated with 7 kGy γ-radiation
DTPA-
(AlaOMe)2
DTPA-
(ArgOMe)2
DTPA-
(HisOMe)2
DTPA-
(SerOEt)2
st dev t-test
J=1J=2 0241 0233 0198 0231 0019
No sig
diff
Table 57 Luminescence lifetimes and q values for the organic phases after Eu3+
extraction from aqueous phases containing DTPA-bis(amino ester) ligands (50 mM) at
pH 2 one of which had been irradiated with 7 kGy γ-radiation
Ligand τ organic phase
without irradiation
(micros)
τ organic phase after
irradiation
DTPA-(AlaOMe)2 2151 plusmn 21 1829 plusmn 18
DTPA-(ArgOMe)2 1881 plusmn 19 1821 plusmn 17
DTPA-(HisOMe)2 2265 plusmn 18 2227 plusmn 18
DTPA-(SerOEt)2 1856 plusmn 20 1777 plusmn 19
54 Separation Work on Ligand Systems
Some separation work using these ligands was carried out with the help of
Andreas Geist at KIT-INE in Germany Extractions were performed under TALSPEAK
conditions but using kerosene as the organic phase due to availability
186
541 AmEu Separation in Ligand Systems
A stock spiking solution of 241
Am + 152
Eu (1 kBq mL-1
) was added to a solution
of yttrium and lanthanides (10 mgdm3 of each Ln(NO3)3) with each ligand (50 mM) for
DTPA-(ArgOMe)2 DTPA-(SerOEt)2 DTPA-(HisOMe)2 at pH 1-2 The aqueous phases
were contacted with HDEHP (02 M) in kerosene and shaken for 30 minutes The
phases were then separated and the Am3+
and Eu3+
concentrations in each phase were
determined by Gamma counting The separation factors for all ligands under these
conditions were found to be approximately 100 across the pH range measured Graphs
of these data are plotted in Figures 511-513 These values are comparable with the
original TALSPEAK process using lactate (SF = 91) Although the TALSPEAK
process uses dodecane rather than kerosene and as such the results are therefore not
directly comparable they still show selectivity between Am3+
and Eu3+
for these
ligands However the DAm using these ligands is 2-3 orders of magnitude higher than in
the original TALSPEAK process (~025-200 compared to 0009) indicating that Am3+
is not being held back sufficiently by the ligand for this to be a viable process and that
more work is needed to decrease the partitioning of Am3+
into the organic phase This
may be possible with optimisation of the systems by varying the pH concentration of
ligand concentration of extractant and by modifying the solubility of the ligands ie by
cleavage of the methyl and ethyl ester groups to generate the amino acid Nevertheless
these results are particularly encouraging
Figure 511 Separation factors and distribution ratios for Eu3+
Am3+
using DTPA-
(ArgOMe)2 (005 M) at pH 1-2 extracted using HDEHP (02 M) in kerosene
187
Figure 512 Separation factors and distribution ratios for Eu3+
Am3+
using DTPA-
(SerOEt)2 (005 M) at pH 1-2 extracted using HDEHP (02 M) in kerosene
Figure 513 Separation factors and distribution ratios for Eu3+
Am3+
using DTPA-
(HisOMe)2 (005 M) at pH 1-2 extracted using HDEHP (02 M) in kerosene
542 Ln Separation in Ligand Systems
In addition to the Eu3+
Am3+
separation studies carried out at KIT-INE using
these amino ester appended DTPA ligands further experiments were conducted to
observe the separation across the lanthanide series by ICP-MS under the same
conditions The graphs of the distribution ratios for each Ln3+
and Am3+
can be seen in
Figures 514-516 for each ligand as well as the separation factor for Nd3+
Am3+
(as
188
Nd3+
is the most difficult lanthanide to extract) The SFNdAm in each case is 30-40 over
the pH range 1-2 These separation factors are good only slightly lower than the
original lactate-buffered TALSPEAK process (SFNdAm ~ 55) and the distribution ratios
for the heavier lanthanides are particularly high higher than the original process with a
greater proportion of them having D values of over 1000 (Figures 514-516)
Figure 514 Distribution ratios for Ln3+
using DTPA-(ArgOMe)2 (005 M) at pH 1-2
extracted using HDEHP (02 M) in kerosene
189
Figure 515 Distribution ratios for Ln3+
using DTPA-(SerOEt)2 (005 M) at pH 1-2
extracted using HDEHP (02 M) in kerosene
Figure 516 Distribution ratios for Ln3+
using DTPA-(HisOMe)2 (005 M) at pH 1-2
extracted using HDEHP (02 M) in kerosene
190
55 Summary and Conclusion of Modified DTPA Ligand Work
After initial difficulties synthesising amino acid appended DTPA ligands the
ligands were successfully synthesised in good yields (~60 ) for DTPA-(AlaOMe)2
DTPA-(ArgOMe)2 DTPA-(SerOEt)2 and DTPA-(HisOMe)2 using ester protected
versions of the amino acids The ligands were shown by luminescence spectroscopy to
complex to Eu3+
at pH 2 3 and 4 forming Eu-DTPA-bis(amino ester) adduct with 1
water molecule in fast exchange in the inner hydration sphere Under TALSPEAK
conditions the ligands were found to be more effective holdback reagents at the lower
pH of 2 but also effectively extract Eu3+
over Am3+
as low as pH 15 This is in stark
contrast to the original TALSPEAK process The co-ordination mode of the ligands to
the metal ion was consistent for all of the ligands but was found to change slightly upon
changing pH although the overall coordination number of Eu3+
with the ligands
remained as approximately 8 (with the 9th
coordination site being completed by one
water molecule) Studies showed that the ligands are relatively resistant to radiolysis
when subjected to 7 kGy γ radiation as there was no change in their luminescence
emission profile co-ordination mode or hydration number after irradiation
Results from separation studies conducted at KIT-INE using gamma counting
and ICP-MS showed that the modified DTPA ligands successfully allowed separation
between Ln3+
Am3+
giving good separation factors comparable to the original lactate-
buffered TALSPEAK process (SFEuAm ~100) even for Nd3+
which is the most difficult
lanthanide to extract in the process (SFNdAm ~30-40) The extraction efficiency of all the
ligands broadly relates to the atomic number of the lanthanide ions (apart from La3+
Ce3+
and Pr3+
) with the heavier ions being preferentially extracted as expected The
separation factors of individual lanthanide pairs range from approximately 25 to gt 100
and for the Dy3+
Nd3+
pair of particular economic importance are quite reasonable SF
DyNd ~ 30
However the distibution ratio for Am3+
is higher than desired (025-200 vs
0009) and so optimisation of the systems would be necessary to try to reduce DAm for
the combined buffer soft-donor system to be viable Another step would also be to try to
deprotect the amino acids on the ligands hydrolysing the esters back to carboxylic acid
groups to see if that would increase the holdback ability of the ligands and possibly
decrease the distribution ratio of Am3+
191
1 PP Hazari G Shukla V Goel K Chuttani N Kumar R Sharma and AK Mishra
Bioconjugate Chem 2010 21 229-239
2 X Wang X Wang Y Wang and Z Guo Chem Comm 2011 47 8127-8129 ESI
3 SJ Pope BJ Coe S Faulkner and R H Laye Dalton Trans 2005 1482-1490
4 S J Pope B J Coe and S Faulkner Chem Commun 2004 1550-1551
192
6 SUMMARY CONCLUSIONS amp FUTURE WORK
61 Summary amp Conclusions
One technique for reprocessing SNF currently being developed in the USA is
the TALSPEAK process an advanced reprocessing method for the separation of Ln3+
and MA3+
components The traditional process developed in the 1960s uses DTPA to
act as a holdback reagent for MA3+
in a lactate buffered aqueous phase at pH 36
allowing Ln3+
to be selectively extracted by organophosphate HDEHP into an organic
phase of DIPB or dodecane TALSPEAK is one of the most promising techniques being
researched due to its numerous advantages particularly its relative resistance to
irradiation and ability to be carried out without the need for high reagent concentrations
Additionally it gives high separation factors in the region of ~50-100 which is
comparable to other advanced reprocessing methods currently being developed1 Since
the chemistry of the process is very complex and not particularly well understood it
would be an advantage to simplify the process by removing the need for a separate
holdback reagent and buffer
Recent studies have shown that complexants with soft donor atoms such as N or
S (relative to O) can be used to separate MA3+
from Ln3+
23
Initial research was carried
out by our collaborators at the Idaho National Lab testing the suitability of amino acids
(L-alanine L-arginine L-histidine and L-methionine) as a potential combined buffer
and soft donor by determining whether amino acids preferentially bind to MA3+
Another benefit to using amino acids would be the scope for carrying out the process at
a lower pH (~ pH 2) due to the lower pKa values of the carboxylic acid groups of the
amino acids than on DTPA Lower pH values are preferred by industry as higher acid
concentrations are easier to control on a large scale and are also known to increase the
Ln3+
distribution coefficients4
This work carried out by Grimes5 showed that amino acids do not act as
holdback reagents in their own right and that no separation of Ln3+
Am3+
is achieved
when they are used without Na5DTPA in solution However investigations showed that
when used alongside Na5DTPA good separation (SFEuAm ~ 66) can be achieved when
using 05 M L-alanine at pH 2 (cf ~25 at pH 3) however the DAm value was relatively
high than at the lower pH (DAm 047 at pH 2 cf 012 at pH 3) as more protonated forms
of the DTPA molecule are present in solution at low pH and the holdback reagent is not
able to bind as strongly to metal ions allowing more Am3+
to be partitioned into the
organic phase
193
However optimisation of the system in order to maximise the separation whilst
keeping Am3+
partitioning to a minimum by changing the concentrations of holdback
reagent and extractant proved to be successful The optimum conditions were found to
be 04 M Na5DTPA and 02 M HDEHP giving a separation factor of 71 plusmn 5 with a DAm
value of 008 Although this separation is not as good as a traditional lactate
TALSPEAK system (SF = 91 DAm = 0009) the use of L-alanine (pKa = 235) as a
buffer would allow the process to be carried out at pH 2 which is a much more
preferable pH for industry
Separations were carried out using other amino acids at varying pH values and it
was found that L-methionine was too poorly soluble at pH 3 and did not give very good
separation data at pH 2 L-arginine was found to have kinetic issues at pH 2 and 3
giving poor separation of the heavier lanthanides The amino acid L-histidine (pKa =
182) however gave good separation data at pH 3 with a SFEuAm of 99 comparable to
that of the original TALSPEAK process and a DAm of 007 comparable to the optimised
L-alanine system Unfortunately ICP-MS studies on lanthanides La-Ho using L-
histidine at pH 3 showed that the same kinetic problems arise for this system as for L-
alanine at pH 3 and L-arginine at pH 2 and 3 as the DLn value decreases for later
lanthanides
The interaction of the buffers glycine L-alanine L-serine L-phenylalanine and
lactate (for comparison) with Eu3+
and [Eu(DTPA)]2-
systems was investigated by
luminescence and 1H NMR spectroscopies As expected it was found that amino acids
and lactate do not form stable complexes with either the free metal ion or the metal-
DTPA complex and that the buffers are likely to be in fast exchange with surrounding
solvent molecules as the number of water molecules in the inner hydration sphere (q) of
Eu3+
was reduced from 9 to ~6 when buffers were added to the aqua ion in solution
Luminescence studies on L-phenylalanine (like other amino acids) showed that it does
not bind to the metal ion as there was no sensitised emission from Tb3+
ion when
excited into the phenyl chromophore of the amino acid when the two components were
in solution Emission spectra of Eu3+
and Cm3+
aqua ions and their corresponding
DTPA complexes showed no change in emission profile upon the addition of amino
acidslactate There was also no change in q when buffers were added to metal-DTPA
complexes in solution for Eu3+
or Cm3+
Radiolysis studies carried out on lactate and amino acid buffered [Eu(DTPA)]2-
systems showed that the systems are relatively resistant to γ-radiation when exposed to
5 kGy γ-radiation This is consistent with previous work conducted by the INL showing
194
that separation systems using L-alanine as a buffer are more resistant to radiolysis than
the original TALSPEAK process using lactate67
A 05 M L-alanine buffered
TALSPEAK system using 04 M Na5DTPA and 02 M HDEHP at pH 2 can therefore
be seen to be a promising alternative to the traditional lactate buffered system as it has
been shown to give good separation data with fairly low extraction of Am3+
and the
buffer is also more resistant to radiolysis than lactate Additionally it allows the process
to be carried out at a lower pH of 2 which is much more practical for industrial
operation
Since amino acids were found not to act as holdback reagents in their own right
the potential of using the larger tripeptide L-glutathione (GSH) was investigated Initial
separation studies carried out using glutathione at pH 4 (as GSH has 2 pKa values
below 4 and Garg et al reported that the optimum stability for Ln-GSH complexes
occurs in solutions between pH 34-348)8 Preliminary investigations found that as
with the amino acids studied GSH is ineffective as a holdback reagent on its own as
there was no separation observed between Eu3+
and Am3+
when used without
Na5DTPA
Analogous to the amino acid studies subsequent investigations were carried out
using GSH alongside Na5DTPA to determine whether separation was improved with the
tripeptide buffer A pH dependence study found that at pH 2 and pH 3 the glutathione
acts solely as a buffer in the systems as the separation factor in each case was
independent of GSH concentration However at pH 4 interestingly separation between
Eu3+
and Am3+
was found to increase as the buffer concentration was increased up to
05 M suggesting that the glutathione is interacting with the Ln-DTPA complexes at
this pH This could be explained by the increase in stability of Ln-GSH complexes as
the pH is increased
Using 05 M GSH the separation factor was found to increase dramatically as a
function of Na5DTPA concentration up to 03 M Na5DTPA After this peak there was
a rapid decrease in separation as the concentration was increased further up to 06 M
Na5DTPA as the stoichiometry is close to 11 GSHDTPA The separation factors
achieved here were extremely high (~1000) ndash a factor of 10 higher than the current
TALSPEAK system and the optimised L-alanine system whilst still maintaining low
Am3+
extraction (DAm = 0002 with 03 M Na5DTPA) lower than in the traditional
TALSPEAK process
At 03 M Na5DTPA the separation factor then increased as the extractant
concentration was increased from 02 to 04 M HDEHP in dodecane after which the SF
195
began to decrease again with the optimum separation at 04 M extractant giving a SF
of 1238 (DAm = 00018) At 04 M Na5DTPA however the separation factor decreases
rapidly as the extractant concentration is increased due to the DAm increasing by a
factor of 1000 consistent with the complexant and buffer possibly forming an adduct
which no longer successfully holds back Am3+
at higher Na5DTPA concentrations
Luminescence experiments mimicking the separation studies showed that the
glutathione does not form a stable complex with the Eu3+
ion and is in exchange with
surrounding solvent molecules comparable to the amino acid buffer studies even at the
highest buffer concentrations 1H NMR spectroscopy confirmed that although the
glutathione may be in exchange with surrounding water molecules no kinetically stable
complexes between the buffer and metal ions are formed In samples containing
Na5DTPA a Eu-DTPA complex can be clearly observed in the emission spectra with
or without the presence of GSH over a pH range of 2-4 The J=1J=2 peak ratios
showed that there is no change in the co-ordination mode of the buffer to the metal ion
as the concentration of GSH is increased for each pH however across the data sets the
co-ordination mode of glutathione was found to be different at different pH values as
expected based on pKa values and increasing stability constant with pH
The co-ordination mode of the Eu-DTPA in the aqueous phase with 05 M GSH
was found not to change as [Na5DTPA] was changed with metal extraction typically
decreasing as the holdback reagent increases and at 03 M Na5DTPA with 05 M GSH
extraction was found to increase as HDEHP concentration increased as expected
The GSH buffered system was found to be susceptible to radiolysis when
subjected 7 kGy γ-radiation from a 60
Co irradiator and seen to degrade into γ-Glu-Cys
fragments However the degradation was seen to have little effect on the extraction of
metal ions from the aqueous phase when analysed by luminescence spectroscopy with
only slightly decreased emission intensity post-irradiation The emission profiles co-
ordination mode and luminescent lifetimes of the samples remained unchanged
In order to be a successful alternative to the current TALSPEAK system it is
essential that effective separation of all lanthanides from MA3+
can occur Further
luminescence experiments were carried out firstly on analogous dysprosium systems in
order to represent heavier lanthanide elements followed by a mixture of four different
lanthanide metals in the same samples (Sm3+
Eu3+
Tb3+
and Dy3+
) For the dysprosium
study as the pH was increased from 2-4 the extraction of Dy3+
decreased suggesting
that the same kinetic issues noted for heavier lanthanides in the amino acid systems may
also be present for the GSH system at higher pH values In the mixed samples the same
196
pattern was observed with extraction of Ln3+
decreasing as pH was increased At pH 4
extraction of all lanthanide ions was very low particularly for Tb3+
and Dy3+
which are
both heavier than Sm3+
and Eu3+
ICP-MS carried out on a series of samples containing
a mixture of 10 lanthanides (La3+
-Ho3+
) was consistent with the luminescence data
showing decreased extraction of heavier lanthanides as pH increases from 2 to 4 The
quantity of metal extracted was so low it was below the limit of detection for some of
the heavier metals at pH 4 forcing the conclusion that unfortunately the same kinetic
issues are a problem at higher pH for the glutathione buffered system as for the amino
acid systems
Initial data obtained on the glutathione system with europium(III) and
americium(III) seemed promising as after optimisation very high separation factors for
Eu3+
Am3+
were achieved (~1000) with very low Am3+
partitioning (DAm ~0002) and
although the buffer was found to be susceptible to radiolysis extraction of lanthanide
ions still remained high after irradiation However subsequent studies with heavier
lanthanides showed that the GSH buffered system is subject to the same kinetic
problems as some of the amino acid systems
Based on the results from studies using amino acid and glutathione buffered
systems demonstrating that Ln3+
MA3+
separation cannot be achieved without the
presence of DTPA and a buffer the possibility of synthesising a combined buffer and
soft-donor was considered Amino acids were appended onto DTPA through reaction of
amino acid esters with DTPA dianhydride to form DTPA-(AlaOMe)2 DTPA-
(ArgOMe)2 DTPA-(SerOEt)2 and DTPA-(HisOMe)2 in good yields (~ 60 ) The
ligands were shown by luminescence spectroscopy to complex to Eu3+
at pH 2 3 and 4
forming Eu-DTPA-AA2 adducts with 1 water molecule in fast exchange in the inner
hydration sphere Under TALSPEAK conditions the ligands were found to be more
effective holdback reagents at the lower pH of 2 and even at pH 15 The co-ordination
mode of the ligands to the metal ion was consistent for all of the ligands being typical
of lanthanide DTPA-amide ligands known in the literature910
but was found to change
upon changing pH These ligands were also found to be relatively resistant to radiolysis
when subjected to 7 kGy γ radiation from a 60
Co irradiator as there was no change in
their luminescent emission profile co-ordination mode or hydration number after
irradiation
Results from separation studies conducted at KIT-INE using gamma counting
and ICP-MS showed that the modified DTPA ligands successfully allowed separation
between Ln3+
Am3+
giving good separation factors comparable to the original lactate-
197
buffered TALSPEAK process (SFEuAm ~100) even for Nd3+
which is the most difficult
lanthanide to extract in the process (SFNdAm ~30-40) The extraction efficiency of all the
ligands broadly relates to the atomic number of the lanthanide ions (apart from La3+
Ce3+
and Pr3+
) with the heavier ions being preferentially extracted as expected The
separation factors of individual lanthanide pairs range from approximately 25 to gt 100
and for the Dy3+
Nd3+
pair of particular economic importance are quite reasonable SF
DyNd ~ 30
However the distibution ratio for Am3+
is much higher than desired for the
modified DTPA ligands (DAm = 025-200 vs DAm 0009) and so optimisation of the
systems would be necessary to try to reduce DAm for the combined buffer soft-donor
system to be viable Initial studies on combined DTPA-bis(amino ester) ligands is
promising allowing the TALSPEAK process chemistry to be simplified and providing a
system which could be buffered to a lower pH (pH 2) as preferred by industry The
synthesis of the ligands is quite moisture sensitive and the products are very
hygroscopic and difficult to purify making the application of them on an industrial
scale potentially problematic but the simplification of the process on a laboratory scale
would allow the chemistry of the TALSPEAK process to be further investigated and
better understood for future developments
Although there are a number of variations of the TALSPEAK process being
developed including the TALSQuEAK (Trivalent Actinide Lanthanide Separation
using Quicker Extractants and Aqueous Complexes) process11
which uses alternative
extractant HEH[EHP]12
and alternative holdback reagent HEDTA13
the use of amino
acid and short-chain peptide buffers is unique to this project in collaboration with the
Idaho National Laboratory There has been some investigation into the use of malonate
buffers for TALSPEAK14
but there are no other reports of the use of amino acids or
peptides in the literature Additionally there are few published reports on the use of
luminescence spectroscopy in TALSPEAK studies chiefly on the complexation of Eu3+
with lactate15
complexation of Eu3+
Cm3+
with DTPA16
and complexation of Eu3+
with
HDEHP in the organic phase17
There is no literature on systems as a whole
A report on bis(methionine)-appended DTPA was published by Hazari et al in
2010 on the use of Tc-DTPA-bis(methionine) in tumour imaging18
however there are
no literature reports on the synthesis or use of amino acid appended or any modified
DTPA ligands for solvent extraction and separation studies
198
62 Future Work
As only a small selection of amino acids have been tested as buffers it would be
interesting to try more of them The original selections were made on the basis of their
chemical structures solubilities and previous work conducted at INL plus presence of
any soft donor atoms L-alanine was selected as it has the most similar structure to lactic
acid although glycine may be worth considering as well based on its also very similar
structure and high aqueous solubility Results with L-arginine and L-methionine were
not very promising possibly due to their longer chain backbones so it may be worth
considering the similar shorter-chain amino acids L-cysteine and L-threonine as these
have similar structures to L-serine which along with glycine was one of the amino
acids investigated by luminescence spectroscopy Although L-cysteine has poor
solubility like L-methionine it would be interesting to see how these amino acids
behave as buffers when subjected to the same separation and optimisation tests as L-
alanine Similarly medium length chain amino acids L-glutamic acid L-aspartic acid
L-asparagine and L-glutamine may also be worth considering (Figure 61)
Figure 61 Chemical structures of amino acids taken from reference 1919
199
In addition to investigating other amino acid buffer systems as discussed in
Chapter 4 there may be some benefit to carrying out experiments with other short chain
peptides such as eisenin and norophthalmic acid as well as some of the B vitamins that
were considered (vitamins B7 and 9) before L-glutathione was selected From the
results obtained with L-glutathione demonstrating that the tripeptide interacts with the
Ln-DTPA complex under certain conditions it is possible that these other peptides may
also interact and potentially aid in extraction of Ln3+
or selective holdback of MA3+
Although the desired result was not achieved with L-glutathione as it seems to
suffer the same kinetic issues which have been common with amino acids causing very
good extraction of the lighter lanthanides but very poor extraction of the heavier
lanthanides further optimisation of the GSH system to exploit the combined liquid-
liquid extraction efficiencies as a function of atomic number may allow the
development of an extraction process of lighter over heavier lanthanides for rare earth
recycling which is currently a strategically important goal20
Initial studies on the modified DTPA ligands showed promising results for a
combined buffer and soft-donor although there is still much work to be done in this
area It would be useful to determine the stability constants of the ligands with
lanthanides and with Am3+
and Cm3+
if possible preferably by potentiomenty which
has proven to be the most reliable method for determining stability constants for these
types of complexes21
The next step in process development with the ligands would be
to optimise the systems (as was done for the L-alanine and GSH buffered systems) in
order to reduce the partitioning of Am3+
and decrease DAm as much as possible ideally
to the same of magnitude of the lactate and GSH buffered systems by altering pH
concentration of ligand and concentration of extractant to maximise separation and
minimise americium distribution
A further step would also be to try to deprotect the amino acids on the DTPA-
amino ester ligands hydrolysing the esters back to carboxylic acid groups to see if that
would increase the holdback ability of the ligands and possibly decrease the distribution
ratio of Am3+
It is envisioned that the research presented in this thesis could be applied to
current and new technologies and challenges faced in the future of the nuclear industry
in particular towards the development of a TALSPEAK-style advanced reprocessing
procedure for implementation in the USA within the near future
200
1 G Modolo A Geist and M Miguirditchian Minor actinide separations in the
reprocessing of spent nuclear fuels recent advances in Europe in R Taylor ed
Reprocessing and Recycling of Spent Nuclear Fuel Woodhead Publishing UK 2015
10 245-279
2 M P Jensen and A H Bond J Am Chem Soc 2002 124 9870-9877
3 L R Martin B J Mincher and N C Schmitt J Radioanal Nucl Chem 2009 282
523-526
4 B Weaver and T A Kappelmann Talspeak A new method of separating americium
and curium from the lanthanides by extraction from an aqueous solution of an
aminopolyacetic acid complex with a monoacidic organophosphate or phosphonate
Oak Ridge National Laboratory 1964 1-60
5 TS Grimes RD Tillotson and LR Martin Solv Extraction and Ion Exchange
2014 32 378-390
6 Dr Leigh Martin Idaho National Laboratory unpublished results
7 LR Martin S P Mezyk and BJ Mincher J Phys Chem A 2009 113 141-145
8 BS Garg BK Singh DN Kumar and PK Sing Indian J Chem 2003 42A 79-83
9 C L Davies N G Housden and A-K Duhme-Klair Angew Chem Int Ed Engl 2008
47 8856
10 SJA Pope Polyhedron 2007 26 17 4818-4824
11 JC Braley JC Carter SI Sinkov KL Nash and GJ Lumetta J Coord Chem
2012 65 16 2862-2876
12 GJ Lumetta AJ Casella BM Rapko TG Levitskaia NK Pence JC Carter
CM Niver and MR Smoot Solv Extraction Ion Exchange 2015 33 346-361
13 JC Braley TS Grimes and KL Nash Ind Eng Chem Res 2012 15 629-638
14 JL Lapka and KL Nash Solv Extraction Ion Exchange 2015 33 346-361
15 G Tian LR Martin and L Rao Inorg Chem 2010 49 10598-10605
16 G Tian LR Martin and L Rao Inorg Chem 2015 54 1232-1239
17 TS Grimes G Tian L Rao and KL Nash Inorg Chem 2012 51 6299-6307
18 PP Hazari G Shukla V Goel K Chuttani N Kumar R Sharma and AK
Mishra Bioconjugate Chem 2010 21 229-239
19 DWhite Wisegeek What are Amino Acids httpwwwwisegeekorgwhat-are-
amino-acidshtm 2015
20 LS Natrajan and MH Langford Paden f-Block Elements Recovery in A Hunt ed
Element Recovery and Sustainability RSC 2013 6 140-184
21 G Tian LR Martin and LRao Inorg Chem 2015 54 1232-1239
201
7 EXPERIMENTAL SECTION
71 Chemicals and Reagents
All chemicals and solvents were purchased from Sigma-Aldrich chemical
company and were used as received Radioisotopes were supplied by the Idaho National
Laboratory or the Institute for Nuclear Waste Disposal (INE) and were used in
accordance with the local rules for manipulation of high specific activity materials
711 Handling Radioisotopes at INL
In order to handle radioisotopes at INL it was necessary to compete the
RadWorker 2 training and theory and practical examinations Upon entering a radiation
area (laboratory) it was a requirement to sign onto the dosimetry record system and
collect a dosimeter which was to be worn on the chest at all times in the area When
handling radioactive material within the designated controlled areas (fume hoods) extra
layers of PPE (personal protective equipment) such as triple layered shoulder length
gloves were to be worn and disposed of immediately upon leaving the controlled area in
designated radioactive waste bins It was then a requirement to monitor the upper body
area carefully with an alpha and a beta radiation detector Whilst working in the
controlled area any potentially contaminated PPE or samples had to be disposed of and
immediately replaced in the case of PPE After preparing sealed samples in the
controlled areas a Radiological Control worker would assist with swabbing each
sample to check for contamination before it could be removed from the area for further
analysis Samples were not to be opened outside of controlled areas and were returned
to the controlled area fume hood to be disposed of by solidification Upon leaving
radiation areas a full body scan was conducted and dose records updated as dosimeters
were returned
72 Complexation studies of Ln3+
amp An3+
with amino acids in TALSPEAK systems
721 Preparation of samples for luminescence studies
7211 Stock solutions
Stock solutions (10 mM 10 mL) were made up for each lanthanide (EuTb)
using the corresponding lanthanide nitrate salt Ln(NO3)3xH2O in H2O or D2O as
required A stock solution of Na5DTPA in H2OD2O (1 M 50 mL) was made up from a
40 wv Na5DTPA solution in H2O by dilution (2517 g into 50 mL) Stock solutions
of amino acids (Gly L-Ala L-Ser) in H2OD2O (125 M 20 mL) were prepared from
202
the crystalline form of each amino acid and a stock solution of DL-lactic acid was
prepared by dilution (225 g in 20 mL) For the sensitisation study with L-Phe due to
poor solubility of L-Phe a 0625 M stock solution in D2O was made using the powdered
form of the amino acid Additionally a stock solution of HDEHP in n-dodecane (645 g
in 100 mL 02 M) was prepared All reagents were purchased from Sigma-Aldrich
Stock solutions
10 mM EuTb(NO3)3 in H2OD2O
1 M Na5DTPA in H2OD2O
125 M GlyL-AlaL-SerLactate in H2OD2O
0625 M L-Phe in D2O
02 M HDEHP in n-dodecane
7212 Preparation of aqueous samples
5 mL samples were prepared using the stock solutions above Ln(NO3)3xH2O
(05 mL) was added to each amino acid solution (4 mL) with either Na5DTPA solution
(05 mL) or H2OD2O (05 mL) depending on whether the samples contained DTPA
This produced individual samples with concentrations of 1 mM Ln3+
1 M amino
acidlactate (05 M for L-Phe) and 01 M Na5DTPA if applicable The pHpD of
samples was adjusted individually with concentrated HNO3 and NaOH to minimise
change in volume using a Mettler Toledo Seven Compact pHion Meter pD (-log10
deuterium ion concentration) was calculated using Equation 71 to account for the
activity coefficient difference between the different isotopes of the hydrogen ion where
pH = the meter reading from a calibrated pH electrode All samples were repeated in
triplicate analagous to the solvent extraction samples performed at INL
Equation 71
7213 Preparation of extracted samples
Aqueous samples were prepared using the stock solutions above Na5DTPA
solution (05 mL) was added to amino acid solution (4 mL) and the mixture was pre-
equilibrated by contacting with n-dodecane and shaken using a Scientific Industries
Vortex Genie 2 Mixer and Shaker for 15 minutes The phases were allowed to separate
and the organic layer was discarded Ln(NO3)3 solution (05 mL) was added to the
aqueous phase and the pH was adjusted individually with concentrated HNO3 and
NaOH to minimise change in volume using a Mettler Toledo Seven Compact pHion
203
Meter The pD was calculated using Equation 71 The aqueous phases were contacted
with HDEHP in n-dodecane (5 mL 02 M) The solutions were then shaken again for 15
minutes left to settle and separated into the two phases for analysis All samples were
repeated in triplicate analagous to the solvent extraction samples performed at INL
722 Radiolysis of samples
Fricke dosimetry can be used to determine dose rates from radiation sources
such as from a 60
Co irradiator used to irradiate samples for radiolysis studies at the
Dalton Cumbrian Facility An aerated iron(II) sulphate solution is irradiated to give free
radicals according to the following reactions
H2O rarr H + OH
OH + Fe2+
rarr Fe3+
+ HO-
H + O2 rarr HO2
H+ + Fe
2+ + HO2 rarr Fe
3+ + H2O2
H2O2 + Fe2+
rarr Fe(OH)2+
+ OH
HO2 + Fe3+
rarr Fe2+
+ O2 + H+
This means that each H radical causes the oxidation of 3 Fe2+
ions to Fe3+
The amount
of Fe3+
present can then be measured using UV-visible spectroscopy and the dose rate
calculated from this1
7221 Preparation of Fricke solution
A Fricke solution was needed for the first set of radiolysis experiments carried
out using the 60
Co irradiator at the DCF as it allows the amount of exposure to be
calculated for each sample position during irradiation
FeSO47H2O (020206 g 133 mM) NaCl (003031 g 052 mM) and H2SO4 (95-98
11 mL) were added to deionised water (500 mL) The resulting Fricke solution was
then air-saturated and stored away from natural and artificial light sources
7222 Calculating dose rates
The UV-vis spectra of Fricke solution was then read before and after irradiation
and the following equation used to work out the dose rate
The dose can be calculated from the equation designed by Spinks and Woods (Equation
72)2
204
Equation 72
Where
F (Faradayrsquos constant) = 0965 x 109 A mol
-1
εFe(III) = Fe(III) molar extinction coefficient = 2174 M-1
cm-1
ρ = Fricke solution density = 1204 g mL-1
G = Critical Dose Value for Fe3+
= 148 molecules per 100 eV for x-rays
V = Volume of sample (mL) = 1
ODi = Optical density of irradiated solution
ODb = Optical density of non-irradiated control
The Spinks and Woods equation is specific to X-rays and must be adjusted so that it can
be applied to the use of γ-rays (Equation 73)
For γ-rays
εFe(III) = 2197 M-1
cm-1
G = 162 molecules per eV
Equation 73
Equation 74
Due to the design of the irradiator different positions in the machine receive
slightly different dose rates resulting in each sample receiving slightly different
amounts of radiation although the variation in dose is not significant and each sample
was calculated to receive an average of 114 Gy min-1
205
Table 71 Dose rates received at each sample position in the 60
Co irradiator at DCF
Position Dose Rate (Gy
min-1
)
1 1084678
2 1171864
3 1183066
4 1103841
73 Solvent extraction and separation studies using amino acids and glutathione at
INL
731 Preparation of samples
7311 Stock solutions for amino acid studies
A stock solution of Na5DTPA in H2O (1 M 100 mL) was made up from a 40
wv Na5DTPA solution in H2O by dilution (2517 g into 50 mL) A stock solution of L-
alanine in H2O (1 M 200 mL) was prepared from its crystalline form Additionally a
stock solution of HDEHP in n-dodecane (3224 g in 100 mL 1 M) was prepared This
was subsequently diluted with n-dodecane to prepare stock solutions of 02 04 06 and
08 M HDEHP in n-dodecane stock solutions as well
Stock solutions
1 M Na5DTPA in H2O
1 M L-Ala in H2O
10 08 06 04 02 M HDEHP in n-dodecane
7312 [Na5DTPA] dependence SX samples for amino acid studies
5 mL aqueous samples were prepared using the stock solutions above L-alanine
solution (25 mL) was added to a calculated volume of Na5DTPA solution to produce
samples with the desired DTPA concentration (006 007 008 009 01 02 03 04
05 M) when made up to 5 mL with water The pH of samples was adjusted individually
with concentrated HNO3 and NaOH to minimise change in volume using a Mettler
Toledo Seven Compact pHion Meter 02 M HDEHP in n-dodecane was used for the
solvent extraction All samples were repeated in triplicate
7313 [HDEHP] dependence SX samples for amino acid studies
5 mL aqueous samples were prepared using the stock solutions above L-alanine
solution (25 mL) was added to a calculated volume of Na5DTPA solution to produce
samples with the desired DTPA concentration (01 02 03 04 05 M) when made up
206
to 5 mL with water The pH of samples was adjusted individually with concentrated
HNO3 and NaOH to minimise change in volume using a Mettler Toledo Seven
Compact pHion Meter 02 04 06 08 and 10 M HDEHP in n-dodecane was used for
the solvent extraction All samples were repeated in triplicate
7314 Other amino acid SX samples for amino acid studies
5 mL aqueous samples were prepared for L-His and L-Met buffered systems
The Na5DTPA stock solution (025 mL) was added to L-His (0388 g) and L-Met (0373
g) separately to make samples with concentrations of 005 M Na5DTPA and 05 M
amino acid when made up to 5 mL with water The powdered forms of the amino acids
were used due to their poor solubility The pH of samples was adjusted individually
with concentrated HNO3 and NaOH to minimise change in volume using a Mettler
Toledo Seven Compact pHion Meter 02 M HDEHP in n-dodecane was used for the
solvent extraction All samples were repeated in triplicate
7315 Stock solutions for glutathione studies
A stock solution of Na5DTPA in H2O (1 M 100 mL) was made up from a 40
wv Na5DTPA solution in H2O by dilution (2517 g into 50 mL) Additionally a stock
solution of HDEHP in n-dodecane (3224g in 100mL 1 M) was prepared This was
subsequently diluted with n-dodecane to prepare stock solutions of 02 04 06 and 08
M HDEHP in n-dodecane stock solutions as well
Stock solutions
1 M Na5DTPA in H2O
10 08 06 04 02 M HDEHP in n-dodecane
7316 [GSH] dependence SX samples without Na5DTPA
GSH (0768 g) was dissolved in water (5 mL) to make a 05 M solution The
powdered form of the peptide was used due to its poor solubility The pH of sample was
adjusted with concentrated HNO3 and NaOH to minimise change in volume using a
Mettler Toledo Seven Compact pHion Meter 02 M HDEHP in n-dodecane was used
for the solvent extraction All samples were repeated in triplicate
7317 [GSH] and pH dependence SX samples with Na5DTPA
5 mL aqueous samples were prepared for GSH buffered systems The Na5DTPA
stock solution (025 mL) was added to varying quantities of GSH to make samples with
207
concentrations of 005 M Na5DTPA and the desired concentration of GSH (01 02 03
04 05 M) when made up to 5 mL with water The pH of samples was adjusted
individually with concentrated HNO3 and NaOH to minimise change in volume using
a Mettler Toledo Seven Compact pHion Meter 02 M HDEHP in n-dodecane was used
for the solvent extraction All samples were repeated in triplicate
7318 [Na5DTPA] dependence SX samples for GSH studies
5 mL aqueous samples were prepared for GSH buffered systems GSH (0768 g)
was added to a calculated volume of Na5DTPA solution to produce samples with
concentrations of 05 M GSH and the desired DTPA concentration (005 01 02 03
04 05 06 M) when made up to 5 mL with water The pH of samples was adjusted
individually with concentrated HNO3 and NaOH to minimise change in volume using
a Mettler Toledo Seven Compact pHion Meter 02 M HDEHP in n-dodecane was used
for the solvent extraction All samples were repeated in triplicate
7319 [HDEHP] dependence SX samples for amino acid studies
5 mL aqueous samples were prepared for GSH buffered systems GSH (0768 g)
was added to a calculated volume of Na5DTPA solution to produce samples with the
concentrations of 05 M GSH and the desired DTPA concentration (03 M and 04 M)
when made up to 5 mL with water The pH of samples was adjusted individually with
concentrated HNO3 and NaOH to minimise change in volume using a Mettler Toledo
Seven Compact pHion Meter 02 04 06 08 and 10 M HDEHP in n-dodecane was
used for the solvent extraction All samples were repeated in triplicate
732 Gamma counting
2 mL of each sample was transferred into a 4 mL sample vial in duplicate One
of the duplicate sets of samples was contacted with 2 mL n-dodecane to pre-equilibrate
the aqueous phase and the other duplicate set was contacted with the stock solution of
HDEHP in n-dodecane to pre-equilibrate the organic phase All of the samples were
then shaken using a VWR Multi-Tube Vortexer for 15 minutes Samples were then
placed in a Boeco S-8 Centrifuge for 5 minutes at 5400 rpm to separate the layers
The organic phase of the pre-equilibrated aqueous phase was discarded and the
aqueous phase of the pre-equilibrated organic phase was discarded 05 mL each
retained phase was then contacted in a 2 mL sample vial in triplicate and spiked with 10
microL 241
Am or 154
Eu stock solutions (1 kBq mL-1
) Samples were then shaken again using
208
a VWR Multi-Tube Vortexer for another 30 minutes before being placed in a Boeco S-
8 Centrifuge for 5 minutes at 5400 rpm to separate the layers
300 microL of each organic phase was transferred into counting tubes and 300 microL of
each aqueous phase was transferred into separate tubes Control tubes containing 300
microL HNO3 spiked with 10 microL 241
Am or 154
Eu stock solutions (1 kBq mL-1
) were also
prepared γ counting was performed on the samples using a Packard Cobra II Gamma
Counter Results were averaged from each of the samples in triplicate
733 ICP-MS
Samples were made up as for SX samples with other amino acids for L-His and
(Section 7314) and for GSH (Section 7318) 2 mL of each sample was transferred
into a 4 mL sample vial 10 microL mixed Ln 110 stock solution (5 mgL-1
of each of La
Ce Pr Nd Sm Eu Gd Tb Dy Ho) was spiked into each sample and samples were
contacted with 2 mL HDEHP in n-dodecane (02 M) All of the samples were then
shaken using a VWR Multi-Tube Vortexer for 15 minutes Samples were then placed in
a Boeco S-8 Centrifuge for 5 minutes at 5400 rpm to separate the layers
The organic phase was discarded and 10 microL of the aqueous phase was
transferred into ICP-MS vials containing 10 mL 2 HNO3 in triplicate Control tubes
containing 10 mL 2 HNO3 spiked with 10 microL mixed Ln 110 stock solution were
also prepared ICP-MS was carried out to determine the concentration of each
lanthanide in the organic and aqueous phase Results were averaged from each of the
samples in triplicate
74 Luminescence studies and solvent extraction using glutathione at UoM
741 Preparation of luminescence samples
7411 Stock solutions for GSH studies
Stock solutions (10 mM (100 mM for Dy3+
) 10 mL) were made up for each
lanthanide (EuTbDySm) using the corresponding lanthanide nitrate salt
Ln(NO3)3xH2O in H2O or D2O as required A mixed lanthanide solution was also made
up to contain the same concentrations of each of the lanthanides above A stock solution
of Na5DTPA in H2OD2O (1 M 50 mL) was made up from a 40 wv Na5DTPA
solution in H2O by dilution (2517 g into 50 mL) Additionally a stock solution of
HDEHP in n-dodecane (3224 g in 100 mL 1 M) was prepared This was subsequently
diluted with n-dodecane to prepare stock solutions of 02 04 06 and 08 M HDEHP in
n-dodecane stock solutions as well All reagents were purchased from Sigma-Aldrich
209
Stock solutions
10 mM EuTbSm(NO3)3 in H2OD2O
100 mM Dy(NO3)3 in H2OD2O
Mixed Ln solution with 10 mM EuTbSm(NO3)3 in H2OD2O and 100 mM Dy(NO3)3
1 M Na5DTPA in H2OD2O
10 08 06 04 02 M HDEHP in n-dodecane
7412 Preparation of aqueous samples
Samples were made up using the stock solutions above in the same way as for
the solvent extraction and separation studies carried out at INL (Sections 7312 to
7319) pD was calculated using Equation 71
7413 Preparation of extracted samples
5 mL aqueous samples were prepared using the stock solutions above GSH
(0768 g) was added to a calculated volume of Na5DTPA solution to produce samples
with the concentrations of 05 M GSH and the desired DTPA concentration (varied
according to the study) when made up to 5 mL with water The mixture was pre-
equilibrated by contacting with n-dodecane and shaken using a Scientific Industries
Vortex Genie 2 Mixer and Shaker for 15 minutes The phases were allowed to separate
and the organic layer was discarded Ln(NO3)3 solution (05 mL) was added to the
aqueous phase and the pH was adjusted individually with concentrated HNO3 and
NaOH to minimise change in volume using a Mettler Toledo Seven Compact pHion
Meter pD was calculated using Equation 71 The aqueous phases were contacted with
5 mL HDEHP in n-dodecane (varied according to the study) The solutions were then
shaken again for 15 minutes left to settle and separated into the two phases for analysis
All samples were repeated in triplicate analagous to the solvent extraction samples
performed at INL
742 Radiolysis of GSH samples
Radiolysis experiments on GSH buffered systems were carried out using the
60Co irradiator at DCF These irradiations were undertaken at a later date than the initial
amino acid radiolysis studies (Section 722) using a new calibrated sample holder with
known dose rates and so preparation and use of a Fricke solution was not necessary
Samples received an average of 7 kGy γ radiation
210
75 Modified DTPA Ligands
751 Synthesis of modified DTPA ligands
L-alanine methyl ester hydrochloride (0837 g 62 mmol) was dissolved in DMF
(15 mL) and added dropwise to DTPA dianhydride (107 g 3 mmol) in DMF (75 mL)
and 3 mL triethylamine (TEA) with stirring under nitrogen in an ice bath at 0 degC The
ice bath was removed after 2 hours and the reaction was left to stir at room temperature
for 48 hours The reaction was quenched with H2O (75 mL) and the solvent evaporated
to ~10 mL The resulting yellow oil was added dropwise to acetone (100 mL) with
stirring and the product precipitated The product was collected by sinter filtration
(porosity 3) under nitrogen as a crude white powder (yield 132 g 78) It was washed
with diethyl ether (3 x 20 mL) chloroform (3 x 20 mL) and diethyl ether again (3 x 20
mL) This was then dried under vacuum to give a white micro-crystalline product
(yield 1031 g 61 ) Multiple re-precipitations were performed to reduce the amount
of associated ammonium salts in the product Samples were dried under vacuum and
freeze-dried but water and solvent impurities continued to remain present
The synthesis was repeated using L-arginine methyl ester dihydrochloride (157 g 6
mmol) L-serine ethyl ester hydrochloride (102 g 6 mmol) and L-histidine methyl ester
(145 g 6 mmol)
Yields
DTPA-(AlaOMe)2 132 g 78 (MW 56356 gmol-1
)
DTPA-(ArgOMe)2 1331 g 60 (MW 73378 gmol-1
)
DTPA-(SerOEt)2 1053 g 56 (MW 62361 gmol-1
)
DTPA-(HisOMe)2 1730 g 83 (MW 69569 gmol-1
)
752 Characterisation of modified DTPA ligands by MALDI-MS
MALDI-MS was used to characterise the synthesised ligands Samples were
dissolved in methanol for analysis These analyses confirm that the ligands are the
desired ones as the protonated monomolecular ion [M+H]+ is visible in each case The
[M+Na]+ and [M+K]
+ ions can also be found in each spectrum The range begins at mz
= 200 so it is therefore not possible to verify the presence of triethylamine (M =
10119gmol) the amino acid starting material or any solvents using this technique The
spectra show a numerous peaks indicating that the ligands have decomposed during
analysis making interpretation difficult The spectrum for DTPA-(AlaOMe)2 can be
found in Appendix 6
211
DTPA-(AlaOMe)2 mz 565 (100) [M+H]+ 587 (37) [M+Na]
+ 603 (39) [M+K]
+
DTPA-(ArgOMe)2 mz 734 (100) [M+H]+ 756 (18) [M+Na]
+ 772 (9) [M+K]
+
DTPA-(SerOEt)2 mz 624 (100) [M+H]+ 646 (60) [M+Na]
+ 662 (15) [M+K]
+
DTPA-(HisOMe)2 mz 697 (100) [M+H]+ 719 (22) [M+Na]
+ 735 (10) [M+K]
+
753 Characterisation of modified DTPA ligands by NMR spectroscopy
NMR spectroscopy was performed on ligand samples in D2O (9992 atom D
Sigma Aldrich) at 400 MHz The 1H NMR spectra of DTPA-(AlaOMe)2 with suggested
peak assignments can be found in Appendix 7
The 1H NMR spectra are difficult to interpret and assign due to the number of
peaks and their proximity to each other There are also impurities observable in the
spectra 13
C NMR spectra were also recorded and were simpler to interpret due to the
DEPT 135 spectra and enabled the quaternary CH CH2 and CH3 carbons to be
distinguished 1H NMR assignments were made using HSQC relating each peak in a
1H
spectrum to its corresponding carbon Solvent impurities were determined from known
solvent shifts (DMF acetone ethanol chloroform andor diethyl ether)3 DMF is the
most prevalent impurity due to it being the most difficult solvent to remove Some
starting material from amino acid esters can also be observed in small quantities
Triethylammonium chloride is also present in a small amount (11 ppm and 30 pmm)
7531 1H NMR Spectroscopy
1H NMR Shifts (400 mHz D2O)
DTPA-(AlaOMe)2 δ ppm 125 (d 3JHH =734 Hz 6 H H8) 311 (t
3JHH =100 Hz 4 H
H5) 323 (t 3JHH =569 Hz 4 H H4) 348 - 355 (m 2 H H6 and H7) 362 - 369 (m
4 H H2) 375 - 387 (m 4 H H3) 418 - 425 (m 2 H H1)
DTPA-(ArgOMe)2 δ ppm 154 (dq 2JHH =1449 Hz
3JHH 730 Hz 4 H H9) 169 - 189
(m 4 H H8) 302 - 317 (m 4 H H10 ) 325 (s 8 H H4 and H5) 362 (s 4 H H2)
365 (s 6 H H7) 368 (s 2 H H6) 375 - 384 (m 4 H H3) 436 - 444 (m 2 H H1)
DTPA-(SerOEt)2 δ ppm 117 (t 3JHH =706 Hz 6 H H7) 327 (s 8 H H4 and H5)
364 - 372 (m 6 H H2 and H6) 378 - 393 (m 9 H) H3 and H9) 414 (q 3JHH =706
Hz 4 H H8) 452 (dd 3JHH =479 378 Hz 2 H H1)
DTPA-(HisOMe)2 δ ppm 297 - 323 (m 12 H H4 H5 and H8) 331 (s 4 H H2) 349
(s 4 H H3) 358 (s 6 H H7) 362 (m 2 H H6) 370 - 375 (m 1 H H3) 464 - 466
(m 2 H H1) 714 (s 2 H H9) 843 (s 2 H H10)
212
Figure 71 1H NMR proton assignments for DTPA-(AlaOMe)2
Figure 72 1H NMR proton assignments for DTPA-(ArgOMe)2
Figure 73 1H NMR proton assignments for DTPA-(SerOEt)2
213
Figure 74 1H NMR proton assignments for DTPA-(HisOMe)2
7532 13
C NMR Spectroscopy
13CNMR Shifts (400 mHz D2O)
DTPA-(AlaOMe)2 δ ppm 158 (CH3 C12) 485 (CH C1) 511 (CH2 C5) 514 (CH2
C4) 529 (CH3 C7) 543 (CH2 C6) 563 (CH2 C2) 564 (CH2 C3) 1686 (q-C C9)
1718 (q-C C11) 1721 (q-C C10) 1746 (q-C C8)
DTPA-(ArgOMe)2 δ ppm 243 (CH2 C13) 275 (CH2 C12) 404 (CH2 C14) 512
(CH2 C5) 518 (CH2 C4) 523 (CH C1) 530 (CH3 C7) 548 (CH2 C6) 564 (CH2
C2) 568 (CH2 C3) 1567 (q-C C15) 1698 (q-C C9) 1716 (q-C C11) 1728 (q-C
C10) 1735 (q-C C8)
DTPA-(SerOEt)2 δ ppm 132 (CH3 C8) 512 (CH2 C5) 514 (CH2 C4) 545 (CH2
C6) 549 (CH C1) 563 (CH2 C2) 565 (CH2 C3) 607 (CH2 C13) 628 (CH2 C7)
1693 (q-C C9) 1712 (q-C C10) 1717 (q-c C11) 1723 (CH3 C8)
DTPA-(HisOMe)2 δ ppm 257 (CH2 C12) 505 (CH2 C5) 517 (CH C1) 525 (CH2
C4) 531 (CH3 C7) 551 (CH2 C6) 568 (CH2 C2) 572 (CH2 C3) 1170 (CH C14)
1286 (q-C C13) 1333 (CH C15) 1711 (q-C C9) 1714 (q-C C11) 1716 (q-C
C10) 1746 (q-C C8)
214
Figure 75 13
C NMR carbon assignments for DTPA-(AlaOMe)2
Figure 76 13
C NMR carbon assignments for DTPA-(ArgOMe)2
Figure 77 13
C NMR carbon assignments for DTPA-(SerOEt)2
215
Figure 78 13
C NMR carbon assignments for DTPA-(HisOMe)2
754 Characterisation of modified DTPA ligands by elemental analysis
Elemental analysis was also performed on the ligands for characterisation Since
the ligands do contain impurities despite several purification steps the elemental
analysis is not quite as predicted for pure samples Chlorine was found to also be
present from residual triethylammonium chloride as identified by NMR spectroscopy in
addition to residual solvents despite prolonged drying under vacuum
Table 72 Elemental analysis results for modified DTPA ligands P = predicted
proportion present () A = actual proportion present ()
C () H () N () Cl () Na ()
Ligand P A P A P A P A P A
DTPA-(AlaOMe)2
4689 4224 662 685 1243 1146 0 475 0 0
DTPA-(ArgOMe)2
4583 3896 701 637 2100 1643 0 1427 0 0
DTPA-(SerOEt)2
4622 4300 663 755 1123 1041 0 240 0 0
DTPA-(HisOMe)2
4834 3985 594 668 1812 1458 0 595 0 0
216
755 Luminescence studies with modified DTPA ligands
7551 Stock solutions
A stock solution (10 mM 10 mL) was made up for Eu(NO3)3xH2O in H2O or
D2O as required Additionally a stock solution of HDEHP in n-dodecane (1935 g in
100 mL 06 M) was prepared All reagents were purchased from Sigma-Aldrich
Stock solutions
10 mM EuTb(NO3)3 in H2OD2O
06 M HDEHP in n-dodecane
7552 Preparation of aqueous samples
2 mL samples were prepared for aqueous phases The Eu(NO3)3 stock solution
(02 mL) was added calculated quantities of each ligand to make samples with
concentrations of 1 mM Eu(NO3)3 and 005 M ligand when made up to 2 mL with H2O
or D2O The pH of samples was adjusted individually with concentrated HNO3 and
NaOH to minimise change in volume using a Mettler Toledo Seven Compact pHion
Meter pD was calculated using Equation 71
7553 Preparation of extracted samples
Aqueous samples were prepared as above (Section 7413) Due to the small
quantities of ligand available pre-equilibration was not possible as the same samples
used for aqueous phase studies were subsequently used for extraction studies The
aqueous phases were contacted with HDEHP in n-dodecane (2 mL 06 M) The
solutions were then shaken using a Scientific Industries Vortex Genie 2 Mixer and
Shaker for 15 minutes left to settle and separated into the two phases for analysis
7554 Radiolysis of ligand samples
Radiolysis experiments on modified DTPA ligand systems were carried out
using the 60
Co irradiator at DCF These irradiations were undertaken at the same time as
the GSH irradiations at a later date than the initial amino acid radiolysis studies
(Section 722) using the new calibrated sample holder with known dose rates and so
preparation and use of a Fricke solution was not necessary Samples received an average
of 7 kGy γ radiation
217
76 Instruments
761 FTS MODEL 812 System 60
Co Irradiator
All irradiations at the Dalton Cumbrian Facility were carried out using a 60
Co
irradiator which can allow multiple dose rates as it comprises two individual source
rods Radiation is generated by the decay of 60
Co to 60
Ni causing emission of β-
particles and γ-rays
Samples (5 mL for amino acid and GSH systems 2 mL for modified DTPA
ligand systems) were transferred into glass vials with plastic screw tops and placed
inside the irradiator mounted on a pre-designed rig Multiple samples were able to be
irradiated at once due to the design of the sample holder (Figure 79)
Figure 79 60
Co Irradiator at DCF (left) sample holder (top right) and sample holder
inside the irradiator (bottom right)
762 Edinburgh Instrument FP920 Phosphorescence Lifetime Spectrometer
All luminescence studies were carried out using an Edinburgh Instrument FP920
Phosphorescence Lifetime Spectrometer Steady state emission and excitation spectra
were recorded in quartz cuvettes on an Edinburgh Instrument FP920 Phosphorescence
Lifetime Spectrometer equipped with a 5 watt microsecond pulsed xenon flashlamp
(with single 300 mm focal length excitation and emission monochromators in Czerny
Turner configuration) and a red sensitive photomultiplier in peltier (air cooled) housing
(Hamamatsu R928P) Lifetime data were recorded following excitation with the
flashlamp and using time correlated single photon counting (PCS900 plug-in PC card
for fast photon counting) Lifetimes were obtained by tail fit on the data obtained
218
Table 73 Emission and excitation wavelengths for Ln3+
ions
763 Packard Cobra II Gamma Counter
Activity in separation samples prepared at the INL was measured using a Cobra
II Gamma Counter an automated gamma counter Background samples were counted in
addition in order allow correction for background radiation levels Samples run on
automated protocols run until the counting error is within 1 or the sample has run for
20 minutes
764 Bruker UltrashieldTM
400 NMR Spectrometer
NMR measurements were carried out using a Bruker UltrashieldTM
400
spectrometer of operating frequency 400 MHz (1H) and 162 MHz (
13C) with a variable
temperature unit set at 295 K unless otherwise stated The instrument was controlled
remotely using Bruker Topspin 21 software
Ln3+
Emission (nm) Excitation (nm)
Eu 617 395
Tb 545 379
Sm 600 403
Dy 575 352
219
1 CB Şenvar Chemical Dosimetry of Gamma Rays Neutrons and Accelerated
Electrons University of Ankara 1959 1-28
2 JWT Spinks and RJ Woods An Introduction to Radiation Chemistry Wiley-
Interscience Canada 3rd edn 1990
3 HE Gottlieb V Kotlyar and A Nudelman J Org Chem 1997 62 7512-7515
220
APPENDICES
APPENDIX 1 - Emission spectra for [GSH] pH dependence studies with DTPA in H2O
Figure A Emission spectra of Eu3+
in H2O at pH 2 with 005 M Na5DTPA over a GSH
concentration range of 01 ndash 05 M following excitation at 397 nm
Figure B Emission spectra of Eu3+
in H2O at pH 3 with 005 M Na5DTPA over a GSH
concentration range of 01 ndash 05 M following excitation at 397 nm
00
02
04
06
08
10
12
14
550 600 650 700
Emis
sio
n In
ten
sity
(au
) x
10
00
0
Wavelength (nm)
01 M GSH
02 M GSH
03 M GSH
04 M GSH
05 M GSH
00
02
04
06
08
10
12
14
550 600 650 700
Emis
sio
n In
ten
sity
(au
) x
10
00
0
Wavelength (nm)
01 M GSH
02 M GSH
03 M GSH
04 M GSH
05 M GSH
221
Figure C Emission spectra of Eu3+
in H2O at pH 4 with 005 M Na5DTPA over a GSH
concentration range of 01 ndash 05 M following excitation at 397 nm
00
02
04
06
08
10
12
14
550 600 650 700
Emis
sio
n In
ten
sity
(au
) x
10
00
0
Wavelength (nm)
01 M GSH
02 M GSH
03 M GSH
04 M GSH
05 M GSH
222
APPENDIX 2 - SFLnAm for varying GSH concentration over a pH range of 2-4 with
005 M Na5DTPA after extraction with 02 M HDEHP in dodecane
Figure D SFLnAm for varying GSH concentration at pH 2 with 005 M Na5DTPA after
extraction with 02 M HDEHP in dodecane
Figure E SFLnAm for varying GSH concentration at pH 3 with 005 M Na5DTPA after
extraction with 02 M HDEHP in dodecane
0
5
10
15
20
25
30
35
40
56 57 58 59 60 61 62 63 64 65 66 67 68
Sep
arat
ion
Fac
tor
Atomic Number
01 M GSH
02 M GSH
03 M GSH
04 M GSH
05 M GSH
0
50
100
150
200
250
56 57 58 59 60 61 62 63 64 65 66 67 68
Sep
arat
ion
Fac
tor
Atomic Number
01 M GSH
02 M GSH
03 M GSH
04 M GSH
05 M GSH
223
APPENDIX 3 - Natural pH values for modified DTPA ligands (005 M) with Eu(NO3)3
(1 mM)
Table F Natural pH values for modified DTPA ligands (005 M) with Eu(NO3)3 (1
mM)
Ligand Natural pH with Eu(NO3)3
DTPA-(AlaOMe)2 243
DTPA-(ArgOMe)2 238
DTPA-(SerOEt)2 240
DTPA-(HisOMe)2 286
224
APPENDIX 4 - Emission spectra for Eu(NO3)3 with modified DTPA ligands in H2O
Figure G Emission spectra for Eu(NO3)3 with modified DTPA ligands in H2O at pH 2
Figure H Emission spectra for Eu(NO3)3 with modified DTPA ligands in H2O at pH 3
0
2
4
6
8
10
12
550 575 600 625 650 675 700
Emis
sio
n In
ten
sity
(au
) x
10
00
0
Wavelength (nm)
Ala-DTPA
Arg-DTPA
Hist-DTPA
Ser-DTPA
0
2
4
6
8
10
12
14
550 575 600 625 650 675 700
Emis
sio
n In
ten
sity
(au
) x
10
00
0
Wavelength (nm)
Ala-DTPA
Arg-DTPA
Hist-DTPA
Ser-DTPA
225
Figure I Emission spectra for Eu(NO3)3 with modified DTPA ligands in H2O at pH 4
0
1
2
3
4
5
6
7
8
9
10
550 575 600 625 650 675 700
Emis
sio
n In
ten
sity
(au
) x
10
00
0
Wavelength (nm)
Ala-DTPA
Arg-DTPA
Hist-DTPA
Ser-DTPA
226
APPENDIX 5 - Emission spectra for radiolysis studies on Eu(NO3)3 in H2O with
DTPA-di(amino acid) ligands
Figure J Emission spectra for Eu(NO3)3 in H2O with DTPA-di(amino acid) ligands
(005 M) at pH 2 after irradiation with 7 kGy γ-radiation
Figure K Emission spectra for Eu(NO3)3 in H2O with DTPA-di(amino acid) ligands
(005 M) at pH 3 after irradiation with 7 kGy γ-radiation
00
05
10
15
20
25
550 575 600 625 650 675 700
Emis
sio
n In
tem
sity
(au
) x
10
00
0
Wavelength (nm)
Ala-DTPA
Arg-DTPA
Hist-DTPA
Ser-DTPA
00
05
10
15
20
25
550 575 600 625 650 675 700
Emis
sio
n In
ten
sity
(au
) x
10
00
0
Wavelength (nm)
Ala-DTPA
Arg-DTPA
Hist-DTPA
Ser-DTPA
227
Figure L Emission spectra for Eu(NO3)3 in H2O with DTPA-di(amino acid) ligands
(005 M) at pH 4 after irradiation with 7 kGy γ-radiation
00
05
10
15
20
25
550 575 600 625 650 675 700
Emis
sio
n In
ten
sity
(au
) x
10
00
0
Wavelength (nm)
Ala-DTPA
Arg-DTPA
Hist-DTPA
Ser-DTPA
228
APPENDIX 6 - MALDI-MS spectrum for DTPA-(AlaOMe)2
[M+H]+
[M+Na]+ [M+K]
+
229
AP
PE
ND
IX 7
- 1H N
MR
spectru
m fo
r DT
PA
-(AlaO
Me)
2
230
GSH1ESP
45 40 35 30 25 20 15
Chemical Shift (ppm)
01
02
03
04
05
06
07
08
09
Norm
alize
d In
tensi
ty
Water
44
944
844
6
38
9
37
6 37
437
2 28
628
628
528
4
24
924
8 24
724
624
524
4
21
1 20
920
720
5
AP
PE
ND
IX 8
- 1H N
MR
spectru
m fo
r GS
H
231
EUGSHESP
45 40 35 30 25 20 15
Chemical Shift (ppm)
01
02
03
04
05
06
07
08
09
Norm
alized Inte
nsity
Water
45
044
844
7
41
8
38
037
837
7
37
136
9
30
230
1
28
7 28
628
4
24
9 24
724
624
423
323
1
21
020
820
720
5
AP
PE
ND
IX 8
a - 1H N
MR
spectru
m fo
r Eu(N
O3 )
3 + G
SH
232

3
1228 Suitable Solvents for Luminescent Complexes
13 Nuclear Theory
131 Nuclear Power
132 The Nuclear Fuel Cycle
133 Spent Nuclear Fuel and Reprocessing
134 Solvent Extraction
1341 PUREX
1342 TRUEX
1343 DIAMEX
1344 SANEX
1345 iSANEX
1346 GANEX
1347 TRPO
1348 LUCA
1349 EXAm
137 TALSPEAK
1371 The Process
138 Reprocessing Summary
14 Project Objectives and Thesis Outline
References
2 Complexation Studies of Ln amp An with DTPA and Buffers
under TALSPEAK Conditions
21 Introduction to An-DTPA and Ln-DTPA Complexes
211 Stability of Ln-DTPA and An-DTPA Complexes
212 Co-ordination Chemistry of Ln-DTPA and An-DTPA
Complexes
22 Ln-DTPA Complexation Studies
221 1H NMR Studies of Ln-DTPA
222 Luminescence Studies of Ln-DTPA
23 An-DTPA Complexation Studies
231 1H NMR Studies of An-DTPA
232 Luminescence Studies of An-DTPA
50
51
51
52
53
55
55
57
59
60
62
63
65
67
68
69
69
74
75
77
81
81
82
83
84
84
86
88
88
89
4
24 Introduction to Buffer Interaction with Ln3+
and Ln-DTPA
Complexes
241 Interaction of Lactate with Ln3+
and Ln-DTPA
Complexes
242 Interaction of Amino Acids with Ln3+
and Ln-DTPA
Complexes
25 Studies on Buffer Interaction with M3+
and [M(DTPA)]2-
251 1HNMR Studies on Buffer Interactions
252 Luminescence Studies on Buffer Interactions
2521 Sensitisation Tests
2522 Aqueous Phase Lanthanide Studies without
Na5DTPA
2523 Aqueous Phase Lanthanide Studies with
Na5DTPA
2524 Aqueous Phase Actinide Studies with
Na5DTPA
253 Radiolysis Studies on Amino Acid Buffered Systems
2531 Previous Studies at the INL
2532 Irradiation Studies using Amino Acid Buffers
254 Buffer Interaction Summary
References
3 Solvent Extraction and Optimisation Studies with Amino Acid
Buffers
31 Previous Work at INL
311 L-alanine Studies
3111 pH Studies on L-alanine
3112 Concentration Effects
3113 Studies at pH 2
312 Other Amino Acids
32 L-alanine System Optimisation at pH 2
321 [Na5DTPA] Dependence (EuAm)
322 [HDEHP] Dependence (EuAm)
323 L-alanine Optimisation Summary
33 Other Amino Acid Studies
90
90
92
93
93
95
95
96
98
99
100
100
102
105
106
108
108
108
108
110
111
111
113
114
116
118
119
5
331 Initial Tests with Other Amino Acids
332 Studies with L-Histidine
34 Summary of Separations with Amino Acid Buffers
References
4 Studies using L-Glutathione as a Buffer in a TALSPEAK
System
41 Solvent Extraction and Separation using GSH
411 [L-Glutathione] and pH Dependence
4111 [GSH] Dependence without Na5DTPA
4112 [GSH] and pH Dependence with
Na5DTPA
412 [Na5DTPA] Dependence at pH 4
413 [HDEHP] Dependence at pH 4
42 Luminescence Studies using GSH with Eu3+
421 [GSH] and pH Dependence without Na5DTPA
4211 Aqueous Phase Studies
4212 Extraction Studies
422 [GSH] and pH Dependence with Na5DTPA
4221 Aqueous Phase Studies
4222 Extraction Studies
423 [Na5DTPA] Dependence at pH 4
4231 Aqueous Phase Studies
4232 Extraction Studies
424 [HDEHP] Dependence at pH 4
43 Radiolysis Studies using GSH at pH 4
431 Aqueous Phase Studies
432 Extraction Studies
44 Luminescence Studies using GSH with Dy3+
441 Dy3+
Complexation Studies
442 pH Dependence Studies
45 Luminescence Studies using GSH with Mixed Ln3+
Systems at pH 4
451 Complexation Studies
452 pH Dependence Studies
119
120
121
123
124
127
127
127
127
132
133
136
137
137
139
140
140
143
145
145
148
149
151
151
153
154
155
156
157
157
160
6
46 ICP-MS Studies with GSH
47 1H NMR Studies on GSH Systems
48 Summary and Conclusion of Glutathione Work
References
5 Modified DTPA Ligands as Combined Buffers and Soft Donors
in a TALSPEAK System
51 Ligand Synthesis
52 Luminescence Studies on Ligand Systems at pH 2 3 and 4
521 Aqueous Phase Studies
522 Extraction Studies
53 Radiolysis Studies on Ligand Systems at pH 2
531 Aqueous Phase Studies
532 Extraction Studies
54 Separation Work on Ligand Systems
541 AmEu Separation in Ligand Systems
542 Ln Separation in Ligand Systems
55 Summary and Conclusion of Modified DTPA Ligand
Work
References
6 Summary Conclusions and Future Work
61 Summary amp Conclusions
62 Future Work
References
7 Experimental Section
71 Chemicals and Reagents
711 Handling Radioisotopes at INL
72 Complexation studies of Ln3+
amp An3+
with amino acids in
TALSPEAK systems
721 Preparation of samples for luminescence studies
7211 Stock solutions
7212 Preparation of aqueous samples
7213 Preparation of extracted samples
163
166
170
173
174
175
176
176
179
183
183
184
185
186
187
190
191
192
192
198
200
201
201
201
201
201
201
202
202
7
722 Radiolysis of samples
7221 Preparation of Fricke solution
7222 Calculating dose rates
73 Solvent extraction and separation studies using amino
acids and glutathione at INL
731 Preparation of samples
7311 Stock solutions for amino acid studies
7312 [Na5DTPA] dependence SX samples for
amino acid studies
7313 [HDEHP] dependence SX samples for
amino acid studies
7314 Other amino acid SX samples for amino
acid studies
7315 Stock solutions for glutathione studies
7316 [GSH] dependence SX samples without
Na5DTPA
7317 [GSH] and pH dependence SX samples
with Na5DTPA
7318 [Na5DTPA] dependence SX samples for
GSH studies
7319 [HDEHP] dependence SX samples for
amino acid studies
732 Gamma counting
733 ICP-MS
74 Luminescence studies and solvent extraction using
glutathione at UoM
741 Preparation of luminescence samples
7411 Stock solutions for GSH studies
7412 Preparation of aqueous samples
7413 Preparation of extracted samples
742 Radiolysis of GSH samples
74 Modified DTPA Ligands
751 Synthesis of modified DTPA ligands
752 Characterisation of modified DTPA ligands by
MALDI-MS
203
203
203
205
205
205
205
205
206
206
206
206
207
207
207
208
208
208
208
209
209
210
210
210
210
8
753 Characterisation of modified DTPA ligands by
NMR spectroscopy
7531 1H NMR Spectroscopy
7532 13
C NMR Spectroscopy
754 Characterisation of modified DTPA ligands by
elemental analysis
755 Luminescence studies with modified DTPA
ligands
7551 Stock solutions
7552 Preparation of aqueous samples
7553 Preparation of extracted samples
7554 Radiolysis of ligand samples
76 Instruments
761 FTS MODEL 812 System 60
Co Irradiator
762 Edinburgh Instrument FP920 Phosphorescence
Lifetime Spectrometer
763 Packard Cobra II Gamma Counter
764 Bruker UltrashieldTM
400 NMR Spectrometer
References
Appendices
Appendix 1 - Emission spectra for [GSH] pH dependence
studies with DTPA in H2O
Appendix 2 - SFLnAm for varying GSH concentration over a
pH range of 2-4 with 005 M Na5DTPA after
extraction with 02 M HDEHP in dodecane
Appendix 3 - Natural pH values for modified DTPA ligands
(005 M) with Eu(NO3)3 (1 mM)
Appendix 4 - APPENDIX 4 - Emission spectra for Eu(NO3)3
with modified DTPA ligands in H2O
Appendix 5 - Emission spectra for radiolysis studies on
Eu(NO3)3 in H2O with DTPA-di(amino acid)
ligands
Appendix 6 - MALDI-MS spectrum for DTPA-(AlaOMe)2
211
211
213
215
216
216
216
216
216
217
217
217
218
218
219
220
220
222
223
224
226
228
9
Appendix 7 - 1H NMR spectrum for DTPA-(AlaOMe)2
Appendix 8 - 1H NMR spectrum for GSH
Appendix 8a - 1H NMR spectrum for Eu(NO3)3 + GSH
Total Word Count 50439
229
230
231
10
LIST OF TABLES
Table 11 Electronic properties of the lanthanides
Table 12 Electronic properties of the actinides
Table 13 Available oxidation states of the actinides and colours of
ions in solution where applicable
Table 14 Luminescence of lanthanide ions
Table 15 Luminescence of actinide ions
Table 16 Approximate compositions of SNF in Light Water
Reactors (LWR)
Table 21 Luminescence lifetimes and q values for Eu3+
with amino
acidslactate
Table 22 Luminescence lifetimes and q values for [Eu(DTPA)]2-
with amino acidslactate
Table 23 Separation factors for Eu3+
Am3+
in the presence of L-
alanine at 05 M under TALSPEAK conditions when subjected
to different doses of γ-radiation
Table 24 Luminescence lifetimes for aqueous and organic phases for
[Eu(DTPA)]2-
systems before and after irradiation at pH 36
Table 25 Luminescence lifetimes and q values for [Eu(DTPA)]2-
systems before and after irradiation at pH 36
Table 31 Distribution ratios and separation factors for a number of
L-alanine buffered TALSPEAK systems as pH and buffer
concentration are varied compared to a traditional lactic acid
system
Table 32 Distribution ratios and separation factors for a number of
amino acid buffered TALSPEAK systems
Table 33 Separation factors for L-alanine optimisation studies
Table 34 DAm values for L-alanine optimisation studies
Table 35 Separation factors and DAmEu values for traditional
TALSPEAK systems with different buffers at varying pH
values
Table 41 Eu3+
Am3+
distribution and separation for [GSH]
dependence with 005 M Na5DTPA at pH 4
11
Table 42 Eu3+
Am3+
distribution and separation for [Na5DTPA]
dependence with 05 M GSH buffer at pH 4
Table 43 Eu3+
Am3+
distribution and separation for [HDEHP]
dependence with 03 M Na5DTPA and 05 M GSH buffer at
pH 4
Table 44 Eu3+
Am3+
distribution and separation for [HDEHP]
dependence with 04 M Na5DTPA and 05 M GSH buffer at
pH 4
Table 45 Luminescence lifetimes and q values for Eu3+
with GSH at
pHD 4
Table 46 J=1J=2 peak ratios and t-test results for Eu-DTPA at pD
2-4 over a GSH concentration range of 01-05 M following
excitation at 397 nm
Table 47 Luminescence lifetimes and q values for Eu-DTPA at pH
2-4 over a GSH concentration range of 01-05 M
Table 48 J=1J=2 peak ratios and t-test results for Eu-DTPA at pH
2-4 as [GSH] is varied
Table 49 J=1J=2 peak ratios and t-test results for Eu-DTPA with
05 M GSH in D2OH2O at pDpH 4 over a Na5DTPA
concentration range of 005-06 M
Table 410 Luminescence lifetimes and q values for Eu-DTPA with
05 M GSH at pH 4 over a Na5DTPA concentration range of
005-06 M following excitation at 397 nm
Table 411 J=1J=2 peak ratios and t-test results for Eu3+
in the
aqueous phase with 05 M GSH at pH 4 as [Na5DTPA] is
varied after extraction with 02 M HDEHP
Table 412 J=1J=2 peak ratios and t-test results for Eu3+
in the
aqueous phase with 05 M GSH and 03 M Na5DTPA at pH 4
as [HDEHP] is varied after extraction
Table 413 J=1J=2 peak ratios and t-test results for Eu-DTPA with
05 M GSH in D2OH2O at pDpH 4 over a Na5DTPA
concentration range of 01-06 M after irradiation with 7 kGy
γ-radiation
12
Table 414 Luminescence lifetimes and q values for Eu-DTPA with
05 M GSH at pH 4 over a Na5DTPA concentration range of
01-06 M after irradiation with 7 kGy γ-radiation
Table 414 Luminescence lifetimes and q values for Eu-DTPA with
05 M GSH at pH 4 over a Na5DTPA concentration range of
01-06 M after irradiation with 7 kGy γ-radiation
Table 415 J=1J=2 peak ratios and t-test results for Eu3+
in the
aqueous phase with 05 M GSH and at pH 4 as [Na5DTPA] is
varied after extraction with 02 M HDEHP in dodecane from
an aqueous phase irradiated at 7 kGy γ ndashradiation
Table 416 Luminescence lifetimes for lanthanide samples at pH 4
Table 417 Luminescence lifetimes and q values for Eu3+
and Tb3+
samples at pH 4
Table 418 Luminescence lifetimes for aqueous phases before
extraction over a pH range of 2-4
Table 419 Luminescence lifetimes and q values for Eu3+
and Tb3+
samples before extraction over a pH range of 2-4
Table 420 SFLnAm for varying GSH concentration over a pH range
of 2-4 with 005 M Na5DTPA after extraction with 02 M
HDEHP in dodecane
Table 51 J=1J=2 peak ratios and t-test results for Eu- DTPA-
bis(amino ester) complexes at pD 2-4
Table 52 Luminescence lifetimes and q values for Eu-DTPA-
bis(amino ester) complexes at pD 2-4 recorded at the emission
maximum (617 nm) following 397 nm excitation
Table 53 J=1J=2 peak ratios and t-test results for organic phases
after extraction after Eu3+
extraction aqueous phases
containing DTPA-bis(amino ester) ligands (50 mM) at pH 2-4
Table 54 J=1J=2 peak ratios and t-test results for Eu-DTPA-
bis(amino ester) complexes at pD 2 after irradiation with 7
kGy γ-radiation
Table 55 Luminescence lifetimes and q values for Eu-DTPA-
bis(amino ester) complexes at pD 2-4 after irradiation with 7
kGy γ-radiation
13
Table 56 J=1J=2 peak ratios and t-test results for the organic phases
after Eu3+
extraction from aqueous phases containing DTPA-
bis(amino ester) ligands (50 mM) at pH 2 one of which had
been irradiated with 7 kGy γ-radiation
Table 57 Luminescence lifetimes and q values for the organic
phases after Eu3+
extraction from aqueous phases containing
DTPA-bis(amino ester) ligands (50 mM) at pH 2 one of which
had been irradiated with 7 kGy γ-radiation
Table 71 Dose rates received at each sample position in the 60
Co
irradiator at DCF
Table 72 Elemental analysis results for modified DTPA ligands P =
predicted proportion present () A = actual proportion
present ()
Table 73 Emission and excitation wavelengths for Ln3+
ions
14
LIST OF FIGURES
Figure 11 Jablonski diagram showing fluorescence and
phosphorescence
Figure 12 Energy transfer pathway for sensitised luminescence of
Ln3+
complexes
Figure 13 Energy level diagram showing the ground and excited
states of a selection of lanthanides and vibrational oscillators
Figure 14 The energy gaps between the lowest emissive states and
ground states of a selection of lanthanides and actinides
Figure 15 Chain reaction generated by fission of 235
U into 92
Kr and
141
Ba
Figure 16 The Nuclear Fuel Cycle
Figure 17 Chemical structure of TBP (Tri-nbutyl phosphate)
Figure 18 PUREX flow diagram
Figure 19 Chemical structure of CMPO (NN-diisobutyl-2-
(octyl(phenyl)phosphoryl)acetamide)
Figure 110 TRUEX flow diagram
Figure 111 Chemical structure of DMDBTDMA
Figure 112 Chemical structure of DMDOHEMA
Figure 113 Example DIAMEX flow diagram
Figure 114 General chemical structure of BTPs
Figure 115 Chemical structure of TODGA
Figure 116 Chemical structure of HEDTA
Figure 117 SANEX flow diagram for TODGA process
Figure 118 General chemical structure of BTBPs
Figure 119 Chemical structure of CyMe4-BTBP
Figure 120 Chemical structure of CyMe4-BTPhen
Figure 121 GANEX flow diagram
Figure 122 Chemical structure of TRPO
Figure 123 Chemical structure of CYANEX 301
Figure 124 Chemical structure of TTHA
Figure 125 TRPO flow diagram using TTHA
Figure 126 TRPO flow diagram using HNO3 and oxalic acid
Figure 127 LUCA flow diagram
15
Figure 128 Chemical structure of TEDGA
Figure 129 Chemical structure of DTPA
Figure 130 Chemical structure of HDEHP
Figure 131 Chemical structure of HEH[ϕP]
Figure 132 Chemical structure of lactic acid pKa = 386
Figure 133 The solvent extraction process used in TALSPEAK Step
1 Binding of DTPA to M3+
in the aqueous phase at pH 36
buffered by lactic acid Step 2 Selective extraction of Ln3+
into the organic phase by HDEHP from the aqueous phase due
to preferential binding of DTPA to MA3+
Figure 134 Effect of Na5DTPA concentration on distribution ratios
of MA3+
and Ln3+
in TALSPEAK process using 1 M lactate
buffer and 03 M HDEHP in DIPB extractant
Figure 135 TALSPEAK flow diagram
Figure 21 XAS molecular structure of Gd(III)-DTPA
Figure 22 Chemical structure of [Eu(DTPA)]2-
Figure 23 1H NMR spectrum of [Eu(DTPA)]
2- in D2O at 278 K at
pD = 36
Figure 24 1H NMR spectra of DTPA in D2O at 278 K at varying pD
a) pD 7 [DTPA]5-
b) pD 36 [H3DTPA]2-
c) pD 2 [H5DTPA]
Figure 25 Emission spectrum of Eu3+
(aq) and [Eu(DTPA)]2-
in D2O
at pD 36
Figure 26 1H NMR spectrum for [Am(DTPA)xH2O]
2- in 41 vv
MeODD2O with NaOD over a temperature range at pH 3
Figure 27 Emission spectrum of Cm3+
and [Cm(DTPA)]2-
in
perchloric acid at pH 3 by direct excitation with a NdYAG
pumped dye laser at 3966 nm
Figure 28 Emission spectrum of Eu-lactate as a function of lactate
concentration
Figure 29 Co-ordination mode of lactate to Eu3+
Figure 210 Chemical structures of L-alanine (top) glycine (bottom
left) and L-serine (bottom right)
Figure 211 1H NMR spectrum of Eu(NO3)3xH2O (10 mM) with L-
alanine in D2O at 278 K
16
Figure 212 1H NMR spectrum of L-alanine in D2O at 278 K
Figure 213 1H NMR spectrum of [Eu(DTPA)]
2- (10 mM) with L-
alanine (1 M) in D2O at 278 K
Figure 214 Emission spectra of [Tb(DTPA)]2-
in D2O at pD 3 with
and without the presence of L-phenylalanine (05 M) excited at
250 nm and 379 nm Excitation spectrum of [Tb(DTPA)]2-
in
D2O at pD 3 with L-phenylalanine (05 M) at 545 nm
Figure 215 Chemical structure of L-phenylalanine
Figure 216 Emission spectra of Eu(NO3)3 in D2O at pD 36 with and
without the presence of amino acidslactate (1 M) excited at
395 nm at 298 K
Figure 217 Emission spectra of Eu-DTPA in D2O at pD 36 with and
without the presence of amino acidslactate (1 M) excited at
395 nm
Figure 218 Emission spectrum of [Cm(DTPA)]2-
in H2O with and
without L-alanine (25 mM) at pH 3 by direct excitation at 396
nm
Figure 219 Graph illustrating the rates of reaction of the middotOH radical
with L-alanine compared to lactic acid and the lactate ion
Figure 220 Distribution ratios for Ln3+
and Am3+
in the presence of
L-alanine at 05 M pH 2 at different doses of γ-radiation
Figure 221 Emission spectra of Eu3+
in D2O at pD 36 with and
without the presence of amino acidslactate excited at 395 nm
before 5 kGy γ-irradiation
Figure 222 Emission spectra of Eu3+
in D2O at pD 36 with and
without the presence of amino acidslactate excited at 395 nm
after 5 kGy γ-irradiation
Figure 31 The effect of pH on an L-alanine-buffered TALSPEAK
system
Figure 32 Distribution ratios of Ln3+
Y3+
in a TALSPEAK system 1
mM LnY3+
1 M lactate 005 M DTPA pH 7 extracted using
05 M HDEHP in 14-DIPB
Figure 33 The effect of buffer concentration on an L-alanine-
buffered TALSPEAK system
17
Figure 34 Chemical structures of L-arginine (top) L-histidine
(bottom left) and L-methionine (bottom right)
Figure 35 DTPA speciation as a function of pH modelled using
HySS sofware using literature pKa values
Figure 36 [Na5DTPA] dependence of L-alanine system (05 M) at
pH 2
Figure 37 Eu3+
Am3+
separation for [Na5DTPA] dependence of L-
alanine system (05 M) at pH 2
Figure 38 Eu3+
Am3+
separation for [HDEHP] dependence of L-
alanine system (05 M) at pH 2 using 02 M Na5DTPA
Figure 39 Eu3+
Am3+
separation for [HDEHP] dependence of L-
alanine system (05 M) at pH 2 using 03 M Na5DTPA
Figure 310 Eu3+
Am3+
separation for [HDEHP] dependence of L-
alanine system (05 M) at pH 2 using 04 M Na5DTPA
Figure 311 Distribution ratios of La3+
-Ho3+
and Am3+
with 05 M L-
histidine buffer at pH 2 and pH 3
Figure 41 Molecular structures of eisenin (top) and norophthalmic
acid (bottom)
Figure 42 Molecular structures of biotinvitamin B7 (top) and folic
acid vitamin B9 (bottom)
Figure 43 Molecular structure of L-glutathione (reduced form)
Figure 44 Eu3+
Am3+
distribution for [GSH] dependence with 005
M Na5DTPA at pH 2 extracted using 02 M HDEHP in
dodecane Results were averaged from 3 repeat tests
Figure 45 Eu3+
Am3+
distribution for [GSH] dependence with 005
M Na5DTPA at pH 3 extracted using 02 M HDEHP in
dodecane Results were averaged from 3 repeat tests
Figure 46 Eu3+
Am3+
distribution for [GSH] dependence with 005
M Na5DTPA at pH 4 Results were averaged from 3 repeat
tests
Figure 47 GSH speciation as a function of pH modelled using
HySS software using literature pKa values
Figure 48 H2GSH- species dominant in solution at pH 4
18
Figure 49 A ternary Nd DO3A-pyrazine amine carboxylate complex
reported by Faulkner at al (left) and anticipated bidentate
chelation of GSH with Am-DTPA at pH 4 (right)
Figure 410 Eu3+
and Am3+
distribution for [Na5DTPA] dependence
with 05 M GSH buffer at pH 4 curves fitted as polynominal
order 2 for both Am3+
and Eu3+
Results were averaged from 3
repeat tests
Figure 411 Eu3+
and Am3+
distribution for [HDEHP] dependence
with 03 M Na5DTPA and 05 M GSH buffer at pH 4 curve
for Eu3+
fitted as polynominal order 2 linear correlation for
Am3+
Results were averaged from 3 repeat tests
Figure 412 Eu3+
and Am3+
distribution for [HDEHP] dependence
with 04 M Na5DTPA and 05 M GSH buffer at pH 4 linear
correlation for both Am3+
and Eu3+
Results were averaged
from 3 repeat tests
Figure 413 Corrected emission spectra of Eu(NO3)3 (1 mM)
Eu(NO3)3 with GSH (05 M) and Eu(NO3)3 with Na5DTPA
(005 M) in H2O following excitation at 397 nm
Figure 414 Emission spectra of Eu(NO3)3 in H2O at pH 4 over a
GSH concentration range of 01 ndash 05 M following excitation
at 397 nm
Figure 415 Emission spectra of Eu(NO3)3 in D2O at pH 4 over a
GSH concentration range of 01 ndash 05 M following excitation
at 397 nm
Figure 416 Emission spectra of aqueous and organic phases after
Eu3+
extraction at pH 4 using a GSH concentration range of
01 ndash 05 M following excitation at 397 nm
Figure 417 Emission spectra of Eu3+
in D2O at pD 2 with 005 M
Na5DTPA over a GSH concentration range of 01 ndash 05 M
following excitation at 397 nm
Figure 418 Emission spectra of Eu3+
in D2O at pD 3 with 005 M
Na5DTPA over a GSH concentration range of 01 ndash 05 M
following excitation at 397 nm
19
Figure 419 Emission spectra of Eu3+
in D2O at pD 4 with 005 M
Na5DTPA over a GSH concentration range of 01 ndash 05 M
following excitation at 397 nm
Figure 420 Emission spectra of aqueous phases after Eu3+
extraction
at pH 2-4 over a GSH concentration range of 01-05 M
following excitation at 397 nm
Figure 421 Emission spectra of organic phases after Eu3+
extraction
at pH 2-4 over a GSH concentration range of 01-05 M
following excitation at 397 nm
Figure 422 Emission spectra of Eu(NO3)3 in D2O at pD 4 with 05
M GSH over a Na5DTPA concentration range of 005 ndash 06 M
following excitation at 397 nm
Figure 423 Emission spectra of Eu(NO3)3 in H2O at pH 4 with 05
M GSH over a Na5DTPA concentration range of 005 ndash 06 M
following excitation at 397 nm
Figure 424 Emission spectra of aqueous and organic phases after
Eu3+
extraction with 05 M GSH at pH 4 over a Na5DTPA
concentration range of 005-06 M following excitation at 397
nm
Figure 425 Emission spectra of aqueous phases after Eu3+
extraction
with 05 M GSH and 03 M Na5DTPA at pH 4 over an
HDEHP concentration range of 02-10 M following
excitation at 397 nm
Figure 426 Emission spectra of organic phases after Eu3+
extraction
with 05 M GSH and 03 M Na5DTPA at pH 4 over an
HDEHP concentration range of 02-10 M following
excitation at 397 nm
Figure 427 Emission spectra of Eu(NO3)3 in H2O at pH 4 with 05
M GSH over a Na5DTPA concentration range of 005 ndash 06 M
after irradiation with 7 kGy γ-radiation following excitation at
397 nm
Figure 428 Emission spectra of aqueous and organic phases after
Eu3+
extraction from irradiated aqueous phase at pH 4
containing 05 M GSH over a Na5DTPA concentration range
of 01-06 M
20
Figure 429 Emission spectra of Dy(NO3)3 Dy-DTPA and Dy(NO3)3
with GSH in H2O following excitation at 352 nm Note that
the tail of ligand emission can be seen in the Dy DTPA and
Dy GSH solutions at shorter wavelengths
Figure 430 Emission spectra of aqueous and organic phases of
Dy(NO3)3 Dy-DTPA and Dy(NO3)3 with GSH after extraction
with 10 M HDEHP following excitation at 352 nm
Figure 431 Emission spectra of aqueous and organic phases of
Dy(NO3)3 Dy-DTPA and Dy(NO3)3 with GSH after extraction
with 10 M HDEHP following 352 nm excitation
Figure 432 Emission spectra of Ln(NO3)3 (1 mM EuTbSm3+
10
mM Dy3+
) in H2O at pH 4 following direct excitation (405 nm
for Sm3+
397 nm for Eu3+
366 nm for Tb3+
and 352 nm for
Dy3+
)
Figure 433 Emission spectra of Ln(NO3)3 (1 mM EuTbSm3+
10
mM Dy3+
) with GSH (05 M) at pH 4 in H2O following direct
excitation (405 nm for Sm3+
397 nm for Eu3+
366 nm for Tb3+
and 352 nm for Dy3+
)
Figure 434 Emission spectra of Ln-DTPA (1 mM EuTbSm3+
10
mM Dy3+
005 M Na5DTPA) in H2O at pH 4 following direct
excitation (405 nm for Sm3+
397 nm for Eu3+
366 nm for Tb3+
and 352 nm for Dy3+
)
Figure 435 Emission spectra of Ln(NO3)3 (1 mM EuTbSm3+
10
mM Dy3+
) with GSH (05 M) and Na5DTPA (005 M)
following direct excitation (405 nm for Sm3+
397 nm for Eu3+
366 nm for Tb3+
and 352 nm for Dy3+
)
Figure 436 Emission spectra of aqueous and organic phases of Ln3+
with 05 M GSH and 005 M Na5DTPA after extraction with
10 M HDEHP at pH 2 following direct excitation (405 nm for
Sm3+
397 nm for Eu3+
366 nm for Tb3+
and 352 nm for Dy3+
)
Figure 437 Emission spectra of aqueous and organic phases of Ln3+
with 05 M GSH and 005 M Na5DTPA after extraction with
10 M HDEHP at pH 3 following direct excitation (405 nm for
Sm3+
397 nm for Eu3+
366 nm for Tb3+
and 352 nm for
Dy3+
)
21
Figure 438 Emission spectra of aqueous and organic phases of Ln3+
with 05 M GSH and 005 M Na5DTPA after extraction with
10 M HDEHP at pH 4 following direct excitation (405 nm for
Sm3+
397 nm for Eu3+
366 nm for Tb3+
and 352 nm for
Dy3+
)
Figure 439 DLn for varying GSH concentration at pH 2 with 005 M
Na5DTPA after extraction with 02 M HDEHP in dodecane
Figure 440 DLn for varying GSH concentration at pH 3 with 005 M
Na5DTPA after extraction with 02 M HDEHP in dodecane
Figure 441 1H NMR spectra for GSH in D2O under a range of
conditions at 298 K a) GSH b) GSH after irradiation with 7
kGy γ-radiation c) Eu(NO3)3 with GSH d) GSH with
Na5DTPA e) Eu-DTPA with GSH
Figure 442 1H
1NMR proton assignments for GSH (top) and γ-Glu-
Cys (bottom)
Figure 51 General structure of DTPA-amino acid ligands
Figure 52 Emission spectra of Eu(NO3)3 with DTPA-bis(amino
ester) ligands in D2O at pD 2 following excitation at 397 nm
Figure 53 Emission spectra of Eu(NO3)3 with DTPA-bis(amino
ester) ligands in D2O at pD 3 following excitation at 397 nm
Figure 54 Emission spectra of Eu(NO3)3 with DTPA-bis(amino
ester) ligands in D2O at pD 4 following excitation at 397 nm
Figure 55 Emission spectra of aqueous phases after Eu3+
extraction
from an aqueous phase containing DTPA-bis(amino ester)
ligands (50 mM) at pH 2 following excitation at 397 nm
Figure 56 Emission spectra of aqueous and organic phases after Eu3+
extraction from an aqueous phase containing DTPA-bis(amino
ester) ligands (50 mM) at pH 2 following excitation at 397
nm
Figure 57 Emission spectra of aqueous and organic phases after Eu3+
extraction from an aqueous phase containing DTPA-bis(amino
ester) ligands (50 mM) at pH 3 following excitation at 397
nm
22
Figure 58 Emission spectra of aqueous and organic phases after Eu3+
extraction from an aqueous phase containing DTPA-bis(amino
ester) ligands (50 mM) at pH 4 following excitation at 397
nm
Figure 59 Emission spectra of Eu(NO3)3 in D2O with DTPA-
bis(amino ester) ligands (50 mM) at pH 2 after irradiation
with 7 kGy γ- radiation and following excitation at 397 nm
Figure 510 Emission spectra of aqueous and organic phases after
Eu3+
extraction from an irradiated (7 kGy γ-radiation) aqueous
phase containing DTPA-bis(amino ester) ligands (50 mM) at
pH 2 following excitation at 397 nm
Figure 511 Separation factors and distribution ratios for Eu3+
Am3+
using DTPA-(ArgOMe)2 (005 M) at pH 1-2 extracted using
HDEHP (02 M) in kerosene
Figure 512 Separation factors and distribution ratios for Eu3+
Am3+
using DTPA-(SerOEt)2 (005 M) at pH 1-2 extracted using
HDEHP (02 M) in kerosene
Figure 513 Separation factors and distribution ratios for Eu3+
Am3+
using DTPA-(HisOMe)2 (005 M) at pH 1-2 extracted using
HDEHP (02 M) in kerosene
Figure 514 Distribution ratios for Ln3+
using DTPA-(ArgOMe)2
(005 M) at pH 1-2 extracted using HDEHP (02 M) in
kerosene
Figure 515 Distribution ratios for Ln3+
using DTPA-(SerOEt)2 (005
M) at pH 1-2 extracted using HDEHP (02 M) in kerosene
Figure 516 Distribution ratios for Ln3+
using DTPA-(HisOMe)2
(005 M) at pH 1-2 extracted using HDEHP (02 M) in
kerosene
Figure 61 Chemical structures of amino acids
Figure 71 1H NMR proton assignments for DTPA-(AlaOMe)2
Figure 72 1H NMR proton assignments for DTPA-(ArgOMe)2
Figure 73 1H NMR proton assignments for DTPA-(SerOEt)2
Figure 74 1H NMR proton assignments for DTPA-(HisOMe)2
Figure 75 13
C NMR carbon assignments for DTPA-(AlaOMe)2
Figure 76 13
C NMR carbon assignments for DTPA-(ArgOMe)2
23
Figure 77 13
C NMR carbon assignments for DTPA-(SerOEt)2
Figure 78 13
C NMR carbon assignments for DTPA-(HisOMe)2
Figure 79 60
Co Irradiator at DCF (left) sample holder (top right)
and sample holder inside the irradiator (bottom right)
24
ABSTRACT
The University of Manchester
Madeleine Hilton Langford Paden
PhD
Development of a Simplified Soft-Donor Technique for Trivalent Actinide-Lanthanide
Separations
2015
The necessity of reprocessing spent nuclear fuel has arisen from increasing
awareness and concern for the environment in addition to the potential of minimising
proliferation A number of different reprocessing techniques are currently being
developed around the world to allow useful spent nuclear fuel (SNF) to be recycled and
reused and the remaining waste to be treated One such technique currently being
developed in the USA is the TALSPEAK process an advanced reprocessing method for
the separation of trivalent lanthanide (Ln3+
) and minor actinide (MA3+
) components
This process developed in the 1960s at Oak Ridge National Laboratory uses DTPA to
act as a holdback reagent for MA3+
in a lactate buffered aqueous phase at pH 36
allowing Ln3+
to be selectively extracted by organophosphate HDEHP into an organic
phase of DIPB or dodecane
TALSPEAK is one of the most promising techniques being researched due to its
numerous advantages particularly its relative resistance to radiolysis and its ability to
be carried out without the need for high reagent concentrations Additionally it gives
high separation factors in the region of ~50-100 comparable to other advanced
reprocessing methods under development The chemistry of the process is very complex
and not particularly well understood so it would be advantageous to simplify the process
by removing the need for a separate holdback reagent and buffer
In collaboration with colleagues at the Idaho National Lab the use of amino
acids as a potential combined buffer and soft donor was investigated Although it was
found that amino acids do not act as holdback reagents in their own right optimisation
of an L-alanine buffered TALSPEAK system with DTPA was found to allow the
process to be carried out effectively at a lower pH of 2 which is more preferable for
industrial application
As an extension of this separation studies were carried out using the tripeptide
L-glutathione (GSH) to determine its potential for use as a combined buffer and soft-
donor As with the studies with amino acids it was found that GSH also does not act as
a holdback reagent in its own right however it does interact with Ln-DTPA complexes
at pH 4 When optimised at this pH separation factors of up to 1200 were achieved for
Eu3+
Am3+
whilst still maintaining low MA3+
partitioning However further studies by
ICP-MS and luminescence spectroscopy showed that a GSH buffered system was not
effective for extraction of heavier lanthanides although the results show the potential
for further investigation into other short and longer chain peptide buffered systems and
possibly lanthanide-lanthanide separations
Further studies were carried on amino acid appended DTPA ligands which were
synthesised in a one step reaction in order to create a combined buffer and soft donor
The ligands were found to self-buffer at around pH 2 and allow successful separation of
Eu3+
Am3+
(SF ~ 100) The results from initial investigations by luminescence
spectroscopy and solvent extraction are promising and are presented here Further work
is needed on these systems in order to optimise their extraction capability and minimise
Am3+
partitioning In the future this work could promote studies for better
understanding of TALSPEAK chemistry that could be used in industrial partitioning
processes
25
DECLARATION
No portion of the work referred to in the thesis has been submitted in support of an
application for another degree or qualification of this or any other university or other
institute of learning
26
COPYRIGHT STATEMENT
The author of this thesis (including any appendices andor schedules to this thesis) owns
certain copyright or related rights in it (the ldquoCopyrightrdquo) and she has given The
University of Manchester certain rights to use such Copyright including for
administrative purposes
ii Copies of this thesis either in full or in extracts and whether in hard or electronic
copy may be made only in accordance with the Copyright Designs and Patents Act
1988 (as amended) and regulations issued under it or where appropriate in accordance
with licensing agreements which the University has from time to time This page must
form part of any such copies made
iii The ownership of certain Copyright patents designs trade marks and other
intellectual property (the ldquoIntellectual Propertyrdquo) and any reproductions of copyright
works in the thesis for example graphs and tables (ldquoReproductionsrdquo) which may be
described in this thesis may not be owned by the author and may be owned by third
parties Such Intellectual Property and Reproductions cannot and must not be made
available for use without the prior written permission of the owner(s) of the relevant
Intellectual Property andor Reproductions
iv Further information on the conditions under which disclosure publication and
commercialisation of this thesis the Copyright and any Intellectual Property andor
Reproductions described in it may take place is available in the University IP Policy
(see httpdocumentsmanchesteracukDocuInfoaspxDocID=487) in any relevant
Thesis restriction declarations deposited in the University Library The University
Libraryrsquos regulations (see httpwwwmanchesteracuklibraryaboutusregulations) and
in The Universityrsquos policy on Presentation of Theses
27
ACKNOWLEDGEMENTS
Firstly I would like to thank my University supervisors Dr Louise Natrajan and
Dr Clint Sharrad for their support and encouragement during my PhD and for their help
and guidance when needed I would also like to thank Dr Leigh Martin my industrial
supervisor at the Idaho National Lab for the opportunity to work there and gain valuable
new experience
For all of his help in the lab general advice and knowledge on the TALSPEAK
process I would particularly like to thank Dr Travis Grimes from the INL - I could not
have done it without you - and for much of the help and advice I received in
Manchester (as well as lending an ear when I needed to vent) I would like to thank Dr
Adam Swinburne
Thank you also to Dr Andreas Geist for conducting some separation studies for
me at KIT-INE Your contributions have been very valuable and I am most grateful for
all of your help
Sarah Hendley Kevin Beal Andrew Alker and Adrien Moll as Masters and
placement students have helped with various parts of the work in this thesis and
deserve great thanks for their contributions Additionally thank you to Dr Michael
Andrews for helping Adrien so much in the lab whilst I was finishing off my
experiments and beginning to write up my thesis I appreciate the time you spent even
though you had so much to do yourself
Further thanks to Prof Simon Pimblott Greg Horne and Logan Barr for
accommodating me and my Masters students at DCF for irradiation studies and to Greg
especially for giving up your precious time to help us
Dr Tamara Griffiths and Dr Catherine Riddle made working in the lab at the
INL a very enjoyable experience for me and kept me sane and encouraged in times of
desperation Many thanks to you wonderful ladies Also thank you to the Aqueous
Separations and Radiochemistry group (Jack Leigh Peter Travis Rocky Dean Cathy
Bruce Guy and Brandi) Terry Todd and other staff at the INL (Steve Chris Jake all
of the radcons the Analytical group and other placement students) who likewise made
me feel very welcome in a place so far from home
I would additionally like to thank Teams NatrajanMillsSharrad (Sean Adam
Simon Lucy Lizzie Debbie Chloe Mike Pete Kathryn Toria Jen (honorary
member) Dr David Mills Ally Conrad Aruna Helen Tamara Kate Dan Chris
Dave Charles Peter Zana Rich Hugues and Tim) and the Centre for Radiochemistry
28
Research at the University of Manchester for general lab help and support and for
making Manchester a great place to work And to my conference buddies Tamara
Debbie Kate and Adam for making conferences as much about the social side as the
work
Thank you to the INL KIT and Diamond Light Source for the opportunities to
carry out work using their specialist equipment and to Dr Louise Natrajan Dr Sean
Woodall Dr Daniel Whittaker Dr Tamara Griffiths Dr Clint Sharrad Dr Leigh Martin
and Dr Travis Grimes for helping with some of the work carried out
I could not have done this PhD without funding from Batelle Energy Alliance
through the INL and the University of Manchester so thank you
On a personal note a big thank you to Steph my room mate for making my 9
months living in Idaho so much fun And also to Cathy and Glen Shelby Natalie and
Leigh and Marie for all the fun times too Lastly but not least I would like to give huge
thanks to my (non-chemistry non-Idaho) friends and family for their support over the
past 4 years especially my wonderful husband Lee - youre amazing and my rock as
always - and my parents for everything over the past 26 years
It was worth it in the end
29
LIST OF SYMBOLS amp UNITS
gt greater than
˂ less than
plusmn plus or minus
percent
degC degrees Celsius
α alpha
β beta
γ gamma
δ chemical shift
Δ change in
ε molar extinction coefficient
λ wavelength
microL microlitres
micros microseconds
ρ density
τ lifetime
ν frequency
ν= energy level
wavenumber
Aring angstroms
A proportionality constant for q taking into account the
inner hydration sphere
ABS optical density difference between ODi and ODb
amu atomic mass units
au arbitrary units
B correction factor for q taking into account the outer
hydration sphere
Bq Becquerel
cm centimetres
D (pD D2O MeOD) deuterium
dm3 decimetres cubed (litres)
E energy
F Faradays constant
30
g grams
G critical dose value
Gy Gray
h Plancks constant
Hz Hertz
J Joules
J= rotational energy level
K Kelvin
kBq kiloBecquerel
kg kilograms
kGy kiloGray
kJ kiloJoules
L litres
log β stability constant
M molar (moldm-3
)
mg milligrams
MHz megaHertz
min minute(s)
mL millilitres
mm millimetres
mM millimolar
mol moles
mmol millimoles
ms milliseconds
ng nanograms
nm nanometres
ns nanoseconds
ODi optical density of irradiated solution
ODb optical density of non-irradiated control solution
ppm parts per million
s seconds
t time
Zeff effective nuclear charge
31
LIST OF ABBREVIATIONS amp ACRONYMS
An actinides
aq aqueous
BT nack-energy Transfer
BTBP bis-triazinbipyridine
BTP bis-triazinylpyridine
CEA Commissariat agrave lrsquoEacutenergie Atomique et aux Eacutenergies
Alternatives
CE-ICP-MS capillary electrophoresis ndash inductively coupled plasma ndash
mass spectrometry
cf confer Latin compare
CMPO carbomoylmethylphosphine oxide
CP corrosion products
CYANEX 301 bis(244-trimethylpentyl)phosphinodithioic acid
CyMe4-BTBP 66-bis(5588-tetramethyl-5678-tetrahydrobenzo
[e][124]triazin-3-yl)-22-bipyridine
D distribution ratio
DCF Dalton Cumbrian Facility
DEPT distortionless enhancement by polarization transfer
DFT density functional theory
DIAMEX DIAMide EXtraxtion
DIPB diisopropyl benzene
DMDBTDMA dimethyldibutyltetradecylmalonamide
DMDOHEMA dimethyldicotylhexylethoxymalonamide
DMF dimethylformamide
DNA deoxyribonucleic acid
DO3A 147 tris(carboxymethyl) 14710 tetraazacyclododecane
DOTA 14710-tetraazacyclododecane-14710-tetraacetic acid
DTPA diethylenetriaminepentaacetic Acid
EC electron capture
EDTA ethylenediaminetetraacetic acid
eg exempli gratia Latin for example
ET electron transfer
32
et al et alli Latin and others
EURACT-NMR Transnational Access to Unique European Actinide and
Radiological NMR Facilities
EXAm EXtraction of Americium
FP fission products
GANEX Grouped ActiNide EXtraction
GSH glutathione
HDEHP (di-(2ethylhexyl)phosphoric acid
HEH[ΦP] (2-ethylhexyl)phenylphosphonic acid
HEH[EHP] (2-ethylhexyl)phosphonic acid mono-2-ethylhexyl ester
HEDTA (2-hydroxyethyl) ethylenediaminetatraacetic acid
HSQC heteronuclear single quantum correlation
I ionic strength
IC internal conversion
ICP-MS inductively coupled plasma ndash mass spectrometry
ie id est Latin that is
INL Idaho National Laboratory
IR infra-red
iSANEX Innovative SANEX
ISC inter-system crossing
KIT-INE Karlsruhe Institute of Technology - Institut fuumlr Nukleare
Entsorgung (Institute for Nuclear Waste Disposal)
Lac lactate
LASER light amplification by stimulated emission of radiation
LINAC linear accelerator
Ln lanthanides
LUCA Lanthaniden Und Curium Americium trennung
LWR light water reactor
M metal
MA minor actinides
MALDI-MS matrix-assisted laser desorption ionization mass
spectrometry
MOX mixed oxide
MRI magnetic resonance imaging
Nd-YAG neodymium-yttrium aluminium garnet
33
nIR near-infra-red
NMR nuclear magnetic resonance
NPH normal paraffinic hydrocarbon
NR non-radiative decay
org organic
PPE personal protective equipment
PUREX Plutonium and Uranium Refinement by EXtraction
q number of solvent molecules in the inner hydration sphere
SANEX Selective ActiNide EXtraction
SF separation factor
SNF spent nuclear fuel
SX solvent extraction
TALSPEAK Trivalent Actinide Lanthanide Separation by Phosphorus
reagent Extraction from Aqueous Complexation
TALSQuEAK Trivalent Actinide Lanthanide Separation using Quicker
Extractants and Aqueous Complexes
TBP tributyl phosphate
TEA triethylamine
TEDGA NNNrsquoNrsquo-tetraethyl-diglycolamide
TEHP tris(2-ethylhexyl)phosphate
TM transition metals
TODGA tetraoctyldiglycolamide
TPH tetrapropylene hydrogenated
TRLFS time-resolved LASER-induced fluorescence spectrocopy
TRPO trialkylphosphine oxide
TRUEX TRans-Uranic EXtraction
TTHA triethylenetetramine hexaacetate
SF spontaneous fission
SNF spent nuclear fuel
UoM The University of Manchester
UV ultra-violet
UV-vis ultra-violet-visible
vs versus Latin against
XAS x-ray absorption spectroscopy
34
AMINO ACID ABBREVIATIONS
Amino Acid 3 Letter Abbreviation
Alanine Ala
Arginine Arg
Asparagine Asn
Aspartic acid Asp
Cysteine Cys
Glutamic Acid Glu
Glutamine Gln
Glycine Gly
Histidine His
Isoleucine Ile
Leucine Leu
Lysine Lys
Methionine Met
Phenylalanine Phe
Proline Pro
Serine Ser
Threonine Thr
Tryptophan Trp
Tyrosine Tyr
Valine Val
35
1 INTRODUCTION
11 The Actinides and Lanthanides
111 Background
The ldquorare earthrdquo or lanthanide elements (Ln) can be found between barium and
hafnium in the periodic table in the first of the two rows containing the f-block
elements The f-block elements are all metallic and have 4f or 5f valence electron
subshells the lanthanides Ce-Lu are also often referred to as the ldquo4frdquo elements1
Although often considered to be part of the lanthanide series lanthanum is not usually
considered to be a ldquo4frdquo element as it has no f-electrons The 4f elements all have
relatively high abundances despite often being termed the ldquorare earthrdquo elements except
for promethium (Pm) which is radioactive and does not occur in nature2 All of the 4f
elements except promethium were discovered and had all successfully been isolated by
the early 20th
century Promethium was not discovered until 19473
The actinide elements (An) can be found between radium and rutherfordium in
the periodic table and are also known as the 5f elements as their valence shell is the 5f
shell They are all radioactive as none of them have any stable isotopes Although often
considered to be part of the actinide series actinium is not usually considered to be a
ldquo5frdquo element due to its electronic configuration of 5f 0 Despite this thorium which also
has a ground state electronic configuration of 5f 0 is considered to be a 5f element The
first actinide element to be discovered was uranium which was discovered in 1789 by
Klaproth in the mineral pitchblende Thorium and protactinium had also both been
discovered by 1913 but the later actinides were not synthesised until the Second World
War initially by Seaborg4
112 Sources of the Lanthanides and Actinides
The naturally occurring lanthanide elements are found in two minerals
primarily monazite and bastnaumlsite which are ores of mixed lanthanide metals and have
the general formulae LnPO4 and LnCO3F respectively Monazite also contains
radioactive thorium so is the less favourable of the two sources of lanthanides
commercially5
Ac Th Pa and U are the only naturally occurring actinide (An) elements
Uranium is less abundant than thorium (24 ppm vs 81 ppm) in the Earthrsquos crust but is
found in numerous minerals in oxide form including pitchblende (uraninite) and
36
carnotite Protactinium is one of the rarest elements in the world and is found at trace
levels in some uranium ores
The remaining 11 (Np-Lr) elements in the An series must be synthesised
Neptunium to fermium can be synthesised by neutron bombardment whereby a neutron
is captured by a heavy element atom and a γ-ray is emitted This is followed by the
emission of a β- particle in a β
- decay process to form a new element with an increased
atomic mass (see Scheme 11) However as this is a relatively improbable process
synthesis of the heaviest elements is impossible by this method and so synthesis of the
heavier elements is carried out by bombardment with light atoms although again this is
also an unfavourable reaction6
238U (n γ)
239U rarr
239Np rarr
239Pu (n γ)
240Pu (n γ)
241Pu rarr
241Am (n γ)
242mAm rarr
242Cm
Scheme 11 Formation of 242
Cm by a series of neutron capture and β- decay
processes6
113 Properties of the 4f Elements
The shapes of the f -orbitals have a variety of different representations dependent
on molecular symmetry The electron configurations for the metals and Ln3+
ions can be
seen in Table 11 along with values for the third and fourth ionisation energies
Gadolinium (Gd) and lutetuim (Lu) both have a 5d electron giving more stable half-full
or full 4f orbitals respectively Cerium (Ce) is also thought to possess a 5d electron The
most common oxidation state for the lanthanide ions is +3 whereby both of the 6s
electrons and either the 5d electron (if applicable) or one 4f electron are lost The first
two ionisation energies of the lanthanide elements are all relatively low corresponding
to the removal of the 6s electrons The third ionisation energy is also sufficiently low to
allow the generation of the Ln3+
ion in each case by removal of the 5d electron or a 4f
electron The fourth ionisation energies are generally significantly higher as the 4f
orbital becomes more stabilised as the first three electrons are removed This makes the
+4 oxidation state rare but can be formed by Ce Pr and Tb under certain conditions
Samarium (Sm) europium (Eu) and ytterbium (Yb) can form Ln2+
ions relatively
readily
β- β
- β
- β
-
23 mins 23 days 13 years 16 hours
37
Table 11 Electronic properties of the lanthanides 7
Symbol Name Electron
Configuration
(Metal)
Electron
Configuration
(Ln3+
)
3rd
Ionisation
Energy
(kJmol-1
)
4th
Ionisation
Energy
(kJmol-1
)
La Lanthanum [Xe]5d16s
2 [Xe] 1850 4819
Ce Cerium [Xe]4f15d
16s
2 [Xe]4f
1 1949 3547
Pr Praseodymium [Xe]4f36s
2 [Xe]4f
2 2086 3761
Nd Neodymium [Xe]4f46s
2 [Xe]4f
3 2130 3899
Pm Promethium [Xe]4f56s
2 [Xe]4f
4 2150 3970
Sm Samarium [Xe]4f66s
2 [Xe]4f
5 2260 3990
Eu Europium [Xe]4f76s
2 [Xe]4f
6 2404 4110
Gd Gadolinium [Xe]4f75d
16s
2 [Xe]4f
7 1990 4250
Tb Terbium [Xe]4f96s
2 [Xe]4f
8 2114 3839
Dy Dysprosium [Xe]4f10
6s2 [Xe]4f
9 2200 4001
Ho Holmium [Xe]4f11
6s2 [Xe]4f
10 2204 4100
Er Erbium [Xe]4f12
6s2 [Xe]4f
11 2194 4115
Tm Thulium [Xe]4f13
6s2 [Xe]4f
12 2285 4119
Yb Ytterbium [Xe]4f14
6s2 [Xe]4f
13 2415 4220
Lu Lutetium [Xe]4f14
5d16s
2 [Xe]4f
14 2022 4360
114 Properties of the 5f Elements
As previously stated the valence electron sub-shell for the actinides is the 5f
shell The electron configuration of the actinides is shown in Table 12 Thorium has no
5f electron but has 6d2 configuration as an empty 5f shell is more favoured Curium has
a 6d electron giving rise to a more stable half full 5f subshell
The actinide elements have a wide range of available oxidation states
particularly for the earlier metals For the heavier elements however the most common
oxidation state for the metal ions is +3 having lost both of the 7s electrons and either a
6d electron (if applicable) or one 5f electron The available oxidation states for each of
the actinides can be seen in Table 13 Ionisation energy values are not available for all
of the actinides although the standard electrode potentials for the reduction of An4+
to
An3+
and An3+
to An2+
can be used to give an indication of the ion stabilities The +4
38
oxidation state is the most favoured for Th as it gives rise to empty 6d and 7s shells but
An4+
generally becomes less favoured across the series and may only be found in
solution for americium and curium complexes Conversely the stability of the +2
oxidation state generally increases across the series with an irregularity at Cm which
does not have an available +2 oxidation state due to the stability of the half full 5f
subshell of Cm3+
The variety of oxidation states found in the earlier actinides suggests
that all of the valence electrons are available for bonding in these elements7
Table 12 Electronic properties of the actinides7
Symbol Name Electron
Config
(Metal)
Electron
Config
(An2+
)
Electron
Config
(An3+
)
Electron
Config
(An4+
)
Th Thorium [Rn]6d27s
2 NA [Rn]6d
1 [Rn]
Pa Protactinium [Rn]5f26d
17s
2 NA [Rn]5f
2 [Rn]5f
1
U Uranium [Rn]5f36d
17s
2 NA [Rn]5f
3 [Rn]5f
2
Np Neptunium [Rn]5f46d
17s
2 NA
[Rn]5f
4 [Rn]5f
3
Pu Plutonium [Rn]5f67s
2 NA [Rn]5f
5 [Rn]5f
4
Am Americium [Rn]5f77s
2 [Rn]5f
7 [Rn]5f
6 [Rn]5f
5
Cm Curium [Rn]5f76d
17s
2 NA [Rn]5f
7 [Rn]5f
6
Bk Berkelium [Rn]5f97s
2 NA [Rn]5f
8 [Rn]5f
7
Cf Californium [Rn]5f10
7s2 [Rn]5f
10 [Rn]5f
9 [Rn]5f
8
Es Einsteinium [Rn]5f11
7s2 [Rn]5f
11 [Rn]5f
10 [Rn]5f
9
Fm Fermium [Rn]5f12
7s2 [Rn]5f
12 [Rn]5f
11 [Rn]5f
10
Md Mendelevium [Rn]5f13
7s2 [Rn]5f
13 [Rn]5f
12 [Rn]5f
11
No Nobelium [Rn]5f14
7s2 [Rn]5f
14 [Rn]5f
13 NA
Lr Lawrencium [Rn]5f14
6d17s
2 NA [Rn]5f
14 NA
39
Table 13 Available oxidation states of the actinides and colours of ions in solution
where applicable Ions in black text are either not found in aqueous solution or are
unknown8
115 Relativistic Effects
Relativistic effects are much more important for heavy elements than light
elements as they are proportional to an atomrsquos mass The Special Theory of Relativity
as devised by Einstein shows that as the velocity (ν) of a particle increases towards the
speed of light (c) its mass (m) increases to infinity as shown in equation 11 where m0
is the rest mass of the particle This is the relativistic mass increase
Equation 11
For example the relativistic mass increase of a 1s electron in uranium (found to
be 135 me) can be calculated using the average radial velocity of the electrons (νrad)
which is roughly equivalent to the atomic number Z for 1s electrons and the rest mass
of an electron (me) This is shown in equation 12
Equation 12
This effect causes a contraction of 1s electron subshell due to the inverse
relationship between electron mass and the Bohr radius of an atom meaning that the
shell is held more closely to the nucleus and stabilised A similar effect is true for p
electrons The relationship can be seen in equation 13 where α0 is the Bohr radius e is
the elementary charge and ħ is the reduced Planckrsquos constant
Equation 13
7 NpO23+
PuO23+
AmO65-
6 UO22+
NpO22+
PuO22+
AmO22
+5 PaO2
+UO2
+NpO2
+PuO2
+AmO2
+
4 Th4+
Pa4+
U4+
Np4+
Pu4+
Am4+
Cm4+
Bk4+
Cf4+
3 Ac3+
Th3+
Pa3+
U3+
Np3+
Pu3+
Am3+
Cm3+
Bk3+
Cf3+
Es3+
Fm3+
Md3+
No3+
Lr3+
2 Am2+
Cf2+
Es2+
Fm2+
Md2+
No2+
Ac Th Pa U Np Pu Am Cm Bk Cf Es Fm Md No Lr
Most stable in aqueous solution Accessible Only found in solid complexes
40
This explains why relativistic effects are more significant for larger nuclei as the
mass increase is dependent on Z Conversely to the stabilisation of s and p electrons by
relativistic effects valence f and d orbitals are expanded further from the nucleus and
destabilised due to effective shielding of the s and p electrons of the nucleus The effect
is greater in the actinides due to the increased number of electrons and is responsible for
the variety of oxidation states exhibited by An as the valence 5f electrons are further
from the nucleus and are therefore more available for bonding Relativistic effects are
much less important for the lanthanides than the actinides as the actinides are more
destabilised by the effects7
116 Lanthanide and Actinide Contraction
There is a general decrease in the size of the metallic and ionic radii of the
lanthanides across the series explained by the fact that 4f electrons are considered to be
ldquocore-likerdquo so are not available for bonding This causes crystal field effects to be minor
in lanthanide complexes The ldquocore-likerdquo property of the 4f electrons prevents them
from shielding valence electrons in outer subshells from the nucleus allowing the
effective nuclear charge (Zeff) to increase and causing contraction of the atoms and ions
across the series The lanthanide contraction is responsible for the small size difference
between the second and third row transition metals
The ionic radii of the actinides for the +3 +4 and +5 oxidation states gradually
decrease in size across the series although the metallic radii do not follow the same
trend The effect of the trend on the chemistry of the elements is not well known as the
later elements cannot be made with large enough yields to study and they decay too
rapidly The gradual decrease is due to the fact that 5f-electrons are poor at shielding s
and p electrons from the nucleus due to their greater radial extension allowing the
effective nuclear charge (Zeff) to increase and the s and p electrons to be held more
closely to the nucleus
117 Co-ordination Chemistry of the Lanthanides and Actinides in Solution
Lanthanide ions are hard Lewis acids and so co-ordinate readily with hard bases
The core-like nature of the 4f electrons prevents them from interacting significantly with
ligand orbitals and means that lanthanide complexes are bonded electrostatically The
co-ordination geometry of complexes is therefore determined predominantly by the
steric interactions of the ligands The high charge density of the Ln3+
ions allows them
41
to form ionic bonds however this means that many lanthanide complexes are labile in
solution
Actinide ions are also hard Lewis acids co-ordinating easily with hard bases
The greater radial extension of the 5f electrons caused by relativistic effects gives rise
to greater chemical activity in the actinides than the lanthanides as the 5f electrons are
more available for bonding This also explains the tendency of the early actinides to
form covalent bonds however the later actinides mainly interact electrostatically like
the lanthanides
Actinide ions are found as An3+
for the later elements in the series except for
No which is found as No2+
and they behave much like the lanthanides However for
some of the early actinides linear actinyl ions (AnO2+ and AnO2
2+) can be observed in
addition to free ions and are often more stable particularly for U91011
Lanthanide and actinide complexes often have high co-ordination numbers
typically 8 or 9 in aqueous solution (although co-ordination numbers as high as 12 have
been reported) due to their large size The Ln3+
ion forms readily in aqueous solution
and the An3+
ion is the common form for the later actinides however the solution state
chemistry of the early actinide ions is complicated Americium is mainly found in the
+3 oxidation state in solution although it also forms the AmO22+
ion The Am7+
oxidation state has been known to exist but is unstable except in very alkaline
conditions
It is difficult to determine the exact co-ordination numbers and geometries of Ln
and An ion complexes in solution due to the lability of the complexes particularly for
lanthanides
1171 Hydrolysis
The solvation of metal cations by water particularly cations with a high charge
density such as Ln3+
and An3+
ions will result in some hydrolysis The cations polarise
the O-H bonds of the solvent allowing the hydrated metal cations to act as Broslashnsted
acids An example can be seen in Equation 14
Equation 14 [Eu(H2O)8]3+
+ H2O rarr [Eu(H2O)7(OH)]2+
+ H3O+
The acidity of the Ln3+
cations increases across the series as the charge density
increases For the An ions the acidity increases as follows
AnO2+ lt An
3+ lt AnO2
2+ lt An
4+
42
Generally the acidity increases with increasing charge density like Ln The
position of AnO22+
can be explained by the fact that the O2-
ions do not fully reduce the
charge on the An ion and so the effective charge of the ion is seen to be +331
1172 Monodentate Ligands
Substituting water for other monodentate ligands in aqueous solution is
challenging for lanthanides as the complexes are labile and the high charge density of
the ion and affinity for a polar environment means that it will often remain solvated
Isolating monodentate complexes from water is almost impossible as Ln3+
ions having a
high enthalpy of hydration making complex formation endothermic Complexation can
be achieved much more easily by the use of macrocyclic or chelating ligands
Conversely it is much easier to form monodentate actinide complexes in water
such as salts which will become hydrated rather than completely substituted by water
molecules However complexation is still much easier with macrocycles or chelates in
aqueous solution12
1173 Chelates and Macrocycles
When a chelate or macrocycle ligates to an ion the reaction entropy increases as
water molecules are eliminated from the complex (see Equation 15) which is
thermodynamically favourable As a chelating or macrocyclic ligand bonds to the metal
ion the remainder of the ligand is considered to be in close proximity to the ion giving
it an ldquoartificially highrdquo concentration and is therefore more likely to bond than
surrounding ions or ligands
Equation 15 [Eu(H2O)8]3+
+ EDTA4-
rarr [Eu(EDTA)(H2O)3]- + 6H2O
Chelating complexes increase in stability across lanthanide and actinide series
This is because the Coulombic attraction between the ligand and the metal increases
with charge density However there is a slight irregularity in this trend for the
lanthanides where a slight dip can be seen at Gd3+
as this is thought to be the point at
which the co-ordination number changes from 9 to 8 often referred to as the
lsquogadolinium breakrsquo12
43
12 Analytical Methods
121 NMR Spectroscopy
Most lanthanide and actinide complexes are paramagnetic as they have unpaired
electrons The nuclei of paramagnetic complexes are subjected to a local magnetic field
in addition to the field generated by the spectrometer causing the complexes to have
larger chemical shifts NMR spectra of paramagnetic complexes often have broad peaks
as they have faster spin-lattice relaxation times due to strong spin-orbit coupling13
The
relationship is explained by the Heisenberg Uncertainty Principle which links energy
(E) and time (t) in Equation 16 where h is Planckrsquos constant
Equation 16
Considering the relationship between energy and frequency (ν) in Equation 17
the Heisenberg equation can be rearranged to show the inverse relationship between the
change in frequency (Δν) or ldquospectral linewidthrdquo (defined as the peak width of the
signal at half of its maximum height) and the lifetime of the excited state or in this case
spin-lattice relaxation time (Δt) See Equation 1814
Equation 17
Equation 18
122 Luminescence Spectroscopy
1221 Fluorescence and Phosphorescence
Fluorescence and phosphorescence are both types of luminescence Radiation is
used to excite electrons into a higher electronic energy level which then emit photons
(light) as they relax back down to their ground state Fluorescence is a relatively fast
process (picoseconds to milliseconds) as it is an allowed transition by the spin selection
rule not involving a change in spin multiplicity Phosphorescence is a slower process
(milliseconds to seconds) as it does involve a change in electron spin from a singlet to a
triplet excited state ndash it is formally ldquospin-forbiddenrdquo The processes can be seen in the
Jablonski diagram in Figure 11 By contrast f-f transitions whereby f-electrons are
excited into other f-subshells are formally Laporte forbidden so direct excitation of the
4f electrons is unfavourable These rules are relaxed a little by vibronic (vibrational and
44
electronic) coupling in which a vibration in the molecule causes the temporary
lowering of the symmetry of the metal allowing the d and p orbitals to share symmetry
The transition has some drarrp character and so becomes more intense However for
vibronic coupling to take place the valence orbitals must interact with incoming
ligands For the transitions that occur in the visible region of the spectrum this explains
why the colours of Ln3+
ions are weak as the valence 4f shell interacts poorly with
ligands due to their core-like nature Vibronic coupling is greater in actinide ions
Figure 11 Jablonski diagram showing fluorescence and phosphorescence15
1222 Lanthanide Luminescence
Lanthanide ions in which f-f transitions can occur are luminescent and emit
across a range of the electromagnetic spectrum from the Ultra-Violet (UV) range to the
visible (vis) or near-infra-red (nIR) region of the spectrum (Table 14) La3+
does not
possess any f-electrons and Lu3+
has a full 4f shell so these two ions are not
luminescent
45
Table 14 Luminescence of lanthanide ions
Luminescent ions which emit
in the nIR region of the
spectrum
Colours of luminescent ions
which emit in the visible and
UV regions of the spectrum
Pr3+
Sm3+
Nd3+
Eu3+
Ho3+
Tb3+
Er3+
Dy3+
Yb3+
Tm3+
Gd3+
(UV)
Ce3+
(UV)
Lanthanide ions have long luminescence lifetimes as their transitions are
formally forbidden Since the interaction between the metal ion and the ligand is
negligible in lanthanides the emission spectra of lanthanide complexes have narrow
emission lines resembling the spectra of the free ions Solid lanthanide compounds and
complexes also tend to be luminescent1617
1223 Actinide Luminescence
Actinide ions in which f-f transitions can occur are luminescent and also emit
across a range of the electromagnetic spectrum from the UV range to the infra-red IR or
nIR region (Table 15) Ac3+
and Th4+
do not have any f-electrons and Lr3+
has a full 4f
shell so these two ions are not luminescent No luminescence studies have been
performed on Fm3+
Md3+
or No2+
The remaining An have luminescent ions but studies
have been most widely performed on UO22+
Am3+
and Cm3+
as these are the most
widely available have fewer problems associated with radioactivity and safety and are
the most well understood
46
Table 15 Luminescence of actinide ions
Luminescent ions which emit
in the IRnIR region of the
spectrum
Colours of luminescent ions which
emit in the visible and UV regions
of the spectrum
NpO22+
Pa4+
(UV) Pa4+
Pa4+
Pa4+
Pa4+
Am3+
U4+
(UV) U4+
Es3+
UO2+
UO22+
UO22+
UO22+
UO22+
Am3+
Am3+
Am3+
Am3+
Cm3+
Bk3+
Cf3+
Unlike lanthanides actinide emission spectra and lifetimes vary depending on
the species and bound species or counter ions although most lifetimes for An are short
(lt 20 ns) with the exceptions of the 5f0 species UO2
2+ (which has lifetimes varying
from 130 ns to 300 μs) and Cm3+
which has a lifetime of ~65 μs and is known to have
the highest luminescence quantum yield of the An ions allowing it to be studied in very
low concentrations which is useful due to its low availability Luminescence studies on
solid state An compounds are unreliable as they are susceptible to radioluminescence
whereby the energy released by radioactive decay can result in the generation of an
emissive excited state718
1224 Sensitised Luminescence and Antennae
Sensitisation of luminescence can occur if an ldquoantennardquo is present which is a
sensitising chromophore An electron is excited on the ion by energy transferred from
the chromophore The antenna must be in close proximity to the ion for energy transfer
to take place and so antennae are usually used as ligands
Antennae are predominantly organic aromatic materials bonded to macrocycles
(as these are easier to ligate to the metal ions in solution) During sensitisation an
electron from the chromophore is excited from its ground state to a singlet excited state
Energy may then be transferred to a triplet excited state by inter-system crossing (ISC)
where the potential curves of the two states intersect at similar energies Although this
spin forbidden spin orbit coupling makes it possible by slightly shifting the electronrsquos
energy levels Energy from the triplet state is then transferred to the metal ionrsquos excited
47
state The ion can then relax to its ground state by luminescence This is the most
common pathway for sensitised emission however it is possible to transfer energy
directly from the singlet excited state on the chromophore to the ion (Figure 12)
Figure 12 Energy transfer pathway for sensitised luminescence of Ln3+
complexes 1S
represents an excited singlet state 3T an excited triplet state and f and frsquo represent
excited states of the Ln3+
ion 19
1225 Russell-Saunders Coupling
ldquoTerm symbolsrdquo are used to label ground state and excited state energy levels
for lanthanide ions Term symbols are derived from Russell-Saunders coupling and
account for the net atomic orbital angular momentum and the net spin angular momenta
of the state determined from the sum of the individual angular momenta of an ionrsquos
electrons Term symbols take the form
(2S+1)LJ
where S is the spin multiplicity of the state L corresponds to the ldquolrdquo quantum number
for the state and J is the coupling of L and S Excited states have several possible J
values although the ground state always has a single J value which can be determined
by Hundrsquos rules The Russell-Saunders coupling scheme is only useful for lanthanide
ions and cannot be applied to actinide ions as spin-orbit coupling is much greater in An
and the 5f orbitals have different properties to the 4f orbitals in particular the greater
importance of relativistic effects (see Section 115) However Russell-Saunders terms
have been used as a basis for assigning ground and excited state terms20
F = Fluorescence P = Phosphorescence L = Luminescence NR = Non Radiative Decay ISC = Inter System Crossing ET = Energy Transfer BT = Back-energy Transfer IC = Internal Conversion
48
1226 Quenching
The excited states of the trivalent lanthanides and actinides are readily quenched
in solution Quenching occurs when the vibrational energy levels of high energy
oscillators (such as C-H N-H or O-H bonds) within the molecule or its environment
(solvent) have a similar energy to the excited state of an ion Inter-System Crossing
(ISC) from the excited state to these vibrational levels can occur causing non-radiative
decay preventing luminescence The efficiency of this non-radiative decay is dependent
upon the energy gap between the emissive state and the ground state of the ion and also
on the number of quanta (energy levels) of the oscillator If the non-radiative decay is
favourable and happens faster than luminescence quenching will occur Quenching
reduces the intensity lifetime and quantum yield of luminescence If the ionrsquos emissive
state is close in energy to the triplet excited state of the ligand (lt 20000 cm-1
) thermal
quenching may also occur whereby energy is transferred backwards to the triplet
excited state of the chromophore21
1227 Quenching in Lanthanides and Actinides
Tb3+
is less susceptible to vibrational quenching than other lanthanide ions as the
energy gap between the lowest emissive state and the ground state of Tb3+
is very high
(20500 cm-1
) It is however susceptible to thermal quenching and back energy transfer
Eu3+
also has a large energy gap (17250 cm-1
) This results in a relatively greater
emission intensity for these ions
Other lanthanide ions such as Pr3+
Ho3+
Er3+
Tm3+
Yb3+
Dy3+
and Sm3+
with
smaller energy gaps are more easily quenched giving less intense emission Er3+
has the
smallest energy gap close to the υ=0 energy level of O-H so is the most easily
quenched (see Figure 13) The lower energy levels of the oscillators provide better
overlap with the energy levels of the ions due to a better overlap with the wavefunction
therefore ions which have energy levels that overlap with the lower quanta of the
oscillators will also be more easily quenched Gd3+
has the highest energy gap of the
lanthanide ions (32000 cm-1
) and cannot be sensitised by conventional UV absorbing
chromophores
49
Nd3+Eu3+ Tb3+Yb3+ O-H O-DTm3+ Sm3+ Pr3+ Er3+
3H4
4I132
4I112
3H4
3H5
3H6
3H6
3H5
3H4
0
20000
4I92
4I112
4I132
4I152
4F32
2H92
4S32
4F92
2H112
4G52
4G72
4G92
(2D2P)32
4G1125D4
7F07F17F27F37F4
7F5
7F67F0
7F1
7F2
7F3
7F4
7F5
7F6
5D0
5D1
5D2
2F52
2F72
10000
6H52
6H72
6H92
6H112
6H132
4F32
4G52
4F32
4F12
4F52
4F72
4G72
4F92
4F112
3F2
3F4
3P0
3P1
3F3
1I6
1G4
4I92
4F92
4S32
4F72
3F4
3F3
3F2
1G4
E
cm
-1
=0
=1
=2
=3
=4
=5
=0
=1
=2
=3
=4
=5
=6
=7
2H112
1D2
Figure 13 Energy level diagram showing the ground and excited states of a selection
of lanthanides and vibrational oscillators Emissive states are shown in red The energy
levels of O-H and O-D oscillations are shown in blue22
Actinides are also susceptible to quenching even more so than the lanthanides
as all of them have smaller energy gaps between the lowest emissive state and the
ground state The energy gaps of some actinides compared to lanthanides can be seen in
Figure 14
50
Figure 14 The energy gaps between the lowest emissive states and ground
states of a selection of lanthanides and actinides represented by arrows23
1228 Suitable Solvents for Luminescent Complexes
In addition to quenching by vibrational oscillators on ligands luminescence can
also be quenched by solvents High energy oscillators must therefore be eliminated from
the solvent in order for luminescence to take place in the solution phase This is
generally achieved by using deuterated (or fluorinated) solvents such as D2O It is also
important to use strongly co-ordinating solvents that would replace the labile ligands
The Horrocks equation can be used to calculate the number of co-ordinated solvent
molecules (q) to an ion whether it is a free ion or co-ordinated to a ligand The original
Horrocks equation (Equation 19) and modified Horrocks equation for q lt 2 (Equation
110) are shown below
Equation 19
Equation 110
The Horrocks equation uses the emission lifetimes (τ) to determine q A is the
proportionality constant taking into account the inner hydration sphere and B is a
correction factor taking into account the outer hydration sphere A and B values are
experimentally determined constants and are available for Sm3+
Eu3+
Tb3+
Nd3+
Yb3+
Am3+
and Cm3+
Inner sphere hydration (q) values can be effectively determined from
51
solutions of water and methanol For the original Horrocks equation A = 105 for Eu3+
and A = 42 for Tb3+
and for the modified Horrocks equation (when q lt 2 ) A = 12 ms
and B = (025 ndash 0075x) ms-1
(where x = the number of exchangeable N-H oscillators)
for Eu3+
and A = 5 ms and B = 006 ms-1
for Tb3+
242526
13 Nuclear Theory
131 Nuclear Power
Currently all nuclear energy irrespective of use is generated by nuclear fission
Nuclear fission is the splitting of a fissile nucleus into two smaller nuclei often aided by
the collision of an incoming particle or neutron The nucleus captures the neutron
which makes it unstable and it breaks into two fragments The splitting process releases
more neutrons which may continue to cause fission of more nuclei generating a chain
reaction An example of a chain reaction caused by 235
U fission can be seen in Figure
15
Figure 15 Chain reaction generated by fission of 235
U into 92
Kr and 141
Ba27
Fission of heavy radioactive actinide elements is exothermic and a chain
reaction can occur if there are enough fissile nuclei present The amount of fissile
material required for a self-sustaining chain reaction is the ldquocritical massrdquo and any mass
above this is referred to as a ldquosupercritical massrdquo which if not controlled can lead to a
runaway chain reaction and a nuclear explosion
52
235U fission is used to generate nuclear power The fission products (FP) collide
with other atoms and their kinetic energy in converted into heat which is absorbed by
the cooling water and then used to drive steam turbines to generate electricity Control
rods are used in the reactor to control the neutron flux and prevent a runaway chain
reaction These are often made of boron nitride which is a neutron absorber
Moderators are also used to slow down the neutrons to the optimum energy for fission
(~2 kJ mol-1
) and these tend to be light nuclei (12
C or 2H)
132 The Nuclear Fuel Cycle
Uranium is mined in its ore form from the ground mainly in Middle Eastern
countries Canada Australia and Africa The ore is then milled to extract the uranium as
ldquoyellowcakerdquo which is mixed oxides of triuranium octoxide (U3O8) uranium dioxide
(UO2) and uranium trioxide (UO3) by leaching with acid or alkali followed by
precipitation The remaining ore ldquotailingsrdquo are disposed of as radioactive waste
The yellowcake is then further processed as only 07 of uranium is fissile
235U the dominant isotope is
238U The uranium oxide is enriched by increasing the ratio
of 235
U238
U to approximately 35-5 235
U This is done by converting all of the mixed
oxides into uranium dioxide and then to uranium hexafluoride (UF6) gas and separating
it into two streams ndash one of which is enriched in 235
U and the other depleted
The enriched UF6 is then converted back to UO2 which can be pressed and
heated to 1400 degC to form fuel pellets The depleted uranium is treated as waste The
fuel pellets are subsequently encased in metal rods which can then be used in a fuel
assembly in a reactor
After 18-36 months the build-up of fission products is such that the efficiency
of the fuel decreases so the fuel rods are removed and replaced The used fuel is then
stored for months or years in water which absorbs the heat until the radiation levels
decrease sufficiently for it to be disposed of or reprocessed As there are no disposal
facilities at present for nuclear fuel waste it is simply isolated from the environment
and left in storage until facilities become available28
A diagram of the Nuclear Fuel
Cycle can be seen in Figure 16
The once-through or ldquoopenrdquo fuel cycle whereby waste is stored for disposal is
favoured by a number of countries including Canada parts of Europe and the USA
presently although some research on reprocessing techniques is being carried out in
these areas as reprocessing is becoming increasingly important for the future of nuclear
power A ldquoclosedrdquo fuel cycle whereby the waste is recycled and reused is becoming
53
more and more favoured as a result of this and has been performed in some parts of the
world for many years including the UK and other parts of Europe Russia and Japan29
Figure 16 The Nuclear Fuel Cycle30
133 Spent Nuclear Fuel and Reprocessing
The reprocessing of spent nuclear fuel (SNF) is essential for preventing the
exhaustion of uranium supplies and reducing the volume and radiotoxicity of the waste
produced
Current reprocessing techniques involve the removal of re-usable uranium and
plutonium present in the waste which can be recycled and reused together in mixed
oxide (MOX) reactors to produce more nuclear power31
The amount of waste
remaining in storage at present worldwide that could be reprocessed is approximately
200000 tonnes with a global reprocessing capacity of around 4000 tonnes per year
90000 tonnes have been reprocessed over the last 50 years
In addition to the reusable U and Pu in the spent nuclear fuel (SNF) there are
also a variety of other fission products (FP) present such as minor actinides (MA) Np
Am and Cm Ln and transition metals (TM) in addition to corrosion products (CP)
54
from steel containers and pipes in the system as a result of radiolysis erosion and
ageing of equipment These are TM chiefly cobalt (Co) chromium (Cr) iron (Fe) and
manganese (Mn) The composition of SNF can be seen in Table 16 Recently research
into the removal of the other actinides from the waste has become important in order to
transmute them into shorter-lived radionuclides so that their radioactivity will not
persist for as long making the disposal process easier and faster This coupled with a
similar approach for any remaining plutonium will make the waste proliferation
resistant as it would not allow the Pu to be recovered from storage in the future for
proliferation purposes
Table 16 Approximate compositions of SNF in Light Water Reactors (LWR)32
Constituent of SNF
U 956
Stable FP (including Ln) 29
Pu 09
Cs amp Sr (FP) 03
I amp Tc (FP) 01
Other long-lived FP 01
MA 01
Although MA only make up 01 of fission products they are highly radiotoxic
and extremely long-lived and so it would be beneficial to separate MA from the
remaining fission products so that they can be transmutated into shorter lived
radionuclides by neutron bombardment The necessity of the separation arises from the
presence of Ln as Ln are known to be neutron scavengers or ldquoneutron poisonsrdquo 33
meaning that they have a high neutron cross section and are able to absorb neutrons
preventing transmutation of other species present
Neptunium is relatively simple to remove from the mixture of fission products
as it has a variety of oxidation states that can be utilised in the process34
However the
predominant trivalent minor actinides (MAs) Am and Cm are much more difficult to
separate from the remaining lanthanide waste due to the similarities in the chemistries
of the elements and the electrostatic nature of interactions of the hard Lewis acidic Ln3+
ions with ligands35
Much of this new research is focussed on separating Am3+
and
Cm3+
from Ln3+
55
134 Solvent Extraction
Currently there are no MA-Ln separation techniques employed commercially
although a number of different processes are being developed particularly in the USA
and Europe with a drive to implement a working process within the next 5 years
Despite differences in the chemistry between the techniques under development all of
them use solvent extraction as the ultimate separation technique
Solvent extraction is the process of separation of two (or more) species using
two immiscible liquids (usually an organic and aqueous phase) by the use of
complexing agents to selectively move only one species between phases This may or
may not be aided by the use of a complexing agent which binds preferentially to one of
the species36
The success of this technique varies between compounds and solvent systems
and can be determined using a separation factor (SF) This is a ratio based on the
distribution ratios (D) of the elements to be separated (Equations 111 and 112)
Equation 111
Equation 112
There are a number of existing methods for removing radiotoxic elements from
fission products these are discussed over the next few sections
1341 PUREX
PUREX (Plutonium and Uranium Refinement by Extraction) is the process used
by nuclear plants that carry out reprocessing to remove U and Pu from the waste in
order to reuse it (Figure 18) Strong nitric acid (~ 4M HNO3) is used to dissolve the
waste in an aqueous phase to form hydrated nitrate complexes of the corresponding
oxides of U and Pu (Equations 113 and 114) High concentrations of acid (2-6 M) are
used to increase the solubility of the oxides
Equation 113 UO22+
+ 2NO3- (aq) rarrUO2(NO3)2xH2O
Equation 114 PuO22+
+ 2NO3- (aq) rarrPuO2(NO3)2xH2O
56
The plutonium complex is then reduced using nitrogen tetroxide (N2O4) to the
corresponding Pu4+
complex and the solution is filtered to remove any precipitates
(Equation 115)
Equation 115 PuO2(NO3)2xH2O + N2O4 rarr Pu(NO3)4xH2O
The solution is then contacted with an organic phase (kerosene) containing tri-
nbutyl phosphate (TBP) as an extracting agent (Figure 17) which forms complexes
with the U and Pu nitrate hydrates to move them into the organic phase (Equations 116
and 117)
Equation 116 UO2(NO3)2xH2O + 2TBP rarr UO2(NO3)2(TBP)2
Equation 117 PuO2(NO3)2xH2O + 2TBP rarr Pu(NO3)4(TBP)2
However Tc and Np are also extracted at this point This is a disadvantage for
the purpose of the PUREX process but is advantageous for subsequent MA-Ln
separation processes which could follow The UO22+
and NpO2+ TBP complexes are
then separated from the Pu4+
and TcO4- complexes by reduction of Pu
4+ to Pu
3+ with
hydrazine (N2H4) and extraction back into water (Equations 118 and 119)3738
Equation 118 N2H4 + H2O harr N2H5+ + OH
-
Equation 119 Pu(NO3)4(TBP)2 + N2H5+ rarr Pu(NO3)3(TBP)2 + N2H5NO3
The Pu3+
and TcO4- are then separated from each other through another
extraction cycle and then a ldquostrippingrdquo solution of nitric acid hydroxylamine and
sulphuric acid to obtain pure Pu The UO22+
and NpO2+ are also extracted back into
aqueous solution and separated from each other through another extraction cycle Pure
U is obtained by using aqueous nitric acid for stripping (back-extraction)39
The process
has been proven to work well and it is an advantage that the organic phase can be reused
after stripping However the process has a few drawbacks ndash the need for high acid
concentrations makes it less environmentally friendly the need for redox control and
less stable oxidation states makes it longer and complicated and the use of phosphorus
reagents makes the products more difficult to dispose of as phosphorus waste is not
57
incinerable and so any radioactive waste must be separated from the phosphorus before
treatment40
Figure 17 Chemical structure of TBP (Tri-nbutyl phosphate)
Figure 18 PUREX flow diagram41
1342 TRUEX
TRUEX (TRansUranic EXtraction) is an example of advanced reprocessing
(removal of MA and Ln) that is being developed in the USA The principle of the
process is to selectively remove Am and Cm (MA) and Ln from the other fission
58
products left in the raffinate after the PUREX process (Figure 110) A combination of
extractants is used carbamoylmethylphosphine oxide (CMPO) (Figure 19) and TBP (as
in the PUREX process) The benefit of the combined extractant system is that the
process is effective over a range of acidities (07-5 M HNO3) The raffinate (in nitric
acid) from the PUREX process is contacted with the extractant in an organic phase of
normal paraffinic hydrocarbon (NPH) Oxalic acid is then added to prevent the co-
extraction of zirconium (Zr) and molybdenum (Mo) with the MA An additional wash is
also performed using sodium carbonate (Na2CO3) to prevent any other fission products
from being co-extracted The extractants selectively remove the MA and Ln into the
organic phase leaving the remaining fission products in the aqueous phase The MA
and Ln are then stripped using nitric acid and can be reprocessed further as required
However a main drawback is that the lanthanides are still present with the MA so
further reprocessing is required 42
Figure 19 Chemical structure of CMPO (NN-diisobutyl-2-
(octyl(phenyl)phosphoryl)acetamide)
59
Figure 110 TRUEX flow diagram
1343 DIAMEX
The DIAMEX (DIAMide Extraction) process is another example of advanced
reprocessing and is currently under development in France by the CEA (Commissariat agrave
lEnergie Atomique et aux Energies Alternatives) (Figure 113) It is similar to the
TRUEX process as the process selectively removes Am and Cm (MA) and Ln from the
PUREX raffinate The process is being researched using a variety of different diamides
as the extractant the most promising of which have been shown to be NNrsquo-dimethyl-
NNrsquo-dibutyl-tetradecylmalonamide (DMDBTDMA) (Figure 111) and NNrsquo-dimethyl-
NNrsquo-dioctyl-hexylethoxymalonamide (DMDOHEMA) (Figure 112)4344
The nitric
acid PUREX raffinate is contacted with the extractant in an organic phase of tetra-
propylene-hydrogenated (TPH) a synthetic branched form of dodecane45
Oxalic acid is
then added to prevent the co-extraction of Zr and Mo with the MA as in the TRUEX
process and the extractant selectively removes the MA and Ln into the organic phase
leaving behind the other fission products in the aqueous phase The MA and Ln are then
stripped using nitric acid and can be reprocessed further as required
The main benefit of this process compared to the TRUEX process is that the
organic waste only contains C H N and O as P reagents are not used so the waste can
be disposed of more easily However like the TRUEX process a main drawback is that
the lanthanides are still present with the MA so further reprocessing is required 46
Figure 111 Chemical structure of DMDBTDMA (N1N3-dibutyl-N1N3-
dimethyl-2-tetradecylmalonamide)
60
Figure 112 Chemical structure of DMDOHEMA (N1N3-dibutyl-2-(2-
(hexyloxy)ethyl)-N1N3-dimethylmalonamide)
Figure 113 Example DIAMEX flow diagram
1344 SANEX
SANEX (Selective ActiNide EXtraction) is another process being developed by
CEA and is intended to be coupled with a TRUEX or DIAMEX type process and is the
next step in the advanced reprocessing whereby the MA and Ln are separated from
each other so that the MA can be treated (Figure 117) Complexing agents such as bis-
triazinyl-pyridines BTPs and their bipyridine variants (BTBPs) (Figure 114) have been
widely studied with a more recent complexing agent tetraoctyldiglycolamide (TODGA)
(Figure 115) being studied47
The complexing agents have been found to preferentially
bind to the MA allow only the MA to be extracted into an organic phase using TBP
leaving the Ln in the aqueous phase Oxalic acid and (2-hydroxyethyl)-
61
ethylenediaminetriacetic acid (HEDTA) (Figure 116) are used to prevent the co-
extraction of any other fission products The chemistry of this process is poorly
understood however and more research is needed48
However many of these extractant
molecules suffered problems that preclude them from use in plant-scale extractions
including poor stability slow extraction kinetics the use of citric acid as a buffer and
inefficient back extraction due to high An3+ affinities
Figure 114 General chemical structure of BTPs (66-di(124-triazin-3-yl)-22-
bipyridine)
Figure 115 Chemical structure of TODGA (22-oxybis(NN-dioctylacetamide))
Figure 116 Chemical structure of HEDTA (22-((2-((carboxymethyl)(2-
hydroxyethyl)amino)ethyl)azanediyl)diacetic acid)
62
Figure 117 SANEX flow diagram for TODGA process
1345 i-SANEX
The innovative SANEX (or i-SANEX) process is also currently under
development at the CEA49
Essentially it is a modified DIAMEX process with selective
back extraction of Am3+
and Cm3+
from the organic phase The MA3+
and Ln3+
ions are
initially extracted from the PUREX raffinate using TODGA and then a hydrophilic
complexant that is selective for MA3+
is employed to back extract the minor actinides
from the loaded organic phase into the aqueous phase In order to retain the lanthanide
ions in the organic phase a nitrate salt is added to the stripping solution Hydrophilic
extracting agents that have been used to demonstrate this technique are DTPA
(diethylenetriaminepentaacetic acid) and the sulphonated BTP derivative 26-bis(56-
di(sulphophenyl)-124-triazin-3-yl)pyridine SFrsquos of up to 1000 are achievable in this
process50
One other option that has been suggested is to add a second stripping agent
such as HDEHP to the organic phase in order to retain the lanthanides in the organic
phase at low pH One major drawback of this process however is the limited operative
acidity range (ca pH 3) which means that buffering agents need to be added to the
aqueous phase in the back extraction step Another reprocessing concept currently under
investigation is the 1-cycle SANEX with the intention to directly extract the trivalent
actinides selectively from the PUREX raffinate A system consisting of 015 M
CyMe4BTBP and 0005 M TODGA in a mixture of 40 TPH and 60 1-octanol has
been proposed51
63
1346 GANEX
The GANEX (Grouped ActiNide EXtraction) process is relatively new and is a
complete separation process combining the principles of the PUREX and TRUEX
processes in order to separate all of the An (U Pu and MA) from the Ln and both from
the other fission products (Figure 121) A complexing agent bis-triazin-bipyridine
(BTBP) (Figure 118) and its variants (such as CyMe4-BTBP (Figure 119) and CyMe4-
BTPhen (Figure 120))52
have been tested and found to be effective in selectively
coordinating to and extracting MA high separation factors of Am3+
over Eu3+
gt 1000
have been documented In the proposed process BTBP is dissolved in cyclohexanone
(as it is soluble in this solvent and has faster extraction kinetics) and used alongside
TBP which extracts U and Pu and is stable against radiolysis and hydrolysis especially
the CyMe4 variant If proven to be successful this process would simplify reprocessing
making it much simpler however much more work is needed before this process could
become operational as co-extraction of fission products is currently a problem53
For the
most attractive candidate to date the CyMe4-BTBP extractant has been successfully
tested for the extraction of genuine actinidelanthanide feed through a 16-stage
centrifugal contactor setup with excellent recoveries for americium and curium
(gt999) but has been shown to undergo radiolytic degradation at doses that will be
encountered at the high minor actinide loadings obtained in the reprocessing of for
example fast reactor fuels The kinetics for actinide extraction with CyMe4-BTBP are
still relatively slow so the addition of a phase-transfer catalyst is necessary (eg NNprime-
dimethyl-NNprime-dioctylethylethoxymalonamide (DMDOHEMA)) if this extractant is to
be used for large- scale partitioning
Figure 118 General chemical structure of BTBPs (66rsquo-bis(124-triazin-3-yl)-22rsquo-
bipyridine)
64
Figure 119 Chemical structure of CyMe4-BTBP (66-bis(5588-tetramethyl-5678-
tetrahydrobenzo[e][124]triazin-3-yl)-22-bipyridine)
Figure 120 Chemical structure of CyMe4-BTPhen (29-bis-(124-triazin-3-yl)-110-
phenanthroline)
65
Figure 121 GANEX flow diagram
1347 TRPO
Another advanced reprocessing extraction process being developed in China is
the TRPO (TRialkyl Phosphine Oxide) process which involves the separation of all
actinides in stages to remove Np and Pu together AmCm and Ln together and isolate
U There are two processes being researched both of which use TRPO (Figure 122) as
the extractant but differ in the other reagents used One system uses TTHA (triethylene
tetramine hexaacetate) (Figure 124) as a complexing agent to selectively bind to
different actinides preferentially at different pH values to allow selective extraction
buffered by lactic acid (Figure 125) The other process uses nitric acid to extract MA
and Ln followed by oxalic acid to extract Pu and Np Both processes then use sodium
carbonate to strip the remaining U from solution (Figure 126) The main advantage of
the first system is that MA and Ln can subsequently be separated from each other using
CYANEX 301 (Figure 123) with the main disadvantage being the need for buffering
due to pH dependence The main advantage of the second system is that the separation
between components is excellent and virtually discrete but the main disadvantage is that
MA and Ln cannot be later separated from each other using CYANEX 301 due to the
high acidity of the solution54
66
Figure 124 Chemical structure of TTHA (3-(2-((2-
(bis(carboxymethyl)amino)ethyl)(carboxymethyl)amino)ethyl)-6-
(carboxymethyl)octanedioic acid)
Figure 125 TRPO flow diagram using TTHA
Figure 122 Chemical structure of TRPO
(trialkyl phosphine oxide R = C6 ndash C8)
Figure 123 Chemical structure of
CYANEX 301 (bis(244-
trimethylpentyl)phosphinodithioic acid)
67
Figure 126 TRPO flow diagram using HNO3 and oxalic acid
1348 LUCA
LUCA (Lanthaniden Und Curium Americium trennung lanthanide and curium
americium separation) is a relatively new process currently being developed in
Germany and is designed to follow the SANEX or DIAMEX processes The process
involves the selective separation of Am3+
from Cm3+
Cf3+
and Ln3+
after co-extraction
A combined extractant system of bis(chlorophenyl)dithiophosphinic acid
((ClPh)2PSSH) and tris(2-ethylhexyl)phosphate (TEHP) in isooctane and tert-butyl
benzene is used Advantages of the LUCA process include high recovery after stripping
and that the phosphinic acid is more stable to hydrolysis and radiolysis than CYANEX
301 however the phosphinic acid was found to be unstable in high HNO3
concentrations55
At present as with the majority of the MALn processes described the
exact origin of the selectivity remains unclear however it is clear that in general
simple extractant molecules are favourable
68
Figure 127 LUCA flow diagram
1349 EXAm
The EXAm (Extraction of Americium) process is another relatively new process
developed by the CEA for the extraction of only americium from a PUREX raffinate56
Americium is the main cause of heat emissions in SNF wastes and so selective removal
and reprocessing of Am is favourable for vitrified waste disposal Separation of Am3+
from Cm3+
was considered as Cm reprocessing would be difficult to implement due to
high neutron emissions which would require very thick shielding
The process uses a mixture of two extractants (DMDOHEMA and HDEHP) in
TPH from a 4-6 M HNO3 FP solution TEDGA (NNNrsquoNrsquo-tetraethyl-diglycolamide)
(Figure 128) is used as the complexing agent to selectively retain Cm3+
and Ln3+
in
solution allowing extraction of Am3+
Advantages of the process are that the use of
TEDGA over TODGA allows increased separation of Am3+
Cm3+
and TEDGA is
relatively resistant to radiolysis However the chemistry remains quite poorly
understood and separation factors are still quite low at ~25 due to the very similar
chemistry of the two metal ions57
Figure 128 Chemical structure of TEDGA (NNNrsquoNrsquo-tetraethyl-diglycolamide)
69
137 TALSPEAK
TALSPEAK (Trivalent Actinide Lanthanide Separation by Phosphorus reagent
Extraction from Aqueous Complexation) is a further effective method of advanced
reprocessing by solvent extraction The process was initially developed at Oak Ridge
National Laboratory in Tennessee USA during the 1960s and it is still being refined
The process is designed to allow the separation of MA3+
(Am3+
and Cm3+
) from
Ln3+
and yttrium (Y3+
) from the other fission products and from each other to allow MA
to be reprocessed further by transmutation Although it is still under development the
TALSPEAK process has a number of benefits over other similar processes discussed in
Section 126 The process is resistant to irradiation and allows the separation to be
carried out without the need for high acid and salt concentrations It also has added
benefits in that it has already been performed on a pilot plant scale and uses cost
effective readily available reagents58
Additionally it can be carried out using relatively
inexpensive stainless steel equipment The process is very promising despite its
potential disadvantage that it involves removing the major constituent from the minor
constituent as studies have shown the separation is effective enough for this not to be a
problem
1371 The Process
In the process the MA preferentially form complexes with an aminopolyacetic
acid chelate over the lanthanides This allows the lanthanides to be better extracted into
an organic phase by a mono-acidic organophosphate or phosphonate (Figures 132 and
134) The most effective complexing agent to date is DTPA (diethylenetriamine
pentaacetic acid) (Figure 129) in the pH 25-35 range giving relatively high SFs (~50
for Nd3+
the most difficult to extract Ln3+
ion) and the most effective extracting agents
are HDEHP (di(2-ethylhexyl)phosphoric acid) (Figure 130) and HEH[ϕP] (2-
ethylhexyl phenyl phosphonic acid) (Figure 131) The extraction can be carried out
without the use of a complexing agent although the separation is not as discrete and is
significantly enhanced by the addition of an aminopolyacetic acid such as DTPA
Without DTPA Eu3+
Am3+
separation factors using 03 M HDEHP are around 40 59
whereas SF ~90 can be achieved when the complexing agent is used with the extractant
Other aminopolyacetic acids have been tested such as TTHA and EDTA but are not as
effective or tend to be less soluble60
70
Figure 129 Chemical structure of DTPA (2222-
((((carboxymethyl)azanediyl)bis(ethane-21-diyl))bis(azanetriyl))tetraacetic acid)
TALSPEAK Process
1 The fission product mixture (1 M) is dissolved in a carboxylic acid which acts
as a buffer and a solubiliser for the complexing agent lactic acid is often used
for this (Figure 132) Lactic acid (pKa 386)61
has been found to be the best
buffer for the process as it gives the best phase separation Nitrate may be
present from the original raffinate but this has been found not to decrease
separation
2 The solution is ldquoscrubbedrdquo with a mixture of Na5DTPA (01 M) in the same
carboxylic acid (1 M) at pH 36 ndash 38 The DTPA5-
complexes to the MA3+
and
Ln3+
but binds more strongly to the MA3+
This pH range is the optimum pH for
DTPA5-
activity as it complexes more strongly at higher pH values but
separation is better in more acidic conditions
Figure 130 Chemical structure of
HDEHP (bis(2-ethylhexyl) hydrogen
phosphate)
Figure 131 Chemical structure of
HEH[ϕP] ((2-(2-
ethylhexyl)phenyl)phosphonic acid)
71
3 The extractant is dilute HDEHP (05 M) in a hydrocarbon solution such as
DIPB (diisopropyl benzene found to give the best separation) which is then
contacted with the aqueous solution containing the LnMA[DTPA]2-
The Ln3+
ions are extracted into the organic phase by the phosphate causing dissociation
of the DTPA5-
and leaving the free DTPA5-
in the aqueous solution The
MA[DTPA]2-
complexes remain in the aqueous solution as DTPA5-
is bound
strongly enough to MA3+
to prevent the complexes from dissociating HEH[ϕP]
gives a better extraction although it makes stripping more difficult
4 After the Ln3+
ions are removed a second scrub is carried out at lower pH (15)
and a lower concentration of the complexing agent (005 M Na5DTPA) in lactic
acid (1 M) in order to extract the MA3+
The lower pH increases the extraction
rate as the DTPA5-
binds less strongly to the MA3+
allowing them to be
extracted more easily at the phase boundary where DTPA5-
dissociates The
phosphate (03 M HDEHP) is dissolved in n-dodecane (a more favourable
diluent) for the second extraction to remove the MA3+
into the organic phase
The use of n-dodecane was found to give better extraction but poorer
separation If Ln3+
and Y3+
are the only fission products present in the original
raffinate solution the MA3+
can be recovered by precipitation with oxalate from
the raffinate
5 Stripping is then carried out using 1 M HNO3 Nitric acid prevents the use of
corrosive chlorides This process can also be used to extract Cf3+
and Es3+
but it
has been found that more concentrated acid is needed for heavier actinides
Figure 132 Chemical structure of lactic acid pKa = 386
72
Figure 133 The solvent extraction process used in TALSPEAK Step 1 Binding of
DTPA to M3+
in the aqueous phase at pH 36 buffered by lactic acid Step 2 Selective
extraction of Ln3+
into the organic phase by HDEHP from the aqueous phase due to
preferential binding of DTPA to MA3+
Additional Notes on the Process
Initial extraction data for the process reported by Weaver et al in 1964 was
obtained by adding isotopic tracers to the aqueous solutions contacting them with the
organic phase performing the separation and measuring the activity by scintillation
counting with a γ-detector Extractions were all repeated 2-3 times to verify the results
and the contact time was 20 minutes which was much longer than necessary
Extractions performed using Na5DTPA and H5DTPA were found to give the same
results at the same pH values although pH adjustment was needed as Na5DTPA is more
alkaline than H5DTPA but H5DTPA is much less soluble The extraction of heavier
lanthanides was found to be slower but did not affect the separation Increasing the
concentration of HDEHP was found to give better separation but made the initial
equilibration time too long and increasing the concentration of DTPA decreased the
separation (Figure 134)
1 2
73
Figure 134 Effect of Na5DTPA concentration on distribution ratios of MA3+
and Ln3+
in TALSPEAK process using 1 M lactate buffer and 03 M HDEHP in DIPB extractant
60
The process is based on the preferential binding of the complexant to the
trivalent actinides over lanthanides Initially this was thought to be due to the fact that
An3+
binding is more covalent than Ln3+
binding However this was found not to be the
sole reason and it is understood that the organic ligand plays a role in the selectivity
The chemistry of the complexation of the ions with the ligand is not yet fully
understood and much work is needed to gain an insight into this complicated
chemistry62
74
Figure 135 TALSPEAK flow diagram
138 Reprocessing Summary
The necessity of reprocessing has arisen from increasing awareness and concern
for the environment in addition to the potential of maximising finite resources whilst
minimising proliferation There are a number of different processes currently under
development none of which have yet been implemented on a commercial scale except
for the PUREX process
The principles of all these process are often very similar although extraction
techniques and reagents vary somewhat There are a number of factors which must be
considered when developing a suitable solvent extraction process for SNF reprocessing
including the ease of stripping (back-extraction) the need for low volatility non-
flammable solvents the potential of the process to be continuous how to minimise
waste production the resistance of the process to radiolysis and degradation
practicality and efficiency of the process and the economic viability63
While some of the chemistry is understood such as the redox chemistry in the
PUREX process much of it is not thus limiting the potential to develop an efficient
process The sheer complexity of the waste content makes partitioning very difficult
and without a full understanding of the chemistry involved in the processes designing
75
an effective working process will be very challenging All of the processes currently
under development have advantages and disadvantages but all are ultimately heading
towards the same goal separation of the actinides from the lanthanides in order allow
the transmutation of the actinides into shorter lived radionuclides for the purpose of
reducing the long-term radiotoxicity of the waste and the volume of waste building up
in storage
TALSPEAK is one of the most promising techniques being researched due to its
numerous advantages particularly its relative resistance to irradiation and ability to be
carried out without the need for high reagent concentrations Additionally it gives
separation factors of ~50-100 comparable to the SANEX process which uses BTP one
of the most effective complexing agents However its main disadvantage is the poor
understanding of the separation mechanisms and complexation chemistry surrounding
it The main focus of research here will be the TALSPEAK process with a view to
improving the understanding of this chemistry and modifying the process to improve its
practicality
14 Project Objectives and Thesis Outline
Recent studies have shown that complexants with soft donor atoms compared to
oxygen (such as N or S) can be used to separate the MA from Ln6465
Initial research in
this area was carried out by our collaborators at Idaho National Lab using amino acids
as a potential buffer and soft donor which if proven to be successful would be able to
eliminate the need for the separate complexing agent and buffer simplifying the process
if amino acids were found to preferentially bind to the MA66
Another benefit to this
change would be the scope for carrying out the process at a lower pH due to the lower
pKa values of the carboxylic acid groups of the amino acids than on DTPA enabling
the system to be buffered to pH 1-2 rather than ~35 Lower pH values are preferred by
industry as higher acid concentrations are easier to control on a large scale pH control
is essential for the distribution ratios for the separation and there is a strong correlation
between the two Low pH values have been found to increase D however DTPA
protonates and precipitates out of the solution at the lowest values The use of amino
acids in place of the complexing agent would allow a lower pH to be used as they would
not fully protonate increasing the SF and making the process more efficient as binding
constants and ligand affinities would be higher To this end several avenues of research
have been explored
76
Chapter 2 presents initial studies carried out using amino acids in a TALSPEAK
system the interaction of amino acids with lanthanide and actinide ions and their
complexes in solution and the susceptibility of amino acid systems to radiolysis
Chapter 3 discusses work carried out at the INL on an L-alanine-buffered
system optimisation of the alanine system at pH 2 in order to maximise separation
potential and the consideration of other amino acid buffers over a range of pH values
Chapter 4 is focussed on an L-glutathione (GSH) buffered system GSH is a
tripeptide showing promise for an improved TALSPEAK system the next step after
research using single amino acids Data was initially obtained via solvent extraction in
order to investigate the separation ability of GSH and conditions were then optimised in
order to achieve maximum separation Interaction of the buffer with various
components in solution including lanthanide ions was probed using various techniques
including luminescence spectroscopy which was also used in determining the
susceptibility of the buffer to -radiolysis
Chapter 5 details the synthesis of amino acid appended DTPA ligands and their
complexation with lanthanide ions as well as their extraction and separation abilities
under different conditions along with radiolysis resistant investigations
77
1 S Cotton Lanthanide and Actinide Chemistry ed D Woolins R Crabtree D
Atwood and G Meyer John Wiley amp Sons Chichester UK 2006 1 1-7
2 C H Evans Episodes from the History of the Rare Earth Elements Kluwer
Academic Publishers Dordrecht Netherlands 1996
3 S Cotton Education in Chemistry 1999 36 4 96 WR Wilmarth RG Haire JP
Young DW Ramey JR Peterson J Less Common Metals 1988 141 275
4 LR Morss NM Edelstein and J Fuger The Chemistry of the Actindie and
Transactinide Elements Springer The Netherlands 4th edn 2010
5 AP Jones F Wall CT Williams Rare Earth Minerals Chemistry Origin and Ore
Deposits ed AP Jones F Wall and CT Williams Chapman and Hall London UK
1966 1 6-10
6 JJ Katz and GT Seaborg The Chemistry of The Actinide Elements Methuen amp Co
Ltd The Pitman Press Great Britain 1957
7 N Kaltsoyannis and P Scott The f elements ed R G Compton S G Davies J
Evans and L F Gladden Oxford University Press United States 1st edn 1999
8 Greenwood NN and Earnshaw A Chemistry of the Elements Butterworth-
Heinemann Great Britain 2nd edn1997
9 MB Jones AJ Gaunt Chem Rev 2012 DOI 101021cr300198m
10 L Natrajan F Burdet J Peacutecaut M Mazzanti J Am Chem Soc 2006 128 7152
11 C Fillaux D Guillaumont J-C Berthet R Copping D Shuh T Tyliszczak C
Den Auwer Phys Chem Chem Phys 2010 12 14253
12 HC Aspinall Chemistry of the f-block Elements ed D Phillips P OrsquoBrien and S
Roberts Gordon and Breach Science Publishers Singapore 2001 vol 5
13 F Gendron K Sharkas and J Autschbach J Phys Chem Lett 2015 6 2183-
2188
14 VBE Thomsen J Chem Educ 1995 72 (7) 616-618
15 Dr Louise Natrajan School of Chemistry The University of Manchester
16 JP Leonard CB Nolan F Stomeo and T Gunnlaugsson Topics in Current
Chemistry 2007 vol 281 pp1-43
17 Y Ma and Y Wang Co-ord Chem Rev 2010 254 972-990
18 LS Natrajan AN Swinburne MB Andrews S Randall and SL Heath Coordin
Chem Rev 2014 266-267 171-193
19 A Bettencourt-Dias Dalton Trans 2007 2229-2241
20 E Hashem AN Swinburne C Schulzke JD Kelly RC Evans JA Platts A
Kerridge LS Natrajan and RJ Baker RSC Adv 2013 3 4350
78
21 C Turro PK Fu and PM Bradley Met Ions Biol Syst 2003 40 323-353
22 Dr Louise Natrajan School of Chemistry The University of Manchester
23 I Billard and G Geipel Springer Ser Fluoresc 2008 5 465-492
24 A Beeby IM Clarkson RS Dickins S Faulkner D Parker L Royle AS de
Sousa JAG Williams and M Woods J Chem Soc Perkin Trans 2 1999 493-504
25 WD Horrocks and DR Sudnick J Am Chem Soc 1979 101 334
26 RM Supkowski and WD Horrocks Inorg Chim Acta 2002 340 44-48
27 Dummiesreg Nuclear Fission Basics httpwwwdummiescomhow-
tocontentnuclear-fission-basicshtml 2015
28 PE Hodgson Nuclear Power Energy and the Environment Imperial College Press
Great Britain 1999
29 P Dyck and MJ Crijns Rising Needs IAEA Bulletin 1998 40 1
30 World Nuclear Association The Nuclear Fuel Cycle httpwwwworld-
nuclearorginfoinf03html 2011
31 Nuclearmatterscouk Re-use of Plutonium as MOX Fuel
httpnuclearmatterscouk201202re-use-of-plutonium-as-mox-fuel 2012
32 World Nuclear Association Processing of Used Nuclear Fuel 2012
httpwwwworld-nuclearorginfoinf69htmla
33 United States Nuclear Regulatory Commission Neutron poison httpwwwnrcgov
2012
34 K L Nash Solvent Extraction and Ion Exchange 1993 114 729-768
35 M P Jensen L R Morss J V Beitz and D D Ensor Journal of Alloys and
Compounds 2000 303-304 137-141
36 Advanced Separation Techniques for Nuclear Fuel Reprocessing and Radioactive
Waste Treatment ed KL Nash and GL Lumetta Woodhead Publishing 1st edn
Cambridge UK 2011
37 CS Dileep Poonam Jagasia PS Dhami PV Achuthan AD Moorthy U
Jambunathan SK Munshi PK Dey and BS Tomar BARC Newsletter 2007 285
130-134
38 H Schmieder G Petrich and A Hollmann J Inorg Nucl Chem 1981 43 (12)
3373-3376
39 SC Tripathi and A Ramanujam Sep Sci and Technol 2003 38 2307
40 G Thiollet and C Musikas Solv Extr Ion Exch 1989 7 813
41 GL De Poorter and CK Rofer-De Poorter 720872 1976 US Pat 4080273 1978
79
42 EP Horwitz DC Kalina H Diamond GF Vandegrift and WW Schulz Solv
Extr Ion Exch 1985 31 75-109
43 A Banc P Bauduin and O Diat Chem Phys Lett 2010 494 (4-6) 301-305
44 J Muller L Bethon N Zorz and J-P Simonin Proceedings of the First ACSEPT
International Workshop 2010
45 C Brassier-Lecarme P Baron JL Chevalier and C Madic Hydrometallurgy
1997 47 57-67
46 O Courson R Malmbeck G Pagliosa K Romer B Satmark J-P Glatz P Baron
and C Madic Radiochim Acta 2000 88 865-871
47 M Sypula A Wilden C Schreinemachers and G Modolo Proceedings of the First
ACSEPT International Workshop 2010
48 C Hill L Berthon P Bros J-P Dancausse and D Guillaneux Nuclear Energy
Agency 7th Information Exchange Meeting Session II 2002
49 S Bourg C Hill C Caravaca C Rhodes C Ekberg R Taylor A Geist G
Modolo L Cassayre G de Angelis A Espartero S Bouvet N Ouvrier Nucl Eng
Des 2011 241 3427 G Modolo A Wilden A Geist D Magnusson R Malmbeck
Radiochim Acta 2012 100 715
50 A Geist U Muumlllich D Magnusson P Kaden G Modolo A Wilden T Zevaco
Solv Extr Ion Exchange 2012 30 433
51 A Wilden C Schreinemachers M Sypula G Modolo Solv Extr Ion Exch 2011
29 190
52 FW Lewis LM Harwood MJ Hudson MGB Drew V Hubscher-Bruder V
Videva F Arnaud-Neu K Stamberg and S Vyas Inorg Chem 2013 52 4993-5005
53 E Aneheim C Ekberg A Fermvik M R St J Foreman T Retegan and G
Skarnemark Solv Extr Ion Exch 2010 284 437-458
54 M Wei X Liu and J Chen J Radioanal Nucl Chem 2012 291 717-723
55 G Modolo P Kluxen A Geist Radiochim Acta 2010 98 193
56 C Rostaing C Poinssot D Warin P Baron and B Lorrain Procedia Chem 2012
7 349-357
57 S Chapron C Marie G Arrachart M Miguirditchian and S Pellet-Rostaing Solv
Extraction and Ion Exchange 2015 33 236-248
58 M Milsson and K L Nash Solvent Extraction and Ion Exchange 2009 273 354-
377
59 G Lumetta AV Gelis and GF Vandegrift Solv Extraction and Ion Exchange
2010 28 3 287-312
80
60 B Weaver and T A Kappelmann Talspeak A new method of separating americium
and curium from the lanthanides by extraction from an aqueous solution of an
aminopolyacetic acid complex with a monoacidic organophosphate or phosphonate
Oak Ridge National Laboratory 1964 1-60
61 K W Raymond General Organic and Biological Chemistry An Integrated
Approach John Wiley amp Sons USA 3rd edn 2010 7 253
62 L Karmazin M Mazzanti C Gateau C Hill and J Peacutecaut Chem Commun 2002
2892-2893
63 KL Nash Actinide Solution Chemistry Proceedings of the Eighth Actinide
Conference Actinides 2005
64 M P Jensen and A H Bond J Am Chem Soc 2002 124 9870-9877
65 L R Martin B J Mincher and N C Schmitt J Radioanal Nucl Chem 2009
282 523-526
66 S Oumlzҫubukҫu K Mandal S Wegner M P Jensen and C He Inorg Chem 2011
50 7937-7939
81
2 COMPLEXATION STUDIES OF Ln amp An WITH DTPA AND BUFFERS
UNDER TALSPEAK CONDITIONS
DTPA (diethylenetriaminepentaacetic acid) is an amino polycarboxylic acid
used to act as a holdback reagent in the TALSPEAK process (Trivalent Actinide
Lanthanide Separation by Phosphorus reagent Extraction from Aqueous Complexation)
an advanced reprocessing technique currently being developed in the USA (Section
137) DTPA is the chelating agent used as it has been shown to complex more strongly
to trivalent minor actinide ions (MA3+
) than lanthanide ions (Ln3+
) in aqueous solution
allowing selective extraction of lanthanides into an organic phase by organophosphate
HDEHP (di-(2ethylhexyl)phosphoric acid) to separate the two components
21 Introduction to An-DTPA and Ln-DTPA Complexes
It is widely known that DTPA ligands bind very well to metal ions in aqueous
media It is commonly used to extract heavy metals from soils for environmental
reasons1 and to treat heavy metal poisoning through its ability to chelate to heavy
metals making them more water soluble and able to be removed from the body
naturally by excretion2 Lanthanide DTPA complexes have been well established
although there is actually very little structural data available on them Most literature
references to lanthanide DTPA complexes discuss their use as MRI contrast agents the
most common choice being Gd-DTPA3 Other reported applications of DTPA-based
lanthanide complexes are for use as biological luminescent probes particularly with Eu4
and Tb5 Due to the highly hygroscopic nature of Ln-DTPA complexes solid state
structural analysis has only been reported in two instances as molecular structures
determined by X-ray absorption spectroscopy (XAS) one for Gd(III)-DTPA (Figure
21) and one for Eu(II)-DTPA6 Most solution state structural analysis for lanthanide
DTPA complexes has been carried out recently in order to better understand MALn
separation and TALSPEAK chemistry The only literature available on An-DTPA
complexes is related to separations chemistry except for actinium-DTPA used in
radiotherapy7
82
Figure 21 XAS molecular structure of Gd(III)-DTPA8
211 Stability of Ln-DTPA and An-DTPA Complexes
Reports on the formation of trivalent actinide complexes with DTPA detail that
the stability of AnDTPA2-
complexes (the dominant DTPA species present at pH 36
which is the pH currently used in the TALSPEAK process) is greater than the stability
of LnDTPA2-
complexes allowing the selective extraction on Ln3+
to take place For
LnDTPA2-
complexes stability constants range from log β = 1948 for La increasing
across the series up to log β = 2283 for Dy (with a slight dip at Gd) decreasing slightly
for the heavier Ln3+
complexes
Stability constants in the literature for AnDTPA2-
have been determined by a
range of techniques including TRLFS CE-ICP-MS spectrophotometry and solvent
extraction and range from log β = 2257 to 2403 for AmDTPA2-
and from log β = 2238
- 2348 for CmDTPA2-
at an ionic strength (I) of 01 M However there is some dispute
on whether AnHDTPA- complexes are also present in solution and this needs to be
accounted for when calculating stability constants as some of these values have been
determined with and some without consideration of AnHDTPA-9101112
Studies conducted by Martin et al determined stability constants of log β =
2219 - 2085 for CmDTPA2-
at I = 1 M over a temperature range of 10-70 degC
compared to log β = 2131 - 2033 for EuDTPA2-
over the same temperature range The
complex EuHDTPA- was found to have a stability constant of log β = 227 - 210 under
TALSPEAK conditions Europium(III)is used as a standard comparison to Am3+
Cm3+
due to the close similarity in chemistry between the elements as a result of their
electronic structures This data clearly shows that the Cm3+
has a higher binding
83
strength to DTPA5-
than Eu3+
The greater exothermic enthalpy of complexation of
CmDTPA2-
than EuDTPA2-
(-407 kJ mol-1
vs -336 kJ mol-1
) determined by
microcalorimetry indicated stronger covalent bonding of Cm3+
to DTPA5-
than Eu3+
Luminescence spectroscopy carried out in support of these studies found that
CmDTPA2-
has a shorter luminescence lifetime than EuDTPA2-
(268 micros in H2O 815 micros
in D2O for Cm3+
cf 630 micros in H2O 6200 micros in D2O for Eu3+
) This along with the
biexponential decay pattern indicating the presence of two species for Cm3+
was
attributed to faster exchange between Eu3+
and the ligandsolvent than for Cm3+
suggesting that the exchange for Eu3+
is not distinguishable on the luminescence
timescale and therefore less susceptible to the associated quenching effects This may be
due to the more ionic bonding of Eu3+
to the ligand
The pKa for the protonation of MDTPA2-
to MHDTPA- (M = metal ion) is 227
for Eu and 025 for Cm indicating that CmHDTPA- is only likely to be present in
solutions of very low pH (pH ltlt 1) It was hypothesised that the presence of
LnHDTPA- facilitates the exchange between ligand and solvent explaining the
observed difference in luminescence lifetime data consistent with stronger
complexation of MA3+
to DTPA and slower kinetics of MA3+
extraction as the
MDTPA2-
is less likely to dissociate13
212 Co-ordination Chemistry of Ln-DTPA and An-DTPA Complexes
It is known that Ln3+
ions co-ordinate to DTPA5-
in aqueous solution at pH 36
through the 5 deprotonated carboxylate groups (COO-) on the molecule and through the
three nitrogen atoms on the DTPA backbone forming an octadentate complex with one
water molecule in its inner hydration sphere giving the Eu3+
ion a co-ordination number
of 9 in the shape of a distorted capped square antiprism This is also the case for the
LnHDTPA- species
Figure 22 Chemical structure of [Eu(DTPA)]2-
84
The co-ordination mode of DTPA5-
to MA3+
is the same as for Ln3+
octadentate
(Figure 21) with a co-ordination number of 9 due to 1 water molecule bound to the
metal ion Hydration numbers of 2 have been reported for Cm-DTPA complexes but
have been found not to be stable14
DFT optimisation of CmDTPA2-
and EuDTPA2-
structures conducted by Martin
et al found that the M-O bond lengths were similar for both metal ions but that the M-
N bond lengths were shorter for Cm3+
than Eu3+
(by 004-008 Aring) Considering that
Cm3+
has a larger ionic radius than Eu3+
this suggests that Cm3+
binds more strongly to
the intermediate N donors on the DTPA molecule Further optimisations showed that
significant changes in bond lengths upon protonation of MDTPA2-
to MHDTPA-
indicated that M-N interactions are weakened to a greater extent for Cm3+
than Eu3+
so
that MHDTPA- is less likely to form for Cm
3+ in solution than Eu
3+ This data is
consistent with the pKa data for the complexes (Section 211)
22 Ln-DTPA Complexation Studies
As a first experiment (in order to verify the experimental procedures for
subsequent studies) the complex [Eu(DTPA)H2O]2-
was formed from europium nitrate
(1 mM) and Na5DTPA (005 M) in H2O and D2O at pH 36 and characterised by 1H
NMR spectroscopy (for the complex in D2O) and luminescence spectroscopy (D2O and
H2O)
221 1H NMR Studies of Ln-DTPA
1H NMR spectra are difficult to fully assign for Ln
3+ DTPA complexes due to
both the paramagnetic nature of the ions and the (fast) chemical exchange of the CH2
carboxylate and ethylene diamine backbone protons which results in significant
spectral broadening However complex formation can be verified at lower temperatures
(here 5 degC) where this conformational exchange is slowed down so the paramagnetic
broadening and shifting of the CH2 DTPA proton resonances can be observed in the 1H
NMR spectrum (Figure 23) by comparison with uncomplexed DTPA (Figures 24a-c)
85
EUDTPAESP
15 10 5 0 -5 -10 -15 -20
Chemical Shift (ppm)
0
0005
0010
0015
0020
0025
0030
0035
0040
0045
0050
0055
Norm
alized Inte
nsity
152
8
99
196
6
88
4
53
7
42
536
033
528
7
15
8
-01
1
-16
1
-40
6
-57
3-6
33
-105
3
-126
8
-148
3
-170
2
-184
7
Figure 23 1H NMR spectrum of [Eu(DTPA)]
2- in D2O at 278 K at pD = 36
DTPA pH71resp
55 50 45 40 35 30 25 20
Chemical Shift (ppm)
0
0005
0010
0015
0020
0025
0030
0035
0040
0045
0050
0055
0060
Norm
alized Inte
nsity
199100215418
DEUTERIUM OXIDE
Water
38
1
34
033
833
632
8
30
630
530
3
a
86
DTPA pH361resp
55 50 45 40 35 30 25 20
Chemical Shift (ppm)
0
0005
0010
0015
0020
0025
0030
0035
0040
0045
0050
0055
0060
Norm
alized Inte
nsity
204206100421
Water
47
647
5
38
5
35
634
634
434
3
31
531
431
2
DTPA pH21resp
55 50 45 40 35 30 25 20
Chemical Shift (ppm)
0
0005
0010
0015
0020
0025
0030
0035
0040
0045
0050
0055
0060
Norm
alized Inte
nsity
202199100406
Water
47
5 46
9
39
0
35
4
34
033
933
7
31
130
930
8
Figure 24 1H NMR spectra of DTPA in D2O at 278 K at varying pD a) pD 7
[DTPA]5-
b) pD 36 [H3DTPA]2-
c) pD 2 [H5DTPA]
222 Luminescence Studies of Ln-DTPA
Emission spectra were recorded for Eu
3+ (1 mM) with and without DTPA
5- (005
M) present in aqueous solution (Figure 25) following 397 nm excitation directly into
the 5L6 f-f absorption band
15 The formation of [Eu(DTPA)]
2- can be observed by the
splitting of the peaks in the emission spectrum of the complex compared to the free
Eu3+
(aq) representing the 5D0 rarr
7FJ transitions where J = 0 1 2 3 and 4 This is due to
crystal field splitting caused by the ligand and is indicative of strong binding of the
ligand to Eu3+
ion at pH 361617
The emission intensity is also significantly enhanced
upon the complexation of Eu3+
to DTPA5-
as the chelating ligand forms an octadentate
b
c
87
complex significantly lowering the degree of quenching of the emission by surrounding
solvent molecules
Figure 25 Emission spectrum of Eu3+
(aq) and [Eu(DTPA)]2-
in D2O at pD 36
Additionally the luminescence lifetimes of the free Eu3+
(aq) and the
[Eu(DTPA)]2-
complex were measured in D2O and H2O This allows calculation of q
which represents the number of bound solvent molecules in the inner hydration sphere
of the metal ion The original Horrocks equation18
(Equation 19) and modified
Horrocks equation1920
for q lt 2 (Equation 110) are shown below
Equation 21
Equation 22
The Horrocks equation uses the emission lifetimes (τ) to determine q A is the
proportionality constant taking into account the inner hydration sphere and B is a
correction factor taking into account the outer hydration sphere A and B values are
experimentally determined constants and are available for Sm3+
Eu3+
Tb3+
Nd3+
Yb3+
Am3+
and Cm3+
The q values can be effectively determined from solutions of water and
methanol For the original Horrocksrsquo equation A = 105 for Eu3+
and A = 42 for Tb3+
and for the modified Horrocksrsquo equation (when q lt 2 ) A = 12 ms and B = (025 ndash
0
2
4
6
8
10
12
14
16
18
550 570 590 610 630 650 670 690 710
Emis
sio
n In
ten
sity
(au
) x
10
00
0
Wavelength (nm)
[Eu(DTPA)]2-
Eu3+
5D0 rarr 7F0
5D0 rarr 7F1
5D0 rarr 7F2
5D0 rarr 7F3
5D0 rarr 7F4
88
0075x) ms-1
(where x = the number of exchangeable N-H oscillators) for Eu3+
and A =
5 ms and B = 006 ms-1
for Tb3+
The q value was found to be 9 for Eu3+
(aq) suggesting that the Eu3+
ion is
surrounded by 9 solvent molecules forming [Eu(H2O)9]3+
in aqueous solution as
expected For [Eu(DTPA)]2-
formed at pH 36 q was found to be 14 plusmn 02 showing that
only 1 water molecule is bound to the metal ion This compares well to the literature
values reported at pH 7 where the lifetimes are similar and q = 1121
23 An-DTPA Complexation Studies
The aminopolycarboxylate DTPA5-
chelates even more strongly to An3+
ions
than Ln3+
ions Preliminary 1H NMR and luminescence analyses were carried out by
Louise Natrajan at KIT-INE in Karlsruhe Germany on Am3+
and Cm3+
complexation
with DTPA as part of the FP7 EURACT-NMR scheme (Scheme 21)
Scheme 21 Complexation of DTPA to Am3+
and Cm3+
231 1H NMR Studies of An-DTPA
The complex [Am(DTPA)xH2O]2-
was formed and analysed by 1H NMR in a
41 ratio of MeODD2O with an additional drop of NaOD to ensure complex formation
from a dried acidic americium nitrate stock salt and Na5DTPA The spectra were taken
over a temperature range of 210-365 K at ~ pD 3 (Figure 26) Note here that the exact
pD of the solution could not be accurately measured due to the high specific activity of
the 241
Am isotope used From the spectrum it can be seen that at pD 3 there is a DTPA
complex formed and that at higher temperatures there are some dynamic exchange
processes occurring as the resonances become broader and the spectrum becomes
simpler This is most likely due to conformational changes in the DTPA ligand
(movement of the carboxylates and the ethylene bridge protons analogous to DOTA
and DO3A derivatives)22
The Am3+
ion is essentially diamagnetic as it has a 7F0 ground state and the
magnetic moment is calculated as 0 based on the Russell Saunders coupling scheme
89
The same is true for the isoelectronic lanthanide analogue Eu3+
but in this ion
significant paramagnetism is induced at room temperature due to low-lying energy
levels that are thermally populated according to the Boltzmann distribution Thermal
mixing of J states induces a paramagnetic shift but in the case of Am3+
the second J
level lies much higher in energy (~ 4000 cm-1
higher) so may only be populated and
induce a paramagnetic shifting of proton resonances at higher temperatures2324
Indeed
a slight shift of the proton resonances with temperature is observed for
[Am(DTPA)xH2O]2-
potentially indicating a small contribution of the Am3+
7F1 excited
state to the chemical shift of the proton resonances
Figure 26 1H NMR spectrum for [Am(DTPA)xH2O]
2- in 41 vv MeODD2O with
NaOD over a temperature range at pH 3
232 Luminescence Studies of An-DTPA
Emission spectra were recorded for solutions of
243Cm
3+ (015 microM Cm
3+ in 32
mM HClO4 diluted to 1 mL with H2O) with and without Na5DTPA (02 M) present in
aqueous solution following direct excitation at 3966 nm into the f-f absorption band of
Cm3+
(Figure 27) The formation of [Cm(DTPA)]2-
can be observed by the immediate
formation of a new red shifted emission band at 607 nm attributed to the 6D72
8S72
transition in the complex compared to that in free Cm
3+(aq)
at 593 nm The f-f transitions
in Cm3+
are much more sensitive to the coordination environment than Ln3+
due to more
210 K
265 K
300 K
365 K
90
spin orbit coupling and the fact the 5f orbitals are more spatially diffuse than the 4f
orbitals resulting in a much greater difference in emission spectra upon complexation
for actinides than lanthanides
Figure 27 Emission spectrum of Cm3+
and [Cm(DTPA)]2-
in perchloric acid at pH 3
by direct excitation with a NdYAG pumped dye laser at 3966 nm
Similarly to Eu3+
the inner hydration sphere of the free Cm3+
ion is known to
contain 9 water molecules25
In 1998 Kimura and Choppin developed a modified
version of the Horrocks equation in order to allow q to be calculated from aqueousnon-
aqueous solvent mixtures (Equation 23)26
Equation 23
The lifetime of the [Cm(DTPA)]2-
complex in H2O is 510 micros and is significantly
longer than that of the aqua ion which is determined as 68 micros The radiative lifetime of
the complex can be directly inserted into this equation and indicates that there are 16
water molecules (between 1 and 2) co-ordinated to the metal ion again showing the
formation of an octadentate complex with DTPA ligand analogously to Eu3+
24 Introduction to Buffer Interaction with Ln3+
and Ln-DTPA Complexes
241 Interaction of Lactate with Ln3+
and Ln-DTPA Complexes
A lactic acidlactate buffer is used in the TALSPEAK process to buffer the
system to pH 36 Lactate (Lac) is known to co-ordinate to M3+
ions27
to form
40
45
50
55
60
65
70
75
80
570 590 610 630
Emis
sio
n In
ten
sity
(au
) Tho
usa
nd
s
Wavelength (nm)
Cm3+(aq)
[Cm(DTPA)]2-
91
M3+
(CH3CH(OH)COO-)3 Equations 24a-c show the formation of Eu
3+-lactate
complexes
Equation 24a-c
(a)
(b)
(c)
Stability constants for each of the species formed in Equations 24a-c were
determined by Martin et al over a temperature range of 0-70 degC Log β values were
found to be 290-281 for Eu(Lac)2+
log β = 490-449 for Eu(Lac)2+ and log β = 624-
633 for Eu(Lac)3 Luminescence spectroscopy of Eu-lactate formation showed that as
the concentration of lactate was increased from 0 mM to 73 mM the emission intensity
of the J=2 peak (5D0 rarr
7F2 transition) at 615-620 nm increased but the J=1 peak (
5D0 rarr
7F1 transition) at 590-600 nm was not significantly affected changing the J=1J=2 peak
ratio suggesting that the co-ordination mode of the lactate to the Eu3+
ion changes as a
function of lactate concentration as the J=1 peak is a magnetic dipole transition which is
insensitive to the co-ordination of the ion (Figure 28)28
Figure 28 Emission spectrum of Eu-lactate as a function of lactate concentration28
The luminescence lifetimes of Eu3+
in water also increased as the lactate
concentration was increased indicating that the number of water molecules directly co-
ordinated to the metal ion decreases from ~9 to ~5 due to complexation with lactate
Luminescence and thermodynamic data suggest that lactate co-ordinates in a bidentate
92
mode to Ln3+
ions through the deprotonated carboxylate group and also through the α-
hydroxyl group (Figure 29) making Ln-lactate complexes more stable than simple
monocarboxylates with monodentate co-ordination28
Figure 29 Co-ordination mode of lactate to Eu3+
28
The interaction of lactate ions with metal-DTPA complexes is less well
understood It is considered that there is an exchange between the Ln3+
ion and the
lactate and DTPA ligands The concentration of lactate has been shown by Nash et al to
affect the complexation and dissociation of [Ln(DTPA)]2-
however it is not understood
whether this is due to the changing pH with lactate concentration since extraction in the
TALSPEAK process is heavily dependent on pH29
TALSPEAK extractions using
lactate without DTPA show poor separation of Ln3+
over Am3+
DTPA is required to
achieve separation of MA3+
from Ln3+
as lactic acid acts only as a buffer and not a
holdback reagent
Research has shown previously that binary complexes are dominant in the
TALSPEAK process chiefly in the form of MDTPA2-
and M(Lac)n3-n
Studies carried
out using spectrophotometry luminescence spectroscopy and thermometric
experiments have shown that ternary M3+
-DTPA-lactate complexes with lactate co-
ordinated directly to the metal centre are only present in very small quantities and so
will have negligible effect on metal separation However it is possible that outer sphere
ternary M3+
-DTPA-lactate complexes may form where the lactate interacts with the
DTPA molecule although it is expected these would also be present only in minor
quantities and so would also have negligible effect on metal separation30
242 Interaction of Amino Acids with Ln3+
and Ln-DTPA Complexes
The potential of using amino acids as a combined buffer and soft donor was
considered as it was thought that the increased number of softer donors on amino acids
93
compared to lactate may remove the need for the separate buffer and DTPA holdback
reagent if amino acids were found to preferentially bind to MA3+
in solution There have
been few studies on the interaction of amino acids with lanthanide ions and none with
actinide ions or with DTPA Stability constants for amino acids with lanthanide ions31
can be found in the literature and like stability of lactate complexes with Ln3+
ions32
generally tend to increase across the lanthanide series from La-Lu as the Lewis acidity
of the metal ions increases The values are close to the stability constants for Ln-lactate
complexes averaging at around 5-6 depending on the metal ion and amino acid Log β
values for La-Sm with glycine range from 532-584 and with L-alanine log β = 582-
668
25 Studies on Buffer Interaction with M3+
and [M(DTPA)]2-
Initial studies in this area considered the interaction of various amino acids and
lactate with lanthanide ions in TALSPEAK systems The amino acids glycine L-alanine
and L-serine (Figure 210) were chosen to begin this research due to their similarity in
molecular structure to lactate and good solubility in water
Figure 210 Chemical structures of L-alanine (top) glycine (bottom left) and L-serine
(bottom right)
251 1H NMR Studies on Buffer Interactions
L-alanine (1 M) was added to Eu(NO3)3 (10 mM) in D2O and analysed by
1H
NMR spectroscopy (Figure 211) The spectrum shows that L-alanine complexes
weakly with the metal ion as there is minimal paramagnetic line broadening and only
slight shifting of the proton resonances from that of L-alanine itself (Figure 212)
94
New Eu Ala0011resp
55 50 45 40 35 30 25 20 15 10 05 0
Chemical Shift (ppm)
0
005
010
015
Norm
alized Inte
nsity
310100
CH3
CH
Water
47
147
1
35
5
12
712
6
Figure 211 1H NMR spectrum of Eu(NO3)3xH2O (10 mM) with L-alanine in D2O at
278 K
Ala1resp
55 50 45 40 35 30 25 20 15 10 05 0
Chemical Shift (ppm)
0
01
02
03
04
05
06
07
08
09
10
Norm
alized Inte
nsity
336100
CH3
CH
Water
36
536
336
2
13
3
Figure 212 1H NMR spectrum of L-alanine in D2O at 278 K
95
The interaction of L-alanine (1 M) with [Eu(DTPA)]2-
(10 mM) in D2O was also
investigated by 1H NMR spectroscopy (Figure 213) This spectrum shows that the L-
alanine does not bind to the europium DTPA complex on the experimental timescale as
there is no paramagnetic broadening or shifting of the amino acid peaks and the ligand
is present as uncomplexed ligand
EuDTPA Ala1esp
15 10 5 0 -5 -10 -15 -20
Chemical Shift (ppm)
0005
0010
0015
0020
0025
0030
0035
Norm
alized Inte
nsity
150
5 96
892
185
2
75
4
50
4
39
533
231
625
8
14
6
05
0
-13
1
-44
2
-63
3-6
86
-108
2
-127
6
-143
1
-169
0
-183
9
Figure 213 1H NMR spectrum of [Eu(DTPA)]
2- (10 mM) with L-alanine (1 M) in D2O
at 278 K
252 Luminescence Studies on Buffer Interactions
2521 Sensitisation Tests
Luminescence studies on a [Tb(DTPA)]2-
(1 mM) complex in the presence of
the amino acid L-phenylalanine (05 M) (Figure 215) at pH 3 were initially carried out
in order to determine if sensitised emission occurs whereby energy would be
transferred from the phenyl chromophore of the amino acid to the metal ion This could
potentially occur if the amino acid was in close proximity (ie bound) to the metal ion
and would give some indication into the interaction between the amino acid and the
metal ion However sensitised emission was found not to occur as when the complex
was excited in the region of the phenyl chromophore (250 nm) no emission occurred
When excited directly into the f-f region of the Tb3+
complex at 379 nm there was a
slight decrease in emission intensity upon the addition of L-phenylalanine however the
decrease is not significant The excitation spectrum was recorded of the emission at 545
96
nm and showed only the presence of f-f transitions and no contribution from the organic
region (Figure 214)
Figure 214 Emission spectra of [Tb(DTPA)]2-
in D2O at pD 3 with and without the
presence of L-phenylalanine (05 M) excited at 250 nm and 379 nm Excitation
spectrum of [Tb(DTPA)]2-
in D2O at pD 3 with L-phenylalanine (05 M) at 545 nm
Figure 215 Chemical structure of L-phenylalanine
2522 Aqueous Phase Lanthanide Studies without Na5DTPA
Emission spectra of Eu3+
(1 mM Eu(NO3)3) were taken in D2O and H2O with the
presence of different amino acidslactate (1 M) in order to determine whether the amino
acids bind to the metal ions at pH 36 (TALSPEAK pH) The emission spectrum of the
free metal ion in solution was also measured for comparison (Figure 216)
0
100
200
300
400
500
600
700
0
5
10
15
20
25
30
220 320 420 520 620
Ab
sorp
tio
n In
ten
sity
(au
) Th
ou
san
ds
Emis
sio
n In
ten
sity
(au
) Th
ou
san
ds
Wavelength (nm)
TbDTPA exc 379 nm
TbDTPA + Phe exc 250 nm
TbDTPA + Phe exc 379 nm
Excitation of TbDTPA + Phe at 545 nm
97
Figure 216 Emission spectra of Eu(NO3)3 in D2O at pD 36 with and without the
presence of amino acidslactate (1 M) excited at 395 nm at 298 K
The emission intensity increases upon the addition of amino acidslactate to Eu3+
in D2O This shows that the amino acids are interacting with the metal ion however the
emission spectra resemble that of the free aqua ion suggesting that the amino acids and
lactate are not binding to the metal ion The presence of the amino acids at such a high
concentration will reduce quenching effects from the surrounding solvent molecules
which may be one explanation for the increased emission intensity At pH 36 the
amino acids will be in their zwitterionic form (H3N+-CHR-COO
-) and so are likely to
co-ordinate with the free metal ion in the same manner as lactate however this co-
ordination appears to be very weak and they are probably in fast exchange with
surrounding water molecules
The q values of the Eu3+
ions were calculated from the luminescence lifetimes in
H2O and D2O using the original Horrocks equation (Equation 19) The results can be
seen in Table 21
0
2
4
6
8
10
12
14
550 570 590 610 630 650 670 690 710
Emis
sio
n In
ten
sity
(au
) x
10
00
0
Wavelength (nm)
Eu3+
Eu-Lactate
Eu-Gly
Eu-Ala
Eu-Ser
98
Table 21 Luminescence lifetimes and q values for Eu3+
with amino acidslactate
Estimated error on lifetimes = plusmn 10 and on q plusmn 02
The number of bound solvent molecules in the inner hydration sphere of Eu3+
decreases with the addition of amino acidslactate from 9 to approximately 6 This is
consistent with possible fast exchange of water molecules with co-ordinated amino
acids and shows that an average of 3 amino acidslactate ions are co-ordinating to the
metal
2523 Aqueous Phase Lanthanide Studies with Na5DTPA
Emission spectra of Eu(NO3)3 (1 mM) with Na5DTPA (01 M) were recorded in
D2O and H2O with the presence of different amino acidslactate (1 M) at pH 36 in order
to determine whether the amino acids bind to the complexed metal (Figure 217)
Figure 217 Emission spectra of Eu-DTPA in D2O at pD 36 with and without the
presence of amino acidslactate (1 M) excited at 395 nm
0
5
10
15
20
25
550 600 650 700
Emis
sio
n In
ten
sity
(au
) x
10
00
0
Wavelength (nm)
EuDTPA
EuDTPA-Lactate
EuDTPA-Gly
EuDTPA-Ala
EuDTPA-Ser
τ in H2O (ms) τ in D2O (ms) q
Eu3+
011 165 89
Eu Lactate 016 194 60
Eu Gly 016 183 60
Eu Ala 016 187 60
Eu Ser 019 147 48
99
The emission intensity does not change upon the addition of amino acidslactate
to [Eu(DTPA)]2-
in D2O These spectra also do not change shape and there is no
observable shift resembling that of the [Eu(DTPA)]2-
species suggesting that the amino
acids and lactate are not binding to the metal complex
The q values of the Eu3+
ions were calculated from the luminescence lifetimes in
H2O and D2O using the original Horrocks equation (Equation 19) The results can be
seen in Table 22
Table 22 Luminescence lifetimes and q values for [Eu(DTPA)]2-
with amino
acidslactate Estimated error on lifetimes = plusmn 10 and on q plusmn 02
From these kinetic data it is clear that q does not change for [Eu(DTPA)]2-
upon
the addition of amino acidslactate showing that there is no significant interaction with
the Eu3+
ion and they do not bind to the metal ion of the complex This may be due to
steric factors as the DTPA5-
is octadentate and fully complexed to the metal ion leaving
room for only 1-2 solvent molecules to bind to the ion and making it difficult for any
larger species to exchange
2524 Aqueous Phase Actinide Studies with Na5DTPA
In order to determine whether amino acids interacted any more with actinides
than lanthanides the emission spectrum of [Cm(DTPA)]2-
(1 mM) was taken with the
addition of L-alanine (25 mM) at KIT-INE Karlsruhe (Figure 218)
τ in H2O τ in D2O q
Eu DTPA 063 230 23
Eu DTPA Lactate 063 216 22
Eu DTPA Gly 065 203 20
Eu DTPA Ala 065 209 21
Eu DTPA Ser 065 208 21
100
Figure 218 Emission spectrum of [Cm(DTPA)]2-
in H2O with and without L-alanine
(25 mM) at pH 3 by direct excitation at 396 nm The spectra are reported uncorrected
for differences in the incident laser power for clarity
Upon addition of L-alanine there is no change in the emission spectrum - no red
shift or change in emission intensity (quantum yield) compared to complexation of
Cm3+
to DTPA5-
(Figure 26) Moreover the luminescence lifetime is the same as
[Cm(DTPA)]2-
and there is no change in the calculated value of q indicating either no
interaction of the L-alanine with the complex or a very weak interaction such as fast
exchange of the buffer and bound solvent molecules showing that the L-alanine does
not strongly interact with Cm3+
253 Radiolysis Studies on Amino Acid Buffered Systems
2531 Previous Studies at the INL
The TALSPEAK process is known to be relatively resistant to radiation effects
both alpha and gamma radiation when compared to the PUREX and SANEX
processes33
The use of lactic acid buffer has been shown to reduce the degradation of
DTPA by radiolysis34
although the chemistry of the lactic acidlactate ion interaction
with the system is still not clear α radiolysis experiments were carried out at INL by the
Martin group initially on lactic acid and then on an L-alanine system in order to
determine the temperature-dependent rate constants of the reaction of the hydroxyl
radical (middotOH) with the buffers at pH 3 (Figure 219) It is thought that at this pH
oxidising reactions are dominant since dissolved O2 in the solution would remove most
40
45
50
55
60
65
70
75
80
570 580 590 600 610 620 630 640
Emis
sio
n In
ten
sity
(au
) Tho
usa
nd
s
Wavelength (nm)
[Cm(DTPA)]2-
[Cm(DTPA)]2- + Ala
101
of the hydrated electrons (e-(aq)) and middotH radicals caused by radiolysis leaving middotOH
radicals present in solution The rate constants were measured using Linear Accelerator
(LINAC) electron pulse radiolysis
Measurements showed that the reaction rate of the middotOH radical with L-alanine is
slower than with lactic acid suggesting that a modified version of the TALSPEAK
process using amino acids would be more resistant to radiolysis
Figure 219 Graph illustrating the rates of reaction of the middotOH radical with L-
alanine compared to lactic acid and the lactate ion 35
Further studies at the INL were carried out on the L-alanine to measure the
effect of γ-radiation on the separation of Eu3+
from Am3+
These studies were carried
out by varying the γ radiation dose (5 ndash 50 kGy) the pH (2 ndash 3) and the L-alanine
concentration (05 ndash 15 M) The extraction of Ln3+
ions was found not to be affected by
increasing the dose to both phases and the extraction of Am3+
was found to increase
only slightly as the dose was increased (Figure 220) The results show that the effect of
γ-radiation on the separation factors is negligible with increasing dose (Table 23)
32 33 34 3517
18
19
20
21
Alanine (pH 30)
Lactate ion (pH 60)
Lactic acid (pH 10)
ToC k M
-1 s
-1Error
1046 59E7 49E6
306 849E7 421E6
305 832E7 419E6
402 102E8 816E6
Arrhenius OH amp lactate at pH 30
Int ln(A) = 2353 plusmn 115
Ea = 1333 plusmn 289 kJ mol-1
R2 = 0990
ln (
kM
-1 s
-1)
103Temp (K)
102
Figure 220 Distribution ratios for Ln3+
and Am3+
in the presence of L-alanine
at 05 M pH 2 at different doses of γ-radiation36
Table 23 Separation factors for Eu3+
Am3+
in the presence of L-alanine at 05 M under
TALSPEAK conditions when subjected to different doses of γ-radiationError Bookmark
not defined
Separation Factor EuAm
5 kGy 10 kGy 50 kGy 100 kGy
pH 2 5620 5519 5132 5103
pH 3 1595 1653 1589 1252
2532 Irradiation Studies using Amino Acid Buffers
The [Eu(DTPA)]2-
systems at pH 36 were irradiated with γ radiation using a
60Co irradiator at the Dalton Cumbrian Facility to determine the effect of radiation on a
range of amino acid buffers
103
Figure 221 Emission spectra of Eu3+
in D2O at pD 36 with and without the presence
of amino acidslactate excited at 395 nm before 5 kGy γ-irradiation
Figure 222 Emission spectra of Eu3+
in D2O at pD 36 with and without the presence
of amino acidslactate excited at 395 nm after 5 kGy γ-irradiation
The emission intensity of the irradiated samples (Figure 222) was lower than
before irradiation (Figure 221) which is likely to be due to quenching effects from
radicals produced by degradation of the solvent However the spectral profiles remain
0
50
100
150
200
250
550 600 650 700
Emis
sio
n In
ten
sity
(au
) Th
ou
san
ds
Wavelength (nm)
EuDTPA
EuDTPA-Lactate
EuDTPA-Gly
EuDTPA-Ala
EuDTPA-Ser
0
20
40
60
80
100
120
140
550 600 650 700
Emis
sio
n In
ten
sity
(au
) Th
ou
san
ds
Wavelength (nm)
EuDTPA
EuDTPA-Lactate
EuDTPA-Gly
EuDTPA-Ala
EuDTPA-Ser
104
the same and still resemble that of [Eu(DTPA)]2-
and t-tests showed that there was no
significant difference between the spectra of each of the buffers
The luminescence lifetimes were also measured for samples before and after
irradiation and before and after extraction into an organic phase (02 M HDEHP in
dodecane) (Table 24)
Table 24 Luminescence lifetimes for aqueous and organic phases for
[Eu(DTPA)]2-
systems before and after irradiation at pH 36 Estimated error on
lifetimes = plusmn 10
Table 25 Luminescence lifetimes and q values for [Eu(DTPA)]2-
systems before and
after irradiation at pH 36 Estimated error on lifetimes = plusmn 10 and on q = plusmn 02
τ of aqueous
phase
before
irradiation
(ms)
τ of aqueous
phase
after
irradiation
(ms)
τ of
organic
phase
before
irradiation
(ms)
τ of
organic
phase
after
irradiation
(ms)
Eu DTPA 063 066 222 262
Eu DTPA Lactate 063 063 241 251
Eu DTPA Gly 065 064 247 249
Eu DTPA Ala 065 065 211 238
Eu DTPA Ser 065 062 260 251
τ of
aqueous
phase
before
irr [H2O]
(ms)
τ of
aqueous
phase
after
irr[H2O]
(ms)
τ of
aqueous
phase
before irr
[D2O] (ms)
τ of
aqueous
phase
after irr
[D2O] (ms)
q
before
irr
q after
irr
Eu DTPA 063 066 230 227 11 10
Eu DTPA
Lactate
063 063 216 210 10 10
Eu DTPA
Gly
065 064 203 208 10 10
Eu DTPA
Ala
065 065 209 211 10 10
Eu DTPA
Ser
065 062 208 206 10 10
105
There was negligible change in luminescence lifetime before and after
irradiation for both aqueous and organic sample sets There was also no change in
hydration number q before and after irradiation of the aqueous phase (Table 25)
These data along with the consistent profiles of the emission spectra is analogous with
the radiolysis data from the INL and shows that the amino acid buffers glycine alanine
and serine are relatively resistant to -radiolysis
254 Buffer Interaction Summary
The potential of using amino acids as a combined buffer and soft donor was
initially investigated by considering the interaction of the buffers glycine L-alanine L-
serine L-phenylalanine and lactate (for comparison) with Eu3+
and [Eu(DTPA)]2-
systems It was found by 1H NMR and luminescence spectroscopies that amino acids
and lactate do not form stable complexes with either the free metal ion or the metal-
DTPA complex and that the buffers may be in fast exchange with surrounding solvent
molecules Luminescence studies on L-phenylalanine showed that this amino acid does
not bind to the metal ion as there was no sensitised emission from Tb3+
ion when
excited into the phenyl chromophore of the amino acid when the two components were
in solution Emission spectra of Eu3+
and Cm3+
aqua ions and their corresponding
DTPA complexes showed no change (no peak splitting or shifting) upon the addition of
amino acidslactate
The number of water molecules in the inner hydration sphere (q) of Eu3+
was
reduced from 9 to ~6 when buffers were added to the aqua ion in solution suggesting
that the amino acids are interacting with the metal ion but are likely to be in fast
exchange with surrounding solvent molecules There was no change in q when buffers
were added to metal-DTPA complexes in solution for Eu3+
or Cm3+
Radiolysis studies were carried out on lactate and amino acid buffered
[Eu(DTPA)]2-
systems and it was found that the systems are relatively resistant to γ-
radiation when exposed to 5 kGy This is consistent with previous work conducted by
the INL showing that separation systems using L-alanine as a buffer are more resistant
to radiolysis than the original TALSPEAK process using lactate
106
1 G Muumlhlbachovaacute Rostlinnaaacute Vyacuteroba 2002 48 12 536ndash542
2 JSF Swaran and V Pachauri Int J Environ Res Public Health 2010 7 7 2745-
2788
3 M Regueiro-Figueroa and C Platas-Iglesias J Phys Chem A 2015 119 6436-
6445
4 N Mignet Q de Chermont T Randrianarivelo J Seguin C Richard M Bessodes
and D Scherman Eur Biophys J 2006 35 155-161
5 CL Davies and A-K Duhme-Klair Tetrahedron Lett 2011 52 4515-4517
6 G Moreau L Burai L Helm J Purans and AE Merbach J Phys Chem A 2003
107 758-769
7 KA Deal IA Davis S Mirzadeh SJ Kennel and MW Brechbiel J Med Chem
1999 42 15 2988ndash2992
8 S Beacutenazeth J Purans M-C Chalbot MK Nguyen-van-Duong L Nicolas K
Keller amp A Gaudemer Inorg Chem 1998 37 3667-3674
9 A Delle Site RD Baybarz J Inorg Nucl Chem 1969 31 2201
10 IA Lebedev VT Filimonov AB Shalinets GN Yakovlev Sov Radiochem
1968 10 94
11 I Bayat KFK
Berichte-1291 Karlsruhe Germany 1970
12 P Thakur JL Conca CJ Dodge AJ Francis GR Choppin Radiochim Acta
2013 101 221
13 G Tian LR Martin and LRao Inorg Chem 2015 54 1232-1239
14 S Leguay T Vercouter S Topin J Aupais D Guillaumont M Miguirditchian P
Moisy and C Le Naour Inorg Chem 2012 51 12638-12649
15 M Nazarov and D Young Noh New Generation of Europium and Terbium
Activated Phosphors 2011 247
16 K N Shinde S J Dhoble H C Swart and K Park Phosphate Phosphors for Solid
State Lighting Springer Series in Materials Science Springer 2012 174 41-59
17 K S Wong T Sun X-L Liu J Pei and W Huang Thin Solid Films 2002 417 85-
89
18 WD Horrocks and DR Sudnick J Am Chem Soc 1979 101 334
19 A Beeby IM Clarkson RS Dickins S Faulkner D Parker L Royle AS de
Sousa JAG Williams and M Woods J Chem Soc Perkin Trans 2 1999 493-504
20 RM Supkowski and WD Horrocks Inorg Chim Acta 2002 340 44-48
107
21 CF Geraldes AD Sherry WP Cacheris KT Kuan RD 3rd Brown SH
Koenig and M Spiller Magn Reson Med 1988 8 2 191-9
22 E Csajboacutek I Baacutenyai and E Bruumlcher Dalton Trans 2004 14 2152-2156
23 JJ Howland and M Calvin J Chem Phys 1950 83 239
24 J E Sansonetti and W C Martin Handbook of Basic Atomic Spectroscopic Data
httpphysicsnistgovPhysRefDataHandbookTables National Institute of Science
and Technology USA 2005
25 T Kimura and G R Choppin J Alloys Compounds 1994 213 313
26 T Kimura Y Kato H Takeishi and G R Choppin J Alloys Compounds 1998
271273 719
27 T L Griffiths Investigations of Ternary Complexes Relevant to the Nuclear Fuel
Cycle 2011 The University of Manchester PhD Thesis
28 G Tian LR Martin and L Rao Inorg Chem 2010 49 10598-10605
29 K L Nash D Brigham T C Shehee and A Martin Dalton Trans 2012 41
14547-14556
30 CJ Leggett G Liu and MP Jensen Solv Extraction and Ion Exchange 2010 28
313-334
31 A Miličević and N Raos Acta Chim Slov 2014 61 904-908
32 VV Nikonorov J Anal Chem 2010 65 4 359-365
33 D Magnusson B Christiansen R Malmbeck and JP Glatz Radiochim Acta 2009
97 9 497-502
34 B Weaver and T A Kappelmann Talspeak A new method of separating americium
and curium from the lanthanides by extraction from an aqueous solution of an
aminopolyacetic acid complex with a monoacidic organophosphate or phosphonate
Oak Ridge National Laboratory 1964 1-60
35 LR Martin S P Mezyk and BJ Mincher J Phys Chem A 2009 113 141-145
36 Dr Leigh Martin Idaho National Laboratory unpublished results
108
3 SOLVENT EXTRACTION AND OPTIMISATION STUDIES WITH AMINO
ACID BUFFERS
As discussed in Chapter 2 the potential of using amino acids as a combined
buffer and soft donor to replace the lactate buffer and holdback reagent DTPA
(diethylenetriaminepentaacetic acid) in the TALSPEAK process (Trivalent Actinide
Lanthanide Separation by Phosphorus reagent Extraction from Aqueous Complexation)
was investigated Initial complexation studies by 1H NMR and luminescence
spectroscopies showed that amino acids do not form stable complexes with actinide or
lanthanide ions or AnLn-DTPA complexes in aqueous solution and that like lactate
they are in fast exchange with surrounding water molecules Separation studies were
carried out by our collaborators at the Idaho National Lab (Travis Grimes Richard
Tillotson and Leigh Martin) to determine whether amino acids could be used as buffers
or as combined bufferssoft-donors to facilitate Ln3+
MA3+
separation A summary of
this work can be found below in Section 31 Their initial studies were used as the basis
for the work conducted as part of this research project (Sections 32 and 33)
31 Previous work at the INL1
311 L-alanine Studies
3111 pH Studies on L-alanine
L-alanine was initially chosen as a potential replacement for lactic acid as a
buffer as the two molecules differ only by the α-group (α-amino on L-alanine compared
to α-hydroxy group on lactic acid) The pKa values of the compounds are 24-26 for L-
alanine and 36-38 for lactic acid depending on the background electrolyte Studies
carried out on the L-alanine found that the separation factors were in fact reduced
compared to the traditional TALSPEAK method when L-alanine was used as a buffer at
pH 2 and pH 3 in place of lactic acid The separation factors were generally lower as the
distribution ratios for Am3+
(DAm) were significantly increased (2 orders of magnitude
higher) when L-alanine was used at pH 3 (DAm 012) and pH 2 (DAm 038-047)
compared to lactic acid at pH 3 (DAm 0009) However the studies carried out at pH 2
resembled a typical TALSPEAK curve and gave overall the best separation of
lanthanides over Am3+
as can be seen in Figure 31 Although separation occurs in the
L-alanine system at pH 3 the separation is better at pH 2 At pH 3 it can be seen that
separation is decreased for the heavier lanthanides This is due to slow phase-transfer
kinetics previously reported by Weaver and Kappelmann2 and Kolarik
3 A pH 1 system
109
does not allow separation of the earlier lanthanides from americium The distribution
ratios for lanthanides in a typical TALSPEAK system can be seen in Figure 32 for
comparison
086 088 09 092 094 096 098 1
10-2
10-1
100
101
102
5x10²
086 088 09 092 094 096 098 1
10-2
10-1
100
101
102
5x10²
pH 1
pH 2
pH 3
Am pH 1
Am pH 2
Am pH 3
[Alanine] = 05 M
[DTPA] = 0050 M
[HDEHP] = 02 M
Organic Diluent
Dodecane
DM
1r Aring
DM
15 M Alanine
10 M Alanine
05 M Alanine
Am 15 M Alanine
Am 10 M Alanine
Am 05 M Alanine
[DTPA] = 0050 M
[HDEHP] = 02 M
Organic Diluent
Dodecane
pH 2
1r Aring
Figure 31 The effect of pH on an L-alanine-buffered TALSPEAK system
Figure 32 Distribution ratios of Ln3+
Y3+
in a TALSPEAK system 1 mM LnY3+
1 M
lactate 005 M DTPA pH 7 extracted using 05 M HDEHP in 14-DIPB4
110
3112 Concentration Effects
The effect of the concentration of L-alanine was also considered and it was
found that the effect on the trend of separation factors across the lanthanide series was
the same as for lactate and the changes were negligible as can be seen from Figure 33
Slower extraction rates were observed for the heaviest lanthanides at lower buffer
concentrations (05 M than 10 or 15 M) for both L-alanine and lactic acid Since it was
found that there was no benefit to changing the L-alanine buffer concentration further
studies were carried out to investigate the potential of using the amino acid to carry out
the process at the lower pH of 2 as although the separation factors are lower than in
lactic acid buffered systems the values are still high enough to give sufficient
separation (see Table 31)
086 088 09 092 094 096 098 1
10-2
10-1
100
101
102
5x10²
086 088 09 092 094 096 098 1
10-2
10-1
100
101
102
5x10²
pH 1
pH 2
pH 3
Am pH 1
Am pH 2
Am pH 3
[Alanine] = 05 M
[DTPA] = 0050 M
[HDEHP] = 02 M
Organic Diluent
Dodecane
DM
1r Aring
DM
15 M Alanine
10 M Alanine
05 M Alanine
Am 15 M Alanine
Am 10 M Alanine
Am 05 M Alanine
[DTPA] = 0050 M
[HDEHP] = 02 M
Organic Diluent
Dodecane
pH 2
1r Aring
Figure 33 The effect of buffer concentration on an L-alanine-buffered TALSPEAK
system
111
Table 31 Distribution ratios and separation factors for a number of L-alanine buffered
TALSPEAK systems as pH and buffer concentration are varied compared to a
traditional lactic acid system
Conc pH DAm Separation Factors (SF)
(M) LaAm CeAm NdAm EuAm
L-Alanine 15 2 038 plusmn 001 165 plusmn 5 61 plusmn 1 28 plusmn 1 64 plusmn 1
L-Alanine 10 2 039 plusmn 002 176 plusmn 10 54 plusmn 3 24 plusmn 1 55 plusmn 3
L-Alanine 05 2 047 plusmn 006 165 plusmn 24 64 plusmn 3 28 plusmn 8 66 plusmn 8
L-Alanine 05 3 012 plusmn 001 147 plusmn 17 45 plusmn 5 9 plusmn 1 25 plusmn 3
Lactic
Acid
10 3 0009 380 140 mdash 91
3113 Studies at pH 2
Further investigations at pH 2 into the potential of using amino acids as a
combined buffer and soft donor showed that no separation occurs when DTPA is not
present indicating that amino acids do not act as holdback reagents in their own right
Previous work by Tanner and Choppin5 showed that at low pH the glycine zwitterion
forms inner-sphere monodentate complexes with M3+
ions including Ln3+
and An3+
Aziz et al67
later showed the same is true for L-alanine with Eu3+
and Am3+
at pH 36
whereby weak monodentate complexes form Krishnan and Plane8 showed that glycine
complexes metal ions solely through the COO- group on the amino acid No co-
ordination through the amino group has been reported
312 Other Amino Acids
Other amino acids L-arginine L-histidine and L-methionine were also
considered and further investigations were carried out (Figure 34) These three amino
acids are larger and more hydrophobic than L-alanine and are therefore less soluble at
higher concentrations (lt05 M) at pH values greater than pH 1 Again no separation
was observed when the amino acids were used without DTPA With Na5DTPA it was
found that the DAm values for Arg and Met were lower than those for L-alanine leading
to an increase in separation factor possibly due to co-ordination of the Am3+
ion with
soft donor atoms on the amino acids (Table 32) The DAm in the His system however
was similar to the Ala system suggesting that there is no coordination of the metal ion
112
with the α-amine or imidazole groups It is not known if the amino acids are co-
ordinating or chelating through soft donor atoms to the metal ion Further studies are
currently being carried out at the INL to determine stability constants and to use time-
resolved fluorescence to probe inner co-ordination sphere changes in order to
investigate the interactions of amino acids with the trivalent metal ions
Figure 34 Chemical structures of L-arginine (top) L-histidine (bottom left)
and L-methionine (bottom right)
Table 32 Distribution ratios and separation factors for a number of amino acid
buffered TALSPEAK systems
When extended further studies on these amino acids found that the kinetic
issues which affected separation of the heavier lanthanides using L-alanine at pH 3
(Figure 31) were also affecting separation with L-arginine at pH 2 as well as pH 3
Conc pH pKa DAm3+ Separation Factors (SF)
(M) LaAm CeAm NdAm EuAm
L- Arg 05 2 182 027 plusmn 001 184 plusmn 26 40 plusmn 3 27 plusmn 2 72 plusmn 4
L- His 05 2 180 040 plusmn 001 208 plusmn 8 95 plusmn 3 24 plusmn 5 83 plusmn 1
L-Met 05 2 213 017 plusmn 001 271 plusmn 18 97 plusmn 3 26 plusmn 1 60 plusmn 3
113
suggesting that longer chain amino acids may not suitable replacements for lactate
Based on these data the most promising replacement buffer is L-alanine at pH 2
32 L-alanine System Optimisation at pH 2
Following from the initial work carried out by Grimes et al at the INL further
studies were begun for this research project The speciation of DTPA was modelled
using HySS (Hyperquad Simulation and Speciation) software using literature pKa
values (Figure 35)9 At pH 1 the dominant DTPA species present in solution are
H7DTPA2+
and H6DTPA+ which both repel MA
3+ and Ln
3+ ions and so the species are
ineffective as holdback reagents At pH 2 the dominant species are H5DTPA (65 )
H4DTPA- (24 ) and H3DTPA
2- (11 ) The species with the greatest electrostatic
attraction under these conditions is to MA3+
Ln3+
ions is H3DTPA2-
At pH 3 a much
higher proportion of this species is present (87 ) than at pH 2 making pH 2 less
favourable for effective separation However the conditions can be optimised in order
to maximise separation by changing the concentrations of extractant and holdback
reagent For industrial purposes conducting the process at a lower pH is preferable as it
is easier for process operators to control higher acid concentrations Optimisation
studies using L-alanine as a buffer at pH 2 were carried out during a placement at the
INL
114
Figure 35 DTPA speciation as a function of pH modelled using HySS sofware using
literature pKa values
321 [Na5DTPA] Dependence
The concentration of Na5DTPA used in traditional TALSPEAK systems is 005
M Initial optimisation studies were carried out using a [Na5DTPA] range of 006 M to
010 M in increments of 001 M The L-alanine concentration was 05 M
115
Figure 36 [Na5DTPA] dependence of L-alanine system (05 M) at pH 2
Experiments were carried out using traditional TALSPEAK methods at pH 2
The extractant was HDEHP (02 M) in dodecane Separations were conducted to
measure the separation of Eu3+
over Am3+
A graph of log[DTPA] vs logDEuAm can be
seen in Figure 36 The slope of the line for Am3+
is approximately -1 indicating that
the metal ions are each bound to 1 DTPA5-
molecule The R2 value is close to 1 and the
errors are small The slope of the line for Eu3+
is also approximately -1 Separation
factors for the data were between 66 and 80 and the DAm were between 026 and 042
which are still 2 orders of magnitude higher than that for a traditional TALSPEAK
system (DAm = 0009) The Na5DTPA concentration was therefore increased further in
order to bring the DAm lower to prevent as much Am3+
being partitioned into the organic
phase
y = -09383x - 15277 Rsup2 = 09854
y = -11258x + 01381 Rsup2 = 09289
-10
-05
00
05
10
15
20
-125 -12 -115 -11 -105 -1 -095
log
DEu
Am
log [Na5DTPA]
Am Extraction
Eu Extraction
116
Figure 37 Eu3+
Am3+
separation for [Na5DTPA] dependence of L-alanine system (05
M) at pH 2
Experiments were carried out as before but using Na5DTPA concentrations of
02 M 03 M 04 M and 05 M A graph of log[DTPA] vs logDEuAm was plotted
(Figure 37) At 05 M [Na5DTPA] H5DTPA began to precipitate out due to the low pH
used and so data for this concentration is unreliable and was not plotted on the graph
The data is good as the R2 values are close to 1 and the errors are small However the
slope is not exactly -1 (slope = -080 for Eu and -085 for Am) this is likely to be due to
competition and activity effects from the increased [Na5DTPA] and therefore increased
Na+ concentration Separation factors for the data were around the same (between 65
and 72) but the DAm values decreased to 008 for the 04 M Na5DTPA meaning much
less Am3+
is being partitioned into the organic phase
322 [HDEHP] Dependence
Experiments were carried out as for the [Na5DTPA] dependence but using
HDEHP extractant concentrations of 04 M 06 M 08 M and 10 M in dodecane for
each of the Na5DTPA concentrations 02 M 03 M and 04 M Graphs of log[DTPA] vs
logDEuAm were plotted (Figures 38-310)
y = -08451x - 14757 Rsup2 = 09936
y = -07958x + 03998 Rsup2 = 0998
-15
-10
-05
00
05
10
15
-11 -1 -09 -08 -07 -06 -05 -04 -03
log
DEu
Am
log [Na5DTPA]
Am Extraction Eu Extraction
117
Figure 38 Eu3+
Am3+
separation for [HDEHP] dependence of L-alanine system (05
M) at pH 2 using 02 M Na5DTPA
Figure 39 Eu3+
Am3+
separation for [HDEHP] dependence of L-alanine system (05
M) at pH 2 using 03 M Na5DTPA
y = 13522x + 02972 Rsup2 = 09283
y = 09682x + 19794 Rsup2 = 09561
-05
00
05
10
15
20
25
-05 -04 -03 -02 -01 0 01
log
DEu
Am
log [HDEHP]
Am Extraction
Eu Extraction
y = 14702x + 00193 Rsup2 = 09981
y = 11892x + 17129 Rsup2 = 09713
-10
-05
00
05
10
15
20
-05 -04 -03 -02 -01 0 01
log
DEu
Am
log [HDEHP]
Am Extraction
Eu Extraction
118
Figure 310 Eu3+
Am3+
separation for [HDEHP] dependence of L-alanine system (05
M) at pH 2 using 04 M Na5DTPA
The R2 values for these data are close to 1 and the errors are generally small
making the data good quality The slope of each data set should be +3 indicating that
the metal ions are each bound to 3 HDEHP molecules in the organic phase1011
However the slopes are not quite +3 this is likely to be due to activity effects and
competition from the increased Na+ concentration as a result of increasing the
Na5DTPA concentration
323 L-alanine Optimisation Summary
The results of the optimisation of a TALSPEAK system using 05 M L-alanine
as a buffer are summarised in Tables 33 and 34
Table 33 Separation factors for L-alanine optimisation studies
[HDEHP] (M)
[Na5DTPA]
(M)
02 04 06 08 10
02 72 plusmn 3 70 plusmn 6 43 plusmn 6 61 plusmn 9 49 plusmn 2
03 70 plusmn 1 62 plusmn 7 59 plusmn 9 56 plusmn 5 46 plusmn 8
04 71 plusmn 5 60 plusmn 4 74 plusmn 4 70 plusmn 7 67 plusmn 1
y = 11522x - 00047 Rsup2 = 09867
y = 12575x + 18424 Rsup2 = 09976
-10
-05
00
05
10
15
20
25
-05 -04 -03 -02 -01 0 01
log
DEu
Am
log [HDEHP]
Am Extraction
Eu Extraction
119
Table 34 DAm values for L-alanine optimisation studies Error plusmn 001
[HDEHP] (M)
[Na5DTPA]
(M)
02 04 06 08 10
02 012 053 121 126 203
03 010 027 050 077 102
04 008 036 051 077 102
Table 33 shows the separation factors are generally similar for each condition
and there is no particular set of conditions that gives the highest value although the
better separation factors tend to be achieved at the lower extractant concentrations The
DAm values (Table 34) are best at the lowest extractant concentrations and highest
holdback concentration as would be expected The best set of conditions is 04 M
Na5DTPA and 02 M HDEHP with the best DAm achievable being 008 and best SF 71 plusmn
5 Despite optimisation the L-alanine system is still not as efficient as the traditional
lactate system as the distribution of Am3+
is one order of magnitude higher and the
separation is lower however the L-alanine system allows the separation to be carried
out at a lower pH which is beneficial for an industrial process
33 Other Amino Acid Studies
331 Initial Tests with Other Amino Acids
Several initial tests were carried out using other amino acids as buffers It had
been found previously that L-arginine at pH 2 gave poor separation of the heavier
lanthanides (Section 312) so further studies were carried out using 05 M L-methionine
and L-histidine to see how effective these amino acids could be as potential buffers
Results from initial tests using TALSEPAK conditions at varied pH values can be seen
in Table 35
120
Table 35 Separation factors and DAmEu values for traditional TALSPEAK systems
with different buffers at varying pH values
From Table 35 it can be seen that L-histidine gives good separation data at pH
3 The DAm of 007 is comparable to the optimised L-alanine system in Section 32 and
the separation factor is high at 99 comparable to the original lactate TALSPEAK
system Further investigations were subsequently carried out in order to determine if the
same kinetic issues arise with L-histidine as with L-arginine and L-alanine L-
methionine was not investigated further as the separation data at pH 2 was not very
promising and it is insoluble at 05 M at pH 3
332 Studies with L-Histidine
The distribution ratios of La-Ho were determined by ICP-MS for a 05 M L-
histidine system at pH 2 and pH 3 (Figure 311)
Buffer pH DAm
DEu
SF
Lactic Acid 3 0009 0819 91
L-Methionine 1 547 6017 11
2 018 1016 57
L-Histidine 1 468 9579 20
2 053 4463 84
3 007 660 99
121
Figure 311 Distribution ratios of La3+
-Ho3+
and Am3+
with 05 M L-histidine buffer at
pH 2 and pH 3
The distribution ratios for the L-histidine system at pH 2 generally resemble
those on a traditional TALSPEAK curve at pH 3 with the D values decreasing towards
neodymium and then increasing with the later lanthanides However the pH 3 L-
histidine system exhibits decreasing D values with the heavier lanthanide elements
demonstrating the same kinetic problems as the L-alanine and L-arginine systems at
higher pH
34 Summary of Separations with Amino Acid Buffers
Previous work carried out at the Idaho National Laboratory by Grimes showed
that amino acids do not act as holdback reagents in their own right and no separation of
Ln3+
Am3+
is achieved when they are used without Na5DTPA in solution However
investigations showed that when used alongside Na5DTPA good separation can be
attained when using 05 M L-alanine at pH 2 pH 2 is less favourable than pH 3 for
separations using DTPA as more protonated forms of the molecule are present in
solution and the holdback reagent is not able to bind as strongly to metal ions However
optimisation of the system in order to maximise the separation whilst keeping Am3+
partitioning to a minimum by changing the concentrations of holdback reagent and
extractant proved to be successful The best conditions were found to be 04 M
Na5DTPA and 02 M HDEHP giving a separation factor of 71 plusmn 5 with a DAm value of
008 Although this separation is not as good as a traditional lactate TALSPEAK
001
01
1
10
56 57 58 59 60 61 62 63 64 65 66 67 68
Dis
trib
uti
on
Rat
io
Atomic Number
His pH 2
His pH 3
Am pH 2
Am pH 3
122
system the use of L-alanine as a buffer allows the process to be carried out at pH 2
which is a much more preferable pH for industry
When investigations were carried out using other amino acids at varying pH
values it was found that L-methionine was too poorly soluble at pH 3 and did not give
very good separation data at pH 2 L-arginine was found to have kinetic issues at pH 2
and 3 giving poor separation of the heavier lanthanides However L-histidine gave
good separation data at pH 3 with a SFEuAm of 99 comparable to that of the original
TALSPEAK process and a DAm of 007 comparable to the optimised alanine system
Studies of the lanthanides La-Ho using L-histidine at pH 3 however showed that the
same kinetic problems arise as for L-arginine and L-alanine as the DLn decreases for
later lanthanides indicating that L-histidine is no more promising as a buffer than the
other amino acids
123
1 TS Grimes RD Tillotson and LR Martin Solv Extraction and Ion Exchange
2014 32 378-390
2 B Weaver and T A Kappelmann Talspeak A new method of separating americium
and curium from the lanthanides by extraction from an aqueous solution of an
aminopolyacetic acid complex with a monoacidic organophosphate or phosphonate
Oak Ridge National Laboratory 1964 1-60
3 Z Kolarik G Koch and W Kuhn J Inorg Nucl Chem 1974 36 905-909
4 KL Nash Solv Extraction and Ion Exchange 2015 33 1-55
5 S P Tanner and G R Choppin Inorg Chem 1968 7 2046-2048
6 A Aziz and S J Lyle J Inorg Nucl Chem 1971 33 3407-3408
7 A Aziz S J Lyle and J E Newbery J Inorg Nucl Chem 1971 33 1757-1764
8 K Krishnan and R Plane Inorg Chem 1967 6 55-60
9 NJ Bridges LE Roy and CL Klug Computation and Spectroscopic Investigation of
the DTPA Complexes US Department of Energy 2012
10 TS Grimes G Tian L Rao and KL Nash Inorg Chem 2012 51 6299-6307
11 G Lumetta AV Gelis and GF Vandegrift Solv Extraction and Ion Exchange
2010 28 3 287-312
124
4 STUDIES USING L-GLUTATHIONE AS A BUFFER IN A TALSPEAK
SYSTEM
The TALSPEAK process (Trivalent Actinide Lanthanide Separation by
Phosphorus reagent Extraction from Aqueous Complexation) which is currently being
developed in the USA for separation of minor actinides (MA) from lanthanides (Ln)
from nuclear waste uses lactic acid as a buffer (pH 36) and the chelator DTPA
(diethylenetriaminepentaacetic acid) as a holdback reagent to retain Am3+
in an aqueous
phase allowing Ln3+
to be extracted by phosphate extractant HDEHP (di-
(2ethylhexyl)phosphoric acid) into an organic phase Studies have been carried out on
the potential of using amino acids as a combined buffer and soft-donor in order to
simplify the TALSPEAK process (Chapters 2 amp 3) however it was found that amino
acids do not act as holdback reagents in their own right although they have been shown
to allow the pH of the process to be lowered to pH 2 which is more favourable for an
industrial process
Although amino acids have been shown not to act as holdback reagents and are
therefore unable to replace lactic acid and DTPA5-
as a combined buffer and soft donor
based on the data obtained from the individual amino acid studies it was considered
that larger ligands with more soft donors such as short-chain peptides may be more
suitable A range of potential molecules were considered including a selection of simple
peptides including eisenin (pGlu-Gln-Ala-OH) and norophthalmic acid (γ-Glu-Ala-
Gly) (Figure 41) and B vitamins including biotin (B7) and folic acid (B9) (Figure
42)
125
Figure 41 Molecular structures of eisenin (top) and norophthalmic acid
(bottom)
Figure 42 Molecular structures of biotinvitamin B7 (top) and folic acid
vitamin B9 (bottom)
The tripeptide L-glutathione (reduced form) was chosen for further study as it
has a fairly simple structure contains several soft-donor atoms and its amino acid
constituents showed promise for buffer activity It is also relatively cheap and easy to
procure L-glutathione (GSH) consists of a chain comprising three amino acids L-
cysteinemdashL-glutamic acidmdashglycine (Figure 43)
126
Figure 43 Molecular structure of L-glutathione (reduced form)
Glutathione is naturally produced in all cells in the human body It is an
antioxidant with numerous functions most of which are related to the ability of its
sulphur atom to scavenge free radicals or donate electrons GSH regulates cell growth
and division by absorbing oxide radicals present in the cell which would prevent cell
growth repairs DNA by donating electrons removed from DNA strands by free radicals
aiding in DNA synthesis assists in protein synthesis by reacting (sulphur atom) with
undesirable S-S bonds to break them and allow for the correct pairing metabolises
toxins by co-ordinating with them through the S atom making them more water soluble
for excretion and recycles other antioxidants (such as vitamins C and E) by donating
electrons1 As a cysteine-containing tripeptide it is also a provider of the amino acid
cysteine in the body and is involved in amino acid transport in and out of cells
Properties of glutathione which are of particular interest to MA3+
Ln3+
separation
studies are its ability to conjugate to heavy metals (to allow them to be removed from
the body like DTPA23
and its resistance to radiation (due to its ability to scavenge free
radicals) which decreases radiation damage in the body45
but also would be beneficial
for spent nuclear fuel (SNF) reprocessing where free radicals and high levels of
radiation are present
As is the case for lactate6 and amino acid
7 complexes of lanthanides stability
constants of Ln-GSH complexes increase across the lanthanide series from La-Lu as the
Lewis acidity of the metal ions increases Log β values range from 556 for La3+
to 751
for Ho3+
with GSH indicating slightly higher stability of Ln-GSH complexes than of
lactate and amino acid complexes of Ln3+
with log β = 633 for Ln(lactate)3 formation
and values ranging from 582-665 for L-alanine with Ln3+
when Ln = La-Sm (Section
242) Garg et al also reported that the stability of Ln-GSH complexes was found to
decrease as ionic strength increases and that the optimum stability of the complexes was
in solutions within the pH range of 340-348 (77 complex formation)8
127
Solvent extraction experiments were initially performed in order to investigate
the separation ability of GSH with Am3+
and Eu3+
and conditions were then optimised
in order to achieve maximum separation Interaction of the buffer with various
components in solution including lanthanide ions was probed using various techniques
including luminescence spectroscopy which was also used in determining the
susceptibility of the buffer to radiolysis and ICP-MS
41 Solvent Extraction and Separation using GSH
411 [L-Glutathione] and pH Dependence
4111 [GSH] Dependence without Na5DTPA at pH 4
L-glutathione has pKa values of 212 (COOH) 359 (COOH) 875 (NH2) and
965 (SH)9 and so with two pKa values below 4 and optimum stability at pH 34 initial
studies were carried out at pH 4 as it would be expected that the glutathione would
complex to metal ions most effectively around this pH and be more likely to act as a
holdback reagent Although pH 4 is a higher pH than that used currently in the
TALSPEAK process and therefore less desirable if proven to improve the process it
may still have potential if satisfactory separation is achieved
Initial studies using L-glutathione as a buffer without the presence of Na5DTPA
in the system showed that as with amino acids GSH is ineffective as a holdback
reagent on its own as there was no separation observed between Eu3+
and Am3+
Over a
GSH concentration range of 01 M to 05 M the separation factors ranged from 038-
585 plusmn 108 Glutathione is insoluble at concentrations above 05 M at pH 4 at room
temperature
4112 [GSH] and pH Dependence with Na5DTPA
Further experiments were then carried out using GSH as a buffer in the presence
of Na5DTPA in order to see if there was any improvement in the separation with this
buffer over the traditional lactic acid buffer The experiments used 005 M Na5DTPA
and 01-05 M GSH over a pH range of 2-4 under TALSPEAK conditions (02 M
HDEHP in n-dodecane)
128
Figure 44 Eu3+
Am3+
distribution for [GSH] dependence with 005 M Na5DTPA at pH
2 extracted using 02 M HDEHP in dodecane Results were averaged from 3 repeat
tests
Figure 45 Eu3+
Am3+
distribution for [GSH] dependence with 005 M Na5DTPA at pH
3 extracted using 02 M HDEHP in dodecane Results were averaged from 3 repeat
tests
Plots of log[GSH] vs logDEuAm for systems at pH 2 and 3 are displayed in
Figures 44 and 45 The graphs show that increasing the concentration of GSH does not
affect the separation of Eu3+
over Am3+
since the distribution ratios for each remain
-02
0
02
04
06
08
1
12
14
16
18
-11 -09 -07 -05 -03
log
DEu
Am
log [GSH]
Am Extraction
Eu Extraction
-1
-08
-06
-04
-02
0
02
04
06
08
1
12
14
-11 -09 -07 -05 -03
log
DEu
Am
log [GSH]
Am Extraction
Eu Extraction
129
relatively constant At pH 2 the average DAm is 103 and DEu is 3013 giving an
average separation factor of 29 plusmn 8 At pH 3 the extraction of both metals is lower with
DAm averaging at 018 and DEu at 1423 giving an average separation of 79 plusmn 13 Both
data sets for pH2 and pH 3 show a slope of almost zero suggesting that the metal ions
are not bound to any GSH molecules which would be consistent with the L-glutathione
just acting as a buffer These separation factors are lower than for the original
TALSPEAK buffered system using lactate (SF = 91 at pH 36) However at pH 4 the
slopes change on the graph and a difference in separation can be observed as the molar
concentration of GSH is increased
Figure 46 Eu3+
Am3+
distribution for [GSH] dependence with 005 M Na5DTPA at pH
4 Results were averaged from 3 repeat tests
At pH 4 as the concentration of L-glutathione is increased the separation factor
increases (Figure 46) The value DEu initially increases as the GSH concentration is
increased from 01-02 M but then remains constant at ~6 However DAm values
decrease linearly as the buffer concentration is increased from 01-05 M giving rise to
increased partitioning and separation values The results from the extraction
experiments at pH 4 are given in Table 41
-15
-10
-05
00
05
10
-11 -09 -07 -05 -03
log
DEu
Am
log [GSH]
Am Extraction
Eu Extraction
130
Table 41 Eu3+
Am3+
distribution and separation for [GSH] dependence with 005 M
Na5DTPA at pH 4
[GSH] (M) DAm DEu SF
01 073 plusmn 027 100 plusmn 041 14 plusmn 13
02 021 plusmn 011 658 plusmn 054 31 plusmn 14
03 016 plusmn 005 578 plusmn 097 37 plusmn 19
04 007 plusmn 002 590 plusmn 043 82 plusmn 19
05 006 plusmn 001 617 plusmn 097 104 plusmn 33
The results show that the L-glutathione is interacting with the DTPA in some
way at pH 4 to allow the separation to increase as a function of GSH concentration only
in the presence of Na5DTPA up to a SF of 104 at 05 M GSH concentration
comparable to separation achieved in the original lactate buffered TALSPEAK process
Figure 47 GSH speciation as a function of pH modelled using HySS software using
literature pKa values of 212 (COOH) 359 (COOH) 875 (NH2) and 965 (SH)9
131
Figure 48 H2GSH- species dominant in solution at pH 4
The speciation of GSH at pH 4 was modelled using HySS (Hyperquad Simulation and
Speciation) software using literature pKa values (Figure 47) At pH 4 the dominant
GSH species is the H2GSH- species (Figure 48) with both carboxylic acids
deprotonated This suggests that deprotonation of the second COOH group allows the
ligand to interact through the COO- to the metal complex Indeed several studies by
Faulkner et al have shown that molecules containing carboxylate functionalities
readily bind with 7-coordinate lanthanide(III) polyaminocarboxylate complexes in a
bidentate manner here DO3A (DO3A = [4710-tris-carboxymethyl-14710-tetraaza-
cyclododec-1-yl]-acetic acid) (Figure 49) and a similar binding interaction with the
related DTPA actinide(III)lanthanide(III) may be anticipated
Figure 49 A ternary Nd DO3A-pyrazine amine carboxylate complex reported by
Faulkner at al (left) and anticipated bidentate chelation of GSH with Am-DTPA at pH
4 (right)10
132
412 [Na5DTPA] Dependence at pH 4
The highest concentration of buffer (05 M) gave the highest separation factors
in the [GSH] dependence study at pH 4 so this concentration was chosen for the next
study on [Na5DTPA] dependence (Figure 410) Relatively high concentrations of
Na5DTPA were chosen (005-06 M) to make the results comparable to those obtained
in the optimisation of the L-alanine system (Section 32) The graphs plotted for the
[Na5DTPA] dependence were not plotted as log plots as it is not known how the
Na5DTPA and GSH interact and what competition effects may be present so the direct
correlation between the complexant concentration and D values have been plotted to
make interpretation more simple
Figure 410 Eu3+
and Am3+
distribution for [Na5DTPA] dependence with 05 M GSH
buffer at pH 4 curves fitted as polynominal order 2 for both Am3+
and Eu3+
Results
were averaged from 3 repeat tests
y = 19018x2 - 23123x + 72258 Rsup2 = 09937
y = 0442x2 - 03543x + 00659 Rsup2 = 0781
00
00
01
01
02
-20
-10
00
10
20
30
40
50
60
70
-01 26E-15 01 02 03 04 05 06 D
Am
DEu
[Na5DTPA] (M)
Eu extraction
Am extraction
133
Table 42 Eu3+
Am3+
distribution and separation for [Na5DTPA] dependence with 05
M GSH buffer at pH 4
[Na5DTPA] (M) DAm DEu SF
005 00650 plusmn ˂0001 624 plusmn 076 96 plusmn 11
01 00196 plusmn ˂0001 480 plusmn 057 245 plusmn 29
02 00039 plusmn ˂0001 361 plusmn 052 917 plusmn 133
03 00020 plusmn ˂0001 207 plusmn 017 1037 plusmn 85
04 00010 plusmn ˂0001 084 plusmn 008 833 plusmn 80
05 00060 plusmn ˂0001 042 plusmn 005 70 plusmn 9
06 00058 plusmn ˂0001 024 plusmn 005 41 plusmn 7
These data show that as the concentration of Na5DTPA is increased the
separation factor increases dramatically up to 03 M Na5DTPA with a maximum of
1037 85 (Table 42) After this peak there is a rapid decrease in separation as the
concentration of Na5DTPA is increased further up to 06 M The DAm decreases at a
steady rate as [Na5DTPA] is increased from 005 M to 04 M after which the DAm
increases slightly and remains fairly constant The DEu decreases at a slower rate
between 005 M and 02 M complexant decreasing more rapidly from 02 M to 06 M
The SF significantly decreases as the concentration of Na5DTPA is increased from 04
to 05 M Although it is unclear why this is without detailed structural analysis the
stoichiometry of DTPAGSH becomes 11 at 05 M which may alter the interaction
between the two constituents The separation factors achieved here are extremely high
(a factor of 10 higher than the current TALSPEAK system and the optimised alanine
system (Chapter 3)) whilst still maintaining low extraction of Am3+
413 [HDEHP] Dependence at pH 4
The extractant concentration dependence was measured for the systems
containing 05 M buffer and 03 M and 04 M Na5DTPA These Na5DTPA
concentrations were chosen for comparison as the 03 M was found to give the highest
separation factor and 04 M seemed to be the point where the separation began to
decrease The graphs plotted for the [HDEHP] dependence have also been plotted by
direct correlation between the extractant concentration and D values
134
Figure 411 Eu3+
and Am3+
distribution for [HDEHP] dependence with 03 M
Na5DTPA and 05 M GSH buffer at pH 4 curve for Eu3+
fitted as polynominal order 2
linear correlation for Am3+
Results were averaged from 3 repeat tests
Table 43 Eu3+
Am3+
distribution and separation for [HDEHP] dependence with 03 M
Na5DTPA and 05 M GSH buffer at pH 4
[HDEHP] (M) DAm DEu SF
02 00020 plusmn ˂0001 207 plusmn 017 1037 plusmn 85
04 00018 plusmn ˂0001 223 plusmn 003 1238 plusmn 17
06 00022 plusmn ˂0001 239 plusmn 006 1097 plusmn 15
08 00024 plusmn ˂0001 218 plusmn 005 906 plusmn 21
10 00031 plusmn ˂0001 165 plusmn 003 535 plusmn 9
At 03 M Na5DTPA the separation factor increases as the extractant
concentration is increased from 02 to 04 M after which the SF begins to decrease
again (Figure 411) The DAm increases slightly as the HDEHP concentration is
increased but the DEu increases and then decreases like the SF The separation factors
for the lower concentrations of extractant are very high with the optimum separation at
04 M giving a SF of 1238 (Table 43)
y = -30649x2 + 3243x + 15029 Rsup2 = 09467
y = 00013x + 00015 Rsup2 = 08028
0000
0002
0004
0006
0008
0010
0012
0014
00
05
10
15
20
25
30
0 02 04 06 08 1 12
DA
m
DEu
[HDEHP] (M)
Eu extraction
Am extraction
135
Figure 412 Eu3+
and Am3+
distribution for [HDEHP] dependence with 04 M
Na5DTPA and 05 M GSH buffer at pH 4 linear correlation for both Am3+
and Eu3+
Results were averaged from 3 repeat tests
Table 44 Eu3+
Am3+
distribution and separation for [HDEHP] dependence with 04 M
Na5DTPA and 05 M GSH buffer at pH 4
[HDEHP] (M) DAm DEu SF
02 0001 plusmn ˂0001 084 plusmn 008 833 plusmn 80
04 0251 plusmn ˂0001 081 plusmn 003 454 plusmn 30
06 0698 plusmn 0014 077 plusmn 001 110 plusmn 010
08 1026 plusmn 0009 078 plusmn 004 076 plusmn 005
10 1410 plusmn 0022 067 plusmn 003 047 plusmn 003
At 04 M Na5DTPA the separation factor decreases rapidly as the extractant
concentration is increased The DAm increases by a factor of 1000 but the DEu only
decreases slightly making the SF decrease significantly (Figure 412 and Table 44)
This would be consistent with the complexant and buffer interacting at higher
Na5DTPA concentrations as the stoichiometry nears 11 possibly forming an adduct
which no longer successfully holds back Am3+
Further structural studies are needed on
these systems in order to determine the complexation mechanisms in the solution under
these conditions
y = -01882x + 08847 Rsup2 = 08326
y = 17968x - 04007 Rsup2 = 09946
-0500
0000
0500
1000
1500
2000
00
01
02
03
04
05
06
07
08
09
10
0 02 04 06 08 1 12
DA
m
DEu
[HDEHP] (M)
Eu extraction
Am extraction
136
42 Luminescence Studies using GSH with Eu3+
Further studies on the glutathione systems were carried out on lanthanide
systems in order to gain some insight into the co-ordination of the buffer with the ions
with and without Na5DTPA present Control measurements were taken of Eu(NO3)3 in
water with no other reagents Eu(NO3)3 with Na5DTPA with no GSH and Eu(NO3)3
with GSH without Na5DTPA for comparison purposes (Figure 413) All luminescence
spectra were recorded and averaged from 5 repeat measurements
Figure 413 Corrected emission spectra of Eu(NO3)3 (1 mM) Eu(NO3)3 with GSH (05
M) and Eu(NO3)3 with Na5DTPA (005 M) in H2O following excitation at 397 nm
A first set of experiments was then carried out to mimic the separation and
solvent extraction studies performed at the INL (Section 41) At the same concentration
of Eu(NO3)3 the J=2 band of Eu3+
increases in intensity upon the addition of GSH
indicating a change in symmetrycrystal field and a weak but detectable interaction with
GSH (the J=1 and J=4 bands are the same intensity with and without GSH) Upon the
addition of Na5DTPA to the system the crystal field changes and the J=4 band shifts
position slightly indicating that a different species is forming which is consistent with
the formation of [EuDTPA]2-
0
1
2
3
4
5
6
550 600 650 700
Emis
sio
n In
ten
sity
(au
) x
10
00
0
Wavelength (nm)
Eu3+ in H2O
Eu with GSH
Eu with DTPA
137
421 [GSH] and pH Dependence without DTPA at pH 4
4211 Aqueous Phase Studies
Emission spectra of Eu3+
(1 mM Eu(NO3)3) in H2O and D2O were measured at
pHpD 4 as the concentration of [GSH] was varied from 01 M to 05 M The spectra
can be seen in Figures 414 and 415
Figure 414 Emission spectra of Eu(NO3)3 in H2O at pH 4 over a GSH concentration
range of 01 ndash 05 M following excitation at 397 nm
The spectra show an increase in emission intensity of the J=2 band as the GSH
concentration is increased from 01-02 M followed by a decrease at 03 M and a
further increase at 04 and 05 M whereas the opposite trend is observed with the J=4
peak The J=1J=2 peak ratios were determined and a t-test was carried out on them to
determine whether they were significantly different and hence whether the co-ordination
mode of the GSH to the Eu3+
changed as the buffer concentration was increased The
J=1J=2 values ranged from 0364-0718 and were found to be significantly different
The spectra are similar to that recorded for the free ion in solution but the J=1J=2
ratios vary slightly and there are some differences in the fine structure of the emission
bands This indicates that GSH is interacting with Eu3+
under these conditions albeit
weakly and the surrounding water molecules are in fast exchange with the buffer
molecules The solution dynamics were investigated further and the spectra were
recorded in D2O in order to minimise quenching caused by fast exchange of O-H
oscillators and to determine the inner sphere hydration number of Eu3+
in each case (q)
00
01
02
03
04
05
06
07
550 600 650 700
Emis
sio
n In
ten
sity
(au
) x
10
00
0
Wavelength (nm)
01 M GSH
02 M GSH
03 M GSH
04 M GSH
05 M GSH
138
Figure 415 Emission spectra of Eu(NO3)3 in D2O at pH 4 over a GSH concentration
range of 01 ndash 05 M following excitation at 397 nm
In D2O it can be seen that the emission intensity increases as the GSH
concentration is increased from 01-03 M followed by a decrease at 04 M and a slight
increase at 05 M This time the J=1J=2 values ranged from 0324-0748 but were
found not to be significantly different suggesting that the co-ordination mode of the
GSH to the metal ion is not changing as the concentration is increased which would be
expected as the buffer is not forming a stable complex with the ion and is in exchange
with surrounding solvent molecules
The number of water molecules bound to the Eu3+
ion (q) was calculated for
each of the samples using the Horrocks equations (Equations 19 and 110) The results
can be found in Table 45 There is a large range in q between different concentrations
with no clear pattern to the lifetimes or number of bound water molecules other than
generally q tends to increase from around 1 to 5 at the highest concentrations of GSH
This could be explained by the increasing ionic strength decreasing the stability of any
Eu-GSH complex and the solvent molecules are also in fast exchange with the buffer
00
02
04
06
08
10
12
550 600 650 700
Emis
sio
n In
ten
sity
(au
) x
10
00
0
Wavelength (nm)
01 M GSH
02 M GSH
03 M GSH
04 M GSH
05 M GSH
139
Table 45 Luminescence lifetimes and q values for Eu3+
with GSH at pHD 4
Error on lifetimes plusmn 10
[GSH]
(M)
τ D2O (μs) τ H2O (μs) q plusmn 02
01 1487 428 17
02 785 353 16
03 829 440 11
04 1545 161 58
05 1016 168 52
4211 Extraction Studies
Extractions were carried out on the Eu3+
samples containing GSH using 02 M
HDEHP in dodecane for the organic phase The emission spectra of both the aqueous
and organic phases post-extraction can be seen in Figure 416
Figure 416 Emission spectra of aqueous and organic phases after Eu3+
extraction at
pH 4 using a GSH concentration range of 01 ndash 05 M following excitation at 397 nm
The Eu-HDEHP complex formed in the organic phase has different symmetry to
Eu3+
complexes in the aqueous phase as can be seen by the different profile of the
emission spectra of the organic phases The spectra show good extraction of the Eu3+
into the organic phase for all concentrations of GSH with little or no metal ion left in the
aqueous phase The J=1J=2 values ranged from 0794-1214 for the organic phase and
were found not to be significantly different as expected as the buffer is unlikely to
00
01
01
02
02
03
03
550 600 650 700
Emis
sio
n In
ten
sity
(au
) x
10
00
0
Wavelength (nm)
01 M GSH Aq 02 M GSH Aq 03 M GSH Aq 04 M GSH Aq 05 M GSH Aq 01 M GSH Org 02 M GSH Org 03 M GSH Org 04 M GSH Org 05 M GSH Org
140
affect the co-ordination of metal ion in the organic phase as the Eu3+
ion is extracted as
the HDEHP complex seen by the different emission profile in the organic phase
spectrum11
422 [GSH] and pH Dependence with DTPA
4221 Aqueous Phase Studies
Emission spectra of Eu3+
(1 mM Eu(NO3)3) in H2O and D2O with 005 M
Na5DTPA were measured over a pHpD range of 2-4 as the concentration of [GSH] was
varied from 01 M to 05 M The D2O spectra can be seen in Figures 417 to 419 The
H2O spectra closely resemble those recorded in D2O but with lower relative emission
intensites as expected (Appendix 1)
Figure 417 Emission spectra of Eu3+
in D2O at pD 2 with 005 M Na5DTPA over a
GSH concentration range of 01 ndash 05 M following excitation at 397 nm
00
02
04
06
08
10
12
14
16
550 600 650 700
Emis
sio
n In
ten
sity
(au
) x
10
00
0
Wavelength (nm)
01 M GSH
02 M GSH
03 M GSH
04 M GSH
05 M GSH
141
Figure 418 Emission spectra of Eu3+
in D2O at pD 3 with 005 M Na5DTPA over a
GSH concentration range of 01 ndash 05 M following excitation at 397 nm
Figure 419 Emission spectra of Eu3+
in D2O at pD 4 with 005 M Na5DTPA over a
GSH concentration range of 01 ndash 05 M following excitation at 397 nm
It can be seen that in all samples a Eu-DTPA complex has formed The spectra
are all almost identical for each pD and for each buffer concentration with the emission
intensity being slightly higher for pD 3 and 4 with the same concentration of Eu3+
00
02
04
06
08
10
12
14
16
550 600 650 700
Emis
sio
n In
ten
sity
(au
) x
10
00
0
Wavelength (nm)
01 M GSH
02 M GSH
03 M GSH
04 M GSH
05 M GSH
00
02
04
06
08
10
12
14
16
550 600 650 700
Emis
sio
n In
ten
sity
(au
) x
10
00
0
Wavelength (nm)
01 M GSH
02 M GSH
03 M GSH
04 M GSH
05 M GSH
142
Table 46 J=1J=2 peak ratios and t-test results for Eu-DTPA at pD 2-4 over a GSH
concentration range of 01-05 M following excitation at 397 nm
J=1J=2
[GSH] (M)
01 02 03 04 05 st dev t-test
pD 2 0335 0399 0379 0375 0361 0024 No sig diff
pD 3 0440 0433 0451 0439 0419 0012 No sig diff
pD 4 0438 0467 0413 0469 0454 0023 No sig diff
st dev 0060 0034 0036 0048 0047
t-test Sig diff Sig diff Sig diff Sig diff Sig diff
The J=1J=2 peak height ratios were recorded for each emission spectrum and t-
tests were carried out on the peak ratios using the t-test data analysis tool in Microsoft
Excel accounting for the standard deviations between the ratios (Table 46) For each
pH as the concentration of GSH is increased the range in the ratios remains small and
there is no significant difference between the values suggesting that there is no change
in the co-ordination mode of the buffer to the metal ion as the concentration of GSH is
increased However a significant difference was observed between the data sets upon
changing pH as the J=1J=2 ratio increases from pD 2 to pD 4 indicating that the co-
ordination mode of glutathione is different at different pH values This is consistent
with the pKa values of GSH as at pH 2 both of the carboxylate groups will be
protonated with the dominant species present in solution shifting from 5050
H3GSHH2GSH to 5050 H4GSHH3GSH (Figure 47)
The luminescence lifetimes of each sample were recorded in H2O and D2O in
order to determine the q value of the complexes using the modified Horrocks equation
(Equation 110) These results are summarised in Table 47
143
Table 47 Luminescence lifetimes and q values for Eu-DTPA at pH 2-4 over a GSH
concentration range of 01-05 M
[GSH] (M) τ D2O (μs) τ H2O (μs) q plusmn 02
pH 2 01 1699 plusmn 7 607 plusmn 9 10
pH 2 02 1692 plusmn 10 619 plusmn 10 09
pH 2 03 1686 plusmn 9 629 plusmn 9 09
pH 2 04 1636 plusmn 12 607 plusmn 13 09
pH 2 05 1596 plusmn 11 629 plusmn 13 09
pH 3 01 1755 plusmn 14 626 plusmn 7 09
pH 3 02 1737 plusmn 13 626 plusmn 15 09
pH 3 03 1723 plusmn 5 626 plusmn 13 09
pH 3 04 1720 plusmn 14 635 plusmn 17 09
pH 3 05 1677 plusmn 9 641 plusmn 14 09
pH 4 01 1778 plusmn 14 593 plusmn 16 10
pH 4 02 1747 plusmn 13 640 plusmn 15 09
pH 4 03 1679 plusmn 15 669 plusmn 18 08
pH 4 04 1689 plusmn 14 623 plusmn 15 09
pH 4 05 1679 plusmn 13 652 plusmn 19 08
All of the complexes have approximately 1 water molecule in the inner
hydration sphere This is consistent with the formation of a [Eu(DTPA)]2-
complex The
values are only slightly less than 1 (compared to [Eu(DTPA)]2-
itself where q = 11)
and in most cases is not significantly different This indicates that any interaction of
GSH with the Eu3+
centre is very weak and that the buffer may be in fast exchange with
the bound water molecule
4222 Extraction Studies
Extractions were carried out on the samples using 02 M HDEHP in dodecane
for the organic phase in the absence of DTPA The emission spectra of both the aqueous
and organic phases post-extraction can be seen in Figures 420 and 421
144
Figure 420 Emission spectra of aqueous phases after Eu3+
extraction at pH 2-4 over a
GSH concentration range of 01-05 M following excitation at 397 nm
Figure 421 Emission spectra of organic phases after Eu3+
extraction at pH 2-4 over a
GSH concentration range of 01-05 M following excitation at 397 nm
The extraction data show that the best Eu3+
extraction occurs at pH 3 under these
conditions although as seen from the separation data obtained at INL (Section 41) this
is not the best pH for separation of metal ions The J=1J=2 peak height ratios were
recorded for each emission spectrum and t-tests were carried out on the peak ratios
using the t-test data analysis tool in Microsoft Excel accounting for the standard
deviations between the ratios The J=1J=2 peak ratios for the aqueous phases show no
significant difference within the pH 4 data as the GSH concentration is increased and
00
05
10
15
20
25
30
35
40
45
50
550 600 650 700
Emis
sio
n In
ten
sity
(au
) H
un
dre
ds
Wavelength (nm)
01 M GSH pH 4 Aq
03 M GSH pH 4 Aq
05 M GSH pH 4 Aq
05 M GSH pH 3 Aq
05 M GSH pH 2 Aq
00
02
04
06
08
10
12
14
550 600 650 700
Emis
sio
n In
ten
sity
(au
) H
un
dre
ds
Wavelength (nm)
01 M GSH pH 4 Org
03 M GSH pH 4 Org
05 M GSH pH 4 Org
05 M GSH pH 3 Org
05 M GSH pH 2 Org
145
the standard deviation is small (Table 48) however a significant difference is observed
between each of the pH values for the same buffer concentration 05 M which is again
consistent with the co-ordination mode of glutathione changing with pH Interestingly
under these experimental conditions the extraction of Eu3+
as the HDEHPDEHP
organic soluble complexes is not very efficient since the emission intensities are
unusually low This suggests that in the absence of competing Am3+
ions GSH is
interacting relatively strongly with the Eu3+
ion in aqueous solution
Table 48 J=1J=2 peak ratios and t-test results for Eu-DTPA at pH 2-4 as [GSH] is
varied
J=1J=2
[GSH] (M)
01 03 05 st dev t-test
pD 4 0202 0276 0247 0037 No sig diff
pD 3 - - 0100 - -
pD 2 - - 0500 - -
st dev - - 0202
t-test - - Sig diff
423 [Na5DTPA] Dependence at pH 4
4231 Aqueous Phase Studies
The [Na5DTPA] dependence study carried out at the INL was also repeated in
order to gain luminescence data for the experiment The conditions used were pH 4 05
M GSH and [Na5DTPA] concentrations ranging from 005 ndash 06 M The emission
spectra can be seen in Figure 422
146
Figure 422 Emission spectra of Eu(NO3)3 in D2O at pD 4 with 05 M GSH over a
Na5DTPA concentration range of 005 ndash 06 M following excitation at 397 nm
The emission intensity of the complex decreases as the concentration of
Na5DTPA is increased from 005 M to 06 M This is likely to be due to the introduction
of more O-H oscillators and therefore increased quenching as the Na5DTPA stock
solution is aqueous and there is no deuterated alternative available The emission
spectra in water do not show this decrease in intensity (Figure 423)
Figure 423 Emission spectra of Eu(NO3)3 in H2O at pH 4 with 05 M GSH over a
Na5DTPA concentration range of 005 ndash 06 M following excitation at 397 nm
0
5
10
15
20
25
30
35
550 600 650 700
Emis
sio
n In
ten
sity
(au
) x
10
00
0
Wavelength (nm)
005 M DTPA
01 M DTPA
02 M DTPA
03 M DTPA
04 M DTPA
05 M DTPA
06 M DTPA
0
2
4
6
8
10
12
14
16
550 600 650 700
Emis
sio
n In
ten
sity
(au
) x
10
00
0
Wavelength (nm)
005 M DTPA
01 M DTPA
02 M DTPA
03 M DTPA
04 M DTPA
05 M DTPA
06 M DTPA
147
Table 49 J=1J=2 peak ratios and t-test results for Eu-DTPA with 05 M GSH in
D2OH2O at pDpH 4 over a Na5DTPA concentration range of 005-06 M
J=1J=2
[Na5DTPA] (M)
005 01 02 03 04 05 06 stdev t-test
D2O 0437 0441 0431 0437 0428 0425 0403 0013
No sig
diff
H2O 0450 0440 0437 0449 0422 0424 0428 0011
No sig
diff
The J=1J=2 peak height ratios were recorded for each emission spectrum and t-
tests were carried out on the peak ratios using the t-test data analysis tool in Microsoft
Excel accounting for the standard deviations between the ratios The J=1J=2 peak
ratios show no significant difference for either the D2O or H2O samples as the
Na5DTPA concentration is increased (Table 49) suggesting that the co-ordination
mode of the DTPA does not change as the concentration is increased The luminescence
lifetimes of the samples show a decrease across the D2O samples as the concentration of
Na5DTPA increases This is consistent with the decreased emission intensity due to
greater quenching of the samples as more water is introduced However there is a slight
increase across the H2O samples as the holdback concentration increased as quenching
is reduced in these samples due to the chelating effect of the DTPA molecules therefore
the results obtained in water for this study are likely to be most accurate The lifetimes
and q values are tabulated in Table 410 Although the q values are likely to be
unreliable especially for the highest Na5DTPA concentrations it can be seen that there
is still approximately 1 H2O molecule in the inner hydration sphere of the complexes
consistent with [Eu(DTPA)]2-
formation again implying very little or weak binding
with GSH
148
Table 410 Luminescence lifetimes and q values for Eu-DTPA with 05 M GSH at pH
4 over a Na5DTPA concentration range of 005-06 M following excitation at 397 nm
[Na5DTPA]
(M)
τ D2O (μs) τ H2O (μs) q plusmn 02
005 1679 plusmn 3 652 plusmn 2 08
01 1549 plusmn 4 659 plusmn 2 10
02 1348 plusmn 4 666 plusmn 3 09
03 1179 plusmn 4 665 plusmn 3 08
04 1076 plusmn 4 674 plusmn 4 07
05 978 plusmn 4 698 plusmn 4 05
06 916 plusmn 5 714 plusmn 5 03
4232 Extraction Studies
Extractions were carried out on the samples using 02 M HDEHP in dodecane
for the organic phase The emission spectra of both the aqueous and organic phases
post-extraction can be seen in Figure 424
Figure 424 Emission spectra of aqueous and organic phases after Eu3+
extraction with
05 M GSH at pH 4 over a Na5DTPA concentration range of 005-06 M following
excitation at 397 nm
0
1
2
3
4
5
6
7
550 600 650 700
Emis
sio
n In
ten
sity
(au
) H
un
dre
ds
Wavelength (nm)
01 M DTPA Aq
03 M DTPA Aq
05 M DTPA Aq
01 M DTPA Org
03 M DTPA Org
05 M DTPA Org
149
As expected the extraction data show that the best Eu3+
extraction occurs with
01 M Na5DTPA the lowest concentration of holdback reagent and that very little
extraction occurs at 03 M and 05 M Na5DTPA under these conditions The J=1J=2
peak ratios for the aqueous phases show no significant difference as the Na5DTPA
concentration is increased (Table 411) Unfortunately here the extraction is too weak
and the emission intensity too low to obtain reliable J=1J=2 peak ratios for the organic
phase
Table 411 J=1J=2 peak ratios and t-test results for Eu3+
in the aqueous phase with 05
M GSH at pH 4 as [Na5DTPA] is varied after extraction with 02 M HDEHP
Na5DTPA (M) 01 03 05 st dev t-test
J=1J=2 0552 0578 0502 0039 No sig
diff
424 [HDEHP] Dependence at pH 4
An HDEHP concentration dependence study was carried out under the same
conditions as the study at INL 05 M GSH 03 M Na5DTPA pH 4 and an extractant
concentration range of 04-10 M HDEHP in dodecane Equilibration time was for 30
minutes The emission spectra of the phases after extraction can be seen in Figures 425
and 426
150
Figure 425 Emission spectra of aqueous phases after Eu3+
extraction with 05 M GSH
and 03 M Na5DTPA at pH 4 over an HDEHP concentration range of 02-10 M
following excitation at 397 nm
The J=1J=2 peak ratios for the aqueous phases show no significant difference as
the HDEHP concentration is increased (Table 412) as expected since the co-ordination
mode of the aqueous phase should be unaffected by the organic phase Unfortunately
again the extraction is too weak and the emission intensity too low to obtain reliable
J=1J=2 peak ratios for the organic phase
Table 412 J=1J=2 peak ratios and t-test results for Eu3+
in the aqueous phase with 05
M GSH and 03 M Na5DTPA at pH 4 as [HDEHP] is varied after extraction
HDEHP (M) 04 06 08 10 st dev t-test
J=1J=2 0472 0499 0455 0510 0025 No sig
diff
00
02
04
06
08
10
12
550 600 650 700
Emis
sio
n In
ten
sity
(au
) x
10
00
0
Wavelength (nm)
04 M HDEHP Aq
06 M HDEHP Aq
08 M HDEHP Aq
10 M HDEHP Aq
151
Figure 426 Emission spectra of organic phases after Eu3+
extraction with 05 M GSH
and 03 M Na5DTPA at pH 4 over an HDEHP concentration range of 02-10 M
following excitation at 397 nm
The lowest Eu3+
extraction is with 04 M HDEHP with better extraction at
higher HDEHP concentrations Although better extraction is obtained at higher
concentrations Am3+
is also extracted to a higher extent decreasing the separation
factor (Section 413)
43 Radiolysis Studies using GSH at pH 4
431 Aqueous Phase Studies
In order to determine how resistant the glutathione buffered system is to
radiolysis a selection of aqueous samples at pHpD 4 containing 05 M GSH and a
Na5DTPA concentration range of 005-06 M were irradiated at the Dalton Cumbrian
Facility using a 60
Co irradiator The samples were exposed to 7 kGy γ-radiation and
analysed by luminescence spectroscopy The emission spectra of the samples can be
seen in Figure 427
00
00
00
01
01
01
01
550 600 650 700
Emis
sio
n In
ten
sity
(au
) x
10
00
0
Wavelength (nm)
04 M HDEHP Org
06 M HDEHP Org
08 M HDEHP Org
10 M HDEHP Org
152
Figure 427 Emission spectra of Eu(NO3)3 in H2O at pH 4 with 05 M GSH over a
Na5DTPA concentration range of 005 ndash 06 M after irradiation with 7 kGy γ-radiation
following excitation at 397 nm
The spectra of the samples show a lower emission intensity after irradiation
(Figure 427) than beforehand (Figure 423) but the profile remains the same indicating
that the radiation has little or no degrading effect on the complex in the aqueous phase
The decreased intensity is likely to be due to increased quenching effects caused by
residual radicals present as a result of irradiating the solvent The J=1J=2 ratios and co-
ordination mode remained unchanged (Table 413) as did the luminescence lifetimes of
the samples and the q values (Table 414)
00
01
01
02
02
03
03
04
550 600 650 700
Emis
sio
n In
ten
sity
(au
) x
10
00
0
Wavelength (nm)
005 M DTPA
01 M DTPA
02 M DTPA
03 M DTPA
04 M DTPA
05 M DTPA
06 M DTPA
153
Table 413 J=1J=2 peak ratios and t-test results for Eu-DTPA with 05 M GSH in
D2OH2O at pDpH 4 over a Na5DTPA concentration range of 01-06 M after
irradiation with 7 kGy γ-radiation
[Na5DTPA] (M)
01 02 03 04 05 06 st
dev
t-test
J=1J=2 0477 0481 0452 0401 0407 0411 0036
No sig
diff
Table 414 Luminescence lifetimes and q values for Eu-DTPA with 05 M
GSH at pH 4 over a Na5DTPA concentration range of 01-06 M after irradiation with 7
kGy γ-radiation
[Na5DTPA] (M) τ H2O (μs) τ D2O (μs) q plusmn 02
01 648 plusmn 4 1895 plusmn 12 10
02 661 plusmn 6 1678 plusmn 10 09
03 670 plusmn 6 1536 plusmn 11 08
04 679 plusmn 5 1462 plusmn 9 07
05 701 plusmn 7 1328 plusmn 10 05
06 696 plusmn 6 1211 plusmn 8 03
432 Extraction Studies
Extractions were then carried out on a selection of the irradiated samples using
02 M HDEHP in dodecane with Eu3+
The resultant emission spectra of both the
aqueous and organic phases post-extraction can be seen in Figure 428
154
Figure 428 Emission spectra of aqueous and organic phases after Eu3+
extraction from
irradiated aqueous phase at pH 4 containing 05 M GSH over a Na5DTPA concentration
range of 01-06 M
As expected the extraction data show that the best Eu3+
extraction occurs with
01 M Na5DTPA the lowest concentration of holdback reagent and that very little
extraction occurs at 03 M and 05 M Na5DTPA under these conditions With the
exception of the 01 M Na5DTPA sample for which the extraction decreases after
irradiation the emission intensity remains relatively constant for each of the phases of
the samples after irradiation The J=1J=2 ratios and co-ordination mode for the aqueous
phase remained unchanged (Table 415) Again the extraction is too weak and the
emission intensity too low to obtain reliable J=1J=2 peak ratios for the organic phase
Table 415 J=1J=2 peak ratios and t-test results for Eu3+
in the aqueous phase with 05
M GSH and at pH 4 as [Na5DTPA] is varied after extraction with 02 M HDEHP in
dodecane from an aqueous phase irradiated at 7 kGy γ ndashradiation
Na5DTPA (M) 01 03 05 st dev t-test
J=1J=2 0505 0563 0551 0031 No sig diff
44 Luminescence Studies using GSH with Dy3+
As well as obtaining primary extraction data for GSH with Eu3+
under a variety
of conditions it is also important to consider the behaviour and extraction of other Ln3+
ions with the buffer in order to achieve effective lanthanide-actinide separation
0
1
2
3
4
5
6
7
8
9
10
550 600 650 700
Emis
sio
n In
ten
sity
(au
) Hu
nd
red
s
Wavelength (nm)
01 M DTPA Aq
03 M DTPA Aq
05 M DTPA Aq
01 M DTPA Org
03 M DTPA Org
05 M DTPA Org
155
Dysprosium(III) was chosen for a preliminary study as it is later in the lanthanide series
representing the heavier metal ions and how they may behave under such conditions
Also like Eu3+
it is emissive in the visible region of the electromagnetic spectrum and
so may be easily analysed by luminescence spectroscopy
441 Dy3+
Complexation Studies
Initial data were obtained for Dy3+
and emission spectra were recorded for the
free ion from Dy(NO3)3 Dy-DTPA (005 M Na5DTPA) and Dy(NO3)3 with GSH (05
M) all in aqueous solution (Figure 429) A concentration of 005 M Na5DTPA was
chosen for the dysprosium experiments as the emission intensity of Dy3+
is relatively
weak and this technique is not sensitive enough to observe any extraction of the metal
from high Na5DTPA concentrations
Figure 429 Emission spectra of Dy(NO3)3 (10 mM) Dy-DTPA (10 mM Dy(NO3)3
005 M Na5DTPA) and Dy(NO3)3 (10 mM) with GSH (05 M) in H2O following
excitation at 352 nm Note that the tail of ligand emission can be seen in the Dy DTPA
and Dy GSH solutions at shorter wavelengths
The spectra show that the emission intensity of the 7F92 rarr
6H152 and
7F92 rarr
6H132 transitions is slightly higher when GSH buffer is present in solution than for the
free ion alone and the intensity is much greater when Na5DTPA is present in the
solution showing formation of a Dy-DTPA complex Interestingly evidence for
binding of GSH and DTPA with Dy3+
is further manifested in the emission spectra by
the presence of residual ligand emission at higher energy These samples were then
00
02
04
06
08
10
12
14
16
425 475 525 575 625 675
Emis
sio
n In
ten
sity
(au
) x
10
00
0
Wavelength (nm)
Dy H2O
Dy DTPA
Dy GSH
7F92 rarr
6H152
7F92 rarr
6H132
156
extracted into an organic phase of 10 M HDEHP in dodecane (Figure 430) as 02 M
extractant was found to be too low to observe any Dy3+
extraction due to the overall
weak emission of the ion relative to Eu3+
Figure 430 Emission spectra of aqueous and organic phases of Dy(NO3)3 Dy-DTPA
and Dy(NO3)3 with GSH after extraction with 10 M HDEHP following excitation at
352 nm
The spectra show that without Na5DTPA present the Dy3+
is extracted into the
organic phase but for the Dy-DTPA complex little or no metal extraction is observed in
the absence of competitive binding with Am3+
This may indicate that the metal is not
being extracted into the organic phase and that the heavier lanthanides may suffer the
same kinetic issues present for amino acid buffers at higher pH (Section 332) or that
this technique is not sensitive enough to obtain good extraction data for less emissive
lanthanides
442 pH Dependence Studies
To attempt to determine whether kinetic issues arise for heavier lanthanides with
GSH buffer at higher pH values a pH study was carried out on Dy-DTPA systems
containing 005 M Na5DTPA and 05 M GSH over a pH range of 2-4 One sample
containing 03 M Na5DTPA was also measured analogous to the europium data sets
The extraction data can be seen in Figure 431
00
02
04
06
08
10
12
14
425 475 525 575 625 675
Emis
sio
n In
ten
sity
(au
) x
10
00
0
Wavelength (nm)
Dy H2O Aq
Dy DTPA Aq
Dy GSH Aq
Dy H2O Org
Dy DTPA Org
Dy GSH Org
157
Figure 431 Emission spectra of aqueous and organic phases of Dy(NO3)3 Dy-DTPA
and Dy(NO3)3 with GSH after extraction with 10 M HDEHP following 352 nm
excitation
The extraction is lowest for the sample with the highest Na5DTPA
concentration as would be expected As the pH increases the extraction of Dy3+
decreases suggesting that the same kinetic issues may also be present in for the GSH
system Further investigation using a more sensitive technique such as ICP-MS is
necessary to confirm this (Section 46)
45 Luminescence Studies using GSH with Mixed Ln3+
Systems at pH 4
The Dy3+
luminescence work was extended to solutions of a mixture of 4
luminescent lanthanide ions (Sm3+
Eu3+
Tb3+
and Dy3+
) to be able to probe the relative
extraction of different lanthanides from a mixture relevant to a real TALSPEAK type
process The spectra are colour coded to each ionrsquos luminescent colour under UV light
irradiation
451 Complexation Studies
Initial data were obtained for each lanthanide ion and emission spectra were
recorded for Ln(NO3)3 Ln-DTPA (005 M Na5DTPA) and Ln(NO3)3 with GSH (05
M) all in aqueous solution (Figures 432-434) analogous to the Dy3+
data
00
01
02
03
04
05
06
07
08
09
10
550 560 570 580 590
Emis
sio
n In
ten
sity
(au
) x 1
00
00
Wavelength (nm)
pH 2 Aq
pH 3 Aq
pH 4 Aq
pH 4 (03 M DTPA) Aq
pH 2 Org
pH 3 Org
pH 4 Org
pH 4 (03 M DTPA) Org
158
Figure 432 Emission spectra of Ln(NO3)3 (1 mM EuTbSm3+
10 mM Dy3+
) in H2O
at pH 4 following direct excitation (405 nm for Sm3+
397 nm for Eu3+
366 nm for Tb3+
and 352 nm for Dy3+
)
Figure 433 Emission spectra of Ln(NO3)3 (1 mM EuTbSm3+
10 mM Dy3+
) with
GSH (05 M) at pH 4 in H2O following direct excitation (405 nm for Sm3+
397 nm for
Eu3+
366 nm for Tb3+
and 352 nm for Dy3+
)
0
5
10
15
20
25
30
35
40
45
50
450 500 550 600 650 700 750
Emis
sio
n In
ten
sity
(au
) H
un
dre
ds
Wavelength (nm)
Sm
Eu
Tb
Dy
0
2
4
6
8
10
12
14
16
18
20
450 500 550 600 650 700 750
Emis
sio
n In
ten
sity
(au
) Th
ou
san
ds
Wavelength (nm)
Sm
Eu
Tb
Dy
159
Figure 434 Emission spectra of Ln-DTPA (1 mM EuTbSm3+
10 mM Dy3+
005 M
Na5DTPA) in H2O at pH 4 following direct excitation (405 nm for Sm3+
397 nm for
Eu3+
366 nm for Tb3+
and 352 nm for Dy3+
)
For all of the metal ions the emission intensity is greater in the sample with
GSH than for the free ions in solution due to reduced quenching by the presence of the
buffer The profiles of all of the spectra remain the same showing that although the
glutathione may be in exchange with surrounding water molecules a stable complex
between the buffer and metal ions is not being formed The emission intensity is much
greater for each of the metal ions with Na5DTPA due to the formation of a Ln-DTPA
complex in each case and the peak splitting observed for the Eu3+
complex can also be
seen for the Tb3+
complex as the emission spectra of these ions are more sensitive to
their co-ordination environment than Sm3+
or Dy3+
Table 416 Luminescence lifetimes for lanthanide samples at pH 4
Sample Lifetime (μs)
Sm(III) Eu (III) Tb(III) Dy (III)
Ln3+
341 plusmn 1 121 plusmn 25 394 plusmn 19 525 plusmn 1
Ln3+
with
GSH
686 plusmn 1 184 plusmn 8 558 plusmn 28 830 plusmn 1
Ln-DTPA 11 plusmn 1 671 plusmn 4 1930 plusmn 20 14 plusmn 1
0
1
2
3
4
5
6
7
450 500 550 600 650 700 750
Emis
sio
n In
ten
sity
(au
) x
10
00
0
Wavelength (nm)
Sm
Eu
Tb
Dy
160
The luminescence lifetimes of all the metal ions (Table 416) are in the expected
ranges for these ions in aqueous solutions and exhibit the same pattern as the emission
intensities increasing as GSH is added to the metal solutions and being greatest for the
Ln-DTPA complexes The q values were calculated for Eu3+
and Tb3+
as calculations of
q for Sm3+
and Dy3+
are unreliable and were as expected with a hydration number of
around 8 for the M3+
ion in solution co-ordination of around 5 for the M3+
ion with
GSH (consistent with the [GSH] dependence studies in Section 421) and 1 water
molecule bound to the Ln-DTPA complex
Table 417 Luminescence lifetimes and q values for Eu3+
and Tb3+
samples at pH 4
Sample Lifetime (μs) q
Eu (III)
H2O
Eu (III)
D2O
Tb(III)
H2O
Tb (III)
D2O
Eu(III) Tb(III)
Ln3+
121 plusmn 25 2309 plusmn 38 394 plusmn 19 1698 plusmn 16 82 82
Ln3+
with
GSH
184 plusmn 8 1658 plusmn 26 558 plusmn 28 1889 plusmn 12 52 53
Ln-DTPA 671 plusmn 4 2066 plusmn 15 1930 plusmn 20 3546 plusmn 27 09 09
452 pH Dependence Studies
As with the dysprosium study extractions were carried out on the mixed
lanthanide samples under the same conditions The aqueous phases contained 005 M
Na5DTPA and 05 M GSH over a pH range of 2-4 The emission spectra of each
aqueous sample before extraction were also recorded but were found to be the same for
each pH The luminescence lifetimes of the samples were also very similar (Table 418)
consistent with the Eu3+
data (Section 422) The q values for Eu3+
and Tb3+
are as
expected with 1 water molecule bound to each Ln-DTPA complex (Table 419) As a
representative example the spectra for the pH 4 sample can be seen in Figure 435
161
Figure 435 Emission spectra of Ln(NO3)3 (1 mM EuTbSm3+
10 mM Dy3+
) with
GSH (05 M) and Na5DTPA (005 M) following direct excitation (405 nm for Sm3+
397
nm for Eu3+
366 nm for Tb3+
and 352 nm for Dy3+
)
Table 418 Luminescence lifetimes for aqueous phases before extraction over a
pH range of 2-4
Sample Lifetime (μs)
Sm(III) Eu (III) Tb(III) Dy (III)
pH 2 12 plusmn 1 677 plusmn 9 1851 plusmn 21 14 plusmn 1
pH 3 12 plusmn 1 715 plusmn 9 1934 plusmn 21 13 plusmn 1
pH 4 12 plusmn 1 699 plusmn 7 1912 plusmn 26 14 plusmn 1
Table 419 Luminescence lifetimes and q values for Eu3+
and Tb3+
samples before
extraction over a pH range of 2-4
Sample Lifetime (μs) q
Eu (III)
H2O
Eu (III)
D2O
Tb(III)
H2O
Tb (III)
D2O
Eu(III) Tb(III)
pH 2 677 plusmn 9 2897 plusmn 27 1851 plusmn 21 3765 plusmn 31 09 10
pH 3 715 plusmn 9 3011 plusmn 13 1934 plusmn 21 3705 plusmn 22 08 09
pH 4 699 plusmn 7 3032 plusmn 15 1912 plusmn 26 3815 plusmn 16 09 10
00
10
20
30
40
50
60
70
450 500 550 600 650 700 750
Emis
sio
n In
ten
sity
(au
) x
10
00
0
Wavelength (nm)
Sm
Eu
Tb
Dy
162
The spectra for the aqueous and organic phases after extraction with 10 M
HDEHP in dodecane (in order to ensure sufficient enough extraction to be observed by
this technique) are plotted in Figures 436-438
Figure 436 Emission spectra of aqueous and organic phases of Ln3+
with 05 M GSH
and 005 M Na5DTPA after extraction with 10 M HDEHP at pH 2 following direct
excitation (405 nm for Sm3+
397 nm for Eu3+
366 nm for Tb3+
and 352 nm for Dy3+
)
Figure 437 Emission spectra of aqueous and organic phases of Ln3+
with 05 M GSH
and 005 M Na5DTPA after extraction with 10 M HDEHP at pH 3 following direct
excitation (405 nm for Sm3+
397 nm for Eu3+
366 nm for Tb3+
and 352 nm for Dy3+
)
00
05
10
15
20
25
30
450 500 550 600 650 700 750
Emis
sio
n In
ten
sity
(au
) x
10
00
0
Wavelength (nm)
Sm Aq
Eu Aq
Tb Aq
Dy Aq
Sm Org
Eu Org
Tb Org
Dy Org
00
05
10
15
20
25
30
450 500 550 600 650 700 750
Emis
sio
n In
ten
sity
(au
) x
10
00
0
Wavelength (nm)
Sm Aq
Eu Aq
Tb Aq
Dy Aq
Sm Org
Eu Org
Tb Org
Dy Org
163
Figure 438 Emission spectra of aqueous and organic phases of Ln3+
with 05 M GSH
and 005 M Na5DTPA after extraction with 10 M HDEHP at pH 4 following direct
excitation (405 nm for Sm3+
397 nm for Eu3+
366 nm for Tb3+
and 352 nm for Dy3+
)
At all three pH values the order of extractability is Sm gt Eu gt Tb gt Dy
showing that the heavier lanthanides are the most difficult to extract The above data
demonstrate that extraction of Ln3+
is reasonably good at pH 2 and 3 but slightly lower
at pH 3 However at pH 4 extraction of all lanthanide ions is drastically reduced
particularly for Tb3+
and Dy3+
which have very low relative concentrations in the
organic phase Although the extraction of Sm3+
and Eu3+
is also greatly reduced there is
still some extraction of these metals into the organic phase This is consistent with the
previously obtained dysprosium results suggesting that there may be kinetic issues
present for heavier lanthanides at high pH The trend in relative extraction efficiency of
the Ln3+
ions approximately follows the relative stability constants of GSH-Ln
complexes Lighter Ln-GSH complexes are less stable an effect of charge density of the
Ln3+
cations so are extracted more efficiently This was investigated further by ICP-
MS
46 ICP-MS Studies with GSH
In order to determine whether a TALSPEAK type system using glutathione as a
buffer had the same kinetic issues as the amino acid systems whereby poor separation of
the heavier lanthanides was observed ICP-MS was carried out on extracted samples
containing 10 lanthanides (La-Ho with the exception of Pm) at pH 2 3 and 4 to
00
05
10
15
20
25
30
35
450 500 550 600 650 700 750
Emis
sio
n In
ten
sity
(au
) x
10
00
0
Wavelength (nm)
Sm Aq
Eu Aq
Tb Aq
Dy Aq
Sm Org
Eu Org
Tb Org
Dy Org
164
determine the distribution pattern of the series using GSH as a buffer The DLn values
can be seen in Figures 439 and 440 for the pH 2 and pH 3 data sets
Figure 439 DLn for varying GSH concentration at pH 2 with 005 M Na5DTPA after
extraction with 02 M HDEHP in dodecane
Figure 440 DLn for varying GSH concentration at pH 3 with 005 M Na5DTPA after
extraction with 02 M HDEHP in dodecane
0
5
10
15
20
25
30
35
40
56 57 58 59 60 61 62 63 64 65 66 67 68
Dis
trib
uti
on
Rat
io
Atomic Number
01 M GSH
02 M GSH
03 M GSH
04 M GSH
05 M GSH
Am3+
0
5
10
15
20
25
30
35
56 57 58 59 60 61 62 63 64 65 66 67 68
Dis
trib
uti
on
Rat
io
Atomic Number
01 M GSH
02 M GSH
03 M GSH
04 M GSH
05 M GSH
Am3+
165
The data set for pH 2 resembles a typical TALSPEAK curve as also
demonstrated by amino acids at pH 2 (Section 3) However at pH 3 the distribution of
the metal ions continues to decrease across the lanthanide series indicating that higher
pH is less favourable for extraction of the heavier lanthanides This may be explained
by the fact that the stability of Ln-GSH complexes is lower at lower pH values making
the metal ions easier to extract The analysis was also repeated for samples at pH 4 but
for some of the later lanthanides in the series the quantity of metal ion present was
below the limit of detection of the technique (004 ng mL-1
) so the data could not
accurately be plotted Corresponding separation factors can be seen in Table 420 and
plotted in Appendix 2 (for pH 2 and 3) Separation factors for all lanthanides are fairly
low at pH 2 compared to the original TALSPEAK process (SFEuAm = 91) The data also
show that for the earlier lanthanides as the pH is increased very high separation factors
can be achieved but separation is much lower for later lanthanides with increasing pH
This indicates that unfortunately the same kinetic issues are likely to be a problem at
higher pH for the glutathione buffered system as for the amino acid systems
166
Table 420 SFLnAm for varying GSH concentration over a pH range of 2-4 with
005 M Na5DTPA after extraction with 02 M HDEHP in dodecane
pH
[GSH]
(M)
SF
La Ce Pr Nd Sm Eu Gd Tb Dy Ho
2 01 234 171 148 107 136 158 216 222 237 234
2 02 244 176 145 103 134 146 215 229 239 244
2 03 263 183 145 105 137 165 243 244 281 289
2 04 239 170 151 111 145 168 218 237 259 265
2 05 278 197 164 117 162 189 257 269 300 314
3 01 1735 972 477 276 163 104 112 53 41 38
3 02 1953 841 433 256 320 266 290 130 89 77
3 03 1898 785 388 220 152 90 95 39 28 24
3 04 2046 812 412 243 196 121 126 53 38 34
3 05 2145 705 312 139 36 16 20 04 02 00
4 01 3777 141 12 - - - - - - -
4 02 5548 231 36 06 - - - - - -
4 03 2768 239 27 - - - - - - -
4 04 1620 150 21 01 - - - - - -
4 05 1589 286 48 11 - - - - - -
47 1H NMR Studies on GSH Systems
The glutathione systems were additionally studied by 1H NMR spectroscopy in
order to confirm the complexation observed by luminescence spectroscopy Spectra
were recorded in D2O for GSH GSH after irradiation Eu(NO3)3 with GSH (150)
Na5DTPA with GSH (110) and Eu-DTPA with GSH (1550
Eu(NO3)3Na5DTPAGSH) (Figures 441 a-e)
167
GSH0011resp
45 40 35 30 25 20 15 10
Chemical Shift (ppm)
0
005
010
Norm
alized Inte
nsity
197201200100200099
c
d
gb
i
f
44
944
844
6
38
9
37
637
437
2
28
628
628
528
4
24
924
824
724
624
524
4
21
120
920
720
5
GSH Irradiated0011resp
45 40 35 30 25 20 15 10
Chemical Shift (ppm)
0
005
010
015
020
025
Norm
alized Inte
nsity
133151244272014101206498131111059100
m
c
d
n
g
q
b
l
i
p
f
47
0
44
7 44
544
442
942
841
641
541
140
940
940
738
137
737
537
3
36
736
6
29
929
728
428
328
1
26
7
24
6
24
424
324
223
823
022
822
6
20
720
520
419
6
19
519
419
319
1
a
b
168
Eu GSH0011resp
45 40 35 30 25 20 15 10
Chemical Shift (ppm)
005
010
015
Norm
alized Inte
nsity
035183050206177050088216024026100
d
g
b
i
f
c
45
044
844
7
42
0 41
841
741
341
241
138
0 37
837
737
136
9 30
230
1
28
928
728
628
428
328
1
25
124
924
724
624
424
2 23
3 23
122
921
020
820
720
519
919
819
719
6
GSH DTPA0011resp
45 40 35 30 25 20 15 10
Chemical Shift (ppm)
0
005
010
015
Norm
alized Inte
nsity
032158045179156092075366021025099
c
d
g
DTPA
DTPA
DTPA
b
DTPA
i
f
45
044
9 44
744
6
41
941
841
741
241
141
0
37
937
737
537
036
8
34
133
633
5
30
730
530
1
28
928
628
528
428
228
0
25
024
824
624
524
324
1 23
223
022
821
020
820
620
419
719
5
c
d
169
EuDTPA GSH0011resp
45 40 35 30 25 20 15 10
Chemical Shift (ppm)
0
0005
0010
0015
0020
0025
0030
0035
0040
0045
0050
0055
Norm
alized Inte
nsity
180181200200212103673021100
47
0
44
244
1
38
4
36
836
3
32
832
0 30
230
129
9 28
628
528
328
1
24
724
624
524
424
3
20
820
720
520
3
Figure 441 1H NMR spectra for GSH in D2O under a range of conditions at 298 K a)
GSH b) GSH after irradiation with 7 kGy γ-radiation c) Eu(NO3)3 with GSH d) GSH
with Na5DTPA e) Eu-DTPA with GSH
Figure 442 1H
1NMR proton assignments for GSH (top) and γ-Glu-Cys (bottom)
It can be seen from spectra ldquoardquo and ldquobrdquo that there is some degradation of GSH
after irradiation with 7 kGy γ-radiation from a 60
Co irradiator shown by the presence of
e
170
γ-Glu-Cys fragments12
(Figure 442) The buffer seems to be susceptible to γ-radiolysis
and the integration ratios show that the γ-Glu-Cys fragments are present in a significant
quantity as the ratios are comparable to those of the intact GSH Spectrum ldquocrdquo shows
that the buffer does not form a stable complex with Eu3+
as there is only slight shifting
of the peaks indicating weak interaction and perhaps fast dynamic exchange on the
timescale of the NMR experiment There is also no notable paramagnetic broadening as
would be expected if a Eu3+
complex is formed Spectrum ldquoerdquo does show slight
paramagnetic broadening relative to spectrum ldquodrdquo (Na5DTPA with GSH) confirming
the formation of the Eu-DTPA complex seen in previous emission spectra (Section
422)
48 Summary and Conclusion of Glutathione Work
Since amino acids have not been shown to act as holdback reagents by
themselves the potential of using the tripeptide L-glutathione was investigated Initial
separation studies were carried out using glutathione at pH 4 as is was anticipated that
based on its pKa values glutathione would be most likely to act as a successful
holdback reagent at this pH despite the unfavourable increase of pH Preliminary
investigations found that like amino acids GSH is ineffective as a holdback reagent on
its own as there was no separation observed between Eu3+
and Am3+
when used without
Na5DTPA
Subsequent investigations were carried out using GSH alongside Na5DTPA to
determine whether separation was improved with the tripeptide buffer At pH 2 and pH
3 it was found that the glutathione acts solely as a buffer as the separation factor in each
case was independent of GSH concentration However at pH 4 separation between
Eu3+
and Am3+
was found to increase as the buffer concentration was increased
suggesting that the glutathione is interacting with the Ln-DTPA complexes at this pH
This could be explained by the increase in stability of Ln-GSH complexes as the pH is
increased A buffer concentration of 05 M was then used for all further optimisation
experiments
At 05 M GSH the separation factor was found to increase dramatically as a
function of Na5DTPA concentration up to 03 M Na5DTPA After this peak there was
a rapid decrease in separation as the concentration is increased further up to 06 M
Na5DTPA as the stoichiometry is close to 11 GSHDTPA The separation factors
achieved here were extremely high (~1000) ndash a factor of 10 higher than the current
171
TALSPEAK system and the optimised alanine system whilst still maintaining low Am3+
extraction
At 03 M Na5DTPA the separation factor then increased as the extractant
concentration was increased from 02 to 04 M HDEHP in dodecane after which the SF
began to decrease again with the optimum separation at 04 M giving a SF of 1238 At
04 M Na5DTPA however the separation factor decreases rapidly as the extractant
concentration is increased due to the DAm increasing by a factor of 1000 consistent with
the complexant and buffer possibly forming some kind of adduct which no longer
successfully holds back Am3+
at higher Na5DTPA concentrations
Luminescence experiments mimicking the separation studies showed that the
glutathione does not form a stable complex with the Eu3+
ion and is in exchange with
surrounding solvent molecules even at the highest buffer concentrations preventing the
GSH from acting as a holdback reagent and allowing extraction of the metal into the
organic phase Proton NMR spectroscopy confirmed that although the glutathione may
be in exchange with surrounding water molecules no stable complexes between the
buffer and metal ions are formed (Appendix 8)
In samples containing Na5DTPA a Eu-DTPA complex can be clearly observed
in the emission spectra with or without the presence of GSH over a pH range of 2-4
The J=1J=2 peak ratios showed that there is no change in the co-ordination mode of the
buffer to the metal ion as the concentration of GSH is increased for each pH However
across the data sets the co-ordination mode of glutathione was found to be different at
different pH values as expected based on pKa values and increasing stability constant
with pH
At 05 M GSH the co-ordination mode of the Eu-DTPA complex in the aqueous
phase was found not to change as [Na5DTPA] was changed with metal extraction
typically decreasing as the holdback reagent increases and at 03 M Na5DTPA with 05
M GSH extraction was found to increase as HDEHP concentration increased as
expected Unfortunately luminescence spectroscopy does not seem to be a sensitive
enough technique to gain much information from samples post-extraction using these
conditions
In order to determine how resistant the glutathione buffered system is to
radiolysis a selection of samples were irradiated with 7 kGy γ-radiation and analysed
by luminescence and 1H NMR spectroscopies The radiation was seen to have some
degrading effect on the buffer in the aqueous phase with slightly decreased
luminescence emission intensity of complexes post-irradiation and evidence of
172
significant quantities of γ-Glu-Cys fragments present in the 1H NMR spectrum
However the emission profiles co-ordination mode and luminescence lifetimes of the
samples remained unchanged Extraction also seemed to be unaffected with the
emission remaining relatively constant for each of the phases of the samples after
irradiation
Initial data obtained on the glutathione system with europium(III) and
americium(III) seemed promising as after optimisation very high separation factors
were achieved and despite the buffer being susceptible to radiolysis extraction of
lanthanide ions was still high after irradiation However in order to be a successful
alternative to the current TALSPEAK system it is essential that effective separation of
all lanthanides from MA3+
can occur Further luminescence experiments were carried
out firstly on an analogous dysprosium system in order to represent heavier lanthanide
elements followed by a mixture of 4 lanthanide metals in the same samples
For the dysprosium study as the pH was increased from 2-4 the extraction of
Dy3+
decreased suggesting that the same kinetic issues noted for heavier lanthanides in
the amino acid systems may also be present for the GSH system at higher pH values In
the mixed samples the same pattern was observed with extraction of Ln3+
decreasing as
pH was increased At pH 4 extraction of all lanthanide ions was very low particularly
for Tb3+
and Dy3+
which are both heavier than Sm3+
and Eu3+
ICP-MS was carried out
on a series of samples containing a mixture of 10 lanthanides in order to confirm
whether the heavier lanthanides are in fact subject to kinetic issues with GSH
ICP-MS data was consistent with the luminescence data showing decreased
extraction of heavier lanthanides as pH increases from 2 to 4 The quantity of metal
extracted was so low it was below the limit of detection for some of the heavier metals
at pH 4 forcing the conclusion that unfortunately the same kinetic issues are a problem
at higher pH for the glutathione buffered system as for the amino acid systems Further
optimisation of the system to exploit the combined liquid-liquid extraction efficiencies
as a function of atomic number may allow the development of an extraction process of
lighter over heavier lanthanides for rare earth recycling which is currently a
strategically important goal13
173
1 ImmuneHealthSciencecom What Glutathione (GSH) is and how it affects your
immune health httpwwwimmunehealthsciencecomglutathionehtml 2015
2 ME Sears Scientific World Journal 2013 2013 219840
3 L Patrick Mercury toxicity and antioxidants Part I Role of glutathione and alpha-
lipoic acid in the treatment of mercury toxicity Alternative Medicine 2002
4 EA Bump and JM Brown Pharmacol Ther 1990 47 1 117-136
5 JB Mitchell and A Russo Br J Cancer 1987 55 Suppl VIII 96-104
6 VV Nikonorov J Anal Chem 2010 65 4 359-365
7 A Miličević and N Raos Acta Chim Slov 2014 61 904-908
8 BS Garg BK Singh DN Kumar and PK Sing Indian J Chem 2003 42A 79-83
9 Sigma Aldrich Product Information
httpwwwsigmaaldrichcometcmedialibdocsSigma-AldrichProduct_Information_
Sheetg4251pisPar0001Filetmpg4251pispdf
10 SJA Pope BP Burton-Pye R Berridge T Khan PJ Skabara and S Faulkner
Dalton Trans 2006 2907-2912
11 TS Grimes MP Jensen L Debeer-Schmidt K Littrell and KL Nash J Phys
Chem B 2012 116 46 13722-13730
12 RJ Hopkinson PS Barlow CJ Schofield and TDW Claridge Org Biomol
Chem 2010 8 4915-4920
13 LS Natrajan and MH Langford Paden f-Block Elements Recovery in A Hunt ed
Element Recovery and Sustainability RSC 2013 6 140-184
174
5 MODIFIED DTPA LIGANDS AS COMBINED BUFFERS AND SOFT
DONORS IN A TALSPEAK SYSTEM
Amino acids and the tripeptide L-glutathione have been shown not to be suitable
as a combined buffer and soft-donor for potential replacement of DTPA
(diethylenetriaminepentaacetic acid) and the lactate buffer used in the TALSPEAK
process (Trivalent Actinide Lanthanide Separation by Phosphorus reagent Extraction
from Aqueous Complexation) an advanced reprocessing technique currently being
developed in the USA They do not act as holdback reagents in their own right as they
do not bind preferentially to minor actinide (MA3+
) over lanthanide (Ln3+
) ions
preventing enhanced selective extraction of Ln3+
by HDEHP (di-
(2ethylhexyl)phosphoric acid) into an organic phase The possibility of synthesising a
combined buffer and soft-donor with DTPA and amino acid functionality was therefore
considered
By incorporating additional soft donors onto the DTPA structural framework
from amino acids the overall system would be simplified to just two components rather
than three This could be achieved by incorporating an amino acid or other soft donor
compounds into the DTPA scaffold itself (Figure 51) This strategy may increase the
complexation affinity binding constants and associated thermodynamic parameters to
the MA3+
ion improving the separation and slowing down the kinetics of the exchange
processes if the ligand has a significant specificity for MA3+
over Ln3+
This is
especially true if two of the carboxylic acid moieties are replaced by relatively softer
donors here amide groups
A report on bis(methionine)-appended DTPA was published by Hazari et al in
2010 on the use of Tc-DTPA-bis(methionine) in tumour imaging1 however there are no
literature reports on the synthesis or use of amino acid appended or any modified DTPA
ligands for solvent extraction and separation studies
The work described in this chapter was performed in collaboration with an
MChem student a summer student and the Institute for Waste disposal (INE)
Karlsruhe Germany The initial ligand syntheses were carried out jointly between
myself and the MChem student and all luminescence analysis was performed jointly
The refining of the syntheses and characterisation of the ligands was carried out by a
summer student All separation work using the ligands was carried out by colleagues at
INE
175
Figure 51 General structure of DTPA-amino acid ligands
51 Ligand Synthesis and Characterisation
A route for the synthesis of DTPA-bis(amino acids) was devised involving ring
opening of the anhydride of DTPA with an amine group of the amino acid in question
whereby the amino acid is incorporated onto two of the side arms of the DTPA
according to Scheme1234
Initially the reaction was attempted using the acid forms of
the amino acid L-alanine however the reaction was found to be unsuccessful since only
an amino acid dimer could be isolated In order to allow optimisation of the reaction
conditions whilst avoiding competitive side reactions the reactions were repeated using
the methyl or ethyl ester protected forms of the amino acids Here commercially
available methyl esters of L-alanine L-arginine and L-histidine and the ethyl ester of L-
serine were used The amide coupling reactions with these amino acid derivatives using
triethylamine as the base proceeded in high yield However isolation and purification of
the products was found to be quite difficult as the reaction products are very
hygroscopic and stubbornly retain residual triethylamine salts Therefore the relatively
impure ligands were isolated for further studies following multiple re-precipitations and
re-crystallisation All the ligands were characterised by 1H NMR spectroscopy
MALDI-MS and elemental analysis (Section 742)
Scheme 1 Synthesis of DTPA-bis(amino) alkyl esters
Protected
Protected Protected
176
52 Luminescence Studies on Ligand Systems at pH 2 3 and 4
521 Aqueous Phase Studies
The DTPA-amino acid ligands synthesised were studied by luminescence
spectroscopy in a TALSPEAK type system The ligands self-buffer at approximately
pH 2 at 50 mM concentration but to ensure consistency in studies the pH of systems
were adjusted to exact pH values (plusmn 01) Aqueous phases were prepared containing 50
mM ligand and 1 mM Eu(NO3)3 at pHpD 2 3 and 4 for each of the four synthesised
ligands Samples were measured in D2O and H2O The emission spectra of the D2O
samples can be seen in Figures 52-54 The spectra for the samples in H2O are identical
but with lower relative emission intensities
Figure 52 Emission spectra of Eu(NO3)3 with DTPA-bis(amino ester) ligands in D2O
at pD 2 following excitation at 397 nm
0
5
10
15
20
25
30
35
550 575 600 625 650 675 700
Emis
sio
n In
ten
sity
(au
) x
10
00
0
Wavelength (nm)
Ala-DTPA
Arg-DTPA
His-DTPA
Ser-DTPA
177
Figure 53 Emission spectra of Eu(NO3)3 with DTPA-bis(amino ester) ligands in D2O
at pD 3 following excitation at 397 nm
Figure 54 Emission spectra of Eu(NO3)3 with DTPA-bis(amino ester) ligands in D2O
at pD 4 following excitation at 397 nm
The emission spectra are all very similar and show clear complexation of the
Eu3+
ion with each ligand There is little difference in emission intensity and form of the
spectra across all of the samples which indicates that all of the ligands present the same
coordination environment to the Eu3+
centre as expected
Table 51 J=1J=2 peak ratios and t-test results for Eu- DTPA-bis(amino ester)
complexes at pD 2-4
0
5
10
15
20
25
30
35
550 575 600 625 650 675 700
Emis
sio
n In
ten
sity
(au
) x
10
00
0
Wavelength (nm)
Ala-DTPA
Arg-DTPA
His-DTPA
Ser-DTPA
0
5
10
15
20
25
30
550 575 600 625 650 675 700
Emis
sio
n In
ten
sity
(au
) x
10
00
0
Wavelength (nm)
Ala-DTPA
Arg-DTPA
His-DTPA
Ser-DTPA
178
DTPA-
(AlaOMe)2
DTPA-
(ArgOMe)2
DTPA-
(HisOMe)2
DTPA-
(SerOEt)2
st dev t-test
pD 2 0359 0381 0404 0353 0023
No sig
diff
pD 3 0394 0425 0417 0381 0020
No sig
diff
pD 4 0391 0427 0432 0423 0019
No sig
diff
st dev 0019 0026 0014 0035
t-test No sig
diff
No sig
diff
No sig
diff
No sig
diff
The J=1J=2 peak height ratios were recorded for each emission spectrum and t-
tests were carried out on the peak ratios using the t-test data analysis tool in Microsoft
Excel accounting for the standard deviations between the ratios (Table 51) For each
data set the range in the ratios is small and there is no significant difference between
the values again suggesting that the co-ordination mode of the each of the ligands to the
metal ion is the same Across the data sets unlike the glutathione system (Chapter 4)
no significant difference was observed either as pD increases from pD 2 to pD 4
indicating that the co-ordination mode of the complexes is not changing with pH
The luminescence lifetimes of each sample were recorded in H2O and D2O in
order to determine the q value of the complexes using the modified Horrocks equation
(Equation 110) These results are summarised in Table 52
179
Table 52 Luminescence lifetimes and q values for Eu-DTPA-bis(amino ester)
complexes at pD 2-4 recorded at the emission maximum (617 nm) following 397 nm
excitation
pH amp Ligand τ D2O (μs) τ H2O (μs) q plusmn 02
pH 2 DTPA-(AlaOMe)2 1794 plusmn 7 587 plusmn 8 09
pH 2 DTPA-(ArgOMe)2 1828 plusmn 12 626 plusmn 10 08
pH 2 DTPA-(HisOMe)2 1816 plusmn 10 614 plusmn 9 09
pH 2 DTPA-(SerOEt)2 1759 plusmn 9 563 plusmn 11 10
pH 3 DTPA-(AlaOMe)2 1981 plusmn 12 587 plusmn 11 10
pH 3 DTPA-(ArgOMe)2 2335 plusmn 16 604 plusmn 12 10
pH 3 DTPA-(HisOMe)2 1963 plusmn 8 607 plusmn 13 09
pH 3 DTPA-(SerOEt)2 1839 plusmn 13 588 plusmn 12 09
pH 4 DTPA-(AlaOMe)2 1908 plusmn 17 608 plusmn 11 09
pH 4 DTPA-(ArgOMe)2 1907 plusmn 13 601 plusmn 17 09
pH 4 DTPA-(HisOMe)2 1905 plusmn 14 604 plusmn 15 09
pH 4 DTPA-(SerOEt)2 1890 plusmn 10 609 plusmn 16 09
All of the complexes have approximately 1 water molecule in the inner
hydration sphere This is consistent with the formation of a Eu-DTPA-amide ligand
complex The values are generally slightly less than 1 in contrast to [Eu-DTPA]2-
itself
where q = 11 indicating the likely fast exchange of the bound water molecule with
other surrounding water molecules and that the amino ester appendage may inhibit the
close approach of more than one water molecule due to steric reasons
522 Extraction Studies
Extractions were carried out on the samples using 06 M HDEHP in dodecane
for the organic phase The emission spectra of both the aqueous and organic phases
post-extraction can be seen in Figures 55-58
180
Figure 55 Emission spectra of aqueous phases after Eu3+
extraction from an aqueous
phase containing DTPA-bis(amino ester) ligands (50 mM) at pH 2 following excitation
at 397 nm
Figure 56 Emission spectra of aqueous and organic phases after Eu3+
extraction from
an aqueous phase containing DTPA-bis(amino ester) ligands (50 mM) at pH 2
following excitation at 397 nm
0
0
0
0
0
1
1
550 575 600 625 650 675 700
Emis
sio
n In
ten
sity
(au
) Th
ou
san
ds
Wavelength (nm)
Ala-DTPA Aq
Arg-DTPA Aq
His-DTPA Aq
Ser-DTPA Aq
0
10
20
30
40
50
60
70
550 575 600 625 650 675 700
Emis
sio
n In
ten
sity
(au
) Th
ou
san
ds
Wavelength (nm)
Ala-DTPA Aq Arg-DTPA Aq His-DTPA Aq Ser-DTPA Aq Ala-DTPA Org Arg-DTPA Org His-DTPA Org Ser-DTPA Org
181
Figure 57 Emission spectra of aqueous and organic phases after Eu3+
extraction from
an aqueous phase containing DTPA-bis(amino ester) ligands (50 mM) at pH 3
following excitation at 397 nm
Figure 58 Emission spectra of aqueous and organic phases after Eu3+
extraction from
an aqueous phase containing DTPA-bis(amino ester) ligands (50 mM) at pH 4
following excitation at 397 nm
0
2
4
6
8
10
12
550 575 600 625 650 675 700
Emis
sio
n In
ten
sity
(au
) x
10
00
0
Wavelength (nm)
Ala-DTPA Aq Arg-DTPA Aq His-DTPA Aq Ser-DTPA Aq Ala-DTPA Org Arg-DTPA Org His-DTPA Org Ser-DTPA Org
0
1
2
3
4
5
6
7
550 575 600 625 650 675 700
Emis
sio
n In
ten
sity
(au
) x
10
00
0
Wavelength (nm)
Ala-DTPA Aq
Arg-DTPA Aq
His-DTPA Aq
Ser-DTPA Aq
Ala-DTPA Org
Arg-DTPA Org
His-DTPA Org
Ser-DTPA Org
182
The Eu-HDEHP complex formed in the organic phase has different symmetry to
Eu-DTPA complexes in the aqueous phase as can be seen be the different profile of the
emission spectra of the organic phases The extraction data show that the best Eu3+
extraction occurs at pH 2 under these conditions as there is complete metal extraction
into the organic phase for all of the ligands and very little or no metal remaining in the
aqueous phase Above pH 2 the extraction of Eu3+
decreases leaving some of the metal
ion in the aqueous phase at pH 3 and an even higher proportion at pH 4 At pH 3
extraction is relatively higher with the DTPA-(SerOEt)2 ligand than any of the other
ligands and at pH 4 extraction is higher with DTPA-(HisOMe)2 and DTPA-(ArgOMe)2
The J=1J=2 peak ratios for the organic phases (Table 53) show no significant
difference in co-ordination mode within the pH 2 or pH 4 data for each ligand however
the co-ordination can be seen to change slightly with each ligand at pH 3 Also no
significant difference is observed as pH is changed for DTPA-(ArgOMe)2 and DTPA-
(AlaOMe)2 however there is a significant difference observed for DTPA-(SerOEt)2 and
DTPA-(HisOMe)2 as pH is changed Each emission spectrum was recorded 5 times and
an average taken and repeat measurements were also taken so whilst the data is
reproducible it appears to be inconsistent and difficult to explain without further
investigation into the co-ordination environment at different pH values by means other
than luminescence spectroscopy although it can be seen that pH 2 is optimum for
extraction using these ligands
Table 53 J=1J=2 peak ratios and t-test results for organic phases after extraction after
Eu3+
extraction aqueous phases containing DTPA-bis(amino ester) ligands (50 mM) at
pH 2-4
DTPA-
(AlaOMe)2
DTPA-
(ArgOMe)2
DTPA-
(HisOMe)2
DTPA-
(SerOEt)2
st dev t-test
pH 2 0208 0207 0198 0208 0005 No sig diff
pH 3 0210 0213 0311 0347 0069 Sig diff
pH 4 0182 0210 0206 0205 0013 No sig diff
st dev 0016 0003 0063 0081
t-test No sig diff No sig diff Sig diff Sig diff
183
53 Radiolysis Studies on Ligand Systems at pH 2
531 Aqueous Phase Studies
In order to determine how resistant the ligand are to radiolysis a selection of
samples at pHpD 2 containing 50 m M ligand and 1 mM Eu(NO3)3 were irradiated at
the Dalton Cumbrian Facility using a 60
Co irradiator The samples were exposed to 7
kGy γ-radiation and analysed by luminescence spectroscopy The emission spectra of
the D2O samples can be seen in Figure 59 The spectra for the samples in H2O are the
same but with lower emission intensity
Figure 59 Emission spectra of Eu(NO3)3 in D2O with DTPA-bis(amino ester) ligands
(50 mM) at pH 2 after irradiation with 7 kGy γ-radiation and following excitation at
397 nm
The spectra of the samples are the same after irradiation as beforehand
indicating that the radiation has little or no degrading effect on the complexes in the
aqueous phase The J=1J=2 ratios and co-ordination mode remained unchanged (Table
54) as do the luminescence lifetimes and q values of the samples (Table 55)
0
5
10
15
20
25
30
35
550 575 600 625 650 675 700
Emis
sio
n In
ten
sity
(au
) Th
ou
san
ds
Wavelength (nm)
Ala-DTPA
Arg-DTPA
His-DTPA
Ser-DTPA
184
Table 54 J=1J=2 peak ratios and t-test results for Eu-DTPA-bis(amino ester)
complexes at pD 2 after irradiation with 7 kGy γ-radiation
DTPA-
(AlaOMe)2
DTPA-
(ArgOMe)2
DTPA-
(HisOMe)2
DTPA-
(SerOEt)2 st dev t-test
J=1J=2 0357 0395 0412 0362 0026 No sig
diff
Table 55 Luminescence lifetimes and q values for Eu-DTPA-bis(amino ester)
complexes at pD 2-4 after irradiation with 7 kGy γ-radiation
Ligand τ D2O (μs) τ H2O (μs) q plusmn 02
DTPA-(AlaOMe)2 1818 plusmn 7 613 plusmn 8 09
DTPA-(ArgOMe)2 1843 plusmn 12 586 plusmn 10 10
DTPA-(HisOMe)2 1803 plusmn 10 629 plusmn 9 08
DTPA-(SerOEt)2 1809 plusmn 9 598 plusmn 11 09
532 Extraction Studies
Extractions were then carried out on some of the irradiated samples using 06 M
HDEHP in dodecane The emission spectra of both the aqueous and organic phases
post-extraction can be seen in Figure 510
Figure 510 Emission spectra of aqueous and organic phases after Eu3+
extraction from
an irradiated (7 kGy γ-radiation) aqueous phase containing DTPA-bis(amino ester)
ligands (50 mM) at pH 2 following excitation at 397 nm
0
1
2
3
4
5
6
550 575 600 625 650 675 700
Emis
sio
n In
ten
sity
(au
) Th
ou
san
ds
Wavelength (nm)
Ala-DTPA Aq Arg-DTPA Aq His-DTPA Aq Ser-DTPA Aq Ala-DTPA Org Arg-DTPA Org His-DTPA Org
185
The emission profiles of the samples are the same after irradiation as
beforehand indicating that the radiation has little or no degrading effect on the
complexes in the aqueous phase The emission intensity is lower for the organic phases
after irradiation than beforehand possibly due to increased quenching effects caused by
radicals present as a result of irradiating the solvents The J=1J=2 ratios and co-
ordination mode for the organic phase remained unchanged (Table 56) and the
luminescence lifetimes can be seen to decrease only slightly after irradiation consistent
with the decrease in emission intensity (Table 57)
Table 56 J=1J=2 peak ratios and t-test results for the organic phases after Eu3+
extraction from aqueous phases containing DTPA-bis(amino ester) ligands (50 mM) at
pH 2 one of which had been irradiated with 7 kGy γ-radiation
DTPA-
(AlaOMe)2
DTPA-
(ArgOMe)2
DTPA-
(HisOMe)2
DTPA-
(SerOEt)2
st dev t-test
J=1J=2 0241 0233 0198 0231 0019
No sig
diff
Table 57 Luminescence lifetimes and q values for the organic phases after Eu3+
extraction from aqueous phases containing DTPA-bis(amino ester) ligands (50 mM) at
pH 2 one of which had been irradiated with 7 kGy γ-radiation
Ligand τ organic phase
without irradiation
(micros)
τ organic phase after
irradiation
DTPA-(AlaOMe)2 2151 plusmn 21 1829 plusmn 18
DTPA-(ArgOMe)2 1881 plusmn 19 1821 plusmn 17
DTPA-(HisOMe)2 2265 plusmn 18 2227 plusmn 18
DTPA-(SerOEt)2 1856 plusmn 20 1777 plusmn 19
54 Separation Work on Ligand Systems
Some separation work using these ligands was carried out with the help of
Andreas Geist at KIT-INE in Germany Extractions were performed under TALSPEAK
conditions but using kerosene as the organic phase due to availability
186
541 AmEu Separation in Ligand Systems
A stock spiking solution of 241
Am + 152
Eu (1 kBq mL-1
) was added to a solution
of yttrium and lanthanides (10 mgdm3 of each Ln(NO3)3) with each ligand (50 mM) for
DTPA-(ArgOMe)2 DTPA-(SerOEt)2 DTPA-(HisOMe)2 at pH 1-2 The aqueous phases
were contacted with HDEHP (02 M) in kerosene and shaken for 30 minutes The
phases were then separated and the Am3+
and Eu3+
concentrations in each phase were
determined by Gamma counting The separation factors for all ligands under these
conditions were found to be approximately 100 across the pH range measured Graphs
of these data are plotted in Figures 511-513 These values are comparable with the
original TALSPEAK process using lactate (SF = 91) Although the TALSPEAK
process uses dodecane rather than kerosene and as such the results are therefore not
directly comparable they still show selectivity between Am3+
and Eu3+
for these
ligands However the DAm using these ligands is 2-3 orders of magnitude higher than in
the original TALSPEAK process (~025-200 compared to 0009) indicating that Am3+
is not being held back sufficiently by the ligand for this to be a viable process and that
more work is needed to decrease the partitioning of Am3+
into the organic phase This
may be possible with optimisation of the systems by varying the pH concentration of
ligand concentration of extractant and by modifying the solubility of the ligands ie by
cleavage of the methyl and ethyl ester groups to generate the amino acid Nevertheless
these results are particularly encouraging
Figure 511 Separation factors and distribution ratios for Eu3+
Am3+
using DTPA-
(ArgOMe)2 (005 M) at pH 1-2 extracted using HDEHP (02 M) in kerosene
187
Figure 512 Separation factors and distribution ratios for Eu3+
Am3+
using DTPA-
(SerOEt)2 (005 M) at pH 1-2 extracted using HDEHP (02 M) in kerosene
Figure 513 Separation factors and distribution ratios for Eu3+
Am3+
using DTPA-
(HisOMe)2 (005 M) at pH 1-2 extracted using HDEHP (02 M) in kerosene
542 Ln Separation in Ligand Systems
In addition to the Eu3+
Am3+
separation studies carried out at KIT-INE using
these amino ester appended DTPA ligands further experiments were conducted to
observe the separation across the lanthanide series by ICP-MS under the same
conditions The graphs of the distribution ratios for each Ln3+
and Am3+
can be seen in
Figures 514-516 for each ligand as well as the separation factor for Nd3+
Am3+
(as
188
Nd3+
is the most difficult lanthanide to extract) The SFNdAm in each case is 30-40 over
the pH range 1-2 These separation factors are good only slightly lower than the
original lactate-buffered TALSPEAK process (SFNdAm ~ 55) and the distribution ratios
for the heavier lanthanides are particularly high higher than the original process with a
greater proportion of them having D values of over 1000 (Figures 514-516)
Figure 514 Distribution ratios for Ln3+
using DTPA-(ArgOMe)2 (005 M) at pH 1-2
extracted using HDEHP (02 M) in kerosene
189
Figure 515 Distribution ratios for Ln3+
using DTPA-(SerOEt)2 (005 M) at pH 1-2
extracted using HDEHP (02 M) in kerosene
Figure 516 Distribution ratios for Ln3+
using DTPA-(HisOMe)2 (005 M) at pH 1-2
extracted using HDEHP (02 M) in kerosene
190
55 Summary and Conclusion of Modified DTPA Ligand Work
After initial difficulties synthesising amino acid appended DTPA ligands the
ligands were successfully synthesised in good yields (~60 ) for DTPA-(AlaOMe)2
DTPA-(ArgOMe)2 DTPA-(SerOEt)2 and DTPA-(HisOMe)2 using ester protected
versions of the amino acids The ligands were shown by luminescence spectroscopy to
complex to Eu3+
at pH 2 3 and 4 forming Eu-DTPA-bis(amino ester) adduct with 1
water molecule in fast exchange in the inner hydration sphere Under TALSPEAK
conditions the ligands were found to be more effective holdback reagents at the lower
pH of 2 but also effectively extract Eu3+
over Am3+
as low as pH 15 This is in stark
contrast to the original TALSPEAK process The co-ordination mode of the ligands to
the metal ion was consistent for all of the ligands but was found to change slightly upon
changing pH although the overall coordination number of Eu3+
with the ligands
remained as approximately 8 (with the 9th
coordination site being completed by one
water molecule) Studies showed that the ligands are relatively resistant to radiolysis
when subjected to 7 kGy γ radiation as there was no change in their luminescence
emission profile co-ordination mode or hydration number after irradiation
Results from separation studies conducted at KIT-INE using gamma counting
and ICP-MS showed that the modified DTPA ligands successfully allowed separation
between Ln3+
Am3+
giving good separation factors comparable to the original lactate-
buffered TALSPEAK process (SFEuAm ~100) even for Nd3+
which is the most difficult
lanthanide to extract in the process (SFNdAm ~30-40) The extraction efficiency of all the
ligands broadly relates to the atomic number of the lanthanide ions (apart from La3+
Ce3+
and Pr3+
) with the heavier ions being preferentially extracted as expected The
separation factors of individual lanthanide pairs range from approximately 25 to gt 100
and for the Dy3+
Nd3+
pair of particular economic importance are quite reasonable SF
DyNd ~ 30
However the distibution ratio for Am3+
is higher than desired (025-200 vs
0009) and so optimisation of the systems would be necessary to try to reduce DAm for
the combined buffer soft-donor system to be viable Another step would also be to try to
deprotect the amino acids on the ligands hydrolysing the esters back to carboxylic acid
groups to see if that would increase the holdback ability of the ligands and possibly
decrease the distribution ratio of Am3+
191
1 PP Hazari G Shukla V Goel K Chuttani N Kumar R Sharma and AK Mishra
Bioconjugate Chem 2010 21 229-239
2 X Wang X Wang Y Wang and Z Guo Chem Comm 2011 47 8127-8129 ESI
3 SJ Pope BJ Coe S Faulkner and R H Laye Dalton Trans 2005 1482-1490
4 S J Pope B J Coe and S Faulkner Chem Commun 2004 1550-1551
192
6 SUMMARY CONCLUSIONS amp FUTURE WORK
61 Summary amp Conclusions
One technique for reprocessing SNF currently being developed in the USA is
the TALSPEAK process an advanced reprocessing method for the separation of Ln3+
and MA3+
components The traditional process developed in the 1960s uses DTPA to
act as a holdback reagent for MA3+
in a lactate buffered aqueous phase at pH 36
allowing Ln3+
to be selectively extracted by organophosphate HDEHP into an organic
phase of DIPB or dodecane TALSPEAK is one of the most promising techniques being
researched due to its numerous advantages particularly its relative resistance to
irradiation and ability to be carried out without the need for high reagent concentrations
Additionally it gives high separation factors in the region of ~50-100 which is
comparable to other advanced reprocessing methods currently being developed1 Since
the chemistry of the process is very complex and not particularly well understood it
would be an advantage to simplify the process by removing the need for a separate
holdback reagent and buffer
Recent studies have shown that complexants with soft donor atoms such as N or
S (relative to O) can be used to separate MA3+
from Ln3+
23
Initial research was carried
out by our collaborators at the Idaho National Lab testing the suitability of amino acids
(L-alanine L-arginine L-histidine and L-methionine) as a potential combined buffer
and soft donor by determining whether amino acids preferentially bind to MA3+
Another benefit to using amino acids would be the scope for carrying out the process at
a lower pH (~ pH 2) due to the lower pKa values of the carboxylic acid groups of the
amino acids than on DTPA Lower pH values are preferred by industry as higher acid
concentrations are easier to control on a large scale and are also known to increase the
Ln3+
distribution coefficients4
This work carried out by Grimes5 showed that amino acids do not act as
holdback reagents in their own right and that no separation of Ln3+
Am3+
is achieved
when they are used without Na5DTPA in solution However investigations showed that
when used alongside Na5DTPA good separation (SFEuAm ~ 66) can be achieved when
using 05 M L-alanine at pH 2 (cf ~25 at pH 3) however the DAm value was relatively
high than at the lower pH (DAm 047 at pH 2 cf 012 at pH 3) as more protonated forms
of the DTPA molecule are present in solution at low pH and the holdback reagent is not
able to bind as strongly to metal ions allowing more Am3+
to be partitioned into the
organic phase
193
However optimisation of the system in order to maximise the separation whilst
keeping Am3+
partitioning to a minimum by changing the concentrations of holdback
reagent and extractant proved to be successful The optimum conditions were found to
be 04 M Na5DTPA and 02 M HDEHP giving a separation factor of 71 plusmn 5 with a DAm
value of 008 Although this separation is not as good as a traditional lactate
TALSPEAK system (SF = 91 DAm = 0009) the use of L-alanine (pKa = 235) as a
buffer would allow the process to be carried out at pH 2 which is a much more
preferable pH for industry
Separations were carried out using other amino acids at varying pH values and it
was found that L-methionine was too poorly soluble at pH 3 and did not give very good
separation data at pH 2 L-arginine was found to have kinetic issues at pH 2 and 3
giving poor separation of the heavier lanthanides The amino acid L-histidine (pKa =
182) however gave good separation data at pH 3 with a SFEuAm of 99 comparable to
that of the original TALSPEAK process and a DAm of 007 comparable to the optimised
L-alanine system Unfortunately ICP-MS studies on lanthanides La-Ho using L-
histidine at pH 3 showed that the same kinetic problems arise for this system as for L-
alanine at pH 3 and L-arginine at pH 2 and 3 as the DLn value decreases for later
lanthanides
The interaction of the buffers glycine L-alanine L-serine L-phenylalanine and
lactate (for comparison) with Eu3+
and [Eu(DTPA)]2-
systems was investigated by
luminescence and 1H NMR spectroscopies As expected it was found that amino acids
and lactate do not form stable complexes with either the free metal ion or the metal-
DTPA complex and that the buffers are likely to be in fast exchange with surrounding
solvent molecules as the number of water molecules in the inner hydration sphere (q) of
Eu3+
was reduced from 9 to ~6 when buffers were added to the aqua ion in solution
Luminescence studies on L-phenylalanine (like other amino acids) showed that it does
not bind to the metal ion as there was no sensitised emission from Tb3+
ion when
excited into the phenyl chromophore of the amino acid when the two components were
in solution Emission spectra of Eu3+
and Cm3+
aqua ions and their corresponding
DTPA complexes showed no change in emission profile upon the addition of amino
acidslactate There was also no change in q when buffers were added to metal-DTPA
complexes in solution for Eu3+
or Cm3+
Radiolysis studies carried out on lactate and amino acid buffered [Eu(DTPA)]2-
systems showed that the systems are relatively resistant to γ-radiation when exposed to
5 kGy γ-radiation This is consistent with previous work conducted by the INL showing
194
that separation systems using L-alanine as a buffer are more resistant to radiolysis than
the original TALSPEAK process using lactate67
A 05 M L-alanine buffered
TALSPEAK system using 04 M Na5DTPA and 02 M HDEHP at pH 2 can therefore
be seen to be a promising alternative to the traditional lactate buffered system as it has
been shown to give good separation data with fairly low extraction of Am3+
and the
buffer is also more resistant to radiolysis than lactate Additionally it allows the process
to be carried out at a lower pH of 2 which is much more practical for industrial
operation
Since amino acids were found not to act as holdback reagents in their own right
the potential of using the larger tripeptide L-glutathione (GSH) was investigated Initial
separation studies carried out using glutathione at pH 4 (as GSH has 2 pKa values
below 4 and Garg et al reported that the optimum stability for Ln-GSH complexes
occurs in solutions between pH 34-348)8 Preliminary investigations found that as
with the amino acids studied GSH is ineffective as a holdback reagent on its own as
there was no separation observed between Eu3+
and Am3+
when used without
Na5DTPA
Analogous to the amino acid studies subsequent investigations were carried out
using GSH alongside Na5DTPA to determine whether separation was improved with the
tripeptide buffer A pH dependence study found that at pH 2 and pH 3 the glutathione
acts solely as a buffer in the systems as the separation factor in each case was
independent of GSH concentration However at pH 4 interestingly separation between
Eu3+
and Am3+
was found to increase as the buffer concentration was increased up to
05 M suggesting that the glutathione is interacting with the Ln-DTPA complexes at
this pH This could be explained by the increase in stability of Ln-GSH complexes as
the pH is increased
Using 05 M GSH the separation factor was found to increase dramatically as a
function of Na5DTPA concentration up to 03 M Na5DTPA After this peak there was
a rapid decrease in separation as the concentration was increased further up to 06 M
Na5DTPA as the stoichiometry is close to 11 GSHDTPA The separation factors
achieved here were extremely high (~1000) ndash a factor of 10 higher than the current
TALSPEAK system and the optimised L-alanine system whilst still maintaining low
Am3+
extraction (DAm = 0002 with 03 M Na5DTPA) lower than in the traditional
TALSPEAK process
At 03 M Na5DTPA the separation factor then increased as the extractant
concentration was increased from 02 to 04 M HDEHP in dodecane after which the SF
195
began to decrease again with the optimum separation at 04 M extractant giving a SF
of 1238 (DAm = 00018) At 04 M Na5DTPA however the separation factor decreases
rapidly as the extractant concentration is increased due to the DAm increasing by a
factor of 1000 consistent with the complexant and buffer possibly forming an adduct
which no longer successfully holds back Am3+
at higher Na5DTPA concentrations
Luminescence experiments mimicking the separation studies showed that the
glutathione does not form a stable complex with the Eu3+
ion and is in exchange with
surrounding solvent molecules comparable to the amino acid buffer studies even at the
highest buffer concentrations 1H NMR spectroscopy confirmed that although the
glutathione may be in exchange with surrounding water molecules no kinetically stable
complexes between the buffer and metal ions are formed In samples containing
Na5DTPA a Eu-DTPA complex can be clearly observed in the emission spectra with
or without the presence of GSH over a pH range of 2-4 The J=1J=2 peak ratios
showed that there is no change in the co-ordination mode of the buffer to the metal ion
as the concentration of GSH is increased for each pH however across the data sets the
co-ordination mode of glutathione was found to be different at different pH values as
expected based on pKa values and increasing stability constant with pH
The co-ordination mode of the Eu-DTPA in the aqueous phase with 05 M GSH
was found not to change as [Na5DTPA] was changed with metal extraction typically
decreasing as the holdback reagent increases and at 03 M Na5DTPA with 05 M GSH
extraction was found to increase as HDEHP concentration increased as expected
The GSH buffered system was found to be susceptible to radiolysis when
subjected 7 kGy γ-radiation from a 60
Co irradiator and seen to degrade into γ-Glu-Cys
fragments However the degradation was seen to have little effect on the extraction of
metal ions from the aqueous phase when analysed by luminescence spectroscopy with
only slightly decreased emission intensity post-irradiation The emission profiles co-
ordination mode and luminescent lifetimes of the samples remained unchanged
In order to be a successful alternative to the current TALSPEAK system it is
essential that effective separation of all lanthanides from MA3+
can occur Further
luminescence experiments were carried out firstly on analogous dysprosium systems in
order to represent heavier lanthanide elements followed by a mixture of four different
lanthanide metals in the same samples (Sm3+
Eu3+
Tb3+
and Dy3+
) For the dysprosium
study as the pH was increased from 2-4 the extraction of Dy3+
decreased suggesting
that the same kinetic issues noted for heavier lanthanides in the amino acid systems may
also be present for the GSH system at higher pH values In the mixed samples the same
196
pattern was observed with extraction of Ln3+
decreasing as pH was increased At pH 4
extraction of all lanthanide ions was very low particularly for Tb3+
and Dy3+
which are
both heavier than Sm3+
and Eu3+
ICP-MS carried out on a series of samples containing
a mixture of 10 lanthanides (La3+
-Ho3+
) was consistent with the luminescence data
showing decreased extraction of heavier lanthanides as pH increases from 2 to 4 The
quantity of metal extracted was so low it was below the limit of detection for some of
the heavier metals at pH 4 forcing the conclusion that unfortunately the same kinetic
issues are a problem at higher pH for the glutathione buffered system as for the amino
acid systems
Initial data obtained on the glutathione system with europium(III) and
americium(III) seemed promising as after optimisation very high separation factors for
Eu3+
Am3+
were achieved (~1000) with very low Am3+
partitioning (DAm ~0002) and
although the buffer was found to be susceptible to radiolysis extraction of lanthanide
ions still remained high after irradiation However subsequent studies with heavier
lanthanides showed that the GSH buffered system is subject to the same kinetic
problems as some of the amino acid systems
Based on the results from studies using amino acid and glutathione buffered
systems demonstrating that Ln3+
MA3+
separation cannot be achieved without the
presence of DTPA and a buffer the possibility of synthesising a combined buffer and
soft-donor was considered Amino acids were appended onto DTPA through reaction of
amino acid esters with DTPA dianhydride to form DTPA-(AlaOMe)2 DTPA-
(ArgOMe)2 DTPA-(SerOEt)2 and DTPA-(HisOMe)2 in good yields (~ 60 ) The
ligands were shown by luminescence spectroscopy to complex to Eu3+
at pH 2 3 and 4
forming Eu-DTPA-AA2 adducts with 1 water molecule in fast exchange in the inner
hydration sphere Under TALSPEAK conditions the ligands were found to be more
effective holdback reagents at the lower pH of 2 and even at pH 15 The co-ordination
mode of the ligands to the metal ion was consistent for all of the ligands being typical
of lanthanide DTPA-amide ligands known in the literature910
but was found to change
upon changing pH These ligands were also found to be relatively resistant to radiolysis
when subjected to 7 kGy γ radiation from a 60
Co irradiator as there was no change in
their luminescent emission profile co-ordination mode or hydration number after
irradiation
Results from separation studies conducted at KIT-INE using gamma counting
and ICP-MS showed that the modified DTPA ligands successfully allowed separation
between Ln3+
Am3+
giving good separation factors comparable to the original lactate-
197
buffered TALSPEAK process (SFEuAm ~100) even for Nd3+
which is the most difficult
lanthanide to extract in the process (SFNdAm ~30-40) The extraction efficiency of all the
ligands broadly relates to the atomic number of the lanthanide ions (apart from La3+
Ce3+
and Pr3+
) with the heavier ions being preferentially extracted as expected The
separation factors of individual lanthanide pairs range from approximately 25 to gt 100
and for the Dy3+
Nd3+
pair of particular economic importance are quite reasonable SF
DyNd ~ 30
However the distibution ratio for Am3+
is much higher than desired for the
modified DTPA ligands (DAm = 025-200 vs DAm 0009) and so optimisation of the
systems would be necessary to try to reduce DAm for the combined buffer soft-donor
system to be viable Initial studies on combined DTPA-bis(amino ester) ligands is
promising allowing the TALSPEAK process chemistry to be simplified and providing a
system which could be buffered to a lower pH (pH 2) as preferred by industry The
synthesis of the ligands is quite moisture sensitive and the products are very
hygroscopic and difficult to purify making the application of them on an industrial
scale potentially problematic but the simplification of the process on a laboratory scale
would allow the chemistry of the TALSPEAK process to be further investigated and
better understood for future developments
Although there are a number of variations of the TALSPEAK process being
developed including the TALSQuEAK (Trivalent Actinide Lanthanide Separation
using Quicker Extractants and Aqueous Complexes) process11
which uses alternative
extractant HEH[EHP]12
and alternative holdback reagent HEDTA13
the use of amino
acid and short-chain peptide buffers is unique to this project in collaboration with the
Idaho National Laboratory There has been some investigation into the use of malonate
buffers for TALSPEAK14
but there are no other reports of the use of amino acids or
peptides in the literature Additionally there are few published reports on the use of
luminescence spectroscopy in TALSPEAK studies chiefly on the complexation of Eu3+
with lactate15
complexation of Eu3+
Cm3+
with DTPA16
and complexation of Eu3+
with
HDEHP in the organic phase17
There is no literature on systems as a whole
A report on bis(methionine)-appended DTPA was published by Hazari et al in
2010 on the use of Tc-DTPA-bis(methionine) in tumour imaging18
however there are
no literature reports on the synthesis or use of amino acid appended or any modified
DTPA ligands for solvent extraction and separation studies
198
62 Future Work
As only a small selection of amino acids have been tested as buffers it would be
interesting to try more of them The original selections were made on the basis of their
chemical structures solubilities and previous work conducted at INL plus presence of
any soft donor atoms L-alanine was selected as it has the most similar structure to lactic
acid although glycine may be worth considering as well based on its also very similar
structure and high aqueous solubility Results with L-arginine and L-methionine were
not very promising possibly due to their longer chain backbones so it may be worth
considering the similar shorter-chain amino acids L-cysteine and L-threonine as these
have similar structures to L-serine which along with glycine was one of the amino
acids investigated by luminescence spectroscopy Although L-cysteine has poor
solubility like L-methionine it would be interesting to see how these amino acids
behave as buffers when subjected to the same separation and optimisation tests as L-
alanine Similarly medium length chain amino acids L-glutamic acid L-aspartic acid
L-asparagine and L-glutamine may also be worth considering (Figure 61)
Figure 61 Chemical structures of amino acids taken from reference 1919
199
In addition to investigating other amino acid buffer systems as discussed in
Chapter 4 there may be some benefit to carrying out experiments with other short chain
peptides such as eisenin and norophthalmic acid as well as some of the B vitamins that
were considered (vitamins B7 and 9) before L-glutathione was selected From the
results obtained with L-glutathione demonstrating that the tripeptide interacts with the
Ln-DTPA complex under certain conditions it is possible that these other peptides may
also interact and potentially aid in extraction of Ln3+
or selective holdback of MA3+
Although the desired result was not achieved with L-glutathione as it seems to
suffer the same kinetic issues which have been common with amino acids causing very
good extraction of the lighter lanthanides but very poor extraction of the heavier
lanthanides further optimisation of the GSH system to exploit the combined liquid-
liquid extraction efficiencies as a function of atomic number may allow the
development of an extraction process of lighter over heavier lanthanides for rare earth
recycling which is currently a strategically important goal20
Initial studies on the modified DTPA ligands showed promising results for a
combined buffer and soft-donor although there is still much work to be done in this
area It would be useful to determine the stability constants of the ligands with
lanthanides and with Am3+
and Cm3+
if possible preferably by potentiomenty which
has proven to be the most reliable method for determining stability constants for these
types of complexes21
The next step in process development with the ligands would be
to optimise the systems (as was done for the L-alanine and GSH buffered systems) in
order to reduce the partitioning of Am3+
and decrease DAm as much as possible ideally
to the same of magnitude of the lactate and GSH buffered systems by altering pH
concentration of ligand and concentration of extractant to maximise separation and
minimise americium distribution
A further step would also be to try to deprotect the amino acids on the DTPA-
amino ester ligands hydrolysing the esters back to carboxylic acid groups to see if that
would increase the holdback ability of the ligands and possibly decrease the distribution
ratio of Am3+
It is envisioned that the research presented in this thesis could be applied to
current and new technologies and challenges faced in the future of the nuclear industry
in particular towards the development of a TALSPEAK-style advanced reprocessing
procedure for implementation in the USA within the near future
200
1 G Modolo A Geist and M Miguirditchian Minor actinide separations in the
reprocessing of spent nuclear fuels recent advances in Europe in R Taylor ed
Reprocessing and Recycling of Spent Nuclear Fuel Woodhead Publishing UK 2015
10 245-279
2 M P Jensen and A H Bond J Am Chem Soc 2002 124 9870-9877
3 L R Martin B J Mincher and N C Schmitt J Radioanal Nucl Chem 2009 282
523-526
4 B Weaver and T A Kappelmann Talspeak A new method of separating americium
and curium from the lanthanides by extraction from an aqueous solution of an
aminopolyacetic acid complex with a monoacidic organophosphate or phosphonate
Oak Ridge National Laboratory 1964 1-60
5 TS Grimes RD Tillotson and LR Martin Solv Extraction and Ion Exchange
2014 32 378-390
6 Dr Leigh Martin Idaho National Laboratory unpublished results
7 LR Martin S P Mezyk and BJ Mincher J Phys Chem A 2009 113 141-145
8 BS Garg BK Singh DN Kumar and PK Sing Indian J Chem 2003 42A 79-83
9 C L Davies N G Housden and A-K Duhme-Klair Angew Chem Int Ed Engl 2008
47 8856
10 SJA Pope Polyhedron 2007 26 17 4818-4824
11 JC Braley JC Carter SI Sinkov KL Nash and GJ Lumetta J Coord Chem
2012 65 16 2862-2876
12 GJ Lumetta AJ Casella BM Rapko TG Levitskaia NK Pence JC Carter
CM Niver and MR Smoot Solv Extraction Ion Exchange 2015 33 346-361
13 JC Braley TS Grimes and KL Nash Ind Eng Chem Res 2012 15 629-638
14 JL Lapka and KL Nash Solv Extraction Ion Exchange 2015 33 346-361
15 G Tian LR Martin and L Rao Inorg Chem 2010 49 10598-10605
16 G Tian LR Martin and L Rao Inorg Chem 2015 54 1232-1239
17 TS Grimes G Tian L Rao and KL Nash Inorg Chem 2012 51 6299-6307
18 PP Hazari G Shukla V Goel K Chuttani N Kumar R Sharma and AK
Mishra Bioconjugate Chem 2010 21 229-239
19 DWhite Wisegeek What are Amino Acids httpwwwwisegeekorgwhat-are-
amino-acidshtm 2015
20 LS Natrajan and MH Langford Paden f-Block Elements Recovery in A Hunt ed
Element Recovery and Sustainability RSC 2013 6 140-184
21 G Tian LR Martin and LRao Inorg Chem 2015 54 1232-1239
201
7 EXPERIMENTAL SECTION
71 Chemicals and Reagents
All chemicals and solvents were purchased from Sigma-Aldrich chemical
company and were used as received Radioisotopes were supplied by the Idaho National
Laboratory or the Institute for Nuclear Waste Disposal (INE) and were used in
accordance with the local rules for manipulation of high specific activity materials
711 Handling Radioisotopes at INL
In order to handle radioisotopes at INL it was necessary to compete the
RadWorker 2 training and theory and practical examinations Upon entering a radiation
area (laboratory) it was a requirement to sign onto the dosimetry record system and
collect a dosimeter which was to be worn on the chest at all times in the area When
handling radioactive material within the designated controlled areas (fume hoods) extra
layers of PPE (personal protective equipment) such as triple layered shoulder length
gloves were to be worn and disposed of immediately upon leaving the controlled area in
designated radioactive waste bins It was then a requirement to monitor the upper body
area carefully with an alpha and a beta radiation detector Whilst working in the
controlled area any potentially contaminated PPE or samples had to be disposed of and
immediately replaced in the case of PPE After preparing sealed samples in the
controlled areas a Radiological Control worker would assist with swabbing each
sample to check for contamination before it could be removed from the area for further
analysis Samples were not to be opened outside of controlled areas and were returned
to the controlled area fume hood to be disposed of by solidification Upon leaving
radiation areas a full body scan was conducted and dose records updated as dosimeters
were returned
72 Complexation studies of Ln3+
amp An3+
with amino acids in TALSPEAK systems
721 Preparation of samples for luminescence studies
7211 Stock solutions
Stock solutions (10 mM 10 mL) were made up for each lanthanide (EuTb)
using the corresponding lanthanide nitrate salt Ln(NO3)3xH2O in H2O or D2O as
required A stock solution of Na5DTPA in H2OD2O (1 M 50 mL) was made up from a
40 wv Na5DTPA solution in H2O by dilution (2517 g into 50 mL) Stock solutions
of amino acids (Gly L-Ala L-Ser) in H2OD2O (125 M 20 mL) were prepared from
202
the crystalline form of each amino acid and a stock solution of DL-lactic acid was
prepared by dilution (225 g in 20 mL) For the sensitisation study with L-Phe due to
poor solubility of L-Phe a 0625 M stock solution in D2O was made using the powdered
form of the amino acid Additionally a stock solution of HDEHP in n-dodecane (645 g
in 100 mL 02 M) was prepared All reagents were purchased from Sigma-Aldrich
Stock solutions
10 mM EuTb(NO3)3 in H2OD2O
1 M Na5DTPA in H2OD2O
125 M GlyL-AlaL-SerLactate in H2OD2O
0625 M L-Phe in D2O
02 M HDEHP in n-dodecane
7212 Preparation of aqueous samples
5 mL samples were prepared using the stock solutions above Ln(NO3)3xH2O
(05 mL) was added to each amino acid solution (4 mL) with either Na5DTPA solution
(05 mL) or H2OD2O (05 mL) depending on whether the samples contained DTPA
This produced individual samples with concentrations of 1 mM Ln3+
1 M amino
acidlactate (05 M for L-Phe) and 01 M Na5DTPA if applicable The pHpD of
samples was adjusted individually with concentrated HNO3 and NaOH to minimise
change in volume using a Mettler Toledo Seven Compact pHion Meter pD (-log10
deuterium ion concentration) was calculated using Equation 71 to account for the
activity coefficient difference between the different isotopes of the hydrogen ion where
pH = the meter reading from a calibrated pH electrode All samples were repeated in
triplicate analagous to the solvent extraction samples performed at INL
Equation 71
7213 Preparation of extracted samples
Aqueous samples were prepared using the stock solutions above Na5DTPA
solution (05 mL) was added to amino acid solution (4 mL) and the mixture was pre-
equilibrated by contacting with n-dodecane and shaken using a Scientific Industries
Vortex Genie 2 Mixer and Shaker for 15 minutes The phases were allowed to separate
and the organic layer was discarded Ln(NO3)3 solution (05 mL) was added to the
aqueous phase and the pH was adjusted individually with concentrated HNO3 and
NaOH to minimise change in volume using a Mettler Toledo Seven Compact pHion
203
Meter The pD was calculated using Equation 71 The aqueous phases were contacted
with HDEHP in n-dodecane (5 mL 02 M) The solutions were then shaken again for 15
minutes left to settle and separated into the two phases for analysis All samples were
repeated in triplicate analagous to the solvent extraction samples performed at INL
722 Radiolysis of samples
Fricke dosimetry can be used to determine dose rates from radiation sources
such as from a 60
Co irradiator used to irradiate samples for radiolysis studies at the
Dalton Cumbrian Facility An aerated iron(II) sulphate solution is irradiated to give free
radicals according to the following reactions
H2O rarr H + OH
OH + Fe2+
rarr Fe3+
+ HO-
H + O2 rarr HO2
H+ + Fe
2+ + HO2 rarr Fe
3+ + H2O2
H2O2 + Fe2+
rarr Fe(OH)2+
+ OH
HO2 + Fe3+
rarr Fe2+
+ O2 + H+
This means that each H radical causes the oxidation of 3 Fe2+
ions to Fe3+
The amount
of Fe3+
present can then be measured using UV-visible spectroscopy and the dose rate
calculated from this1
7221 Preparation of Fricke solution
A Fricke solution was needed for the first set of radiolysis experiments carried
out using the 60
Co irradiator at the DCF as it allows the amount of exposure to be
calculated for each sample position during irradiation
FeSO47H2O (020206 g 133 mM) NaCl (003031 g 052 mM) and H2SO4 (95-98
11 mL) were added to deionised water (500 mL) The resulting Fricke solution was
then air-saturated and stored away from natural and artificial light sources
7222 Calculating dose rates
The UV-vis spectra of Fricke solution was then read before and after irradiation
and the following equation used to work out the dose rate
The dose can be calculated from the equation designed by Spinks and Woods (Equation
72)2
204
Equation 72
Where
F (Faradayrsquos constant) = 0965 x 109 A mol
-1
εFe(III) = Fe(III) molar extinction coefficient = 2174 M-1
cm-1
ρ = Fricke solution density = 1204 g mL-1
G = Critical Dose Value for Fe3+
= 148 molecules per 100 eV for x-rays
V = Volume of sample (mL) = 1
ODi = Optical density of irradiated solution
ODb = Optical density of non-irradiated control
The Spinks and Woods equation is specific to X-rays and must be adjusted so that it can
be applied to the use of γ-rays (Equation 73)
For γ-rays
εFe(III) = 2197 M-1
cm-1
G = 162 molecules per eV
Equation 73
Equation 74
Due to the design of the irradiator different positions in the machine receive
slightly different dose rates resulting in each sample receiving slightly different
amounts of radiation although the variation in dose is not significant and each sample
was calculated to receive an average of 114 Gy min-1
205
Table 71 Dose rates received at each sample position in the 60
Co irradiator at DCF
Position Dose Rate (Gy
min-1
)
1 1084678
2 1171864
3 1183066
4 1103841
73 Solvent extraction and separation studies using amino acids and glutathione at
INL
731 Preparation of samples
7311 Stock solutions for amino acid studies
A stock solution of Na5DTPA in H2O (1 M 100 mL) was made up from a 40
wv Na5DTPA solution in H2O by dilution (2517 g into 50 mL) A stock solution of L-
alanine in H2O (1 M 200 mL) was prepared from its crystalline form Additionally a
stock solution of HDEHP in n-dodecane (3224 g in 100 mL 1 M) was prepared This
was subsequently diluted with n-dodecane to prepare stock solutions of 02 04 06 and
08 M HDEHP in n-dodecane stock solutions as well
Stock solutions
1 M Na5DTPA in H2O
1 M L-Ala in H2O
10 08 06 04 02 M HDEHP in n-dodecane
7312 [Na5DTPA] dependence SX samples for amino acid studies
5 mL aqueous samples were prepared using the stock solutions above L-alanine
solution (25 mL) was added to a calculated volume of Na5DTPA solution to produce
samples with the desired DTPA concentration (006 007 008 009 01 02 03 04
05 M) when made up to 5 mL with water The pH of samples was adjusted individually
with concentrated HNO3 and NaOH to minimise change in volume using a Mettler
Toledo Seven Compact pHion Meter 02 M HDEHP in n-dodecane was used for the
solvent extraction All samples were repeated in triplicate
7313 [HDEHP] dependence SX samples for amino acid studies
5 mL aqueous samples were prepared using the stock solutions above L-alanine
solution (25 mL) was added to a calculated volume of Na5DTPA solution to produce
samples with the desired DTPA concentration (01 02 03 04 05 M) when made up
206
to 5 mL with water The pH of samples was adjusted individually with concentrated
HNO3 and NaOH to minimise change in volume using a Mettler Toledo Seven
Compact pHion Meter 02 04 06 08 and 10 M HDEHP in n-dodecane was used for
the solvent extraction All samples were repeated in triplicate
7314 Other amino acid SX samples for amino acid studies
5 mL aqueous samples were prepared for L-His and L-Met buffered systems
The Na5DTPA stock solution (025 mL) was added to L-His (0388 g) and L-Met (0373
g) separately to make samples with concentrations of 005 M Na5DTPA and 05 M
amino acid when made up to 5 mL with water The powdered forms of the amino acids
were used due to their poor solubility The pH of samples was adjusted individually
with concentrated HNO3 and NaOH to minimise change in volume using a Mettler
Toledo Seven Compact pHion Meter 02 M HDEHP in n-dodecane was used for the
solvent extraction All samples were repeated in triplicate
7315 Stock solutions for glutathione studies
A stock solution of Na5DTPA in H2O (1 M 100 mL) was made up from a 40
wv Na5DTPA solution in H2O by dilution (2517 g into 50 mL) Additionally a stock
solution of HDEHP in n-dodecane (3224g in 100mL 1 M) was prepared This was
subsequently diluted with n-dodecane to prepare stock solutions of 02 04 06 and 08
M HDEHP in n-dodecane stock solutions as well
Stock solutions
1 M Na5DTPA in H2O
10 08 06 04 02 M HDEHP in n-dodecane
7316 [GSH] dependence SX samples without Na5DTPA
GSH (0768 g) was dissolved in water (5 mL) to make a 05 M solution The
powdered form of the peptide was used due to its poor solubility The pH of sample was
adjusted with concentrated HNO3 and NaOH to minimise change in volume using a
Mettler Toledo Seven Compact pHion Meter 02 M HDEHP in n-dodecane was used
for the solvent extraction All samples were repeated in triplicate
7317 [GSH] and pH dependence SX samples with Na5DTPA
5 mL aqueous samples were prepared for GSH buffered systems The Na5DTPA
stock solution (025 mL) was added to varying quantities of GSH to make samples with
207
concentrations of 005 M Na5DTPA and the desired concentration of GSH (01 02 03
04 05 M) when made up to 5 mL with water The pH of samples was adjusted
individually with concentrated HNO3 and NaOH to minimise change in volume using
a Mettler Toledo Seven Compact pHion Meter 02 M HDEHP in n-dodecane was used
for the solvent extraction All samples were repeated in triplicate
7318 [Na5DTPA] dependence SX samples for GSH studies
5 mL aqueous samples were prepared for GSH buffered systems GSH (0768 g)
was added to a calculated volume of Na5DTPA solution to produce samples with
concentrations of 05 M GSH and the desired DTPA concentration (005 01 02 03
04 05 06 M) when made up to 5 mL with water The pH of samples was adjusted
individually with concentrated HNO3 and NaOH to minimise change in volume using
a Mettler Toledo Seven Compact pHion Meter 02 M HDEHP in n-dodecane was used
for the solvent extraction All samples were repeated in triplicate
7319 [HDEHP] dependence SX samples for amino acid studies
5 mL aqueous samples were prepared for GSH buffered systems GSH (0768 g)
was added to a calculated volume of Na5DTPA solution to produce samples with the
concentrations of 05 M GSH and the desired DTPA concentration (03 M and 04 M)
when made up to 5 mL with water The pH of samples was adjusted individually with
concentrated HNO3 and NaOH to minimise change in volume using a Mettler Toledo
Seven Compact pHion Meter 02 04 06 08 and 10 M HDEHP in n-dodecane was
used for the solvent extraction All samples were repeated in triplicate
732 Gamma counting
2 mL of each sample was transferred into a 4 mL sample vial in duplicate One
of the duplicate sets of samples was contacted with 2 mL n-dodecane to pre-equilibrate
the aqueous phase and the other duplicate set was contacted with the stock solution of
HDEHP in n-dodecane to pre-equilibrate the organic phase All of the samples were
then shaken using a VWR Multi-Tube Vortexer for 15 minutes Samples were then
placed in a Boeco S-8 Centrifuge for 5 minutes at 5400 rpm to separate the layers
The organic phase of the pre-equilibrated aqueous phase was discarded and the
aqueous phase of the pre-equilibrated organic phase was discarded 05 mL each
retained phase was then contacted in a 2 mL sample vial in triplicate and spiked with 10
microL 241
Am or 154
Eu stock solutions (1 kBq mL-1
) Samples were then shaken again using
208
a VWR Multi-Tube Vortexer for another 30 minutes before being placed in a Boeco S-
8 Centrifuge for 5 minutes at 5400 rpm to separate the layers
300 microL of each organic phase was transferred into counting tubes and 300 microL of
each aqueous phase was transferred into separate tubes Control tubes containing 300
microL HNO3 spiked with 10 microL 241
Am or 154
Eu stock solutions (1 kBq mL-1
) were also
prepared γ counting was performed on the samples using a Packard Cobra II Gamma
Counter Results were averaged from each of the samples in triplicate
733 ICP-MS
Samples were made up as for SX samples with other amino acids for L-His and
(Section 7314) and for GSH (Section 7318) 2 mL of each sample was transferred
into a 4 mL sample vial 10 microL mixed Ln 110 stock solution (5 mgL-1
of each of La
Ce Pr Nd Sm Eu Gd Tb Dy Ho) was spiked into each sample and samples were
contacted with 2 mL HDEHP in n-dodecane (02 M) All of the samples were then
shaken using a VWR Multi-Tube Vortexer for 15 minutes Samples were then placed in
a Boeco S-8 Centrifuge for 5 minutes at 5400 rpm to separate the layers
The organic phase was discarded and 10 microL of the aqueous phase was
transferred into ICP-MS vials containing 10 mL 2 HNO3 in triplicate Control tubes
containing 10 mL 2 HNO3 spiked with 10 microL mixed Ln 110 stock solution were
also prepared ICP-MS was carried out to determine the concentration of each
lanthanide in the organic and aqueous phase Results were averaged from each of the
samples in triplicate
74 Luminescence studies and solvent extraction using glutathione at UoM
741 Preparation of luminescence samples
7411 Stock solutions for GSH studies
Stock solutions (10 mM (100 mM for Dy3+
) 10 mL) were made up for each
lanthanide (EuTbDySm) using the corresponding lanthanide nitrate salt
Ln(NO3)3xH2O in H2O or D2O as required A mixed lanthanide solution was also made
up to contain the same concentrations of each of the lanthanides above A stock solution
of Na5DTPA in H2OD2O (1 M 50 mL) was made up from a 40 wv Na5DTPA
solution in H2O by dilution (2517 g into 50 mL) Additionally a stock solution of
HDEHP in n-dodecane (3224 g in 100 mL 1 M) was prepared This was subsequently
diluted with n-dodecane to prepare stock solutions of 02 04 06 and 08 M HDEHP in
n-dodecane stock solutions as well All reagents were purchased from Sigma-Aldrich
209
Stock solutions
10 mM EuTbSm(NO3)3 in H2OD2O
100 mM Dy(NO3)3 in H2OD2O
Mixed Ln solution with 10 mM EuTbSm(NO3)3 in H2OD2O and 100 mM Dy(NO3)3
1 M Na5DTPA in H2OD2O
10 08 06 04 02 M HDEHP in n-dodecane
7412 Preparation of aqueous samples
Samples were made up using the stock solutions above in the same way as for
the solvent extraction and separation studies carried out at INL (Sections 7312 to
7319) pD was calculated using Equation 71
7413 Preparation of extracted samples
5 mL aqueous samples were prepared using the stock solutions above GSH
(0768 g) was added to a calculated volume of Na5DTPA solution to produce samples
with the concentrations of 05 M GSH and the desired DTPA concentration (varied
according to the study) when made up to 5 mL with water The mixture was pre-
equilibrated by contacting with n-dodecane and shaken using a Scientific Industries
Vortex Genie 2 Mixer and Shaker for 15 minutes The phases were allowed to separate
and the organic layer was discarded Ln(NO3)3 solution (05 mL) was added to the
aqueous phase and the pH was adjusted individually with concentrated HNO3 and
NaOH to minimise change in volume using a Mettler Toledo Seven Compact pHion
Meter pD was calculated using Equation 71 The aqueous phases were contacted with
5 mL HDEHP in n-dodecane (varied according to the study) The solutions were then
shaken again for 15 minutes left to settle and separated into the two phases for analysis
All samples were repeated in triplicate analagous to the solvent extraction samples
performed at INL
742 Radiolysis of GSH samples
Radiolysis experiments on GSH buffered systems were carried out using the
60Co irradiator at DCF These irradiations were undertaken at a later date than the initial
amino acid radiolysis studies (Section 722) using a new calibrated sample holder with
known dose rates and so preparation and use of a Fricke solution was not necessary
Samples received an average of 7 kGy γ radiation
210
75 Modified DTPA Ligands
751 Synthesis of modified DTPA ligands
L-alanine methyl ester hydrochloride (0837 g 62 mmol) was dissolved in DMF
(15 mL) and added dropwise to DTPA dianhydride (107 g 3 mmol) in DMF (75 mL)
and 3 mL triethylamine (TEA) with stirring under nitrogen in an ice bath at 0 degC The
ice bath was removed after 2 hours and the reaction was left to stir at room temperature
for 48 hours The reaction was quenched with H2O (75 mL) and the solvent evaporated
to ~10 mL The resulting yellow oil was added dropwise to acetone (100 mL) with
stirring and the product precipitated The product was collected by sinter filtration
(porosity 3) under nitrogen as a crude white powder (yield 132 g 78) It was washed
with diethyl ether (3 x 20 mL) chloroform (3 x 20 mL) and diethyl ether again (3 x 20
mL) This was then dried under vacuum to give a white micro-crystalline product
(yield 1031 g 61 ) Multiple re-precipitations were performed to reduce the amount
of associated ammonium salts in the product Samples were dried under vacuum and
freeze-dried but water and solvent impurities continued to remain present
The synthesis was repeated using L-arginine methyl ester dihydrochloride (157 g 6
mmol) L-serine ethyl ester hydrochloride (102 g 6 mmol) and L-histidine methyl ester
(145 g 6 mmol)
Yields
DTPA-(AlaOMe)2 132 g 78 (MW 56356 gmol-1
)
DTPA-(ArgOMe)2 1331 g 60 (MW 73378 gmol-1
)
DTPA-(SerOEt)2 1053 g 56 (MW 62361 gmol-1
)
DTPA-(HisOMe)2 1730 g 83 (MW 69569 gmol-1
)
752 Characterisation of modified DTPA ligands by MALDI-MS
MALDI-MS was used to characterise the synthesised ligands Samples were
dissolved in methanol for analysis These analyses confirm that the ligands are the
desired ones as the protonated monomolecular ion [M+H]+ is visible in each case The
[M+Na]+ and [M+K]
+ ions can also be found in each spectrum The range begins at mz
= 200 so it is therefore not possible to verify the presence of triethylamine (M =
10119gmol) the amino acid starting material or any solvents using this technique The
spectra show a numerous peaks indicating that the ligands have decomposed during
analysis making interpretation difficult The spectrum for DTPA-(AlaOMe)2 can be
found in Appendix 6
211
DTPA-(AlaOMe)2 mz 565 (100) [M+H]+ 587 (37) [M+Na]
+ 603 (39) [M+K]
+
DTPA-(ArgOMe)2 mz 734 (100) [M+H]+ 756 (18) [M+Na]
+ 772 (9) [M+K]
+
DTPA-(SerOEt)2 mz 624 (100) [M+H]+ 646 (60) [M+Na]
+ 662 (15) [M+K]
+
DTPA-(HisOMe)2 mz 697 (100) [M+H]+ 719 (22) [M+Na]
+ 735 (10) [M+K]
+
753 Characterisation of modified DTPA ligands by NMR spectroscopy
NMR spectroscopy was performed on ligand samples in D2O (9992 atom D
Sigma Aldrich) at 400 MHz The 1H NMR spectra of DTPA-(AlaOMe)2 with suggested
peak assignments can be found in Appendix 7
The 1H NMR spectra are difficult to interpret and assign due to the number of
peaks and their proximity to each other There are also impurities observable in the
spectra 13
C NMR spectra were also recorded and were simpler to interpret due to the
DEPT 135 spectra and enabled the quaternary CH CH2 and CH3 carbons to be
distinguished 1H NMR assignments were made using HSQC relating each peak in a
1H
spectrum to its corresponding carbon Solvent impurities were determined from known
solvent shifts (DMF acetone ethanol chloroform andor diethyl ether)3 DMF is the
most prevalent impurity due to it being the most difficult solvent to remove Some
starting material from amino acid esters can also be observed in small quantities
Triethylammonium chloride is also present in a small amount (11 ppm and 30 pmm)
7531 1H NMR Spectroscopy
1H NMR Shifts (400 mHz D2O)
DTPA-(AlaOMe)2 δ ppm 125 (d 3JHH =734 Hz 6 H H8) 311 (t
3JHH =100 Hz 4 H
H5) 323 (t 3JHH =569 Hz 4 H H4) 348 - 355 (m 2 H H6 and H7) 362 - 369 (m
4 H H2) 375 - 387 (m 4 H H3) 418 - 425 (m 2 H H1)
DTPA-(ArgOMe)2 δ ppm 154 (dq 2JHH =1449 Hz
3JHH 730 Hz 4 H H9) 169 - 189
(m 4 H H8) 302 - 317 (m 4 H H10 ) 325 (s 8 H H4 and H5) 362 (s 4 H H2)
365 (s 6 H H7) 368 (s 2 H H6) 375 - 384 (m 4 H H3) 436 - 444 (m 2 H H1)
DTPA-(SerOEt)2 δ ppm 117 (t 3JHH =706 Hz 6 H H7) 327 (s 8 H H4 and H5)
364 - 372 (m 6 H H2 and H6) 378 - 393 (m 9 H) H3 and H9) 414 (q 3JHH =706
Hz 4 H H8) 452 (dd 3JHH =479 378 Hz 2 H H1)
DTPA-(HisOMe)2 δ ppm 297 - 323 (m 12 H H4 H5 and H8) 331 (s 4 H H2) 349
(s 4 H H3) 358 (s 6 H H7) 362 (m 2 H H6) 370 - 375 (m 1 H H3) 464 - 466
(m 2 H H1) 714 (s 2 H H9) 843 (s 2 H H10)
212
Figure 71 1H NMR proton assignments for DTPA-(AlaOMe)2
Figure 72 1H NMR proton assignments for DTPA-(ArgOMe)2
Figure 73 1H NMR proton assignments for DTPA-(SerOEt)2
213
Figure 74 1H NMR proton assignments for DTPA-(HisOMe)2
7532 13
C NMR Spectroscopy
13CNMR Shifts (400 mHz D2O)
DTPA-(AlaOMe)2 δ ppm 158 (CH3 C12) 485 (CH C1) 511 (CH2 C5) 514 (CH2
C4) 529 (CH3 C7) 543 (CH2 C6) 563 (CH2 C2) 564 (CH2 C3) 1686 (q-C C9)
1718 (q-C C11) 1721 (q-C C10) 1746 (q-C C8)
DTPA-(ArgOMe)2 δ ppm 243 (CH2 C13) 275 (CH2 C12) 404 (CH2 C14) 512
(CH2 C5) 518 (CH2 C4) 523 (CH C1) 530 (CH3 C7) 548 (CH2 C6) 564 (CH2
C2) 568 (CH2 C3) 1567 (q-C C15) 1698 (q-C C9) 1716 (q-C C11) 1728 (q-C
C10) 1735 (q-C C8)
DTPA-(SerOEt)2 δ ppm 132 (CH3 C8) 512 (CH2 C5) 514 (CH2 C4) 545 (CH2
C6) 549 (CH C1) 563 (CH2 C2) 565 (CH2 C3) 607 (CH2 C13) 628 (CH2 C7)
1693 (q-C C9) 1712 (q-C C10) 1717 (q-c C11) 1723 (CH3 C8)
DTPA-(HisOMe)2 δ ppm 257 (CH2 C12) 505 (CH2 C5) 517 (CH C1) 525 (CH2
C4) 531 (CH3 C7) 551 (CH2 C6) 568 (CH2 C2) 572 (CH2 C3) 1170 (CH C14)
1286 (q-C C13) 1333 (CH C15) 1711 (q-C C9) 1714 (q-C C11) 1716 (q-C
C10) 1746 (q-C C8)
214
Figure 75 13
C NMR carbon assignments for DTPA-(AlaOMe)2
Figure 76 13
C NMR carbon assignments for DTPA-(ArgOMe)2
Figure 77 13
C NMR carbon assignments for DTPA-(SerOEt)2
215
Figure 78 13
C NMR carbon assignments for DTPA-(HisOMe)2
754 Characterisation of modified DTPA ligands by elemental analysis
Elemental analysis was also performed on the ligands for characterisation Since
the ligands do contain impurities despite several purification steps the elemental
analysis is not quite as predicted for pure samples Chlorine was found to also be
present from residual triethylammonium chloride as identified by NMR spectroscopy in
addition to residual solvents despite prolonged drying under vacuum
Table 72 Elemental analysis results for modified DTPA ligands P = predicted
proportion present () A = actual proportion present ()
C () H () N () Cl () Na ()
Ligand P A P A P A P A P A
DTPA-(AlaOMe)2
4689 4224 662 685 1243 1146 0 475 0 0
DTPA-(ArgOMe)2
4583 3896 701 637 2100 1643 0 1427 0 0
DTPA-(SerOEt)2
4622 4300 663 755 1123 1041 0 240 0 0
DTPA-(HisOMe)2
4834 3985 594 668 1812 1458 0 595 0 0
216
755 Luminescence studies with modified DTPA ligands
7551 Stock solutions
A stock solution (10 mM 10 mL) was made up for Eu(NO3)3xH2O in H2O or
D2O as required Additionally a stock solution of HDEHP in n-dodecane (1935 g in
100 mL 06 M) was prepared All reagents were purchased from Sigma-Aldrich
Stock solutions
10 mM EuTb(NO3)3 in H2OD2O
06 M HDEHP in n-dodecane
7552 Preparation of aqueous samples
2 mL samples were prepared for aqueous phases The Eu(NO3)3 stock solution
(02 mL) was added calculated quantities of each ligand to make samples with
concentrations of 1 mM Eu(NO3)3 and 005 M ligand when made up to 2 mL with H2O
or D2O The pH of samples was adjusted individually with concentrated HNO3 and
NaOH to minimise change in volume using a Mettler Toledo Seven Compact pHion
Meter pD was calculated using Equation 71
7553 Preparation of extracted samples
Aqueous samples were prepared as above (Section 7413) Due to the small
quantities of ligand available pre-equilibration was not possible as the same samples
used for aqueous phase studies were subsequently used for extraction studies The
aqueous phases were contacted with HDEHP in n-dodecane (2 mL 06 M) The
solutions were then shaken using a Scientific Industries Vortex Genie 2 Mixer and
Shaker for 15 minutes left to settle and separated into the two phases for analysis
7554 Radiolysis of ligand samples
Radiolysis experiments on modified DTPA ligand systems were carried out
using the 60
Co irradiator at DCF These irradiations were undertaken at the same time as
the GSH irradiations at a later date than the initial amino acid radiolysis studies
(Section 722) using the new calibrated sample holder with known dose rates and so
preparation and use of a Fricke solution was not necessary Samples received an average
of 7 kGy γ radiation
217
76 Instruments
761 FTS MODEL 812 System 60
Co Irradiator
All irradiations at the Dalton Cumbrian Facility were carried out using a 60
Co
irradiator which can allow multiple dose rates as it comprises two individual source
rods Radiation is generated by the decay of 60
Co to 60
Ni causing emission of β-
particles and γ-rays
Samples (5 mL for amino acid and GSH systems 2 mL for modified DTPA
ligand systems) were transferred into glass vials with plastic screw tops and placed
inside the irradiator mounted on a pre-designed rig Multiple samples were able to be
irradiated at once due to the design of the sample holder (Figure 79)
Figure 79 60
Co Irradiator at DCF (left) sample holder (top right) and sample holder
inside the irradiator (bottom right)
762 Edinburgh Instrument FP920 Phosphorescence Lifetime Spectrometer
All luminescence studies were carried out using an Edinburgh Instrument FP920
Phosphorescence Lifetime Spectrometer Steady state emission and excitation spectra
were recorded in quartz cuvettes on an Edinburgh Instrument FP920 Phosphorescence
Lifetime Spectrometer equipped with a 5 watt microsecond pulsed xenon flashlamp
(with single 300 mm focal length excitation and emission monochromators in Czerny
Turner configuration) and a red sensitive photomultiplier in peltier (air cooled) housing
(Hamamatsu R928P) Lifetime data were recorded following excitation with the
flashlamp and using time correlated single photon counting (PCS900 plug-in PC card
for fast photon counting) Lifetimes were obtained by tail fit on the data obtained
218
Table 73 Emission and excitation wavelengths for Ln3+
ions
763 Packard Cobra II Gamma Counter
Activity in separation samples prepared at the INL was measured using a Cobra
II Gamma Counter an automated gamma counter Background samples were counted in
addition in order allow correction for background radiation levels Samples run on
automated protocols run until the counting error is within 1 or the sample has run for
20 minutes
764 Bruker UltrashieldTM
400 NMR Spectrometer
NMR measurements were carried out using a Bruker UltrashieldTM
400
spectrometer of operating frequency 400 MHz (1H) and 162 MHz (
13C) with a variable
temperature unit set at 295 K unless otherwise stated The instrument was controlled
remotely using Bruker Topspin 21 software
Ln3+
Emission (nm) Excitation (nm)
Eu 617 395
Tb 545 379
Sm 600 403
Dy 575 352
219
1 CB Şenvar Chemical Dosimetry of Gamma Rays Neutrons and Accelerated
Electrons University of Ankara 1959 1-28
2 JWT Spinks and RJ Woods An Introduction to Radiation Chemistry Wiley-
Interscience Canada 3rd edn 1990
3 HE Gottlieb V Kotlyar and A Nudelman J Org Chem 1997 62 7512-7515
220
APPENDICES
APPENDIX 1 - Emission spectra for [GSH] pH dependence studies with DTPA in H2O
Figure A Emission spectra of Eu3+
in H2O at pH 2 with 005 M Na5DTPA over a GSH
concentration range of 01 ndash 05 M following excitation at 397 nm
Figure B Emission spectra of Eu3+
in H2O at pH 3 with 005 M Na5DTPA over a GSH
concentration range of 01 ndash 05 M following excitation at 397 nm
00
02
04
06
08
10
12
14
550 600 650 700
Emis
sio
n In
ten
sity
(au
) x
10
00
0
Wavelength (nm)
01 M GSH
02 M GSH
03 M GSH
04 M GSH
05 M GSH
00
02
04
06
08
10
12
14
550 600 650 700
Emis
sio
n In
ten
sity
(au
) x
10
00
0
Wavelength (nm)
01 M GSH
02 M GSH
03 M GSH
04 M GSH
05 M GSH
221
Figure C Emission spectra of Eu3+
in H2O at pH 4 with 005 M Na5DTPA over a GSH
concentration range of 01 ndash 05 M following excitation at 397 nm
00
02
04
06
08
10
12
14
550 600 650 700
Emis
sio
n In
ten
sity
(au
) x
10
00
0
Wavelength (nm)
01 M GSH
02 M GSH
03 M GSH
04 M GSH
05 M GSH
222
APPENDIX 2 - SFLnAm for varying GSH concentration over a pH range of 2-4 with
005 M Na5DTPA after extraction with 02 M HDEHP in dodecane
Figure D SFLnAm for varying GSH concentration at pH 2 with 005 M Na5DTPA after
extraction with 02 M HDEHP in dodecane
Figure E SFLnAm for varying GSH concentration at pH 3 with 005 M Na5DTPA after
extraction with 02 M HDEHP in dodecane
0
5
10
15
20
25
30
35
40
56 57 58 59 60 61 62 63 64 65 66 67 68
Sep
arat
ion
Fac
tor
Atomic Number
01 M GSH
02 M GSH
03 M GSH
04 M GSH
05 M GSH
0
50
100
150
200
250
56 57 58 59 60 61 62 63 64 65 66 67 68
Sep
arat
ion
Fac
tor
Atomic Number
01 M GSH
02 M GSH
03 M GSH
04 M GSH
05 M GSH
223
APPENDIX 3 - Natural pH values for modified DTPA ligands (005 M) with Eu(NO3)3
(1 mM)
Table F Natural pH values for modified DTPA ligands (005 M) with Eu(NO3)3 (1
mM)
Ligand Natural pH with Eu(NO3)3
DTPA-(AlaOMe)2 243
DTPA-(ArgOMe)2 238
DTPA-(SerOEt)2 240
DTPA-(HisOMe)2 286
224
APPENDIX 4 - Emission spectra for Eu(NO3)3 with modified DTPA ligands in H2O
Figure G Emission spectra for Eu(NO3)3 with modified DTPA ligands in H2O at pH 2
Figure H Emission spectra for Eu(NO3)3 with modified DTPA ligands in H2O at pH 3
0
2
4
6
8
10
12
550 575 600 625 650 675 700
Emis
sio
n In
ten
sity
(au
) x
10
00
0
Wavelength (nm)
Ala-DTPA
Arg-DTPA
Hist-DTPA
Ser-DTPA
0
2
4
6
8
10
12
14
550 575 600 625 650 675 700
Emis
sio
n In
ten
sity
(au
) x
10
00
0
Wavelength (nm)
Ala-DTPA
Arg-DTPA
Hist-DTPA
Ser-DTPA
225
Figure I Emission spectra for Eu(NO3)3 with modified DTPA ligands in H2O at pH 4
0
1
2
3
4
5
6
7
8
9
10
550 575 600 625 650 675 700
Emis
sio
n In
ten
sity
(au
) x
10
00
0
Wavelength (nm)
Ala-DTPA
Arg-DTPA
Hist-DTPA
Ser-DTPA
226
APPENDIX 5 - Emission spectra for radiolysis studies on Eu(NO3)3 in H2O with
DTPA-di(amino acid) ligands
Figure J Emission spectra for Eu(NO3)3 in H2O with DTPA-di(amino acid) ligands
(005 M) at pH 2 after irradiation with 7 kGy γ-radiation
Figure K Emission spectra for Eu(NO3)3 in H2O with DTPA-di(amino acid) ligands
(005 M) at pH 3 after irradiation with 7 kGy γ-radiation
00
05
10
15
20
25
550 575 600 625 650 675 700
Emis
sio
n In
tem
sity
(au
) x
10
00
0
Wavelength (nm)
Ala-DTPA
Arg-DTPA
Hist-DTPA
Ser-DTPA
00
05
10
15
20
25
550 575 600 625 650 675 700
Emis
sio
n In
ten
sity
(au
) x
10
00
0
Wavelength (nm)
Ala-DTPA
Arg-DTPA
Hist-DTPA
Ser-DTPA
227
Figure L Emission spectra for Eu(NO3)3 in H2O with DTPA-di(amino acid) ligands
(005 M) at pH 4 after irradiation with 7 kGy γ-radiation
00
05
10
15
20
25
550 575 600 625 650 675 700
Emis
sio
n In
ten
sity
(au
) x
10
00
0
Wavelength (nm)
Ala-DTPA
Arg-DTPA
Hist-DTPA
Ser-DTPA
228
APPENDIX 6 - MALDI-MS spectrum for DTPA-(AlaOMe)2
[M+H]+
[M+Na]+ [M+K]
+
229
AP
PE
ND
IX 7
- 1H N
MR
spectru
m fo
r DT
PA
-(AlaO
Me)
2
230
GSH1ESP
45 40 35 30 25 20 15
Chemical Shift (ppm)
01
02
03
04
05
06
07
08
09
Norm
alize
d In
tensi
ty
Water
44
944
844
6
38
9
37
6 37
437
2 28
628
628
528
4
24
924
8 24
724
624
524
4
21
1 20
920
720
5
AP
PE
ND
IX 8
- 1H N
MR
spectru
m fo
r GS
H
231
EUGSHESP
45 40 35 30 25 20 15
Chemical Shift (ppm)
01
02
03
04
05
06
07
08
09
Norm
alized Inte
nsity
Water
45
044
844
7
41
8
38
037
837
7
37
136
9
30
230
1
28
7 28
628
4
24
9 24
724
624
423
323
1
21
020
820
720
5
AP
PE
ND
IX 8
a - 1H N
MR
spectru
m fo
r Eu(N
O3 )
3 + G
SH
232

4
24 Introduction to Buffer Interaction with Ln3+
and Ln-DTPA
Complexes
241 Interaction of Lactate with Ln3+
and Ln-DTPA
Complexes
242 Interaction of Amino Acids with Ln3+
and Ln-DTPA
Complexes
25 Studies on Buffer Interaction with M3+
and [M(DTPA)]2-
251 1HNMR Studies on Buffer Interactions
252 Luminescence Studies on Buffer Interactions
2521 Sensitisation Tests
2522 Aqueous Phase Lanthanide Studies without
Na5DTPA
2523 Aqueous Phase Lanthanide Studies with
Na5DTPA
2524 Aqueous Phase Actinide Studies with
Na5DTPA
253 Radiolysis Studies on Amino Acid Buffered Systems
2531 Previous Studies at the INL
2532 Irradiation Studies using Amino Acid Buffers
254 Buffer Interaction Summary
References
3 Solvent Extraction and Optimisation Studies with Amino Acid
Buffers
31 Previous Work at INL
311 L-alanine Studies
3111 pH Studies on L-alanine
3112 Concentration Effects
3113 Studies at pH 2
312 Other Amino Acids
32 L-alanine System Optimisation at pH 2
321 [Na5DTPA] Dependence (EuAm)
322 [HDEHP] Dependence (EuAm)
323 L-alanine Optimisation Summary
33 Other Amino Acid Studies
90
90
92
93
93
95
95
96
98
99
100
100
102
105
106
108
108
108
108
110
111
111
113
114
116
118
119
5
331 Initial Tests with Other Amino Acids
332 Studies with L-Histidine
34 Summary of Separations with Amino Acid Buffers
References
4 Studies using L-Glutathione as a Buffer in a TALSPEAK
System
41 Solvent Extraction and Separation using GSH
411 [L-Glutathione] and pH Dependence
4111 [GSH] Dependence without Na5DTPA
4112 [GSH] and pH Dependence with
Na5DTPA
412 [Na5DTPA] Dependence at pH 4
413 [HDEHP] Dependence at pH 4
42 Luminescence Studies using GSH with Eu3+
421 [GSH] and pH Dependence without Na5DTPA
4211 Aqueous Phase Studies
4212 Extraction Studies
422 [GSH] and pH Dependence with Na5DTPA
4221 Aqueous Phase Studies
4222 Extraction Studies
423 [Na5DTPA] Dependence at pH 4
4231 Aqueous Phase Studies
4232 Extraction Studies
424 [HDEHP] Dependence at pH 4
43 Radiolysis Studies using GSH at pH 4
431 Aqueous Phase Studies
432 Extraction Studies
44 Luminescence Studies using GSH with Dy3+
441 Dy3+
Complexation Studies
442 pH Dependence Studies
45 Luminescence Studies using GSH with Mixed Ln3+
Systems at pH 4
451 Complexation Studies
452 pH Dependence Studies
119
120
121
123
124
127
127
127
127
132
133
136
137
137
139
140
140
143
145
145
148
149
151
151
153
154
155
156
157
157
160
6
46 ICP-MS Studies with GSH
47 1H NMR Studies on GSH Systems
48 Summary and Conclusion of Glutathione Work
References
5 Modified DTPA Ligands as Combined Buffers and Soft Donors
in a TALSPEAK System
51 Ligand Synthesis
52 Luminescence Studies on Ligand Systems at pH 2 3 and 4
521 Aqueous Phase Studies
522 Extraction Studies
53 Radiolysis Studies on Ligand Systems at pH 2
531 Aqueous Phase Studies
532 Extraction Studies
54 Separation Work on Ligand Systems
541 AmEu Separation in Ligand Systems
542 Ln Separation in Ligand Systems
55 Summary and Conclusion of Modified DTPA Ligand
Work
References
6 Summary Conclusions and Future Work
61 Summary amp Conclusions
62 Future Work
References
7 Experimental Section
71 Chemicals and Reagents
711 Handling Radioisotopes at INL
72 Complexation studies of Ln3+
amp An3+
with amino acids in
TALSPEAK systems
721 Preparation of samples for luminescence studies
7211 Stock solutions
7212 Preparation of aqueous samples
7213 Preparation of extracted samples
163
166
170
173
174
175
176
176
179
183
183
184
185
186
187
190
191
192
192
198
200
201
201
201
201
201
201
202
202
7
722 Radiolysis of samples
7221 Preparation of Fricke solution
7222 Calculating dose rates
73 Solvent extraction and separation studies using amino
acids and glutathione at INL
731 Preparation of samples
7311 Stock solutions for amino acid studies
7312 [Na5DTPA] dependence SX samples for
amino acid studies
7313 [HDEHP] dependence SX samples for
amino acid studies
7314 Other amino acid SX samples for amino
acid studies
7315 Stock solutions for glutathione studies
7316 [GSH] dependence SX samples without
Na5DTPA
7317 [GSH] and pH dependence SX samples
with Na5DTPA
7318 [Na5DTPA] dependence SX samples for
GSH studies
7319 [HDEHP] dependence SX samples for
amino acid studies
732 Gamma counting
733 ICP-MS
74 Luminescence studies and solvent extraction using
glutathione at UoM
741 Preparation of luminescence samples
7411 Stock solutions for GSH studies
7412 Preparation of aqueous samples
7413 Preparation of extracted samples
742 Radiolysis of GSH samples
74 Modified DTPA Ligands
751 Synthesis of modified DTPA ligands
752 Characterisation of modified DTPA ligands by
MALDI-MS
203
203
203
205
205
205
205
205
206
206
206
206
207
207
207
208
208
208
208
209
209
210
210
210
210
8
753 Characterisation of modified DTPA ligands by
NMR spectroscopy
7531 1H NMR Spectroscopy
7532 13
C NMR Spectroscopy
754 Characterisation of modified DTPA ligands by
elemental analysis
755 Luminescence studies with modified DTPA
ligands
7551 Stock solutions
7552 Preparation of aqueous samples
7553 Preparation of extracted samples
7554 Radiolysis of ligand samples
76 Instruments
761 FTS MODEL 812 System 60
Co Irradiator
762 Edinburgh Instrument FP920 Phosphorescence
Lifetime Spectrometer
763 Packard Cobra II Gamma Counter
764 Bruker UltrashieldTM
400 NMR Spectrometer
References
Appendices
Appendix 1 - Emission spectra for [GSH] pH dependence
studies with DTPA in H2O
Appendix 2 - SFLnAm for varying GSH concentration over a
pH range of 2-4 with 005 M Na5DTPA after
extraction with 02 M HDEHP in dodecane
Appendix 3 - Natural pH values for modified DTPA ligands
(005 M) with Eu(NO3)3 (1 mM)
Appendix 4 - APPENDIX 4 - Emission spectra for Eu(NO3)3
with modified DTPA ligands in H2O
Appendix 5 - Emission spectra for radiolysis studies on
Eu(NO3)3 in H2O with DTPA-di(amino acid)
ligands
Appendix 6 - MALDI-MS spectrum for DTPA-(AlaOMe)2
211
211
213
215
216
216
216
216
216
217
217
217
218
218
219
220
220
222
223
224
226
228
9
Appendix 7 - 1H NMR spectrum for DTPA-(AlaOMe)2
Appendix 8 - 1H NMR spectrum for GSH
Appendix 8a - 1H NMR spectrum for Eu(NO3)3 + GSH
Total Word Count 50439
229
230
231
10
LIST OF TABLES
Table 11 Electronic properties of the lanthanides
Table 12 Electronic properties of the actinides
Table 13 Available oxidation states of the actinides and colours of
ions in solution where applicable
Table 14 Luminescence of lanthanide ions
Table 15 Luminescence of actinide ions
Table 16 Approximate compositions of SNF in Light Water
Reactors (LWR)
Table 21 Luminescence lifetimes and q values for Eu3+
with amino
acidslactate
Table 22 Luminescence lifetimes and q values for [Eu(DTPA)]2-
with amino acidslactate
Table 23 Separation factors for Eu3+
Am3+
in the presence of L-
alanine at 05 M under TALSPEAK conditions when subjected
to different doses of γ-radiation
Table 24 Luminescence lifetimes for aqueous and organic phases for
[Eu(DTPA)]2-
systems before and after irradiation at pH 36
Table 25 Luminescence lifetimes and q values for [Eu(DTPA)]2-
systems before and after irradiation at pH 36
Table 31 Distribution ratios and separation factors for a number of
L-alanine buffered TALSPEAK systems as pH and buffer
concentration are varied compared to a traditional lactic acid
system
Table 32 Distribution ratios and separation factors for a number of
amino acid buffered TALSPEAK systems
Table 33 Separation factors for L-alanine optimisation studies
Table 34 DAm values for L-alanine optimisation studies
Table 35 Separation factors and DAmEu values for traditional
TALSPEAK systems with different buffers at varying pH
values
Table 41 Eu3+
Am3+
distribution and separation for [GSH]
dependence with 005 M Na5DTPA at pH 4
11
Table 42 Eu3+
Am3+
distribution and separation for [Na5DTPA]
dependence with 05 M GSH buffer at pH 4
Table 43 Eu3+
Am3+
distribution and separation for [HDEHP]
dependence with 03 M Na5DTPA and 05 M GSH buffer at
pH 4
Table 44 Eu3+
Am3+
distribution and separation for [HDEHP]
dependence with 04 M Na5DTPA and 05 M GSH buffer at
pH 4
Table 45 Luminescence lifetimes and q values for Eu3+
with GSH at
pHD 4
Table 46 J=1J=2 peak ratios and t-test results for Eu-DTPA at pD
2-4 over a GSH concentration range of 01-05 M following
excitation at 397 nm
Table 47 Luminescence lifetimes and q values for Eu-DTPA at pH
2-4 over a GSH concentration range of 01-05 M
Table 48 J=1J=2 peak ratios and t-test results for Eu-DTPA at pH
2-4 as [GSH] is varied
Table 49 J=1J=2 peak ratios and t-test results for Eu-DTPA with
05 M GSH in D2OH2O at pDpH 4 over a Na5DTPA
concentration range of 005-06 M
Table 410 Luminescence lifetimes and q values for Eu-DTPA with
05 M GSH at pH 4 over a Na5DTPA concentration range of
005-06 M following excitation at 397 nm
Table 411 J=1J=2 peak ratios and t-test results for Eu3+
in the
aqueous phase with 05 M GSH at pH 4 as [Na5DTPA] is
varied after extraction with 02 M HDEHP
Table 412 J=1J=2 peak ratios and t-test results for Eu3+
in the
aqueous phase with 05 M GSH and 03 M Na5DTPA at pH 4
as [HDEHP] is varied after extraction
Table 413 J=1J=2 peak ratios and t-test results for Eu-DTPA with
05 M GSH in D2OH2O at pDpH 4 over a Na5DTPA
concentration range of 01-06 M after irradiation with 7 kGy
γ-radiation
12
Table 414 Luminescence lifetimes and q values for Eu-DTPA with
05 M GSH at pH 4 over a Na5DTPA concentration range of
01-06 M after irradiation with 7 kGy γ-radiation
Table 414 Luminescence lifetimes and q values for Eu-DTPA with
05 M GSH at pH 4 over a Na5DTPA concentration range of
01-06 M after irradiation with 7 kGy γ-radiation
Table 415 J=1J=2 peak ratios and t-test results for Eu3+
in the
aqueous phase with 05 M GSH and at pH 4 as [Na5DTPA] is
varied after extraction with 02 M HDEHP in dodecane from
an aqueous phase irradiated at 7 kGy γ ndashradiation
Table 416 Luminescence lifetimes for lanthanide samples at pH 4
Table 417 Luminescence lifetimes and q values for Eu3+
and Tb3+
samples at pH 4
Table 418 Luminescence lifetimes for aqueous phases before
extraction over a pH range of 2-4
Table 419 Luminescence lifetimes and q values for Eu3+
and Tb3+
samples before extraction over a pH range of 2-4
Table 420 SFLnAm for varying GSH concentration over a pH range
of 2-4 with 005 M Na5DTPA after extraction with 02 M
HDEHP in dodecane
Table 51 J=1J=2 peak ratios and t-test results for Eu- DTPA-
bis(amino ester) complexes at pD 2-4
Table 52 Luminescence lifetimes and q values for Eu-DTPA-
bis(amino ester) complexes at pD 2-4 recorded at the emission
maximum (617 nm) following 397 nm excitation
Table 53 J=1J=2 peak ratios and t-test results for organic phases
after extraction after Eu3+
extraction aqueous phases
containing DTPA-bis(amino ester) ligands (50 mM) at pH 2-4
Table 54 J=1J=2 peak ratios and t-test results for Eu-DTPA-
bis(amino ester) complexes at pD 2 after irradiation with 7
kGy γ-radiation
Table 55 Luminescence lifetimes and q values for Eu-DTPA-
bis(amino ester) complexes at pD 2-4 after irradiation with 7
kGy γ-radiation
13
Table 56 J=1J=2 peak ratios and t-test results for the organic phases
after Eu3+
extraction from aqueous phases containing DTPA-
bis(amino ester) ligands (50 mM) at pH 2 one of which had
been irradiated with 7 kGy γ-radiation
Table 57 Luminescence lifetimes and q values for the organic
phases after Eu3+
extraction from aqueous phases containing
DTPA-bis(amino ester) ligands (50 mM) at pH 2 one of which
had been irradiated with 7 kGy γ-radiation
Table 71 Dose rates received at each sample position in the 60
Co
irradiator at DCF
Table 72 Elemental analysis results for modified DTPA ligands P =
predicted proportion present () A = actual proportion
present ()
Table 73 Emission and excitation wavelengths for Ln3+
ions
14
LIST OF FIGURES
Figure 11 Jablonski diagram showing fluorescence and
phosphorescence
Figure 12 Energy transfer pathway for sensitised luminescence of
Ln3+
complexes
Figure 13 Energy level diagram showing the ground and excited
states of a selection of lanthanides and vibrational oscillators
Figure 14 The energy gaps between the lowest emissive states and
ground states of a selection of lanthanides and actinides
Figure 15 Chain reaction generated by fission of 235
U into 92
Kr and
141
Ba
Figure 16 The Nuclear Fuel Cycle
Figure 17 Chemical structure of TBP (Tri-nbutyl phosphate)
Figure 18 PUREX flow diagram
Figure 19 Chemical structure of CMPO (NN-diisobutyl-2-
(octyl(phenyl)phosphoryl)acetamide)
Figure 110 TRUEX flow diagram
Figure 111 Chemical structure of DMDBTDMA
Figure 112 Chemical structure of DMDOHEMA
Figure 113 Example DIAMEX flow diagram
Figure 114 General chemical structure of BTPs
Figure 115 Chemical structure of TODGA
Figure 116 Chemical structure of HEDTA
Figure 117 SANEX flow diagram for TODGA process
Figure 118 General chemical structure of BTBPs
Figure 119 Chemical structure of CyMe4-BTBP
Figure 120 Chemical structure of CyMe4-BTPhen
Figure 121 GANEX flow diagram
Figure 122 Chemical structure of TRPO
Figure 123 Chemical structure of CYANEX 301
Figure 124 Chemical structure of TTHA
Figure 125 TRPO flow diagram using TTHA
Figure 126 TRPO flow diagram using HNO3 and oxalic acid
Figure 127 LUCA flow diagram
15
Figure 128 Chemical structure of TEDGA
Figure 129 Chemical structure of DTPA
Figure 130 Chemical structure of HDEHP
Figure 131 Chemical structure of HEH[ϕP]
Figure 132 Chemical structure of lactic acid pKa = 386
Figure 133 The solvent extraction process used in TALSPEAK Step
1 Binding of DTPA to M3+
in the aqueous phase at pH 36
buffered by lactic acid Step 2 Selective extraction of Ln3+
into the organic phase by HDEHP from the aqueous phase due
to preferential binding of DTPA to MA3+
Figure 134 Effect of Na5DTPA concentration on distribution ratios
of MA3+
and Ln3+
in TALSPEAK process using 1 M lactate
buffer and 03 M HDEHP in DIPB extractant
Figure 135 TALSPEAK flow diagram
Figure 21 XAS molecular structure of Gd(III)-DTPA
Figure 22 Chemical structure of [Eu(DTPA)]2-
Figure 23 1H NMR spectrum of [Eu(DTPA)]
2- in D2O at 278 K at
pD = 36
Figure 24 1H NMR spectra of DTPA in D2O at 278 K at varying pD
a) pD 7 [DTPA]5-
b) pD 36 [H3DTPA]2-
c) pD 2 [H5DTPA]
Figure 25 Emission spectrum of Eu3+
(aq) and [Eu(DTPA)]2-
in D2O
at pD 36
Figure 26 1H NMR spectrum for [Am(DTPA)xH2O]
2- in 41 vv
MeODD2O with NaOD over a temperature range at pH 3
Figure 27 Emission spectrum of Cm3+
and [Cm(DTPA)]2-
in
perchloric acid at pH 3 by direct excitation with a NdYAG
pumped dye laser at 3966 nm
Figure 28 Emission spectrum of Eu-lactate as a function of lactate
concentration
Figure 29 Co-ordination mode of lactate to Eu3+
Figure 210 Chemical structures of L-alanine (top) glycine (bottom
left) and L-serine (bottom right)
Figure 211 1H NMR spectrum of Eu(NO3)3xH2O (10 mM) with L-
alanine in D2O at 278 K
16
Figure 212 1H NMR spectrum of L-alanine in D2O at 278 K
Figure 213 1H NMR spectrum of [Eu(DTPA)]
2- (10 mM) with L-
alanine (1 M) in D2O at 278 K
Figure 214 Emission spectra of [Tb(DTPA)]2-
in D2O at pD 3 with
and without the presence of L-phenylalanine (05 M) excited at
250 nm and 379 nm Excitation spectrum of [Tb(DTPA)]2-
in
D2O at pD 3 with L-phenylalanine (05 M) at 545 nm
Figure 215 Chemical structure of L-phenylalanine
Figure 216 Emission spectra of Eu(NO3)3 in D2O at pD 36 with and
without the presence of amino acidslactate (1 M) excited at
395 nm at 298 K
Figure 217 Emission spectra of Eu-DTPA in D2O at pD 36 with and
without the presence of amino acidslactate (1 M) excited at
395 nm
Figure 218 Emission spectrum of [Cm(DTPA)]2-
in H2O with and
without L-alanine (25 mM) at pH 3 by direct excitation at 396
nm
Figure 219 Graph illustrating the rates of reaction of the middotOH radical
with L-alanine compared to lactic acid and the lactate ion
Figure 220 Distribution ratios for Ln3+
and Am3+
in the presence of
L-alanine at 05 M pH 2 at different doses of γ-radiation
Figure 221 Emission spectra of Eu3+
in D2O at pD 36 with and
without the presence of amino acidslactate excited at 395 nm
before 5 kGy γ-irradiation
Figure 222 Emission spectra of Eu3+
in D2O at pD 36 with and
without the presence of amino acidslactate excited at 395 nm
after 5 kGy γ-irradiation
Figure 31 The effect of pH on an L-alanine-buffered TALSPEAK
system
Figure 32 Distribution ratios of Ln3+
Y3+
in a TALSPEAK system 1
mM LnY3+
1 M lactate 005 M DTPA pH 7 extracted using
05 M HDEHP in 14-DIPB
Figure 33 The effect of buffer concentration on an L-alanine-
buffered TALSPEAK system
17
Figure 34 Chemical structures of L-arginine (top) L-histidine
(bottom left) and L-methionine (bottom right)
Figure 35 DTPA speciation as a function of pH modelled using
HySS sofware using literature pKa values
Figure 36 [Na5DTPA] dependence of L-alanine system (05 M) at
pH 2
Figure 37 Eu3+
Am3+
separation for [Na5DTPA] dependence of L-
alanine system (05 M) at pH 2
Figure 38 Eu3+
Am3+
separation for [HDEHP] dependence of L-
alanine system (05 M) at pH 2 using 02 M Na5DTPA
Figure 39 Eu3+
Am3+
separation for [HDEHP] dependence of L-
alanine system (05 M) at pH 2 using 03 M Na5DTPA
Figure 310 Eu3+
Am3+
separation for [HDEHP] dependence of L-
alanine system (05 M) at pH 2 using 04 M Na5DTPA
Figure 311 Distribution ratios of La3+
-Ho3+
and Am3+
with 05 M L-
histidine buffer at pH 2 and pH 3
Figure 41 Molecular structures of eisenin (top) and norophthalmic
acid (bottom)
Figure 42 Molecular structures of biotinvitamin B7 (top) and folic
acid vitamin B9 (bottom)
Figure 43 Molecular structure of L-glutathione (reduced form)
Figure 44 Eu3+
Am3+
distribution for [GSH] dependence with 005
M Na5DTPA at pH 2 extracted using 02 M HDEHP in
dodecane Results were averaged from 3 repeat tests
Figure 45 Eu3+
Am3+
distribution for [GSH] dependence with 005
M Na5DTPA at pH 3 extracted using 02 M HDEHP in
dodecane Results were averaged from 3 repeat tests
Figure 46 Eu3+
Am3+
distribution for [GSH] dependence with 005
M Na5DTPA at pH 4 Results were averaged from 3 repeat
tests
Figure 47 GSH speciation as a function of pH modelled using
HySS software using literature pKa values
Figure 48 H2GSH- species dominant in solution at pH 4
18
Figure 49 A ternary Nd DO3A-pyrazine amine carboxylate complex
reported by Faulkner at al (left) and anticipated bidentate
chelation of GSH with Am-DTPA at pH 4 (right)
Figure 410 Eu3+
and Am3+
distribution for [Na5DTPA] dependence
with 05 M GSH buffer at pH 4 curves fitted as polynominal
order 2 for both Am3+
and Eu3+
Results were averaged from 3
repeat tests
Figure 411 Eu3+
and Am3+
distribution for [HDEHP] dependence
with 03 M Na5DTPA and 05 M GSH buffer at pH 4 curve
for Eu3+
fitted as polynominal order 2 linear correlation for
Am3+
Results were averaged from 3 repeat tests
Figure 412 Eu3+
and Am3+
distribution for [HDEHP] dependence
with 04 M Na5DTPA and 05 M GSH buffer at pH 4 linear
correlation for both Am3+
and Eu3+
Results were averaged
from 3 repeat tests
Figure 413 Corrected emission spectra of Eu(NO3)3 (1 mM)
Eu(NO3)3 with GSH (05 M) and Eu(NO3)3 with Na5DTPA
(005 M) in H2O following excitation at 397 nm
Figure 414 Emission spectra of Eu(NO3)3 in H2O at pH 4 over a
GSH concentration range of 01 ndash 05 M following excitation
at 397 nm
Figure 415 Emission spectra of Eu(NO3)3 in D2O at pH 4 over a
GSH concentration range of 01 ndash 05 M following excitation
at 397 nm
Figure 416 Emission spectra of aqueous and organic phases after
Eu3+
extraction at pH 4 using a GSH concentration range of
01 ndash 05 M following excitation at 397 nm
Figure 417 Emission spectra of Eu3+
in D2O at pD 2 with 005 M
Na5DTPA over a GSH concentration range of 01 ndash 05 M
following excitation at 397 nm
Figure 418 Emission spectra of Eu3+
in D2O at pD 3 with 005 M
Na5DTPA over a GSH concentration range of 01 ndash 05 M
following excitation at 397 nm
19
Figure 419 Emission spectra of Eu3+
in D2O at pD 4 with 005 M
Na5DTPA over a GSH concentration range of 01 ndash 05 M
following excitation at 397 nm
Figure 420 Emission spectra of aqueous phases after Eu3+
extraction
at pH 2-4 over a GSH concentration range of 01-05 M
following excitation at 397 nm
Figure 421 Emission spectra of organic phases after Eu3+
extraction
at pH 2-4 over a GSH concentration range of 01-05 M
following excitation at 397 nm
Figure 422 Emission spectra of Eu(NO3)3 in D2O at pD 4 with 05
M GSH over a Na5DTPA concentration range of 005 ndash 06 M
following excitation at 397 nm
Figure 423 Emission spectra of Eu(NO3)3 in H2O at pH 4 with 05
M GSH over a Na5DTPA concentration range of 005 ndash 06 M
following excitation at 397 nm
Figure 424 Emission spectra of aqueous and organic phases after
Eu3+
extraction with 05 M GSH at pH 4 over a Na5DTPA
concentration range of 005-06 M following excitation at 397
nm
Figure 425 Emission spectra of aqueous phases after Eu3+
extraction
with 05 M GSH and 03 M Na5DTPA at pH 4 over an
HDEHP concentration range of 02-10 M following
excitation at 397 nm
Figure 426 Emission spectra of organic phases after Eu3+
extraction
with 05 M GSH and 03 M Na5DTPA at pH 4 over an
HDEHP concentration range of 02-10 M following
excitation at 397 nm
Figure 427 Emission spectra of Eu(NO3)3 in H2O at pH 4 with 05
M GSH over a Na5DTPA concentration range of 005 ndash 06 M
after irradiation with 7 kGy γ-radiation following excitation at
397 nm
Figure 428 Emission spectra of aqueous and organic phases after
Eu3+
extraction from irradiated aqueous phase at pH 4
containing 05 M GSH over a Na5DTPA concentration range
of 01-06 M
20
Figure 429 Emission spectra of Dy(NO3)3 Dy-DTPA and Dy(NO3)3
with GSH in H2O following excitation at 352 nm Note that
the tail of ligand emission can be seen in the Dy DTPA and
Dy GSH solutions at shorter wavelengths
Figure 430 Emission spectra of aqueous and organic phases of
Dy(NO3)3 Dy-DTPA and Dy(NO3)3 with GSH after extraction
with 10 M HDEHP following excitation at 352 nm
Figure 431 Emission spectra of aqueous and organic phases of
Dy(NO3)3 Dy-DTPA and Dy(NO3)3 with GSH after extraction
with 10 M HDEHP following 352 nm excitation
Figure 432 Emission spectra of Ln(NO3)3 (1 mM EuTbSm3+
10
mM Dy3+
) in H2O at pH 4 following direct excitation (405 nm
for Sm3+
397 nm for Eu3+
366 nm for Tb3+
and 352 nm for
Dy3+
)
Figure 433 Emission spectra of Ln(NO3)3 (1 mM EuTbSm3+
10
mM Dy3+
) with GSH (05 M) at pH 4 in H2O following direct
excitation (405 nm for Sm3+
397 nm for Eu3+
366 nm for Tb3+
and 352 nm for Dy3+
)
Figure 434 Emission spectra of Ln-DTPA (1 mM EuTbSm3+
10
mM Dy3+
005 M Na5DTPA) in H2O at pH 4 following direct
excitation (405 nm for Sm3+
397 nm for Eu3+
366 nm for Tb3+
and 352 nm for Dy3+
)
Figure 435 Emission spectra of Ln(NO3)3 (1 mM EuTbSm3+
10
mM Dy3+
) with GSH (05 M) and Na5DTPA (005 M)
following direct excitation (405 nm for Sm3+
397 nm for Eu3+
366 nm for Tb3+
and 352 nm for Dy3+
)
Figure 436 Emission spectra of aqueous and organic phases of Ln3+
with 05 M GSH and 005 M Na5DTPA after extraction with
10 M HDEHP at pH 2 following direct excitation (405 nm for
Sm3+
397 nm for Eu3+
366 nm for Tb3+
and 352 nm for Dy3+
)
Figure 437 Emission spectra of aqueous and organic phases of Ln3+
with 05 M GSH and 005 M Na5DTPA after extraction with
10 M HDEHP at pH 3 following direct excitation (405 nm for
Sm3+
397 nm for Eu3+
366 nm for Tb3+
and 352 nm for
Dy3+
)
21
Figure 438 Emission spectra of aqueous and organic phases of Ln3+
with 05 M GSH and 005 M Na5DTPA after extraction with
10 M HDEHP at pH 4 following direct excitation (405 nm for
Sm3+
397 nm for Eu3+
366 nm for Tb3+
and 352 nm for
Dy3+
)
Figure 439 DLn for varying GSH concentration at pH 2 with 005 M
Na5DTPA after extraction with 02 M HDEHP in dodecane
Figure 440 DLn for varying GSH concentration at pH 3 with 005 M
Na5DTPA after extraction with 02 M HDEHP in dodecane
Figure 441 1H NMR spectra for GSH in D2O under a range of
conditions at 298 K a) GSH b) GSH after irradiation with 7
kGy γ-radiation c) Eu(NO3)3 with GSH d) GSH with
Na5DTPA e) Eu-DTPA with GSH
Figure 442 1H
1NMR proton assignments for GSH (top) and γ-Glu-
Cys (bottom)
Figure 51 General structure of DTPA-amino acid ligands
Figure 52 Emission spectra of Eu(NO3)3 with DTPA-bis(amino
ester) ligands in D2O at pD 2 following excitation at 397 nm
Figure 53 Emission spectra of Eu(NO3)3 with DTPA-bis(amino
ester) ligands in D2O at pD 3 following excitation at 397 nm
Figure 54 Emission spectra of Eu(NO3)3 with DTPA-bis(amino
ester) ligands in D2O at pD 4 following excitation at 397 nm
Figure 55 Emission spectra of aqueous phases after Eu3+
extraction
from an aqueous phase containing DTPA-bis(amino ester)
ligands (50 mM) at pH 2 following excitation at 397 nm
Figure 56 Emission spectra of aqueous and organic phases after Eu3+
extraction from an aqueous phase containing DTPA-bis(amino
ester) ligands (50 mM) at pH 2 following excitation at 397
nm
Figure 57 Emission spectra of aqueous and organic phases after Eu3+
extraction from an aqueous phase containing DTPA-bis(amino
ester) ligands (50 mM) at pH 3 following excitation at 397
nm
22
Figure 58 Emission spectra of aqueous and organic phases after Eu3+
extraction from an aqueous phase containing DTPA-bis(amino
ester) ligands (50 mM) at pH 4 following excitation at 397
nm
Figure 59 Emission spectra of Eu(NO3)3 in D2O with DTPA-
bis(amino ester) ligands (50 mM) at pH 2 after irradiation
with 7 kGy γ- radiation and following excitation at 397 nm
Figure 510 Emission spectra of aqueous and organic phases after
Eu3+
extraction from an irradiated (7 kGy γ-radiation) aqueous
phase containing DTPA-bis(amino ester) ligands (50 mM) at
pH 2 following excitation at 397 nm
Figure 511 Separation factors and distribution ratios for Eu3+
Am3+
using DTPA-(ArgOMe)2 (005 M) at pH 1-2 extracted using
HDEHP (02 M) in kerosene
Figure 512 Separation factors and distribution ratios for Eu3+
Am3+
using DTPA-(SerOEt)2 (005 M) at pH 1-2 extracted using
HDEHP (02 M) in kerosene
Figure 513 Separation factors and distribution ratios for Eu3+
Am3+
using DTPA-(HisOMe)2 (005 M) at pH 1-2 extracted using
HDEHP (02 M) in kerosene
Figure 514 Distribution ratios for Ln3+
using DTPA-(ArgOMe)2
(005 M) at pH 1-2 extracted using HDEHP (02 M) in
kerosene
Figure 515 Distribution ratios for Ln3+
using DTPA-(SerOEt)2 (005
M) at pH 1-2 extracted using HDEHP (02 M) in kerosene
Figure 516 Distribution ratios for Ln3+
using DTPA-(HisOMe)2
(005 M) at pH 1-2 extracted using HDEHP (02 M) in
kerosene
Figure 61 Chemical structures of amino acids
Figure 71 1H NMR proton assignments for DTPA-(AlaOMe)2
Figure 72 1H NMR proton assignments for DTPA-(ArgOMe)2
Figure 73 1H NMR proton assignments for DTPA-(SerOEt)2
Figure 74 1H NMR proton assignments for DTPA-(HisOMe)2
Figure 75 13
C NMR carbon assignments for DTPA-(AlaOMe)2
Figure 76 13
C NMR carbon assignments for DTPA-(ArgOMe)2
23
Figure 77 13
C NMR carbon assignments for DTPA-(SerOEt)2
Figure 78 13
C NMR carbon assignments for DTPA-(HisOMe)2
Figure 79 60
Co Irradiator at DCF (left) sample holder (top right)
and sample holder inside the irradiator (bottom right)
24
ABSTRACT
The University of Manchester
Madeleine Hilton Langford Paden
PhD
Development of a Simplified Soft-Donor Technique for Trivalent Actinide-Lanthanide
Separations
2015
The necessity of reprocessing spent nuclear fuel has arisen from increasing
awareness and concern for the environment in addition to the potential of minimising
proliferation A number of different reprocessing techniques are currently being
developed around the world to allow useful spent nuclear fuel (SNF) to be recycled and
reused and the remaining waste to be treated One such technique currently being
developed in the USA is the TALSPEAK process an advanced reprocessing method for
the separation of trivalent lanthanide (Ln3+
) and minor actinide (MA3+
) components
This process developed in the 1960s at Oak Ridge National Laboratory uses DTPA to
act as a holdback reagent for MA3+
in a lactate buffered aqueous phase at pH 36
allowing Ln3+
to be selectively extracted by organophosphate HDEHP into an organic
phase of DIPB or dodecane
TALSPEAK is one of the most promising techniques being researched due to its
numerous advantages particularly its relative resistance to radiolysis and its ability to
be carried out without the need for high reagent concentrations Additionally it gives
high separation factors in the region of ~50-100 comparable to other advanced
reprocessing methods under development The chemistry of the process is very complex
and not particularly well understood so it would be advantageous to simplify the process
by removing the need for a separate holdback reagent and buffer
In collaboration with colleagues at the Idaho National Lab the use of amino
acids as a potential combined buffer and soft donor was investigated Although it was
found that amino acids do not act as holdback reagents in their own right optimisation
of an L-alanine buffered TALSPEAK system with DTPA was found to allow the
process to be carried out effectively at a lower pH of 2 which is more preferable for
industrial application
As an extension of this separation studies were carried out using the tripeptide
L-glutathione (GSH) to determine its potential for use as a combined buffer and soft-
donor As with the studies with amino acids it was found that GSH also does not act as
a holdback reagent in its own right however it does interact with Ln-DTPA complexes
at pH 4 When optimised at this pH separation factors of up to 1200 were achieved for
Eu3+
Am3+
whilst still maintaining low MA3+
partitioning However further studies by
ICP-MS and luminescence spectroscopy showed that a GSH buffered system was not
effective for extraction of heavier lanthanides although the results show the potential
for further investigation into other short and longer chain peptide buffered systems and
possibly lanthanide-lanthanide separations
Further studies were carried on amino acid appended DTPA ligands which were
synthesised in a one step reaction in order to create a combined buffer and soft donor
The ligands were found to self-buffer at around pH 2 and allow successful separation of
Eu3+
Am3+
(SF ~ 100) The results from initial investigations by luminescence
spectroscopy and solvent extraction are promising and are presented here Further work
is needed on these systems in order to optimise their extraction capability and minimise
Am3+
partitioning In the future this work could promote studies for better
understanding of TALSPEAK chemistry that could be used in industrial partitioning
processes
25
DECLARATION
No portion of the work referred to in the thesis has been submitted in support of an
application for another degree or qualification of this or any other university or other
institute of learning
26
COPYRIGHT STATEMENT
The author of this thesis (including any appendices andor schedules to this thesis) owns
certain copyright or related rights in it (the ldquoCopyrightrdquo) and she has given The
University of Manchester certain rights to use such Copyright including for
administrative purposes
ii Copies of this thesis either in full or in extracts and whether in hard or electronic
copy may be made only in accordance with the Copyright Designs and Patents Act
1988 (as amended) and regulations issued under it or where appropriate in accordance
with licensing agreements which the University has from time to time This page must
form part of any such copies made
iii The ownership of certain Copyright patents designs trade marks and other
intellectual property (the ldquoIntellectual Propertyrdquo) and any reproductions of copyright
works in the thesis for example graphs and tables (ldquoReproductionsrdquo) which may be
described in this thesis may not be owned by the author and may be owned by third
parties Such Intellectual Property and Reproductions cannot and must not be made
available for use without the prior written permission of the owner(s) of the relevant
Intellectual Property andor Reproductions
iv Further information on the conditions under which disclosure publication and
commercialisation of this thesis the Copyright and any Intellectual Property andor
Reproductions described in it may take place is available in the University IP Policy
(see httpdocumentsmanchesteracukDocuInfoaspxDocID=487) in any relevant
Thesis restriction declarations deposited in the University Library The University
Libraryrsquos regulations (see httpwwwmanchesteracuklibraryaboutusregulations) and
in The Universityrsquos policy on Presentation of Theses
27
ACKNOWLEDGEMENTS
Firstly I would like to thank my University supervisors Dr Louise Natrajan and
Dr Clint Sharrad for their support and encouragement during my PhD and for their help
and guidance when needed I would also like to thank Dr Leigh Martin my industrial
supervisor at the Idaho National Lab for the opportunity to work there and gain valuable
new experience
For all of his help in the lab general advice and knowledge on the TALSPEAK
process I would particularly like to thank Dr Travis Grimes from the INL - I could not
have done it without you - and for much of the help and advice I received in
Manchester (as well as lending an ear when I needed to vent) I would like to thank Dr
Adam Swinburne
Thank you also to Dr Andreas Geist for conducting some separation studies for
me at KIT-INE Your contributions have been very valuable and I am most grateful for
all of your help
Sarah Hendley Kevin Beal Andrew Alker and Adrien Moll as Masters and
placement students have helped with various parts of the work in this thesis and
deserve great thanks for their contributions Additionally thank you to Dr Michael
Andrews for helping Adrien so much in the lab whilst I was finishing off my
experiments and beginning to write up my thesis I appreciate the time you spent even
though you had so much to do yourself
Further thanks to Prof Simon Pimblott Greg Horne and Logan Barr for
accommodating me and my Masters students at DCF for irradiation studies and to Greg
especially for giving up your precious time to help us
Dr Tamara Griffiths and Dr Catherine Riddle made working in the lab at the
INL a very enjoyable experience for me and kept me sane and encouraged in times of
desperation Many thanks to you wonderful ladies Also thank you to the Aqueous
Separations and Radiochemistry group (Jack Leigh Peter Travis Rocky Dean Cathy
Bruce Guy and Brandi) Terry Todd and other staff at the INL (Steve Chris Jake all
of the radcons the Analytical group and other placement students) who likewise made
me feel very welcome in a place so far from home
I would additionally like to thank Teams NatrajanMillsSharrad (Sean Adam
Simon Lucy Lizzie Debbie Chloe Mike Pete Kathryn Toria Jen (honorary
member) Dr David Mills Ally Conrad Aruna Helen Tamara Kate Dan Chris
Dave Charles Peter Zana Rich Hugues and Tim) and the Centre for Radiochemistry
28
Research at the University of Manchester for general lab help and support and for
making Manchester a great place to work And to my conference buddies Tamara
Debbie Kate and Adam for making conferences as much about the social side as the
work
Thank you to the INL KIT and Diamond Light Source for the opportunities to
carry out work using their specialist equipment and to Dr Louise Natrajan Dr Sean
Woodall Dr Daniel Whittaker Dr Tamara Griffiths Dr Clint Sharrad Dr Leigh Martin
and Dr Travis Grimes for helping with some of the work carried out
I could not have done this PhD without funding from Batelle Energy Alliance
through the INL and the University of Manchester so thank you
On a personal note a big thank you to Steph my room mate for making my 9
months living in Idaho so much fun And also to Cathy and Glen Shelby Natalie and
Leigh and Marie for all the fun times too Lastly but not least I would like to give huge
thanks to my (non-chemistry non-Idaho) friends and family for their support over the
past 4 years especially my wonderful husband Lee - youre amazing and my rock as
always - and my parents for everything over the past 26 years
It was worth it in the end
29
LIST OF SYMBOLS amp UNITS
gt greater than
˂ less than
plusmn plus or minus
percent
degC degrees Celsius
α alpha
β beta
γ gamma
δ chemical shift
Δ change in
ε molar extinction coefficient
λ wavelength
microL microlitres
micros microseconds
ρ density
τ lifetime
ν frequency
ν= energy level
wavenumber
Aring angstroms
A proportionality constant for q taking into account the
inner hydration sphere
ABS optical density difference between ODi and ODb
amu atomic mass units
au arbitrary units
B correction factor for q taking into account the outer
hydration sphere
Bq Becquerel
cm centimetres
D (pD D2O MeOD) deuterium
dm3 decimetres cubed (litres)
E energy
F Faradays constant
30
g grams
G critical dose value
Gy Gray
h Plancks constant
Hz Hertz
J Joules
J= rotational energy level
K Kelvin
kBq kiloBecquerel
kg kilograms
kGy kiloGray
kJ kiloJoules
L litres
log β stability constant
M molar (moldm-3
)
mg milligrams
MHz megaHertz
min minute(s)
mL millilitres
mm millimetres
mM millimolar
mol moles
mmol millimoles
ms milliseconds
ng nanograms
nm nanometres
ns nanoseconds
ODi optical density of irradiated solution
ODb optical density of non-irradiated control solution
ppm parts per million
s seconds
t time
Zeff effective nuclear charge
31
LIST OF ABBREVIATIONS amp ACRONYMS
An actinides
aq aqueous
BT nack-energy Transfer
BTBP bis-triazinbipyridine
BTP bis-triazinylpyridine
CEA Commissariat agrave lrsquoEacutenergie Atomique et aux Eacutenergies
Alternatives
CE-ICP-MS capillary electrophoresis ndash inductively coupled plasma ndash
mass spectrometry
cf confer Latin compare
CMPO carbomoylmethylphosphine oxide
CP corrosion products
CYANEX 301 bis(244-trimethylpentyl)phosphinodithioic acid
CyMe4-BTBP 66-bis(5588-tetramethyl-5678-tetrahydrobenzo
[e][124]triazin-3-yl)-22-bipyridine
D distribution ratio
DCF Dalton Cumbrian Facility
DEPT distortionless enhancement by polarization transfer
DFT density functional theory
DIAMEX DIAMide EXtraxtion
DIPB diisopropyl benzene
DMDBTDMA dimethyldibutyltetradecylmalonamide
DMDOHEMA dimethyldicotylhexylethoxymalonamide
DMF dimethylformamide
DNA deoxyribonucleic acid
DO3A 147 tris(carboxymethyl) 14710 tetraazacyclododecane
DOTA 14710-tetraazacyclododecane-14710-tetraacetic acid
DTPA diethylenetriaminepentaacetic Acid
EC electron capture
EDTA ethylenediaminetetraacetic acid
eg exempli gratia Latin for example
ET electron transfer
32
et al et alli Latin and others
EURACT-NMR Transnational Access to Unique European Actinide and
Radiological NMR Facilities
EXAm EXtraction of Americium
FP fission products
GANEX Grouped ActiNide EXtraction
GSH glutathione
HDEHP (di-(2ethylhexyl)phosphoric acid
HEH[ΦP] (2-ethylhexyl)phenylphosphonic acid
HEH[EHP] (2-ethylhexyl)phosphonic acid mono-2-ethylhexyl ester
HEDTA (2-hydroxyethyl) ethylenediaminetatraacetic acid
HSQC heteronuclear single quantum correlation
I ionic strength
IC internal conversion
ICP-MS inductively coupled plasma ndash mass spectrometry
ie id est Latin that is
INL Idaho National Laboratory
IR infra-red
iSANEX Innovative SANEX
ISC inter-system crossing
KIT-INE Karlsruhe Institute of Technology - Institut fuumlr Nukleare
Entsorgung (Institute for Nuclear Waste Disposal)
Lac lactate
LASER light amplification by stimulated emission of radiation
LINAC linear accelerator
Ln lanthanides
LUCA Lanthaniden Und Curium Americium trennung
LWR light water reactor
M metal
MA minor actinides
MALDI-MS matrix-assisted laser desorption ionization mass
spectrometry
MOX mixed oxide
MRI magnetic resonance imaging
Nd-YAG neodymium-yttrium aluminium garnet
33
nIR near-infra-red
NMR nuclear magnetic resonance
NPH normal paraffinic hydrocarbon
NR non-radiative decay
org organic
PPE personal protective equipment
PUREX Plutonium and Uranium Refinement by EXtraction
q number of solvent molecules in the inner hydration sphere
SANEX Selective ActiNide EXtraction
SF separation factor
SNF spent nuclear fuel
SX solvent extraction
TALSPEAK Trivalent Actinide Lanthanide Separation by Phosphorus
reagent Extraction from Aqueous Complexation
TALSQuEAK Trivalent Actinide Lanthanide Separation using Quicker
Extractants and Aqueous Complexes
TBP tributyl phosphate
TEA triethylamine
TEDGA NNNrsquoNrsquo-tetraethyl-diglycolamide
TEHP tris(2-ethylhexyl)phosphate
TM transition metals
TODGA tetraoctyldiglycolamide
TPH tetrapropylene hydrogenated
TRLFS time-resolved LASER-induced fluorescence spectrocopy
TRPO trialkylphosphine oxide
TRUEX TRans-Uranic EXtraction
TTHA triethylenetetramine hexaacetate
SF spontaneous fission
SNF spent nuclear fuel
UoM The University of Manchester
UV ultra-violet
UV-vis ultra-violet-visible
vs versus Latin against
XAS x-ray absorption spectroscopy
34
AMINO ACID ABBREVIATIONS
Amino Acid 3 Letter Abbreviation
Alanine Ala
Arginine Arg
Asparagine Asn
Aspartic acid Asp
Cysteine Cys
Glutamic Acid Glu
Glutamine Gln
Glycine Gly
Histidine His
Isoleucine Ile
Leucine Leu
Lysine Lys
Methionine Met
Phenylalanine Phe
Proline Pro
Serine Ser
Threonine Thr
Tryptophan Trp
Tyrosine Tyr
Valine Val
35
1 INTRODUCTION
11 The Actinides and Lanthanides
111 Background
The ldquorare earthrdquo or lanthanide elements (Ln) can be found between barium and
hafnium in the periodic table in the first of the two rows containing the f-block
elements The f-block elements are all metallic and have 4f or 5f valence electron
subshells the lanthanides Ce-Lu are also often referred to as the ldquo4frdquo elements1
Although often considered to be part of the lanthanide series lanthanum is not usually
considered to be a ldquo4frdquo element as it has no f-electrons The 4f elements all have
relatively high abundances despite often being termed the ldquorare earthrdquo elements except
for promethium (Pm) which is radioactive and does not occur in nature2 All of the 4f
elements except promethium were discovered and had all successfully been isolated by
the early 20th
century Promethium was not discovered until 19473
The actinide elements (An) can be found between radium and rutherfordium in
the periodic table and are also known as the 5f elements as their valence shell is the 5f
shell They are all radioactive as none of them have any stable isotopes Although often
considered to be part of the actinide series actinium is not usually considered to be a
ldquo5frdquo element due to its electronic configuration of 5f 0 Despite this thorium which also
has a ground state electronic configuration of 5f 0 is considered to be a 5f element The
first actinide element to be discovered was uranium which was discovered in 1789 by
Klaproth in the mineral pitchblende Thorium and protactinium had also both been
discovered by 1913 but the later actinides were not synthesised until the Second World
War initially by Seaborg4
112 Sources of the Lanthanides and Actinides
The naturally occurring lanthanide elements are found in two minerals
primarily monazite and bastnaumlsite which are ores of mixed lanthanide metals and have
the general formulae LnPO4 and LnCO3F respectively Monazite also contains
radioactive thorium so is the less favourable of the two sources of lanthanides
commercially5
Ac Th Pa and U are the only naturally occurring actinide (An) elements
Uranium is less abundant than thorium (24 ppm vs 81 ppm) in the Earthrsquos crust but is
found in numerous minerals in oxide form including pitchblende (uraninite) and
36
carnotite Protactinium is one of the rarest elements in the world and is found at trace
levels in some uranium ores
The remaining 11 (Np-Lr) elements in the An series must be synthesised
Neptunium to fermium can be synthesised by neutron bombardment whereby a neutron
is captured by a heavy element atom and a γ-ray is emitted This is followed by the
emission of a β- particle in a β
- decay process to form a new element with an increased
atomic mass (see Scheme 11) However as this is a relatively improbable process
synthesis of the heaviest elements is impossible by this method and so synthesis of the
heavier elements is carried out by bombardment with light atoms although again this is
also an unfavourable reaction6
238U (n γ)
239U rarr
239Np rarr
239Pu (n γ)
240Pu (n γ)
241Pu rarr
241Am (n γ)
242mAm rarr
242Cm
Scheme 11 Formation of 242
Cm by a series of neutron capture and β- decay
processes6
113 Properties of the 4f Elements
The shapes of the f -orbitals have a variety of different representations dependent
on molecular symmetry The electron configurations for the metals and Ln3+
ions can be
seen in Table 11 along with values for the third and fourth ionisation energies
Gadolinium (Gd) and lutetuim (Lu) both have a 5d electron giving more stable half-full
or full 4f orbitals respectively Cerium (Ce) is also thought to possess a 5d electron The
most common oxidation state for the lanthanide ions is +3 whereby both of the 6s
electrons and either the 5d electron (if applicable) or one 4f electron are lost The first
two ionisation energies of the lanthanide elements are all relatively low corresponding
to the removal of the 6s electrons The third ionisation energy is also sufficiently low to
allow the generation of the Ln3+
ion in each case by removal of the 5d electron or a 4f
electron The fourth ionisation energies are generally significantly higher as the 4f
orbital becomes more stabilised as the first three electrons are removed This makes the
+4 oxidation state rare but can be formed by Ce Pr and Tb under certain conditions
Samarium (Sm) europium (Eu) and ytterbium (Yb) can form Ln2+
ions relatively
readily
β- β
- β
- β
-
23 mins 23 days 13 years 16 hours
37
Table 11 Electronic properties of the lanthanides 7
Symbol Name Electron
Configuration
(Metal)
Electron
Configuration
(Ln3+
)
3rd
Ionisation
Energy
(kJmol-1
)
4th
Ionisation
Energy
(kJmol-1
)
La Lanthanum [Xe]5d16s
2 [Xe] 1850 4819
Ce Cerium [Xe]4f15d
16s
2 [Xe]4f
1 1949 3547
Pr Praseodymium [Xe]4f36s
2 [Xe]4f
2 2086 3761
Nd Neodymium [Xe]4f46s
2 [Xe]4f
3 2130 3899
Pm Promethium [Xe]4f56s
2 [Xe]4f
4 2150 3970
Sm Samarium [Xe]4f66s
2 [Xe]4f
5 2260 3990
Eu Europium [Xe]4f76s
2 [Xe]4f
6 2404 4110
Gd Gadolinium [Xe]4f75d
16s
2 [Xe]4f
7 1990 4250
Tb Terbium [Xe]4f96s
2 [Xe]4f
8 2114 3839
Dy Dysprosium [Xe]4f10
6s2 [Xe]4f
9 2200 4001
Ho Holmium [Xe]4f11
6s2 [Xe]4f
10 2204 4100
Er Erbium [Xe]4f12
6s2 [Xe]4f
11 2194 4115
Tm Thulium [Xe]4f13
6s2 [Xe]4f
12 2285 4119
Yb Ytterbium [Xe]4f14
6s2 [Xe]4f
13 2415 4220
Lu Lutetium [Xe]4f14
5d16s
2 [Xe]4f
14 2022 4360
114 Properties of the 5f Elements
As previously stated the valence electron sub-shell for the actinides is the 5f
shell The electron configuration of the actinides is shown in Table 12 Thorium has no
5f electron but has 6d2 configuration as an empty 5f shell is more favoured Curium has
a 6d electron giving rise to a more stable half full 5f subshell
The actinide elements have a wide range of available oxidation states
particularly for the earlier metals For the heavier elements however the most common
oxidation state for the metal ions is +3 having lost both of the 7s electrons and either a
6d electron (if applicable) or one 5f electron The available oxidation states for each of
the actinides can be seen in Table 13 Ionisation energy values are not available for all
of the actinides although the standard electrode potentials for the reduction of An4+
to
An3+
and An3+
to An2+
can be used to give an indication of the ion stabilities The +4
38
oxidation state is the most favoured for Th as it gives rise to empty 6d and 7s shells but
An4+
generally becomes less favoured across the series and may only be found in
solution for americium and curium complexes Conversely the stability of the +2
oxidation state generally increases across the series with an irregularity at Cm which
does not have an available +2 oxidation state due to the stability of the half full 5f
subshell of Cm3+
The variety of oxidation states found in the earlier actinides suggests
that all of the valence electrons are available for bonding in these elements7
Table 12 Electronic properties of the actinides7
Symbol Name Electron
Config
(Metal)
Electron
Config
(An2+
)
Electron
Config
(An3+
)
Electron
Config
(An4+
)
Th Thorium [Rn]6d27s
2 NA [Rn]6d
1 [Rn]
Pa Protactinium [Rn]5f26d
17s
2 NA [Rn]5f
2 [Rn]5f
1
U Uranium [Rn]5f36d
17s
2 NA [Rn]5f
3 [Rn]5f
2
Np Neptunium [Rn]5f46d
17s
2 NA
[Rn]5f
4 [Rn]5f
3
Pu Plutonium [Rn]5f67s
2 NA [Rn]5f
5 [Rn]5f
4
Am Americium [Rn]5f77s
2 [Rn]5f
7 [Rn]5f
6 [Rn]5f
5
Cm Curium [Rn]5f76d
17s
2 NA [Rn]5f
7 [Rn]5f
6
Bk Berkelium [Rn]5f97s
2 NA [Rn]5f
8 [Rn]5f
7
Cf Californium [Rn]5f10
7s2 [Rn]5f
10 [Rn]5f
9 [Rn]5f
8
Es Einsteinium [Rn]5f11
7s2 [Rn]5f
11 [Rn]5f
10 [Rn]5f
9
Fm Fermium [Rn]5f12
7s2 [Rn]5f
12 [Rn]5f
11 [Rn]5f
10
Md Mendelevium [Rn]5f13
7s2 [Rn]5f
13 [Rn]5f
12 [Rn]5f
11
No Nobelium [Rn]5f14
7s2 [Rn]5f
14 [Rn]5f
13 NA
Lr Lawrencium [Rn]5f14
6d17s
2 NA [Rn]5f
14 NA
39
Table 13 Available oxidation states of the actinides and colours of ions in solution
where applicable Ions in black text are either not found in aqueous solution or are
unknown8
115 Relativistic Effects
Relativistic effects are much more important for heavy elements than light
elements as they are proportional to an atomrsquos mass The Special Theory of Relativity
as devised by Einstein shows that as the velocity (ν) of a particle increases towards the
speed of light (c) its mass (m) increases to infinity as shown in equation 11 where m0
is the rest mass of the particle This is the relativistic mass increase
Equation 11
For example the relativistic mass increase of a 1s electron in uranium (found to
be 135 me) can be calculated using the average radial velocity of the electrons (νrad)
which is roughly equivalent to the atomic number Z for 1s electrons and the rest mass
of an electron (me) This is shown in equation 12
Equation 12
This effect causes a contraction of 1s electron subshell due to the inverse
relationship between electron mass and the Bohr radius of an atom meaning that the
shell is held more closely to the nucleus and stabilised A similar effect is true for p
electrons The relationship can be seen in equation 13 where α0 is the Bohr radius e is
the elementary charge and ħ is the reduced Planckrsquos constant
Equation 13
7 NpO23+
PuO23+
AmO65-
6 UO22+
NpO22+
PuO22+
AmO22
+5 PaO2
+UO2
+NpO2
+PuO2
+AmO2
+
4 Th4+
Pa4+
U4+
Np4+
Pu4+
Am4+
Cm4+
Bk4+
Cf4+
3 Ac3+
Th3+
Pa3+
U3+
Np3+
Pu3+
Am3+
Cm3+
Bk3+
Cf3+
Es3+
Fm3+
Md3+
No3+
Lr3+
2 Am2+
Cf2+
Es2+
Fm2+
Md2+
No2+
Ac Th Pa U Np Pu Am Cm Bk Cf Es Fm Md No Lr
Most stable in aqueous solution Accessible Only found in solid complexes
40
This explains why relativistic effects are more significant for larger nuclei as the
mass increase is dependent on Z Conversely to the stabilisation of s and p electrons by
relativistic effects valence f and d orbitals are expanded further from the nucleus and
destabilised due to effective shielding of the s and p electrons of the nucleus The effect
is greater in the actinides due to the increased number of electrons and is responsible for
the variety of oxidation states exhibited by An as the valence 5f electrons are further
from the nucleus and are therefore more available for bonding Relativistic effects are
much less important for the lanthanides than the actinides as the actinides are more
destabilised by the effects7
116 Lanthanide and Actinide Contraction
There is a general decrease in the size of the metallic and ionic radii of the
lanthanides across the series explained by the fact that 4f electrons are considered to be
ldquocore-likerdquo so are not available for bonding This causes crystal field effects to be minor
in lanthanide complexes The ldquocore-likerdquo property of the 4f electrons prevents them
from shielding valence electrons in outer subshells from the nucleus allowing the
effective nuclear charge (Zeff) to increase and causing contraction of the atoms and ions
across the series The lanthanide contraction is responsible for the small size difference
between the second and third row transition metals
The ionic radii of the actinides for the +3 +4 and +5 oxidation states gradually
decrease in size across the series although the metallic radii do not follow the same
trend The effect of the trend on the chemistry of the elements is not well known as the
later elements cannot be made with large enough yields to study and they decay too
rapidly The gradual decrease is due to the fact that 5f-electrons are poor at shielding s
and p electrons from the nucleus due to their greater radial extension allowing the
effective nuclear charge (Zeff) to increase and the s and p electrons to be held more
closely to the nucleus
117 Co-ordination Chemistry of the Lanthanides and Actinides in Solution
Lanthanide ions are hard Lewis acids and so co-ordinate readily with hard bases
The core-like nature of the 4f electrons prevents them from interacting significantly with
ligand orbitals and means that lanthanide complexes are bonded electrostatically The
co-ordination geometry of complexes is therefore determined predominantly by the
steric interactions of the ligands The high charge density of the Ln3+
ions allows them
41
to form ionic bonds however this means that many lanthanide complexes are labile in
solution
Actinide ions are also hard Lewis acids co-ordinating easily with hard bases
The greater radial extension of the 5f electrons caused by relativistic effects gives rise
to greater chemical activity in the actinides than the lanthanides as the 5f electrons are
more available for bonding This also explains the tendency of the early actinides to
form covalent bonds however the later actinides mainly interact electrostatically like
the lanthanides
Actinide ions are found as An3+
for the later elements in the series except for
No which is found as No2+
and they behave much like the lanthanides However for
some of the early actinides linear actinyl ions (AnO2+ and AnO2
2+) can be observed in
addition to free ions and are often more stable particularly for U91011
Lanthanide and actinide complexes often have high co-ordination numbers
typically 8 or 9 in aqueous solution (although co-ordination numbers as high as 12 have
been reported) due to their large size The Ln3+
ion forms readily in aqueous solution
and the An3+
ion is the common form for the later actinides however the solution state
chemistry of the early actinide ions is complicated Americium is mainly found in the
+3 oxidation state in solution although it also forms the AmO22+
ion The Am7+
oxidation state has been known to exist but is unstable except in very alkaline
conditions
It is difficult to determine the exact co-ordination numbers and geometries of Ln
and An ion complexes in solution due to the lability of the complexes particularly for
lanthanides
1171 Hydrolysis
The solvation of metal cations by water particularly cations with a high charge
density such as Ln3+
and An3+
ions will result in some hydrolysis The cations polarise
the O-H bonds of the solvent allowing the hydrated metal cations to act as Broslashnsted
acids An example can be seen in Equation 14
Equation 14 [Eu(H2O)8]3+
+ H2O rarr [Eu(H2O)7(OH)]2+
+ H3O+
The acidity of the Ln3+
cations increases across the series as the charge density
increases For the An ions the acidity increases as follows
AnO2+ lt An
3+ lt AnO2
2+ lt An
4+
42
Generally the acidity increases with increasing charge density like Ln The
position of AnO22+
can be explained by the fact that the O2-
ions do not fully reduce the
charge on the An ion and so the effective charge of the ion is seen to be +331
1172 Monodentate Ligands
Substituting water for other monodentate ligands in aqueous solution is
challenging for lanthanides as the complexes are labile and the high charge density of
the ion and affinity for a polar environment means that it will often remain solvated
Isolating monodentate complexes from water is almost impossible as Ln3+
ions having a
high enthalpy of hydration making complex formation endothermic Complexation can
be achieved much more easily by the use of macrocyclic or chelating ligands
Conversely it is much easier to form monodentate actinide complexes in water
such as salts which will become hydrated rather than completely substituted by water
molecules However complexation is still much easier with macrocycles or chelates in
aqueous solution12
1173 Chelates and Macrocycles
When a chelate or macrocycle ligates to an ion the reaction entropy increases as
water molecules are eliminated from the complex (see Equation 15) which is
thermodynamically favourable As a chelating or macrocyclic ligand bonds to the metal
ion the remainder of the ligand is considered to be in close proximity to the ion giving
it an ldquoartificially highrdquo concentration and is therefore more likely to bond than
surrounding ions or ligands
Equation 15 [Eu(H2O)8]3+
+ EDTA4-
rarr [Eu(EDTA)(H2O)3]- + 6H2O
Chelating complexes increase in stability across lanthanide and actinide series
This is because the Coulombic attraction between the ligand and the metal increases
with charge density However there is a slight irregularity in this trend for the
lanthanides where a slight dip can be seen at Gd3+
as this is thought to be the point at
which the co-ordination number changes from 9 to 8 often referred to as the
lsquogadolinium breakrsquo12
43
12 Analytical Methods
121 NMR Spectroscopy
Most lanthanide and actinide complexes are paramagnetic as they have unpaired
electrons The nuclei of paramagnetic complexes are subjected to a local magnetic field
in addition to the field generated by the spectrometer causing the complexes to have
larger chemical shifts NMR spectra of paramagnetic complexes often have broad peaks
as they have faster spin-lattice relaxation times due to strong spin-orbit coupling13
The
relationship is explained by the Heisenberg Uncertainty Principle which links energy
(E) and time (t) in Equation 16 where h is Planckrsquos constant
Equation 16
Considering the relationship between energy and frequency (ν) in Equation 17
the Heisenberg equation can be rearranged to show the inverse relationship between the
change in frequency (Δν) or ldquospectral linewidthrdquo (defined as the peak width of the
signal at half of its maximum height) and the lifetime of the excited state or in this case
spin-lattice relaxation time (Δt) See Equation 1814
Equation 17
Equation 18
122 Luminescence Spectroscopy
1221 Fluorescence and Phosphorescence
Fluorescence and phosphorescence are both types of luminescence Radiation is
used to excite electrons into a higher electronic energy level which then emit photons
(light) as they relax back down to their ground state Fluorescence is a relatively fast
process (picoseconds to milliseconds) as it is an allowed transition by the spin selection
rule not involving a change in spin multiplicity Phosphorescence is a slower process
(milliseconds to seconds) as it does involve a change in electron spin from a singlet to a
triplet excited state ndash it is formally ldquospin-forbiddenrdquo The processes can be seen in the
Jablonski diagram in Figure 11 By contrast f-f transitions whereby f-electrons are
excited into other f-subshells are formally Laporte forbidden so direct excitation of the
4f electrons is unfavourable These rules are relaxed a little by vibronic (vibrational and
44
electronic) coupling in which a vibration in the molecule causes the temporary
lowering of the symmetry of the metal allowing the d and p orbitals to share symmetry
The transition has some drarrp character and so becomes more intense However for
vibronic coupling to take place the valence orbitals must interact with incoming
ligands For the transitions that occur in the visible region of the spectrum this explains
why the colours of Ln3+
ions are weak as the valence 4f shell interacts poorly with
ligands due to their core-like nature Vibronic coupling is greater in actinide ions
Figure 11 Jablonski diagram showing fluorescence and phosphorescence15
1222 Lanthanide Luminescence
Lanthanide ions in which f-f transitions can occur are luminescent and emit
across a range of the electromagnetic spectrum from the Ultra-Violet (UV) range to the
visible (vis) or near-infra-red (nIR) region of the spectrum (Table 14) La3+
does not
possess any f-electrons and Lu3+
has a full 4f shell so these two ions are not
luminescent
45
Table 14 Luminescence of lanthanide ions
Luminescent ions which emit
in the nIR region of the
spectrum
Colours of luminescent ions
which emit in the visible and
UV regions of the spectrum
Pr3+
Sm3+
Nd3+
Eu3+
Ho3+
Tb3+
Er3+
Dy3+
Yb3+
Tm3+
Gd3+
(UV)
Ce3+
(UV)
Lanthanide ions have long luminescence lifetimes as their transitions are
formally forbidden Since the interaction between the metal ion and the ligand is
negligible in lanthanides the emission spectra of lanthanide complexes have narrow
emission lines resembling the spectra of the free ions Solid lanthanide compounds and
complexes also tend to be luminescent1617
1223 Actinide Luminescence
Actinide ions in which f-f transitions can occur are luminescent and also emit
across a range of the electromagnetic spectrum from the UV range to the infra-red IR or
nIR region (Table 15) Ac3+
and Th4+
do not have any f-electrons and Lr3+
has a full 4f
shell so these two ions are not luminescent No luminescence studies have been
performed on Fm3+
Md3+
or No2+
The remaining An have luminescent ions but studies
have been most widely performed on UO22+
Am3+
and Cm3+
as these are the most
widely available have fewer problems associated with radioactivity and safety and are
the most well understood
46
Table 15 Luminescence of actinide ions
Luminescent ions which emit
in the IRnIR region of the
spectrum
Colours of luminescent ions which
emit in the visible and UV regions
of the spectrum
NpO22+
Pa4+
(UV) Pa4+
Pa4+
Pa4+
Pa4+
Am3+
U4+
(UV) U4+
Es3+
UO2+
UO22+
UO22+
UO22+
UO22+
Am3+
Am3+
Am3+
Am3+
Cm3+
Bk3+
Cf3+
Unlike lanthanides actinide emission spectra and lifetimes vary depending on
the species and bound species or counter ions although most lifetimes for An are short
(lt 20 ns) with the exceptions of the 5f0 species UO2
2+ (which has lifetimes varying
from 130 ns to 300 μs) and Cm3+
which has a lifetime of ~65 μs and is known to have
the highest luminescence quantum yield of the An ions allowing it to be studied in very
low concentrations which is useful due to its low availability Luminescence studies on
solid state An compounds are unreliable as they are susceptible to radioluminescence
whereby the energy released by radioactive decay can result in the generation of an
emissive excited state718
1224 Sensitised Luminescence and Antennae
Sensitisation of luminescence can occur if an ldquoantennardquo is present which is a
sensitising chromophore An electron is excited on the ion by energy transferred from
the chromophore The antenna must be in close proximity to the ion for energy transfer
to take place and so antennae are usually used as ligands
Antennae are predominantly organic aromatic materials bonded to macrocycles
(as these are easier to ligate to the metal ions in solution) During sensitisation an
electron from the chromophore is excited from its ground state to a singlet excited state
Energy may then be transferred to a triplet excited state by inter-system crossing (ISC)
where the potential curves of the two states intersect at similar energies Although this
spin forbidden spin orbit coupling makes it possible by slightly shifting the electronrsquos
energy levels Energy from the triplet state is then transferred to the metal ionrsquos excited
47
state The ion can then relax to its ground state by luminescence This is the most
common pathway for sensitised emission however it is possible to transfer energy
directly from the singlet excited state on the chromophore to the ion (Figure 12)
Figure 12 Energy transfer pathway for sensitised luminescence of Ln3+
complexes 1S
represents an excited singlet state 3T an excited triplet state and f and frsquo represent
excited states of the Ln3+
ion 19
1225 Russell-Saunders Coupling
ldquoTerm symbolsrdquo are used to label ground state and excited state energy levels
for lanthanide ions Term symbols are derived from Russell-Saunders coupling and
account for the net atomic orbital angular momentum and the net spin angular momenta
of the state determined from the sum of the individual angular momenta of an ionrsquos
electrons Term symbols take the form
(2S+1)LJ
where S is the spin multiplicity of the state L corresponds to the ldquolrdquo quantum number
for the state and J is the coupling of L and S Excited states have several possible J
values although the ground state always has a single J value which can be determined
by Hundrsquos rules The Russell-Saunders coupling scheme is only useful for lanthanide
ions and cannot be applied to actinide ions as spin-orbit coupling is much greater in An
and the 5f orbitals have different properties to the 4f orbitals in particular the greater
importance of relativistic effects (see Section 115) However Russell-Saunders terms
have been used as a basis for assigning ground and excited state terms20
F = Fluorescence P = Phosphorescence L = Luminescence NR = Non Radiative Decay ISC = Inter System Crossing ET = Energy Transfer BT = Back-energy Transfer IC = Internal Conversion
48
1226 Quenching
The excited states of the trivalent lanthanides and actinides are readily quenched
in solution Quenching occurs when the vibrational energy levels of high energy
oscillators (such as C-H N-H or O-H bonds) within the molecule or its environment
(solvent) have a similar energy to the excited state of an ion Inter-System Crossing
(ISC) from the excited state to these vibrational levels can occur causing non-radiative
decay preventing luminescence The efficiency of this non-radiative decay is dependent
upon the energy gap between the emissive state and the ground state of the ion and also
on the number of quanta (energy levels) of the oscillator If the non-radiative decay is
favourable and happens faster than luminescence quenching will occur Quenching
reduces the intensity lifetime and quantum yield of luminescence If the ionrsquos emissive
state is close in energy to the triplet excited state of the ligand (lt 20000 cm-1
) thermal
quenching may also occur whereby energy is transferred backwards to the triplet
excited state of the chromophore21
1227 Quenching in Lanthanides and Actinides
Tb3+
is less susceptible to vibrational quenching than other lanthanide ions as the
energy gap between the lowest emissive state and the ground state of Tb3+
is very high
(20500 cm-1
) It is however susceptible to thermal quenching and back energy transfer
Eu3+
also has a large energy gap (17250 cm-1
) This results in a relatively greater
emission intensity for these ions
Other lanthanide ions such as Pr3+
Ho3+
Er3+
Tm3+
Yb3+
Dy3+
and Sm3+
with
smaller energy gaps are more easily quenched giving less intense emission Er3+
has the
smallest energy gap close to the υ=0 energy level of O-H so is the most easily
quenched (see Figure 13) The lower energy levels of the oscillators provide better
overlap with the energy levels of the ions due to a better overlap with the wavefunction
therefore ions which have energy levels that overlap with the lower quanta of the
oscillators will also be more easily quenched Gd3+
has the highest energy gap of the
lanthanide ions (32000 cm-1
) and cannot be sensitised by conventional UV absorbing
chromophores
49
Nd3+Eu3+ Tb3+Yb3+ O-H O-DTm3+ Sm3+ Pr3+ Er3+
3H4
4I132
4I112
3H4
3H5
3H6
3H6
3H5
3H4
0
20000
4I92
4I112
4I132
4I152
4F32
2H92
4S32
4F92
2H112
4G52
4G72
4G92
(2D2P)32
4G1125D4
7F07F17F27F37F4
7F5
7F67F0
7F1
7F2
7F3
7F4
7F5
7F6
5D0
5D1
5D2
2F52
2F72
10000
6H52
6H72
6H92
6H112
6H132
4F32
4G52
4F32
4F12
4F52
4F72
4G72
4F92
4F112
3F2
3F4
3P0
3P1
3F3
1I6
1G4
4I92
4F92
4S32
4F72
3F4
3F3
3F2
1G4
E
cm
-1
=0
=1
=2
=3
=4
=5
=0
=1
=2
=3
=4
=5
=6
=7
2H112
1D2
Figure 13 Energy level diagram showing the ground and excited states of a selection
of lanthanides and vibrational oscillators Emissive states are shown in red The energy
levels of O-H and O-D oscillations are shown in blue22
Actinides are also susceptible to quenching even more so than the lanthanides
as all of them have smaller energy gaps between the lowest emissive state and the
ground state The energy gaps of some actinides compared to lanthanides can be seen in
Figure 14
50
Figure 14 The energy gaps between the lowest emissive states and ground
states of a selection of lanthanides and actinides represented by arrows23
1228 Suitable Solvents for Luminescent Complexes
In addition to quenching by vibrational oscillators on ligands luminescence can
also be quenched by solvents High energy oscillators must therefore be eliminated from
the solvent in order for luminescence to take place in the solution phase This is
generally achieved by using deuterated (or fluorinated) solvents such as D2O It is also
important to use strongly co-ordinating solvents that would replace the labile ligands
The Horrocks equation can be used to calculate the number of co-ordinated solvent
molecules (q) to an ion whether it is a free ion or co-ordinated to a ligand The original
Horrocks equation (Equation 19) and modified Horrocks equation for q lt 2 (Equation
110) are shown below
Equation 19
Equation 110
The Horrocks equation uses the emission lifetimes (τ) to determine q A is the
proportionality constant taking into account the inner hydration sphere and B is a
correction factor taking into account the outer hydration sphere A and B values are
experimentally determined constants and are available for Sm3+
Eu3+
Tb3+
Nd3+
Yb3+
Am3+
and Cm3+
Inner sphere hydration (q) values can be effectively determined from
51
solutions of water and methanol For the original Horrocks equation A = 105 for Eu3+
and A = 42 for Tb3+
and for the modified Horrocks equation (when q lt 2 ) A = 12 ms
and B = (025 ndash 0075x) ms-1
(where x = the number of exchangeable N-H oscillators)
for Eu3+
and A = 5 ms and B = 006 ms-1
for Tb3+
242526
13 Nuclear Theory
131 Nuclear Power
Currently all nuclear energy irrespective of use is generated by nuclear fission
Nuclear fission is the splitting of a fissile nucleus into two smaller nuclei often aided by
the collision of an incoming particle or neutron The nucleus captures the neutron
which makes it unstable and it breaks into two fragments The splitting process releases
more neutrons which may continue to cause fission of more nuclei generating a chain
reaction An example of a chain reaction caused by 235
U fission can be seen in Figure
15
Figure 15 Chain reaction generated by fission of 235
U into 92
Kr and 141
Ba27
Fission of heavy radioactive actinide elements is exothermic and a chain
reaction can occur if there are enough fissile nuclei present The amount of fissile
material required for a self-sustaining chain reaction is the ldquocritical massrdquo and any mass
above this is referred to as a ldquosupercritical massrdquo which if not controlled can lead to a
runaway chain reaction and a nuclear explosion
52
235U fission is used to generate nuclear power The fission products (FP) collide
with other atoms and their kinetic energy in converted into heat which is absorbed by
the cooling water and then used to drive steam turbines to generate electricity Control
rods are used in the reactor to control the neutron flux and prevent a runaway chain
reaction These are often made of boron nitride which is a neutron absorber
Moderators are also used to slow down the neutrons to the optimum energy for fission
(~2 kJ mol-1
) and these tend to be light nuclei (12
C or 2H)
132 The Nuclear Fuel Cycle
Uranium is mined in its ore form from the ground mainly in Middle Eastern
countries Canada Australia and Africa The ore is then milled to extract the uranium as
ldquoyellowcakerdquo which is mixed oxides of triuranium octoxide (U3O8) uranium dioxide
(UO2) and uranium trioxide (UO3) by leaching with acid or alkali followed by
precipitation The remaining ore ldquotailingsrdquo are disposed of as radioactive waste
The yellowcake is then further processed as only 07 of uranium is fissile
235U the dominant isotope is
238U The uranium oxide is enriched by increasing the ratio
of 235
U238
U to approximately 35-5 235
U This is done by converting all of the mixed
oxides into uranium dioxide and then to uranium hexafluoride (UF6) gas and separating
it into two streams ndash one of which is enriched in 235
U and the other depleted
The enriched UF6 is then converted back to UO2 which can be pressed and
heated to 1400 degC to form fuel pellets The depleted uranium is treated as waste The
fuel pellets are subsequently encased in metal rods which can then be used in a fuel
assembly in a reactor
After 18-36 months the build-up of fission products is such that the efficiency
of the fuel decreases so the fuel rods are removed and replaced The used fuel is then
stored for months or years in water which absorbs the heat until the radiation levels
decrease sufficiently for it to be disposed of or reprocessed As there are no disposal
facilities at present for nuclear fuel waste it is simply isolated from the environment
and left in storage until facilities become available28
A diagram of the Nuclear Fuel
Cycle can be seen in Figure 16
The once-through or ldquoopenrdquo fuel cycle whereby waste is stored for disposal is
favoured by a number of countries including Canada parts of Europe and the USA
presently although some research on reprocessing techniques is being carried out in
these areas as reprocessing is becoming increasingly important for the future of nuclear
power A ldquoclosedrdquo fuel cycle whereby the waste is recycled and reused is becoming
53
more and more favoured as a result of this and has been performed in some parts of the
world for many years including the UK and other parts of Europe Russia and Japan29
Figure 16 The Nuclear Fuel Cycle30
133 Spent Nuclear Fuel and Reprocessing
The reprocessing of spent nuclear fuel (SNF) is essential for preventing the
exhaustion of uranium supplies and reducing the volume and radiotoxicity of the waste
produced
Current reprocessing techniques involve the removal of re-usable uranium and
plutonium present in the waste which can be recycled and reused together in mixed
oxide (MOX) reactors to produce more nuclear power31
The amount of waste
remaining in storage at present worldwide that could be reprocessed is approximately
200000 tonnes with a global reprocessing capacity of around 4000 tonnes per year
90000 tonnes have been reprocessed over the last 50 years
In addition to the reusable U and Pu in the spent nuclear fuel (SNF) there are
also a variety of other fission products (FP) present such as minor actinides (MA) Np
Am and Cm Ln and transition metals (TM) in addition to corrosion products (CP)
54
from steel containers and pipes in the system as a result of radiolysis erosion and
ageing of equipment These are TM chiefly cobalt (Co) chromium (Cr) iron (Fe) and
manganese (Mn) The composition of SNF can be seen in Table 16 Recently research
into the removal of the other actinides from the waste has become important in order to
transmute them into shorter-lived radionuclides so that their radioactivity will not
persist for as long making the disposal process easier and faster This coupled with a
similar approach for any remaining plutonium will make the waste proliferation
resistant as it would not allow the Pu to be recovered from storage in the future for
proliferation purposes
Table 16 Approximate compositions of SNF in Light Water Reactors (LWR)32
Constituent of SNF
U 956
Stable FP (including Ln) 29
Pu 09
Cs amp Sr (FP) 03
I amp Tc (FP) 01
Other long-lived FP 01
MA 01
Although MA only make up 01 of fission products they are highly radiotoxic
and extremely long-lived and so it would be beneficial to separate MA from the
remaining fission products so that they can be transmutated into shorter lived
radionuclides by neutron bombardment The necessity of the separation arises from the
presence of Ln as Ln are known to be neutron scavengers or ldquoneutron poisonsrdquo 33
meaning that they have a high neutron cross section and are able to absorb neutrons
preventing transmutation of other species present
Neptunium is relatively simple to remove from the mixture of fission products
as it has a variety of oxidation states that can be utilised in the process34
However the
predominant trivalent minor actinides (MAs) Am and Cm are much more difficult to
separate from the remaining lanthanide waste due to the similarities in the chemistries
of the elements and the electrostatic nature of interactions of the hard Lewis acidic Ln3+
ions with ligands35
Much of this new research is focussed on separating Am3+
and
Cm3+
from Ln3+
55
134 Solvent Extraction
Currently there are no MA-Ln separation techniques employed commercially
although a number of different processes are being developed particularly in the USA
and Europe with a drive to implement a working process within the next 5 years
Despite differences in the chemistry between the techniques under development all of
them use solvent extraction as the ultimate separation technique
Solvent extraction is the process of separation of two (or more) species using
two immiscible liquids (usually an organic and aqueous phase) by the use of
complexing agents to selectively move only one species between phases This may or
may not be aided by the use of a complexing agent which binds preferentially to one of
the species36
The success of this technique varies between compounds and solvent systems
and can be determined using a separation factor (SF) This is a ratio based on the
distribution ratios (D) of the elements to be separated (Equations 111 and 112)
Equation 111
Equation 112
There are a number of existing methods for removing radiotoxic elements from
fission products these are discussed over the next few sections
1341 PUREX
PUREX (Plutonium and Uranium Refinement by Extraction) is the process used
by nuclear plants that carry out reprocessing to remove U and Pu from the waste in
order to reuse it (Figure 18) Strong nitric acid (~ 4M HNO3) is used to dissolve the
waste in an aqueous phase to form hydrated nitrate complexes of the corresponding
oxides of U and Pu (Equations 113 and 114) High concentrations of acid (2-6 M) are
used to increase the solubility of the oxides
Equation 113 UO22+
+ 2NO3- (aq) rarrUO2(NO3)2xH2O
Equation 114 PuO22+
+ 2NO3- (aq) rarrPuO2(NO3)2xH2O
56
The plutonium complex is then reduced using nitrogen tetroxide (N2O4) to the
corresponding Pu4+
complex and the solution is filtered to remove any precipitates
(Equation 115)
Equation 115 PuO2(NO3)2xH2O + N2O4 rarr Pu(NO3)4xH2O
The solution is then contacted with an organic phase (kerosene) containing tri-
nbutyl phosphate (TBP) as an extracting agent (Figure 17) which forms complexes
with the U and Pu nitrate hydrates to move them into the organic phase (Equations 116
and 117)
Equation 116 UO2(NO3)2xH2O + 2TBP rarr UO2(NO3)2(TBP)2
Equation 117 PuO2(NO3)2xH2O + 2TBP rarr Pu(NO3)4(TBP)2
However Tc and Np are also extracted at this point This is a disadvantage for
the purpose of the PUREX process but is advantageous for subsequent MA-Ln
separation processes which could follow The UO22+
and NpO2+ TBP complexes are
then separated from the Pu4+
and TcO4- complexes by reduction of Pu
4+ to Pu
3+ with
hydrazine (N2H4) and extraction back into water (Equations 118 and 119)3738
Equation 118 N2H4 + H2O harr N2H5+ + OH
-
Equation 119 Pu(NO3)4(TBP)2 + N2H5+ rarr Pu(NO3)3(TBP)2 + N2H5NO3
The Pu3+
and TcO4- are then separated from each other through another
extraction cycle and then a ldquostrippingrdquo solution of nitric acid hydroxylamine and
sulphuric acid to obtain pure Pu The UO22+
and NpO2+ are also extracted back into
aqueous solution and separated from each other through another extraction cycle Pure
U is obtained by using aqueous nitric acid for stripping (back-extraction)39
The process
has been proven to work well and it is an advantage that the organic phase can be reused
after stripping However the process has a few drawbacks ndash the need for high acid
concentrations makes it less environmentally friendly the need for redox control and
less stable oxidation states makes it longer and complicated and the use of phosphorus
reagents makes the products more difficult to dispose of as phosphorus waste is not
57
incinerable and so any radioactive waste must be separated from the phosphorus before
treatment40
Figure 17 Chemical structure of TBP (Tri-nbutyl phosphate)
Figure 18 PUREX flow diagram41
1342 TRUEX
TRUEX (TRansUranic EXtraction) is an example of advanced reprocessing
(removal of MA and Ln) that is being developed in the USA The principle of the
process is to selectively remove Am and Cm (MA) and Ln from the other fission
58
products left in the raffinate after the PUREX process (Figure 110) A combination of
extractants is used carbamoylmethylphosphine oxide (CMPO) (Figure 19) and TBP (as
in the PUREX process) The benefit of the combined extractant system is that the
process is effective over a range of acidities (07-5 M HNO3) The raffinate (in nitric
acid) from the PUREX process is contacted with the extractant in an organic phase of
normal paraffinic hydrocarbon (NPH) Oxalic acid is then added to prevent the co-
extraction of zirconium (Zr) and molybdenum (Mo) with the MA An additional wash is
also performed using sodium carbonate (Na2CO3) to prevent any other fission products
from being co-extracted The extractants selectively remove the MA and Ln into the
organic phase leaving the remaining fission products in the aqueous phase The MA
and Ln are then stripped using nitric acid and can be reprocessed further as required
However a main drawback is that the lanthanides are still present with the MA so
further reprocessing is required 42
Figure 19 Chemical structure of CMPO (NN-diisobutyl-2-
(octyl(phenyl)phosphoryl)acetamide)
59
Figure 110 TRUEX flow diagram
1343 DIAMEX
The DIAMEX (DIAMide Extraction) process is another example of advanced
reprocessing and is currently under development in France by the CEA (Commissariat agrave
lEnergie Atomique et aux Energies Alternatives) (Figure 113) It is similar to the
TRUEX process as the process selectively removes Am and Cm (MA) and Ln from the
PUREX raffinate The process is being researched using a variety of different diamides
as the extractant the most promising of which have been shown to be NNrsquo-dimethyl-
NNrsquo-dibutyl-tetradecylmalonamide (DMDBTDMA) (Figure 111) and NNrsquo-dimethyl-
NNrsquo-dioctyl-hexylethoxymalonamide (DMDOHEMA) (Figure 112)4344
The nitric
acid PUREX raffinate is contacted with the extractant in an organic phase of tetra-
propylene-hydrogenated (TPH) a synthetic branched form of dodecane45
Oxalic acid is
then added to prevent the co-extraction of Zr and Mo with the MA as in the TRUEX
process and the extractant selectively removes the MA and Ln into the organic phase
leaving behind the other fission products in the aqueous phase The MA and Ln are then
stripped using nitric acid and can be reprocessed further as required
The main benefit of this process compared to the TRUEX process is that the
organic waste only contains C H N and O as P reagents are not used so the waste can
be disposed of more easily However like the TRUEX process a main drawback is that
the lanthanides are still present with the MA so further reprocessing is required 46
Figure 111 Chemical structure of DMDBTDMA (N1N3-dibutyl-N1N3-
dimethyl-2-tetradecylmalonamide)
60
Figure 112 Chemical structure of DMDOHEMA (N1N3-dibutyl-2-(2-
(hexyloxy)ethyl)-N1N3-dimethylmalonamide)
Figure 113 Example DIAMEX flow diagram
1344 SANEX
SANEX (Selective ActiNide EXtraction) is another process being developed by
CEA and is intended to be coupled with a TRUEX or DIAMEX type process and is the
next step in the advanced reprocessing whereby the MA and Ln are separated from
each other so that the MA can be treated (Figure 117) Complexing agents such as bis-
triazinyl-pyridines BTPs and their bipyridine variants (BTBPs) (Figure 114) have been
widely studied with a more recent complexing agent tetraoctyldiglycolamide (TODGA)
(Figure 115) being studied47
The complexing agents have been found to preferentially
bind to the MA allow only the MA to be extracted into an organic phase using TBP
leaving the Ln in the aqueous phase Oxalic acid and (2-hydroxyethyl)-
61
ethylenediaminetriacetic acid (HEDTA) (Figure 116) are used to prevent the co-
extraction of any other fission products The chemistry of this process is poorly
understood however and more research is needed48
However many of these extractant
molecules suffered problems that preclude them from use in plant-scale extractions
including poor stability slow extraction kinetics the use of citric acid as a buffer and
inefficient back extraction due to high An3+ affinities
Figure 114 General chemical structure of BTPs (66-di(124-triazin-3-yl)-22-
bipyridine)
Figure 115 Chemical structure of TODGA (22-oxybis(NN-dioctylacetamide))
Figure 116 Chemical structure of HEDTA (22-((2-((carboxymethyl)(2-
hydroxyethyl)amino)ethyl)azanediyl)diacetic acid)
62
Figure 117 SANEX flow diagram for TODGA process
1345 i-SANEX
The innovative SANEX (or i-SANEX) process is also currently under
development at the CEA49
Essentially it is a modified DIAMEX process with selective
back extraction of Am3+
and Cm3+
from the organic phase The MA3+
and Ln3+
ions are
initially extracted from the PUREX raffinate using TODGA and then a hydrophilic
complexant that is selective for MA3+
is employed to back extract the minor actinides
from the loaded organic phase into the aqueous phase In order to retain the lanthanide
ions in the organic phase a nitrate salt is added to the stripping solution Hydrophilic
extracting agents that have been used to demonstrate this technique are DTPA
(diethylenetriaminepentaacetic acid) and the sulphonated BTP derivative 26-bis(56-
di(sulphophenyl)-124-triazin-3-yl)pyridine SFrsquos of up to 1000 are achievable in this
process50
One other option that has been suggested is to add a second stripping agent
such as HDEHP to the organic phase in order to retain the lanthanides in the organic
phase at low pH One major drawback of this process however is the limited operative
acidity range (ca pH 3) which means that buffering agents need to be added to the
aqueous phase in the back extraction step Another reprocessing concept currently under
investigation is the 1-cycle SANEX with the intention to directly extract the trivalent
actinides selectively from the PUREX raffinate A system consisting of 015 M
CyMe4BTBP and 0005 M TODGA in a mixture of 40 TPH and 60 1-octanol has
been proposed51
63
1346 GANEX
The GANEX (Grouped ActiNide EXtraction) process is relatively new and is a
complete separation process combining the principles of the PUREX and TRUEX
processes in order to separate all of the An (U Pu and MA) from the Ln and both from
the other fission products (Figure 121) A complexing agent bis-triazin-bipyridine
(BTBP) (Figure 118) and its variants (such as CyMe4-BTBP (Figure 119) and CyMe4-
BTPhen (Figure 120))52
have been tested and found to be effective in selectively
coordinating to and extracting MA high separation factors of Am3+
over Eu3+
gt 1000
have been documented In the proposed process BTBP is dissolved in cyclohexanone
(as it is soluble in this solvent and has faster extraction kinetics) and used alongside
TBP which extracts U and Pu and is stable against radiolysis and hydrolysis especially
the CyMe4 variant If proven to be successful this process would simplify reprocessing
making it much simpler however much more work is needed before this process could
become operational as co-extraction of fission products is currently a problem53
For the
most attractive candidate to date the CyMe4-BTBP extractant has been successfully
tested for the extraction of genuine actinidelanthanide feed through a 16-stage
centrifugal contactor setup with excellent recoveries for americium and curium
(gt999) but has been shown to undergo radiolytic degradation at doses that will be
encountered at the high minor actinide loadings obtained in the reprocessing of for
example fast reactor fuels The kinetics for actinide extraction with CyMe4-BTBP are
still relatively slow so the addition of a phase-transfer catalyst is necessary (eg NNprime-
dimethyl-NNprime-dioctylethylethoxymalonamide (DMDOHEMA)) if this extractant is to
be used for large- scale partitioning
Figure 118 General chemical structure of BTBPs (66rsquo-bis(124-triazin-3-yl)-22rsquo-
bipyridine)
64
Figure 119 Chemical structure of CyMe4-BTBP (66-bis(5588-tetramethyl-5678-
tetrahydrobenzo[e][124]triazin-3-yl)-22-bipyridine)
Figure 120 Chemical structure of CyMe4-BTPhen (29-bis-(124-triazin-3-yl)-110-
phenanthroline)
65
Figure 121 GANEX flow diagram
1347 TRPO
Another advanced reprocessing extraction process being developed in China is
the TRPO (TRialkyl Phosphine Oxide) process which involves the separation of all
actinides in stages to remove Np and Pu together AmCm and Ln together and isolate
U There are two processes being researched both of which use TRPO (Figure 122) as
the extractant but differ in the other reagents used One system uses TTHA (triethylene
tetramine hexaacetate) (Figure 124) as a complexing agent to selectively bind to
different actinides preferentially at different pH values to allow selective extraction
buffered by lactic acid (Figure 125) The other process uses nitric acid to extract MA
and Ln followed by oxalic acid to extract Pu and Np Both processes then use sodium
carbonate to strip the remaining U from solution (Figure 126) The main advantage of
the first system is that MA and Ln can subsequently be separated from each other using
CYANEX 301 (Figure 123) with the main disadvantage being the need for buffering
due to pH dependence The main advantage of the second system is that the separation
between components is excellent and virtually discrete but the main disadvantage is that
MA and Ln cannot be later separated from each other using CYANEX 301 due to the
high acidity of the solution54
66
Figure 124 Chemical structure of TTHA (3-(2-((2-
(bis(carboxymethyl)amino)ethyl)(carboxymethyl)amino)ethyl)-6-
(carboxymethyl)octanedioic acid)
Figure 125 TRPO flow diagram using TTHA
Figure 122 Chemical structure of TRPO
(trialkyl phosphine oxide R = C6 ndash C8)
Figure 123 Chemical structure of
CYANEX 301 (bis(244-
trimethylpentyl)phosphinodithioic acid)
67
Figure 126 TRPO flow diagram using HNO3 and oxalic acid
1348 LUCA
LUCA (Lanthaniden Und Curium Americium trennung lanthanide and curium
americium separation) is a relatively new process currently being developed in
Germany and is designed to follow the SANEX or DIAMEX processes The process
involves the selective separation of Am3+
from Cm3+
Cf3+
and Ln3+
after co-extraction
A combined extractant system of bis(chlorophenyl)dithiophosphinic acid
((ClPh)2PSSH) and tris(2-ethylhexyl)phosphate (TEHP) in isooctane and tert-butyl
benzene is used Advantages of the LUCA process include high recovery after stripping
and that the phosphinic acid is more stable to hydrolysis and radiolysis than CYANEX
301 however the phosphinic acid was found to be unstable in high HNO3
concentrations55
At present as with the majority of the MALn processes described the
exact origin of the selectivity remains unclear however it is clear that in general
simple extractant molecules are favourable
68
Figure 127 LUCA flow diagram
1349 EXAm
The EXAm (Extraction of Americium) process is another relatively new process
developed by the CEA for the extraction of only americium from a PUREX raffinate56
Americium is the main cause of heat emissions in SNF wastes and so selective removal
and reprocessing of Am is favourable for vitrified waste disposal Separation of Am3+
from Cm3+
was considered as Cm reprocessing would be difficult to implement due to
high neutron emissions which would require very thick shielding
The process uses a mixture of two extractants (DMDOHEMA and HDEHP) in
TPH from a 4-6 M HNO3 FP solution TEDGA (NNNrsquoNrsquo-tetraethyl-diglycolamide)
(Figure 128) is used as the complexing agent to selectively retain Cm3+
and Ln3+
in
solution allowing extraction of Am3+
Advantages of the process are that the use of
TEDGA over TODGA allows increased separation of Am3+
Cm3+
and TEDGA is
relatively resistant to radiolysis However the chemistry remains quite poorly
understood and separation factors are still quite low at ~25 due to the very similar
chemistry of the two metal ions57
Figure 128 Chemical structure of TEDGA (NNNrsquoNrsquo-tetraethyl-diglycolamide)
69
137 TALSPEAK
TALSPEAK (Trivalent Actinide Lanthanide Separation by Phosphorus reagent
Extraction from Aqueous Complexation) is a further effective method of advanced
reprocessing by solvent extraction The process was initially developed at Oak Ridge
National Laboratory in Tennessee USA during the 1960s and it is still being refined
The process is designed to allow the separation of MA3+
(Am3+
and Cm3+
) from
Ln3+
and yttrium (Y3+
) from the other fission products and from each other to allow MA
to be reprocessed further by transmutation Although it is still under development the
TALSPEAK process has a number of benefits over other similar processes discussed in
Section 126 The process is resistant to irradiation and allows the separation to be
carried out without the need for high acid and salt concentrations It also has added
benefits in that it has already been performed on a pilot plant scale and uses cost
effective readily available reagents58
Additionally it can be carried out using relatively
inexpensive stainless steel equipment The process is very promising despite its
potential disadvantage that it involves removing the major constituent from the minor
constituent as studies have shown the separation is effective enough for this not to be a
problem
1371 The Process
In the process the MA preferentially form complexes with an aminopolyacetic
acid chelate over the lanthanides This allows the lanthanides to be better extracted into
an organic phase by a mono-acidic organophosphate or phosphonate (Figures 132 and
134) The most effective complexing agent to date is DTPA (diethylenetriamine
pentaacetic acid) (Figure 129) in the pH 25-35 range giving relatively high SFs (~50
for Nd3+
the most difficult to extract Ln3+
ion) and the most effective extracting agents
are HDEHP (di(2-ethylhexyl)phosphoric acid) (Figure 130) and HEH[ϕP] (2-
ethylhexyl phenyl phosphonic acid) (Figure 131) The extraction can be carried out
without the use of a complexing agent although the separation is not as discrete and is
significantly enhanced by the addition of an aminopolyacetic acid such as DTPA
Without DTPA Eu3+
Am3+
separation factors using 03 M HDEHP are around 40 59
whereas SF ~90 can be achieved when the complexing agent is used with the extractant
Other aminopolyacetic acids have been tested such as TTHA and EDTA but are not as
effective or tend to be less soluble60
70
Figure 129 Chemical structure of DTPA (2222-
((((carboxymethyl)azanediyl)bis(ethane-21-diyl))bis(azanetriyl))tetraacetic acid)
TALSPEAK Process
1 The fission product mixture (1 M) is dissolved in a carboxylic acid which acts
as a buffer and a solubiliser for the complexing agent lactic acid is often used
for this (Figure 132) Lactic acid (pKa 386)61
has been found to be the best
buffer for the process as it gives the best phase separation Nitrate may be
present from the original raffinate but this has been found not to decrease
separation
2 The solution is ldquoscrubbedrdquo with a mixture of Na5DTPA (01 M) in the same
carboxylic acid (1 M) at pH 36 ndash 38 The DTPA5-
complexes to the MA3+
and
Ln3+
but binds more strongly to the MA3+
This pH range is the optimum pH for
DTPA5-
activity as it complexes more strongly at higher pH values but
separation is better in more acidic conditions
Figure 130 Chemical structure of
HDEHP (bis(2-ethylhexyl) hydrogen
phosphate)
Figure 131 Chemical structure of
HEH[ϕP] ((2-(2-
ethylhexyl)phenyl)phosphonic acid)
71
3 The extractant is dilute HDEHP (05 M) in a hydrocarbon solution such as
DIPB (diisopropyl benzene found to give the best separation) which is then
contacted with the aqueous solution containing the LnMA[DTPA]2-
The Ln3+
ions are extracted into the organic phase by the phosphate causing dissociation
of the DTPA5-
and leaving the free DTPA5-
in the aqueous solution The
MA[DTPA]2-
complexes remain in the aqueous solution as DTPA5-
is bound
strongly enough to MA3+
to prevent the complexes from dissociating HEH[ϕP]
gives a better extraction although it makes stripping more difficult
4 After the Ln3+
ions are removed a second scrub is carried out at lower pH (15)
and a lower concentration of the complexing agent (005 M Na5DTPA) in lactic
acid (1 M) in order to extract the MA3+
The lower pH increases the extraction
rate as the DTPA5-
binds less strongly to the MA3+
allowing them to be
extracted more easily at the phase boundary where DTPA5-
dissociates The
phosphate (03 M HDEHP) is dissolved in n-dodecane (a more favourable
diluent) for the second extraction to remove the MA3+
into the organic phase
The use of n-dodecane was found to give better extraction but poorer
separation If Ln3+
and Y3+
are the only fission products present in the original
raffinate solution the MA3+
can be recovered by precipitation with oxalate from
the raffinate
5 Stripping is then carried out using 1 M HNO3 Nitric acid prevents the use of
corrosive chlorides This process can also be used to extract Cf3+
and Es3+
but it
has been found that more concentrated acid is needed for heavier actinides
Figure 132 Chemical structure of lactic acid pKa = 386
72
Figure 133 The solvent extraction process used in TALSPEAK Step 1 Binding of
DTPA to M3+
in the aqueous phase at pH 36 buffered by lactic acid Step 2 Selective
extraction of Ln3+
into the organic phase by HDEHP from the aqueous phase due to
preferential binding of DTPA to MA3+
Additional Notes on the Process
Initial extraction data for the process reported by Weaver et al in 1964 was
obtained by adding isotopic tracers to the aqueous solutions contacting them with the
organic phase performing the separation and measuring the activity by scintillation
counting with a γ-detector Extractions were all repeated 2-3 times to verify the results
and the contact time was 20 minutes which was much longer than necessary
Extractions performed using Na5DTPA and H5DTPA were found to give the same
results at the same pH values although pH adjustment was needed as Na5DTPA is more
alkaline than H5DTPA but H5DTPA is much less soluble The extraction of heavier
lanthanides was found to be slower but did not affect the separation Increasing the
concentration of HDEHP was found to give better separation but made the initial
equilibration time too long and increasing the concentration of DTPA decreased the
separation (Figure 134)
1 2
73
Figure 134 Effect of Na5DTPA concentration on distribution ratios of MA3+
and Ln3+
in TALSPEAK process using 1 M lactate buffer and 03 M HDEHP in DIPB extractant
60
The process is based on the preferential binding of the complexant to the
trivalent actinides over lanthanides Initially this was thought to be due to the fact that
An3+
binding is more covalent than Ln3+
binding However this was found not to be the
sole reason and it is understood that the organic ligand plays a role in the selectivity
The chemistry of the complexation of the ions with the ligand is not yet fully
understood and much work is needed to gain an insight into this complicated
chemistry62
74
Figure 135 TALSPEAK flow diagram
138 Reprocessing Summary
The necessity of reprocessing has arisen from increasing awareness and concern
for the environment in addition to the potential of maximising finite resources whilst
minimising proliferation There are a number of different processes currently under
development none of which have yet been implemented on a commercial scale except
for the PUREX process
The principles of all these process are often very similar although extraction
techniques and reagents vary somewhat There are a number of factors which must be
considered when developing a suitable solvent extraction process for SNF reprocessing
including the ease of stripping (back-extraction) the need for low volatility non-
flammable solvents the potential of the process to be continuous how to minimise
waste production the resistance of the process to radiolysis and degradation
practicality and efficiency of the process and the economic viability63
While some of the chemistry is understood such as the redox chemistry in the
PUREX process much of it is not thus limiting the potential to develop an efficient
process The sheer complexity of the waste content makes partitioning very difficult
and without a full understanding of the chemistry involved in the processes designing
75
an effective working process will be very challenging All of the processes currently
under development have advantages and disadvantages but all are ultimately heading
towards the same goal separation of the actinides from the lanthanides in order allow
the transmutation of the actinides into shorter lived radionuclides for the purpose of
reducing the long-term radiotoxicity of the waste and the volume of waste building up
in storage
TALSPEAK is one of the most promising techniques being researched due to its
numerous advantages particularly its relative resistance to irradiation and ability to be
carried out without the need for high reagent concentrations Additionally it gives
separation factors of ~50-100 comparable to the SANEX process which uses BTP one
of the most effective complexing agents However its main disadvantage is the poor
understanding of the separation mechanisms and complexation chemistry surrounding
it The main focus of research here will be the TALSPEAK process with a view to
improving the understanding of this chemistry and modifying the process to improve its
practicality
14 Project Objectives and Thesis Outline
Recent studies have shown that complexants with soft donor atoms compared to
oxygen (such as N or S) can be used to separate the MA from Ln6465
Initial research in
this area was carried out by our collaborators at Idaho National Lab using amino acids
as a potential buffer and soft donor which if proven to be successful would be able to
eliminate the need for the separate complexing agent and buffer simplifying the process
if amino acids were found to preferentially bind to the MA66
Another benefit to this
change would be the scope for carrying out the process at a lower pH due to the lower
pKa values of the carboxylic acid groups of the amino acids than on DTPA enabling
the system to be buffered to pH 1-2 rather than ~35 Lower pH values are preferred by
industry as higher acid concentrations are easier to control on a large scale pH control
is essential for the distribution ratios for the separation and there is a strong correlation
between the two Low pH values have been found to increase D however DTPA
protonates and precipitates out of the solution at the lowest values The use of amino
acids in place of the complexing agent would allow a lower pH to be used as they would
not fully protonate increasing the SF and making the process more efficient as binding
constants and ligand affinities would be higher To this end several avenues of research
have been explored
76
Chapter 2 presents initial studies carried out using amino acids in a TALSPEAK
system the interaction of amino acids with lanthanide and actinide ions and their
complexes in solution and the susceptibility of amino acid systems to radiolysis
Chapter 3 discusses work carried out at the INL on an L-alanine-buffered
system optimisation of the alanine system at pH 2 in order to maximise separation
potential and the consideration of other amino acid buffers over a range of pH values
Chapter 4 is focussed on an L-glutathione (GSH) buffered system GSH is a
tripeptide showing promise for an improved TALSPEAK system the next step after
research using single amino acids Data was initially obtained via solvent extraction in
order to investigate the separation ability of GSH and conditions were then optimised in
order to achieve maximum separation Interaction of the buffer with various
components in solution including lanthanide ions was probed using various techniques
including luminescence spectroscopy which was also used in determining the
susceptibility of the buffer to -radiolysis
Chapter 5 details the synthesis of amino acid appended DTPA ligands and their
complexation with lanthanide ions as well as their extraction and separation abilities
under different conditions along with radiolysis resistant investigations
77
1 S Cotton Lanthanide and Actinide Chemistry ed D Woolins R Crabtree D
Atwood and G Meyer John Wiley amp Sons Chichester UK 2006 1 1-7
2 C H Evans Episodes from the History of the Rare Earth Elements Kluwer
Academic Publishers Dordrecht Netherlands 1996
3 S Cotton Education in Chemistry 1999 36 4 96 WR Wilmarth RG Haire JP
Young DW Ramey JR Peterson J Less Common Metals 1988 141 275
4 LR Morss NM Edelstein and J Fuger The Chemistry of the Actindie and
Transactinide Elements Springer The Netherlands 4th edn 2010
5 AP Jones F Wall CT Williams Rare Earth Minerals Chemistry Origin and Ore
Deposits ed AP Jones F Wall and CT Williams Chapman and Hall London UK
1966 1 6-10
6 JJ Katz and GT Seaborg The Chemistry of The Actinide Elements Methuen amp Co
Ltd The Pitman Press Great Britain 1957
7 N Kaltsoyannis and P Scott The f elements ed R G Compton S G Davies J
Evans and L F Gladden Oxford University Press United States 1st edn 1999
8 Greenwood NN and Earnshaw A Chemistry of the Elements Butterworth-
Heinemann Great Britain 2nd edn1997
9 MB Jones AJ Gaunt Chem Rev 2012 DOI 101021cr300198m
10 L Natrajan F Burdet J Peacutecaut M Mazzanti J Am Chem Soc 2006 128 7152
11 C Fillaux D Guillaumont J-C Berthet R Copping D Shuh T Tyliszczak C
Den Auwer Phys Chem Chem Phys 2010 12 14253
12 HC Aspinall Chemistry of the f-block Elements ed D Phillips P OrsquoBrien and S
Roberts Gordon and Breach Science Publishers Singapore 2001 vol 5
13 F Gendron K Sharkas and J Autschbach J Phys Chem Lett 2015 6 2183-
2188
14 VBE Thomsen J Chem Educ 1995 72 (7) 616-618
15 Dr Louise Natrajan School of Chemistry The University of Manchester
16 JP Leonard CB Nolan F Stomeo and T Gunnlaugsson Topics in Current
Chemistry 2007 vol 281 pp1-43
17 Y Ma and Y Wang Co-ord Chem Rev 2010 254 972-990
18 LS Natrajan AN Swinburne MB Andrews S Randall and SL Heath Coordin
Chem Rev 2014 266-267 171-193
19 A Bettencourt-Dias Dalton Trans 2007 2229-2241
20 E Hashem AN Swinburne C Schulzke JD Kelly RC Evans JA Platts A
Kerridge LS Natrajan and RJ Baker RSC Adv 2013 3 4350
78
21 C Turro PK Fu and PM Bradley Met Ions Biol Syst 2003 40 323-353
22 Dr Louise Natrajan School of Chemistry The University of Manchester
23 I Billard and G Geipel Springer Ser Fluoresc 2008 5 465-492
24 A Beeby IM Clarkson RS Dickins S Faulkner D Parker L Royle AS de
Sousa JAG Williams and M Woods J Chem Soc Perkin Trans 2 1999 493-504
25 WD Horrocks and DR Sudnick J Am Chem Soc 1979 101 334
26 RM Supkowski and WD Horrocks Inorg Chim Acta 2002 340 44-48
27 Dummiesreg Nuclear Fission Basics httpwwwdummiescomhow-
tocontentnuclear-fission-basicshtml 2015
28 PE Hodgson Nuclear Power Energy and the Environment Imperial College Press
Great Britain 1999
29 P Dyck and MJ Crijns Rising Needs IAEA Bulletin 1998 40 1
30 World Nuclear Association The Nuclear Fuel Cycle httpwwwworld-
nuclearorginfoinf03html 2011
31 Nuclearmatterscouk Re-use of Plutonium as MOX Fuel
httpnuclearmatterscouk201202re-use-of-plutonium-as-mox-fuel 2012
32 World Nuclear Association Processing of Used Nuclear Fuel 2012
httpwwwworld-nuclearorginfoinf69htmla
33 United States Nuclear Regulatory Commission Neutron poison httpwwwnrcgov
2012
34 K L Nash Solvent Extraction and Ion Exchange 1993 114 729-768
35 M P Jensen L R Morss J V Beitz and D D Ensor Journal of Alloys and
Compounds 2000 303-304 137-141
36 Advanced Separation Techniques for Nuclear Fuel Reprocessing and Radioactive
Waste Treatment ed KL Nash and GL Lumetta Woodhead Publishing 1st edn
Cambridge UK 2011
37 CS Dileep Poonam Jagasia PS Dhami PV Achuthan AD Moorthy U
Jambunathan SK Munshi PK Dey and BS Tomar BARC Newsletter 2007 285
130-134
38 H Schmieder G Petrich and A Hollmann J Inorg Nucl Chem 1981 43 (12)
3373-3376
39 SC Tripathi and A Ramanujam Sep Sci and Technol 2003 38 2307
40 G Thiollet and C Musikas Solv Extr Ion Exch 1989 7 813
41 GL De Poorter and CK Rofer-De Poorter 720872 1976 US Pat 4080273 1978
79
42 EP Horwitz DC Kalina H Diamond GF Vandegrift and WW Schulz Solv
Extr Ion Exch 1985 31 75-109
43 A Banc P Bauduin and O Diat Chem Phys Lett 2010 494 (4-6) 301-305
44 J Muller L Bethon N Zorz and J-P Simonin Proceedings of the First ACSEPT
International Workshop 2010
45 C Brassier-Lecarme P Baron JL Chevalier and C Madic Hydrometallurgy
1997 47 57-67
46 O Courson R Malmbeck G Pagliosa K Romer B Satmark J-P Glatz P Baron
and C Madic Radiochim Acta 2000 88 865-871
47 M Sypula A Wilden C Schreinemachers and G Modolo Proceedings of the First
ACSEPT International Workshop 2010
48 C Hill L Berthon P Bros J-P Dancausse and D Guillaneux Nuclear Energy
Agency 7th Information Exchange Meeting Session II 2002
49 S Bourg C Hill C Caravaca C Rhodes C Ekberg R Taylor A Geist G
Modolo L Cassayre G de Angelis A Espartero S Bouvet N Ouvrier Nucl Eng
Des 2011 241 3427 G Modolo A Wilden A Geist D Magnusson R Malmbeck
Radiochim Acta 2012 100 715
50 A Geist U Muumlllich D Magnusson P Kaden G Modolo A Wilden T Zevaco
Solv Extr Ion Exchange 2012 30 433
51 A Wilden C Schreinemachers M Sypula G Modolo Solv Extr Ion Exch 2011
29 190
52 FW Lewis LM Harwood MJ Hudson MGB Drew V Hubscher-Bruder V
Videva F Arnaud-Neu K Stamberg and S Vyas Inorg Chem 2013 52 4993-5005
53 E Aneheim C Ekberg A Fermvik M R St J Foreman T Retegan and G
Skarnemark Solv Extr Ion Exch 2010 284 437-458
54 M Wei X Liu and J Chen J Radioanal Nucl Chem 2012 291 717-723
55 G Modolo P Kluxen A Geist Radiochim Acta 2010 98 193
56 C Rostaing C Poinssot D Warin P Baron and B Lorrain Procedia Chem 2012
7 349-357
57 S Chapron C Marie G Arrachart M Miguirditchian and S Pellet-Rostaing Solv
Extraction and Ion Exchange 2015 33 236-248
58 M Milsson and K L Nash Solvent Extraction and Ion Exchange 2009 273 354-
377
59 G Lumetta AV Gelis and GF Vandegrift Solv Extraction and Ion Exchange
2010 28 3 287-312
80
60 B Weaver and T A Kappelmann Talspeak A new method of separating americium
and curium from the lanthanides by extraction from an aqueous solution of an
aminopolyacetic acid complex with a monoacidic organophosphate or phosphonate
Oak Ridge National Laboratory 1964 1-60
61 K W Raymond General Organic and Biological Chemistry An Integrated
Approach John Wiley amp Sons USA 3rd edn 2010 7 253
62 L Karmazin M Mazzanti C Gateau C Hill and J Peacutecaut Chem Commun 2002
2892-2893
63 KL Nash Actinide Solution Chemistry Proceedings of the Eighth Actinide
Conference Actinides 2005
64 M P Jensen and A H Bond J Am Chem Soc 2002 124 9870-9877
65 L R Martin B J Mincher and N C Schmitt J Radioanal Nucl Chem 2009
282 523-526
66 S Oumlzҫubukҫu K Mandal S Wegner M P Jensen and C He Inorg Chem 2011
50 7937-7939
81
2 COMPLEXATION STUDIES OF Ln amp An WITH DTPA AND BUFFERS
UNDER TALSPEAK CONDITIONS
DTPA (diethylenetriaminepentaacetic acid) is an amino polycarboxylic acid
used to act as a holdback reagent in the TALSPEAK process (Trivalent Actinide
Lanthanide Separation by Phosphorus reagent Extraction from Aqueous Complexation)
an advanced reprocessing technique currently being developed in the USA (Section
137) DTPA is the chelating agent used as it has been shown to complex more strongly
to trivalent minor actinide ions (MA3+
) than lanthanide ions (Ln3+
) in aqueous solution
allowing selective extraction of lanthanides into an organic phase by organophosphate
HDEHP (di-(2ethylhexyl)phosphoric acid) to separate the two components
21 Introduction to An-DTPA and Ln-DTPA Complexes
It is widely known that DTPA ligands bind very well to metal ions in aqueous
media It is commonly used to extract heavy metals from soils for environmental
reasons1 and to treat heavy metal poisoning through its ability to chelate to heavy
metals making them more water soluble and able to be removed from the body
naturally by excretion2 Lanthanide DTPA complexes have been well established
although there is actually very little structural data available on them Most literature
references to lanthanide DTPA complexes discuss their use as MRI contrast agents the
most common choice being Gd-DTPA3 Other reported applications of DTPA-based
lanthanide complexes are for use as biological luminescent probes particularly with Eu4
and Tb5 Due to the highly hygroscopic nature of Ln-DTPA complexes solid state
structural analysis has only been reported in two instances as molecular structures
determined by X-ray absorption spectroscopy (XAS) one for Gd(III)-DTPA (Figure
21) and one for Eu(II)-DTPA6 Most solution state structural analysis for lanthanide
DTPA complexes has been carried out recently in order to better understand MALn
separation and TALSPEAK chemistry The only literature available on An-DTPA
complexes is related to separations chemistry except for actinium-DTPA used in
radiotherapy7
82
Figure 21 XAS molecular structure of Gd(III)-DTPA8
211 Stability of Ln-DTPA and An-DTPA Complexes
Reports on the formation of trivalent actinide complexes with DTPA detail that
the stability of AnDTPA2-
complexes (the dominant DTPA species present at pH 36
which is the pH currently used in the TALSPEAK process) is greater than the stability
of LnDTPA2-
complexes allowing the selective extraction on Ln3+
to take place For
LnDTPA2-
complexes stability constants range from log β = 1948 for La increasing
across the series up to log β = 2283 for Dy (with a slight dip at Gd) decreasing slightly
for the heavier Ln3+
complexes
Stability constants in the literature for AnDTPA2-
have been determined by a
range of techniques including TRLFS CE-ICP-MS spectrophotometry and solvent
extraction and range from log β = 2257 to 2403 for AmDTPA2-
and from log β = 2238
- 2348 for CmDTPA2-
at an ionic strength (I) of 01 M However there is some dispute
on whether AnHDTPA- complexes are also present in solution and this needs to be
accounted for when calculating stability constants as some of these values have been
determined with and some without consideration of AnHDTPA-9101112
Studies conducted by Martin et al determined stability constants of log β =
2219 - 2085 for CmDTPA2-
at I = 1 M over a temperature range of 10-70 degC
compared to log β = 2131 - 2033 for EuDTPA2-
over the same temperature range The
complex EuHDTPA- was found to have a stability constant of log β = 227 - 210 under
TALSPEAK conditions Europium(III)is used as a standard comparison to Am3+
Cm3+
due to the close similarity in chemistry between the elements as a result of their
electronic structures This data clearly shows that the Cm3+
has a higher binding
83
strength to DTPA5-
than Eu3+
The greater exothermic enthalpy of complexation of
CmDTPA2-
than EuDTPA2-
(-407 kJ mol-1
vs -336 kJ mol-1
) determined by
microcalorimetry indicated stronger covalent bonding of Cm3+
to DTPA5-
than Eu3+
Luminescence spectroscopy carried out in support of these studies found that
CmDTPA2-
has a shorter luminescence lifetime than EuDTPA2-
(268 micros in H2O 815 micros
in D2O for Cm3+
cf 630 micros in H2O 6200 micros in D2O for Eu3+
) This along with the
biexponential decay pattern indicating the presence of two species for Cm3+
was
attributed to faster exchange between Eu3+
and the ligandsolvent than for Cm3+
suggesting that the exchange for Eu3+
is not distinguishable on the luminescence
timescale and therefore less susceptible to the associated quenching effects This may be
due to the more ionic bonding of Eu3+
to the ligand
The pKa for the protonation of MDTPA2-
to MHDTPA- (M = metal ion) is 227
for Eu and 025 for Cm indicating that CmHDTPA- is only likely to be present in
solutions of very low pH (pH ltlt 1) It was hypothesised that the presence of
LnHDTPA- facilitates the exchange between ligand and solvent explaining the
observed difference in luminescence lifetime data consistent with stronger
complexation of MA3+
to DTPA and slower kinetics of MA3+
extraction as the
MDTPA2-
is less likely to dissociate13
212 Co-ordination Chemistry of Ln-DTPA and An-DTPA Complexes
It is known that Ln3+
ions co-ordinate to DTPA5-
in aqueous solution at pH 36
through the 5 deprotonated carboxylate groups (COO-) on the molecule and through the
three nitrogen atoms on the DTPA backbone forming an octadentate complex with one
water molecule in its inner hydration sphere giving the Eu3+
ion a co-ordination number
of 9 in the shape of a distorted capped square antiprism This is also the case for the
LnHDTPA- species
Figure 22 Chemical structure of [Eu(DTPA)]2-
84
The co-ordination mode of DTPA5-
to MA3+
is the same as for Ln3+
octadentate
(Figure 21) with a co-ordination number of 9 due to 1 water molecule bound to the
metal ion Hydration numbers of 2 have been reported for Cm-DTPA complexes but
have been found not to be stable14
DFT optimisation of CmDTPA2-
and EuDTPA2-
structures conducted by Martin
et al found that the M-O bond lengths were similar for both metal ions but that the M-
N bond lengths were shorter for Cm3+
than Eu3+
(by 004-008 Aring) Considering that
Cm3+
has a larger ionic radius than Eu3+
this suggests that Cm3+
binds more strongly to
the intermediate N donors on the DTPA molecule Further optimisations showed that
significant changes in bond lengths upon protonation of MDTPA2-
to MHDTPA-
indicated that M-N interactions are weakened to a greater extent for Cm3+
than Eu3+
so
that MHDTPA- is less likely to form for Cm
3+ in solution than Eu
3+ This data is
consistent with the pKa data for the complexes (Section 211)
22 Ln-DTPA Complexation Studies
As a first experiment (in order to verify the experimental procedures for
subsequent studies) the complex [Eu(DTPA)H2O]2-
was formed from europium nitrate
(1 mM) and Na5DTPA (005 M) in H2O and D2O at pH 36 and characterised by 1H
NMR spectroscopy (for the complex in D2O) and luminescence spectroscopy (D2O and
H2O)
221 1H NMR Studies of Ln-DTPA
1H NMR spectra are difficult to fully assign for Ln
3+ DTPA complexes due to
both the paramagnetic nature of the ions and the (fast) chemical exchange of the CH2
carboxylate and ethylene diamine backbone protons which results in significant
spectral broadening However complex formation can be verified at lower temperatures
(here 5 degC) where this conformational exchange is slowed down so the paramagnetic
broadening and shifting of the CH2 DTPA proton resonances can be observed in the 1H
NMR spectrum (Figure 23) by comparison with uncomplexed DTPA (Figures 24a-c)
85
EUDTPAESP
15 10 5 0 -5 -10 -15 -20
Chemical Shift (ppm)
0
0005
0010
0015
0020
0025
0030
0035
0040
0045
0050
0055
Norm
alized Inte
nsity
152
8
99
196
6
88
4
53
7
42
536
033
528
7
15
8
-01
1
-16
1
-40
6
-57
3-6
33
-105
3
-126
8
-148
3
-170
2
-184
7
Figure 23 1H NMR spectrum of [Eu(DTPA)]
2- in D2O at 278 K at pD = 36
DTPA pH71resp
55 50 45 40 35 30 25 20
Chemical Shift (ppm)
0
0005
0010
0015
0020
0025
0030
0035
0040
0045
0050
0055
0060
Norm
alized Inte
nsity
199100215418
DEUTERIUM OXIDE
Water
38
1
34
033
833
632
8
30
630
530
3
a
86
DTPA pH361resp
55 50 45 40 35 30 25 20
Chemical Shift (ppm)
0
0005
0010
0015
0020
0025
0030
0035
0040
0045
0050
0055
0060
Norm
alized Inte
nsity
204206100421
Water
47
647
5
38
5
35
634
634
434
3
31
531
431
2
DTPA pH21resp
55 50 45 40 35 30 25 20
Chemical Shift (ppm)
0
0005
0010
0015
0020
0025
0030
0035
0040
0045
0050
0055
0060
Norm
alized Inte
nsity
202199100406
Water
47
5 46
9
39
0
35
4
34
033
933
7
31
130
930
8
Figure 24 1H NMR spectra of DTPA in D2O at 278 K at varying pD a) pD 7
[DTPA]5-
b) pD 36 [H3DTPA]2-
c) pD 2 [H5DTPA]
222 Luminescence Studies of Ln-DTPA
Emission spectra were recorded for Eu
3+ (1 mM) with and without DTPA
5- (005
M) present in aqueous solution (Figure 25) following 397 nm excitation directly into
the 5L6 f-f absorption band
15 The formation of [Eu(DTPA)]
2- can be observed by the
splitting of the peaks in the emission spectrum of the complex compared to the free
Eu3+
(aq) representing the 5D0 rarr
7FJ transitions where J = 0 1 2 3 and 4 This is due to
crystal field splitting caused by the ligand and is indicative of strong binding of the
ligand to Eu3+
ion at pH 361617
The emission intensity is also significantly enhanced
upon the complexation of Eu3+
to DTPA5-
as the chelating ligand forms an octadentate
b
c
87
complex significantly lowering the degree of quenching of the emission by surrounding
solvent molecules
Figure 25 Emission spectrum of Eu3+
(aq) and [Eu(DTPA)]2-
in D2O at pD 36
Additionally the luminescence lifetimes of the free Eu3+
(aq) and the
[Eu(DTPA)]2-
complex were measured in D2O and H2O This allows calculation of q
which represents the number of bound solvent molecules in the inner hydration sphere
of the metal ion The original Horrocks equation18
(Equation 19) and modified
Horrocks equation1920
for q lt 2 (Equation 110) are shown below
Equation 21
Equation 22
The Horrocks equation uses the emission lifetimes (τ) to determine q A is the
proportionality constant taking into account the inner hydration sphere and B is a
correction factor taking into account the outer hydration sphere A and B values are
experimentally determined constants and are available for Sm3+
Eu3+
Tb3+
Nd3+
Yb3+
Am3+
and Cm3+
The q values can be effectively determined from solutions of water and
methanol For the original Horrocksrsquo equation A = 105 for Eu3+
and A = 42 for Tb3+
and for the modified Horrocksrsquo equation (when q lt 2 ) A = 12 ms and B = (025 ndash
0
2
4
6
8
10
12
14
16
18
550 570 590 610 630 650 670 690 710
Emis
sio
n In
ten
sity
(au
) x
10
00
0
Wavelength (nm)
[Eu(DTPA)]2-
Eu3+
5D0 rarr 7F0
5D0 rarr 7F1
5D0 rarr 7F2
5D0 rarr 7F3
5D0 rarr 7F4
88
0075x) ms-1
(where x = the number of exchangeable N-H oscillators) for Eu3+
and A =
5 ms and B = 006 ms-1
for Tb3+
The q value was found to be 9 for Eu3+
(aq) suggesting that the Eu3+
ion is
surrounded by 9 solvent molecules forming [Eu(H2O)9]3+
in aqueous solution as
expected For [Eu(DTPA)]2-
formed at pH 36 q was found to be 14 plusmn 02 showing that
only 1 water molecule is bound to the metal ion This compares well to the literature
values reported at pH 7 where the lifetimes are similar and q = 1121
23 An-DTPA Complexation Studies
The aminopolycarboxylate DTPA5-
chelates even more strongly to An3+
ions
than Ln3+
ions Preliminary 1H NMR and luminescence analyses were carried out by
Louise Natrajan at KIT-INE in Karlsruhe Germany on Am3+
and Cm3+
complexation
with DTPA as part of the FP7 EURACT-NMR scheme (Scheme 21)
Scheme 21 Complexation of DTPA to Am3+
and Cm3+
231 1H NMR Studies of An-DTPA
The complex [Am(DTPA)xH2O]2-
was formed and analysed by 1H NMR in a
41 ratio of MeODD2O with an additional drop of NaOD to ensure complex formation
from a dried acidic americium nitrate stock salt and Na5DTPA The spectra were taken
over a temperature range of 210-365 K at ~ pD 3 (Figure 26) Note here that the exact
pD of the solution could not be accurately measured due to the high specific activity of
the 241
Am isotope used From the spectrum it can be seen that at pD 3 there is a DTPA
complex formed and that at higher temperatures there are some dynamic exchange
processes occurring as the resonances become broader and the spectrum becomes
simpler This is most likely due to conformational changes in the DTPA ligand
(movement of the carboxylates and the ethylene bridge protons analogous to DOTA
and DO3A derivatives)22
The Am3+
ion is essentially diamagnetic as it has a 7F0 ground state and the
magnetic moment is calculated as 0 based on the Russell Saunders coupling scheme
89
The same is true for the isoelectronic lanthanide analogue Eu3+
but in this ion
significant paramagnetism is induced at room temperature due to low-lying energy
levels that are thermally populated according to the Boltzmann distribution Thermal
mixing of J states induces a paramagnetic shift but in the case of Am3+
the second J
level lies much higher in energy (~ 4000 cm-1
higher) so may only be populated and
induce a paramagnetic shifting of proton resonances at higher temperatures2324
Indeed
a slight shift of the proton resonances with temperature is observed for
[Am(DTPA)xH2O]2-
potentially indicating a small contribution of the Am3+
7F1 excited
state to the chemical shift of the proton resonances
Figure 26 1H NMR spectrum for [Am(DTPA)xH2O]
2- in 41 vv MeODD2O with
NaOD over a temperature range at pH 3
232 Luminescence Studies of An-DTPA
Emission spectra were recorded for solutions of
243Cm
3+ (015 microM Cm
3+ in 32
mM HClO4 diluted to 1 mL with H2O) with and without Na5DTPA (02 M) present in
aqueous solution following direct excitation at 3966 nm into the f-f absorption band of
Cm3+
(Figure 27) The formation of [Cm(DTPA)]2-
can be observed by the immediate
formation of a new red shifted emission band at 607 nm attributed to the 6D72
8S72
transition in the complex compared to that in free Cm
3+(aq)
at 593 nm The f-f transitions
in Cm3+
are much more sensitive to the coordination environment than Ln3+
due to more
210 K
265 K
300 K
365 K
90
spin orbit coupling and the fact the 5f orbitals are more spatially diffuse than the 4f
orbitals resulting in a much greater difference in emission spectra upon complexation
for actinides than lanthanides
Figure 27 Emission spectrum of Cm3+
and [Cm(DTPA)]2-
in perchloric acid at pH 3
by direct excitation with a NdYAG pumped dye laser at 3966 nm
Similarly to Eu3+
the inner hydration sphere of the free Cm3+
ion is known to
contain 9 water molecules25
In 1998 Kimura and Choppin developed a modified
version of the Horrocks equation in order to allow q to be calculated from aqueousnon-
aqueous solvent mixtures (Equation 23)26
Equation 23
The lifetime of the [Cm(DTPA)]2-
complex in H2O is 510 micros and is significantly
longer than that of the aqua ion which is determined as 68 micros The radiative lifetime of
the complex can be directly inserted into this equation and indicates that there are 16
water molecules (between 1 and 2) co-ordinated to the metal ion again showing the
formation of an octadentate complex with DTPA ligand analogously to Eu3+
24 Introduction to Buffer Interaction with Ln3+
and Ln-DTPA Complexes
241 Interaction of Lactate with Ln3+
and Ln-DTPA Complexes
A lactic acidlactate buffer is used in the TALSPEAK process to buffer the
system to pH 36 Lactate (Lac) is known to co-ordinate to M3+
ions27
to form
40
45
50
55
60
65
70
75
80
570 590 610 630
Emis
sio
n In
ten
sity
(au
) Tho
usa
nd
s
Wavelength (nm)
Cm3+(aq)
[Cm(DTPA)]2-
91
M3+
(CH3CH(OH)COO-)3 Equations 24a-c show the formation of Eu
3+-lactate
complexes
Equation 24a-c
(a)
(b)
(c)
Stability constants for each of the species formed in Equations 24a-c were
determined by Martin et al over a temperature range of 0-70 degC Log β values were
found to be 290-281 for Eu(Lac)2+
log β = 490-449 for Eu(Lac)2+ and log β = 624-
633 for Eu(Lac)3 Luminescence spectroscopy of Eu-lactate formation showed that as
the concentration of lactate was increased from 0 mM to 73 mM the emission intensity
of the J=2 peak (5D0 rarr
7F2 transition) at 615-620 nm increased but the J=1 peak (
5D0 rarr
7F1 transition) at 590-600 nm was not significantly affected changing the J=1J=2 peak
ratio suggesting that the co-ordination mode of the lactate to the Eu3+
ion changes as a
function of lactate concentration as the J=1 peak is a magnetic dipole transition which is
insensitive to the co-ordination of the ion (Figure 28)28
Figure 28 Emission spectrum of Eu-lactate as a function of lactate concentration28
The luminescence lifetimes of Eu3+
in water also increased as the lactate
concentration was increased indicating that the number of water molecules directly co-
ordinated to the metal ion decreases from ~9 to ~5 due to complexation with lactate
Luminescence and thermodynamic data suggest that lactate co-ordinates in a bidentate
92
mode to Ln3+
ions through the deprotonated carboxylate group and also through the α-
hydroxyl group (Figure 29) making Ln-lactate complexes more stable than simple
monocarboxylates with monodentate co-ordination28
Figure 29 Co-ordination mode of lactate to Eu3+
28
The interaction of lactate ions with metal-DTPA complexes is less well
understood It is considered that there is an exchange between the Ln3+
ion and the
lactate and DTPA ligands The concentration of lactate has been shown by Nash et al to
affect the complexation and dissociation of [Ln(DTPA)]2-
however it is not understood
whether this is due to the changing pH with lactate concentration since extraction in the
TALSPEAK process is heavily dependent on pH29
TALSPEAK extractions using
lactate without DTPA show poor separation of Ln3+
over Am3+
DTPA is required to
achieve separation of MA3+
from Ln3+
as lactic acid acts only as a buffer and not a
holdback reagent
Research has shown previously that binary complexes are dominant in the
TALSPEAK process chiefly in the form of MDTPA2-
and M(Lac)n3-n
Studies carried
out using spectrophotometry luminescence spectroscopy and thermometric
experiments have shown that ternary M3+
-DTPA-lactate complexes with lactate co-
ordinated directly to the metal centre are only present in very small quantities and so
will have negligible effect on metal separation However it is possible that outer sphere
ternary M3+
-DTPA-lactate complexes may form where the lactate interacts with the
DTPA molecule although it is expected these would also be present only in minor
quantities and so would also have negligible effect on metal separation30
242 Interaction of Amino Acids with Ln3+
and Ln-DTPA Complexes
The potential of using amino acids as a combined buffer and soft donor was
considered as it was thought that the increased number of softer donors on amino acids
93
compared to lactate may remove the need for the separate buffer and DTPA holdback
reagent if amino acids were found to preferentially bind to MA3+
in solution There have
been few studies on the interaction of amino acids with lanthanide ions and none with
actinide ions or with DTPA Stability constants for amino acids with lanthanide ions31
can be found in the literature and like stability of lactate complexes with Ln3+
ions32
generally tend to increase across the lanthanide series from La-Lu as the Lewis acidity
of the metal ions increases The values are close to the stability constants for Ln-lactate
complexes averaging at around 5-6 depending on the metal ion and amino acid Log β
values for La-Sm with glycine range from 532-584 and with L-alanine log β = 582-
668
25 Studies on Buffer Interaction with M3+
and [M(DTPA)]2-
Initial studies in this area considered the interaction of various amino acids and
lactate with lanthanide ions in TALSPEAK systems The amino acids glycine L-alanine
and L-serine (Figure 210) were chosen to begin this research due to their similarity in
molecular structure to lactate and good solubility in water
Figure 210 Chemical structures of L-alanine (top) glycine (bottom left) and L-serine
(bottom right)
251 1H NMR Studies on Buffer Interactions
L-alanine (1 M) was added to Eu(NO3)3 (10 mM) in D2O and analysed by
1H
NMR spectroscopy (Figure 211) The spectrum shows that L-alanine complexes
weakly with the metal ion as there is minimal paramagnetic line broadening and only
slight shifting of the proton resonances from that of L-alanine itself (Figure 212)
94
New Eu Ala0011resp
55 50 45 40 35 30 25 20 15 10 05 0
Chemical Shift (ppm)
0
005
010
015
Norm
alized Inte
nsity
310100
CH3
CH
Water
47
147
1
35
5
12
712
6
Figure 211 1H NMR spectrum of Eu(NO3)3xH2O (10 mM) with L-alanine in D2O at
278 K
Ala1resp
55 50 45 40 35 30 25 20 15 10 05 0
Chemical Shift (ppm)
0
01
02
03
04
05
06
07
08
09
10
Norm
alized Inte
nsity
336100
CH3
CH
Water
36
536
336
2
13
3
Figure 212 1H NMR spectrum of L-alanine in D2O at 278 K
95
The interaction of L-alanine (1 M) with [Eu(DTPA)]2-
(10 mM) in D2O was also
investigated by 1H NMR spectroscopy (Figure 213) This spectrum shows that the L-
alanine does not bind to the europium DTPA complex on the experimental timescale as
there is no paramagnetic broadening or shifting of the amino acid peaks and the ligand
is present as uncomplexed ligand
EuDTPA Ala1esp
15 10 5 0 -5 -10 -15 -20
Chemical Shift (ppm)
0005
0010
0015
0020
0025
0030
0035
Norm
alized Inte
nsity
150
5 96
892
185
2
75
4
50
4
39
533
231
625
8
14
6
05
0
-13
1
-44
2
-63
3-6
86
-108
2
-127
6
-143
1
-169
0
-183
9
Figure 213 1H NMR spectrum of [Eu(DTPA)]
2- (10 mM) with L-alanine (1 M) in D2O
at 278 K
252 Luminescence Studies on Buffer Interactions
2521 Sensitisation Tests
Luminescence studies on a [Tb(DTPA)]2-
(1 mM) complex in the presence of
the amino acid L-phenylalanine (05 M) (Figure 215) at pH 3 were initially carried out
in order to determine if sensitised emission occurs whereby energy would be
transferred from the phenyl chromophore of the amino acid to the metal ion This could
potentially occur if the amino acid was in close proximity (ie bound) to the metal ion
and would give some indication into the interaction between the amino acid and the
metal ion However sensitised emission was found not to occur as when the complex
was excited in the region of the phenyl chromophore (250 nm) no emission occurred
When excited directly into the f-f region of the Tb3+
complex at 379 nm there was a
slight decrease in emission intensity upon the addition of L-phenylalanine however the
decrease is not significant The excitation spectrum was recorded of the emission at 545
96
nm and showed only the presence of f-f transitions and no contribution from the organic
region (Figure 214)
Figure 214 Emission spectra of [Tb(DTPA)]2-
in D2O at pD 3 with and without the
presence of L-phenylalanine (05 M) excited at 250 nm and 379 nm Excitation
spectrum of [Tb(DTPA)]2-
in D2O at pD 3 with L-phenylalanine (05 M) at 545 nm
Figure 215 Chemical structure of L-phenylalanine
2522 Aqueous Phase Lanthanide Studies without Na5DTPA
Emission spectra of Eu3+
(1 mM Eu(NO3)3) were taken in D2O and H2O with the
presence of different amino acidslactate (1 M) in order to determine whether the amino
acids bind to the metal ions at pH 36 (TALSPEAK pH) The emission spectrum of the
free metal ion in solution was also measured for comparison (Figure 216)
0
100
200
300
400
500
600
700
0
5
10
15
20
25
30
220 320 420 520 620
Ab
sorp
tio
n In
ten
sity
(au
) Th
ou
san
ds
Emis
sio
n In
ten
sity
(au
) Th
ou
san
ds
Wavelength (nm)
TbDTPA exc 379 nm
TbDTPA + Phe exc 250 nm
TbDTPA + Phe exc 379 nm
Excitation of TbDTPA + Phe at 545 nm
97
Figure 216 Emission spectra of Eu(NO3)3 in D2O at pD 36 with and without the
presence of amino acidslactate (1 M) excited at 395 nm at 298 K
The emission intensity increases upon the addition of amino acidslactate to Eu3+
in D2O This shows that the amino acids are interacting with the metal ion however the
emission spectra resemble that of the free aqua ion suggesting that the amino acids and
lactate are not binding to the metal ion The presence of the amino acids at such a high
concentration will reduce quenching effects from the surrounding solvent molecules
which may be one explanation for the increased emission intensity At pH 36 the
amino acids will be in their zwitterionic form (H3N+-CHR-COO
-) and so are likely to
co-ordinate with the free metal ion in the same manner as lactate however this co-
ordination appears to be very weak and they are probably in fast exchange with
surrounding water molecules
The q values of the Eu3+
ions were calculated from the luminescence lifetimes in
H2O and D2O using the original Horrocks equation (Equation 19) The results can be
seen in Table 21
0
2
4
6
8
10
12
14
550 570 590 610 630 650 670 690 710
Emis
sio
n In
ten
sity
(au
) x
10
00
0
Wavelength (nm)
Eu3+
Eu-Lactate
Eu-Gly
Eu-Ala
Eu-Ser
98
Table 21 Luminescence lifetimes and q values for Eu3+
with amino acidslactate
Estimated error on lifetimes = plusmn 10 and on q plusmn 02
The number of bound solvent molecules in the inner hydration sphere of Eu3+
decreases with the addition of amino acidslactate from 9 to approximately 6 This is
consistent with possible fast exchange of water molecules with co-ordinated amino
acids and shows that an average of 3 amino acidslactate ions are co-ordinating to the
metal
2523 Aqueous Phase Lanthanide Studies with Na5DTPA
Emission spectra of Eu(NO3)3 (1 mM) with Na5DTPA (01 M) were recorded in
D2O and H2O with the presence of different amino acidslactate (1 M) at pH 36 in order
to determine whether the amino acids bind to the complexed metal (Figure 217)
Figure 217 Emission spectra of Eu-DTPA in D2O at pD 36 with and without the
presence of amino acidslactate (1 M) excited at 395 nm
0
5
10
15
20
25
550 600 650 700
Emis
sio
n In
ten
sity
(au
) x
10
00
0
Wavelength (nm)
EuDTPA
EuDTPA-Lactate
EuDTPA-Gly
EuDTPA-Ala
EuDTPA-Ser
τ in H2O (ms) τ in D2O (ms) q
Eu3+
011 165 89
Eu Lactate 016 194 60
Eu Gly 016 183 60
Eu Ala 016 187 60
Eu Ser 019 147 48
99
The emission intensity does not change upon the addition of amino acidslactate
to [Eu(DTPA)]2-
in D2O These spectra also do not change shape and there is no
observable shift resembling that of the [Eu(DTPA)]2-
species suggesting that the amino
acids and lactate are not binding to the metal complex
The q values of the Eu3+
ions were calculated from the luminescence lifetimes in
H2O and D2O using the original Horrocks equation (Equation 19) The results can be
seen in Table 22
Table 22 Luminescence lifetimes and q values for [Eu(DTPA)]2-
with amino
acidslactate Estimated error on lifetimes = plusmn 10 and on q plusmn 02
From these kinetic data it is clear that q does not change for [Eu(DTPA)]2-
upon
the addition of amino acidslactate showing that there is no significant interaction with
the Eu3+
ion and they do not bind to the metal ion of the complex This may be due to
steric factors as the DTPA5-
is octadentate and fully complexed to the metal ion leaving
room for only 1-2 solvent molecules to bind to the ion and making it difficult for any
larger species to exchange
2524 Aqueous Phase Actinide Studies with Na5DTPA
In order to determine whether amino acids interacted any more with actinides
than lanthanides the emission spectrum of [Cm(DTPA)]2-
(1 mM) was taken with the
addition of L-alanine (25 mM) at KIT-INE Karlsruhe (Figure 218)
τ in H2O τ in D2O q
Eu DTPA 063 230 23
Eu DTPA Lactate 063 216 22
Eu DTPA Gly 065 203 20
Eu DTPA Ala 065 209 21
Eu DTPA Ser 065 208 21
100
Figure 218 Emission spectrum of [Cm(DTPA)]2-
in H2O with and without L-alanine
(25 mM) at pH 3 by direct excitation at 396 nm The spectra are reported uncorrected
for differences in the incident laser power for clarity
Upon addition of L-alanine there is no change in the emission spectrum - no red
shift or change in emission intensity (quantum yield) compared to complexation of
Cm3+
to DTPA5-
(Figure 26) Moreover the luminescence lifetime is the same as
[Cm(DTPA)]2-
and there is no change in the calculated value of q indicating either no
interaction of the L-alanine with the complex or a very weak interaction such as fast
exchange of the buffer and bound solvent molecules showing that the L-alanine does
not strongly interact with Cm3+
253 Radiolysis Studies on Amino Acid Buffered Systems
2531 Previous Studies at the INL
The TALSPEAK process is known to be relatively resistant to radiation effects
both alpha and gamma radiation when compared to the PUREX and SANEX
processes33
The use of lactic acid buffer has been shown to reduce the degradation of
DTPA by radiolysis34
although the chemistry of the lactic acidlactate ion interaction
with the system is still not clear α radiolysis experiments were carried out at INL by the
Martin group initially on lactic acid and then on an L-alanine system in order to
determine the temperature-dependent rate constants of the reaction of the hydroxyl
radical (middotOH) with the buffers at pH 3 (Figure 219) It is thought that at this pH
oxidising reactions are dominant since dissolved O2 in the solution would remove most
40
45
50
55
60
65
70
75
80
570 580 590 600 610 620 630 640
Emis
sio
n In
ten
sity
(au
) Tho
usa
nd
s
Wavelength (nm)
[Cm(DTPA)]2-
[Cm(DTPA)]2- + Ala
101
of the hydrated electrons (e-(aq)) and middotH radicals caused by radiolysis leaving middotOH
radicals present in solution The rate constants were measured using Linear Accelerator
(LINAC) electron pulse radiolysis
Measurements showed that the reaction rate of the middotOH radical with L-alanine is
slower than with lactic acid suggesting that a modified version of the TALSPEAK
process using amino acids would be more resistant to radiolysis
Figure 219 Graph illustrating the rates of reaction of the middotOH radical with L-
alanine compared to lactic acid and the lactate ion 35
Further studies at the INL were carried out on the L-alanine to measure the
effect of γ-radiation on the separation of Eu3+
from Am3+
These studies were carried
out by varying the γ radiation dose (5 ndash 50 kGy) the pH (2 ndash 3) and the L-alanine
concentration (05 ndash 15 M) The extraction of Ln3+
ions was found not to be affected by
increasing the dose to both phases and the extraction of Am3+
was found to increase
only slightly as the dose was increased (Figure 220) The results show that the effect of
γ-radiation on the separation factors is negligible with increasing dose (Table 23)
32 33 34 3517
18
19
20
21
Alanine (pH 30)
Lactate ion (pH 60)
Lactic acid (pH 10)
ToC k M
-1 s
-1Error
1046 59E7 49E6
306 849E7 421E6
305 832E7 419E6
402 102E8 816E6
Arrhenius OH amp lactate at pH 30
Int ln(A) = 2353 plusmn 115
Ea = 1333 plusmn 289 kJ mol-1
R2 = 0990
ln (
kM
-1 s
-1)
103Temp (K)
102
Figure 220 Distribution ratios for Ln3+
and Am3+
in the presence of L-alanine
at 05 M pH 2 at different doses of γ-radiation36
Table 23 Separation factors for Eu3+
Am3+
in the presence of L-alanine at 05 M under
TALSPEAK conditions when subjected to different doses of γ-radiationError Bookmark
not defined
Separation Factor EuAm
5 kGy 10 kGy 50 kGy 100 kGy
pH 2 5620 5519 5132 5103
pH 3 1595 1653 1589 1252
2532 Irradiation Studies using Amino Acid Buffers
The [Eu(DTPA)]2-
systems at pH 36 were irradiated with γ radiation using a
60Co irradiator at the Dalton Cumbrian Facility to determine the effect of radiation on a
range of amino acid buffers
103
Figure 221 Emission spectra of Eu3+
in D2O at pD 36 with and without the presence
of amino acidslactate excited at 395 nm before 5 kGy γ-irradiation
Figure 222 Emission spectra of Eu3+
in D2O at pD 36 with and without the presence
of amino acidslactate excited at 395 nm after 5 kGy γ-irradiation
The emission intensity of the irradiated samples (Figure 222) was lower than
before irradiation (Figure 221) which is likely to be due to quenching effects from
radicals produced by degradation of the solvent However the spectral profiles remain
0
50
100
150
200
250
550 600 650 700
Emis
sio
n In
ten
sity
(au
) Th
ou
san
ds
Wavelength (nm)
EuDTPA
EuDTPA-Lactate
EuDTPA-Gly
EuDTPA-Ala
EuDTPA-Ser
0
20
40
60
80
100
120
140
550 600 650 700
Emis
sio
n In
ten
sity
(au
) Th
ou
san
ds
Wavelength (nm)
EuDTPA
EuDTPA-Lactate
EuDTPA-Gly
EuDTPA-Ala
EuDTPA-Ser
104
the same and still resemble that of [Eu(DTPA)]2-
and t-tests showed that there was no
significant difference between the spectra of each of the buffers
The luminescence lifetimes were also measured for samples before and after
irradiation and before and after extraction into an organic phase (02 M HDEHP in
dodecane) (Table 24)
Table 24 Luminescence lifetimes for aqueous and organic phases for
[Eu(DTPA)]2-
systems before and after irradiation at pH 36 Estimated error on
lifetimes = plusmn 10
Table 25 Luminescence lifetimes and q values for [Eu(DTPA)]2-
systems before and
after irradiation at pH 36 Estimated error on lifetimes = plusmn 10 and on q = plusmn 02
τ of aqueous
phase
before
irradiation
(ms)
τ of aqueous
phase
after
irradiation
(ms)
τ of
organic
phase
before
irradiation
(ms)
τ of
organic
phase
after
irradiation
(ms)
Eu DTPA 063 066 222 262
Eu DTPA Lactate 063 063 241 251
Eu DTPA Gly 065 064 247 249
Eu DTPA Ala 065 065 211 238
Eu DTPA Ser 065 062 260 251
τ of
aqueous
phase
before
irr [H2O]
(ms)
τ of
aqueous
phase
after
irr[H2O]
(ms)
τ of
aqueous
phase
before irr
[D2O] (ms)
τ of
aqueous
phase
after irr
[D2O] (ms)
q
before
irr
q after
irr
Eu DTPA 063 066 230 227 11 10
Eu DTPA
Lactate
063 063 216 210 10 10
Eu DTPA
Gly
065 064 203 208 10 10
Eu DTPA
Ala
065 065 209 211 10 10
Eu DTPA
Ser
065 062 208 206 10 10
105
There was negligible change in luminescence lifetime before and after
irradiation for both aqueous and organic sample sets There was also no change in
hydration number q before and after irradiation of the aqueous phase (Table 25)
These data along with the consistent profiles of the emission spectra is analogous with
the radiolysis data from the INL and shows that the amino acid buffers glycine alanine
and serine are relatively resistant to -radiolysis
254 Buffer Interaction Summary
The potential of using amino acids as a combined buffer and soft donor was
initially investigated by considering the interaction of the buffers glycine L-alanine L-
serine L-phenylalanine and lactate (for comparison) with Eu3+
and [Eu(DTPA)]2-
systems It was found by 1H NMR and luminescence spectroscopies that amino acids
and lactate do not form stable complexes with either the free metal ion or the metal-
DTPA complex and that the buffers may be in fast exchange with surrounding solvent
molecules Luminescence studies on L-phenylalanine showed that this amino acid does
not bind to the metal ion as there was no sensitised emission from Tb3+
ion when
excited into the phenyl chromophore of the amino acid when the two components were
in solution Emission spectra of Eu3+
and Cm3+
aqua ions and their corresponding
DTPA complexes showed no change (no peak splitting or shifting) upon the addition of
amino acidslactate
The number of water molecules in the inner hydration sphere (q) of Eu3+
was
reduced from 9 to ~6 when buffers were added to the aqua ion in solution suggesting
that the amino acids are interacting with the metal ion but are likely to be in fast
exchange with surrounding solvent molecules There was no change in q when buffers
were added to metal-DTPA complexes in solution for Eu3+
or Cm3+
Radiolysis studies were carried out on lactate and amino acid buffered
[Eu(DTPA)]2-
systems and it was found that the systems are relatively resistant to γ-
radiation when exposed to 5 kGy This is consistent with previous work conducted by
the INL showing that separation systems using L-alanine as a buffer are more resistant
to radiolysis than the original TALSPEAK process using lactate
106
1 G Muumlhlbachovaacute Rostlinnaaacute Vyacuteroba 2002 48 12 536ndash542
2 JSF Swaran and V Pachauri Int J Environ Res Public Health 2010 7 7 2745-
2788
3 M Regueiro-Figueroa and C Platas-Iglesias J Phys Chem A 2015 119 6436-
6445
4 N Mignet Q de Chermont T Randrianarivelo J Seguin C Richard M Bessodes
and D Scherman Eur Biophys J 2006 35 155-161
5 CL Davies and A-K Duhme-Klair Tetrahedron Lett 2011 52 4515-4517
6 G Moreau L Burai L Helm J Purans and AE Merbach J Phys Chem A 2003
107 758-769
7 KA Deal IA Davis S Mirzadeh SJ Kennel and MW Brechbiel J Med Chem
1999 42 15 2988ndash2992
8 S Beacutenazeth J Purans M-C Chalbot MK Nguyen-van-Duong L Nicolas K
Keller amp A Gaudemer Inorg Chem 1998 37 3667-3674
9 A Delle Site RD Baybarz J Inorg Nucl Chem 1969 31 2201
10 IA Lebedev VT Filimonov AB Shalinets GN Yakovlev Sov Radiochem
1968 10 94
11 I Bayat KFK
Berichte-1291 Karlsruhe Germany 1970
12 P Thakur JL Conca CJ Dodge AJ Francis GR Choppin Radiochim Acta
2013 101 221
13 G Tian LR Martin and LRao Inorg Chem 2015 54 1232-1239
14 S Leguay T Vercouter S Topin J Aupais D Guillaumont M Miguirditchian P
Moisy and C Le Naour Inorg Chem 2012 51 12638-12649
15 M Nazarov and D Young Noh New Generation of Europium and Terbium
Activated Phosphors 2011 247
16 K N Shinde S J Dhoble H C Swart and K Park Phosphate Phosphors for Solid
State Lighting Springer Series in Materials Science Springer 2012 174 41-59
17 K S Wong T Sun X-L Liu J Pei and W Huang Thin Solid Films 2002 417 85-
89
18 WD Horrocks and DR Sudnick J Am Chem Soc 1979 101 334
19 A Beeby IM Clarkson RS Dickins S Faulkner D Parker L Royle AS de
Sousa JAG Williams and M Woods J Chem Soc Perkin Trans 2 1999 493-504
20 RM Supkowski and WD Horrocks Inorg Chim Acta 2002 340 44-48
107
21 CF Geraldes AD Sherry WP Cacheris KT Kuan RD 3rd Brown SH
Koenig and M Spiller Magn Reson Med 1988 8 2 191-9
22 E Csajboacutek I Baacutenyai and E Bruumlcher Dalton Trans 2004 14 2152-2156
23 JJ Howland and M Calvin J Chem Phys 1950 83 239
24 J E Sansonetti and W C Martin Handbook of Basic Atomic Spectroscopic Data
httpphysicsnistgovPhysRefDataHandbookTables National Institute of Science
and Technology USA 2005
25 T Kimura and G R Choppin J Alloys Compounds 1994 213 313
26 T Kimura Y Kato H Takeishi and G R Choppin J Alloys Compounds 1998
271273 719
27 T L Griffiths Investigations of Ternary Complexes Relevant to the Nuclear Fuel
Cycle 2011 The University of Manchester PhD Thesis
28 G Tian LR Martin and L Rao Inorg Chem 2010 49 10598-10605
29 K L Nash D Brigham T C Shehee and A Martin Dalton Trans 2012 41
14547-14556
30 CJ Leggett G Liu and MP Jensen Solv Extraction and Ion Exchange 2010 28
313-334
31 A Miličević and N Raos Acta Chim Slov 2014 61 904-908
32 VV Nikonorov J Anal Chem 2010 65 4 359-365
33 D Magnusson B Christiansen R Malmbeck and JP Glatz Radiochim Acta 2009
97 9 497-502
34 B Weaver and T A Kappelmann Talspeak A new method of separating americium
and curium from the lanthanides by extraction from an aqueous solution of an
aminopolyacetic acid complex with a monoacidic organophosphate or phosphonate
Oak Ridge National Laboratory 1964 1-60
35 LR Martin S P Mezyk and BJ Mincher J Phys Chem A 2009 113 141-145
36 Dr Leigh Martin Idaho National Laboratory unpublished results
108
3 SOLVENT EXTRACTION AND OPTIMISATION STUDIES WITH AMINO
ACID BUFFERS
As discussed in Chapter 2 the potential of using amino acids as a combined
buffer and soft donor to replace the lactate buffer and holdback reagent DTPA
(diethylenetriaminepentaacetic acid) in the TALSPEAK process (Trivalent Actinide
Lanthanide Separation by Phosphorus reagent Extraction from Aqueous Complexation)
was investigated Initial complexation studies by 1H NMR and luminescence
spectroscopies showed that amino acids do not form stable complexes with actinide or
lanthanide ions or AnLn-DTPA complexes in aqueous solution and that like lactate
they are in fast exchange with surrounding water molecules Separation studies were
carried out by our collaborators at the Idaho National Lab (Travis Grimes Richard
Tillotson and Leigh Martin) to determine whether amino acids could be used as buffers
or as combined bufferssoft-donors to facilitate Ln3+
MA3+
separation A summary of
this work can be found below in Section 31 Their initial studies were used as the basis
for the work conducted as part of this research project (Sections 32 and 33)
31 Previous work at the INL1
311 L-alanine Studies
3111 pH Studies on L-alanine
L-alanine was initially chosen as a potential replacement for lactic acid as a
buffer as the two molecules differ only by the α-group (α-amino on L-alanine compared
to α-hydroxy group on lactic acid) The pKa values of the compounds are 24-26 for L-
alanine and 36-38 for lactic acid depending on the background electrolyte Studies
carried out on the L-alanine found that the separation factors were in fact reduced
compared to the traditional TALSPEAK method when L-alanine was used as a buffer at
pH 2 and pH 3 in place of lactic acid The separation factors were generally lower as the
distribution ratios for Am3+
(DAm) were significantly increased (2 orders of magnitude
higher) when L-alanine was used at pH 3 (DAm 012) and pH 2 (DAm 038-047)
compared to lactic acid at pH 3 (DAm 0009) However the studies carried out at pH 2
resembled a typical TALSPEAK curve and gave overall the best separation of
lanthanides over Am3+
as can be seen in Figure 31 Although separation occurs in the
L-alanine system at pH 3 the separation is better at pH 2 At pH 3 it can be seen that
separation is decreased for the heavier lanthanides This is due to slow phase-transfer
kinetics previously reported by Weaver and Kappelmann2 and Kolarik
3 A pH 1 system
109
does not allow separation of the earlier lanthanides from americium The distribution
ratios for lanthanides in a typical TALSPEAK system can be seen in Figure 32 for
comparison
086 088 09 092 094 096 098 1
10-2
10-1
100
101
102
5x10²
086 088 09 092 094 096 098 1
10-2
10-1
100
101
102
5x10²
pH 1
pH 2
pH 3
Am pH 1
Am pH 2
Am pH 3
[Alanine] = 05 M
[DTPA] = 0050 M
[HDEHP] = 02 M
Organic Diluent
Dodecane
DM
1r Aring
DM
15 M Alanine
10 M Alanine
05 M Alanine
Am 15 M Alanine
Am 10 M Alanine
Am 05 M Alanine
[DTPA] = 0050 M
[HDEHP] = 02 M
Organic Diluent
Dodecane
pH 2
1r Aring
Figure 31 The effect of pH on an L-alanine-buffered TALSPEAK system
Figure 32 Distribution ratios of Ln3+
Y3+
in a TALSPEAK system 1 mM LnY3+
1 M
lactate 005 M DTPA pH 7 extracted using 05 M HDEHP in 14-DIPB4
110
3112 Concentration Effects
The effect of the concentration of L-alanine was also considered and it was
found that the effect on the trend of separation factors across the lanthanide series was
the same as for lactate and the changes were negligible as can be seen from Figure 33
Slower extraction rates were observed for the heaviest lanthanides at lower buffer
concentrations (05 M than 10 or 15 M) for both L-alanine and lactic acid Since it was
found that there was no benefit to changing the L-alanine buffer concentration further
studies were carried out to investigate the potential of using the amino acid to carry out
the process at the lower pH of 2 as although the separation factors are lower than in
lactic acid buffered systems the values are still high enough to give sufficient
separation (see Table 31)
086 088 09 092 094 096 098 1
10-2
10-1
100
101
102
5x10²
086 088 09 092 094 096 098 1
10-2
10-1
100
101
102
5x10²
pH 1
pH 2
pH 3
Am pH 1
Am pH 2
Am pH 3
[Alanine] = 05 M
[DTPA] = 0050 M
[HDEHP] = 02 M
Organic Diluent
Dodecane
DM
1r Aring
DM
15 M Alanine
10 M Alanine
05 M Alanine
Am 15 M Alanine
Am 10 M Alanine
Am 05 M Alanine
[DTPA] = 0050 M
[HDEHP] = 02 M
Organic Diluent
Dodecane
pH 2
1r Aring
Figure 33 The effect of buffer concentration on an L-alanine-buffered TALSPEAK
system
111
Table 31 Distribution ratios and separation factors for a number of L-alanine buffered
TALSPEAK systems as pH and buffer concentration are varied compared to a
traditional lactic acid system
Conc pH DAm Separation Factors (SF)
(M) LaAm CeAm NdAm EuAm
L-Alanine 15 2 038 plusmn 001 165 plusmn 5 61 plusmn 1 28 plusmn 1 64 plusmn 1
L-Alanine 10 2 039 plusmn 002 176 plusmn 10 54 plusmn 3 24 plusmn 1 55 plusmn 3
L-Alanine 05 2 047 plusmn 006 165 plusmn 24 64 plusmn 3 28 plusmn 8 66 plusmn 8
L-Alanine 05 3 012 plusmn 001 147 plusmn 17 45 plusmn 5 9 plusmn 1 25 plusmn 3
Lactic
Acid
10 3 0009 380 140 mdash 91
3113 Studies at pH 2
Further investigations at pH 2 into the potential of using amino acids as a
combined buffer and soft donor showed that no separation occurs when DTPA is not
present indicating that amino acids do not act as holdback reagents in their own right
Previous work by Tanner and Choppin5 showed that at low pH the glycine zwitterion
forms inner-sphere monodentate complexes with M3+
ions including Ln3+
and An3+
Aziz et al67
later showed the same is true for L-alanine with Eu3+
and Am3+
at pH 36
whereby weak monodentate complexes form Krishnan and Plane8 showed that glycine
complexes metal ions solely through the COO- group on the amino acid No co-
ordination through the amino group has been reported
312 Other Amino Acids
Other amino acids L-arginine L-histidine and L-methionine were also
considered and further investigations were carried out (Figure 34) These three amino
acids are larger and more hydrophobic than L-alanine and are therefore less soluble at
higher concentrations (lt05 M) at pH values greater than pH 1 Again no separation
was observed when the amino acids were used without DTPA With Na5DTPA it was
found that the DAm values for Arg and Met were lower than those for L-alanine leading
to an increase in separation factor possibly due to co-ordination of the Am3+
ion with
soft donor atoms on the amino acids (Table 32) The DAm in the His system however
was similar to the Ala system suggesting that there is no coordination of the metal ion
112
with the α-amine or imidazole groups It is not known if the amino acids are co-
ordinating or chelating through soft donor atoms to the metal ion Further studies are
currently being carried out at the INL to determine stability constants and to use time-
resolved fluorescence to probe inner co-ordination sphere changes in order to
investigate the interactions of amino acids with the trivalent metal ions
Figure 34 Chemical structures of L-arginine (top) L-histidine (bottom left)
and L-methionine (bottom right)
Table 32 Distribution ratios and separation factors for a number of amino acid
buffered TALSPEAK systems
When extended further studies on these amino acids found that the kinetic
issues which affected separation of the heavier lanthanides using L-alanine at pH 3
(Figure 31) were also affecting separation with L-arginine at pH 2 as well as pH 3
Conc pH pKa DAm3+ Separation Factors (SF)
(M) LaAm CeAm NdAm EuAm
L- Arg 05 2 182 027 plusmn 001 184 plusmn 26 40 plusmn 3 27 plusmn 2 72 plusmn 4
L- His 05 2 180 040 plusmn 001 208 plusmn 8 95 plusmn 3 24 plusmn 5 83 plusmn 1
L-Met 05 2 213 017 plusmn 001 271 plusmn 18 97 plusmn 3 26 plusmn 1 60 plusmn 3
113
suggesting that longer chain amino acids may not suitable replacements for lactate
Based on these data the most promising replacement buffer is L-alanine at pH 2
32 L-alanine System Optimisation at pH 2
Following from the initial work carried out by Grimes et al at the INL further
studies were begun for this research project The speciation of DTPA was modelled
using HySS (Hyperquad Simulation and Speciation) software using literature pKa
values (Figure 35)9 At pH 1 the dominant DTPA species present in solution are
H7DTPA2+
and H6DTPA+ which both repel MA
3+ and Ln
3+ ions and so the species are
ineffective as holdback reagents At pH 2 the dominant species are H5DTPA (65 )
H4DTPA- (24 ) and H3DTPA
2- (11 ) The species with the greatest electrostatic
attraction under these conditions is to MA3+
Ln3+
ions is H3DTPA2-
At pH 3 a much
higher proportion of this species is present (87 ) than at pH 2 making pH 2 less
favourable for effective separation However the conditions can be optimised in order
to maximise separation by changing the concentrations of extractant and holdback
reagent For industrial purposes conducting the process at a lower pH is preferable as it
is easier for process operators to control higher acid concentrations Optimisation
studies using L-alanine as a buffer at pH 2 were carried out during a placement at the
INL
114
Figure 35 DTPA speciation as a function of pH modelled using HySS sofware using
literature pKa values
321 [Na5DTPA] Dependence
The concentration of Na5DTPA used in traditional TALSPEAK systems is 005
M Initial optimisation studies were carried out using a [Na5DTPA] range of 006 M to
010 M in increments of 001 M The L-alanine concentration was 05 M
115
Figure 36 [Na5DTPA] dependence of L-alanine system (05 M) at pH 2
Experiments were carried out using traditional TALSPEAK methods at pH 2
The extractant was HDEHP (02 M) in dodecane Separations were conducted to
measure the separation of Eu3+
over Am3+
A graph of log[DTPA] vs logDEuAm can be
seen in Figure 36 The slope of the line for Am3+
is approximately -1 indicating that
the metal ions are each bound to 1 DTPA5-
molecule The R2 value is close to 1 and the
errors are small The slope of the line for Eu3+
is also approximately -1 Separation
factors for the data were between 66 and 80 and the DAm were between 026 and 042
which are still 2 orders of magnitude higher than that for a traditional TALSPEAK
system (DAm = 0009) The Na5DTPA concentration was therefore increased further in
order to bring the DAm lower to prevent as much Am3+
being partitioned into the organic
phase
y = -09383x - 15277 Rsup2 = 09854
y = -11258x + 01381 Rsup2 = 09289
-10
-05
00
05
10
15
20
-125 -12 -115 -11 -105 -1 -095
log
DEu
Am
log [Na5DTPA]
Am Extraction
Eu Extraction
116
Figure 37 Eu3+
Am3+
separation for [Na5DTPA] dependence of L-alanine system (05
M) at pH 2
Experiments were carried out as before but using Na5DTPA concentrations of
02 M 03 M 04 M and 05 M A graph of log[DTPA] vs logDEuAm was plotted
(Figure 37) At 05 M [Na5DTPA] H5DTPA began to precipitate out due to the low pH
used and so data for this concentration is unreliable and was not plotted on the graph
The data is good as the R2 values are close to 1 and the errors are small However the
slope is not exactly -1 (slope = -080 for Eu and -085 for Am) this is likely to be due to
competition and activity effects from the increased [Na5DTPA] and therefore increased
Na+ concentration Separation factors for the data were around the same (between 65
and 72) but the DAm values decreased to 008 for the 04 M Na5DTPA meaning much
less Am3+
is being partitioned into the organic phase
322 [HDEHP] Dependence
Experiments were carried out as for the [Na5DTPA] dependence but using
HDEHP extractant concentrations of 04 M 06 M 08 M and 10 M in dodecane for
each of the Na5DTPA concentrations 02 M 03 M and 04 M Graphs of log[DTPA] vs
logDEuAm were plotted (Figures 38-310)
y = -08451x - 14757 Rsup2 = 09936
y = -07958x + 03998 Rsup2 = 0998
-15
-10
-05
00
05
10
15
-11 -1 -09 -08 -07 -06 -05 -04 -03
log
DEu
Am
log [Na5DTPA]
Am Extraction Eu Extraction
117
Figure 38 Eu3+
Am3+
separation for [HDEHP] dependence of L-alanine system (05
M) at pH 2 using 02 M Na5DTPA
Figure 39 Eu3+
Am3+
separation for [HDEHP] dependence of L-alanine system (05
M) at pH 2 using 03 M Na5DTPA
y = 13522x + 02972 Rsup2 = 09283
y = 09682x + 19794 Rsup2 = 09561
-05
00
05
10
15
20
25
-05 -04 -03 -02 -01 0 01
log
DEu
Am
log [HDEHP]
Am Extraction
Eu Extraction
y = 14702x + 00193 Rsup2 = 09981
y = 11892x + 17129 Rsup2 = 09713
-10
-05
00
05
10
15
20
-05 -04 -03 -02 -01 0 01
log
DEu
Am
log [HDEHP]
Am Extraction
Eu Extraction
118
Figure 310 Eu3+
Am3+
separation for [HDEHP] dependence of L-alanine system (05
M) at pH 2 using 04 M Na5DTPA
The R2 values for these data are close to 1 and the errors are generally small
making the data good quality The slope of each data set should be +3 indicating that
the metal ions are each bound to 3 HDEHP molecules in the organic phase1011
However the slopes are not quite +3 this is likely to be due to activity effects and
competition from the increased Na+ concentration as a result of increasing the
Na5DTPA concentration
323 L-alanine Optimisation Summary
The results of the optimisation of a TALSPEAK system using 05 M L-alanine
as a buffer are summarised in Tables 33 and 34
Table 33 Separation factors for L-alanine optimisation studies
[HDEHP] (M)
[Na5DTPA]
(M)
02 04 06 08 10
02 72 plusmn 3 70 plusmn 6 43 plusmn 6 61 plusmn 9 49 plusmn 2
03 70 plusmn 1 62 plusmn 7 59 plusmn 9 56 plusmn 5 46 plusmn 8
04 71 plusmn 5 60 plusmn 4 74 plusmn 4 70 plusmn 7 67 plusmn 1
y = 11522x - 00047 Rsup2 = 09867
y = 12575x + 18424 Rsup2 = 09976
-10
-05
00
05
10
15
20
25
-05 -04 -03 -02 -01 0 01
log
DEu
Am
log [HDEHP]
Am Extraction
Eu Extraction
119
Table 34 DAm values for L-alanine optimisation studies Error plusmn 001
[HDEHP] (M)
[Na5DTPA]
(M)
02 04 06 08 10
02 012 053 121 126 203
03 010 027 050 077 102
04 008 036 051 077 102
Table 33 shows the separation factors are generally similar for each condition
and there is no particular set of conditions that gives the highest value although the
better separation factors tend to be achieved at the lower extractant concentrations The
DAm values (Table 34) are best at the lowest extractant concentrations and highest
holdback concentration as would be expected The best set of conditions is 04 M
Na5DTPA and 02 M HDEHP with the best DAm achievable being 008 and best SF 71 plusmn
5 Despite optimisation the L-alanine system is still not as efficient as the traditional
lactate system as the distribution of Am3+
is one order of magnitude higher and the
separation is lower however the L-alanine system allows the separation to be carried
out at a lower pH which is beneficial for an industrial process
33 Other Amino Acid Studies
331 Initial Tests with Other Amino Acids
Several initial tests were carried out using other amino acids as buffers It had
been found previously that L-arginine at pH 2 gave poor separation of the heavier
lanthanides (Section 312) so further studies were carried out using 05 M L-methionine
and L-histidine to see how effective these amino acids could be as potential buffers
Results from initial tests using TALSEPAK conditions at varied pH values can be seen
in Table 35
120
Table 35 Separation factors and DAmEu values for traditional TALSPEAK systems
with different buffers at varying pH values
From Table 35 it can be seen that L-histidine gives good separation data at pH
3 The DAm of 007 is comparable to the optimised L-alanine system in Section 32 and
the separation factor is high at 99 comparable to the original lactate TALSPEAK
system Further investigations were subsequently carried out in order to determine if the
same kinetic issues arise with L-histidine as with L-arginine and L-alanine L-
methionine was not investigated further as the separation data at pH 2 was not very
promising and it is insoluble at 05 M at pH 3
332 Studies with L-Histidine
The distribution ratios of La-Ho were determined by ICP-MS for a 05 M L-
histidine system at pH 2 and pH 3 (Figure 311)
Buffer pH DAm
DEu
SF
Lactic Acid 3 0009 0819 91
L-Methionine 1 547 6017 11
2 018 1016 57
L-Histidine 1 468 9579 20
2 053 4463 84
3 007 660 99
121
Figure 311 Distribution ratios of La3+
-Ho3+
and Am3+
with 05 M L-histidine buffer at
pH 2 and pH 3
The distribution ratios for the L-histidine system at pH 2 generally resemble
those on a traditional TALSPEAK curve at pH 3 with the D values decreasing towards
neodymium and then increasing with the later lanthanides However the pH 3 L-
histidine system exhibits decreasing D values with the heavier lanthanide elements
demonstrating the same kinetic problems as the L-alanine and L-arginine systems at
higher pH
34 Summary of Separations with Amino Acid Buffers
Previous work carried out at the Idaho National Laboratory by Grimes showed
that amino acids do not act as holdback reagents in their own right and no separation of
Ln3+
Am3+
is achieved when they are used without Na5DTPA in solution However
investigations showed that when used alongside Na5DTPA good separation can be
attained when using 05 M L-alanine at pH 2 pH 2 is less favourable than pH 3 for
separations using DTPA as more protonated forms of the molecule are present in
solution and the holdback reagent is not able to bind as strongly to metal ions However
optimisation of the system in order to maximise the separation whilst keeping Am3+
partitioning to a minimum by changing the concentrations of holdback reagent and
extractant proved to be successful The best conditions were found to be 04 M
Na5DTPA and 02 M HDEHP giving a separation factor of 71 plusmn 5 with a DAm value of
008 Although this separation is not as good as a traditional lactate TALSPEAK
001
01
1
10
56 57 58 59 60 61 62 63 64 65 66 67 68
Dis
trib
uti
on
Rat
io
Atomic Number
His pH 2
His pH 3
Am pH 2
Am pH 3
122
system the use of L-alanine as a buffer allows the process to be carried out at pH 2
which is a much more preferable pH for industry
When investigations were carried out using other amino acids at varying pH
values it was found that L-methionine was too poorly soluble at pH 3 and did not give
very good separation data at pH 2 L-arginine was found to have kinetic issues at pH 2
and 3 giving poor separation of the heavier lanthanides However L-histidine gave
good separation data at pH 3 with a SFEuAm of 99 comparable to that of the original
TALSPEAK process and a DAm of 007 comparable to the optimised alanine system
Studies of the lanthanides La-Ho using L-histidine at pH 3 however showed that the
same kinetic problems arise as for L-arginine and L-alanine as the DLn decreases for
later lanthanides indicating that L-histidine is no more promising as a buffer than the
other amino acids
123
1 TS Grimes RD Tillotson and LR Martin Solv Extraction and Ion Exchange
2014 32 378-390
2 B Weaver and T A Kappelmann Talspeak A new method of separating americium
and curium from the lanthanides by extraction from an aqueous solution of an
aminopolyacetic acid complex with a monoacidic organophosphate or phosphonate
Oak Ridge National Laboratory 1964 1-60
3 Z Kolarik G Koch and W Kuhn J Inorg Nucl Chem 1974 36 905-909
4 KL Nash Solv Extraction and Ion Exchange 2015 33 1-55
5 S P Tanner and G R Choppin Inorg Chem 1968 7 2046-2048
6 A Aziz and S J Lyle J Inorg Nucl Chem 1971 33 3407-3408
7 A Aziz S J Lyle and J E Newbery J Inorg Nucl Chem 1971 33 1757-1764
8 K Krishnan and R Plane Inorg Chem 1967 6 55-60
9 NJ Bridges LE Roy and CL Klug Computation and Spectroscopic Investigation of
the DTPA Complexes US Department of Energy 2012
10 TS Grimes G Tian L Rao and KL Nash Inorg Chem 2012 51 6299-6307
11 G Lumetta AV Gelis and GF Vandegrift Solv Extraction and Ion Exchange
2010 28 3 287-312
124
4 STUDIES USING L-GLUTATHIONE AS A BUFFER IN A TALSPEAK
SYSTEM
The TALSPEAK process (Trivalent Actinide Lanthanide Separation by
Phosphorus reagent Extraction from Aqueous Complexation) which is currently being
developed in the USA for separation of minor actinides (MA) from lanthanides (Ln)
from nuclear waste uses lactic acid as a buffer (pH 36) and the chelator DTPA
(diethylenetriaminepentaacetic acid) as a holdback reagent to retain Am3+
in an aqueous
phase allowing Ln3+
to be extracted by phosphate extractant HDEHP (di-
(2ethylhexyl)phosphoric acid) into an organic phase Studies have been carried out on
the potential of using amino acids as a combined buffer and soft-donor in order to
simplify the TALSPEAK process (Chapters 2 amp 3) however it was found that amino
acids do not act as holdback reagents in their own right although they have been shown
to allow the pH of the process to be lowered to pH 2 which is more favourable for an
industrial process
Although amino acids have been shown not to act as holdback reagents and are
therefore unable to replace lactic acid and DTPA5-
as a combined buffer and soft donor
based on the data obtained from the individual amino acid studies it was considered
that larger ligands with more soft donors such as short-chain peptides may be more
suitable A range of potential molecules were considered including a selection of simple
peptides including eisenin (pGlu-Gln-Ala-OH) and norophthalmic acid (γ-Glu-Ala-
Gly) (Figure 41) and B vitamins including biotin (B7) and folic acid (B9) (Figure
42)
125
Figure 41 Molecular structures of eisenin (top) and norophthalmic acid
(bottom)
Figure 42 Molecular structures of biotinvitamin B7 (top) and folic acid
vitamin B9 (bottom)
The tripeptide L-glutathione (reduced form) was chosen for further study as it
has a fairly simple structure contains several soft-donor atoms and its amino acid
constituents showed promise for buffer activity It is also relatively cheap and easy to
procure L-glutathione (GSH) consists of a chain comprising three amino acids L-
cysteinemdashL-glutamic acidmdashglycine (Figure 43)
126
Figure 43 Molecular structure of L-glutathione (reduced form)
Glutathione is naturally produced in all cells in the human body It is an
antioxidant with numerous functions most of which are related to the ability of its
sulphur atom to scavenge free radicals or donate electrons GSH regulates cell growth
and division by absorbing oxide radicals present in the cell which would prevent cell
growth repairs DNA by donating electrons removed from DNA strands by free radicals
aiding in DNA synthesis assists in protein synthesis by reacting (sulphur atom) with
undesirable S-S bonds to break them and allow for the correct pairing metabolises
toxins by co-ordinating with them through the S atom making them more water soluble
for excretion and recycles other antioxidants (such as vitamins C and E) by donating
electrons1 As a cysteine-containing tripeptide it is also a provider of the amino acid
cysteine in the body and is involved in amino acid transport in and out of cells
Properties of glutathione which are of particular interest to MA3+
Ln3+
separation
studies are its ability to conjugate to heavy metals (to allow them to be removed from
the body like DTPA23
and its resistance to radiation (due to its ability to scavenge free
radicals) which decreases radiation damage in the body45
but also would be beneficial
for spent nuclear fuel (SNF) reprocessing where free radicals and high levels of
radiation are present
As is the case for lactate6 and amino acid
7 complexes of lanthanides stability
constants of Ln-GSH complexes increase across the lanthanide series from La-Lu as the
Lewis acidity of the metal ions increases Log β values range from 556 for La3+
to 751
for Ho3+
with GSH indicating slightly higher stability of Ln-GSH complexes than of
lactate and amino acid complexes of Ln3+
with log β = 633 for Ln(lactate)3 formation
and values ranging from 582-665 for L-alanine with Ln3+
when Ln = La-Sm (Section
242) Garg et al also reported that the stability of Ln-GSH complexes was found to
decrease as ionic strength increases and that the optimum stability of the complexes was
in solutions within the pH range of 340-348 (77 complex formation)8
127
Solvent extraction experiments were initially performed in order to investigate
the separation ability of GSH with Am3+
and Eu3+
and conditions were then optimised
in order to achieve maximum separation Interaction of the buffer with various
components in solution including lanthanide ions was probed using various techniques
including luminescence spectroscopy which was also used in determining the
susceptibility of the buffer to radiolysis and ICP-MS
41 Solvent Extraction and Separation using GSH
411 [L-Glutathione] and pH Dependence
4111 [GSH] Dependence without Na5DTPA at pH 4
L-glutathione has pKa values of 212 (COOH) 359 (COOH) 875 (NH2) and
965 (SH)9 and so with two pKa values below 4 and optimum stability at pH 34 initial
studies were carried out at pH 4 as it would be expected that the glutathione would
complex to metal ions most effectively around this pH and be more likely to act as a
holdback reagent Although pH 4 is a higher pH than that used currently in the
TALSPEAK process and therefore less desirable if proven to improve the process it
may still have potential if satisfactory separation is achieved
Initial studies using L-glutathione as a buffer without the presence of Na5DTPA
in the system showed that as with amino acids GSH is ineffective as a holdback
reagent on its own as there was no separation observed between Eu3+
and Am3+
Over a
GSH concentration range of 01 M to 05 M the separation factors ranged from 038-
585 plusmn 108 Glutathione is insoluble at concentrations above 05 M at pH 4 at room
temperature
4112 [GSH] and pH Dependence with Na5DTPA
Further experiments were then carried out using GSH as a buffer in the presence
of Na5DTPA in order to see if there was any improvement in the separation with this
buffer over the traditional lactic acid buffer The experiments used 005 M Na5DTPA
and 01-05 M GSH over a pH range of 2-4 under TALSPEAK conditions (02 M
HDEHP in n-dodecane)
128
Figure 44 Eu3+
Am3+
distribution for [GSH] dependence with 005 M Na5DTPA at pH
2 extracted using 02 M HDEHP in dodecane Results were averaged from 3 repeat
tests
Figure 45 Eu3+
Am3+
distribution for [GSH] dependence with 005 M Na5DTPA at pH
3 extracted using 02 M HDEHP in dodecane Results were averaged from 3 repeat
tests
Plots of log[GSH] vs logDEuAm for systems at pH 2 and 3 are displayed in
Figures 44 and 45 The graphs show that increasing the concentration of GSH does not
affect the separation of Eu3+
over Am3+
since the distribution ratios for each remain
-02
0
02
04
06
08
1
12
14
16
18
-11 -09 -07 -05 -03
log
DEu
Am
log [GSH]
Am Extraction
Eu Extraction
-1
-08
-06
-04
-02
0
02
04
06
08
1
12
14
-11 -09 -07 -05 -03
log
DEu
Am
log [GSH]
Am Extraction
Eu Extraction
129
relatively constant At pH 2 the average DAm is 103 and DEu is 3013 giving an
average separation factor of 29 plusmn 8 At pH 3 the extraction of both metals is lower with
DAm averaging at 018 and DEu at 1423 giving an average separation of 79 plusmn 13 Both
data sets for pH2 and pH 3 show a slope of almost zero suggesting that the metal ions
are not bound to any GSH molecules which would be consistent with the L-glutathione
just acting as a buffer These separation factors are lower than for the original
TALSPEAK buffered system using lactate (SF = 91 at pH 36) However at pH 4 the
slopes change on the graph and a difference in separation can be observed as the molar
concentration of GSH is increased
Figure 46 Eu3+
Am3+
distribution for [GSH] dependence with 005 M Na5DTPA at pH
4 Results were averaged from 3 repeat tests
At pH 4 as the concentration of L-glutathione is increased the separation factor
increases (Figure 46) The value DEu initially increases as the GSH concentration is
increased from 01-02 M but then remains constant at ~6 However DAm values
decrease linearly as the buffer concentration is increased from 01-05 M giving rise to
increased partitioning and separation values The results from the extraction
experiments at pH 4 are given in Table 41
-15
-10
-05
00
05
10
-11 -09 -07 -05 -03
log
DEu
Am
log [GSH]
Am Extraction
Eu Extraction
130
Table 41 Eu3+
Am3+
distribution and separation for [GSH] dependence with 005 M
Na5DTPA at pH 4
[GSH] (M) DAm DEu SF
01 073 plusmn 027 100 plusmn 041 14 plusmn 13
02 021 plusmn 011 658 plusmn 054 31 plusmn 14
03 016 plusmn 005 578 plusmn 097 37 plusmn 19
04 007 plusmn 002 590 plusmn 043 82 plusmn 19
05 006 plusmn 001 617 plusmn 097 104 plusmn 33
The results show that the L-glutathione is interacting with the DTPA in some
way at pH 4 to allow the separation to increase as a function of GSH concentration only
in the presence of Na5DTPA up to a SF of 104 at 05 M GSH concentration
comparable to separation achieved in the original lactate buffered TALSPEAK process
Figure 47 GSH speciation as a function of pH modelled using HySS software using
literature pKa values of 212 (COOH) 359 (COOH) 875 (NH2) and 965 (SH)9
131
Figure 48 H2GSH- species dominant in solution at pH 4
The speciation of GSH at pH 4 was modelled using HySS (Hyperquad Simulation and
Speciation) software using literature pKa values (Figure 47) At pH 4 the dominant
GSH species is the H2GSH- species (Figure 48) with both carboxylic acids
deprotonated This suggests that deprotonation of the second COOH group allows the
ligand to interact through the COO- to the metal complex Indeed several studies by
Faulkner et al have shown that molecules containing carboxylate functionalities
readily bind with 7-coordinate lanthanide(III) polyaminocarboxylate complexes in a
bidentate manner here DO3A (DO3A = [4710-tris-carboxymethyl-14710-tetraaza-
cyclododec-1-yl]-acetic acid) (Figure 49) and a similar binding interaction with the
related DTPA actinide(III)lanthanide(III) may be anticipated
Figure 49 A ternary Nd DO3A-pyrazine amine carboxylate complex reported by
Faulkner at al (left) and anticipated bidentate chelation of GSH with Am-DTPA at pH
4 (right)10
132
412 [Na5DTPA] Dependence at pH 4
The highest concentration of buffer (05 M) gave the highest separation factors
in the [GSH] dependence study at pH 4 so this concentration was chosen for the next
study on [Na5DTPA] dependence (Figure 410) Relatively high concentrations of
Na5DTPA were chosen (005-06 M) to make the results comparable to those obtained
in the optimisation of the L-alanine system (Section 32) The graphs plotted for the
[Na5DTPA] dependence were not plotted as log plots as it is not known how the
Na5DTPA and GSH interact and what competition effects may be present so the direct
correlation between the complexant concentration and D values have been plotted to
make interpretation more simple
Figure 410 Eu3+
and Am3+
distribution for [Na5DTPA] dependence with 05 M GSH
buffer at pH 4 curves fitted as polynominal order 2 for both Am3+
and Eu3+
Results
were averaged from 3 repeat tests
y = 19018x2 - 23123x + 72258 Rsup2 = 09937
y = 0442x2 - 03543x + 00659 Rsup2 = 0781
00
00
01
01
02
-20
-10
00
10
20
30
40
50
60
70
-01 26E-15 01 02 03 04 05 06 D
Am
DEu
[Na5DTPA] (M)
Eu extraction
Am extraction
133
Table 42 Eu3+
Am3+
distribution and separation for [Na5DTPA] dependence with 05
M GSH buffer at pH 4
[Na5DTPA] (M) DAm DEu SF
005 00650 plusmn ˂0001 624 plusmn 076 96 plusmn 11
01 00196 plusmn ˂0001 480 plusmn 057 245 plusmn 29
02 00039 plusmn ˂0001 361 plusmn 052 917 plusmn 133
03 00020 plusmn ˂0001 207 plusmn 017 1037 plusmn 85
04 00010 plusmn ˂0001 084 plusmn 008 833 plusmn 80
05 00060 plusmn ˂0001 042 plusmn 005 70 plusmn 9
06 00058 plusmn ˂0001 024 plusmn 005 41 plusmn 7
These data show that as the concentration of Na5DTPA is increased the
separation factor increases dramatically up to 03 M Na5DTPA with a maximum of
1037 85 (Table 42) After this peak there is a rapid decrease in separation as the
concentration of Na5DTPA is increased further up to 06 M The DAm decreases at a
steady rate as [Na5DTPA] is increased from 005 M to 04 M after which the DAm
increases slightly and remains fairly constant The DEu decreases at a slower rate
between 005 M and 02 M complexant decreasing more rapidly from 02 M to 06 M
The SF significantly decreases as the concentration of Na5DTPA is increased from 04
to 05 M Although it is unclear why this is without detailed structural analysis the
stoichiometry of DTPAGSH becomes 11 at 05 M which may alter the interaction
between the two constituents The separation factors achieved here are extremely high
(a factor of 10 higher than the current TALSPEAK system and the optimised alanine
system (Chapter 3)) whilst still maintaining low extraction of Am3+
413 [HDEHP] Dependence at pH 4
The extractant concentration dependence was measured for the systems
containing 05 M buffer and 03 M and 04 M Na5DTPA These Na5DTPA
concentrations were chosen for comparison as the 03 M was found to give the highest
separation factor and 04 M seemed to be the point where the separation began to
decrease The graphs plotted for the [HDEHP] dependence have also been plotted by
direct correlation between the extractant concentration and D values
134
Figure 411 Eu3+
and Am3+
distribution for [HDEHP] dependence with 03 M
Na5DTPA and 05 M GSH buffer at pH 4 curve for Eu3+
fitted as polynominal order 2
linear correlation for Am3+
Results were averaged from 3 repeat tests
Table 43 Eu3+
Am3+
distribution and separation for [HDEHP] dependence with 03 M
Na5DTPA and 05 M GSH buffer at pH 4
[HDEHP] (M) DAm DEu SF
02 00020 plusmn ˂0001 207 plusmn 017 1037 plusmn 85
04 00018 plusmn ˂0001 223 plusmn 003 1238 plusmn 17
06 00022 plusmn ˂0001 239 plusmn 006 1097 plusmn 15
08 00024 plusmn ˂0001 218 plusmn 005 906 plusmn 21
10 00031 plusmn ˂0001 165 plusmn 003 535 plusmn 9
At 03 M Na5DTPA the separation factor increases as the extractant
concentration is increased from 02 to 04 M after which the SF begins to decrease
again (Figure 411) The DAm increases slightly as the HDEHP concentration is
increased but the DEu increases and then decreases like the SF The separation factors
for the lower concentrations of extractant are very high with the optimum separation at
04 M giving a SF of 1238 (Table 43)
y = -30649x2 + 3243x + 15029 Rsup2 = 09467
y = 00013x + 00015 Rsup2 = 08028
0000
0002
0004
0006
0008
0010
0012
0014
00
05
10
15
20
25
30
0 02 04 06 08 1 12
DA
m
DEu
[HDEHP] (M)
Eu extraction
Am extraction
135
Figure 412 Eu3+
and Am3+
distribution for [HDEHP] dependence with 04 M
Na5DTPA and 05 M GSH buffer at pH 4 linear correlation for both Am3+
and Eu3+
Results were averaged from 3 repeat tests
Table 44 Eu3+
Am3+
distribution and separation for [HDEHP] dependence with 04 M
Na5DTPA and 05 M GSH buffer at pH 4
[HDEHP] (M) DAm DEu SF
02 0001 plusmn ˂0001 084 plusmn 008 833 plusmn 80
04 0251 plusmn ˂0001 081 plusmn 003 454 plusmn 30
06 0698 plusmn 0014 077 plusmn 001 110 plusmn 010
08 1026 plusmn 0009 078 plusmn 004 076 plusmn 005
10 1410 plusmn 0022 067 plusmn 003 047 plusmn 003
At 04 M Na5DTPA the separation factor decreases rapidly as the extractant
concentration is increased The DAm increases by a factor of 1000 but the DEu only
decreases slightly making the SF decrease significantly (Figure 412 and Table 44)
This would be consistent with the complexant and buffer interacting at higher
Na5DTPA concentrations as the stoichiometry nears 11 possibly forming an adduct
which no longer successfully holds back Am3+
Further structural studies are needed on
these systems in order to determine the complexation mechanisms in the solution under
these conditions
y = -01882x + 08847 Rsup2 = 08326
y = 17968x - 04007 Rsup2 = 09946
-0500
0000
0500
1000
1500
2000
00
01
02
03
04
05
06
07
08
09
10
0 02 04 06 08 1 12
DA
m
DEu
[HDEHP] (M)
Eu extraction
Am extraction
136
42 Luminescence Studies using GSH with Eu3+
Further studies on the glutathione systems were carried out on lanthanide
systems in order to gain some insight into the co-ordination of the buffer with the ions
with and without Na5DTPA present Control measurements were taken of Eu(NO3)3 in
water with no other reagents Eu(NO3)3 with Na5DTPA with no GSH and Eu(NO3)3
with GSH without Na5DTPA for comparison purposes (Figure 413) All luminescence
spectra were recorded and averaged from 5 repeat measurements
Figure 413 Corrected emission spectra of Eu(NO3)3 (1 mM) Eu(NO3)3 with GSH (05
M) and Eu(NO3)3 with Na5DTPA (005 M) in H2O following excitation at 397 nm
A first set of experiments was then carried out to mimic the separation and
solvent extraction studies performed at the INL (Section 41) At the same concentration
of Eu(NO3)3 the J=2 band of Eu3+
increases in intensity upon the addition of GSH
indicating a change in symmetrycrystal field and a weak but detectable interaction with
GSH (the J=1 and J=4 bands are the same intensity with and without GSH) Upon the
addition of Na5DTPA to the system the crystal field changes and the J=4 band shifts
position slightly indicating that a different species is forming which is consistent with
the formation of [EuDTPA]2-
0
1
2
3
4
5
6
550 600 650 700
Emis
sio
n In
ten
sity
(au
) x
10
00
0
Wavelength (nm)
Eu3+ in H2O
Eu with GSH
Eu with DTPA
137
421 [GSH] and pH Dependence without DTPA at pH 4
4211 Aqueous Phase Studies
Emission spectra of Eu3+
(1 mM Eu(NO3)3) in H2O and D2O were measured at
pHpD 4 as the concentration of [GSH] was varied from 01 M to 05 M The spectra
can be seen in Figures 414 and 415
Figure 414 Emission spectra of Eu(NO3)3 in H2O at pH 4 over a GSH concentration
range of 01 ndash 05 M following excitation at 397 nm
The spectra show an increase in emission intensity of the J=2 band as the GSH
concentration is increased from 01-02 M followed by a decrease at 03 M and a
further increase at 04 and 05 M whereas the opposite trend is observed with the J=4
peak The J=1J=2 peak ratios were determined and a t-test was carried out on them to
determine whether they were significantly different and hence whether the co-ordination
mode of the GSH to the Eu3+
changed as the buffer concentration was increased The
J=1J=2 values ranged from 0364-0718 and were found to be significantly different
The spectra are similar to that recorded for the free ion in solution but the J=1J=2
ratios vary slightly and there are some differences in the fine structure of the emission
bands This indicates that GSH is interacting with Eu3+
under these conditions albeit
weakly and the surrounding water molecules are in fast exchange with the buffer
molecules The solution dynamics were investigated further and the spectra were
recorded in D2O in order to minimise quenching caused by fast exchange of O-H
oscillators and to determine the inner sphere hydration number of Eu3+
in each case (q)
00
01
02
03
04
05
06
07
550 600 650 700
Emis
sio
n In
ten
sity
(au
) x
10
00
0
Wavelength (nm)
01 M GSH
02 M GSH
03 M GSH
04 M GSH
05 M GSH
138
Figure 415 Emission spectra of Eu(NO3)3 in D2O at pH 4 over a GSH concentration
range of 01 ndash 05 M following excitation at 397 nm
In D2O it can be seen that the emission intensity increases as the GSH
concentration is increased from 01-03 M followed by a decrease at 04 M and a slight
increase at 05 M This time the J=1J=2 values ranged from 0324-0748 but were
found not to be significantly different suggesting that the co-ordination mode of the
GSH to the metal ion is not changing as the concentration is increased which would be
expected as the buffer is not forming a stable complex with the ion and is in exchange
with surrounding solvent molecules
The number of water molecules bound to the Eu3+
ion (q) was calculated for
each of the samples using the Horrocks equations (Equations 19 and 110) The results
can be found in Table 45 There is a large range in q between different concentrations
with no clear pattern to the lifetimes or number of bound water molecules other than
generally q tends to increase from around 1 to 5 at the highest concentrations of GSH
This could be explained by the increasing ionic strength decreasing the stability of any
Eu-GSH complex and the solvent molecules are also in fast exchange with the buffer
00
02
04
06
08
10
12
550 600 650 700
Emis
sio
n In
ten
sity
(au
) x
10
00
0
Wavelength (nm)
01 M GSH
02 M GSH
03 M GSH
04 M GSH
05 M GSH
139
Table 45 Luminescence lifetimes and q values for Eu3+
with GSH at pHD 4
Error on lifetimes plusmn 10
[GSH]
(M)
τ D2O (μs) τ H2O (μs) q plusmn 02
01 1487 428 17
02 785 353 16
03 829 440 11
04 1545 161 58
05 1016 168 52
4211 Extraction Studies
Extractions were carried out on the Eu3+
samples containing GSH using 02 M
HDEHP in dodecane for the organic phase The emission spectra of both the aqueous
and organic phases post-extraction can be seen in Figure 416
Figure 416 Emission spectra of aqueous and organic phases after Eu3+
extraction at
pH 4 using a GSH concentration range of 01 ndash 05 M following excitation at 397 nm
The Eu-HDEHP complex formed in the organic phase has different symmetry to
Eu3+
complexes in the aqueous phase as can be seen by the different profile of the
emission spectra of the organic phases The spectra show good extraction of the Eu3+
into the organic phase for all concentrations of GSH with little or no metal ion left in the
aqueous phase The J=1J=2 values ranged from 0794-1214 for the organic phase and
were found not to be significantly different as expected as the buffer is unlikely to
00
01
01
02
02
03
03
550 600 650 700
Emis
sio
n In
ten
sity
(au
) x
10
00
0
Wavelength (nm)
01 M GSH Aq 02 M GSH Aq 03 M GSH Aq 04 M GSH Aq 05 M GSH Aq 01 M GSH Org 02 M GSH Org 03 M GSH Org 04 M GSH Org 05 M GSH Org
140
affect the co-ordination of metal ion in the organic phase as the Eu3+
ion is extracted as
the HDEHP complex seen by the different emission profile in the organic phase
spectrum11
422 [GSH] and pH Dependence with DTPA
4221 Aqueous Phase Studies
Emission spectra of Eu3+
(1 mM Eu(NO3)3) in H2O and D2O with 005 M
Na5DTPA were measured over a pHpD range of 2-4 as the concentration of [GSH] was
varied from 01 M to 05 M The D2O spectra can be seen in Figures 417 to 419 The
H2O spectra closely resemble those recorded in D2O but with lower relative emission
intensites as expected (Appendix 1)
Figure 417 Emission spectra of Eu3+
in D2O at pD 2 with 005 M Na5DTPA over a
GSH concentration range of 01 ndash 05 M following excitation at 397 nm
00
02
04
06
08
10
12
14
16
550 600 650 700
Emis
sio
n In
ten
sity
(au
) x
10
00
0
Wavelength (nm)
01 M GSH
02 M GSH
03 M GSH
04 M GSH
05 M GSH
141
Figure 418 Emission spectra of Eu3+
in D2O at pD 3 with 005 M Na5DTPA over a
GSH concentration range of 01 ndash 05 M following excitation at 397 nm
Figure 419 Emission spectra of Eu3+
in D2O at pD 4 with 005 M Na5DTPA over a
GSH concentration range of 01 ndash 05 M following excitation at 397 nm
It can be seen that in all samples a Eu-DTPA complex has formed The spectra
are all almost identical for each pD and for each buffer concentration with the emission
intensity being slightly higher for pD 3 and 4 with the same concentration of Eu3+
00
02
04
06
08
10
12
14
16
550 600 650 700
Emis
sio
n In
ten
sity
(au
) x
10
00
0
Wavelength (nm)
01 M GSH
02 M GSH
03 M GSH
04 M GSH
05 M GSH
00
02
04
06
08
10
12
14
16
550 600 650 700
Emis
sio
n In
ten
sity
(au
) x
10
00
0
Wavelength (nm)
01 M GSH
02 M GSH
03 M GSH
04 M GSH
05 M GSH
142
Table 46 J=1J=2 peak ratios and t-test results for Eu-DTPA at pD 2-4 over a GSH
concentration range of 01-05 M following excitation at 397 nm
J=1J=2
[GSH] (M)
01 02 03 04 05 st dev t-test
pD 2 0335 0399 0379 0375 0361 0024 No sig diff
pD 3 0440 0433 0451 0439 0419 0012 No sig diff
pD 4 0438 0467 0413 0469 0454 0023 No sig diff
st dev 0060 0034 0036 0048 0047
t-test Sig diff Sig diff Sig diff Sig diff Sig diff
The J=1J=2 peak height ratios were recorded for each emission spectrum and t-
tests were carried out on the peak ratios using the t-test data analysis tool in Microsoft
Excel accounting for the standard deviations between the ratios (Table 46) For each
pH as the concentration of GSH is increased the range in the ratios remains small and
there is no significant difference between the values suggesting that there is no change
in the co-ordination mode of the buffer to the metal ion as the concentration of GSH is
increased However a significant difference was observed between the data sets upon
changing pH as the J=1J=2 ratio increases from pD 2 to pD 4 indicating that the co-
ordination mode of glutathione is different at different pH values This is consistent
with the pKa values of GSH as at pH 2 both of the carboxylate groups will be
protonated with the dominant species present in solution shifting from 5050
H3GSHH2GSH to 5050 H4GSHH3GSH (Figure 47)
The luminescence lifetimes of each sample were recorded in H2O and D2O in
order to determine the q value of the complexes using the modified Horrocks equation
(Equation 110) These results are summarised in Table 47
143
Table 47 Luminescence lifetimes and q values for Eu-DTPA at pH 2-4 over a GSH
concentration range of 01-05 M
[GSH] (M) τ D2O (μs) τ H2O (μs) q plusmn 02
pH 2 01 1699 plusmn 7 607 plusmn 9 10
pH 2 02 1692 plusmn 10 619 plusmn 10 09
pH 2 03 1686 plusmn 9 629 plusmn 9 09
pH 2 04 1636 plusmn 12 607 plusmn 13 09
pH 2 05 1596 plusmn 11 629 plusmn 13 09
pH 3 01 1755 plusmn 14 626 plusmn 7 09
pH 3 02 1737 plusmn 13 626 plusmn 15 09
pH 3 03 1723 plusmn 5 626 plusmn 13 09
pH 3 04 1720 plusmn 14 635 plusmn 17 09
pH 3 05 1677 plusmn 9 641 plusmn 14 09
pH 4 01 1778 plusmn 14 593 plusmn 16 10
pH 4 02 1747 plusmn 13 640 plusmn 15 09
pH 4 03 1679 plusmn 15 669 plusmn 18 08
pH 4 04 1689 plusmn 14 623 plusmn 15 09
pH 4 05 1679 plusmn 13 652 plusmn 19 08
All of the complexes have approximately 1 water molecule in the inner
hydration sphere This is consistent with the formation of a [Eu(DTPA)]2-
complex The
values are only slightly less than 1 (compared to [Eu(DTPA)]2-
itself where q = 11)
and in most cases is not significantly different This indicates that any interaction of
GSH with the Eu3+
centre is very weak and that the buffer may be in fast exchange with
the bound water molecule
4222 Extraction Studies
Extractions were carried out on the samples using 02 M HDEHP in dodecane
for the organic phase in the absence of DTPA The emission spectra of both the aqueous
and organic phases post-extraction can be seen in Figures 420 and 421
144
Figure 420 Emission spectra of aqueous phases after Eu3+
extraction at pH 2-4 over a
GSH concentration range of 01-05 M following excitation at 397 nm
Figure 421 Emission spectra of organic phases after Eu3+
extraction at pH 2-4 over a
GSH concentration range of 01-05 M following excitation at 397 nm
The extraction data show that the best Eu3+
extraction occurs at pH 3 under these
conditions although as seen from the separation data obtained at INL (Section 41) this
is not the best pH for separation of metal ions The J=1J=2 peak height ratios were
recorded for each emission spectrum and t-tests were carried out on the peak ratios
using the t-test data analysis tool in Microsoft Excel accounting for the standard
deviations between the ratios The J=1J=2 peak ratios for the aqueous phases show no
significant difference within the pH 4 data as the GSH concentration is increased and
00
05
10
15
20
25
30
35
40
45
50
550 600 650 700
Emis
sio
n In
ten
sity
(au
) H
un
dre
ds
Wavelength (nm)
01 M GSH pH 4 Aq
03 M GSH pH 4 Aq
05 M GSH pH 4 Aq
05 M GSH pH 3 Aq
05 M GSH pH 2 Aq
00
02
04
06
08
10
12
14
550 600 650 700
Emis
sio
n In
ten
sity
(au
) H
un
dre
ds
Wavelength (nm)
01 M GSH pH 4 Org
03 M GSH pH 4 Org
05 M GSH pH 4 Org
05 M GSH pH 3 Org
05 M GSH pH 2 Org
145
the standard deviation is small (Table 48) however a significant difference is observed
between each of the pH values for the same buffer concentration 05 M which is again
consistent with the co-ordination mode of glutathione changing with pH Interestingly
under these experimental conditions the extraction of Eu3+
as the HDEHPDEHP
organic soluble complexes is not very efficient since the emission intensities are
unusually low This suggests that in the absence of competing Am3+
ions GSH is
interacting relatively strongly with the Eu3+
ion in aqueous solution
Table 48 J=1J=2 peak ratios and t-test results for Eu-DTPA at pH 2-4 as [GSH] is
varied
J=1J=2
[GSH] (M)
01 03 05 st dev t-test
pD 4 0202 0276 0247 0037 No sig diff
pD 3 - - 0100 - -
pD 2 - - 0500 - -
st dev - - 0202
t-test - - Sig diff
423 [Na5DTPA] Dependence at pH 4
4231 Aqueous Phase Studies
The [Na5DTPA] dependence study carried out at the INL was also repeated in
order to gain luminescence data for the experiment The conditions used were pH 4 05
M GSH and [Na5DTPA] concentrations ranging from 005 ndash 06 M The emission
spectra can be seen in Figure 422
146
Figure 422 Emission spectra of Eu(NO3)3 in D2O at pD 4 with 05 M GSH over a
Na5DTPA concentration range of 005 ndash 06 M following excitation at 397 nm
The emission intensity of the complex decreases as the concentration of
Na5DTPA is increased from 005 M to 06 M This is likely to be due to the introduction
of more O-H oscillators and therefore increased quenching as the Na5DTPA stock
solution is aqueous and there is no deuterated alternative available The emission
spectra in water do not show this decrease in intensity (Figure 423)
Figure 423 Emission spectra of Eu(NO3)3 in H2O at pH 4 with 05 M GSH over a
Na5DTPA concentration range of 005 ndash 06 M following excitation at 397 nm
0
5
10
15
20
25
30
35
550 600 650 700
Emis
sio
n In
ten
sity
(au
) x
10
00
0
Wavelength (nm)
005 M DTPA
01 M DTPA
02 M DTPA
03 M DTPA
04 M DTPA
05 M DTPA
06 M DTPA
0
2
4
6
8
10
12
14
16
550 600 650 700
Emis
sio
n In
ten
sity
(au
) x
10
00
0
Wavelength (nm)
005 M DTPA
01 M DTPA
02 M DTPA
03 M DTPA
04 M DTPA
05 M DTPA
06 M DTPA
147
Table 49 J=1J=2 peak ratios and t-test results for Eu-DTPA with 05 M GSH in
D2OH2O at pDpH 4 over a Na5DTPA concentration range of 005-06 M
J=1J=2
[Na5DTPA] (M)
005 01 02 03 04 05 06 stdev t-test
D2O 0437 0441 0431 0437 0428 0425 0403 0013
No sig
diff
H2O 0450 0440 0437 0449 0422 0424 0428 0011
No sig
diff
The J=1J=2 peak height ratios were recorded for each emission spectrum and t-
tests were carried out on the peak ratios using the t-test data analysis tool in Microsoft
Excel accounting for the standard deviations between the ratios The J=1J=2 peak
ratios show no significant difference for either the D2O or H2O samples as the
Na5DTPA concentration is increased (Table 49) suggesting that the co-ordination
mode of the DTPA does not change as the concentration is increased The luminescence
lifetimes of the samples show a decrease across the D2O samples as the concentration of
Na5DTPA increases This is consistent with the decreased emission intensity due to
greater quenching of the samples as more water is introduced However there is a slight
increase across the H2O samples as the holdback concentration increased as quenching
is reduced in these samples due to the chelating effect of the DTPA molecules therefore
the results obtained in water for this study are likely to be most accurate The lifetimes
and q values are tabulated in Table 410 Although the q values are likely to be
unreliable especially for the highest Na5DTPA concentrations it can be seen that there
is still approximately 1 H2O molecule in the inner hydration sphere of the complexes
consistent with [Eu(DTPA)]2-
formation again implying very little or weak binding
with GSH
148
Table 410 Luminescence lifetimes and q values for Eu-DTPA with 05 M GSH at pH
4 over a Na5DTPA concentration range of 005-06 M following excitation at 397 nm
[Na5DTPA]
(M)
τ D2O (μs) τ H2O (μs) q plusmn 02
005 1679 plusmn 3 652 plusmn 2 08
01 1549 plusmn 4 659 plusmn 2 10
02 1348 plusmn 4 666 plusmn 3 09
03 1179 plusmn 4 665 plusmn 3 08
04 1076 plusmn 4 674 plusmn 4 07
05 978 plusmn 4 698 plusmn 4 05
06 916 plusmn 5 714 plusmn 5 03
4232 Extraction Studies
Extractions were carried out on the samples using 02 M HDEHP in dodecane
for the organic phase The emission spectra of both the aqueous and organic phases
post-extraction can be seen in Figure 424
Figure 424 Emission spectra of aqueous and organic phases after Eu3+
extraction with
05 M GSH at pH 4 over a Na5DTPA concentration range of 005-06 M following
excitation at 397 nm
0
1
2
3
4
5
6
7
550 600 650 700
Emis
sio
n In
ten
sity
(au
) H
un
dre
ds
Wavelength (nm)
01 M DTPA Aq
03 M DTPA Aq
05 M DTPA Aq
01 M DTPA Org
03 M DTPA Org
05 M DTPA Org
149
As expected the extraction data show that the best Eu3+
extraction occurs with
01 M Na5DTPA the lowest concentration of holdback reagent and that very little
extraction occurs at 03 M and 05 M Na5DTPA under these conditions The J=1J=2
peak ratios for the aqueous phases show no significant difference as the Na5DTPA
concentration is increased (Table 411) Unfortunately here the extraction is too weak
and the emission intensity too low to obtain reliable J=1J=2 peak ratios for the organic
phase
Table 411 J=1J=2 peak ratios and t-test results for Eu3+
in the aqueous phase with 05
M GSH at pH 4 as [Na5DTPA] is varied after extraction with 02 M HDEHP
Na5DTPA (M) 01 03 05 st dev t-test
J=1J=2 0552 0578 0502 0039 No sig
diff
424 [HDEHP] Dependence at pH 4
An HDEHP concentration dependence study was carried out under the same
conditions as the study at INL 05 M GSH 03 M Na5DTPA pH 4 and an extractant
concentration range of 04-10 M HDEHP in dodecane Equilibration time was for 30
minutes The emission spectra of the phases after extraction can be seen in Figures 425
and 426
150
Figure 425 Emission spectra of aqueous phases after Eu3+
extraction with 05 M GSH
and 03 M Na5DTPA at pH 4 over an HDEHP concentration range of 02-10 M
following excitation at 397 nm
The J=1J=2 peak ratios for the aqueous phases show no significant difference as
the HDEHP concentration is increased (Table 412) as expected since the co-ordination
mode of the aqueous phase should be unaffected by the organic phase Unfortunately
again the extraction is too weak and the emission intensity too low to obtain reliable
J=1J=2 peak ratios for the organic phase
Table 412 J=1J=2 peak ratios and t-test results for Eu3+
in the aqueous phase with 05
M GSH and 03 M Na5DTPA at pH 4 as [HDEHP] is varied after extraction
HDEHP (M) 04 06 08 10 st dev t-test
J=1J=2 0472 0499 0455 0510 0025 No sig
diff
00
02
04
06
08
10
12
550 600 650 700
Emis
sio
n In
ten
sity
(au
) x
10
00
0
Wavelength (nm)
04 M HDEHP Aq
06 M HDEHP Aq
08 M HDEHP Aq
10 M HDEHP Aq
151
Figure 426 Emission spectra of organic phases after Eu3+
extraction with 05 M GSH
and 03 M Na5DTPA at pH 4 over an HDEHP concentration range of 02-10 M
following excitation at 397 nm
The lowest Eu3+
extraction is with 04 M HDEHP with better extraction at
higher HDEHP concentrations Although better extraction is obtained at higher
concentrations Am3+
is also extracted to a higher extent decreasing the separation
factor (Section 413)
43 Radiolysis Studies using GSH at pH 4
431 Aqueous Phase Studies
In order to determine how resistant the glutathione buffered system is to
radiolysis a selection of aqueous samples at pHpD 4 containing 05 M GSH and a
Na5DTPA concentration range of 005-06 M were irradiated at the Dalton Cumbrian
Facility using a 60
Co irradiator The samples were exposed to 7 kGy γ-radiation and
analysed by luminescence spectroscopy The emission spectra of the samples can be
seen in Figure 427
00
00
00
01
01
01
01
550 600 650 700
Emis
sio
n In
ten
sity
(au
) x
10
00
0
Wavelength (nm)
04 M HDEHP Org
06 M HDEHP Org
08 M HDEHP Org
10 M HDEHP Org
152
Figure 427 Emission spectra of Eu(NO3)3 in H2O at pH 4 with 05 M GSH over a
Na5DTPA concentration range of 005 ndash 06 M after irradiation with 7 kGy γ-radiation
following excitation at 397 nm
The spectra of the samples show a lower emission intensity after irradiation
(Figure 427) than beforehand (Figure 423) but the profile remains the same indicating
that the radiation has little or no degrading effect on the complex in the aqueous phase
The decreased intensity is likely to be due to increased quenching effects caused by
residual radicals present as a result of irradiating the solvent The J=1J=2 ratios and co-
ordination mode remained unchanged (Table 413) as did the luminescence lifetimes of
the samples and the q values (Table 414)
00
01
01
02
02
03
03
04
550 600 650 700
Emis
sio
n In
ten
sity
(au
) x
10
00
0
Wavelength (nm)
005 M DTPA
01 M DTPA
02 M DTPA
03 M DTPA
04 M DTPA
05 M DTPA
06 M DTPA
153
Table 413 J=1J=2 peak ratios and t-test results for Eu-DTPA with 05 M GSH in
D2OH2O at pDpH 4 over a Na5DTPA concentration range of 01-06 M after
irradiation with 7 kGy γ-radiation
[Na5DTPA] (M)
01 02 03 04 05 06 st
dev
t-test
J=1J=2 0477 0481 0452 0401 0407 0411 0036
No sig
diff
Table 414 Luminescence lifetimes and q values for Eu-DTPA with 05 M
GSH at pH 4 over a Na5DTPA concentration range of 01-06 M after irradiation with 7
kGy γ-radiation
[Na5DTPA] (M) τ H2O (μs) τ D2O (μs) q plusmn 02
01 648 plusmn 4 1895 plusmn 12 10
02 661 plusmn 6 1678 plusmn 10 09
03 670 plusmn 6 1536 plusmn 11 08
04 679 plusmn 5 1462 plusmn 9 07
05 701 plusmn 7 1328 plusmn 10 05
06 696 plusmn 6 1211 plusmn 8 03
432 Extraction Studies
Extractions were then carried out on a selection of the irradiated samples using
02 M HDEHP in dodecane with Eu3+
The resultant emission spectra of both the
aqueous and organic phases post-extraction can be seen in Figure 428
154
Figure 428 Emission spectra of aqueous and organic phases after Eu3+
extraction from
irradiated aqueous phase at pH 4 containing 05 M GSH over a Na5DTPA concentration
range of 01-06 M
As expected the extraction data show that the best Eu3+
extraction occurs with
01 M Na5DTPA the lowest concentration of holdback reagent and that very little
extraction occurs at 03 M and 05 M Na5DTPA under these conditions With the
exception of the 01 M Na5DTPA sample for which the extraction decreases after
irradiation the emission intensity remains relatively constant for each of the phases of
the samples after irradiation The J=1J=2 ratios and co-ordination mode for the aqueous
phase remained unchanged (Table 415) Again the extraction is too weak and the
emission intensity too low to obtain reliable J=1J=2 peak ratios for the organic phase
Table 415 J=1J=2 peak ratios and t-test results for Eu3+
in the aqueous phase with 05
M GSH and at pH 4 as [Na5DTPA] is varied after extraction with 02 M HDEHP in
dodecane from an aqueous phase irradiated at 7 kGy γ ndashradiation
Na5DTPA (M) 01 03 05 st dev t-test
J=1J=2 0505 0563 0551 0031 No sig diff
44 Luminescence Studies using GSH with Dy3+
As well as obtaining primary extraction data for GSH with Eu3+
under a variety
of conditions it is also important to consider the behaviour and extraction of other Ln3+
ions with the buffer in order to achieve effective lanthanide-actinide separation
0
1
2
3
4
5
6
7
8
9
10
550 600 650 700
Emis
sio
n In
ten
sity
(au
) Hu
nd
red
s
Wavelength (nm)
01 M DTPA Aq
03 M DTPA Aq
05 M DTPA Aq
01 M DTPA Org
03 M DTPA Org
05 M DTPA Org
155
Dysprosium(III) was chosen for a preliminary study as it is later in the lanthanide series
representing the heavier metal ions and how they may behave under such conditions
Also like Eu3+
it is emissive in the visible region of the electromagnetic spectrum and
so may be easily analysed by luminescence spectroscopy
441 Dy3+
Complexation Studies
Initial data were obtained for Dy3+
and emission spectra were recorded for the
free ion from Dy(NO3)3 Dy-DTPA (005 M Na5DTPA) and Dy(NO3)3 with GSH (05
M) all in aqueous solution (Figure 429) A concentration of 005 M Na5DTPA was
chosen for the dysprosium experiments as the emission intensity of Dy3+
is relatively
weak and this technique is not sensitive enough to observe any extraction of the metal
from high Na5DTPA concentrations
Figure 429 Emission spectra of Dy(NO3)3 (10 mM) Dy-DTPA (10 mM Dy(NO3)3
005 M Na5DTPA) and Dy(NO3)3 (10 mM) with GSH (05 M) in H2O following
excitation at 352 nm Note that the tail of ligand emission can be seen in the Dy DTPA
and Dy GSH solutions at shorter wavelengths
The spectra show that the emission intensity of the 7F92 rarr
6H152 and
7F92 rarr
6H132 transitions is slightly higher when GSH buffer is present in solution than for the
free ion alone and the intensity is much greater when Na5DTPA is present in the
solution showing formation of a Dy-DTPA complex Interestingly evidence for
binding of GSH and DTPA with Dy3+
is further manifested in the emission spectra by
the presence of residual ligand emission at higher energy These samples were then
00
02
04
06
08
10
12
14
16
425 475 525 575 625 675
Emis
sio
n In
ten
sity
(au
) x
10
00
0
Wavelength (nm)
Dy H2O
Dy DTPA
Dy GSH
7F92 rarr
6H152
7F92 rarr
6H132
156
extracted into an organic phase of 10 M HDEHP in dodecane (Figure 430) as 02 M
extractant was found to be too low to observe any Dy3+
extraction due to the overall
weak emission of the ion relative to Eu3+
Figure 430 Emission spectra of aqueous and organic phases of Dy(NO3)3 Dy-DTPA
and Dy(NO3)3 with GSH after extraction with 10 M HDEHP following excitation at
352 nm
The spectra show that without Na5DTPA present the Dy3+
is extracted into the
organic phase but for the Dy-DTPA complex little or no metal extraction is observed in
the absence of competitive binding with Am3+
This may indicate that the metal is not
being extracted into the organic phase and that the heavier lanthanides may suffer the
same kinetic issues present for amino acid buffers at higher pH (Section 332) or that
this technique is not sensitive enough to obtain good extraction data for less emissive
lanthanides
442 pH Dependence Studies
To attempt to determine whether kinetic issues arise for heavier lanthanides with
GSH buffer at higher pH values a pH study was carried out on Dy-DTPA systems
containing 005 M Na5DTPA and 05 M GSH over a pH range of 2-4 One sample
containing 03 M Na5DTPA was also measured analogous to the europium data sets
The extraction data can be seen in Figure 431
00
02
04
06
08
10
12
14
425 475 525 575 625 675
Emis
sio
n In
ten
sity
(au
) x
10
00
0
Wavelength (nm)
Dy H2O Aq
Dy DTPA Aq
Dy GSH Aq
Dy H2O Org
Dy DTPA Org
Dy GSH Org
157
Figure 431 Emission spectra of aqueous and organic phases of Dy(NO3)3 Dy-DTPA
and Dy(NO3)3 with GSH after extraction with 10 M HDEHP following 352 nm
excitation
The extraction is lowest for the sample with the highest Na5DTPA
concentration as would be expected As the pH increases the extraction of Dy3+
decreases suggesting that the same kinetic issues may also be present in for the GSH
system Further investigation using a more sensitive technique such as ICP-MS is
necessary to confirm this (Section 46)
45 Luminescence Studies using GSH with Mixed Ln3+
Systems at pH 4
The Dy3+
luminescence work was extended to solutions of a mixture of 4
luminescent lanthanide ions (Sm3+
Eu3+
Tb3+
and Dy3+
) to be able to probe the relative
extraction of different lanthanides from a mixture relevant to a real TALSPEAK type
process The spectra are colour coded to each ionrsquos luminescent colour under UV light
irradiation
451 Complexation Studies
Initial data were obtained for each lanthanide ion and emission spectra were
recorded for Ln(NO3)3 Ln-DTPA (005 M Na5DTPA) and Ln(NO3)3 with GSH (05
M) all in aqueous solution (Figures 432-434) analogous to the Dy3+
data
00
01
02
03
04
05
06
07
08
09
10
550 560 570 580 590
Emis
sio
n In
ten
sity
(au
) x 1
00
00
Wavelength (nm)
pH 2 Aq
pH 3 Aq
pH 4 Aq
pH 4 (03 M DTPA) Aq
pH 2 Org
pH 3 Org
pH 4 Org
pH 4 (03 M DTPA) Org
158
Figure 432 Emission spectra of Ln(NO3)3 (1 mM EuTbSm3+
10 mM Dy3+
) in H2O
at pH 4 following direct excitation (405 nm for Sm3+
397 nm for Eu3+
366 nm for Tb3+
and 352 nm for Dy3+
)
Figure 433 Emission spectra of Ln(NO3)3 (1 mM EuTbSm3+
10 mM Dy3+
) with
GSH (05 M) at pH 4 in H2O following direct excitation (405 nm for Sm3+
397 nm for
Eu3+
366 nm for Tb3+
and 352 nm for Dy3+
)
0
5
10
15
20
25
30
35
40
45
50
450 500 550 600 650 700 750
Emis
sio
n In
ten
sity
(au
) H
un
dre
ds
Wavelength (nm)
Sm
Eu
Tb
Dy
0
2
4
6
8
10
12
14
16
18
20
450 500 550 600 650 700 750
Emis
sio
n In
ten
sity
(au
) Th
ou
san
ds
Wavelength (nm)
Sm
Eu
Tb
Dy
159
Figure 434 Emission spectra of Ln-DTPA (1 mM EuTbSm3+
10 mM Dy3+
005 M
Na5DTPA) in H2O at pH 4 following direct excitation (405 nm for Sm3+
397 nm for
Eu3+
366 nm for Tb3+
and 352 nm for Dy3+
)
For all of the metal ions the emission intensity is greater in the sample with
GSH than for the free ions in solution due to reduced quenching by the presence of the
buffer The profiles of all of the spectra remain the same showing that although the
glutathione may be in exchange with surrounding water molecules a stable complex
between the buffer and metal ions is not being formed The emission intensity is much
greater for each of the metal ions with Na5DTPA due to the formation of a Ln-DTPA
complex in each case and the peak splitting observed for the Eu3+
complex can also be
seen for the Tb3+
complex as the emission spectra of these ions are more sensitive to
their co-ordination environment than Sm3+
or Dy3+
Table 416 Luminescence lifetimes for lanthanide samples at pH 4
Sample Lifetime (μs)
Sm(III) Eu (III) Tb(III) Dy (III)
Ln3+
341 plusmn 1 121 plusmn 25 394 plusmn 19 525 plusmn 1
Ln3+
with
GSH
686 plusmn 1 184 plusmn 8 558 plusmn 28 830 plusmn 1
Ln-DTPA 11 plusmn 1 671 plusmn 4 1930 plusmn 20 14 plusmn 1
0
1
2
3
4
5
6
7
450 500 550 600 650 700 750
Emis
sio
n In
ten
sity
(au
) x
10
00
0
Wavelength (nm)
Sm
Eu
Tb
Dy
160
The luminescence lifetimes of all the metal ions (Table 416) are in the expected
ranges for these ions in aqueous solutions and exhibit the same pattern as the emission
intensities increasing as GSH is added to the metal solutions and being greatest for the
Ln-DTPA complexes The q values were calculated for Eu3+
and Tb3+
as calculations of
q for Sm3+
and Dy3+
are unreliable and were as expected with a hydration number of
around 8 for the M3+
ion in solution co-ordination of around 5 for the M3+
ion with
GSH (consistent with the [GSH] dependence studies in Section 421) and 1 water
molecule bound to the Ln-DTPA complex
Table 417 Luminescence lifetimes and q values for Eu3+
and Tb3+
samples at pH 4
Sample Lifetime (μs) q
Eu (III)
H2O
Eu (III)
D2O
Tb(III)
H2O
Tb (III)
D2O
Eu(III) Tb(III)
Ln3+
121 plusmn 25 2309 plusmn 38 394 plusmn 19 1698 plusmn 16 82 82
Ln3+
with
GSH
184 plusmn 8 1658 plusmn 26 558 plusmn 28 1889 plusmn 12 52 53
Ln-DTPA 671 plusmn 4 2066 plusmn 15 1930 plusmn 20 3546 plusmn 27 09 09
452 pH Dependence Studies
As with the dysprosium study extractions were carried out on the mixed
lanthanide samples under the same conditions The aqueous phases contained 005 M
Na5DTPA and 05 M GSH over a pH range of 2-4 The emission spectra of each
aqueous sample before extraction were also recorded but were found to be the same for
each pH The luminescence lifetimes of the samples were also very similar (Table 418)
consistent with the Eu3+
data (Section 422) The q values for Eu3+
and Tb3+
are as
expected with 1 water molecule bound to each Ln-DTPA complex (Table 419) As a
representative example the spectra for the pH 4 sample can be seen in Figure 435
161
Figure 435 Emission spectra of Ln(NO3)3 (1 mM EuTbSm3+
10 mM Dy3+
) with
GSH (05 M) and Na5DTPA (005 M) following direct excitation (405 nm for Sm3+
397
nm for Eu3+
366 nm for Tb3+
and 352 nm for Dy3+
)
Table 418 Luminescence lifetimes for aqueous phases before extraction over a
pH range of 2-4
Sample Lifetime (μs)
Sm(III) Eu (III) Tb(III) Dy (III)
pH 2 12 plusmn 1 677 plusmn 9 1851 plusmn 21 14 plusmn 1
pH 3 12 plusmn 1 715 plusmn 9 1934 plusmn 21 13 plusmn 1
pH 4 12 plusmn 1 699 plusmn 7 1912 plusmn 26 14 plusmn 1
Table 419 Luminescence lifetimes and q values for Eu3+
and Tb3+
samples before
extraction over a pH range of 2-4
Sample Lifetime (μs) q
Eu (III)
H2O
Eu (III)
D2O
Tb(III)
H2O
Tb (III)
D2O
Eu(III) Tb(III)
pH 2 677 plusmn 9 2897 plusmn 27 1851 plusmn 21 3765 plusmn 31 09 10
pH 3 715 plusmn 9 3011 plusmn 13 1934 plusmn 21 3705 plusmn 22 08 09
pH 4 699 plusmn 7 3032 plusmn 15 1912 plusmn 26 3815 plusmn 16 09 10
00
10
20
30
40
50
60
70
450 500 550 600 650 700 750
Emis
sio
n In
ten
sity
(au
) x
10
00
0
Wavelength (nm)
Sm
Eu
Tb
Dy
162
The spectra for the aqueous and organic phases after extraction with 10 M
HDEHP in dodecane (in order to ensure sufficient enough extraction to be observed by
this technique) are plotted in Figures 436-438
Figure 436 Emission spectra of aqueous and organic phases of Ln3+
with 05 M GSH
and 005 M Na5DTPA after extraction with 10 M HDEHP at pH 2 following direct
excitation (405 nm for Sm3+
397 nm for Eu3+
366 nm for Tb3+
and 352 nm for Dy3+
)
Figure 437 Emission spectra of aqueous and organic phases of Ln3+
with 05 M GSH
and 005 M Na5DTPA after extraction with 10 M HDEHP at pH 3 following direct
excitation (405 nm for Sm3+
397 nm for Eu3+
366 nm for Tb3+
and 352 nm for Dy3+
)
00
05
10
15
20
25
30
450 500 550 600 650 700 750
Emis
sio
n In
ten
sity
(au
) x
10
00
0
Wavelength (nm)
Sm Aq
Eu Aq
Tb Aq
Dy Aq
Sm Org
Eu Org
Tb Org
Dy Org
00
05
10
15
20
25
30
450 500 550 600 650 700 750
Emis
sio
n In
ten
sity
(au
) x
10
00
0
Wavelength (nm)
Sm Aq
Eu Aq
Tb Aq
Dy Aq
Sm Org
Eu Org
Tb Org
Dy Org
163
Figure 438 Emission spectra of aqueous and organic phases of Ln3+
with 05 M GSH
and 005 M Na5DTPA after extraction with 10 M HDEHP at pH 4 following direct
excitation (405 nm for Sm3+
397 nm for Eu3+
366 nm for Tb3+
and 352 nm for Dy3+
)
At all three pH values the order of extractability is Sm gt Eu gt Tb gt Dy
showing that the heavier lanthanides are the most difficult to extract The above data
demonstrate that extraction of Ln3+
is reasonably good at pH 2 and 3 but slightly lower
at pH 3 However at pH 4 extraction of all lanthanide ions is drastically reduced
particularly for Tb3+
and Dy3+
which have very low relative concentrations in the
organic phase Although the extraction of Sm3+
and Eu3+
is also greatly reduced there is
still some extraction of these metals into the organic phase This is consistent with the
previously obtained dysprosium results suggesting that there may be kinetic issues
present for heavier lanthanides at high pH The trend in relative extraction efficiency of
the Ln3+
ions approximately follows the relative stability constants of GSH-Ln
complexes Lighter Ln-GSH complexes are less stable an effect of charge density of the
Ln3+
cations so are extracted more efficiently This was investigated further by ICP-
MS
46 ICP-MS Studies with GSH
In order to determine whether a TALSPEAK type system using glutathione as a
buffer had the same kinetic issues as the amino acid systems whereby poor separation of
the heavier lanthanides was observed ICP-MS was carried out on extracted samples
containing 10 lanthanides (La-Ho with the exception of Pm) at pH 2 3 and 4 to
00
05
10
15
20
25
30
35
450 500 550 600 650 700 750
Emis
sio
n In
ten
sity
(au
) x
10
00
0
Wavelength (nm)
Sm Aq
Eu Aq
Tb Aq
Dy Aq
Sm Org
Eu Org
Tb Org
Dy Org
164
determine the distribution pattern of the series using GSH as a buffer The DLn values
can be seen in Figures 439 and 440 for the pH 2 and pH 3 data sets
Figure 439 DLn for varying GSH concentration at pH 2 with 005 M Na5DTPA after
extraction with 02 M HDEHP in dodecane
Figure 440 DLn for varying GSH concentration at pH 3 with 005 M Na5DTPA after
extraction with 02 M HDEHP in dodecane
0
5
10
15
20
25
30
35
40
56 57 58 59 60 61 62 63 64 65 66 67 68
Dis
trib
uti
on
Rat
io
Atomic Number
01 M GSH
02 M GSH
03 M GSH
04 M GSH
05 M GSH
Am3+
0
5
10
15
20
25
30
35
56 57 58 59 60 61 62 63 64 65 66 67 68
Dis
trib
uti
on
Rat
io
Atomic Number
01 M GSH
02 M GSH
03 M GSH
04 M GSH
05 M GSH
Am3+
165
The data set for pH 2 resembles a typical TALSPEAK curve as also
demonstrated by amino acids at pH 2 (Section 3) However at pH 3 the distribution of
the metal ions continues to decrease across the lanthanide series indicating that higher
pH is less favourable for extraction of the heavier lanthanides This may be explained
by the fact that the stability of Ln-GSH complexes is lower at lower pH values making
the metal ions easier to extract The analysis was also repeated for samples at pH 4 but
for some of the later lanthanides in the series the quantity of metal ion present was
below the limit of detection of the technique (004 ng mL-1
) so the data could not
accurately be plotted Corresponding separation factors can be seen in Table 420 and
plotted in Appendix 2 (for pH 2 and 3) Separation factors for all lanthanides are fairly
low at pH 2 compared to the original TALSPEAK process (SFEuAm = 91) The data also
show that for the earlier lanthanides as the pH is increased very high separation factors
can be achieved but separation is much lower for later lanthanides with increasing pH
This indicates that unfortunately the same kinetic issues are likely to be a problem at
higher pH for the glutathione buffered system as for the amino acid systems
166
Table 420 SFLnAm for varying GSH concentration over a pH range of 2-4 with
005 M Na5DTPA after extraction with 02 M HDEHP in dodecane
pH
[GSH]
(M)
SF
La Ce Pr Nd Sm Eu Gd Tb Dy Ho
2 01 234 171 148 107 136 158 216 222 237 234
2 02 244 176 145 103 134 146 215 229 239 244
2 03 263 183 145 105 137 165 243 244 281 289
2 04 239 170 151 111 145 168 218 237 259 265
2 05 278 197 164 117 162 189 257 269 300 314
3 01 1735 972 477 276 163 104 112 53 41 38
3 02 1953 841 433 256 320 266 290 130 89 77
3 03 1898 785 388 220 152 90 95 39 28 24
3 04 2046 812 412 243 196 121 126 53 38 34
3 05 2145 705 312 139 36 16 20 04 02 00
4 01 3777 141 12 - - - - - - -
4 02 5548 231 36 06 - - - - - -
4 03 2768 239 27 - - - - - - -
4 04 1620 150 21 01 - - - - - -
4 05 1589 286 48 11 - - - - - -
47 1H NMR Studies on GSH Systems
The glutathione systems were additionally studied by 1H NMR spectroscopy in
order to confirm the complexation observed by luminescence spectroscopy Spectra
were recorded in D2O for GSH GSH after irradiation Eu(NO3)3 with GSH (150)
Na5DTPA with GSH (110) and Eu-DTPA with GSH (1550
Eu(NO3)3Na5DTPAGSH) (Figures 441 a-e)
167
GSH0011resp
45 40 35 30 25 20 15 10
Chemical Shift (ppm)
0
005
010
Norm
alized Inte
nsity
197201200100200099
c
d
gb
i
f
44
944
844
6
38
9
37
637
437
2
28
628
628
528
4
24
924
824
724
624
524
4
21
120
920
720
5
GSH Irradiated0011resp
45 40 35 30 25 20 15 10
Chemical Shift (ppm)
0
005
010
015
020
025
Norm
alized Inte
nsity
133151244272014101206498131111059100
m
c
d
n
g
q
b
l
i
p
f
47
0
44
7 44
544
442
942
841
641
541
140
940
940
738
137
737
537
3
36
736
6
29
929
728
428
328
1
26
7
24
6
24
424
324
223
823
022
822
6
20
720
520
419
6
19
519
419
319
1
a
b
168
Eu GSH0011resp
45 40 35 30 25 20 15 10
Chemical Shift (ppm)
005
010
015
Norm
alized Inte
nsity
035183050206177050088216024026100
d
g
b
i
f
c
45
044
844
7
42
0 41
841
741
341
241
138
0 37
837
737
136
9 30
230
1
28
928
728
628
428
328
1
25
124
924
724
624
424
2 23
3 23
122
921
020
820
720
519
919
819
719
6
GSH DTPA0011resp
45 40 35 30 25 20 15 10
Chemical Shift (ppm)
0
005
010
015
Norm
alized Inte
nsity
032158045179156092075366021025099
c
d
g
DTPA
DTPA
DTPA
b
DTPA
i
f
45
044
9 44
744
6
41
941
841
741
241
141
0
37
937
737
537
036
8
34
133
633
5
30
730
530
1
28
928
628
528
428
228
0
25
024
824
624
524
324
1 23
223
022
821
020
820
620
419
719
5
c
d
169
EuDTPA GSH0011resp
45 40 35 30 25 20 15 10
Chemical Shift (ppm)
0
0005
0010
0015
0020
0025
0030
0035
0040
0045
0050
0055
Norm
alized Inte
nsity
180181200200212103673021100
47
0
44
244
1
38
4
36
836
3
32
832
0 30
230
129
9 28
628
528
328
1
24
724
624
524
424
3
20
820
720
520
3
Figure 441 1H NMR spectra for GSH in D2O under a range of conditions at 298 K a)
GSH b) GSH after irradiation with 7 kGy γ-radiation c) Eu(NO3)3 with GSH d) GSH
with Na5DTPA e) Eu-DTPA with GSH
Figure 442 1H
1NMR proton assignments for GSH (top) and γ-Glu-Cys (bottom)
It can be seen from spectra ldquoardquo and ldquobrdquo that there is some degradation of GSH
after irradiation with 7 kGy γ-radiation from a 60
Co irradiator shown by the presence of
e
170
γ-Glu-Cys fragments12
(Figure 442) The buffer seems to be susceptible to γ-radiolysis
and the integration ratios show that the γ-Glu-Cys fragments are present in a significant
quantity as the ratios are comparable to those of the intact GSH Spectrum ldquocrdquo shows
that the buffer does not form a stable complex with Eu3+
as there is only slight shifting
of the peaks indicating weak interaction and perhaps fast dynamic exchange on the
timescale of the NMR experiment There is also no notable paramagnetic broadening as
would be expected if a Eu3+
complex is formed Spectrum ldquoerdquo does show slight
paramagnetic broadening relative to spectrum ldquodrdquo (Na5DTPA with GSH) confirming
the formation of the Eu-DTPA complex seen in previous emission spectra (Section
422)
48 Summary and Conclusion of Glutathione Work
Since amino acids have not been shown to act as holdback reagents by
themselves the potential of using the tripeptide L-glutathione was investigated Initial
separation studies were carried out using glutathione at pH 4 as is was anticipated that
based on its pKa values glutathione would be most likely to act as a successful
holdback reagent at this pH despite the unfavourable increase of pH Preliminary
investigations found that like amino acids GSH is ineffective as a holdback reagent on
its own as there was no separation observed between Eu3+
and Am3+
when used without
Na5DTPA
Subsequent investigations were carried out using GSH alongside Na5DTPA to
determine whether separation was improved with the tripeptide buffer At pH 2 and pH
3 it was found that the glutathione acts solely as a buffer as the separation factor in each
case was independent of GSH concentration However at pH 4 separation between
Eu3+
and Am3+
was found to increase as the buffer concentration was increased
suggesting that the glutathione is interacting with the Ln-DTPA complexes at this pH
This could be explained by the increase in stability of Ln-GSH complexes as the pH is
increased A buffer concentration of 05 M was then used for all further optimisation
experiments
At 05 M GSH the separation factor was found to increase dramatically as a
function of Na5DTPA concentration up to 03 M Na5DTPA After this peak there was
a rapid decrease in separation as the concentration is increased further up to 06 M
Na5DTPA as the stoichiometry is close to 11 GSHDTPA The separation factors
achieved here were extremely high (~1000) ndash a factor of 10 higher than the current
171
TALSPEAK system and the optimised alanine system whilst still maintaining low Am3+
extraction
At 03 M Na5DTPA the separation factor then increased as the extractant
concentration was increased from 02 to 04 M HDEHP in dodecane after which the SF
began to decrease again with the optimum separation at 04 M giving a SF of 1238 At
04 M Na5DTPA however the separation factor decreases rapidly as the extractant
concentration is increased due to the DAm increasing by a factor of 1000 consistent with
the complexant and buffer possibly forming some kind of adduct which no longer
successfully holds back Am3+
at higher Na5DTPA concentrations
Luminescence experiments mimicking the separation studies showed that the
glutathione does not form a stable complex with the Eu3+
ion and is in exchange with
surrounding solvent molecules even at the highest buffer concentrations preventing the
GSH from acting as a holdback reagent and allowing extraction of the metal into the
organic phase Proton NMR spectroscopy confirmed that although the glutathione may
be in exchange with surrounding water molecules no stable complexes between the
buffer and metal ions are formed (Appendix 8)
In samples containing Na5DTPA a Eu-DTPA complex can be clearly observed
in the emission spectra with or without the presence of GSH over a pH range of 2-4
The J=1J=2 peak ratios showed that there is no change in the co-ordination mode of the
buffer to the metal ion as the concentration of GSH is increased for each pH However
across the data sets the co-ordination mode of glutathione was found to be different at
different pH values as expected based on pKa values and increasing stability constant
with pH
At 05 M GSH the co-ordination mode of the Eu-DTPA complex in the aqueous
phase was found not to change as [Na5DTPA] was changed with metal extraction
typically decreasing as the holdback reagent increases and at 03 M Na5DTPA with 05
M GSH extraction was found to increase as HDEHP concentration increased as
expected Unfortunately luminescence spectroscopy does not seem to be a sensitive
enough technique to gain much information from samples post-extraction using these
conditions
In order to determine how resistant the glutathione buffered system is to
radiolysis a selection of samples were irradiated with 7 kGy γ-radiation and analysed
by luminescence and 1H NMR spectroscopies The radiation was seen to have some
degrading effect on the buffer in the aqueous phase with slightly decreased
luminescence emission intensity of complexes post-irradiation and evidence of
172
significant quantities of γ-Glu-Cys fragments present in the 1H NMR spectrum
However the emission profiles co-ordination mode and luminescence lifetimes of the
samples remained unchanged Extraction also seemed to be unaffected with the
emission remaining relatively constant for each of the phases of the samples after
irradiation
Initial data obtained on the glutathione system with europium(III) and
americium(III) seemed promising as after optimisation very high separation factors
were achieved and despite the buffer being susceptible to radiolysis extraction of
lanthanide ions was still high after irradiation However in order to be a successful
alternative to the current TALSPEAK system it is essential that effective separation of
all lanthanides from MA3+
can occur Further luminescence experiments were carried
out firstly on an analogous dysprosium system in order to represent heavier lanthanide
elements followed by a mixture of 4 lanthanide metals in the same samples
For the dysprosium study as the pH was increased from 2-4 the extraction of
Dy3+
decreased suggesting that the same kinetic issues noted for heavier lanthanides in
the amino acid systems may also be present for the GSH system at higher pH values In
the mixed samples the same pattern was observed with extraction of Ln3+
decreasing as
pH was increased At pH 4 extraction of all lanthanide ions was very low particularly
for Tb3+
and Dy3+
which are both heavier than Sm3+
and Eu3+
ICP-MS was carried out
on a series of samples containing a mixture of 10 lanthanides in order to confirm
whether the heavier lanthanides are in fact subject to kinetic issues with GSH
ICP-MS data was consistent with the luminescence data showing decreased
extraction of heavier lanthanides as pH increases from 2 to 4 The quantity of metal
extracted was so low it was below the limit of detection for some of the heavier metals
at pH 4 forcing the conclusion that unfortunately the same kinetic issues are a problem
at higher pH for the glutathione buffered system as for the amino acid systems Further
optimisation of the system to exploit the combined liquid-liquid extraction efficiencies
as a function of atomic number may allow the development of an extraction process of
lighter over heavier lanthanides for rare earth recycling which is currently a
strategically important goal13
173
1 ImmuneHealthSciencecom What Glutathione (GSH) is and how it affects your
immune health httpwwwimmunehealthsciencecomglutathionehtml 2015
2 ME Sears Scientific World Journal 2013 2013 219840
3 L Patrick Mercury toxicity and antioxidants Part I Role of glutathione and alpha-
lipoic acid in the treatment of mercury toxicity Alternative Medicine 2002
4 EA Bump and JM Brown Pharmacol Ther 1990 47 1 117-136
5 JB Mitchell and A Russo Br J Cancer 1987 55 Suppl VIII 96-104
6 VV Nikonorov J Anal Chem 2010 65 4 359-365
7 A Miličević and N Raos Acta Chim Slov 2014 61 904-908
8 BS Garg BK Singh DN Kumar and PK Sing Indian J Chem 2003 42A 79-83
9 Sigma Aldrich Product Information
httpwwwsigmaaldrichcometcmedialibdocsSigma-AldrichProduct_Information_
Sheetg4251pisPar0001Filetmpg4251pispdf
10 SJA Pope BP Burton-Pye R Berridge T Khan PJ Skabara and S Faulkner
Dalton Trans 2006 2907-2912
11 TS Grimes MP Jensen L Debeer-Schmidt K Littrell and KL Nash J Phys
Chem B 2012 116 46 13722-13730
12 RJ Hopkinson PS Barlow CJ Schofield and TDW Claridge Org Biomol
Chem 2010 8 4915-4920
13 LS Natrajan and MH Langford Paden f-Block Elements Recovery in A Hunt ed
Element Recovery and Sustainability RSC 2013 6 140-184
174
5 MODIFIED DTPA LIGANDS AS COMBINED BUFFERS AND SOFT
DONORS IN A TALSPEAK SYSTEM
Amino acids and the tripeptide L-glutathione have been shown not to be suitable
as a combined buffer and soft-donor for potential replacement of DTPA
(diethylenetriaminepentaacetic acid) and the lactate buffer used in the TALSPEAK
process (Trivalent Actinide Lanthanide Separation by Phosphorus reagent Extraction
from Aqueous Complexation) an advanced reprocessing technique currently being
developed in the USA They do not act as holdback reagents in their own right as they
do not bind preferentially to minor actinide (MA3+
) over lanthanide (Ln3+
) ions
preventing enhanced selective extraction of Ln3+
by HDEHP (di-
(2ethylhexyl)phosphoric acid) into an organic phase The possibility of synthesising a
combined buffer and soft-donor with DTPA and amino acid functionality was therefore
considered
By incorporating additional soft donors onto the DTPA structural framework
from amino acids the overall system would be simplified to just two components rather
than three This could be achieved by incorporating an amino acid or other soft donor
compounds into the DTPA scaffold itself (Figure 51) This strategy may increase the
complexation affinity binding constants and associated thermodynamic parameters to
the MA3+
ion improving the separation and slowing down the kinetics of the exchange
processes if the ligand has a significant specificity for MA3+
over Ln3+
This is
especially true if two of the carboxylic acid moieties are replaced by relatively softer
donors here amide groups
A report on bis(methionine)-appended DTPA was published by Hazari et al in
2010 on the use of Tc-DTPA-bis(methionine) in tumour imaging1 however there are no
literature reports on the synthesis or use of amino acid appended or any modified DTPA
ligands for solvent extraction and separation studies
The work described in this chapter was performed in collaboration with an
MChem student a summer student and the Institute for Waste disposal (INE)
Karlsruhe Germany The initial ligand syntheses were carried out jointly between
myself and the MChem student and all luminescence analysis was performed jointly
The refining of the syntheses and characterisation of the ligands was carried out by a
summer student All separation work using the ligands was carried out by colleagues at
INE
175
Figure 51 General structure of DTPA-amino acid ligands
51 Ligand Synthesis and Characterisation
A route for the synthesis of DTPA-bis(amino acids) was devised involving ring
opening of the anhydride of DTPA with an amine group of the amino acid in question
whereby the amino acid is incorporated onto two of the side arms of the DTPA
according to Scheme1234
Initially the reaction was attempted using the acid forms of
the amino acid L-alanine however the reaction was found to be unsuccessful since only
an amino acid dimer could be isolated In order to allow optimisation of the reaction
conditions whilst avoiding competitive side reactions the reactions were repeated using
the methyl or ethyl ester protected forms of the amino acids Here commercially
available methyl esters of L-alanine L-arginine and L-histidine and the ethyl ester of L-
serine were used The amide coupling reactions with these amino acid derivatives using
triethylamine as the base proceeded in high yield However isolation and purification of
the products was found to be quite difficult as the reaction products are very
hygroscopic and stubbornly retain residual triethylamine salts Therefore the relatively
impure ligands were isolated for further studies following multiple re-precipitations and
re-crystallisation All the ligands were characterised by 1H NMR spectroscopy
MALDI-MS and elemental analysis (Section 742)
Scheme 1 Synthesis of DTPA-bis(amino) alkyl esters
Protected
Protected Protected
176
52 Luminescence Studies on Ligand Systems at pH 2 3 and 4
521 Aqueous Phase Studies
The DTPA-amino acid ligands synthesised were studied by luminescence
spectroscopy in a TALSPEAK type system The ligands self-buffer at approximately
pH 2 at 50 mM concentration but to ensure consistency in studies the pH of systems
were adjusted to exact pH values (plusmn 01) Aqueous phases were prepared containing 50
mM ligand and 1 mM Eu(NO3)3 at pHpD 2 3 and 4 for each of the four synthesised
ligands Samples were measured in D2O and H2O The emission spectra of the D2O
samples can be seen in Figures 52-54 The spectra for the samples in H2O are identical
but with lower relative emission intensities
Figure 52 Emission spectra of Eu(NO3)3 with DTPA-bis(amino ester) ligands in D2O
at pD 2 following excitation at 397 nm
0
5
10
15
20
25
30
35
550 575 600 625 650 675 700
Emis
sio
n In
ten
sity
(au
) x
10
00
0
Wavelength (nm)
Ala-DTPA
Arg-DTPA
His-DTPA
Ser-DTPA
177
Figure 53 Emission spectra of Eu(NO3)3 with DTPA-bis(amino ester) ligands in D2O
at pD 3 following excitation at 397 nm
Figure 54 Emission spectra of Eu(NO3)3 with DTPA-bis(amino ester) ligands in D2O
at pD 4 following excitation at 397 nm
The emission spectra are all very similar and show clear complexation of the
Eu3+
ion with each ligand There is little difference in emission intensity and form of the
spectra across all of the samples which indicates that all of the ligands present the same
coordination environment to the Eu3+
centre as expected
Table 51 J=1J=2 peak ratios and t-test results for Eu- DTPA-bis(amino ester)
complexes at pD 2-4
0
5
10
15
20
25
30
35
550 575 600 625 650 675 700
Emis
sio
n In
ten
sity
(au
) x
10
00
0
Wavelength (nm)
Ala-DTPA
Arg-DTPA
His-DTPA
Ser-DTPA
0
5
10
15
20
25
30
550 575 600 625 650 675 700
Emis
sio
n In
ten
sity
(au
) x
10
00
0
Wavelength (nm)
Ala-DTPA
Arg-DTPA
His-DTPA
Ser-DTPA
178
DTPA-
(AlaOMe)2
DTPA-
(ArgOMe)2
DTPA-
(HisOMe)2
DTPA-
(SerOEt)2
st dev t-test
pD 2 0359 0381 0404 0353 0023
No sig
diff
pD 3 0394 0425 0417 0381 0020
No sig
diff
pD 4 0391 0427 0432 0423 0019
No sig
diff
st dev 0019 0026 0014 0035
t-test No sig
diff
No sig
diff
No sig
diff
No sig
diff
The J=1J=2 peak height ratios were recorded for each emission spectrum and t-
tests were carried out on the peak ratios using the t-test data analysis tool in Microsoft
Excel accounting for the standard deviations between the ratios (Table 51) For each
data set the range in the ratios is small and there is no significant difference between
the values again suggesting that the co-ordination mode of the each of the ligands to the
metal ion is the same Across the data sets unlike the glutathione system (Chapter 4)
no significant difference was observed either as pD increases from pD 2 to pD 4
indicating that the co-ordination mode of the complexes is not changing with pH
The luminescence lifetimes of each sample were recorded in H2O and D2O in
order to determine the q value of the complexes using the modified Horrocks equation
(Equation 110) These results are summarised in Table 52
179
Table 52 Luminescence lifetimes and q values for Eu-DTPA-bis(amino ester)
complexes at pD 2-4 recorded at the emission maximum (617 nm) following 397 nm
excitation
pH amp Ligand τ D2O (μs) τ H2O (μs) q plusmn 02
pH 2 DTPA-(AlaOMe)2 1794 plusmn 7 587 plusmn 8 09
pH 2 DTPA-(ArgOMe)2 1828 plusmn 12 626 plusmn 10 08
pH 2 DTPA-(HisOMe)2 1816 plusmn 10 614 plusmn 9 09
pH 2 DTPA-(SerOEt)2 1759 plusmn 9 563 plusmn 11 10
pH 3 DTPA-(AlaOMe)2 1981 plusmn 12 587 plusmn 11 10
pH 3 DTPA-(ArgOMe)2 2335 plusmn 16 604 plusmn 12 10
pH 3 DTPA-(HisOMe)2 1963 plusmn 8 607 plusmn 13 09
pH 3 DTPA-(SerOEt)2 1839 plusmn 13 588 plusmn 12 09
pH 4 DTPA-(AlaOMe)2 1908 plusmn 17 608 plusmn 11 09
pH 4 DTPA-(ArgOMe)2 1907 plusmn 13 601 plusmn 17 09
pH 4 DTPA-(HisOMe)2 1905 plusmn 14 604 plusmn 15 09
pH 4 DTPA-(SerOEt)2 1890 plusmn 10 609 plusmn 16 09
All of the complexes have approximately 1 water molecule in the inner
hydration sphere This is consistent with the formation of a Eu-DTPA-amide ligand
complex The values are generally slightly less than 1 in contrast to [Eu-DTPA]2-
itself
where q = 11 indicating the likely fast exchange of the bound water molecule with
other surrounding water molecules and that the amino ester appendage may inhibit the
close approach of more than one water molecule due to steric reasons
522 Extraction Studies
Extractions were carried out on the samples using 06 M HDEHP in dodecane
for the organic phase The emission spectra of both the aqueous and organic phases
post-extraction can be seen in Figures 55-58
180
Figure 55 Emission spectra of aqueous phases after Eu3+
extraction from an aqueous
phase containing DTPA-bis(amino ester) ligands (50 mM) at pH 2 following excitation
at 397 nm
Figure 56 Emission spectra of aqueous and organic phases after Eu3+
extraction from
an aqueous phase containing DTPA-bis(amino ester) ligands (50 mM) at pH 2
following excitation at 397 nm
0
0
0
0
0
1
1
550 575 600 625 650 675 700
Emis
sio
n In
ten
sity
(au
) Th
ou
san
ds
Wavelength (nm)
Ala-DTPA Aq
Arg-DTPA Aq
His-DTPA Aq
Ser-DTPA Aq
0
10
20
30
40
50
60
70
550 575 600 625 650 675 700
Emis
sio
n In
ten
sity
(au
) Th
ou
san
ds
Wavelength (nm)
Ala-DTPA Aq Arg-DTPA Aq His-DTPA Aq Ser-DTPA Aq Ala-DTPA Org Arg-DTPA Org His-DTPA Org Ser-DTPA Org
181
Figure 57 Emission spectra of aqueous and organic phases after Eu3+
extraction from
an aqueous phase containing DTPA-bis(amino ester) ligands (50 mM) at pH 3
following excitation at 397 nm
Figure 58 Emission spectra of aqueous and organic phases after Eu3+
extraction from
an aqueous phase containing DTPA-bis(amino ester) ligands (50 mM) at pH 4
following excitation at 397 nm
0
2
4
6
8
10
12
550 575 600 625 650 675 700
Emis
sio
n In
ten
sity
(au
) x
10
00
0
Wavelength (nm)
Ala-DTPA Aq Arg-DTPA Aq His-DTPA Aq Ser-DTPA Aq Ala-DTPA Org Arg-DTPA Org His-DTPA Org Ser-DTPA Org
0
1
2
3
4
5
6
7
550 575 600 625 650 675 700
Emis
sio
n In
ten
sity
(au
) x
10
00
0
Wavelength (nm)
Ala-DTPA Aq
Arg-DTPA Aq
His-DTPA Aq
Ser-DTPA Aq
Ala-DTPA Org
Arg-DTPA Org
His-DTPA Org
Ser-DTPA Org
182
The Eu-HDEHP complex formed in the organic phase has different symmetry to
Eu-DTPA complexes in the aqueous phase as can be seen be the different profile of the
emission spectra of the organic phases The extraction data show that the best Eu3+
extraction occurs at pH 2 under these conditions as there is complete metal extraction
into the organic phase for all of the ligands and very little or no metal remaining in the
aqueous phase Above pH 2 the extraction of Eu3+
decreases leaving some of the metal
ion in the aqueous phase at pH 3 and an even higher proportion at pH 4 At pH 3
extraction is relatively higher with the DTPA-(SerOEt)2 ligand than any of the other
ligands and at pH 4 extraction is higher with DTPA-(HisOMe)2 and DTPA-(ArgOMe)2
The J=1J=2 peak ratios for the organic phases (Table 53) show no significant
difference in co-ordination mode within the pH 2 or pH 4 data for each ligand however
the co-ordination can be seen to change slightly with each ligand at pH 3 Also no
significant difference is observed as pH is changed for DTPA-(ArgOMe)2 and DTPA-
(AlaOMe)2 however there is a significant difference observed for DTPA-(SerOEt)2 and
DTPA-(HisOMe)2 as pH is changed Each emission spectrum was recorded 5 times and
an average taken and repeat measurements were also taken so whilst the data is
reproducible it appears to be inconsistent and difficult to explain without further
investigation into the co-ordination environment at different pH values by means other
than luminescence spectroscopy although it can be seen that pH 2 is optimum for
extraction using these ligands
Table 53 J=1J=2 peak ratios and t-test results for organic phases after extraction after
Eu3+
extraction aqueous phases containing DTPA-bis(amino ester) ligands (50 mM) at
pH 2-4
DTPA-
(AlaOMe)2
DTPA-
(ArgOMe)2
DTPA-
(HisOMe)2
DTPA-
(SerOEt)2
st dev t-test
pH 2 0208 0207 0198 0208 0005 No sig diff
pH 3 0210 0213 0311 0347 0069 Sig diff
pH 4 0182 0210 0206 0205 0013 No sig diff
st dev 0016 0003 0063 0081
t-test No sig diff No sig diff Sig diff Sig diff
183
53 Radiolysis Studies on Ligand Systems at pH 2
531 Aqueous Phase Studies
In order to determine how resistant the ligand are to radiolysis a selection of
samples at pHpD 2 containing 50 m M ligand and 1 mM Eu(NO3)3 were irradiated at
the Dalton Cumbrian Facility using a 60
Co irradiator The samples were exposed to 7
kGy γ-radiation and analysed by luminescence spectroscopy The emission spectra of
the D2O samples can be seen in Figure 59 The spectra for the samples in H2O are the
same but with lower emission intensity
Figure 59 Emission spectra of Eu(NO3)3 in D2O with DTPA-bis(amino ester) ligands
(50 mM) at pH 2 after irradiation with 7 kGy γ-radiation and following excitation at
397 nm
The spectra of the samples are the same after irradiation as beforehand
indicating that the radiation has little or no degrading effect on the complexes in the
aqueous phase The J=1J=2 ratios and co-ordination mode remained unchanged (Table
54) as do the luminescence lifetimes and q values of the samples (Table 55)
0
5
10
15
20
25
30
35
550 575 600 625 650 675 700
Emis
sio
n In
ten
sity
(au
) Th
ou
san
ds
Wavelength (nm)
Ala-DTPA
Arg-DTPA
His-DTPA
Ser-DTPA
184
Table 54 J=1J=2 peak ratios and t-test results for Eu-DTPA-bis(amino ester)
complexes at pD 2 after irradiation with 7 kGy γ-radiation
DTPA-
(AlaOMe)2
DTPA-
(ArgOMe)2
DTPA-
(HisOMe)2
DTPA-
(SerOEt)2 st dev t-test
J=1J=2 0357 0395 0412 0362 0026 No sig
diff
Table 55 Luminescence lifetimes and q values for Eu-DTPA-bis(amino ester)
complexes at pD 2-4 after irradiation with 7 kGy γ-radiation
Ligand τ D2O (μs) τ H2O (μs) q plusmn 02
DTPA-(AlaOMe)2 1818 plusmn 7 613 plusmn 8 09
DTPA-(ArgOMe)2 1843 plusmn 12 586 plusmn 10 10
DTPA-(HisOMe)2 1803 plusmn 10 629 plusmn 9 08
DTPA-(SerOEt)2 1809 plusmn 9 598 plusmn 11 09
532 Extraction Studies
Extractions were then carried out on some of the irradiated samples using 06 M
HDEHP in dodecane The emission spectra of both the aqueous and organic phases
post-extraction can be seen in Figure 510
Figure 510 Emission spectra of aqueous and organic phases after Eu3+
extraction from
an irradiated (7 kGy γ-radiation) aqueous phase containing DTPA-bis(amino ester)
ligands (50 mM) at pH 2 following excitation at 397 nm
0
1
2
3
4
5
6
550 575 600 625 650 675 700
Emis
sio
n In
ten
sity
(au
) Th
ou
san
ds
Wavelength (nm)
Ala-DTPA Aq Arg-DTPA Aq His-DTPA Aq Ser-DTPA Aq Ala-DTPA Org Arg-DTPA Org His-DTPA Org
185
The emission profiles of the samples are the same after irradiation as
beforehand indicating that the radiation has little or no degrading effect on the
complexes in the aqueous phase The emission intensity is lower for the organic phases
after irradiation than beforehand possibly due to increased quenching effects caused by
radicals present as a result of irradiating the solvents The J=1J=2 ratios and co-
ordination mode for the organic phase remained unchanged (Table 56) and the
luminescence lifetimes can be seen to decrease only slightly after irradiation consistent
with the decrease in emission intensity (Table 57)
Table 56 J=1J=2 peak ratios and t-test results for the organic phases after Eu3+
extraction from aqueous phases containing DTPA-bis(amino ester) ligands (50 mM) at
pH 2 one of which had been irradiated with 7 kGy γ-radiation
DTPA-
(AlaOMe)2
DTPA-
(ArgOMe)2
DTPA-
(HisOMe)2
DTPA-
(SerOEt)2
st dev t-test
J=1J=2 0241 0233 0198 0231 0019
No sig
diff
Table 57 Luminescence lifetimes and q values for the organic phases after Eu3+
extraction from aqueous phases containing DTPA-bis(amino ester) ligands (50 mM) at
pH 2 one of which had been irradiated with 7 kGy γ-radiation
Ligand τ organic phase
without irradiation
(micros)
τ organic phase after
irradiation
DTPA-(AlaOMe)2 2151 plusmn 21 1829 plusmn 18
DTPA-(ArgOMe)2 1881 plusmn 19 1821 plusmn 17
DTPA-(HisOMe)2 2265 plusmn 18 2227 plusmn 18
DTPA-(SerOEt)2 1856 plusmn 20 1777 plusmn 19
54 Separation Work on Ligand Systems
Some separation work using these ligands was carried out with the help of
Andreas Geist at KIT-INE in Germany Extractions were performed under TALSPEAK
conditions but using kerosene as the organic phase due to availability
186
541 AmEu Separation in Ligand Systems
A stock spiking solution of 241
Am + 152
Eu (1 kBq mL-1
) was added to a solution
of yttrium and lanthanides (10 mgdm3 of each Ln(NO3)3) with each ligand (50 mM) for
DTPA-(ArgOMe)2 DTPA-(SerOEt)2 DTPA-(HisOMe)2 at pH 1-2 The aqueous phases
were contacted with HDEHP (02 M) in kerosene and shaken for 30 minutes The
phases were then separated and the Am3+
and Eu3+
concentrations in each phase were
determined by Gamma counting The separation factors for all ligands under these
conditions were found to be approximately 100 across the pH range measured Graphs
of these data are plotted in Figures 511-513 These values are comparable with the
original TALSPEAK process using lactate (SF = 91) Although the TALSPEAK
process uses dodecane rather than kerosene and as such the results are therefore not
directly comparable they still show selectivity between Am3+
and Eu3+
for these
ligands However the DAm using these ligands is 2-3 orders of magnitude higher than in
the original TALSPEAK process (~025-200 compared to 0009) indicating that Am3+
is not being held back sufficiently by the ligand for this to be a viable process and that
more work is needed to decrease the partitioning of Am3+
into the organic phase This
may be possible with optimisation of the systems by varying the pH concentration of
ligand concentration of extractant and by modifying the solubility of the ligands ie by
cleavage of the methyl and ethyl ester groups to generate the amino acid Nevertheless
these results are particularly encouraging
Figure 511 Separation factors and distribution ratios for Eu3+
Am3+
using DTPA-
(ArgOMe)2 (005 M) at pH 1-2 extracted using HDEHP (02 M) in kerosene
187
Figure 512 Separation factors and distribution ratios for Eu3+
Am3+
using DTPA-
(SerOEt)2 (005 M) at pH 1-2 extracted using HDEHP (02 M) in kerosene
Figure 513 Separation factors and distribution ratios for Eu3+
Am3+
using DTPA-
(HisOMe)2 (005 M) at pH 1-2 extracted using HDEHP (02 M) in kerosene
542 Ln Separation in Ligand Systems
In addition to the Eu3+
Am3+
separation studies carried out at KIT-INE using
these amino ester appended DTPA ligands further experiments were conducted to
observe the separation across the lanthanide series by ICP-MS under the same
conditions The graphs of the distribution ratios for each Ln3+
and Am3+
can be seen in
Figures 514-516 for each ligand as well as the separation factor for Nd3+
Am3+
(as
188
Nd3+
is the most difficult lanthanide to extract) The SFNdAm in each case is 30-40 over
the pH range 1-2 These separation factors are good only slightly lower than the
original lactate-buffered TALSPEAK process (SFNdAm ~ 55) and the distribution ratios
for the heavier lanthanides are particularly high higher than the original process with a
greater proportion of them having D values of over 1000 (Figures 514-516)
Figure 514 Distribution ratios for Ln3+
using DTPA-(ArgOMe)2 (005 M) at pH 1-2
extracted using HDEHP (02 M) in kerosene
189
Figure 515 Distribution ratios for Ln3+
using DTPA-(SerOEt)2 (005 M) at pH 1-2
extracted using HDEHP (02 M) in kerosene
Figure 516 Distribution ratios for Ln3+
using DTPA-(HisOMe)2 (005 M) at pH 1-2
extracted using HDEHP (02 M) in kerosene
190
55 Summary and Conclusion of Modified DTPA Ligand Work
After initial difficulties synthesising amino acid appended DTPA ligands the
ligands were successfully synthesised in good yields (~60 ) for DTPA-(AlaOMe)2
DTPA-(ArgOMe)2 DTPA-(SerOEt)2 and DTPA-(HisOMe)2 using ester protected
versions of the amino acids The ligands were shown by luminescence spectroscopy to
complex to Eu3+
at pH 2 3 and 4 forming Eu-DTPA-bis(amino ester) adduct with 1
water molecule in fast exchange in the inner hydration sphere Under TALSPEAK
conditions the ligands were found to be more effective holdback reagents at the lower
pH of 2 but also effectively extract Eu3+
over Am3+
as low as pH 15 This is in stark
contrast to the original TALSPEAK process The co-ordination mode of the ligands to
the metal ion was consistent for all of the ligands but was found to change slightly upon
changing pH although the overall coordination number of Eu3+
with the ligands
remained as approximately 8 (with the 9th
coordination site being completed by one
water molecule) Studies showed that the ligands are relatively resistant to radiolysis
when subjected to 7 kGy γ radiation as there was no change in their luminescence
emission profile co-ordination mode or hydration number after irradiation
Results from separation studies conducted at KIT-INE using gamma counting
and ICP-MS showed that the modified DTPA ligands successfully allowed separation
between Ln3+
Am3+
giving good separation factors comparable to the original lactate-
buffered TALSPEAK process (SFEuAm ~100) even for Nd3+
which is the most difficult
lanthanide to extract in the process (SFNdAm ~30-40) The extraction efficiency of all the
ligands broadly relates to the atomic number of the lanthanide ions (apart from La3+
Ce3+
and Pr3+
) with the heavier ions being preferentially extracted as expected The
separation factors of individual lanthanide pairs range from approximately 25 to gt 100
and for the Dy3+
Nd3+
pair of particular economic importance are quite reasonable SF
DyNd ~ 30
However the distibution ratio for Am3+
is higher than desired (025-200 vs
0009) and so optimisation of the systems would be necessary to try to reduce DAm for
the combined buffer soft-donor system to be viable Another step would also be to try to
deprotect the amino acids on the ligands hydrolysing the esters back to carboxylic acid
groups to see if that would increase the holdback ability of the ligands and possibly
decrease the distribution ratio of Am3+
191
1 PP Hazari G Shukla V Goel K Chuttani N Kumar R Sharma and AK Mishra
Bioconjugate Chem 2010 21 229-239
2 X Wang X Wang Y Wang and Z Guo Chem Comm 2011 47 8127-8129 ESI
3 SJ Pope BJ Coe S Faulkner and R H Laye Dalton Trans 2005 1482-1490
4 S J Pope B J Coe and S Faulkner Chem Commun 2004 1550-1551
192
6 SUMMARY CONCLUSIONS amp FUTURE WORK
61 Summary amp Conclusions
One technique for reprocessing SNF currently being developed in the USA is
the TALSPEAK process an advanced reprocessing method for the separation of Ln3+
and MA3+
components The traditional process developed in the 1960s uses DTPA to
act as a holdback reagent for MA3+
in a lactate buffered aqueous phase at pH 36
allowing Ln3+
to be selectively extracted by organophosphate HDEHP into an organic
phase of DIPB or dodecane TALSPEAK is one of the most promising techniques being
researched due to its numerous advantages particularly its relative resistance to
irradiation and ability to be carried out without the need for high reagent concentrations
Additionally it gives high separation factors in the region of ~50-100 which is
comparable to other advanced reprocessing methods currently being developed1 Since
the chemistry of the process is very complex and not particularly well understood it
would be an advantage to simplify the process by removing the need for a separate
holdback reagent and buffer
Recent studies have shown that complexants with soft donor atoms such as N or
S (relative to O) can be used to separate MA3+
from Ln3+
23
Initial research was carried
out by our collaborators at the Idaho National Lab testing the suitability of amino acids
(L-alanine L-arginine L-histidine and L-methionine) as a potential combined buffer
and soft donor by determining whether amino acids preferentially bind to MA3+
Another benefit to using amino acids would be the scope for carrying out the process at
a lower pH (~ pH 2) due to the lower pKa values of the carboxylic acid groups of the
amino acids than on DTPA Lower pH values are preferred by industry as higher acid
concentrations are easier to control on a large scale and are also known to increase the
Ln3+
distribution coefficients4
This work carried out by Grimes5 showed that amino acids do not act as
holdback reagents in their own right and that no separation of Ln3+
Am3+
is achieved
when they are used without Na5DTPA in solution However investigations showed that
when used alongside Na5DTPA good separation (SFEuAm ~ 66) can be achieved when
using 05 M L-alanine at pH 2 (cf ~25 at pH 3) however the DAm value was relatively
high than at the lower pH (DAm 047 at pH 2 cf 012 at pH 3) as more protonated forms
of the DTPA molecule are present in solution at low pH and the holdback reagent is not
able to bind as strongly to metal ions allowing more Am3+
to be partitioned into the
organic phase
193
However optimisation of the system in order to maximise the separation whilst
keeping Am3+
partitioning to a minimum by changing the concentrations of holdback
reagent and extractant proved to be successful The optimum conditions were found to
be 04 M Na5DTPA and 02 M HDEHP giving a separation factor of 71 plusmn 5 with a DAm
value of 008 Although this separation is not as good as a traditional lactate
TALSPEAK system (SF = 91 DAm = 0009) the use of L-alanine (pKa = 235) as a
buffer would allow the process to be carried out at pH 2 which is a much more
preferable pH for industry
Separations were carried out using other amino acids at varying pH values and it
was found that L-methionine was too poorly soluble at pH 3 and did not give very good
separation data at pH 2 L-arginine was found to have kinetic issues at pH 2 and 3
giving poor separation of the heavier lanthanides The amino acid L-histidine (pKa =
182) however gave good separation data at pH 3 with a SFEuAm of 99 comparable to
that of the original TALSPEAK process and a DAm of 007 comparable to the optimised
L-alanine system Unfortunately ICP-MS studies on lanthanides La-Ho using L-
histidine at pH 3 showed that the same kinetic problems arise for this system as for L-
alanine at pH 3 and L-arginine at pH 2 and 3 as the DLn value decreases for later
lanthanides
The interaction of the buffers glycine L-alanine L-serine L-phenylalanine and
lactate (for comparison) with Eu3+
and [Eu(DTPA)]2-
systems was investigated by
luminescence and 1H NMR spectroscopies As expected it was found that amino acids
and lactate do not form stable complexes with either the free metal ion or the metal-
DTPA complex and that the buffers are likely to be in fast exchange with surrounding
solvent molecules as the number of water molecules in the inner hydration sphere (q) of
Eu3+
was reduced from 9 to ~6 when buffers were added to the aqua ion in solution
Luminescence studies on L-phenylalanine (like other amino acids) showed that it does
not bind to the metal ion as there was no sensitised emission from Tb3+
ion when
excited into the phenyl chromophore of the amino acid when the two components were
in solution Emission spectra of Eu3+
and Cm3+
aqua ions and their corresponding
DTPA complexes showed no change in emission profile upon the addition of amino
acidslactate There was also no change in q when buffers were added to metal-DTPA
complexes in solution for Eu3+
or Cm3+
Radiolysis studies carried out on lactate and amino acid buffered [Eu(DTPA)]2-
systems showed that the systems are relatively resistant to γ-radiation when exposed to
5 kGy γ-radiation This is consistent with previous work conducted by the INL showing
194
that separation systems using L-alanine as a buffer are more resistant to radiolysis than
the original TALSPEAK process using lactate67
A 05 M L-alanine buffered
TALSPEAK system using 04 M Na5DTPA and 02 M HDEHP at pH 2 can therefore
be seen to be a promising alternative to the traditional lactate buffered system as it has
been shown to give good separation data with fairly low extraction of Am3+
and the
buffer is also more resistant to radiolysis than lactate Additionally it allows the process
to be carried out at a lower pH of 2 which is much more practical for industrial
operation
Since amino acids were found not to act as holdback reagents in their own right
the potential of using the larger tripeptide L-glutathione (GSH) was investigated Initial
separation studies carried out using glutathione at pH 4 (as GSH has 2 pKa values
below 4 and Garg et al reported that the optimum stability for Ln-GSH complexes
occurs in solutions between pH 34-348)8 Preliminary investigations found that as
with the amino acids studied GSH is ineffective as a holdback reagent on its own as
there was no separation observed between Eu3+
and Am3+
when used without
Na5DTPA
Analogous to the amino acid studies subsequent investigations were carried out
using GSH alongside Na5DTPA to determine whether separation was improved with the
tripeptide buffer A pH dependence study found that at pH 2 and pH 3 the glutathione
acts solely as a buffer in the systems as the separation factor in each case was
independent of GSH concentration However at pH 4 interestingly separation between
Eu3+
and Am3+
was found to increase as the buffer concentration was increased up to
05 M suggesting that the glutathione is interacting with the Ln-DTPA complexes at
this pH This could be explained by the increase in stability of Ln-GSH complexes as
the pH is increased
Using 05 M GSH the separation factor was found to increase dramatically as a
function of Na5DTPA concentration up to 03 M Na5DTPA After this peak there was
a rapid decrease in separation as the concentration was increased further up to 06 M
Na5DTPA as the stoichiometry is close to 11 GSHDTPA The separation factors
achieved here were extremely high (~1000) ndash a factor of 10 higher than the current
TALSPEAK system and the optimised L-alanine system whilst still maintaining low
Am3+
extraction (DAm = 0002 with 03 M Na5DTPA) lower than in the traditional
TALSPEAK process
At 03 M Na5DTPA the separation factor then increased as the extractant
concentration was increased from 02 to 04 M HDEHP in dodecane after which the SF
195
began to decrease again with the optimum separation at 04 M extractant giving a SF
of 1238 (DAm = 00018) At 04 M Na5DTPA however the separation factor decreases
rapidly as the extractant concentration is increased due to the DAm increasing by a
factor of 1000 consistent with the complexant and buffer possibly forming an adduct
which no longer successfully holds back Am3+
at higher Na5DTPA concentrations
Luminescence experiments mimicking the separation studies showed that the
glutathione does not form a stable complex with the Eu3+
ion and is in exchange with
surrounding solvent molecules comparable to the amino acid buffer studies even at the
highest buffer concentrations 1H NMR spectroscopy confirmed that although the
glutathione may be in exchange with surrounding water molecules no kinetically stable
complexes between the buffer and metal ions are formed In samples containing
Na5DTPA a Eu-DTPA complex can be clearly observed in the emission spectra with
or without the presence of GSH over a pH range of 2-4 The J=1J=2 peak ratios
showed that there is no change in the co-ordination mode of the buffer to the metal ion
as the concentration of GSH is increased for each pH however across the data sets the
co-ordination mode of glutathione was found to be different at different pH values as
expected based on pKa values and increasing stability constant with pH
The co-ordination mode of the Eu-DTPA in the aqueous phase with 05 M GSH
was found not to change as [Na5DTPA] was changed with metal extraction typically
decreasing as the holdback reagent increases and at 03 M Na5DTPA with 05 M GSH
extraction was found to increase as HDEHP concentration increased as expected
The GSH buffered system was found to be susceptible to radiolysis when
subjected 7 kGy γ-radiation from a 60
Co irradiator and seen to degrade into γ-Glu-Cys
fragments However the degradation was seen to have little effect on the extraction of
metal ions from the aqueous phase when analysed by luminescence spectroscopy with
only slightly decreased emission intensity post-irradiation The emission profiles co-
ordination mode and luminescent lifetimes of the samples remained unchanged
In order to be a successful alternative to the current TALSPEAK system it is
essential that effective separation of all lanthanides from MA3+
can occur Further
luminescence experiments were carried out firstly on analogous dysprosium systems in
order to represent heavier lanthanide elements followed by a mixture of four different
lanthanide metals in the same samples (Sm3+
Eu3+
Tb3+
and Dy3+
) For the dysprosium
study as the pH was increased from 2-4 the extraction of Dy3+
decreased suggesting
that the same kinetic issues noted for heavier lanthanides in the amino acid systems may
also be present for the GSH system at higher pH values In the mixed samples the same
196
pattern was observed with extraction of Ln3+
decreasing as pH was increased At pH 4
extraction of all lanthanide ions was very low particularly for Tb3+
and Dy3+
which are
both heavier than Sm3+
and Eu3+
ICP-MS carried out on a series of samples containing
a mixture of 10 lanthanides (La3+
-Ho3+
) was consistent with the luminescence data
showing decreased extraction of heavier lanthanides as pH increases from 2 to 4 The
quantity of metal extracted was so low it was below the limit of detection for some of
the heavier metals at pH 4 forcing the conclusion that unfortunately the same kinetic
issues are a problem at higher pH for the glutathione buffered system as for the amino
acid systems
Initial data obtained on the glutathione system with europium(III) and
americium(III) seemed promising as after optimisation very high separation factors for
Eu3+
Am3+
were achieved (~1000) with very low Am3+
partitioning (DAm ~0002) and
although the buffer was found to be susceptible to radiolysis extraction of lanthanide
ions still remained high after irradiation However subsequent studies with heavier
lanthanides showed that the GSH buffered system is subject to the same kinetic
problems as some of the amino acid systems
Based on the results from studies using amino acid and glutathione buffered
systems demonstrating that Ln3+
MA3+
separation cannot be achieved without the
presence of DTPA and a buffer the possibility of synthesising a combined buffer and
soft-donor was considered Amino acids were appended onto DTPA through reaction of
amino acid esters with DTPA dianhydride to form DTPA-(AlaOMe)2 DTPA-
(ArgOMe)2 DTPA-(SerOEt)2 and DTPA-(HisOMe)2 in good yields (~ 60 ) The
ligands were shown by luminescence spectroscopy to complex to Eu3+
at pH 2 3 and 4
forming Eu-DTPA-AA2 adducts with 1 water molecule in fast exchange in the inner
hydration sphere Under TALSPEAK conditions the ligands were found to be more
effective holdback reagents at the lower pH of 2 and even at pH 15 The co-ordination
mode of the ligands to the metal ion was consistent for all of the ligands being typical
of lanthanide DTPA-amide ligands known in the literature910
but was found to change
upon changing pH These ligands were also found to be relatively resistant to radiolysis
when subjected to 7 kGy γ radiation from a 60
Co irradiator as there was no change in
their luminescent emission profile co-ordination mode or hydration number after
irradiation
Results from separation studies conducted at KIT-INE using gamma counting
and ICP-MS showed that the modified DTPA ligands successfully allowed separation
between Ln3+
Am3+
giving good separation factors comparable to the original lactate-
197
buffered TALSPEAK process (SFEuAm ~100) even for Nd3+
which is the most difficult
lanthanide to extract in the process (SFNdAm ~30-40) The extraction efficiency of all the
ligands broadly relates to the atomic number of the lanthanide ions (apart from La3+
Ce3+
and Pr3+
) with the heavier ions being preferentially extracted as expected The
separation factors of individual lanthanide pairs range from approximately 25 to gt 100
and for the Dy3+
Nd3+
pair of particular economic importance are quite reasonable SF
DyNd ~ 30
However the distibution ratio for Am3+
is much higher than desired for the
modified DTPA ligands (DAm = 025-200 vs DAm 0009) and so optimisation of the
systems would be necessary to try to reduce DAm for the combined buffer soft-donor
system to be viable Initial studies on combined DTPA-bis(amino ester) ligands is
promising allowing the TALSPEAK process chemistry to be simplified and providing a
system which could be buffered to a lower pH (pH 2) as preferred by industry The
synthesis of the ligands is quite moisture sensitive and the products are very
hygroscopic and difficult to purify making the application of them on an industrial
scale potentially problematic but the simplification of the process on a laboratory scale
would allow the chemistry of the TALSPEAK process to be further investigated and
better understood for future developments
Although there are a number of variations of the TALSPEAK process being
developed including the TALSQuEAK (Trivalent Actinide Lanthanide Separation
using Quicker Extractants and Aqueous Complexes) process11
which uses alternative
extractant HEH[EHP]12
and alternative holdback reagent HEDTA13
the use of amino
acid and short-chain peptide buffers is unique to this project in collaboration with the
Idaho National Laboratory There has been some investigation into the use of malonate
buffers for TALSPEAK14
but there are no other reports of the use of amino acids or
peptides in the literature Additionally there are few published reports on the use of
luminescence spectroscopy in TALSPEAK studies chiefly on the complexation of Eu3+
with lactate15
complexation of Eu3+
Cm3+
with DTPA16
and complexation of Eu3+
with
HDEHP in the organic phase17
There is no literature on systems as a whole
A report on bis(methionine)-appended DTPA was published by Hazari et al in
2010 on the use of Tc-DTPA-bis(methionine) in tumour imaging18
however there are
no literature reports on the synthesis or use of amino acid appended or any modified
DTPA ligands for solvent extraction and separation studies
198
62 Future Work
As only a small selection of amino acids have been tested as buffers it would be
interesting to try more of them The original selections were made on the basis of their
chemical structures solubilities and previous work conducted at INL plus presence of
any soft donor atoms L-alanine was selected as it has the most similar structure to lactic
acid although glycine may be worth considering as well based on its also very similar
structure and high aqueous solubility Results with L-arginine and L-methionine were
not very promising possibly due to their longer chain backbones so it may be worth
considering the similar shorter-chain amino acids L-cysteine and L-threonine as these
have similar structures to L-serine which along with glycine was one of the amino
acids investigated by luminescence spectroscopy Although L-cysteine has poor
solubility like L-methionine it would be interesting to see how these amino acids
behave as buffers when subjected to the same separation and optimisation tests as L-
alanine Similarly medium length chain amino acids L-glutamic acid L-aspartic acid
L-asparagine and L-glutamine may also be worth considering (Figure 61)
Figure 61 Chemical structures of amino acids taken from reference 1919
199
In addition to investigating other amino acid buffer systems as discussed in
Chapter 4 there may be some benefit to carrying out experiments with other short chain
peptides such as eisenin and norophthalmic acid as well as some of the B vitamins that
were considered (vitamins B7 and 9) before L-glutathione was selected From the
results obtained with L-glutathione demonstrating that the tripeptide interacts with the
Ln-DTPA complex under certain conditions it is possible that these other peptides may
also interact and potentially aid in extraction of Ln3+
or selective holdback of MA3+
Although the desired result was not achieved with L-glutathione as it seems to
suffer the same kinetic issues which have been common with amino acids causing very
good extraction of the lighter lanthanides but very poor extraction of the heavier
lanthanides further optimisation of the GSH system to exploit the combined liquid-
liquid extraction efficiencies as a function of atomic number may allow the
development of an extraction process of lighter over heavier lanthanides for rare earth
recycling which is currently a strategically important goal20
Initial studies on the modified DTPA ligands showed promising results for a
combined buffer and soft-donor although there is still much work to be done in this
area It would be useful to determine the stability constants of the ligands with
lanthanides and with Am3+
and Cm3+
if possible preferably by potentiomenty which
has proven to be the most reliable method for determining stability constants for these
types of complexes21
The next step in process development with the ligands would be
to optimise the systems (as was done for the L-alanine and GSH buffered systems) in
order to reduce the partitioning of Am3+
and decrease DAm as much as possible ideally
to the same of magnitude of the lactate and GSH buffered systems by altering pH
concentration of ligand and concentration of extractant to maximise separation and
minimise americium distribution
A further step would also be to try to deprotect the amino acids on the DTPA-
amino ester ligands hydrolysing the esters back to carboxylic acid groups to see if that
would increase the holdback ability of the ligands and possibly decrease the distribution
ratio of Am3+
It is envisioned that the research presented in this thesis could be applied to
current and new technologies and challenges faced in the future of the nuclear industry
in particular towards the development of a TALSPEAK-style advanced reprocessing
procedure for implementation in the USA within the near future
200
1 G Modolo A Geist and M Miguirditchian Minor actinide separations in the
reprocessing of spent nuclear fuels recent advances in Europe in R Taylor ed
Reprocessing and Recycling of Spent Nuclear Fuel Woodhead Publishing UK 2015
10 245-279
2 M P Jensen and A H Bond J Am Chem Soc 2002 124 9870-9877
3 L R Martin B J Mincher and N C Schmitt J Radioanal Nucl Chem 2009 282
523-526
4 B Weaver and T A Kappelmann Talspeak A new method of separating americium
and curium from the lanthanides by extraction from an aqueous solution of an
aminopolyacetic acid complex with a monoacidic organophosphate or phosphonate
Oak Ridge National Laboratory 1964 1-60
5 TS Grimes RD Tillotson and LR Martin Solv Extraction and Ion Exchange
2014 32 378-390
6 Dr Leigh Martin Idaho National Laboratory unpublished results
7 LR Martin S P Mezyk and BJ Mincher J Phys Chem A 2009 113 141-145
8 BS Garg BK Singh DN Kumar and PK Sing Indian J Chem 2003 42A 79-83
9 C L Davies N G Housden and A-K Duhme-Klair Angew Chem Int Ed Engl 2008
47 8856
10 SJA Pope Polyhedron 2007 26 17 4818-4824
11 JC Braley JC Carter SI Sinkov KL Nash and GJ Lumetta J Coord Chem
2012 65 16 2862-2876
12 GJ Lumetta AJ Casella BM Rapko TG Levitskaia NK Pence JC Carter
CM Niver and MR Smoot Solv Extraction Ion Exchange 2015 33 346-361
13 JC Braley TS Grimes and KL Nash Ind Eng Chem Res 2012 15 629-638
14 JL Lapka and KL Nash Solv Extraction Ion Exchange 2015 33 346-361
15 G Tian LR Martin and L Rao Inorg Chem 2010 49 10598-10605
16 G Tian LR Martin and L Rao Inorg Chem 2015 54 1232-1239
17 TS Grimes G Tian L Rao and KL Nash Inorg Chem 2012 51 6299-6307
18 PP Hazari G Shukla V Goel K Chuttani N Kumar R Sharma and AK
Mishra Bioconjugate Chem 2010 21 229-239
19 DWhite Wisegeek What are Amino Acids httpwwwwisegeekorgwhat-are-
amino-acidshtm 2015
20 LS Natrajan and MH Langford Paden f-Block Elements Recovery in A Hunt ed
Element Recovery and Sustainability RSC 2013 6 140-184
21 G Tian LR Martin and LRao Inorg Chem 2015 54 1232-1239
201
7 EXPERIMENTAL SECTION
71 Chemicals and Reagents
All chemicals and solvents were purchased from Sigma-Aldrich chemical
company and were used as received Radioisotopes were supplied by the Idaho National
Laboratory or the Institute for Nuclear Waste Disposal (INE) and were used in
accordance with the local rules for manipulation of high specific activity materials
711 Handling Radioisotopes at INL
In order to handle radioisotopes at INL it was necessary to compete the
RadWorker 2 training and theory and practical examinations Upon entering a radiation
area (laboratory) it was a requirement to sign onto the dosimetry record system and
collect a dosimeter which was to be worn on the chest at all times in the area When
handling radioactive material within the designated controlled areas (fume hoods) extra
layers of PPE (personal protective equipment) such as triple layered shoulder length
gloves were to be worn and disposed of immediately upon leaving the controlled area in
designated radioactive waste bins It was then a requirement to monitor the upper body
area carefully with an alpha and a beta radiation detector Whilst working in the
controlled area any potentially contaminated PPE or samples had to be disposed of and
immediately replaced in the case of PPE After preparing sealed samples in the
controlled areas a Radiological Control worker would assist with swabbing each
sample to check for contamination before it could be removed from the area for further
analysis Samples were not to be opened outside of controlled areas and were returned
to the controlled area fume hood to be disposed of by solidification Upon leaving
radiation areas a full body scan was conducted and dose records updated as dosimeters
were returned
72 Complexation studies of Ln3+
amp An3+
with amino acids in TALSPEAK systems
721 Preparation of samples for luminescence studies
7211 Stock solutions
Stock solutions (10 mM 10 mL) were made up for each lanthanide (EuTb)
using the corresponding lanthanide nitrate salt Ln(NO3)3xH2O in H2O or D2O as
required A stock solution of Na5DTPA in H2OD2O (1 M 50 mL) was made up from a
40 wv Na5DTPA solution in H2O by dilution (2517 g into 50 mL) Stock solutions
of amino acids (Gly L-Ala L-Ser) in H2OD2O (125 M 20 mL) were prepared from
202
the crystalline form of each amino acid and a stock solution of DL-lactic acid was
prepared by dilution (225 g in 20 mL) For the sensitisation study with L-Phe due to
poor solubility of L-Phe a 0625 M stock solution in D2O was made using the powdered
form of the amino acid Additionally a stock solution of HDEHP in n-dodecane (645 g
in 100 mL 02 M) was prepared All reagents were purchased from Sigma-Aldrich
Stock solutions
10 mM EuTb(NO3)3 in H2OD2O
1 M Na5DTPA in H2OD2O
125 M GlyL-AlaL-SerLactate in H2OD2O
0625 M L-Phe in D2O
02 M HDEHP in n-dodecane
7212 Preparation of aqueous samples
5 mL samples were prepared using the stock solutions above Ln(NO3)3xH2O
(05 mL) was added to each amino acid solution (4 mL) with either Na5DTPA solution
(05 mL) or H2OD2O (05 mL) depending on whether the samples contained DTPA
This produced individual samples with concentrations of 1 mM Ln3+
1 M amino
acidlactate (05 M for L-Phe) and 01 M Na5DTPA if applicable The pHpD of
samples was adjusted individually with concentrated HNO3 and NaOH to minimise
change in volume using a Mettler Toledo Seven Compact pHion Meter pD (-log10
deuterium ion concentration) was calculated using Equation 71 to account for the
activity coefficient difference between the different isotopes of the hydrogen ion where
pH = the meter reading from a calibrated pH electrode All samples were repeated in
triplicate analagous to the solvent extraction samples performed at INL
Equation 71
7213 Preparation of extracted samples
Aqueous samples were prepared using the stock solutions above Na5DTPA
solution (05 mL) was added to amino acid solution (4 mL) and the mixture was pre-
equilibrated by contacting with n-dodecane and shaken using a Scientific Industries
Vortex Genie 2 Mixer and Shaker for 15 minutes The phases were allowed to separate
and the organic layer was discarded Ln(NO3)3 solution (05 mL) was added to the
aqueous phase and the pH was adjusted individually with concentrated HNO3 and
NaOH to minimise change in volume using a Mettler Toledo Seven Compact pHion
203
Meter The pD was calculated using Equation 71 The aqueous phases were contacted
with HDEHP in n-dodecane (5 mL 02 M) The solutions were then shaken again for 15
minutes left to settle and separated into the two phases for analysis All samples were
repeated in triplicate analagous to the solvent extraction samples performed at INL
722 Radiolysis of samples
Fricke dosimetry can be used to determine dose rates from radiation sources
such as from a 60
Co irradiator used to irradiate samples for radiolysis studies at the
Dalton Cumbrian Facility An aerated iron(II) sulphate solution is irradiated to give free
radicals according to the following reactions
H2O rarr H + OH
OH + Fe2+
rarr Fe3+
+ HO-
H + O2 rarr HO2
H+ + Fe
2+ + HO2 rarr Fe
3+ + H2O2
H2O2 + Fe2+
rarr Fe(OH)2+
+ OH
HO2 + Fe3+
rarr Fe2+
+ O2 + H+
This means that each H radical causes the oxidation of 3 Fe2+
ions to Fe3+
The amount
of Fe3+
present can then be measured using UV-visible spectroscopy and the dose rate
calculated from this1
7221 Preparation of Fricke solution
A Fricke solution was needed for the first set of radiolysis experiments carried
out using the 60
Co irradiator at the DCF as it allows the amount of exposure to be
calculated for each sample position during irradiation
FeSO47H2O (020206 g 133 mM) NaCl (003031 g 052 mM) and H2SO4 (95-98
11 mL) were added to deionised water (500 mL) The resulting Fricke solution was
then air-saturated and stored away from natural and artificial light sources
7222 Calculating dose rates
The UV-vis spectra of Fricke solution was then read before and after irradiation
and the following equation used to work out the dose rate
The dose can be calculated from the equation designed by Spinks and Woods (Equation
72)2
204
Equation 72
Where
F (Faradayrsquos constant) = 0965 x 109 A mol
-1
εFe(III) = Fe(III) molar extinction coefficient = 2174 M-1
cm-1
ρ = Fricke solution density = 1204 g mL-1
G = Critical Dose Value for Fe3+
= 148 molecules per 100 eV for x-rays
V = Volume of sample (mL) = 1
ODi = Optical density of irradiated solution
ODb = Optical density of non-irradiated control
The Spinks and Woods equation is specific to X-rays and must be adjusted so that it can
be applied to the use of γ-rays (Equation 73)
For γ-rays
εFe(III) = 2197 M-1
cm-1
G = 162 molecules per eV
Equation 73
Equation 74
Due to the design of the irradiator different positions in the machine receive
slightly different dose rates resulting in each sample receiving slightly different
amounts of radiation although the variation in dose is not significant and each sample
was calculated to receive an average of 114 Gy min-1
205
Table 71 Dose rates received at each sample position in the 60
Co irradiator at DCF
Position Dose Rate (Gy
min-1
)
1 1084678
2 1171864
3 1183066
4 1103841
73 Solvent extraction and separation studies using amino acids and glutathione at
INL
731 Preparation of samples
7311 Stock solutions for amino acid studies
A stock solution of Na5DTPA in H2O (1 M 100 mL) was made up from a 40
wv Na5DTPA solution in H2O by dilution (2517 g into 50 mL) A stock solution of L-
alanine in H2O (1 M 200 mL) was prepared from its crystalline form Additionally a
stock solution of HDEHP in n-dodecane (3224 g in 100 mL 1 M) was prepared This
was subsequently diluted with n-dodecane to prepare stock solutions of 02 04 06 and
08 M HDEHP in n-dodecane stock solutions as well
Stock solutions
1 M Na5DTPA in H2O
1 M L-Ala in H2O
10 08 06 04 02 M HDEHP in n-dodecane
7312 [Na5DTPA] dependence SX samples for amino acid studies
5 mL aqueous samples were prepared using the stock solutions above L-alanine
solution (25 mL) was added to a calculated volume of Na5DTPA solution to produce
samples with the desired DTPA concentration (006 007 008 009 01 02 03 04
05 M) when made up to 5 mL with water The pH of samples was adjusted individually
with concentrated HNO3 and NaOH to minimise change in volume using a Mettler
Toledo Seven Compact pHion Meter 02 M HDEHP in n-dodecane was used for the
solvent extraction All samples were repeated in triplicate
7313 [HDEHP] dependence SX samples for amino acid studies
5 mL aqueous samples were prepared using the stock solutions above L-alanine
solution (25 mL) was added to a calculated volume of Na5DTPA solution to produce
samples with the desired DTPA concentration (01 02 03 04 05 M) when made up
206
to 5 mL with water The pH of samples was adjusted individually with concentrated
HNO3 and NaOH to minimise change in volume using a Mettler Toledo Seven
Compact pHion Meter 02 04 06 08 and 10 M HDEHP in n-dodecane was used for
the solvent extraction All samples were repeated in triplicate
7314 Other amino acid SX samples for amino acid studies
5 mL aqueous samples were prepared for L-His and L-Met buffered systems
The Na5DTPA stock solution (025 mL) was added to L-His (0388 g) and L-Met (0373
g) separately to make samples with concentrations of 005 M Na5DTPA and 05 M
amino acid when made up to 5 mL with water The powdered forms of the amino acids
were used due to their poor solubility The pH of samples was adjusted individually
with concentrated HNO3 and NaOH to minimise change in volume using a Mettler
Toledo Seven Compact pHion Meter 02 M HDEHP in n-dodecane was used for the
solvent extraction All samples were repeated in triplicate
7315 Stock solutions for glutathione studies
A stock solution of Na5DTPA in H2O (1 M 100 mL) was made up from a 40
wv Na5DTPA solution in H2O by dilution (2517 g into 50 mL) Additionally a stock
solution of HDEHP in n-dodecane (3224g in 100mL 1 M) was prepared This was
subsequently diluted with n-dodecane to prepare stock solutions of 02 04 06 and 08
M HDEHP in n-dodecane stock solutions as well
Stock solutions
1 M Na5DTPA in H2O
10 08 06 04 02 M HDEHP in n-dodecane
7316 [GSH] dependence SX samples without Na5DTPA
GSH (0768 g) was dissolved in water (5 mL) to make a 05 M solution The
powdered form of the peptide was used due to its poor solubility The pH of sample was
adjusted with concentrated HNO3 and NaOH to minimise change in volume using a
Mettler Toledo Seven Compact pHion Meter 02 M HDEHP in n-dodecane was used
for the solvent extraction All samples were repeated in triplicate
7317 [GSH] and pH dependence SX samples with Na5DTPA
5 mL aqueous samples were prepared for GSH buffered systems The Na5DTPA
stock solution (025 mL) was added to varying quantities of GSH to make samples with
207
concentrations of 005 M Na5DTPA and the desired concentration of GSH (01 02 03
04 05 M) when made up to 5 mL with water The pH of samples was adjusted
individually with concentrated HNO3 and NaOH to minimise change in volume using
a Mettler Toledo Seven Compact pHion Meter 02 M HDEHP in n-dodecane was used
for the solvent extraction All samples were repeated in triplicate
7318 [Na5DTPA] dependence SX samples for GSH studies
5 mL aqueous samples were prepared for GSH buffered systems GSH (0768 g)
was added to a calculated volume of Na5DTPA solution to produce samples with
concentrations of 05 M GSH and the desired DTPA concentration (005 01 02 03
04 05 06 M) when made up to 5 mL with water The pH of samples was adjusted
individually with concentrated HNO3 and NaOH to minimise change in volume using
a Mettler Toledo Seven Compact pHion Meter 02 M HDEHP in n-dodecane was used
for the solvent extraction All samples were repeated in triplicate
7319 [HDEHP] dependence SX samples for amino acid studies
5 mL aqueous samples were prepared for GSH buffered systems GSH (0768 g)
was added to a calculated volume of Na5DTPA solution to produce samples with the
concentrations of 05 M GSH and the desired DTPA concentration (03 M and 04 M)
when made up to 5 mL with water The pH of samples was adjusted individually with
concentrated HNO3 and NaOH to minimise change in volume using a Mettler Toledo
Seven Compact pHion Meter 02 04 06 08 and 10 M HDEHP in n-dodecane was
used for the solvent extraction All samples were repeated in triplicate
732 Gamma counting
2 mL of each sample was transferred into a 4 mL sample vial in duplicate One
of the duplicate sets of samples was contacted with 2 mL n-dodecane to pre-equilibrate
the aqueous phase and the other duplicate set was contacted with the stock solution of
HDEHP in n-dodecane to pre-equilibrate the organic phase All of the samples were
then shaken using a VWR Multi-Tube Vortexer for 15 minutes Samples were then
placed in a Boeco S-8 Centrifuge for 5 minutes at 5400 rpm to separate the layers
The organic phase of the pre-equilibrated aqueous phase was discarded and the
aqueous phase of the pre-equilibrated organic phase was discarded 05 mL each
retained phase was then contacted in a 2 mL sample vial in triplicate and spiked with 10
microL 241
Am or 154
Eu stock solutions (1 kBq mL-1
) Samples were then shaken again using
208
a VWR Multi-Tube Vortexer for another 30 minutes before being placed in a Boeco S-
8 Centrifuge for 5 minutes at 5400 rpm to separate the layers
300 microL of each organic phase was transferred into counting tubes and 300 microL of
each aqueous phase was transferred into separate tubes Control tubes containing 300
microL HNO3 spiked with 10 microL 241
Am or 154
Eu stock solutions (1 kBq mL-1
) were also
prepared γ counting was performed on the samples using a Packard Cobra II Gamma
Counter Results were averaged from each of the samples in triplicate
733 ICP-MS
Samples were made up as for SX samples with other amino acids for L-His and
(Section 7314) and for GSH (Section 7318) 2 mL of each sample was transferred
into a 4 mL sample vial 10 microL mixed Ln 110 stock solution (5 mgL-1
of each of La
Ce Pr Nd Sm Eu Gd Tb Dy Ho) was spiked into each sample and samples were
contacted with 2 mL HDEHP in n-dodecane (02 M) All of the samples were then
shaken using a VWR Multi-Tube Vortexer for 15 minutes Samples were then placed in
a Boeco S-8 Centrifuge for 5 minutes at 5400 rpm to separate the layers
The organic phase was discarded and 10 microL of the aqueous phase was
transferred into ICP-MS vials containing 10 mL 2 HNO3 in triplicate Control tubes
containing 10 mL 2 HNO3 spiked with 10 microL mixed Ln 110 stock solution were
also prepared ICP-MS was carried out to determine the concentration of each
lanthanide in the organic and aqueous phase Results were averaged from each of the
samples in triplicate
74 Luminescence studies and solvent extraction using glutathione at UoM
741 Preparation of luminescence samples
7411 Stock solutions for GSH studies
Stock solutions (10 mM (100 mM for Dy3+
) 10 mL) were made up for each
lanthanide (EuTbDySm) using the corresponding lanthanide nitrate salt
Ln(NO3)3xH2O in H2O or D2O as required A mixed lanthanide solution was also made
up to contain the same concentrations of each of the lanthanides above A stock solution
of Na5DTPA in H2OD2O (1 M 50 mL) was made up from a 40 wv Na5DTPA
solution in H2O by dilution (2517 g into 50 mL) Additionally a stock solution of
HDEHP in n-dodecane (3224 g in 100 mL 1 M) was prepared This was subsequently
diluted with n-dodecane to prepare stock solutions of 02 04 06 and 08 M HDEHP in
n-dodecane stock solutions as well All reagents were purchased from Sigma-Aldrich
209
Stock solutions
10 mM EuTbSm(NO3)3 in H2OD2O
100 mM Dy(NO3)3 in H2OD2O
Mixed Ln solution with 10 mM EuTbSm(NO3)3 in H2OD2O and 100 mM Dy(NO3)3
1 M Na5DTPA in H2OD2O
10 08 06 04 02 M HDEHP in n-dodecane
7412 Preparation of aqueous samples
Samples were made up using the stock solutions above in the same way as for
the solvent extraction and separation studies carried out at INL (Sections 7312 to
7319) pD was calculated using Equation 71
7413 Preparation of extracted samples
5 mL aqueous samples were prepared using the stock solutions above GSH
(0768 g) was added to a calculated volume of Na5DTPA solution to produce samples
with the concentrations of 05 M GSH and the desired DTPA concentration (varied
according to the study) when made up to 5 mL with water The mixture was pre-
equilibrated by contacting with n-dodecane and shaken using a Scientific Industries
Vortex Genie 2 Mixer and Shaker for 15 minutes The phases were allowed to separate
and the organic layer was discarded Ln(NO3)3 solution (05 mL) was added to the
aqueous phase and the pH was adjusted individually with concentrated HNO3 and
NaOH to minimise change in volume using a Mettler Toledo Seven Compact pHion
Meter pD was calculated using Equation 71 The aqueous phases were contacted with
5 mL HDEHP in n-dodecane (varied according to the study) The solutions were then
shaken again for 15 minutes left to settle and separated into the two phases for analysis
All samples were repeated in triplicate analagous to the solvent extraction samples
performed at INL
742 Radiolysis of GSH samples
Radiolysis experiments on GSH buffered systems were carried out using the
60Co irradiator at DCF These irradiations were undertaken at a later date than the initial
amino acid radiolysis studies (Section 722) using a new calibrated sample holder with
known dose rates and so preparation and use of a Fricke solution was not necessary
Samples received an average of 7 kGy γ radiation
210
75 Modified DTPA Ligands
751 Synthesis of modified DTPA ligands
L-alanine methyl ester hydrochloride (0837 g 62 mmol) was dissolved in DMF
(15 mL) and added dropwise to DTPA dianhydride (107 g 3 mmol) in DMF (75 mL)
and 3 mL triethylamine (TEA) with stirring under nitrogen in an ice bath at 0 degC The
ice bath was removed after 2 hours and the reaction was left to stir at room temperature
for 48 hours The reaction was quenched with H2O (75 mL) and the solvent evaporated
to ~10 mL The resulting yellow oil was added dropwise to acetone (100 mL) with
stirring and the product precipitated The product was collected by sinter filtration
(porosity 3) under nitrogen as a crude white powder (yield 132 g 78) It was washed
with diethyl ether (3 x 20 mL) chloroform (3 x 20 mL) and diethyl ether again (3 x 20
mL) This was then dried under vacuum to give a white micro-crystalline product
(yield 1031 g 61 ) Multiple re-precipitations were performed to reduce the amount
of associated ammonium salts in the product Samples were dried under vacuum and
freeze-dried but water and solvent impurities continued to remain present
The synthesis was repeated using L-arginine methyl ester dihydrochloride (157 g 6
mmol) L-serine ethyl ester hydrochloride (102 g 6 mmol) and L-histidine methyl ester
(145 g 6 mmol)
Yields
DTPA-(AlaOMe)2 132 g 78 (MW 56356 gmol-1
)
DTPA-(ArgOMe)2 1331 g 60 (MW 73378 gmol-1
)
DTPA-(SerOEt)2 1053 g 56 (MW 62361 gmol-1
)
DTPA-(HisOMe)2 1730 g 83 (MW 69569 gmol-1
)
752 Characterisation of modified DTPA ligands by MALDI-MS
MALDI-MS was used to characterise the synthesised ligands Samples were
dissolved in methanol for analysis These analyses confirm that the ligands are the
desired ones as the protonated monomolecular ion [M+H]+ is visible in each case The
[M+Na]+ and [M+K]
+ ions can also be found in each spectrum The range begins at mz
= 200 so it is therefore not possible to verify the presence of triethylamine (M =
10119gmol) the amino acid starting material or any solvents using this technique The
spectra show a numerous peaks indicating that the ligands have decomposed during
analysis making interpretation difficult The spectrum for DTPA-(AlaOMe)2 can be
found in Appendix 6
211
DTPA-(AlaOMe)2 mz 565 (100) [M+H]+ 587 (37) [M+Na]
+ 603 (39) [M+K]
+
DTPA-(ArgOMe)2 mz 734 (100) [M+H]+ 756 (18) [M+Na]
+ 772 (9) [M+K]
+
DTPA-(SerOEt)2 mz 624 (100) [M+H]+ 646 (60) [M+Na]
+ 662 (15) [M+K]
+
DTPA-(HisOMe)2 mz 697 (100) [M+H]+ 719 (22) [M+Na]
+ 735 (10) [M+K]
+
753 Characterisation of modified DTPA ligands by NMR spectroscopy
NMR spectroscopy was performed on ligand samples in D2O (9992 atom D
Sigma Aldrich) at 400 MHz The 1H NMR spectra of DTPA-(AlaOMe)2 with suggested
peak assignments can be found in Appendix 7
The 1H NMR spectra are difficult to interpret and assign due to the number of
peaks and their proximity to each other There are also impurities observable in the
spectra 13
C NMR spectra were also recorded and were simpler to interpret due to the
DEPT 135 spectra and enabled the quaternary CH CH2 and CH3 carbons to be
distinguished 1H NMR assignments were made using HSQC relating each peak in a
1H
spectrum to its corresponding carbon Solvent impurities were determined from known
solvent shifts (DMF acetone ethanol chloroform andor diethyl ether)3 DMF is the
most prevalent impurity due to it being the most difficult solvent to remove Some
starting material from amino acid esters can also be observed in small quantities
Triethylammonium chloride is also present in a small amount (11 ppm and 30 pmm)
7531 1H NMR Spectroscopy
1H NMR Shifts (400 mHz D2O)
DTPA-(AlaOMe)2 δ ppm 125 (d 3JHH =734 Hz 6 H H8) 311 (t
3JHH =100 Hz 4 H
H5) 323 (t 3JHH =569 Hz 4 H H4) 348 - 355 (m 2 H H6 and H7) 362 - 369 (m
4 H H2) 375 - 387 (m 4 H H3) 418 - 425 (m 2 H H1)
DTPA-(ArgOMe)2 δ ppm 154 (dq 2JHH =1449 Hz
3JHH 730 Hz 4 H H9) 169 - 189
(m 4 H H8) 302 - 317 (m 4 H H10 ) 325 (s 8 H H4 and H5) 362 (s 4 H H2)
365 (s 6 H H7) 368 (s 2 H H6) 375 - 384 (m 4 H H3) 436 - 444 (m 2 H H1)
DTPA-(SerOEt)2 δ ppm 117 (t 3JHH =706 Hz 6 H H7) 327 (s 8 H H4 and H5)
364 - 372 (m 6 H H2 and H6) 378 - 393 (m 9 H) H3 and H9) 414 (q 3JHH =706
Hz 4 H H8) 452 (dd 3JHH =479 378 Hz 2 H H1)
DTPA-(HisOMe)2 δ ppm 297 - 323 (m 12 H H4 H5 and H8) 331 (s 4 H H2) 349
(s 4 H H3) 358 (s 6 H H7) 362 (m 2 H H6) 370 - 375 (m 1 H H3) 464 - 466
(m 2 H H1) 714 (s 2 H H9) 843 (s 2 H H10)
212
Figure 71 1H NMR proton assignments for DTPA-(AlaOMe)2
Figure 72 1H NMR proton assignments for DTPA-(ArgOMe)2
Figure 73 1H NMR proton assignments for DTPA-(SerOEt)2
213
Figure 74 1H NMR proton assignments for DTPA-(HisOMe)2
7532 13
C NMR Spectroscopy
13CNMR Shifts (400 mHz D2O)
DTPA-(AlaOMe)2 δ ppm 158 (CH3 C12) 485 (CH C1) 511 (CH2 C5) 514 (CH2
C4) 529 (CH3 C7) 543 (CH2 C6) 563 (CH2 C2) 564 (CH2 C3) 1686 (q-C C9)
1718 (q-C C11) 1721 (q-C C10) 1746 (q-C C8)
DTPA-(ArgOMe)2 δ ppm 243 (CH2 C13) 275 (CH2 C12) 404 (CH2 C14) 512
(CH2 C5) 518 (CH2 C4) 523 (CH C1) 530 (CH3 C7) 548 (CH2 C6) 564 (CH2
C2) 568 (CH2 C3) 1567 (q-C C15) 1698 (q-C C9) 1716 (q-C C11) 1728 (q-C
C10) 1735 (q-C C8)
DTPA-(SerOEt)2 δ ppm 132 (CH3 C8) 512 (CH2 C5) 514 (CH2 C4) 545 (CH2
C6) 549 (CH C1) 563 (CH2 C2) 565 (CH2 C3) 607 (CH2 C13) 628 (CH2 C7)
1693 (q-C C9) 1712 (q-C C10) 1717 (q-c C11) 1723 (CH3 C8)
DTPA-(HisOMe)2 δ ppm 257 (CH2 C12) 505 (CH2 C5) 517 (CH C1) 525 (CH2
C4) 531 (CH3 C7) 551 (CH2 C6) 568 (CH2 C2) 572 (CH2 C3) 1170 (CH C14)
1286 (q-C C13) 1333 (CH C15) 1711 (q-C C9) 1714 (q-C C11) 1716 (q-C
C10) 1746 (q-C C8)
214
Figure 75 13
C NMR carbon assignments for DTPA-(AlaOMe)2
Figure 76 13
C NMR carbon assignments for DTPA-(ArgOMe)2
Figure 77 13
C NMR carbon assignments for DTPA-(SerOEt)2
215
Figure 78 13
C NMR carbon assignments for DTPA-(HisOMe)2
754 Characterisation of modified DTPA ligands by elemental analysis
Elemental analysis was also performed on the ligands for characterisation Since
the ligands do contain impurities despite several purification steps the elemental
analysis is not quite as predicted for pure samples Chlorine was found to also be
present from residual triethylammonium chloride as identified by NMR spectroscopy in
addition to residual solvents despite prolonged drying under vacuum
Table 72 Elemental analysis results for modified DTPA ligands P = predicted
proportion present () A = actual proportion present ()
C () H () N () Cl () Na ()
Ligand P A P A P A P A P A
DTPA-(AlaOMe)2
4689 4224 662 685 1243 1146 0 475 0 0
DTPA-(ArgOMe)2
4583 3896 701 637 2100 1643 0 1427 0 0
DTPA-(SerOEt)2
4622 4300 663 755 1123 1041 0 240 0 0
DTPA-(HisOMe)2
4834 3985 594 668 1812 1458 0 595 0 0
216
755 Luminescence studies with modified DTPA ligands
7551 Stock solutions
A stock solution (10 mM 10 mL) was made up for Eu(NO3)3xH2O in H2O or
D2O as required Additionally a stock solution of HDEHP in n-dodecane (1935 g in
100 mL 06 M) was prepared All reagents were purchased from Sigma-Aldrich
Stock solutions
10 mM EuTb(NO3)3 in H2OD2O
06 M HDEHP in n-dodecane
7552 Preparation of aqueous samples
2 mL samples were prepared for aqueous phases The Eu(NO3)3 stock solution
(02 mL) was added calculated quantities of each ligand to make samples with
concentrations of 1 mM Eu(NO3)3 and 005 M ligand when made up to 2 mL with H2O
or D2O The pH of samples was adjusted individually with concentrated HNO3 and
NaOH to minimise change in volume using a Mettler Toledo Seven Compact pHion
Meter pD was calculated using Equation 71
7553 Preparation of extracted samples
Aqueous samples were prepared as above (Section 7413) Due to the small
quantities of ligand available pre-equilibration was not possible as the same samples
used for aqueous phase studies were subsequently used for extraction studies The
aqueous phases were contacted with HDEHP in n-dodecane (2 mL 06 M) The
solutions were then shaken using a Scientific Industries Vortex Genie 2 Mixer and
Shaker for 15 minutes left to settle and separated into the two phases for analysis
7554 Radiolysis of ligand samples
Radiolysis experiments on modified DTPA ligand systems were carried out
using the 60
Co irradiator at DCF These irradiations were undertaken at the same time as
the GSH irradiations at a later date than the initial amino acid radiolysis studies
(Section 722) using the new calibrated sample holder with known dose rates and so
preparation and use of a Fricke solution was not necessary Samples received an average
of 7 kGy γ radiation
217
76 Instruments
761 FTS MODEL 812 System 60
Co Irradiator
All irradiations at the Dalton Cumbrian Facility were carried out using a 60
Co
irradiator which can allow multiple dose rates as it comprises two individual source
rods Radiation is generated by the decay of 60
Co to 60
Ni causing emission of β-
particles and γ-rays
Samples (5 mL for amino acid and GSH systems 2 mL for modified DTPA
ligand systems) were transferred into glass vials with plastic screw tops and placed
inside the irradiator mounted on a pre-designed rig Multiple samples were able to be
irradiated at once due to the design of the sample holder (Figure 79)
Figure 79 60
Co Irradiator at DCF (left) sample holder (top right) and sample holder
inside the irradiator (bottom right)
762 Edinburgh Instrument FP920 Phosphorescence Lifetime Spectrometer
All luminescence studies were carried out using an Edinburgh Instrument FP920
Phosphorescence Lifetime Spectrometer Steady state emission and excitation spectra
were recorded in quartz cuvettes on an Edinburgh Instrument FP920 Phosphorescence
Lifetime Spectrometer equipped with a 5 watt microsecond pulsed xenon flashlamp
(with single 300 mm focal length excitation and emission monochromators in Czerny
Turner configuration) and a red sensitive photomultiplier in peltier (air cooled) housing
(Hamamatsu R928P) Lifetime data were recorded following excitation with the
flashlamp and using time correlated single photon counting (PCS900 plug-in PC card
for fast photon counting) Lifetimes were obtained by tail fit on the data obtained
218
Table 73 Emission and excitation wavelengths for Ln3+
ions
763 Packard Cobra II Gamma Counter
Activity in separation samples prepared at the INL was measured using a Cobra
II Gamma Counter an automated gamma counter Background samples were counted in
addition in order allow correction for background radiation levels Samples run on
automated protocols run until the counting error is within 1 or the sample has run for
20 minutes
764 Bruker UltrashieldTM
400 NMR Spectrometer
NMR measurements were carried out using a Bruker UltrashieldTM
400
spectrometer of operating frequency 400 MHz (1H) and 162 MHz (
13C) with a variable
temperature unit set at 295 K unless otherwise stated The instrument was controlled
remotely using Bruker Topspin 21 software
Ln3+
Emission (nm) Excitation (nm)
Eu 617 395
Tb 545 379
Sm 600 403
Dy 575 352
219
1 CB Şenvar Chemical Dosimetry of Gamma Rays Neutrons and Accelerated
Electrons University of Ankara 1959 1-28
2 JWT Spinks and RJ Woods An Introduction to Radiation Chemistry Wiley-
Interscience Canada 3rd edn 1990
3 HE Gottlieb V Kotlyar and A Nudelman J Org Chem 1997 62 7512-7515
220
APPENDICES
APPENDIX 1 - Emission spectra for [GSH] pH dependence studies with DTPA in H2O
Figure A Emission spectra of Eu3+
in H2O at pH 2 with 005 M Na5DTPA over a GSH
concentration range of 01 ndash 05 M following excitation at 397 nm
Figure B Emission spectra of Eu3+
in H2O at pH 3 with 005 M Na5DTPA over a GSH
concentration range of 01 ndash 05 M following excitation at 397 nm
00
02
04
06
08
10
12
14
550 600 650 700
Emis
sio
n In
ten
sity
(au
) x
10
00
0
Wavelength (nm)
01 M GSH
02 M GSH
03 M GSH
04 M GSH
05 M GSH
00
02
04
06
08
10
12
14
550 600 650 700
Emis
sio
n In
ten
sity
(au
) x
10
00
0
Wavelength (nm)
01 M GSH
02 M GSH
03 M GSH
04 M GSH
05 M GSH
221
Figure C Emission spectra of Eu3+
in H2O at pH 4 with 005 M Na5DTPA over a GSH
concentration range of 01 ndash 05 M following excitation at 397 nm
00
02
04
06
08
10
12
14
550 600 650 700
Emis
sio
n In
ten
sity
(au
) x
10
00
0
Wavelength (nm)
01 M GSH
02 M GSH
03 M GSH
04 M GSH
05 M GSH
222
APPENDIX 2 - SFLnAm for varying GSH concentration over a pH range of 2-4 with
005 M Na5DTPA after extraction with 02 M HDEHP in dodecane
Figure D SFLnAm for varying GSH concentration at pH 2 with 005 M Na5DTPA after
extraction with 02 M HDEHP in dodecane
Figure E SFLnAm for varying GSH concentration at pH 3 with 005 M Na5DTPA after
extraction with 02 M HDEHP in dodecane
0
5
10
15
20
25
30
35
40
56 57 58 59 60 61 62 63 64 65 66 67 68
Sep
arat
ion
Fac
tor
Atomic Number
01 M GSH
02 M GSH
03 M GSH
04 M GSH
05 M GSH
0
50
100
150
200
250
56 57 58 59 60 61 62 63 64 65 66 67 68
Sep
arat
ion
Fac
tor
Atomic Number
01 M GSH
02 M GSH
03 M GSH
04 M GSH
05 M GSH
223
APPENDIX 3 - Natural pH values for modified DTPA ligands (005 M) with Eu(NO3)3
(1 mM)
Table F Natural pH values for modified DTPA ligands (005 M) with Eu(NO3)3 (1
mM)
Ligand Natural pH with Eu(NO3)3
DTPA-(AlaOMe)2 243
DTPA-(ArgOMe)2 238
DTPA-(SerOEt)2 240
DTPA-(HisOMe)2 286
224
APPENDIX 4 - Emission spectra for Eu(NO3)3 with modified DTPA ligands in H2O
Figure G Emission spectra for Eu(NO3)3 with modified DTPA ligands in H2O at pH 2
Figure H Emission spectra for Eu(NO3)3 with modified DTPA ligands in H2O at pH 3
0
2
4
6
8
10
12
550 575 600 625 650 675 700
Emis
sio
n In
ten
sity
(au
) x
10
00
0
Wavelength (nm)
Ala-DTPA
Arg-DTPA
Hist-DTPA
Ser-DTPA
0
2
4
6
8
10
12
14
550 575 600 625 650 675 700
Emis
sio
n In
ten
sity
(au
) x
10
00
0
Wavelength (nm)
Ala-DTPA
Arg-DTPA
Hist-DTPA
Ser-DTPA
225
Figure I Emission spectra for Eu(NO3)3 with modified DTPA ligands in H2O at pH 4
0
1
2
3
4
5
6
7
8
9
10
550 575 600 625 650 675 700
Emis
sio
n In
ten
sity
(au
) x
10
00
0
Wavelength (nm)
Ala-DTPA
Arg-DTPA
Hist-DTPA
Ser-DTPA
226
APPENDIX 5 - Emission spectra for radiolysis studies on Eu(NO3)3 in H2O with
DTPA-di(amino acid) ligands
Figure J Emission spectra for Eu(NO3)3 in H2O with DTPA-di(amino acid) ligands
(005 M) at pH 2 after irradiation with 7 kGy γ-radiation
Figure K Emission spectra for Eu(NO3)3 in H2O with DTPA-di(amino acid) ligands
(005 M) at pH 3 after irradiation with 7 kGy γ-radiation
00
05
10
15
20
25
550 575 600 625 650 675 700
Emis
sio
n In
tem
sity
(au
) x
10
00
0
Wavelength (nm)
Ala-DTPA
Arg-DTPA
Hist-DTPA
Ser-DTPA
00
05
10
15
20
25
550 575 600 625 650 675 700
Emis
sio
n In
ten
sity
(au
) x
10
00
0
Wavelength (nm)
Ala-DTPA
Arg-DTPA
Hist-DTPA
Ser-DTPA
227
Figure L Emission spectra for Eu(NO3)3 in H2O with DTPA-di(amino acid) ligands
(005 M) at pH 4 after irradiation with 7 kGy γ-radiation
00
05
10
15
20
25
550 575 600 625 650 675 700
Emis
sio
n In
ten
sity
(au
) x
10
00
0
Wavelength (nm)
Ala-DTPA
Arg-DTPA
Hist-DTPA
Ser-DTPA
228
APPENDIX 6 - MALDI-MS spectrum for DTPA-(AlaOMe)2
[M+H]+
[M+Na]+ [M+K]
+
229
AP
PE
ND
IX 7
- 1H N
MR
spectru
m fo
r DT
PA
-(AlaO
Me)
2
230
GSH1ESP
45 40 35 30 25 20 15
Chemical Shift (ppm)
01
02
03
04
05
06
07
08
09
Norm
alize
d In
tensi
ty
Water
44
944
844
6
38
9
37
6 37
437
2 28
628
628
528
4
24
924
8 24
724
624
524
4
21
1 20
920
720
5
AP
PE
ND
IX 8
- 1H N
MR
spectru
m fo
r GS
H
231
EUGSHESP
45 40 35 30 25 20 15
Chemical Shift (ppm)
01
02
03
04
05
06
07
08
09
Norm
alized Inte
nsity
Water
45
044
844
7
41
8
38
037
837
7
37
136
9
30
230
1
28
7 28
628
4
24
9 24
724
624
423
323
1
21
020
820
720
5
AP
PE
ND
IX 8
a - 1H N
MR
spectru
m fo
r Eu(N
O3 )
3 + G
SH
232

5
331 Initial Tests with Other Amino Acids
332 Studies with L-Histidine
34 Summary of Separations with Amino Acid Buffers
References
4 Studies using L-Glutathione as a Buffer in a TALSPEAK
System
41 Solvent Extraction and Separation using GSH
411 [L-Glutathione] and pH Dependence
4111 [GSH] Dependence without Na5DTPA
4112 [GSH] and pH Dependence with
Na5DTPA
412 [Na5DTPA] Dependence at pH 4
413 [HDEHP] Dependence at pH 4
42 Luminescence Studies using GSH with Eu3+
421 [GSH] and pH Dependence without Na5DTPA
4211 Aqueous Phase Studies
4212 Extraction Studies
422 [GSH] and pH Dependence with Na5DTPA
4221 Aqueous Phase Studies
4222 Extraction Studies
423 [Na5DTPA] Dependence at pH 4
4231 Aqueous Phase Studies
4232 Extraction Studies
424 [HDEHP] Dependence at pH 4
43 Radiolysis Studies using GSH at pH 4
431 Aqueous Phase Studies
432 Extraction Studies
44 Luminescence Studies using GSH with Dy3+
441 Dy3+
Complexation Studies
442 pH Dependence Studies
45 Luminescence Studies using GSH with Mixed Ln3+
Systems at pH 4
451 Complexation Studies
452 pH Dependence Studies
119
120
121
123
124
127
127
127
127
132
133
136
137
137
139
140
140
143
145
145
148
149
151
151
153
154
155
156
157
157
160
6
46 ICP-MS Studies with GSH
47 1H NMR Studies on GSH Systems
48 Summary and Conclusion of Glutathione Work
References
5 Modified DTPA Ligands as Combined Buffers and Soft Donors
in a TALSPEAK System
51 Ligand Synthesis
52 Luminescence Studies on Ligand Systems at pH 2 3 and 4
521 Aqueous Phase Studies
522 Extraction Studies
53 Radiolysis Studies on Ligand Systems at pH 2
531 Aqueous Phase Studies
532 Extraction Studies
54 Separation Work on Ligand Systems
541 AmEu Separation in Ligand Systems
542 Ln Separation in Ligand Systems
55 Summary and Conclusion of Modified DTPA Ligand
Work
References
6 Summary Conclusions and Future Work
61 Summary amp Conclusions
62 Future Work
References
7 Experimental Section
71 Chemicals and Reagents
711 Handling Radioisotopes at INL
72 Complexation studies of Ln3+
amp An3+
with amino acids in
TALSPEAK systems
721 Preparation of samples for luminescence studies
7211 Stock solutions
7212 Preparation of aqueous samples
7213 Preparation of extracted samples
163
166
170
173
174
175
176
176
179
183
183
184
185
186
187
190
191
192
192
198
200
201
201
201
201
201
201
202
202
7
722 Radiolysis of samples
7221 Preparation of Fricke solution
7222 Calculating dose rates
73 Solvent extraction and separation studies using amino
acids and glutathione at INL
731 Preparation of samples
7311 Stock solutions for amino acid studies
7312 [Na5DTPA] dependence SX samples for
amino acid studies
7313 [HDEHP] dependence SX samples for
amino acid studies
7314 Other amino acid SX samples for amino
acid studies
7315 Stock solutions for glutathione studies
7316 [GSH] dependence SX samples without
Na5DTPA
7317 [GSH] and pH dependence SX samples
with Na5DTPA
7318 [Na5DTPA] dependence SX samples for
GSH studies
7319 [HDEHP] dependence SX samples for
amino acid studies
732 Gamma counting
733 ICP-MS
74 Luminescence studies and solvent extraction using
glutathione at UoM
741 Preparation of luminescence samples
7411 Stock solutions for GSH studies
7412 Preparation of aqueous samples
7413 Preparation of extracted samples
742 Radiolysis of GSH samples
74 Modified DTPA Ligands
751 Synthesis of modified DTPA ligands
752 Characterisation of modified DTPA ligands by
MALDI-MS
203
203
203
205
205
205
205
205
206
206
206
206
207
207
207
208
208
208
208
209
209
210
210
210
210
8
753 Characterisation of modified DTPA ligands by
NMR spectroscopy
7531 1H NMR Spectroscopy
7532 13
C NMR Spectroscopy
754 Characterisation of modified DTPA ligands by
elemental analysis
755 Luminescence studies with modified DTPA
ligands
7551 Stock solutions
7552 Preparation of aqueous samples
7553 Preparation of extracted samples
7554 Radiolysis of ligand samples
76 Instruments
761 FTS MODEL 812 System 60
Co Irradiator
762 Edinburgh Instrument FP920 Phosphorescence
Lifetime Spectrometer
763 Packard Cobra II Gamma Counter
764 Bruker UltrashieldTM
400 NMR Spectrometer
References
Appendices
Appendix 1 - Emission spectra for [GSH] pH dependence
studies with DTPA in H2O
Appendix 2 - SFLnAm for varying GSH concentration over a
pH range of 2-4 with 005 M Na5DTPA after
extraction with 02 M HDEHP in dodecane
Appendix 3 - Natural pH values for modified DTPA ligands
(005 M) with Eu(NO3)3 (1 mM)
Appendix 4 - APPENDIX 4 - Emission spectra for Eu(NO3)3
with modified DTPA ligands in H2O
Appendix 5 - Emission spectra for radiolysis studies on
Eu(NO3)3 in H2O with DTPA-di(amino acid)
ligands
Appendix 6 - MALDI-MS spectrum for DTPA-(AlaOMe)2
211
211
213
215
216
216
216
216
216
217
217
217
218
218
219
220
220
222
223
224
226
228
9
Appendix 7 - 1H NMR spectrum for DTPA-(AlaOMe)2
Appendix 8 - 1H NMR spectrum for GSH
Appendix 8a - 1H NMR spectrum for Eu(NO3)3 + GSH
Total Word Count 50439
229
230
231
10
LIST OF TABLES
Table 11 Electronic properties of the lanthanides
Table 12 Electronic properties of the actinides
Table 13 Available oxidation states of the actinides and colours of
ions in solution where applicable
Table 14 Luminescence of lanthanide ions
Table 15 Luminescence of actinide ions
Table 16 Approximate compositions of SNF in Light Water
Reactors (LWR)
Table 21 Luminescence lifetimes and q values for Eu3+
with amino
acidslactate
Table 22 Luminescence lifetimes and q values for [Eu(DTPA)]2-
with amino acidslactate
Table 23 Separation factors for Eu3+
Am3+
in the presence of L-
alanine at 05 M under TALSPEAK conditions when subjected
to different doses of γ-radiation
Table 24 Luminescence lifetimes for aqueous and organic phases for
[Eu(DTPA)]2-
systems before and after irradiation at pH 36
Table 25 Luminescence lifetimes and q values for [Eu(DTPA)]2-
systems before and after irradiation at pH 36
Table 31 Distribution ratios and separation factors for a number of
L-alanine buffered TALSPEAK systems as pH and buffer
concentration are varied compared to a traditional lactic acid
system
Table 32 Distribution ratios and separation factors for a number of
amino acid buffered TALSPEAK systems
Table 33 Separation factors for L-alanine optimisation studies
Table 34 DAm values for L-alanine optimisation studies
Table 35 Separation factors and DAmEu values for traditional
TALSPEAK systems with different buffers at varying pH
values
Table 41 Eu3+
Am3+
distribution and separation for [GSH]
dependence with 005 M Na5DTPA at pH 4
11
Table 42 Eu3+
Am3+
distribution and separation for [Na5DTPA]
dependence with 05 M GSH buffer at pH 4
Table 43 Eu3+
Am3+
distribution and separation for [HDEHP]
dependence with 03 M Na5DTPA and 05 M GSH buffer at
pH 4
Table 44 Eu3+
Am3+
distribution and separation for [HDEHP]
dependence with 04 M Na5DTPA and 05 M GSH buffer at
pH 4
Table 45 Luminescence lifetimes and q values for Eu3+
with GSH at
pHD 4
Table 46 J=1J=2 peak ratios and t-test results for Eu-DTPA at pD
2-4 over a GSH concentration range of 01-05 M following
excitation at 397 nm
Table 47 Luminescence lifetimes and q values for Eu-DTPA at pH
2-4 over a GSH concentration range of 01-05 M
Table 48 J=1J=2 peak ratios and t-test results for Eu-DTPA at pH
2-4 as [GSH] is varied
Table 49 J=1J=2 peak ratios and t-test results for Eu-DTPA with
05 M GSH in D2OH2O at pDpH 4 over a Na5DTPA
concentration range of 005-06 M
Table 410 Luminescence lifetimes and q values for Eu-DTPA with
05 M GSH at pH 4 over a Na5DTPA concentration range of
005-06 M following excitation at 397 nm
Table 411 J=1J=2 peak ratios and t-test results for Eu3+
in the
aqueous phase with 05 M GSH at pH 4 as [Na5DTPA] is
varied after extraction with 02 M HDEHP
Table 412 J=1J=2 peak ratios and t-test results for Eu3+
in the
aqueous phase with 05 M GSH and 03 M Na5DTPA at pH 4
as [HDEHP] is varied after extraction
Table 413 J=1J=2 peak ratios and t-test results for Eu-DTPA with
05 M GSH in D2OH2O at pDpH 4 over a Na5DTPA
concentration range of 01-06 M after irradiation with 7 kGy
γ-radiation
12
Table 414 Luminescence lifetimes and q values for Eu-DTPA with
05 M GSH at pH 4 over a Na5DTPA concentration range of
01-06 M after irradiation with 7 kGy γ-radiation
Table 414 Luminescence lifetimes and q values for Eu-DTPA with
05 M GSH at pH 4 over a Na5DTPA concentration range of
01-06 M after irradiation with 7 kGy γ-radiation
Table 415 J=1J=2 peak ratios and t-test results for Eu3+
in the
aqueous phase with 05 M GSH and at pH 4 as [Na5DTPA] is
varied after extraction with 02 M HDEHP in dodecane from
an aqueous phase irradiated at 7 kGy γ ndashradiation
Table 416 Luminescence lifetimes for lanthanide samples at pH 4
Table 417 Luminescence lifetimes and q values for Eu3+
and Tb3+
samples at pH 4
Table 418 Luminescence lifetimes for aqueous phases before
extraction over a pH range of 2-4
Table 419 Luminescence lifetimes and q values for Eu3+
and Tb3+
samples before extraction over a pH range of 2-4
Table 420 SFLnAm for varying GSH concentration over a pH range
of 2-4 with 005 M Na5DTPA after extraction with 02 M
HDEHP in dodecane
Table 51 J=1J=2 peak ratios and t-test results for Eu- DTPA-
bis(amino ester) complexes at pD 2-4
Table 52 Luminescence lifetimes and q values for Eu-DTPA-
bis(amino ester) complexes at pD 2-4 recorded at the emission
maximum (617 nm) following 397 nm excitation
Table 53 J=1J=2 peak ratios and t-test results for organic phases
after extraction after Eu3+
extraction aqueous phases
containing DTPA-bis(amino ester) ligands (50 mM) at pH 2-4
Table 54 J=1J=2 peak ratios and t-test results for Eu-DTPA-
bis(amino ester) complexes at pD 2 after irradiation with 7
kGy γ-radiation
Table 55 Luminescence lifetimes and q values for Eu-DTPA-
bis(amino ester) complexes at pD 2-4 after irradiation with 7
kGy γ-radiation
13
Table 56 J=1J=2 peak ratios and t-test results for the organic phases
after Eu3+
extraction from aqueous phases containing DTPA-
bis(amino ester) ligands (50 mM) at pH 2 one of which had
been irradiated with 7 kGy γ-radiation
Table 57 Luminescence lifetimes and q values for the organic
phases after Eu3+
extraction from aqueous phases containing
DTPA-bis(amino ester) ligands (50 mM) at pH 2 one of which
had been irradiated with 7 kGy γ-radiation
Table 71 Dose rates received at each sample position in the 60
Co
irradiator at DCF
Table 72 Elemental analysis results for modified DTPA ligands P =
predicted proportion present () A = actual proportion
present ()
Table 73 Emission and excitation wavelengths for Ln3+
ions
14
LIST OF FIGURES
Figure 11 Jablonski diagram showing fluorescence and
phosphorescence
Figure 12 Energy transfer pathway for sensitised luminescence of
Ln3+
complexes
Figure 13 Energy level diagram showing the ground and excited
states of a selection of lanthanides and vibrational oscillators
Figure 14 The energy gaps between the lowest emissive states and
ground states of a selection of lanthanides and actinides
Figure 15 Chain reaction generated by fission of 235
U into 92
Kr and
141
Ba
Figure 16 The Nuclear Fuel Cycle
Figure 17 Chemical structure of TBP (Tri-nbutyl phosphate)
Figure 18 PUREX flow diagram
Figure 19 Chemical structure of CMPO (NN-diisobutyl-2-
(octyl(phenyl)phosphoryl)acetamide)
Figure 110 TRUEX flow diagram
Figure 111 Chemical structure of DMDBTDMA
Figure 112 Chemical structure of DMDOHEMA
Figure 113 Example DIAMEX flow diagram
Figure 114 General chemical structure of BTPs
Figure 115 Chemical structure of TODGA
Figure 116 Chemical structure of HEDTA
Figure 117 SANEX flow diagram for TODGA process
Figure 118 General chemical structure of BTBPs
Figure 119 Chemical structure of CyMe4-BTBP
Figure 120 Chemical structure of CyMe4-BTPhen
Figure 121 GANEX flow diagram
Figure 122 Chemical structure of TRPO
Figure 123 Chemical structure of CYANEX 301
Figure 124 Chemical structure of TTHA
Figure 125 TRPO flow diagram using TTHA
Figure 126 TRPO flow diagram using HNO3 and oxalic acid
Figure 127 LUCA flow diagram
15
Figure 128 Chemical structure of TEDGA
Figure 129 Chemical structure of DTPA
Figure 130 Chemical structure of HDEHP
Figure 131 Chemical structure of HEH[ϕP]
Figure 132 Chemical structure of lactic acid pKa = 386
Figure 133 The solvent extraction process used in TALSPEAK Step
1 Binding of DTPA to M3+
in the aqueous phase at pH 36
buffered by lactic acid Step 2 Selective extraction of Ln3+
into the organic phase by HDEHP from the aqueous phase due
to preferential binding of DTPA to MA3+
Figure 134 Effect of Na5DTPA concentration on distribution ratios
of MA3+
and Ln3+
in TALSPEAK process using 1 M lactate
buffer and 03 M HDEHP in DIPB extractant
Figure 135 TALSPEAK flow diagram
Figure 21 XAS molecular structure of Gd(III)-DTPA
Figure 22 Chemical structure of [Eu(DTPA)]2-
Figure 23 1H NMR spectrum of [Eu(DTPA)]
2- in D2O at 278 K at
pD = 36
Figure 24 1H NMR spectra of DTPA in D2O at 278 K at varying pD
a) pD 7 [DTPA]5-
b) pD 36 [H3DTPA]2-
c) pD 2 [H5DTPA]
Figure 25 Emission spectrum of Eu3+
(aq) and [Eu(DTPA)]2-
in D2O
at pD 36
Figure 26 1H NMR spectrum for [Am(DTPA)xH2O]
2- in 41 vv
MeODD2O with NaOD over a temperature range at pH 3
Figure 27 Emission spectrum of Cm3+
and [Cm(DTPA)]2-
in
perchloric acid at pH 3 by direct excitation with a NdYAG
pumped dye laser at 3966 nm
Figure 28 Emission spectrum of Eu-lactate as a function of lactate
concentration
Figure 29 Co-ordination mode of lactate to Eu3+
Figure 210 Chemical structures of L-alanine (top) glycine (bottom
left) and L-serine (bottom right)
Figure 211 1H NMR spectrum of Eu(NO3)3xH2O (10 mM) with L-
alanine in D2O at 278 K
16
Figure 212 1H NMR spectrum of L-alanine in D2O at 278 K
Figure 213 1H NMR spectrum of [Eu(DTPA)]
2- (10 mM) with L-
alanine (1 M) in D2O at 278 K
Figure 214 Emission spectra of [Tb(DTPA)]2-
in D2O at pD 3 with
and without the presence of L-phenylalanine (05 M) excited at
250 nm and 379 nm Excitation spectrum of [Tb(DTPA)]2-
in
D2O at pD 3 with L-phenylalanine (05 M) at 545 nm
Figure 215 Chemical structure of L-phenylalanine
Figure 216 Emission spectra of Eu(NO3)3 in D2O at pD 36 with and
without the presence of amino acidslactate (1 M) excited at
395 nm at 298 K
Figure 217 Emission spectra of Eu-DTPA in D2O at pD 36 with and
without the presence of amino acidslactate (1 M) excited at
395 nm
Figure 218 Emission spectrum of [Cm(DTPA)]2-
in H2O with and
without L-alanine (25 mM) at pH 3 by direct excitation at 396
nm
Figure 219 Graph illustrating the rates of reaction of the middotOH radical
with L-alanine compared to lactic acid and the lactate ion
Figure 220 Distribution ratios for Ln3+
and Am3+
in the presence of
L-alanine at 05 M pH 2 at different doses of γ-radiation
Figure 221 Emission spectra of Eu3+
in D2O at pD 36 with and
without the presence of amino acidslactate excited at 395 nm
before 5 kGy γ-irradiation
Figure 222 Emission spectra of Eu3+
in D2O at pD 36 with and
without the presence of amino acidslactate excited at 395 nm
after 5 kGy γ-irradiation
Figure 31 The effect of pH on an L-alanine-buffered TALSPEAK
system
Figure 32 Distribution ratios of Ln3+
Y3+
in a TALSPEAK system 1
mM LnY3+
1 M lactate 005 M DTPA pH 7 extracted using
05 M HDEHP in 14-DIPB
Figure 33 The effect of buffer concentration on an L-alanine-
buffered TALSPEAK system
17
Figure 34 Chemical structures of L-arginine (top) L-histidine
(bottom left) and L-methionine (bottom right)
Figure 35 DTPA speciation as a function of pH modelled using
HySS sofware using literature pKa values
Figure 36 [Na5DTPA] dependence of L-alanine system (05 M) at
pH 2
Figure 37 Eu3+
Am3+
separation for [Na5DTPA] dependence of L-
alanine system (05 M) at pH 2
Figure 38 Eu3+
Am3+
separation for [HDEHP] dependence of L-
alanine system (05 M) at pH 2 using 02 M Na5DTPA
Figure 39 Eu3+
Am3+
separation for [HDEHP] dependence of L-
alanine system (05 M) at pH 2 using 03 M Na5DTPA
Figure 310 Eu3+
Am3+
separation for [HDEHP] dependence of L-
alanine system (05 M) at pH 2 using 04 M Na5DTPA
Figure 311 Distribution ratios of La3+
-Ho3+
and Am3+
with 05 M L-
histidine buffer at pH 2 and pH 3
Figure 41 Molecular structures of eisenin (top) and norophthalmic
acid (bottom)
Figure 42 Molecular structures of biotinvitamin B7 (top) and folic
acid vitamin B9 (bottom)
Figure 43 Molecular structure of L-glutathione (reduced form)
Figure 44 Eu3+
Am3+
distribution for [GSH] dependence with 005
M Na5DTPA at pH 2 extracted using 02 M HDEHP in
dodecane Results were averaged from 3 repeat tests
Figure 45 Eu3+
Am3+
distribution for [GSH] dependence with 005
M Na5DTPA at pH 3 extracted using 02 M HDEHP in
dodecane Results were averaged from 3 repeat tests
Figure 46 Eu3+
Am3+
distribution for [GSH] dependence with 005
M Na5DTPA at pH 4 Results were averaged from 3 repeat
tests
Figure 47 GSH speciation as a function of pH modelled using
HySS software using literature pKa values
Figure 48 H2GSH- species dominant in solution at pH 4
18
Figure 49 A ternary Nd DO3A-pyrazine amine carboxylate complex
reported by Faulkner at al (left) and anticipated bidentate
chelation of GSH with Am-DTPA at pH 4 (right)
Figure 410 Eu3+
and Am3+
distribution for [Na5DTPA] dependence
with 05 M GSH buffer at pH 4 curves fitted as polynominal
order 2 for both Am3+
and Eu3+
Results were averaged from 3
repeat tests
Figure 411 Eu3+
and Am3+
distribution for [HDEHP] dependence
with 03 M Na5DTPA and 05 M GSH buffer at pH 4 curve
for Eu3+
fitted as polynominal order 2 linear correlation for
Am3+
Results were averaged from 3 repeat tests
Figure 412 Eu3+
and Am3+
distribution for [HDEHP] dependence
with 04 M Na5DTPA and 05 M GSH buffer at pH 4 linear
correlation for both Am3+
and Eu3+
Results were averaged
from 3 repeat tests
Figure 413 Corrected emission spectra of Eu(NO3)3 (1 mM)
Eu(NO3)3 with GSH (05 M) and Eu(NO3)3 with Na5DTPA
(005 M) in H2O following excitation at 397 nm
Figure 414 Emission spectra of Eu(NO3)3 in H2O at pH 4 over a
GSH concentration range of 01 ndash 05 M following excitation
at 397 nm
Figure 415 Emission spectra of Eu(NO3)3 in D2O at pH 4 over a
GSH concentration range of 01 ndash 05 M following excitation
at 397 nm
Figure 416 Emission spectra of aqueous and organic phases after
Eu3+
extraction at pH 4 using a GSH concentration range of
01 ndash 05 M following excitation at 397 nm
Figure 417 Emission spectra of Eu3+
in D2O at pD 2 with 005 M
Na5DTPA over a GSH concentration range of 01 ndash 05 M
following excitation at 397 nm
Figure 418 Emission spectra of Eu3+
in D2O at pD 3 with 005 M
Na5DTPA over a GSH concentration range of 01 ndash 05 M
following excitation at 397 nm
19
Figure 419 Emission spectra of Eu3+
in D2O at pD 4 with 005 M
Na5DTPA over a GSH concentration range of 01 ndash 05 M
following excitation at 397 nm
Figure 420 Emission spectra of aqueous phases after Eu3+
extraction
at pH 2-4 over a GSH concentration range of 01-05 M
following excitation at 397 nm
Figure 421 Emission spectra of organic phases after Eu3+
extraction
at pH 2-4 over a GSH concentration range of 01-05 M
following excitation at 397 nm
Figure 422 Emission spectra of Eu(NO3)3 in D2O at pD 4 with 05
M GSH over a Na5DTPA concentration range of 005 ndash 06 M
following excitation at 397 nm
Figure 423 Emission spectra of Eu(NO3)3 in H2O at pH 4 with 05
M GSH over a Na5DTPA concentration range of 005 ndash 06 M
following excitation at 397 nm
Figure 424 Emission spectra of aqueous and organic phases after
Eu3+
extraction with 05 M GSH at pH 4 over a Na5DTPA
concentration range of 005-06 M following excitation at 397
nm
Figure 425 Emission spectra of aqueous phases after Eu3+
extraction
with 05 M GSH and 03 M Na5DTPA at pH 4 over an
HDEHP concentration range of 02-10 M following
excitation at 397 nm
Figure 426 Emission spectra of organic phases after Eu3+
extraction
with 05 M GSH and 03 M Na5DTPA at pH 4 over an
HDEHP concentration range of 02-10 M following
excitation at 397 nm
Figure 427 Emission spectra of Eu(NO3)3 in H2O at pH 4 with 05
M GSH over a Na5DTPA concentration range of 005 ndash 06 M
after irradiation with 7 kGy γ-radiation following excitation at
397 nm
Figure 428 Emission spectra of aqueous and organic phases after
Eu3+
extraction from irradiated aqueous phase at pH 4
containing 05 M GSH over a Na5DTPA concentration range
of 01-06 M
20
Figure 429 Emission spectra of Dy(NO3)3 Dy-DTPA and Dy(NO3)3
with GSH in H2O following excitation at 352 nm Note that
the tail of ligand emission can be seen in the Dy DTPA and
Dy GSH solutions at shorter wavelengths
Figure 430 Emission spectra of aqueous and organic phases of
Dy(NO3)3 Dy-DTPA and Dy(NO3)3 with GSH after extraction
with 10 M HDEHP following excitation at 352 nm
Figure 431 Emission spectra of aqueous and organic phases of
Dy(NO3)3 Dy-DTPA and Dy(NO3)3 with GSH after extraction
with 10 M HDEHP following 352 nm excitation
Figure 432 Emission spectra of Ln(NO3)3 (1 mM EuTbSm3+
10
mM Dy3+
) in H2O at pH 4 following direct excitation (405 nm
for Sm3+
397 nm for Eu3+
366 nm for Tb3+
and 352 nm for
Dy3+
)
Figure 433 Emission spectra of Ln(NO3)3 (1 mM EuTbSm3+
10
mM Dy3+
) with GSH (05 M) at pH 4 in H2O following direct
excitation (405 nm for Sm3+
397 nm for Eu3+
366 nm for Tb3+
and 352 nm for Dy3+
)
Figure 434 Emission spectra of Ln-DTPA (1 mM EuTbSm3+
10
mM Dy3+
005 M Na5DTPA) in H2O at pH 4 following direct
excitation (405 nm for Sm3+
397 nm for Eu3+
366 nm for Tb3+
and 352 nm for Dy3+
)
Figure 435 Emission spectra of Ln(NO3)3 (1 mM EuTbSm3+
10
mM Dy3+
) with GSH (05 M) and Na5DTPA (005 M)
following direct excitation (405 nm for Sm3+
397 nm for Eu3+
366 nm for Tb3+
and 352 nm for Dy3+
)
Figure 436 Emission spectra of aqueous and organic phases of Ln3+
with 05 M GSH and 005 M Na5DTPA after extraction with
10 M HDEHP at pH 2 following direct excitation (405 nm for
Sm3+
397 nm for Eu3+
366 nm for Tb3+
and 352 nm for Dy3+
)
Figure 437 Emission spectra of aqueous and organic phases of Ln3+
with 05 M GSH and 005 M Na5DTPA after extraction with
10 M HDEHP at pH 3 following direct excitation (405 nm for
Sm3+
397 nm for Eu3+
366 nm for Tb3+
and 352 nm for
Dy3+
)
21
Figure 438 Emission spectra of aqueous and organic phases of Ln3+
with 05 M GSH and 005 M Na5DTPA after extraction with
10 M HDEHP at pH 4 following direct excitation (405 nm for
Sm3+
397 nm for Eu3+
366 nm for Tb3+
and 352 nm for
Dy3+
)
Figure 439 DLn for varying GSH concentration at pH 2 with 005 M
Na5DTPA after extraction with 02 M HDEHP in dodecane
Figure 440 DLn for varying GSH concentration at pH 3 with 005 M
Na5DTPA after extraction with 02 M HDEHP in dodecane
Figure 441 1H NMR spectra for GSH in D2O under a range of
conditions at 298 K a) GSH b) GSH after irradiation with 7
kGy γ-radiation c) Eu(NO3)3 with GSH d) GSH with
Na5DTPA e) Eu-DTPA with GSH
Figure 442 1H
1NMR proton assignments for GSH (top) and γ-Glu-
Cys (bottom)
Figure 51 General structure of DTPA-amino acid ligands
Figure 52 Emission spectra of Eu(NO3)3 with DTPA-bis(amino
ester) ligands in D2O at pD 2 following excitation at 397 nm
Figure 53 Emission spectra of Eu(NO3)3 with DTPA-bis(amino
ester) ligands in D2O at pD 3 following excitation at 397 nm
Figure 54 Emission spectra of Eu(NO3)3 with DTPA-bis(amino
ester) ligands in D2O at pD 4 following excitation at 397 nm
Figure 55 Emission spectra of aqueous phases after Eu3+
extraction
from an aqueous phase containing DTPA-bis(amino ester)
ligands (50 mM) at pH 2 following excitation at 397 nm
Figure 56 Emission spectra of aqueous and organic phases after Eu3+
extraction from an aqueous phase containing DTPA-bis(amino
ester) ligands (50 mM) at pH 2 following excitation at 397
nm
Figure 57 Emission spectra of aqueous and organic phases after Eu3+
extraction from an aqueous phase containing DTPA-bis(amino
ester) ligands (50 mM) at pH 3 following excitation at 397
nm
22
Figure 58 Emission spectra of aqueous and organic phases after Eu3+
extraction from an aqueous phase containing DTPA-bis(amino
ester) ligands (50 mM) at pH 4 following excitation at 397
nm
Figure 59 Emission spectra of Eu(NO3)3 in D2O with DTPA-
bis(amino ester) ligands (50 mM) at pH 2 after irradiation
with 7 kGy γ- radiation and following excitation at 397 nm
Figure 510 Emission spectra of aqueous and organic phases after
Eu3+
extraction from an irradiated (7 kGy γ-radiation) aqueous
phase containing DTPA-bis(amino ester) ligands (50 mM) at
pH 2 following excitation at 397 nm
Figure 511 Separation factors and distribution ratios for Eu3+
Am3+
using DTPA-(ArgOMe)2 (005 M) at pH 1-2 extracted using
HDEHP (02 M) in kerosene
Figure 512 Separation factors and distribution ratios for Eu3+
Am3+
using DTPA-(SerOEt)2 (005 M) at pH 1-2 extracted using
HDEHP (02 M) in kerosene
Figure 513 Separation factors and distribution ratios for Eu3+
Am3+
using DTPA-(HisOMe)2 (005 M) at pH 1-2 extracted using
HDEHP (02 M) in kerosene
Figure 514 Distribution ratios for Ln3+
using DTPA-(ArgOMe)2
(005 M) at pH 1-2 extracted using HDEHP (02 M) in
kerosene
Figure 515 Distribution ratios for Ln3+
using DTPA-(SerOEt)2 (005
M) at pH 1-2 extracted using HDEHP (02 M) in kerosene
Figure 516 Distribution ratios for Ln3+
using DTPA-(HisOMe)2
(005 M) at pH 1-2 extracted using HDEHP (02 M) in
kerosene
Figure 61 Chemical structures of amino acids
Figure 71 1H NMR proton assignments for DTPA-(AlaOMe)2
Figure 72 1H NMR proton assignments for DTPA-(ArgOMe)2
Figure 73 1H NMR proton assignments for DTPA-(SerOEt)2
Figure 74 1H NMR proton assignments for DTPA-(HisOMe)2
Figure 75 13
C NMR carbon assignments for DTPA-(AlaOMe)2
Figure 76 13
C NMR carbon assignments for DTPA-(ArgOMe)2
23
Figure 77 13
C NMR carbon assignments for DTPA-(SerOEt)2
Figure 78 13
C NMR carbon assignments for DTPA-(HisOMe)2
Figure 79 60
Co Irradiator at DCF (left) sample holder (top right)
and sample holder inside the irradiator (bottom right)
24
ABSTRACT
The University of Manchester
Madeleine Hilton Langford Paden
PhD
Development of a Simplified Soft-Donor Technique for Trivalent Actinide-Lanthanide
Separations
2015
The necessity of reprocessing spent nuclear fuel has arisen from increasing
awareness and concern for the environment in addition to the potential of minimising
proliferation A number of different reprocessing techniques are currently being
developed around the world to allow useful spent nuclear fuel (SNF) to be recycled and
reused and the remaining waste to be treated One such technique currently being
developed in the USA is the TALSPEAK process an advanced reprocessing method for
the separation of trivalent lanthanide (Ln3+
) and minor actinide (MA3+
) components
This process developed in the 1960s at Oak Ridge National Laboratory uses DTPA to
act as a holdback reagent for MA3+
in a lactate buffered aqueous phase at pH 36
allowing Ln3+
to be selectively extracted by organophosphate HDEHP into an organic
phase of DIPB or dodecane
TALSPEAK is one of the most promising techniques being researched due to its
numerous advantages particularly its relative resistance to radiolysis and its ability to
be carried out without the need for high reagent concentrations Additionally it gives
high separation factors in the region of ~50-100 comparable to other advanced
reprocessing methods under development The chemistry of the process is very complex
and not particularly well understood so it would be advantageous to simplify the process
by removing the need for a separate holdback reagent and buffer
In collaboration with colleagues at the Idaho National Lab the use of amino
acids as a potential combined buffer and soft donor was investigated Although it was
found that amino acids do not act as holdback reagents in their own right optimisation
of an L-alanine buffered TALSPEAK system with DTPA was found to allow the
process to be carried out effectively at a lower pH of 2 which is more preferable for
industrial application
As an extension of this separation studies were carried out using the tripeptide
L-glutathione (GSH) to determine its potential for use as a combined buffer and soft-
donor As with the studies with amino acids it was found that GSH also does not act as
a holdback reagent in its own right however it does interact with Ln-DTPA complexes
at pH 4 When optimised at this pH separation factors of up to 1200 were achieved for
Eu3+
Am3+
whilst still maintaining low MA3+
partitioning However further studies by
ICP-MS and luminescence spectroscopy showed that a GSH buffered system was not
effective for extraction of heavier lanthanides although the results show the potential
for further investigation into other short and longer chain peptide buffered systems and
possibly lanthanide-lanthanide separations
Further studies were carried on amino acid appended DTPA ligands which were
synthesised in a one step reaction in order to create a combined buffer and soft donor
The ligands were found to self-buffer at around pH 2 and allow successful separation of
Eu3+
Am3+
(SF ~ 100) The results from initial investigations by luminescence
spectroscopy and solvent extraction are promising and are presented here Further work
is needed on these systems in order to optimise their extraction capability and minimise
Am3+
partitioning In the future this work could promote studies for better
understanding of TALSPEAK chemistry that could be used in industrial partitioning
processes
25
DECLARATION
No portion of the work referred to in the thesis has been submitted in support of an
application for another degree or qualification of this or any other university or other
institute of learning
26
COPYRIGHT STATEMENT
The author of this thesis (including any appendices andor schedules to this thesis) owns
certain copyright or related rights in it (the ldquoCopyrightrdquo) and she has given The
University of Manchester certain rights to use such Copyright including for
administrative purposes
ii Copies of this thesis either in full or in extracts and whether in hard or electronic
copy may be made only in accordance with the Copyright Designs and Patents Act
1988 (as amended) and regulations issued under it or where appropriate in accordance
with licensing agreements which the University has from time to time This page must
form part of any such copies made
iii The ownership of certain Copyright patents designs trade marks and other
intellectual property (the ldquoIntellectual Propertyrdquo) and any reproductions of copyright
works in the thesis for example graphs and tables (ldquoReproductionsrdquo) which may be
described in this thesis may not be owned by the author and may be owned by third
parties Such Intellectual Property and Reproductions cannot and must not be made
available for use without the prior written permission of the owner(s) of the relevant
Intellectual Property andor Reproductions
iv Further information on the conditions under which disclosure publication and
commercialisation of this thesis the Copyright and any Intellectual Property andor
Reproductions described in it may take place is available in the University IP Policy
(see httpdocumentsmanchesteracukDocuInfoaspxDocID=487) in any relevant
Thesis restriction declarations deposited in the University Library The University
Libraryrsquos regulations (see httpwwwmanchesteracuklibraryaboutusregulations) and
in The Universityrsquos policy on Presentation of Theses
27
ACKNOWLEDGEMENTS
Firstly I would like to thank my University supervisors Dr Louise Natrajan and
Dr Clint Sharrad for their support and encouragement during my PhD and for their help
and guidance when needed I would also like to thank Dr Leigh Martin my industrial
supervisor at the Idaho National Lab for the opportunity to work there and gain valuable
new experience
For all of his help in the lab general advice and knowledge on the TALSPEAK
process I would particularly like to thank Dr Travis Grimes from the INL - I could not
have done it without you - and for much of the help and advice I received in
Manchester (as well as lending an ear when I needed to vent) I would like to thank Dr
Adam Swinburne
Thank you also to Dr Andreas Geist for conducting some separation studies for
me at KIT-INE Your contributions have been very valuable and I am most grateful for
all of your help
Sarah Hendley Kevin Beal Andrew Alker and Adrien Moll as Masters and
placement students have helped with various parts of the work in this thesis and
deserve great thanks for their contributions Additionally thank you to Dr Michael
Andrews for helping Adrien so much in the lab whilst I was finishing off my
experiments and beginning to write up my thesis I appreciate the time you spent even
though you had so much to do yourself
Further thanks to Prof Simon Pimblott Greg Horne and Logan Barr for
accommodating me and my Masters students at DCF for irradiation studies and to Greg
especially for giving up your precious time to help us
Dr Tamara Griffiths and Dr Catherine Riddle made working in the lab at the
INL a very enjoyable experience for me and kept me sane and encouraged in times of
desperation Many thanks to you wonderful ladies Also thank you to the Aqueous
Separations and Radiochemistry group (Jack Leigh Peter Travis Rocky Dean Cathy
Bruce Guy and Brandi) Terry Todd and other staff at the INL (Steve Chris Jake all
of the radcons the Analytical group and other placement students) who likewise made
me feel very welcome in a place so far from home
I would additionally like to thank Teams NatrajanMillsSharrad (Sean Adam
Simon Lucy Lizzie Debbie Chloe Mike Pete Kathryn Toria Jen (honorary
member) Dr David Mills Ally Conrad Aruna Helen Tamara Kate Dan Chris
Dave Charles Peter Zana Rich Hugues and Tim) and the Centre for Radiochemistry
28
Research at the University of Manchester for general lab help and support and for
making Manchester a great place to work And to my conference buddies Tamara
Debbie Kate and Adam for making conferences as much about the social side as the
work
Thank you to the INL KIT and Diamond Light Source for the opportunities to
carry out work using their specialist equipment and to Dr Louise Natrajan Dr Sean
Woodall Dr Daniel Whittaker Dr Tamara Griffiths Dr Clint Sharrad Dr Leigh Martin
and Dr Travis Grimes for helping with some of the work carried out
I could not have done this PhD without funding from Batelle Energy Alliance
through the INL and the University of Manchester so thank you
On a personal note a big thank you to Steph my room mate for making my 9
months living in Idaho so much fun And also to Cathy and Glen Shelby Natalie and
Leigh and Marie for all the fun times too Lastly but not least I would like to give huge
thanks to my (non-chemistry non-Idaho) friends and family for their support over the
past 4 years especially my wonderful husband Lee - youre amazing and my rock as
always - and my parents for everything over the past 26 years
It was worth it in the end
29
LIST OF SYMBOLS amp UNITS
gt greater than
˂ less than
plusmn plus or minus
percent
degC degrees Celsius
α alpha
β beta
γ gamma
δ chemical shift
Δ change in
ε molar extinction coefficient
λ wavelength
microL microlitres
micros microseconds
ρ density
τ lifetime
ν frequency
ν= energy level
wavenumber
Aring angstroms
A proportionality constant for q taking into account the
inner hydration sphere
ABS optical density difference between ODi and ODb
amu atomic mass units
au arbitrary units
B correction factor for q taking into account the outer
hydration sphere
Bq Becquerel
cm centimetres
D (pD D2O MeOD) deuterium
dm3 decimetres cubed (litres)
E energy
F Faradays constant
30
g grams
G critical dose value
Gy Gray
h Plancks constant
Hz Hertz
J Joules
J= rotational energy level
K Kelvin
kBq kiloBecquerel
kg kilograms
kGy kiloGray
kJ kiloJoules
L litres
log β stability constant
M molar (moldm-3
)
mg milligrams
MHz megaHertz
min minute(s)
mL millilitres
mm millimetres
mM millimolar
mol moles
mmol millimoles
ms milliseconds
ng nanograms
nm nanometres
ns nanoseconds
ODi optical density of irradiated solution
ODb optical density of non-irradiated control solution
ppm parts per million
s seconds
t time
Zeff effective nuclear charge
31
LIST OF ABBREVIATIONS amp ACRONYMS
An actinides
aq aqueous
BT nack-energy Transfer
BTBP bis-triazinbipyridine
BTP bis-triazinylpyridine
CEA Commissariat agrave lrsquoEacutenergie Atomique et aux Eacutenergies
Alternatives
CE-ICP-MS capillary electrophoresis ndash inductively coupled plasma ndash
mass spectrometry
cf confer Latin compare
CMPO carbomoylmethylphosphine oxide
CP corrosion products
CYANEX 301 bis(244-trimethylpentyl)phosphinodithioic acid
CyMe4-BTBP 66-bis(5588-tetramethyl-5678-tetrahydrobenzo
[e][124]triazin-3-yl)-22-bipyridine
D distribution ratio
DCF Dalton Cumbrian Facility
DEPT distortionless enhancement by polarization transfer
DFT density functional theory
DIAMEX DIAMide EXtraxtion
DIPB diisopropyl benzene
DMDBTDMA dimethyldibutyltetradecylmalonamide
DMDOHEMA dimethyldicotylhexylethoxymalonamide
DMF dimethylformamide
DNA deoxyribonucleic acid
DO3A 147 tris(carboxymethyl) 14710 tetraazacyclododecane
DOTA 14710-tetraazacyclododecane-14710-tetraacetic acid
DTPA diethylenetriaminepentaacetic Acid
EC electron capture
EDTA ethylenediaminetetraacetic acid
eg exempli gratia Latin for example
ET electron transfer
32
et al et alli Latin and others
EURACT-NMR Transnational Access to Unique European Actinide and
Radiological NMR Facilities
EXAm EXtraction of Americium
FP fission products
GANEX Grouped ActiNide EXtraction
GSH glutathione
HDEHP (di-(2ethylhexyl)phosphoric acid
HEH[ΦP] (2-ethylhexyl)phenylphosphonic acid
HEH[EHP] (2-ethylhexyl)phosphonic acid mono-2-ethylhexyl ester
HEDTA (2-hydroxyethyl) ethylenediaminetatraacetic acid
HSQC heteronuclear single quantum correlation
I ionic strength
IC internal conversion
ICP-MS inductively coupled plasma ndash mass spectrometry
ie id est Latin that is
INL Idaho National Laboratory
IR infra-red
iSANEX Innovative SANEX
ISC inter-system crossing
KIT-INE Karlsruhe Institute of Technology - Institut fuumlr Nukleare
Entsorgung (Institute for Nuclear Waste Disposal)
Lac lactate
LASER light amplification by stimulated emission of radiation
LINAC linear accelerator
Ln lanthanides
LUCA Lanthaniden Und Curium Americium trennung
LWR light water reactor
M metal
MA minor actinides
MALDI-MS matrix-assisted laser desorption ionization mass
spectrometry
MOX mixed oxide
MRI magnetic resonance imaging
Nd-YAG neodymium-yttrium aluminium garnet
33
nIR near-infra-red
NMR nuclear magnetic resonance
NPH normal paraffinic hydrocarbon
NR non-radiative decay
org organic
PPE personal protective equipment
PUREX Plutonium and Uranium Refinement by EXtraction
q number of solvent molecules in the inner hydration sphere
SANEX Selective ActiNide EXtraction
SF separation factor
SNF spent nuclear fuel
SX solvent extraction
TALSPEAK Trivalent Actinide Lanthanide Separation by Phosphorus
reagent Extraction from Aqueous Complexation
TALSQuEAK Trivalent Actinide Lanthanide Separation using Quicker
Extractants and Aqueous Complexes
TBP tributyl phosphate
TEA triethylamine
TEDGA NNNrsquoNrsquo-tetraethyl-diglycolamide
TEHP tris(2-ethylhexyl)phosphate
TM transition metals
TODGA tetraoctyldiglycolamide
TPH tetrapropylene hydrogenated
TRLFS time-resolved LASER-induced fluorescence spectrocopy
TRPO trialkylphosphine oxide
TRUEX TRans-Uranic EXtraction
TTHA triethylenetetramine hexaacetate
SF spontaneous fission
SNF spent nuclear fuel
UoM The University of Manchester
UV ultra-violet
UV-vis ultra-violet-visible
vs versus Latin against
XAS x-ray absorption spectroscopy
34
AMINO ACID ABBREVIATIONS
Amino Acid 3 Letter Abbreviation
Alanine Ala
Arginine Arg
Asparagine Asn
Aspartic acid Asp
Cysteine Cys
Glutamic Acid Glu
Glutamine Gln
Glycine Gly
Histidine His
Isoleucine Ile
Leucine Leu
Lysine Lys
Methionine Met
Phenylalanine Phe
Proline Pro
Serine Ser
Threonine Thr
Tryptophan Trp
Tyrosine Tyr
Valine Val
35
1 INTRODUCTION
11 The Actinides and Lanthanides
111 Background
The ldquorare earthrdquo or lanthanide elements (Ln) can be found between barium and
hafnium in the periodic table in the first of the two rows containing the f-block
elements The f-block elements are all metallic and have 4f or 5f valence electron
subshells the lanthanides Ce-Lu are also often referred to as the ldquo4frdquo elements1
Although often considered to be part of the lanthanide series lanthanum is not usually
considered to be a ldquo4frdquo element as it has no f-electrons The 4f elements all have
relatively high abundances despite often being termed the ldquorare earthrdquo elements except
for promethium (Pm) which is radioactive and does not occur in nature2 All of the 4f
elements except promethium were discovered and had all successfully been isolated by
the early 20th
century Promethium was not discovered until 19473
The actinide elements (An) can be found between radium and rutherfordium in
the periodic table and are also known as the 5f elements as their valence shell is the 5f
shell They are all radioactive as none of them have any stable isotopes Although often
considered to be part of the actinide series actinium is not usually considered to be a
ldquo5frdquo element due to its electronic configuration of 5f 0 Despite this thorium which also
has a ground state electronic configuration of 5f 0 is considered to be a 5f element The
first actinide element to be discovered was uranium which was discovered in 1789 by
Klaproth in the mineral pitchblende Thorium and protactinium had also both been
discovered by 1913 but the later actinides were not synthesised until the Second World
War initially by Seaborg4
112 Sources of the Lanthanides and Actinides
The naturally occurring lanthanide elements are found in two minerals
primarily monazite and bastnaumlsite which are ores of mixed lanthanide metals and have
the general formulae LnPO4 and LnCO3F respectively Monazite also contains
radioactive thorium so is the less favourable of the two sources of lanthanides
commercially5
Ac Th Pa and U are the only naturally occurring actinide (An) elements
Uranium is less abundant than thorium (24 ppm vs 81 ppm) in the Earthrsquos crust but is
found in numerous minerals in oxide form including pitchblende (uraninite) and
36
carnotite Protactinium is one of the rarest elements in the world and is found at trace
levels in some uranium ores
The remaining 11 (Np-Lr) elements in the An series must be synthesised
Neptunium to fermium can be synthesised by neutron bombardment whereby a neutron
is captured by a heavy element atom and a γ-ray is emitted This is followed by the
emission of a β- particle in a β
- decay process to form a new element with an increased
atomic mass (see Scheme 11) However as this is a relatively improbable process
synthesis of the heaviest elements is impossible by this method and so synthesis of the
heavier elements is carried out by bombardment with light atoms although again this is
also an unfavourable reaction6
238U (n γ)
239U rarr
239Np rarr
239Pu (n γ)
240Pu (n γ)
241Pu rarr
241Am (n γ)
242mAm rarr
242Cm
Scheme 11 Formation of 242
Cm by a series of neutron capture and β- decay
processes6
113 Properties of the 4f Elements
The shapes of the f -orbitals have a variety of different representations dependent
on molecular symmetry The electron configurations for the metals and Ln3+
ions can be
seen in Table 11 along with values for the third and fourth ionisation energies
Gadolinium (Gd) and lutetuim (Lu) both have a 5d electron giving more stable half-full
or full 4f orbitals respectively Cerium (Ce) is also thought to possess a 5d electron The
most common oxidation state for the lanthanide ions is +3 whereby both of the 6s
electrons and either the 5d electron (if applicable) or one 4f electron are lost The first
two ionisation energies of the lanthanide elements are all relatively low corresponding
to the removal of the 6s electrons The third ionisation energy is also sufficiently low to
allow the generation of the Ln3+
ion in each case by removal of the 5d electron or a 4f
electron The fourth ionisation energies are generally significantly higher as the 4f
orbital becomes more stabilised as the first three electrons are removed This makes the
+4 oxidation state rare but can be formed by Ce Pr and Tb under certain conditions
Samarium (Sm) europium (Eu) and ytterbium (Yb) can form Ln2+
ions relatively
readily
β- β
- β
- β
-
23 mins 23 days 13 years 16 hours
37
Table 11 Electronic properties of the lanthanides 7
Symbol Name Electron
Configuration
(Metal)
Electron
Configuration
(Ln3+
)
3rd
Ionisation
Energy
(kJmol-1
)
4th
Ionisation
Energy
(kJmol-1
)
La Lanthanum [Xe]5d16s
2 [Xe] 1850 4819
Ce Cerium [Xe]4f15d
16s
2 [Xe]4f
1 1949 3547
Pr Praseodymium [Xe]4f36s
2 [Xe]4f
2 2086 3761
Nd Neodymium [Xe]4f46s
2 [Xe]4f
3 2130 3899
Pm Promethium [Xe]4f56s
2 [Xe]4f
4 2150 3970
Sm Samarium [Xe]4f66s
2 [Xe]4f
5 2260 3990
Eu Europium [Xe]4f76s
2 [Xe]4f
6 2404 4110
Gd Gadolinium [Xe]4f75d
16s
2 [Xe]4f
7 1990 4250
Tb Terbium [Xe]4f96s
2 [Xe]4f
8 2114 3839
Dy Dysprosium [Xe]4f10
6s2 [Xe]4f
9 2200 4001
Ho Holmium [Xe]4f11
6s2 [Xe]4f
10 2204 4100
Er Erbium [Xe]4f12
6s2 [Xe]4f
11 2194 4115
Tm Thulium [Xe]4f13
6s2 [Xe]4f
12 2285 4119
Yb Ytterbium [Xe]4f14
6s2 [Xe]4f
13 2415 4220
Lu Lutetium [Xe]4f14
5d16s
2 [Xe]4f
14 2022 4360
114 Properties of the 5f Elements
As previously stated the valence electron sub-shell for the actinides is the 5f
shell The electron configuration of the actinides is shown in Table 12 Thorium has no
5f electron but has 6d2 configuration as an empty 5f shell is more favoured Curium has
a 6d electron giving rise to a more stable half full 5f subshell
The actinide elements have a wide range of available oxidation states
particularly for the earlier metals For the heavier elements however the most common
oxidation state for the metal ions is +3 having lost both of the 7s electrons and either a
6d electron (if applicable) or one 5f electron The available oxidation states for each of
the actinides can be seen in Table 13 Ionisation energy values are not available for all
of the actinides although the standard electrode potentials for the reduction of An4+
to
An3+
and An3+
to An2+
can be used to give an indication of the ion stabilities The +4
38
oxidation state is the most favoured for Th as it gives rise to empty 6d and 7s shells but
An4+
generally becomes less favoured across the series and may only be found in
solution for americium and curium complexes Conversely the stability of the +2
oxidation state generally increases across the series with an irregularity at Cm which
does not have an available +2 oxidation state due to the stability of the half full 5f
subshell of Cm3+
The variety of oxidation states found in the earlier actinides suggests
that all of the valence electrons are available for bonding in these elements7
Table 12 Electronic properties of the actinides7
Symbol Name Electron
Config
(Metal)
Electron
Config
(An2+
)
Electron
Config
(An3+
)
Electron
Config
(An4+
)
Th Thorium [Rn]6d27s
2 NA [Rn]6d
1 [Rn]
Pa Protactinium [Rn]5f26d
17s
2 NA [Rn]5f
2 [Rn]5f
1
U Uranium [Rn]5f36d
17s
2 NA [Rn]5f
3 [Rn]5f
2
Np Neptunium [Rn]5f46d
17s
2 NA
[Rn]5f
4 [Rn]5f
3
Pu Plutonium [Rn]5f67s
2 NA [Rn]5f
5 [Rn]5f
4
Am Americium [Rn]5f77s
2 [Rn]5f
7 [Rn]5f
6 [Rn]5f
5
Cm Curium [Rn]5f76d
17s
2 NA [Rn]5f
7 [Rn]5f
6
Bk Berkelium [Rn]5f97s
2 NA [Rn]5f
8 [Rn]5f
7
Cf Californium [Rn]5f10
7s2 [Rn]5f
10 [Rn]5f
9 [Rn]5f
8
Es Einsteinium [Rn]5f11
7s2 [Rn]5f
11 [Rn]5f
10 [Rn]5f
9
Fm Fermium [Rn]5f12
7s2 [Rn]5f
12 [Rn]5f
11 [Rn]5f
10
Md Mendelevium [Rn]5f13
7s2 [Rn]5f
13 [Rn]5f
12 [Rn]5f
11
No Nobelium [Rn]5f14
7s2 [Rn]5f
14 [Rn]5f
13 NA
Lr Lawrencium [Rn]5f14
6d17s
2 NA [Rn]5f
14 NA
39
Table 13 Available oxidation states of the actinides and colours of ions in solution
where applicable Ions in black text are either not found in aqueous solution or are
unknown8
115 Relativistic Effects
Relativistic effects are much more important for heavy elements than light
elements as they are proportional to an atomrsquos mass The Special Theory of Relativity
as devised by Einstein shows that as the velocity (ν) of a particle increases towards the
speed of light (c) its mass (m) increases to infinity as shown in equation 11 where m0
is the rest mass of the particle This is the relativistic mass increase
Equation 11
For example the relativistic mass increase of a 1s electron in uranium (found to
be 135 me) can be calculated using the average radial velocity of the electrons (νrad)
which is roughly equivalent to the atomic number Z for 1s electrons and the rest mass
of an electron (me) This is shown in equation 12
Equation 12
This effect causes a contraction of 1s electron subshell due to the inverse
relationship between electron mass and the Bohr radius of an atom meaning that the
shell is held more closely to the nucleus and stabilised A similar effect is true for p
electrons The relationship can be seen in equation 13 where α0 is the Bohr radius e is
the elementary charge and ħ is the reduced Planckrsquos constant
Equation 13
7 NpO23+
PuO23+
AmO65-
6 UO22+
NpO22+
PuO22+
AmO22
+5 PaO2
+UO2
+NpO2
+PuO2
+AmO2
+
4 Th4+
Pa4+
U4+
Np4+
Pu4+
Am4+
Cm4+
Bk4+
Cf4+
3 Ac3+
Th3+
Pa3+
U3+
Np3+
Pu3+
Am3+
Cm3+
Bk3+
Cf3+
Es3+
Fm3+
Md3+
No3+
Lr3+
2 Am2+
Cf2+
Es2+
Fm2+
Md2+
No2+
Ac Th Pa U Np Pu Am Cm Bk Cf Es Fm Md No Lr
Most stable in aqueous solution Accessible Only found in solid complexes
40
This explains why relativistic effects are more significant for larger nuclei as the
mass increase is dependent on Z Conversely to the stabilisation of s and p electrons by
relativistic effects valence f and d orbitals are expanded further from the nucleus and
destabilised due to effective shielding of the s and p electrons of the nucleus The effect
is greater in the actinides due to the increased number of electrons and is responsible for
the variety of oxidation states exhibited by An as the valence 5f electrons are further
from the nucleus and are therefore more available for bonding Relativistic effects are
much less important for the lanthanides than the actinides as the actinides are more
destabilised by the effects7
116 Lanthanide and Actinide Contraction
There is a general decrease in the size of the metallic and ionic radii of the
lanthanides across the series explained by the fact that 4f electrons are considered to be
ldquocore-likerdquo so are not available for bonding This causes crystal field effects to be minor
in lanthanide complexes The ldquocore-likerdquo property of the 4f electrons prevents them
from shielding valence electrons in outer subshells from the nucleus allowing the
effective nuclear charge (Zeff) to increase and causing contraction of the atoms and ions
across the series The lanthanide contraction is responsible for the small size difference
between the second and third row transition metals
The ionic radii of the actinides for the +3 +4 and +5 oxidation states gradually
decrease in size across the series although the metallic radii do not follow the same
trend The effect of the trend on the chemistry of the elements is not well known as the
later elements cannot be made with large enough yields to study and they decay too
rapidly The gradual decrease is due to the fact that 5f-electrons are poor at shielding s
and p electrons from the nucleus due to their greater radial extension allowing the
effective nuclear charge (Zeff) to increase and the s and p electrons to be held more
closely to the nucleus
117 Co-ordination Chemistry of the Lanthanides and Actinides in Solution
Lanthanide ions are hard Lewis acids and so co-ordinate readily with hard bases
The core-like nature of the 4f electrons prevents them from interacting significantly with
ligand orbitals and means that lanthanide complexes are bonded electrostatically The
co-ordination geometry of complexes is therefore determined predominantly by the
steric interactions of the ligands The high charge density of the Ln3+
ions allows them
41
to form ionic bonds however this means that many lanthanide complexes are labile in
solution
Actinide ions are also hard Lewis acids co-ordinating easily with hard bases
The greater radial extension of the 5f electrons caused by relativistic effects gives rise
to greater chemical activity in the actinides than the lanthanides as the 5f electrons are
more available for bonding This also explains the tendency of the early actinides to
form covalent bonds however the later actinides mainly interact electrostatically like
the lanthanides
Actinide ions are found as An3+
for the later elements in the series except for
No which is found as No2+
and they behave much like the lanthanides However for
some of the early actinides linear actinyl ions (AnO2+ and AnO2
2+) can be observed in
addition to free ions and are often more stable particularly for U91011
Lanthanide and actinide complexes often have high co-ordination numbers
typically 8 or 9 in aqueous solution (although co-ordination numbers as high as 12 have
been reported) due to their large size The Ln3+
ion forms readily in aqueous solution
and the An3+
ion is the common form for the later actinides however the solution state
chemistry of the early actinide ions is complicated Americium is mainly found in the
+3 oxidation state in solution although it also forms the AmO22+
ion The Am7+
oxidation state has been known to exist but is unstable except in very alkaline
conditions
It is difficult to determine the exact co-ordination numbers and geometries of Ln
and An ion complexes in solution due to the lability of the complexes particularly for
lanthanides
1171 Hydrolysis
The solvation of metal cations by water particularly cations with a high charge
density such as Ln3+
and An3+
ions will result in some hydrolysis The cations polarise
the O-H bonds of the solvent allowing the hydrated metal cations to act as Broslashnsted
acids An example can be seen in Equation 14
Equation 14 [Eu(H2O)8]3+
+ H2O rarr [Eu(H2O)7(OH)]2+
+ H3O+
The acidity of the Ln3+
cations increases across the series as the charge density
increases For the An ions the acidity increases as follows
AnO2+ lt An
3+ lt AnO2
2+ lt An
4+
42
Generally the acidity increases with increasing charge density like Ln The
position of AnO22+
can be explained by the fact that the O2-
ions do not fully reduce the
charge on the An ion and so the effective charge of the ion is seen to be +331
1172 Monodentate Ligands
Substituting water for other monodentate ligands in aqueous solution is
challenging for lanthanides as the complexes are labile and the high charge density of
the ion and affinity for a polar environment means that it will often remain solvated
Isolating monodentate complexes from water is almost impossible as Ln3+
ions having a
high enthalpy of hydration making complex formation endothermic Complexation can
be achieved much more easily by the use of macrocyclic or chelating ligands
Conversely it is much easier to form monodentate actinide complexes in water
such as salts which will become hydrated rather than completely substituted by water
molecules However complexation is still much easier with macrocycles or chelates in
aqueous solution12
1173 Chelates and Macrocycles
When a chelate or macrocycle ligates to an ion the reaction entropy increases as
water molecules are eliminated from the complex (see Equation 15) which is
thermodynamically favourable As a chelating or macrocyclic ligand bonds to the metal
ion the remainder of the ligand is considered to be in close proximity to the ion giving
it an ldquoartificially highrdquo concentration and is therefore more likely to bond than
surrounding ions or ligands
Equation 15 [Eu(H2O)8]3+
+ EDTA4-
rarr [Eu(EDTA)(H2O)3]- + 6H2O
Chelating complexes increase in stability across lanthanide and actinide series
This is because the Coulombic attraction between the ligand and the metal increases
with charge density However there is a slight irregularity in this trend for the
lanthanides where a slight dip can be seen at Gd3+
as this is thought to be the point at
which the co-ordination number changes from 9 to 8 often referred to as the
lsquogadolinium breakrsquo12
43
12 Analytical Methods
121 NMR Spectroscopy
Most lanthanide and actinide complexes are paramagnetic as they have unpaired
electrons The nuclei of paramagnetic complexes are subjected to a local magnetic field
in addition to the field generated by the spectrometer causing the complexes to have
larger chemical shifts NMR spectra of paramagnetic complexes often have broad peaks
as they have faster spin-lattice relaxation times due to strong spin-orbit coupling13
The
relationship is explained by the Heisenberg Uncertainty Principle which links energy
(E) and time (t) in Equation 16 where h is Planckrsquos constant
Equation 16
Considering the relationship between energy and frequency (ν) in Equation 17
the Heisenberg equation can be rearranged to show the inverse relationship between the
change in frequency (Δν) or ldquospectral linewidthrdquo (defined as the peak width of the
signal at half of its maximum height) and the lifetime of the excited state or in this case
spin-lattice relaxation time (Δt) See Equation 1814
Equation 17
Equation 18
122 Luminescence Spectroscopy
1221 Fluorescence and Phosphorescence
Fluorescence and phosphorescence are both types of luminescence Radiation is
used to excite electrons into a higher electronic energy level which then emit photons
(light) as they relax back down to their ground state Fluorescence is a relatively fast
process (picoseconds to milliseconds) as it is an allowed transition by the spin selection
rule not involving a change in spin multiplicity Phosphorescence is a slower process
(milliseconds to seconds) as it does involve a change in electron spin from a singlet to a
triplet excited state ndash it is formally ldquospin-forbiddenrdquo The processes can be seen in the
Jablonski diagram in Figure 11 By contrast f-f transitions whereby f-electrons are
excited into other f-subshells are formally Laporte forbidden so direct excitation of the
4f electrons is unfavourable These rules are relaxed a little by vibronic (vibrational and
44
electronic) coupling in which a vibration in the molecule causes the temporary
lowering of the symmetry of the metal allowing the d and p orbitals to share symmetry
The transition has some drarrp character and so becomes more intense However for
vibronic coupling to take place the valence orbitals must interact with incoming
ligands For the transitions that occur in the visible region of the spectrum this explains
why the colours of Ln3+
ions are weak as the valence 4f shell interacts poorly with
ligands due to their core-like nature Vibronic coupling is greater in actinide ions
Figure 11 Jablonski diagram showing fluorescence and phosphorescence15
1222 Lanthanide Luminescence
Lanthanide ions in which f-f transitions can occur are luminescent and emit
across a range of the electromagnetic spectrum from the Ultra-Violet (UV) range to the
visible (vis) or near-infra-red (nIR) region of the spectrum (Table 14) La3+
does not
possess any f-electrons and Lu3+
has a full 4f shell so these two ions are not
luminescent
45
Table 14 Luminescence of lanthanide ions
Luminescent ions which emit
in the nIR region of the
spectrum
Colours of luminescent ions
which emit in the visible and
UV regions of the spectrum
Pr3+
Sm3+
Nd3+
Eu3+
Ho3+
Tb3+
Er3+
Dy3+
Yb3+
Tm3+
Gd3+
(UV)
Ce3+
(UV)
Lanthanide ions have long luminescence lifetimes as their transitions are
formally forbidden Since the interaction between the metal ion and the ligand is
negligible in lanthanides the emission spectra of lanthanide complexes have narrow
emission lines resembling the spectra of the free ions Solid lanthanide compounds and
complexes also tend to be luminescent1617
1223 Actinide Luminescence
Actinide ions in which f-f transitions can occur are luminescent and also emit
across a range of the electromagnetic spectrum from the UV range to the infra-red IR or
nIR region (Table 15) Ac3+
and Th4+
do not have any f-electrons and Lr3+
has a full 4f
shell so these two ions are not luminescent No luminescence studies have been
performed on Fm3+
Md3+
or No2+
The remaining An have luminescent ions but studies
have been most widely performed on UO22+
Am3+
and Cm3+
as these are the most
widely available have fewer problems associated with radioactivity and safety and are
the most well understood
46
Table 15 Luminescence of actinide ions
Luminescent ions which emit
in the IRnIR region of the
spectrum
Colours of luminescent ions which
emit in the visible and UV regions
of the spectrum
NpO22+
Pa4+
(UV) Pa4+
Pa4+
Pa4+
Pa4+
Am3+
U4+
(UV) U4+
Es3+
UO2+
UO22+
UO22+
UO22+
UO22+
Am3+
Am3+
Am3+
Am3+
Cm3+
Bk3+
Cf3+
Unlike lanthanides actinide emission spectra and lifetimes vary depending on
the species and bound species or counter ions although most lifetimes for An are short
(lt 20 ns) with the exceptions of the 5f0 species UO2
2+ (which has lifetimes varying
from 130 ns to 300 μs) and Cm3+
which has a lifetime of ~65 μs and is known to have
the highest luminescence quantum yield of the An ions allowing it to be studied in very
low concentrations which is useful due to its low availability Luminescence studies on
solid state An compounds are unreliable as they are susceptible to radioluminescence
whereby the energy released by radioactive decay can result in the generation of an
emissive excited state718
1224 Sensitised Luminescence and Antennae
Sensitisation of luminescence can occur if an ldquoantennardquo is present which is a
sensitising chromophore An electron is excited on the ion by energy transferred from
the chromophore The antenna must be in close proximity to the ion for energy transfer
to take place and so antennae are usually used as ligands
Antennae are predominantly organic aromatic materials bonded to macrocycles
(as these are easier to ligate to the metal ions in solution) During sensitisation an
electron from the chromophore is excited from its ground state to a singlet excited state
Energy may then be transferred to a triplet excited state by inter-system crossing (ISC)
where the potential curves of the two states intersect at similar energies Although this
spin forbidden spin orbit coupling makes it possible by slightly shifting the electronrsquos
energy levels Energy from the triplet state is then transferred to the metal ionrsquos excited
47
state The ion can then relax to its ground state by luminescence This is the most
common pathway for sensitised emission however it is possible to transfer energy
directly from the singlet excited state on the chromophore to the ion (Figure 12)
Figure 12 Energy transfer pathway for sensitised luminescence of Ln3+
complexes 1S
represents an excited singlet state 3T an excited triplet state and f and frsquo represent
excited states of the Ln3+
ion 19
1225 Russell-Saunders Coupling
ldquoTerm symbolsrdquo are used to label ground state and excited state energy levels
for lanthanide ions Term symbols are derived from Russell-Saunders coupling and
account for the net atomic orbital angular momentum and the net spin angular momenta
of the state determined from the sum of the individual angular momenta of an ionrsquos
electrons Term symbols take the form
(2S+1)LJ
where S is the spin multiplicity of the state L corresponds to the ldquolrdquo quantum number
for the state and J is the coupling of L and S Excited states have several possible J
values although the ground state always has a single J value which can be determined
by Hundrsquos rules The Russell-Saunders coupling scheme is only useful for lanthanide
ions and cannot be applied to actinide ions as spin-orbit coupling is much greater in An
and the 5f orbitals have different properties to the 4f orbitals in particular the greater
importance of relativistic effects (see Section 115) However Russell-Saunders terms
have been used as a basis for assigning ground and excited state terms20
F = Fluorescence P = Phosphorescence L = Luminescence NR = Non Radiative Decay ISC = Inter System Crossing ET = Energy Transfer BT = Back-energy Transfer IC = Internal Conversion
48
1226 Quenching
The excited states of the trivalent lanthanides and actinides are readily quenched
in solution Quenching occurs when the vibrational energy levels of high energy
oscillators (such as C-H N-H or O-H bonds) within the molecule or its environment
(solvent) have a similar energy to the excited state of an ion Inter-System Crossing
(ISC) from the excited state to these vibrational levels can occur causing non-radiative
decay preventing luminescence The efficiency of this non-radiative decay is dependent
upon the energy gap between the emissive state and the ground state of the ion and also
on the number of quanta (energy levels) of the oscillator If the non-radiative decay is
favourable and happens faster than luminescence quenching will occur Quenching
reduces the intensity lifetime and quantum yield of luminescence If the ionrsquos emissive
state is close in energy to the triplet excited state of the ligand (lt 20000 cm-1
) thermal
quenching may also occur whereby energy is transferred backwards to the triplet
excited state of the chromophore21
1227 Quenching in Lanthanides and Actinides
Tb3+
is less susceptible to vibrational quenching than other lanthanide ions as the
energy gap between the lowest emissive state and the ground state of Tb3+
is very high
(20500 cm-1
) It is however susceptible to thermal quenching and back energy transfer
Eu3+
also has a large energy gap (17250 cm-1
) This results in a relatively greater
emission intensity for these ions
Other lanthanide ions such as Pr3+
Ho3+
Er3+
Tm3+
Yb3+
Dy3+
and Sm3+
with
smaller energy gaps are more easily quenched giving less intense emission Er3+
has the
smallest energy gap close to the υ=0 energy level of O-H so is the most easily
quenched (see Figure 13) The lower energy levels of the oscillators provide better
overlap with the energy levels of the ions due to a better overlap with the wavefunction
therefore ions which have energy levels that overlap with the lower quanta of the
oscillators will also be more easily quenched Gd3+
has the highest energy gap of the
lanthanide ions (32000 cm-1
) and cannot be sensitised by conventional UV absorbing
chromophores
49
Nd3+Eu3+ Tb3+Yb3+ O-H O-DTm3+ Sm3+ Pr3+ Er3+
3H4
4I132
4I112
3H4
3H5
3H6
3H6
3H5
3H4
0
20000
4I92
4I112
4I132
4I152
4F32
2H92
4S32
4F92
2H112
4G52
4G72
4G92
(2D2P)32
4G1125D4
7F07F17F27F37F4
7F5
7F67F0
7F1
7F2
7F3
7F4
7F5
7F6
5D0
5D1
5D2
2F52
2F72
10000
6H52
6H72
6H92
6H112
6H132
4F32
4G52
4F32
4F12
4F52
4F72
4G72
4F92
4F112
3F2
3F4
3P0
3P1
3F3
1I6
1G4
4I92
4F92
4S32
4F72
3F4
3F3
3F2
1G4
E
cm
-1
=0
=1
=2
=3
=4
=5
=0
=1
=2
=3
=4
=5
=6
=7
2H112
1D2
Figure 13 Energy level diagram showing the ground and excited states of a selection
of lanthanides and vibrational oscillators Emissive states are shown in red The energy
levels of O-H and O-D oscillations are shown in blue22
Actinides are also susceptible to quenching even more so than the lanthanides
as all of them have smaller energy gaps between the lowest emissive state and the
ground state The energy gaps of some actinides compared to lanthanides can be seen in
Figure 14
50
Figure 14 The energy gaps between the lowest emissive states and ground
states of a selection of lanthanides and actinides represented by arrows23
1228 Suitable Solvents for Luminescent Complexes
In addition to quenching by vibrational oscillators on ligands luminescence can
also be quenched by solvents High energy oscillators must therefore be eliminated from
the solvent in order for luminescence to take place in the solution phase This is
generally achieved by using deuterated (or fluorinated) solvents such as D2O It is also
important to use strongly co-ordinating solvents that would replace the labile ligands
The Horrocks equation can be used to calculate the number of co-ordinated solvent
molecules (q) to an ion whether it is a free ion or co-ordinated to a ligand The original
Horrocks equation (Equation 19) and modified Horrocks equation for q lt 2 (Equation
110) are shown below
Equation 19
Equation 110
The Horrocks equation uses the emission lifetimes (τ) to determine q A is the
proportionality constant taking into account the inner hydration sphere and B is a
correction factor taking into account the outer hydration sphere A and B values are
experimentally determined constants and are available for Sm3+
Eu3+
Tb3+
Nd3+
Yb3+
Am3+
and Cm3+
Inner sphere hydration (q) values can be effectively determined from
51
solutions of water and methanol For the original Horrocks equation A = 105 for Eu3+
and A = 42 for Tb3+
and for the modified Horrocks equation (when q lt 2 ) A = 12 ms
and B = (025 ndash 0075x) ms-1
(where x = the number of exchangeable N-H oscillators)
for Eu3+
and A = 5 ms and B = 006 ms-1
for Tb3+
242526
13 Nuclear Theory
131 Nuclear Power
Currently all nuclear energy irrespective of use is generated by nuclear fission
Nuclear fission is the splitting of a fissile nucleus into two smaller nuclei often aided by
the collision of an incoming particle or neutron The nucleus captures the neutron
which makes it unstable and it breaks into two fragments The splitting process releases
more neutrons which may continue to cause fission of more nuclei generating a chain
reaction An example of a chain reaction caused by 235
U fission can be seen in Figure
15
Figure 15 Chain reaction generated by fission of 235
U into 92
Kr and 141
Ba27
Fission of heavy radioactive actinide elements is exothermic and a chain
reaction can occur if there are enough fissile nuclei present The amount of fissile
material required for a self-sustaining chain reaction is the ldquocritical massrdquo and any mass
above this is referred to as a ldquosupercritical massrdquo which if not controlled can lead to a
runaway chain reaction and a nuclear explosion
52
235U fission is used to generate nuclear power The fission products (FP) collide
with other atoms and their kinetic energy in converted into heat which is absorbed by
the cooling water and then used to drive steam turbines to generate electricity Control
rods are used in the reactor to control the neutron flux and prevent a runaway chain
reaction These are often made of boron nitride which is a neutron absorber
Moderators are also used to slow down the neutrons to the optimum energy for fission
(~2 kJ mol-1
) and these tend to be light nuclei (12
C or 2H)
132 The Nuclear Fuel Cycle
Uranium is mined in its ore form from the ground mainly in Middle Eastern
countries Canada Australia and Africa The ore is then milled to extract the uranium as
ldquoyellowcakerdquo which is mixed oxides of triuranium octoxide (U3O8) uranium dioxide
(UO2) and uranium trioxide (UO3) by leaching with acid or alkali followed by
precipitation The remaining ore ldquotailingsrdquo are disposed of as radioactive waste
The yellowcake is then further processed as only 07 of uranium is fissile
235U the dominant isotope is
238U The uranium oxide is enriched by increasing the ratio
of 235
U238
U to approximately 35-5 235
U This is done by converting all of the mixed
oxides into uranium dioxide and then to uranium hexafluoride (UF6) gas and separating
it into two streams ndash one of which is enriched in 235
U and the other depleted
The enriched UF6 is then converted back to UO2 which can be pressed and
heated to 1400 degC to form fuel pellets The depleted uranium is treated as waste The
fuel pellets are subsequently encased in metal rods which can then be used in a fuel
assembly in a reactor
After 18-36 months the build-up of fission products is such that the efficiency
of the fuel decreases so the fuel rods are removed and replaced The used fuel is then
stored for months or years in water which absorbs the heat until the radiation levels
decrease sufficiently for it to be disposed of or reprocessed As there are no disposal
facilities at present for nuclear fuel waste it is simply isolated from the environment
and left in storage until facilities become available28
A diagram of the Nuclear Fuel
Cycle can be seen in Figure 16
The once-through or ldquoopenrdquo fuel cycle whereby waste is stored for disposal is
favoured by a number of countries including Canada parts of Europe and the USA
presently although some research on reprocessing techniques is being carried out in
these areas as reprocessing is becoming increasingly important for the future of nuclear
power A ldquoclosedrdquo fuel cycle whereby the waste is recycled and reused is becoming
53
more and more favoured as a result of this and has been performed in some parts of the
world for many years including the UK and other parts of Europe Russia and Japan29
Figure 16 The Nuclear Fuel Cycle30
133 Spent Nuclear Fuel and Reprocessing
The reprocessing of spent nuclear fuel (SNF) is essential for preventing the
exhaustion of uranium supplies and reducing the volume and radiotoxicity of the waste
produced
Current reprocessing techniques involve the removal of re-usable uranium and
plutonium present in the waste which can be recycled and reused together in mixed
oxide (MOX) reactors to produce more nuclear power31
The amount of waste
remaining in storage at present worldwide that could be reprocessed is approximately
200000 tonnes with a global reprocessing capacity of around 4000 tonnes per year
90000 tonnes have been reprocessed over the last 50 years
In addition to the reusable U and Pu in the spent nuclear fuel (SNF) there are
also a variety of other fission products (FP) present such as minor actinides (MA) Np
Am and Cm Ln and transition metals (TM) in addition to corrosion products (CP)
54
from steel containers and pipes in the system as a result of radiolysis erosion and
ageing of equipment These are TM chiefly cobalt (Co) chromium (Cr) iron (Fe) and
manganese (Mn) The composition of SNF can be seen in Table 16 Recently research
into the removal of the other actinides from the waste has become important in order to
transmute them into shorter-lived radionuclides so that their radioactivity will not
persist for as long making the disposal process easier and faster This coupled with a
similar approach for any remaining plutonium will make the waste proliferation
resistant as it would not allow the Pu to be recovered from storage in the future for
proliferation purposes
Table 16 Approximate compositions of SNF in Light Water Reactors (LWR)32
Constituent of SNF
U 956
Stable FP (including Ln) 29
Pu 09
Cs amp Sr (FP) 03
I amp Tc (FP) 01
Other long-lived FP 01
MA 01
Although MA only make up 01 of fission products they are highly radiotoxic
and extremely long-lived and so it would be beneficial to separate MA from the
remaining fission products so that they can be transmutated into shorter lived
radionuclides by neutron bombardment The necessity of the separation arises from the
presence of Ln as Ln are known to be neutron scavengers or ldquoneutron poisonsrdquo 33
meaning that they have a high neutron cross section and are able to absorb neutrons
preventing transmutation of other species present
Neptunium is relatively simple to remove from the mixture of fission products
as it has a variety of oxidation states that can be utilised in the process34
However the
predominant trivalent minor actinides (MAs) Am and Cm are much more difficult to
separate from the remaining lanthanide waste due to the similarities in the chemistries
of the elements and the electrostatic nature of interactions of the hard Lewis acidic Ln3+
ions with ligands35
Much of this new research is focussed on separating Am3+
and
Cm3+
from Ln3+
55
134 Solvent Extraction
Currently there are no MA-Ln separation techniques employed commercially
although a number of different processes are being developed particularly in the USA
and Europe with a drive to implement a working process within the next 5 years
Despite differences in the chemistry between the techniques under development all of
them use solvent extraction as the ultimate separation technique
Solvent extraction is the process of separation of two (or more) species using
two immiscible liquids (usually an organic and aqueous phase) by the use of
complexing agents to selectively move only one species between phases This may or
may not be aided by the use of a complexing agent which binds preferentially to one of
the species36
The success of this technique varies between compounds and solvent systems
and can be determined using a separation factor (SF) This is a ratio based on the
distribution ratios (D) of the elements to be separated (Equations 111 and 112)
Equation 111
Equation 112
There are a number of existing methods for removing radiotoxic elements from
fission products these are discussed over the next few sections
1341 PUREX
PUREX (Plutonium and Uranium Refinement by Extraction) is the process used
by nuclear plants that carry out reprocessing to remove U and Pu from the waste in
order to reuse it (Figure 18) Strong nitric acid (~ 4M HNO3) is used to dissolve the
waste in an aqueous phase to form hydrated nitrate complexes of the corresponding
oxides of U and Pu (Equations 113 and 114) High concentrations of acid (2-6 M) are
used to increase the solubility of the oxides
Equation 113 UO22+
+ 2NO3- (aq) rarrUO2(NO3)2xH2O
Equation 114 PuO22+
+ 2NO3- (aq) rarrPuO2(NO3)2xH2O
56
The plutonium complex is then reduced using nitrogen tetroxide (N2O4) to the
corresponding Pu4+
complex and the solution is filtered to remove any precipitates
(Equation 115)
Equation 115 PuO2(NO3)2xH2O + N2O4 rarr Pu(NO3)4xH2O
The solution is then contacted with an organic phase (kerosene) containing tri-
nbutyl phosphate (TBP) as an extracting agent (Figure 17) which forms complexes
with the U and Pu nitrate hydrates to move them into the organic phase (Equations 116
and 117)
Equation 116 UO2(NO3)2xH2O + 2TBP rarr UO2(NO3)2(TBP)2
Equation 117 PuO2(NO3)2xH2O + 2TBP rarr Pu(NO3)4(TBP)2
However Tc and Np are also extracted at this point This is a disadvantage for
the purpose of the PUREX process but is advantageous for subsequent MA-Ln
separation processes which could follow The UO22+
and NpO2+ TBP complexes are
then separated from the Pu4+
and TcO4- complexes by reduction of Pu
4+ to Pu
3+ with
hydrazine (N2H4) and extraction back into water (Equations 118 and 119)3738
Equation 118 N2H4 + H2O harr N2H5+ + OH
-
Equation 119 Pu(NO3)4(TBP)2 + N2H5+ rarr Pu(NO3)3(TBP)2 + N2H5NO3
The Pu3+
and TcO4- are then separated from each other through another
extraction cycle and then a ldquostrippingrdquo solution of nitric acid hydroxylamine and
sulphuric acid to obtain pure Pu The UO22+
and NpO2+ are also extracted back into
aqueous solution and separated from each other through another extraction cycle Pure
U is obtained by using aqueous nitric acid for stripping (back-extraction)39
The process
has been proven to work well and it is an advantage that the organic phase can be reused
after stripping However the process has a few drawbacks ndash the need for high acid
concentrations makes it less environmentally friendly the need for redox control and
less stable oxidation states makes it longer and complicated and the use of phosphorus
reagents makes the products more difficult to dispose of as phosphorus waste is not
57
incinerable and so any radioactive waste must be separated from the phosphorus before
treatment40
Figure 17 Chemical structure of TBP (Tri-nbutyl phosphate)
Figure 18 PUREX flow diagram41
1342 TRUEX
TRUEX (TRansUranic EXtraction) is an example of advanced reprocessing
(removal of MA and Ln) that is being developed in the USA The principle of the
process is to selectively remove Am and Cm (MA) and Ln from the other fission
58
products left in the raffinate after the PUREX process (Figure 110) A combination of
extractants is used carbamoylmethylphosphine oxide (CMPO) (Figure 19) and TBP (as
in the PUREX process) The benefit of the combined extractant system is that the
process is effective over a range of acidities (07-5 M HNO3) The raffinate (in nitric
acid) from the PUREX process is contacted with the extractant in an organic phase of
normal paraffinic hydrocarbon (NPH) Oxalic acid is then added to prevent the co-
extraction of zirconium (Zr) and molybdenum (Mo) with the MA An additional wash is
also performed using sodium carbonate (Na2CO3) to prevent any other fission products
from being co-extracted The extractants selectively remove the MA and Ln into the
organic phase leaving the remaining fission products in the aqueous phase The MA
and Ln are then stripped using nitric acid and can be reprocessed further as required
However a main drawback is that the lanthanides are still present with the MA so
further reprocessing is required 42
Figure 19 Chemical structure of CMPO (NN-diisobutyl-2-
(octyl(phenyl)phosphoryl)acetamide)
59
Figure 110 TRUEX flow diagram
1343 DIAMEX
The DIAMEX (DIAMide Extraction) process is another example of advanced
reprocessing and is currently under development in France by the CEA (Commissariat agrave
lEnergie Atomique et aux Energies Alternatives) (Figure 113) It is similar to the
TRUEX process as the process selectively removes Am and Cm (MA) and Ln from the
PUREX raffinate The process is being researched using a variety of different diamides
as the extractant the most promising of which have been shown to be NNrsquo-dimethyl-
NNrsquo-dibutyl-tetradecylmalonamide (DMDBTDMA) (Figure 111) and NNrsquo-dimethyl-
NNrsquo-dioctyl-hexylethoxymalonamide (DMDOHEMA) (Figure 112)4344
The nitric
acid PUREX raffinate is contacted with the extractant in an organic phase of tetra-
propylene-hydrogenated (TPH) a synthetic branched form of dodecane45
Oxalic acid is
then added to prevent the co-extraction of Zr and Mo with the MA as in the TRUEX
process and the extractant selectively removes the MA and Ln into the organic phase
leaving behind the other fission products in the aqueous phase The MA and Ln are then
stripped using nitric acid and can be reprocessed further as required
The main benefit of this process compared to the TRUEX process is that the
organic waste only contains C H N and O as P reagents are not used so the waste can
be disposed of more easily However like the TRUEX process a main drawback is that
the lanthanides are still present with the MA so further reprocessing is required 46
Figure 111 Chemical structure of DMDBTDMA (N1N3-dibutyl-N1N3-
dimethyl-2-tetradecylmalonamide)
60
Figure 112 Chemical structure of DMDOHEMA (N1N3-dibutyl-2-(2-
(hexyloxy)ethyl)-N1N3-dimethylmalonamide)
Figure 113 Example DIAMEX flow diagram
1344 SANEX
SANEX (Selective ActiNide EXtraction) is another process being developed by
CEA and is intended to be coupled with a TRUEX or DIAMEX type process and is the
next step in the advanced reprocessing whereby the MA and Ln are separated from
each other so that the MA can be treated (Figure 117) Complexing agents such as bis-
triazinyl-pyridines BTPs and their bipyridine variants (BTBPs) (Figure 114) have been
widely studied with a more recent complexing agent tetraoctyldiglycolamide (TODGA)
(Figure 115) being studied47
The complexing agents have been found to preferentially
bind to the MA allow only the MA to be extracted into an organic phase using TBP
leaving the Ln in the aqueous phase Oxalic acid and (2-hydroxyethyl)-
61
ethylenediaminetriacetic acid (HEDTA) (Figure 116) are used to prevent the co-
extraction of any other fission products The chemistry of this process is poorly
understood however and more research is needed48
However many of these extractant
molecules suffered problems that preclude them from use in plant-scale extractions
including poor stability slow extraction kinetics the use of citric acid as a buffer and
inefficient back extraction due to high An3+ affinities
Figure 114 General chemical structure of BTPs (66-di(124-triazin-3-yl)-22-
bipyridine)
Figure 115 Chemical structure of TODGA (22-oxybis(NN-dioctylacetamide))
Figure 116 Chemical structure of HEDTA (22-((2-((carboxymethyl)(2-
hydroxyethyl)amino)ethyl)azanediyl)diacetic acid)
62
Figure 117 SANEX flow diagram for TODGA process
1345 i-SANEX
The innovative SANEX (or i-SANEX) process is also currently under
development at the CEA49
Essentially it is a modified DIAMEX process with selective
back extraction of Am3+
and Cm3+
from the organic phase The MA3+
and Ln3+
ions are
initially extracted from the PUREX raffinate using TODGA and then a hydrophilic
complexant that is selective for MA3+
is employed to back extract the minor actinides
from the loaded organic phase into the aqueous phase In order to retain the lanthanide
ions in the organic phase a nitrate salt is added to the stripping solution Hydrophilic
extracting agents that have been used to demonstrate this technique are DTPA
(diethylenetriaminepentaacetic acid) and the sulphonated BTP derivative 26-bis(56-
di(sulphophenyl)-124-triazin-3-yl)pyridine SFrsquos of up to 1000 are achievable in this
process50
One other option that has been suggested is to add a second stripping agent
such as HDEHP to the organic phase in order to retain the lanthanides in the organic
phase at low pH One major drawback of this process however is the limited operative
acidity range (ca pH 3) which means that buffering agents need to be added to the
aqueous phase in the back extraction step Another reprocessing concept currently under
investigation is the 1-cycle SANEX with the intention to directly extract the trivalent
actinides selectively from the PUREX raffinate A system consisting of 015 M
CyMe4BTBP and 0005 M TODGA in a mixture of 40 TPH and 60 1-octanol has
been proposed51
63
1346 GANEX
The GANEX (Grouped ActiNide EXtraction) process is relatively new and is a
complete separation process combining the principles of the PUREX and TRUEX
processes in order to separate all of the An (U Pu and MA) from the Ln and both from
the other fission products (Figure 121) A complexing agent bis-triazin-bipyridine
(BTBP) (Figure 118) and its variants (such as CyMe4-BTBP (Figure 119) and CyMe4-
BTPhen (Figure 120))52
have been tested and found to be effective in selectively
coordinating to and extracting MA high separation factors of Am3+
over Eu3+
gt 1000
have been documented In the proposed process BTBP is dissolved in cyclohexanone
(as it is soluble in this solvent and has faster extraction kinetics) and used alongside
TBP which extracts U and Pu and is stable against radiolysis and hydrolysis especially
the CyMe4 variant If proven to be successful this process would simplify reprocessing
making it much simpler however much more work is needed before this process could
become operational as co-extraction of fission products is currently a problem53
For the
most attractive candidate to date the CyMe4-BTBP extractant has been successfully
tested for the extraction of genuine actinidelanthanide feed through a 16-stage
centrifugal contactor setup with excellent recoveries for americium and curium
(gt999) but has been shown to undergo radiolytic degradation at doses that will be
encountered at the high minor actinide loadings obtained in the reprocessing of for
example fast reactor fuels The kinetics for actinide extraction with CyMe4-BTBP are
still relatively slow so the addition of a phase-transfer catalyst is necessary (eg NNprime-
dimethyl-NNprime-dioctylethylethoxymalonamide (DMDOHEMA)) if this extractant is to
be used for large- scale partitioning
Figure 118 General chemical structure of BTBPs (66rsquo-bis(124-triazin-3-yl)-22rsquo-
bipyridine)
64
Figure 119 Chemical structure of CyMe4-BTBP (66-bis(5588-tetramethyl-5678-
tetrahydrobenzo[e][124]triazin-3-yl)-22-bipyridine)
Figure 120 Chemical structure of CyMe4-BTPhen (29-bis-(124-triazin-3-yl)-110-
phenanthroline)
65
Figure 121 GANEX flow diagram
1347 TRPO
Another advanced reprocessing extraction process being developed in China is
the TRPO (TRialkyl Phosphine Oxide) process which involves the separation of all
actinides in stages to remove Np and Pu together AmCm and Ln together and isolate
U There are two processes being researched both of which use TRPO (Figure 122) as
the extractant but differ in the other reagents used One system uses TTHA (triethylene
tetramine hexaacetate) (Figure 124) as a complexing agent to selectively bind to
different actinides preferentially at different pH values to allow selective extraction
buffered by lactic acid (Figure 125) The other process uses nitric acid to extract MA
and Ln followed by oxalic acid to extract Pu and Np Both processes then use sodium
carbonate to strip the remaining U from solution (Figure 126) The main advantage of
the first system is that MA and Ln can subsequently be separated from each other using
CYANEX 301 (Figure 123) with the main disadvantage being the need for buffering
due to pH dependence The main advantage of the second system is that the separation
between components is excellent and virtually discrete but the main disadvantage is that
MA and Ln cannot be later separated from each other using CYANEX 301 due to the
high acidity of the solution54
66
Figure 124 Chemical structure of TTHA (3-(2-((2-
(bis(carboxymethyl)amino)ethyl)(carboxymethyl)amino)ethyl)-6-
(carboxymethyl)octanedioic acid)
Figure 125 TRPO flow diagram using TTHA
Figure 122 Chemical structure of TRPO
(trialkyl phosphine oxide R = C6 ndash C8)
Figure 123 Chemical structure of
CYANEX 301 (bis(244-
trimethylpentyl)phosphinodithioic acid)
67
Figure 126 TRPO flow diagram using HNO3 and oxalic acid
1348 LUCA
LUCA (Lanthaniden Und Curium Americium trennung lanthanide and curium
americium separation) is a relatively new process currently being developed in
Germany and is designed to follow the SANEX or DIAMEX processes The process
involves the selective separation of Am3+
from Cm3+
Cf3+
and Ln3+
after co-extraction
A combined extractant system of bis(chlorophenyl)dithiophosphinic acid
((ClPh)2PSSH) and tris(2-ethylhexyl)phosphate (TEHP) in isooctane and tert-butyl
benzene is used Advantages of the LUCA process include high recovery after stripping
and that the phosphinic acid is more stable to hydrolysis and radiolysis than CYANEX
301 however the phosphinic acid was found to be unstable in high HNO3
concentrations55
At present as with the majority of the MALn processes described the
exact origin of the selectivity remains unclear however it is clear that in general
simple extractant molecules are favourable
68
Figure 127 LUCA flow diagram
1349 EXAm
The EXAm (Extraction of Americium) process is another relatively new process
developed by the CEA for the extraction of only americium from a PUREX raffinate56
Americium is the main cause of heat emissions in SNF wastes and so selective removal
and reprocessing of Am is favourable for vitrified waste disposal Separation of Am3+
from Cm3+
was considered as Cm reprocessing would be difficult to implement due to
high neutron emissions which would require very thick shielding
The process uses a mixture of two extractants (DMDOHEMA and HDEHP) in
TPH from a 4-6 M HNO3 FP solution TEDGA (NNNrsquoNrsquo-tetraethyl-diglycolamide)
(Figure 128) is used as the complexing agent to selectively retain Cm3+
and Ln3+
in
solution allowing extraction of Am3+
Advantages of the process are that the use of
TEDGA over TODGA allows increased separation of Am3+
Cm3+
and TEDGA is
relatively resistant to radiolysis However the chemistry remains quite poorly
understood and separation factors are still quite low at ~25 due to the very similar
chemistry of the two metal ions57
Figure 128 Chemical structure of TEDGA (NNNrsquoNrsquo-tetraethyl-diglycolamide)
69
137 TALSPEAK
TALSPEAK (Trivalent Actinide Lanthanide Separation by Phosphorus reagent
Extraction from Aqueous Complexation) is a further effective method of advanced
reprocessing by solvent extraction The process was initially developed at Oak Ridge
National Laboratory in Tennessee USA during the 1960s and it is still being refined
The process is designed to allow the separation of MA3+
(Am3+
and Cm3+
) from
Ln3+
and yttrium (Y3+
) from the other fission products and from each other to allow MA
to be reprocessed further by transmutation Although it is still under development the
TALSPEAK process has a number of benefits over other similar processes discussed in
Section 126 The process is resistant to irradiation and allows the separation to be
carried out without the need for high acid and salt concentrations It also has added
benefits in that it has already been performed on a pilot plant scale and uses cost
effective readily available reagents58
Additionally it can be carried out using relatively
inexpensive stainless steel equipment The process is very promising despite its
potential disadvantage that it involves removing the major constituent from the minor
constituent as studies have shown the separation is effective enough for this not to be a
problem
1371 The Process
In the process the MA preferentially form complexes with an aminopolyacetic
acid chelate over the lanthanides This allows the lanthanides to be better extracted into
an organic phase by a mono-acidic organophosphate or phosphonate (Figures 132 and
134) The most effective complexing agent to date is DTPA (diethylenetriamine
pentaacetic acid) (Figure 129) in the pH 25-35 range giving relatively high SFs (~50
for Nd3+
the most difficult to extract Ln3+
ion) and the most effective extracting agents
are HDEHP (di(2-ethylhexyl)phosphoric acid) (Figure 130) and HEH[ϕP] (2-
ethylhexyl phenyl phosphonic acid) (Figure 131) The extraction can be carried out
without the use of a complexing agent although the separation is not as discrete and is
significantly enhanced by the addition of an aminopolyacetic acid such as DTPA
Without DTPA Eu3+
Am3+
separation factors using 03 M HDEHP are around 40 59
whereas SF ~90 can be achieved when the complexing agent is used with the extractant
Other aminopolyacetic acids have been tested such as TTHA and EDTA but are not as
effective or tend to be less soluble60
70
Figure 129 Chemical structure of DTPA (2222-
((((carboxymethyl)azanediyl)bis(ethane-21-diyl))bis(azanetriyl))tetraacetic acid)
TALSPEAK Process
1 The fission product mixture (1 M) is dissolved in a carboxylic acid which acts
as a buffer and a solubiliser for the complexing agent lactic acid is often used
for this (Figure 132) Lactic acid (pKa 386)61
has been found to be the best
buffer for the process as it gives the best phase separation Nitrate may be
present from the original raffinate but this has been found not to decrease
separation
2 The solution is ldquoscrubbedrdquo with a mixture of Na5DTPA (01 M) in the same
carboxylic acid (1 M) at pH 36 ndash 38 The DTPA5-
complexes to the MA3+
and
Ln3+
but binds more strongly to the MA3+
This pH range is the optimum pH for
DTPA5-
activity as it complexes more strongly at higher pH values but
separation is better in more acidic conditions
Figure 130 Chemical structure of
HDEHP (bis(2-ethylhexyl) hydrogen
phosphate)
Figure 131 Chemical structure of
HEH[ϕP] ((2-(2-
ethylhexyl)phenyl)phosphonic acid)
71
3 The extractant is dilute HDEHP (05 M) in a hydrocarbon solution such as
DIPB (diisopropyl benzene found to give the best separation) which is then
contacted with the aqueous solution containing the LnMA[DTPA]2-
The Ln3+
ions are extracted into the organic phase by the phosphate causing dissociation
of the DTPA5-
and leaving the free DTPA5-
in the aqueous solution The
MA[DTPA]2-
complexes remain in the aqueous solution as DTPA5-
is bound
strongly enough to MA3+
to prevent the complexes from dissociating HEH[ϕP]
gives a better extraction although it makes stripping more difficult
4 After the Ln3+
ions are removed a second scrub is carried out at lower pH (15)
and a lower concentration of the complexing agent (005 M Na5DTPA) in lactic
acid (1 M) in order to extract the MA3+
The lower pH increases the extraction
rate as the DTPA5-
binds less strongly to the MA3+
allowing them to be
extracted more easily at the phase boundary where DTPA5-
dissociates The
phosphate (03 M HDEHP) is dissolved in n-dodecane (a more favourable
diluent) for the second extraction to remove the MA3+
into the organic phase
The use of n-dodecane was found to give better extraction but poorer
separation If Ln3+
and Y3+
are the only fission products present in the original
raffinate solution the MA3+
can be recovered by precipitation with oxalate from
the raffinate
5 Stripping is then carried out using 1 M HNO3 Nitric acid prevents the use of
corrosive chlorides This process can also be used to extract Cf3+
and Es3+
but it
has been found that more concentrated acid is needed for heavier actinides
Figure 132 Chemical structure of lactic acid pKa = 386
72
Figure 133 The solvent extraction process used in TALSPEAK Step 1 Binding of
DTPA to M3+
in the aqueous phase at pH 36 buffered by lactic acid Step 2 Selective
extraction of Ln3+
into the organic phase by HDEHP from the aqueous phase due to
preferential binding of DTPA to MA3+
Additional Notes on the Process
Initial extraction data for the process reported by Weaver et al in 1964 was
obtained by adding isotopic tracers to the aqueous solutions contacting them with the
organic phase performing the separation and measuring the activity by scintillation
counting with a γ-detector Extractions were all repeated 2-3 times to verify the results
and the contact time was 20 minutes which was much longer than necessary
Extractions performed using Na5DTPA and H5DTPA were found to give the same
results at the same pH values although pH adjustment was needed as Na5DTPA is more
alkaline than H5DTPA but H5DTPA is much less soluble The extraction of heavier
lanthanides was found to be slower but did not affect the separation Increasing the
concentration of HDEHP was found to give better separation but made the initial
equilibration time too long and increasing the concentration of DTPA decreased the
separation (Figure 134)
1 2
73
Figure 134 Effect of Na5DTPA concentration on distribution ratios of MA3+
and Ln3+
in TALSPEAK process using 1 M lactate buffer and 03 M HDEHP in DIPB extractant
60
The process is based on the preferential binding of the complexant to the
trivalent actinides over lanthanides Initially this was thought to be due to the fact that
An3+
binding is more covalent than Ln3+
binding However this was found not to be the
sole reason and it is understood that the organic ligand plays a role in the selectivity
The chemistry of the complexation of the ions with the ligand is not yet fully
understood and much work is needed to gain an insight into this complicated
chemistry62
74
Figure 135 TALSPEAK flow diagram
138 Reprocessing Summary
The necessity of reprocessing has arisen from increasing awareness and concern
for the environment in addition to the potential of maximising finite resources whilst
minimising proliferation There are a number of different processes currently under
development none of which have yet been implemented on a commercial scale except
for the PUREX process
The principles of all these process are often very similar although extraction
techniques and reagents vary somewhat There are a number of factors which must be
considered when developing a suitable solvent extraction process for SNF reprocessing
including the ease of stripping (back-extraction) the need for low volatility non-
flammable solvents the potential of the process to be continuous how to minimise
waste production the resistance of the process to radiolysis and degradation
practicality and efficiency of the process and the economic viability63
While some of the chemistry is understood such as the redox chemistry in the
PUREX process much of it is not thus limiting the potential to develop an efficient
process The sheer complexity of the waste content makes partitioning very difficult
and without a full understanding of the chemistry involved in the processes designing
75
an effective working process will be very challenging All of the processes currently
under development have advantages and disadvantages but all are ultimately heading
towards the same goal separation of the actinides from the lanthanides in order allow
the transmutation of the actinides into shorter lived radionuclides for the purpose of
reducing the long-term radiotoxicity of the waste and the volume of waste building up
in storage
TALSPEAK is one of the most promising techniques being researched due to its
numerous advantages particularly its relative resistance to irradiation and ability to be
carried out without the need for high reagent concentrations Additionally it gives
separation factors of ~50-100 comparable to the SANEX process which uses BTP one
of the most effective complexing agents However its main disadvantage is the poor
understanding of the separation mechanisms and complexation chemistry surrounding
it The main focus of research here will be the TALSPEAK process with a view to
improving the understanding of this chemistry and modifying the process to improve its
practicality
14 Project Objectives and Thesis Outline
Recent studies have shown that complexants with soft donor atoms compared to
oxygen (such as N or S) can be used to separate the MA from Ln6465
Initial research in
this area was carried out by our collaborators at Idaho National Lab using amino acids
as a potential buffer and soft donor which if proven to be successful would be able to
eliminate the need for the separate complexing agent and buffer simplifying the process
if amino acids were found to preferentially bind to the MA66
Another benefit to this
change would be the scope for carrying out the process at a lower pH due to the lower
pKa values of the carboxylic acid groups of the amino acids than on DTPA enabling
the system to be buffered to pH 1-2 rather than ~35 Lower pH values are preferred by
industry as higher acid concentrations are easier to control on a large scale pH control
is essential for the distribution ratios for the separation and there is a strong correlation
between the two Low pH values have been found to increase D however DTPA
protonates and precipitates out of the solution at the lowest values The use of amino
acids in place of the complexing agent would allow a lower pH to be used as they would
not fully protonate increasing the SF and making the process more efficient as binding
constants and ligand affinities would be higher To this end several avenues of research
have been explored
76
Chapter 2 presents initial studies carried out using amino acids in a TALSPEAK
system the interaction of amino acids with lanthanide and actinide ions and their
complexes in solution and the susceptibility of amino acid systems to radiolysis
Chapter 3 discusses work carried out at the INL on an L-alanine-buffered
system optimisation of the alanine system at pH 2 in order to maximise separation
potential and the consideration of other amino acid buffers over a range of pH values
Chapter 4 is focussed on an L-glutathione (GSH) buffered system GSH is a
tripeptide showing promise for an improved TALSPEAK system the next step after
research using single amino acids Data was initially obtained via solvent extraction in
order to investigate the separation ability of GSH and conditions were then optimised in
order to achieve maximum separation Interaction of the buffer with various
components in solution including lanthanide ions was probed using various techniques
including luminescence spectroscopy which was also used in determining the
susceptibility of the buffer to -radiolysis
Chapter 5 details the synthesis of amino acid appended DTPA ligands and their
complexation with lanthanide ions as well as their extraction and separation abilities
under different conditions along with radiolysis resistant investigations
77
1 S Cotton Lanthanide and Actinide Chemistry ed D Woolins R Crabtree D
Atwood and G Meyer John Wiley amp Sons Chichester UK 2006 1 1-7
2 C H Evans Episodes from the History of the Rare Earth Elements Kluwer
Academic Publishers Dordrecht Netherlands 1996
3 S Cotton Education in Chemistry 1999 36 4 96 WR Wilmarth RG Haire JP
Young DW Ramey JR Peterson J Less Common Metals 1988 141 275
4 LR Morss NM Edelstein and J Fuger The Chemistry of the Actindie and
Transactinide Elements Springer The Netherlands 4th edn 2010
5 AP Jones F Wall CT Williams Rare Earth Minerals Chemistry Origin and Ore
Deposits ed AP Jones F Wall and CT Williams Chapman and Hall London UK
1966 1 6-10
6 JJ Katz and GT Seaborg The Chemistry of The Actinide Elements Methuen amp Co
Ltd The Pitman Press Great Britain 1957
7 N Kaltsoyannis and P Scott The f elements ed R G Compton S G Davies J
Evans and L F Gladden Oxford University Press United States 1st edn 1999
8 Greenwood NN and Earnshaw A Chemistry of the Elements Butterworth-
Heinemann Great Britain 2nd edn1997
9 MB Jones AJ Gaunt Chem Rev 2012 DOI 101021cr300198m
10 L Natrajan F Burdet J Peacutecaut M Mazzanti J Am Chem Soc 2006 128 7152
11 C Fillaux D Guillaumont J-C Berthet R Copping D Shuh T Tyliszczak C
Den Auwer Phys Chem Chem Phys 2010 12 14253
12 HC Aspinall Chemistry of the f-block Elements ed D Phillips P OrsquoBrien and S
Roberts Gordon and Breach Science Publishers Singapore 2001 vol 5
13 F Gendron K Sharkas and J Autschbach J Phys Chem Lett 2015 6 2183-
2188
14 VBE Thomsen J Chem Educ 1995 72 (7) 616-618
15 Dr Louise Natrajan School of Chemistry The University of Manchester
16 JP Leonard CB Nolan F Stomeo and T Gunnlaugsson Topics in Current
Chemistry 2007 vol 281 pp1-43
17 Y Ma and Y Wang Co-ord Chem Rev 2010 254 972-990
18 LS Natrajan AN Swinburne MB Andrews S Randall and SL Heath Coordin
Chem Rev 2014 266-267 171-193
19 A Bettencourt-Dias Dalton Trans 2007 2229-2241
20 E Hashem AN Swinburne C Schulzke JD Kelly RC Evans JA Platts A
Kerridge LS Natrajan and RJ Baker RSC Adv 2013 3 4350
78
21 C Turro PK Fu and PM Bradley Met Ions Biol Syst 2003 40 323-353
22 Dr Louise Natrajan School of Chemistry The University of Manchester
23 I Billard and G Geipel Springer Ser Fluoresc 2008 5 465-492
24 A Beeby IM Clarkson RS Dickins S Faulkner D Parker L Royle AS de
Sousa JAG Williams and M Woods J Chem Soc Perkin Trans 2 1999 493-504
25 WD Horrocks and DR Sudnick J Am Chem Soc 1979 101 334
26 RM Supkowski and WD Horrocks Inorg Chim Acta 2002 340 44-48
27 Dummiesreg Nuclear Fission Basics httpwwwdummiescomhow-
tocontentnuclear-fission-basicshtml 2015
28 PE Hodgson Nuclear Power Energy and the Environment Imperial College Press
Great Britain 1999
29 P Dyck and MJ Crijns Rising Needs IAEA Bulletin 1998 40 1
30 World Nuclear Association The Nuclear Fuel Cycle httpwwwworld-
nuclearorginfoinf03html 2011
31 Nuclearmatterscouk Re-use of Plutonium as MOX Fuel
httpnuclearmatterscouk201202re-use-of-plutonium-as-mox-fuel 2012
32 World Nuclear Association Processing of Used Nuclear Fuel 2012
httpwwwworld-nuclearorginfoinf69htmla
33 United States Nuclear Regulatory Commission Neutron poison httpwwwnrcgov
2012
34 K L Nash Solvent Extraction and Ion Exchange 1993 114 729-768
35 M P Jensen L R Morss J V Beitz and D D Ensor Journal of Alloys and
Compounds 2000 303-304 137-141
36 Advanced Separation Techniques for Nuclear Fuel Reprocessing and Radioactive
Waste Treatment ed KL Nash and GL Lumetta Woodhead Publishing 1st edn
Cambridge UK 2011
37 CS Dileep Poonam Jagasia PS Dhami PV Achuthan AD Moorthy U
Jambunathan SK Munshi PK Dey and BS Tomar BARC Newsletter 2007 285
130-134
38 H Schmieder G Petrich and A Hollmann J Inorg Nucl Chem 1981 43 (12)
3373-3376
39 SC Tripathi and A Ramanujam Sep Sci and Technol 2003 38 2307
40 G Thiollet and C Musikas Solv Extr Ion Exch 1989 7 813
41 GL De Poorter and CK Rofer-De Poorter 720872 1976 US Pat 4080273 1978
79
42 EP Horwitz DC Kalina H Diamond GF Vandegrift and WW Schulz Solv
Extr Ion Exch 1985 31 75-109
43 A Banc P Bauduin and O Diat Chem Phys Lett 2010 494 (4-6) 301-305
44 J Muller L Bethon N Zorz and J-P Simonin Proceedings of the First ACSEPT
International Workshop 2010
45 C Brassier-Lecarme P Baron JL Chevalier and C Madic Hydrometallurgy
1997 47 57-67
46 O Courson R Malmbeck G Pagliosa K Romer B Satmark J-P Glatz P Baron
and C Madic Radiochim Acta 2000 88 865-871
47 M Sypula A Wilden C Schreinemachers and G Modolo Proceedings of the First
ACSEPT International Workshop 2010
48 C Hill L Berthon P Bros J-P Dancausse and D Guillaneux Nuclear Energy
Agency 7th Information Exchange Meeting Session II 2002
49 S Bourg C Hill C Caravaca C Rhodes C Ekberg R Taylor A Geist G
Modolo L Cassayre G de Angelis A Espartero S Bouvet N Ouvrier Nucl Eng
Des 2011 241 3427 G Modolo A Wilden A Geist D Magnusson R Malmbeck
Radiochim Acta 2012 100 715
50 A Geist U Muumlllich D Magnusson P Kaden G Modolo A Wilden T Zevaco
Solv Extr Ion Exchange 2012 30 433
51 A Wilden C Schreinemachers M Sypula G Modolo Solv Extr Ion Exch 2011
29 190
52 FW Lewis LM Harwood MJ Hudson MGB Drew V Hubscher-Bruder V
Videva F Arnaud-Neu K Stamberg and S Vyas Inorg Chem 2013 52 4993-5005
53 E Aneheim C Ekberg A Fermvik M R St J Foreman T Retegan and G
Skarnemark Solv Extr Ion Exch 2010 284 437-458
54 M Wei X Liu and J Chen J Radioanal Nucl Chem 2012 291 717-723
55 G Modolo P Kluxen A Geist Radiochim Acta 2010 98 193
56 C Rostaing C Poinssot D Warin P Baron and B Lorrain Procedia Chem 2012
7 349-357
57 S Chapron C Marie G Arrachart M Miguirditchian and S Pellet-Rostaing Solv
Extraction and Ion Exchange 2015 33 236-248
58 M Milsson and K L Nash Solvent Extraction and Ion Exchange 2009 273 354-
377
59 G Lumetta AV Gelis and GF Vandegrift Solv Extraction and Ion Exchange
2010 28 3 287-312
80
60 B Weaver and T A Kappelmann Talspeak A new method of separating americium
and curium from the lanthanides by extraction from an aqueous solution of an
aminopolyacetic acid complex with a monoacidic organophosphate or phosphonate
Oak Ridge National Laboratory 1964 1-60
61 K W Raymond General Organic and Biological Chemistry An Integrated
Approach John Wiley amp Sons USA 3rd edn 2010 7 253
62 L Karmazin M Mazzanti C Gateau C Hill and J Peacutecaut Chem Commun 2002
2892-2893
63 KL Nash Actinide Solution Chemistry Proceedings of the Eighth Actinide
Conference Actinides 2005
64 M P Jensen and A H Bond J Am Chem Soc 2002 124 9870-9877
65 L R Martin B J Mincher and N C Schmitt J Radioanal Nucl Chem 2009
282 523-526
66 S Oumlzҫubukҫu K Mandal S Wegner M P Jensen and C He Inorg Chem 2011
50 7937-7939
81
2 COMPLEXATION STUDIES OF Ln amp An WITH DTPA AND BUFFERS
UNDER TALSPEAK CONDITIONS
DTPA (diethylenetriaminepentaacetic acid) is an amino polycarboxylic acid
used to act as a holdback reagent in the TALSPEAK process (Trivalent Actinide
Lanthanide Separation by Phosphorus reagent Extraction from Aqueous Complexation)
an advanced reprocessing technique currently being developed in the USA (Section
137) DTPA is the chelating agent used as it has been shown to complex more strongly
to trivalent minor actinide ions (MA3+
) than lanthanide ions (Ln3+
) in aqueous solution
allowing selective extraction of lanthanides into an organic phase by organophosphate
HDEHP (di-(2ethylhexyl)phosphoric acid) to separate the two components
21 Introduction to An-DTPA and Ln-DTPA Complexes
It is widely known that DTPA ligands bind very well to metal ions in aqueous
media It is commonly used to extract heavy metals from soils for environmental
reasons1 and to treat heavy metal poisoning through its ability to chelate to heavy
metals making them more water soluble and able to be removed from the body
naturally by excretion2 Lanthanide DTPA complexes have been well established
although there is actually very little structural data available on them Most literature
references to lanthanide DTPA complexes discuss their use as MRI contrast agents the
most common choice being Gd-DTPA3 Other reported applications of DTPA-based
lanthanide complexes are for use as biological luminescent probes particularly with Eu4
and Tb5 Due to the highly hygroscopic nature of Ln-DTPA complexes solid state
structural analysis has only been reported in two instances as molecular structures
determined by X-ray absorption spectroscopy (XAS) one for Gd(III)-DTPA (Figure
21) and one for Eu(II)-DTPA6 Most solution state structural analysis for lanthanide
DTPA complexes has been carried out recently in order to better understand MALn
separation and TALSPEAK chemistry The only literature available on An-DTPA
complexes is related to separations chemistry except for actinium-DTPA used in
radiotherapy7
82
Figure 21 XAS molecular structure of Gd(III)-DTPA8
211 Stability of Ln-DTPA and An-DTPA Complexes
Reports on the formation of trivalent actinide complexes with DTPA detail that
the stability of AnDTPA2-
complexes (the dominant DTPA species present at pH 36
which is the pH currently used in the TALSPEAK process) is greater than the stability
of LnDTPA2-
complexes allowing the selective extraction on Ln3+
to take place For
LnDTPA2-
complexes stability constants range from log β = 1948 for La increasing
across the series up to log β = 2283 for Dy (with a slight dip at Gd) decreasing slightly
for the heavier Ln3+
complexes
Stability constants in the literature for AnDTPA2-
have been determined by a
range of techniques including TRLFS CE-ICP-MS spectrophotometry and solvent
extraction and range from log β = 2257 to 2403 for AmDTPA2-
and from log β = 2238
- 2348 for CmDTPA2-
at an ionic strength (I) of 01 M However there is some dispute
on whether AnHDTPA- complexes are also present in solution and this needs to be
accounted for when calculating stability constants as some of these values have been
determined with and some without consideration of AnHDTPA-9101112
Studies conducted by Martin et al determined stability constants of log β =
2219 - 2085 for CmDTPA2-
at I = 1 M over a temperature range of 10-70 degC
compared to log β = 2131 - 2033 for EuDTPA2-
over the same temperature range The
complex EuHDTPA- was found to have a stability constant of log β = 227 - 210 under
TALSPEAK conditions Europium(III)is used as a standard comparison to Am3+
Cm3+
due to the close similarity in chemistry between the elements as a result of their
electronic structures This data clearly shows that the Cm3+
has a higher binding
83
strength to DTPA5-
than Eu3+
The greater exothermic enthalpy of complexation of
CmDTPA2-
than EuDTPA2-
(-407 kJ mol-1
vs -336 kJ mol-1
) determined by
microcalorimetry indicated stronger covalent bonding of Cm3+
to DTPA5-
than Eu3+
Luminescence spectroscopy carried out in support of these studies found that
CmDTPA2-
has a shorter luminescence lifetime than EuDTPA2-
(268 micros in H2O 815 micros
in D2O for Cm3+
cf 630 micros in H2O 6200 micros in D2O for Eu3+
) This along with the
biexponential decay pattern indicating the presence of two species for Cm3+
was
attributed to faster exchange between Eu3+
and the ligandsolvent than for Cm3+
suggesting that the exchange for Eu3+
is not distinguishable on the luminescence
timescale and therefore less susceptible to the associated quenching effects This may be
due to the more ionic bonding of Eu3+
to the ligand
The pKa for the protonation of MDTPA2-
to MHDTPA- (M = metal ion) is 227
for Eu and 025 for Cm indicating that CmHDTPA- is only likely to be present in
solutions of very low pH (pH ltlt 1) It was hypothesised that the presence of
LnHDTPA- facilitates the exchange between ligand and solvent explaining the
observed difference in luminescence lifetime data consistent with stronger
complexation of MA3+
to DTPA and slower kinetics of MA3+
extraction as the
MDTPA2-
is less likely to dissociate13
212 Co-ordination Chemistry of Ln-DTPA and An-DTPA Complexes
It is known that Ln3+
ions co-ordinate to DTPA5-
in aqueous solution at pH 36
through the 5 deprotonated carboxylate groups (COO-) on the molecule and through the
three nitrogen atoms on the DTPA backbone forming an octadentate complex with one
water molecule in its inner hydration sphere giving the Eu3+
ion a co-ordination number
of 9 in the shape of a distorted capped square antiprism This is also the case for the
LnHDTPA- species
Figure 22 Chemical structure of [Eu(DTPA)]2-
84
The co-ordination mode of DTPA5-
to MA3+
is the same as for Ln3+
octadentate
(Figure 21) with a co-ordination number of 9 due to 1 water molecule bound to the
metal ion Hydration numbers of 2 have been reported for Cm-DTPA complexes but
have been found not to be stable14
DFT optimisation of CmDTPA2-
and EuDTPA2-
structures conducted by Martin
et al found that the M-O bond lengths were similar for both metal ions but that the M-
N bond lengths were shorter for Cm3+
than Eu3+
(by 004-008 Aring) Considering that
Cm3+
has a larger ionic radius than Eu3+
this suggests that Cm3+
binds more strongly to
the intermediate N donors on the DTPA molecule Further optimisations showed that
significant changes in bond lengths upon protonation of MDTPA2-
to MHDTPA-
indicated that M-N interactions are weakened to a greater extent for Cm3+
than Eu3+
so
that MHDTPA- is less likely to form for Cm
3+ in solution than Eu
3+ This data is
consistent with the pKa data for the complexes (Section 211)
22 Ln-DTPA Complexation Studies
As a first experiment (in order to verify the experimental procedures for
subsequent studies) the complex [Eu(DTPA)H2O]2-
was formed from europium nitrate
(1 mM) and Na5DTPA (005 M) in H2O and D2O at pH 36 and characterised by 1H
NMR spectroscopy (for the complex in D2O) and luminescence spectroscopy (D2O and
H2O)
221 1H NMR Studies of Ln-DTPA
1H NMR spectra are difficult to fully assign for Ln
3+ DTPA complexes due to
both the paramagnetic nature of the ions and the (fast) chemical exchange of the CH2
carboxylate and ethylene diamine backbone protons which results in significant
spectral broadening However complex formation can be verified at lower temperatures
(here 5 degC) where this conformational exchange is slowed down so the paramagnetic
broadening and shifting of the CH2 DTPA proton resonances can be observed in the 1H
NMR spectrum (Figure 23) by comparison with uncomplexed DTPA (Figures 24a-c)
85
EUDTPAESP
15 10 5 0 -5 -10 -15 -20
Chemical Shift (ppm)
0
0005
0010
0015
0020
0025
0030
0035
0040
0045
0050
0055
Norm
alized Inte
nsity
152
8
99
196
6
88
4
53
7
42
536
033
528
7
15
8
-01
1
-16
1
-40
6
-57
3-6
33
-105
3
-126
8
-148
3
-170
2
-184
7
Figure 23 1H NMR spectrum of [Eu(DTPA)]
2- in D2O at 278 K at pD = 36
DTPA pH71resp
55 50 45 40 35 30 25 20
Chemical Shift (ppm)
0
0005
0010
0015
0020
0025
0030
0035
0040
0045
0050
0055
0060
Norm
alized Inte
nsity
199100215418
DEUTERIUM OXIDE
Water
38
1
34
033
833
632
8
30
630
530
3
a
86
DTPA pH361resp
55 50 45 40 35 30 25 20
Chemical Shift (ppm)
0
0005
0010
0015
0020
0025
0030
0035
0040
0045
0050
0055
0060
Norm
alized Inte
nsity
204206100421
Water
47
647
5
38
5
35
634
634
434
3
31
531
431
2
DTPA pH21resp
55 50 45 40 35 30 25 20
Chemical Shift (ppm)
0
0005
0010
0015
0020
0025
0030
0035
0040
0045
0050
0055
0060
Norm
alized Inte
nsity
202199100406
Water
47
5 46
9
39
0
35
4
34
033
933
7
31
130
930
8
Figure 24 1H NMR spectra of DTPA in D2O at 278 K at varying pD a) pD 7
[DTPA]5-
b) pD 36 [H3DTPA]2-
c) pD 2 [H5DTPA]
222 Luminescence Studies of Ln-DTPA
Emission spectra were recorded for Eu
3+ (1 mM) with and without DTPA
5- (005
M) present in aqueous solution (Figure 25) following 397 nm excitation directly into
the 5L6 f-f absorption band
15 The formation of [Eu(DTPA)]
2- can be observed by the
splitting of the peaks in the emission spectrum of the complex compared to the free
Eu3+
(aq) representing the 5D0 rarr
7FJ transitions where J = 0 1 2 3 and 4 This is due to
crystal field splitting caused by the ligand and is indicative of strong binding of the
ligand to Eu3+
ion at pH 361617
The emission intensity is also significantly enhanced
upon the complexation of Eu3+
to DTPA5-
as the chelating ligand forms an octadentate
b
c
87
complex significantly lowering the degree of quenching of the emission by surrounding
solvent molecules
Figure 25 Emission spectrum of Eu3+
(aq) and [Eu(DTPA)]2-
in D2O at pD 36
Additionally the luminescence lifetimes of the free Eu3+
(aq) and the
[Eu(DTPA)]2-
complex were measured in D2O and H2O This allows calculation of q
which represents the number of bound solvent molecules in the inner hydration sphere
of the metal ion The original Horrocks equation18
(Equation 19) and modified
Horrocks equation1920
for q lt 2 (Equation 110) are shown below
Equation 21
Equation 22
The Horrocks equation uses the emission lifetimes (τ) to determine q A is the
proportionality constant taking into account the inner hydration sphere and B is a
correction factor taking into account the outer hydration sphere A and B values are
experimentally determined constants and are available for Sm3+
Eu3+
Tb3+
Nd3+
Yb3+
Am3+
and Cm3+
The q values can be effectively determined from solutions of water and
methanol For the original Horrocksrsquo equation A = 105 for Eu3+
and A = 42 for Tb3+
and for the modified Horrocksrsquo equation (when q lt 2 ) A = 12 ms and B = (025 ndash
0
2
4
6
8
10
12
14
16
18
550 570 590 610 630 650 670 690 710
Emis
sio
n In
ten
sity
(au
) x
10
00
0
Wavelength (nm)
[Eu(DTPA)]2-
Eu3+
5D0 rarr 7F0
5D0 rarr 7F1
5D0 rarr 7F2
5D0 rarr 7F3
5D0 rarr 7F4
88
0075x) ms-1
(where x = the number of exchangeable N-H oscillators) for Eu3+
and A =
5 ms and B = 006 ms-1
for Tb3+
The q value was found to be 9 for Eu3+
(aq) suggesting that the Eu3+
ion is
surrounded by 9 solvent molecules forming [Eu(H2O)9]3+
in aqueous solution as
expected For [Eu(DTPA)]2-
formed at pH 36 q was found to be 14 plusmn 02 showing that
only 1 water molecule is bound to the metal ion This compares well to the literature
values reported at pH 7 where the lifetimes are similar and q = 1121
23 An-DTPA Complexation Studies
The aminopolycarboxylate DTPA5-
chelates even more strongly to An3+
ions
than Ln3+
ions Preliminary 1H NMR and luminescence analyses were carried out by
Louise Natrajan at KIT-INE in Karlsruhe Germany on Am3+
and Cm3+
complexation
with DTPA as part of the FP7 EURACT-NMR scheme (Scheme 21)
Scheme 21 Complexation of DTPA to Am3+
and Cm3+
231 1H NMR Studies of An-DTPA
The complex [Am(DTPA)xH2O]2-
was formed and analysed by 1H NMR in a
41 ratio of MeODD2O with an additional drop of NaOD to ensure complex formation
from a dried acidic americium nitrate stock salt and Na5DTPA The spectra were taken
over a temperature range of 210-365 K at ~ pD 3 (Figure 26) Note here that the exact
pD of the solution could not be accurately measured due to the high specific activity of
the 241
Am isotope used From the spectrum it can be seen that at pD 3 there is a DTPA
complex formed and that at higher temperatures there are some dynamic exchange
processes occurring as the resonances become broader and the spectrum becomes
simpler This is most likely due to conformational changes in the DTPA ligand
(movement of the carboxylates and the ethylene bridge protons analogous to DOTA
and DO3A derivatives)22
The Am3+
ion is essentially diamagnetic as it has a 7F0 ground state and the
magnetic moment is calculated as 0 based on the Russell Saunders coupling scheme
89
The same is true for the isoelectronic lanthanide analogue Eu3+
but in this ion
significant paramagnetism is induced at room temperature due to low-lying energy
levels that are thermally populated according to the Boltzmann distribution Thermal
mixing of J states induces a paramagnetic shift but in the case of Am3+
the second J
level lies much higher in energy (~ 4000 cm-1
higher) so may only be populated and
induce a paramagnetic shifting of proton resonances at higher temperatures2324
Indeed
a slight shift of the proton resonances with temperature is observed for
[Am(DTPA)xH2O]2-
potentially indicating a small contribution of the Am3+
7F1 excited
state to the chemical shift of the proton resonances
Figure 26 1H NMR spectrum for [Am(DTPA)xH2O]
2- in 41 vv MeODD2O with
NaOD over a temperature range at pH 3
232 Luminescence Studies of An-DTPA
Emission spectra were recorded for solutions of
243Cm
3+ (015 microM Cm
3+ in 32
mM HClO4 diluted to 1 mL with H2O) with and without Na5DTPA (02 M) present in
aqueous solution following direct excitation at 3966 nm into the f-f absorption band of
Cm3+
(Figure 27) The formation of [Cm(DTPA)]2-
can be observed by the immediate
formation of a new red shifted emission band at 607 nm attributed to the 6D72
8S72
transition in the complex compared to that in free Cm
3+(aq)
at 593 nm The f-f transitions
in Cm3+
are much more sensitive to the coordination environment than Ln3+
due to more
210 K
265 K
300 K
365 K
90
spin orbit coupling and the fact the 5f orbitals are more spatially diffuse than the 4f
orbitals resulting in a much greater difference in emission spectra upon complexation
for actinides than lanthanides
Figure 27 Emission spectrum of Cm3+
and [Cm(DTPA)]2-
in perchloric acid at pH 3
by direct excitation with a NdYAG pumped dye laser at 3966 nm
Similarly to Eu3+
the inner hydration sphere of the free Cm3+
ion is known to
contain 9 water molecules25
In 1998 Kimura and Choppin developed a modified
version of the Horrocks equation in order to allow q to be calculated from aqueousnon-
aqueous solvent mixtures (Equation 23)26
Equation 23
The lifetime of the [Cm(DTPA)]2-
complex in H2O is 510 micros and is significantly
longer than that of the aqua ion which is determined as 68 micros The radiative lifetime of
the complex can be directly inserted into this equation and indicates that there are 16
water molecules (between 1 and 2) co-ordinated to the metal ion again showing the
formation of an octadentate complex with DTPA ligand analogously to Eu3+
24 Introduction to Buffer Interaction with Ln3+
and Ln-DTPA Complexes
241 Interaction of Lactate with Ln3+
and Ln-DTPA Complexes
A lactic acidlactate buffer is used in the TALSPEAK process to buffer the
system to pH 36 Lactate (Lac) is known to co-ordinate to M3+
ions27
to form
40
45
50
55
60
65
70
75
80
570 590 610 630
Emis
sio
n In
ten
sity
(au
) Tho
usa
nd
s
Wavelength (nm)
Cm3+(aq)
[Cm(DTPA)]2-
91
M3+
(CH3CH(OH)COO-)3 Equations 24a-c show the formation of Eu
3+-lactate
complexes
Equation 24a-c
(a)
(b)
(c)
Stability constants for each of the species formed in Equations 24a-c were
determined by Martin et al over a temperature range of 0-70 degC Log β values were
found to be 290-281 for Eu(Lac)2+
log β = 490-449 for Eu(Lac)2+ and log β = 624-
633 for Eu(Lac)3 Luminescence spectroscopy of Eu-lactate formation showed that as
the concentration of lactate was increased from 0 mM to 73 mM the emission intensity
of the J=2 peak (5D0 rarr
7F2 transition) at 615-620 nm increased but the J=1 peak (
5D0 rarr
7F1 transition) at 590-600 nm was not significantly affected changing the J=1J=2 peak
ratio suggesting that the co-ordination mode of the lactate to the Eu3+
ion changes as a
function of lactate concentration as the J=1 peak is a magnetic dipole transition which is
insensitive to the co-ordination of the ion (Figure 28)28
Figure 28 Emission spectrum of Eu-lactate as a function of lactate concentration28
The luminescence lifetimes of Eu3+
in water also increased as the lactate
concentration was increased indicating that the number of water molecules directly co-
ordinated to the metal ion decreases from ~9 to ~5 due to complexation with lactate
Luminescence and thermodynamic data suggest that lactate co-ordinates in a bidentate
92
mode to Ln3+
ions through the deprotonated carboxylate group and also through the α-
hydroxyl group (Figure 29) making Ln-lactate complexes more stable than simple
monocarboxylates with monodentate co-ordination28
Figure 29 Co-ordination mode of lactate to Eu3+
28
The interaction of lactate ions with metal-DTPA complexes is less well
understood It is considered that there is an exchange between the Ln3+
ion and the
lactate and DTPA ligands The concentration of lactate has been shown by Nash et al to
affect the complexation and dissociation of [Ln(DTPA)]2-
however it is not understood
whether this is due to the changing pH with lactate concentration since extraction in the
TALSPEAK process is heavily dependent on pH29
TALSPEAK extractions using
lactate without DTPA show poor separation of Ln3+
over Am3+
DTPA is required to
achieve separation of MA3+
from Ln3+
as lactic acid acts only as a buffer and not a
holdback reagent
Research has shown previously that binary complexes are dominant in the
TALSPEAK process chiefly in the form of MDTPA2-
and M(Lac)n3-n
Studies carried
out using spectrophotometry luminescence spectroscopy and thermometric
experiments have shown that ternary M3+
-DTPA-lactate complexes with lactate co-
ordinated directly to the metal centre are only present in very small quantities and so
will have negligible effect on metal separation However it is possible that outer sphere
ternary M3+
-DTPA-lactate complexes may form where the lactate interacts with the
DTPA molecule although it is expected these would also be present only in minor
quantities and so would also have negligible effect on metal separation30
242 Interaction of Amino Acids with Ln3+
and Ln-DTPA Complexes
The potential of using amino acids as a combined buffer and soft donor was
considered as it was thought that the increased number of softer donors on amino acids
93
compared to lactate may remove the need for the separate buffer and DTPA holdback
reagent if amino acids were found to preferentially bind to MA3+
in solution There have
been few studies on the interaction of amino acids with lanthanide ions and none with
actinide ions or with DTPA Stability constants for amino acids with lanthanide ions31
can be found in the literature and like stability of lactate complexes with Ln3+
ions32
generally tend to increase across the lanthanide series from La-Lu as the Lewis acidity
of the metal ions increases The values are close to the stability constants for Ln-lactate
complexes averaging at around 5-6 depending on the metal ion and amino acid Log β
values for La-Sm with glycine range from 532-584 and with L-alanine log β = 582-
668
25 Studies on Buffer Interaction with M3+
and [M(DTPA)]2-
Initial studies in this area considered the interaction of various amino acids and
lactate with lanthanide ions in TALSPEAK systems The amino acids glycine L-alanine
and L-serine (Figure 210) were chosen to begin this research due to their similarity in
molecular structure to lactate and good solubility in water
Figure 210 Chemical structures of L-alanine (top) glycine (bottom left) and L-serine
(bottom right)
251 1H NMR Studies on Buffer Interactions
L-alanine (1 M) was added to Eu(NO3)3 (10 mM) in D2O and analysed by
1H
NMR spectroscopy (Figure 211) The spectrum shows that L-alanine complexes
weakly with the metal ion as there is minimal paramagnetic line broadening and only
slight shifting of the proton resonances from that of L-alanine itself (Figure 212)
94
New Eu Ala0011resp
55 50 45 40 35 30 25 20 15 10 05 0
Chemical Shift (ppm)
0
005
010
015
Norm
alized Inte
nsity
310100
CH3
CH
Water
47
147
1
35
5
12
712
6
Figure 211 1H NMR spectrum of Eu(NO3)3xH2O (10 mM) with L-alanine in D2O at
278 K
Ala1resp
55 50 45 40 35 30 25 20 15 10 05 0
Chemical Shift (ppm)
0
01
02
03
04
05
06
07
08
09
10
Norm
alized Inte
nsity
336100
CH3
CH
Water
36
536
336
2
13
3
Figure 212 1H NMR spectrum of L-alanine in D2O at 278 K
95
The interaction of L-alanine (1 M) with [Eu(DTPA)]2-
(10 mM) in D2O was also
investigated by 1H NMR spectroscopy (Figure 213) This spectrum shows that the L-
alanine does not bind to the europium DTPA complex on the experimental timescale as
there is no paramagnetic broadening or shifting of the amino acid peaks and the ligand
is present as uncomplexed ligand
EuDTPA Ala1esp
15 10 5 0 -5 -10 -15 -20
Chemical Shift (ppm)
0005
0010
0015
0020
0025
0030
0035
Norm
alized Inte
nsity
150
5 96
892
185
2
75
4
50
4
39
533
231
625
8
14
6
05
0
-13
1
-44
2
-63
3-6
86
-108
2
-127
6
-143
1
-169
0
-183
9
Figure 213 1H NMR spectrum of [Eu(DTPA)]
2- (10 mM) with L-alanine (1 M) in D2O
at 278 K
252 Luminescence Studies on Buffer Interactions
2521 Sensitisation Tests
Luminescence studies on a [Tb(DTPA)]2-
(1 mM) complex in the presence of
the amino acid L-phenylalanine (05 M) (Figure 215) at pH 3 were initially carried out
in order to determine if sensitised emission occurs whereby energy would be
transferred from the phenyl chromophore of the amino acid to the metal ion This could
potentially occur if the amino acid was in close proximity (ie bound) to the metal ion
and would give some indication into the interaction between the amino acid and the
metal ion However sensitised emission was found not to occur as when the complex
was excited in the region of the phenyl chromophore (250 nm) no emission occurred
When excited directly into the f-f region of the Tb3+
complex at 379 nm there was a
slight decrease in emission intensity upon the addition of L-phenylalanine however the
decrease is not significant The excitation spectrum was recorded of the emission at 545
96
nm and showed only the presence of f-f transitions and no contribution from the organic
region (Figure 214)
Figure 214 Emission spectra of [Tb(DTPA)]2-
in D2O at pD 3 with and without the
presence of L-phenylalanine (05 M) excited at 250 nm and 379 nm Excitation
spectrum of [Tb(DTPA)]2-
in D2O at pD 3 with L-phenylalanine (05 M) at 545 nm
Figure 215 Chemical structure of L-phenylalanine
2522 Aqueous Phase Lanthanide Studies without Na5DTPA
Emission spectra of Eu3+
(1 mM Eu(NO3)3) were taken in D2O and H2O with the
presence of different amino acidslactate (1 M) in order to determine whether the amino
acids bind to the metal ions at pH 36 (TALSPEAK pH) The emission spectrum of the
free metal ion in solution was also measured for comparison (Figure 216)
0
100
200
300
400
500
600
700
0
5
10
15
20
25
30
220 320 420 520 620
Ab
sorp
tio
n In
ten
sity
(au
) Th
ou
san
ds
Emis
sio
n In
ten
sity
(au
) Th
ou
san
ds
Wavelength (nm)
TbDTPA exc 379 nm
TbDTPA + Phe exc 250 nm
TbDTPA + Phe exc 379 nm
Excitation of TbDTPA + Phe at 545 nm
97
Figure 216 Emission spectra of Eu(NO3)3 in D2O at pD 36 with and without the
presence of amino acidslactate (1 M) excited at 395 nm at 298 K
The emission intensity increases upon the addition of amino acidslactate to Eu3+
in D2O This shows that the amino acids are interacting with the metal ion however the
emission spectra resemble that of the free aqua ion suggesting that the amino acids and
lactate are not binding to the metal ion The presence of the amino acids at such a high
concentration will reduce quenching effects from the surrounding solvent molecules
which may be one explanation for the increased emission intensity At pH 36 the
amino acids will be in their zwitterionic form (H3N+-CHR-COO
-) and so are likely to
co-ordinate with the free metal ion in the same manner as lactate however this co-
ordination appears to be very weak and they are probably in fast exchange with
surrounding water molecules
The q values of the Eu3+
ions were calculated from the luminescence lifetimes in
H2O and D2O using the original Horrocks equation (Equation 19) The results can be
seen in Table 21
0
2
4
6
8
10
12
14
550 570 590 610 630 650 670 690 710
Emis
sio
n In
ten
sity
(au
) x
10
00
0
Wavelength (nm)
Eu3+
Eu-Lactate
Eu-Gly
Eu-Ala
Eu-Ser
98
Table 21 Luminescence lifetimes and q values for Eu3+
with amino acidslactate
Estimated error on lifetimes = plusmn 10 and on q plusmn 02
The number of bound solvent molecules in the inner hydration sphere of Eu3+
decreases with the addition of amino acidslactate from 9 to approximately 6 This is
consistent with possible fast exchange of water molecules with co-ordinated amino
acids and shows that an average of 3 amino acidslactate ions are co-ordinating to the
metal
2523 Aqueous Phase Lanthanide Studies with Na5DTPA
Emission spectra of Eu(NO3)3 (1 mM) with Na5DTPA (01 M) were recorded in
D2O and H2O with the presence of different amino acidslactate (1 M) at pH 36 in order
to determine whether the amino acids bind to the complexed metal (Figure 217)
Figure 217 Emission spectra of Eu-DTPA in D2O at pD 36 with and without the
presence of amino acidslactate (1 M) excited at 395 nm
0
5
10
15
20
25
550 600 650 700
Emis
sio
n In
ten
sity
(au
) x
10
00
0
Wavelength (nm)
EuDTPA
EuDTPA-Lactate
EuDTPA-Gly
EuDTPA-Ala
EuDTPA-Ser
τ in H2O (ms) τ in D2O (ms) q
Eu3+
011 165 89
Eu Lactate 016 194 60
Eu Gly 016 183 60
Eu Ala 016 187 60
Eu Ser 019 147 48
99
The emission intensity does not change upon the addition of amino acidslactate
to [Eu(DTPA)]2-
in D2O These spectra also do not change shape and there is no
observable shift resembling that of the [Eu(DTPA)]2-
species suggesting that the amino
acids and lactate are not binding to the metal complex
The q values of the Eu3+
ions were calculated from the luminescence lifetimes in
H2O and D2O using the original Horrocks equation (Equation 19) The results can be
seen in Table 22
Table 22 Luminescence lifetimes and q values for [Eu(DTPA)]2-
with amino
acidslactate Estimated error on lifetimes = plusmn 10 and on q plusmn 02
From these kinetic data it is clear that q does not change for [Eu(DTPA)]2-
upon
the addition of amino acidslactate showing that there is no significant interaction with
the Eu3+
ion and they do not bind to the metal ion of the complex This may be due to
steric factors as the DTPA5-
is octadentate and fully complexed to the metal ion leaving
room for only 1-2 solvent molecules to bind to the ion and making it difficult for any
larger species to exchange
2524 Aqueous Phase Actinide Studies with Na5DTPA
In order to determine whether amino acids interacted any more with actinides
than lanthanides the emission spectrum of [Cm(DTPA)]2-
(1 mM) was taken with the
addition of L-alanine (25 mM) at KIT-INE Karlsruhe (Figure 218)
τ in H2O τ in D2O q
Eu DTPA 063 230 23
Eu DTPA Lactate 063 216 22
Eu DTPA Gly 065 203 20
Eu DTPA Ala 065 209 21
Eu DTPA Ser 065 208 21
100
Figure 218 Emission spectrum of [Cm(DTPA)]2-
in H2O with and without L-alanine
(25 mM) at pH 3 by direct excitation at 396 nm The spectra are reported uncorrected
for differences in the incident laser power for clarity
Upon addition of L-alanine there is no change in the emission spectrum - no red
shift or change in emission intensity (quantum yield) compared to complexation of
Cm3+
to DTPA5-
(Figure 26) Moreover the luminescence lifetime is the same as
[Cm(DTPA)]2-
and there is no change in the calculated value of q indicating either no
interaction of the L-alanine with the complex or a very weak interaction such as fast
exchange of the buffer and bound solvent molecules showing that the L-alanine does
not strongly interact with Cm3+
253 Radiolysis Studies on Amino Acid Buffered Systems
2531 Previous Studies at the INL
The TALSPEAK process is known to be relatively resistant to radiation effects
both alpha and gamma radiation when compared to the PUREX and SANEX
processes33
The use of lactic acid buffer has been shown to reduce the degradation of
DTPA by radiolysis34
although the chemistry of the lactic acidlactate ion interaction
with the system is still not clear α radiolysis experiments were carried out at INL by the
Martin group initially on lactic acid and then on an L-alanine system in order to
determine the temperature-dependent rate constants of the reaction of the hydroxyl
radical (middotOH) with the buffers at pH 3 (Figure 219) It is thought that at this pH
oxidising reactions are dominant since dissolved O2 in the solution would remove most
40
45
50
55
60
65
70
75
80
570 580 590 600 610 620 630 640
Emis
sio
n In
ten
sity
(au
) Tho
usa
nd
s
Wavelength (nm)
[Cm(DTPA)]2-
[Cm(DTPA)]2- + Ala
101
of the hydrated electrons (e-(aq)) and middotH radicals caused by radiolysis leaving middotOH
radicals present in solution The rate constants were measured using Linear Accelerator
(LINAC) electron pulse radiolysis
Measurements showed that the reaction rate of the middotOH radical with L-alanine is
slower than with lactic acid suggesting that a modified version of the TALSPEAK
process using amino acids would be more resistant to radiolysis
Figure 219 Graph illustrating the rates of reaction of the middotOH radical with L-
alanine compared to lactic acid and the lactate ion 35
Further studies at the INL were carried out on the L-alanine to measure the
effect of γ-radiation on the separation of Eu3+
from Am3+
These studies were carried
out by varying the γ radiation dose (5 ndash 50 kGy) the pH (2 ndash 3) and the L-alanine
concentration (05 ndash 15 M) The extraction of Ln3+
ions was found not to be affected by
increasing the dose to both phases and the extraction of Am3+
was found to increase
only slightly as the dose was increased (Figure 220) The results show that the effect of
γ-radiation on the separation factors is negligible with increasing dose (Table 23)
32 33 34 3517
18
19
20
21
Alanine (pH 30)
Lactate ion (pH 60)
Lactic acid (pH 10)
ToC k M
-1 s
-1Error
1046 59E7 49E6
306 849E7 421E6
305 832E7 419E6
402 102E8 816E6
Arrhenius OH amp lactate at pH 30
Int ln(A) = 2353 plusmn 115
Ea = 1333 plusmn 289 kJ mol-1
R2 = 0990
ln (
kM
-1 s
-1)
103Temp (K)
102
Figure 220 Distribution ratios for Ln3+
and Am3+
in the presence of L-alanine
at 05 M pH 2 at different doses of γ-radiation36
Table 23 Separation factors for Eu3+
Am3+
in the presence of L-alanine at 05 M under
TALSPEAK conditions when subjected to different doses of γ-radiationError Bookmark
not defined
Separation Factor EuAm
5 kGy 10 kGy 50 kGy 100 kGy
pH 2 5620 5519 5132 5103
pH 3 1595 1653 1589 1252
2532 Irradiation Studies using Amino Acid Buffers
The [Eu(DTPA)]2-
systems at pH 36 were irradiated with γ radiation using a
60Co irradiator at the Dalton Cumbrian Facility to determine the effect of radiation on a
range of amino acid buffers
103
Figure 221 Emission spectra of Eu3+
in D2O at pD 36 with and without the presence
of amino acidslactate excited at 395 nm before 5 kGy γ-irradiation
Figure 222 Emission spectra of Eu3+
in D2O at pD 36 with and without the presence
of amino acidslactate excited at 395 nm after 5 kGy γ-irradiation
The emission intensity of the irradiated samples (Figure 222) was lower than
before irradiation (Figure 221) which is likely to be due to quenching effects from
radicals produced by degradation of the solvent However the spectral profiles remain
0
50
100
150
200
250
550 600 650 700
Emis
sio
n In
ten
sity
(au
) Th
ou
san
ds
Wavelength (nm)
EuDTPA
EuDTPA-Lactate
EuDTPA-Gly
EuDTPA-Ala
EuDTPA-Ser
0
20
40
60
80
100
120
140
550 600 650 700
Emis
sio
n In
ten
sity
(au
) Th
ou
san
ds
Wavelength (nm)
EuDTPA
EuDTPA-Lactate
EuDTPA-Gly
EuDTPA-Ala
EuDTPA-Ser
104
the same and still resemble that of [Eu(DTPA)]2-
and t-tests showed that there was no
significant difference between the spectra of each of the buffers
The luminescence lifetimes were also measured for samples before and after
irradiation and before and after extraction into an organic phase (02 M HDEHP in
dodecane) (Table 24)
Table 24 Luminescence lifetimes for aqueous and organic phases for
[Eu(DTPA)]2-
systems before and after irradiation at pH 36 Estimated error on
lifetimes = plusmn 10
Table 25 Luminescence lifetimes and q values for [Eu(DTPA)]2-
systems before and
after irradiation at pH 36 Estimated error on lifetimes = plusmn 10 and on q = plusmn 02
τ of aqueous
phase
before
irradiation
(ms)
τ of aqueous
phase
after
irradiation
(ms)
τ of
organic
phase
before
irradiation
(ms)
τ of
organic
phase
after
irradiation
(ms)
Eu DTPA 063 066 222 262
Eu DTPA Lactate 063 063 241 251
Eu DTPA Gly 065 064 247 249
Eu DTPA Ala 065 065 211 238
Eu DTPA Ser 065 062 260 251
τ of
aqueous
phase
before
irr [H2O]
(ms)
τ of
aqueous
phase
after
irr[H2O]
(ms)
τ of
aqueous
phase
before irr
[D2O] (ms)
τ of
aqueous
phase
after irr
[D2O] (ms)
q
before
irr
q after
irr
Eu DTPA 063 066 230 227 11 10
Eu DTPA
Lactate
063 063 216 210 10 10
Eu DTPA
Gly
065 064 203 208 10 10
Eu DTPA
Ala
065 065 209 211 10 10
Eu DTPA
Ser
065 062 208 206 10 10
105
There was negligible change in luminescence lifetime before and after
irradiation for both aqueous and organic sample sets There was also no change in
hydration number q before and after irradiation of the aqueous phase (Table 25)
These data along with the consistent profiles of the emission spectra is analogous with
the radiolysis data from the INL and shows that the amino acid buffers glycine alanine
and serine are relatively resistant to -radiolysis
254 Buffer Interaction Summary
The potential of using amino acids as a combined buffer and soft donor was
initially investigated by considering the interaction of the buffers glycine L-alanine L-
serine L-phenylalanine and lactate (for comparison) with Eu3+
and [Eu(DTPA)]2-
systems It was found by 1H NMR and luminescence spectroscopies that amino acids
and lactate do not form stable complexes with either the free metal ion or the metal-
DTPA complex and that the buffers may be in fast exchange with surrounding solvent
molecules Luminescence studies on L-phenylalanine showed that this amino acid does
not bind to the metal ion as there was no sensitised emission from Tb3+
ion when
excited into the phenyl chromophore of the amino acid when the two components were
in solution Emission spectra of Eu3+
and Cm3+
aqua ions and their corresponding
DTPA complexes showed no change (no peak splitting or shifting) upon the addition of
amino acidslactate
The number of water molecules in the inner hydration sphere (q) of Eu3+
was
reduced from 9 to ~6 when buffers were added to the aqua ion in solution suggesting
that the amino acids are interacting with the metal ion but are likely to be in fast
exchange with surrounding solvent molecules There was no change in q when buffers
were added to metal-DTPA complexes in solution for Eu3+
or Cm3+
Radiolysis studies were carried out on lactate and amino acid buffered
[Eu(DTPA)]2-
systems and it was found that the systems are relatively resistant to γ-
radiation when exposed to 5 kGy This is consistent with previous work conducted by
the INL showing that separation systems using L-alanine as a buffer are more resistant
to radiolysis than the original TALSPEAK process using lactate
106
1 G Muumlhlbachovaacute Rostlinnaaacute Vyacuteroba 2002 48 12 536ndash542
2 JSF Swaran and V Pachauri Int J Environ Res Public Health 2010 7 7 2745-
2788
3 M Regueiro-Figueroa and C Platas-Iglesias J Phys Chem A 2015 119 6436-
6445
4 N Mignet Q de Chermont T Randrianarivelo J Seguin C Richard M Bessodes
and D Scherman Eur Biophys J 2006 35 155-161
5 CL Davies and A-K Duhme-Klair Tetrahedron Lett 2011 52 4515-4517
6 G Moreau L Burai L Helm J Purans and AE Merbach J Phys Chem A 2003
107 758-769
7 KA Deal IA Davis S Mirzadeh SJ Kennel and MW Brechbiel J Med Chem
1999 42 15 2988ndash2992
8 S Beacutenazeth J Purans M-C Chalbot MK Nguyen-van-Duong L Nicolas K
Keller amp A Gaudemer Inorg Chem 1998 37 3667-3674
9 A Delle Site RD Baybarz J Inorg Nucl Chem 1969 31 2201
10 IA Lebedev VT Filimonov AB Shalinets GN Yakovlev Sov Radiochem
1968 10 94
11 I Bayat KFK
Berichte-1291 Karlsruhe Germany 1970
12 P Thakur JL Conca CJ Dodge AJ Francis GR Choppin Radiochim Acta
2013 101 221
13 G Tian LR Martin and LRao Inorg Chem 2015 54 1232-1239
14 S Leguay T Vercouter S Topin J Aupais D Guillaumont M Miguirditchian P
Moisy and C Le Naour Inorg Chem 2012 51 12638-12649
15 M Nazarov and D Young Noh New Generation of Europium and Terbium
Activated Phosphors 2011 247
16 K N Shinde S J Dhoble H C Swart and K Park Phosphate Phosphors for Solid
State Lighting Springer Series in Materials Science Springer 2012 174 41-59
17 K S Wong T Sun X-L Liu J Pei and W Huang Thin Solid Films 2002 417 85-
89
18 WD Horrocks and DR Sudnick J Am Chem Soc 1979 101 334
19 A Beeby IM Clarkson RS Dickins S Faulkner D Parker L Royle AS de
Sousa JAG Williams and M Woods J Chem Soc Perkin Trans 2 1999 493-504
20 RM Supkowski and WD Horrocks Inorg Chim Acta 2002 340 44-48
107
21 CF Geraldes AD Sherry WP Cacheris KT Kuan RD 3rd Brown SH
Koenig and M Spiller Magn Reson Med 1988 8 2 191-9
22 E Csajboacutek I Baacutenyai and E Bruumlcher Dalton Trans 2004 14 2152-2156
23 JJ Howland and M Calvin J Chem Phys 1950 83 239
24 J E Sansonetti and W C Martin Handbook of Basic Atomic Spectroscopic Data
httpphysicsnistgovPhysRefDataHandbookTables National Institute of Science
and Technology USA 2005
25 T Kimura and G R Choppin J Alloys Compounds 1994 213 313
26 T Kimura Y Kato H Takeishi and G R Choppin J Alloys Compounds 1998
271273 719
27 T L Griffiths Investigations of Ternary Complexes Relevant to the Nuclear Fuel
Cycle 2011 The University of Manchester PhD Thesis
28 G Tian LR Martin and L Rao Inorg Chem 2010 49 10598-10605
29 K L Nash D Brigham T C Shehee and A Martin Dalton Trans 2012 41
14547-14556
30 CJ Leggett G Liu and MP Jensen Solv Extraction and Ion Exchange 2010 28
313-334
31 A Miličević and N Raos Acta Chim Slov 2014 61 904-908
32 VV Nikonorov J Anal Chem 2010 65 4 359-365
33 D Magnusson B Christiansen R Malmbeck and JP Glatz Radiochim Acta 2009
97 9 497-502
34 B Weaver and T A Kappelmann Talspeak A new method of separating americium
and curium from the lanthanides by extraction from an aqueous solution of an
aminopolyacetic acid complex with a monoacidic organophosphate or phosphonate
Oak Ridge National Laboratory 1964 1-60
35 LR Martin S P Mezyk and BJ Mincher J Phys Chem A 2009 113 141-145
36 Dr Leigh Martin Idaho National Laboratory unpublished results
108
3 SOLVENT EXTRACTION AND OPTIMISATION STUDIES WITH AMINO
ACID BUFFERS
As discussed in Chapter 2 the potential of using amino acids as a combined
buffer and soft donor to replace the lactate buffer and holdback reagent DTPA
(diethylenetriaminepentaacetic acid) in the TALSPEAK process (Trivalent Actinide
Lanthanide Separation by Phosphorus reagent Extraction from Aqueous Complexation)
was investigated Initial complexation studies by 1H NMR and luminescence
spectroscopies showed that amino acids do not form stable complexes with actinide or
lanthanide ions or AnLn-DTPA complexes in aqueous solution and that like lactate
they are in fast exchange with surrounding water molecules Separation studies were
carried out by our collaborators at the Idaho National Lab (Travis Grimes Richard
Tillotson and Leigh Martin) to determine whether amino acids could be used as buffers
or as combined bufferssoft-donors to facilitate Ln3+
MA3+
separation A summary of
this work can be found below in Section 31 Their initial studies were used as the basis
for the work conducted as part of this research project (Sections 32 and 33)
31 Previous work at the INL1
311 L-alanine Studies
3111 pH Studies on L-alanine
L-alanine was initially chosen as a potential replacement for lactic acid as a
buffer as the two molecules differ only by the α-group (α-amino on L-alanine compared
to α-hydroxy group on lactic acid) The pKa values of the compounds are 24-26 for L-
alanine and 36-38 for lactic acid depending on the background electrolyte Studies
carried out on the L-alanine found that the separation factors were in fact reduced
compared to the traditional TALSPEAK method when L-alanine was used as a buffer at
pH 2 and pH 3 in place of lactic acid The separation factors were generally lower as the
distribution ratios for Am3+
(DAm) were significantly increased (2 orders of magnitude
higher) when L-alanine was used at pH 3 (DAm 012) and pH 2 (DAm 038-047)
compared to lactic acid at pH 3 (DAm 0009) However the studies carried out at pH 2
resembled a typical TALSPEAK curve and gave overall the best separation of
lanthanides over Am3+
as can be seen in Figure 31 Although separation occurs in the
L-alanine system at pH 3 the separation is better at pH 2 At pH 3 it can be seen that
separation is decreased for the heavier lanthanides This is due to slow phase-transfer
kinetics previously reported by Weaver and Kappelmann2 and Kolarik
3 A pH 1 system
109
does not allow separation of the earlier lanthanides from americium The distribution
ratios for lanthanides in a typical TALSPEAK system can be seen in Figure 32 for
comparison
086 088 09 092 094 096 098 1
10-2
10-1
100
101
102
5x10²
086 088 09 092 094 096 098 1
10-2
10-1
100
101
102
5x10²
pH 1
pH 2
pH 3
Am pH 1
Am pH 2
Am pH 3
[Alanine] = 05 M
[DTPA] = 0050 M
[HDEHP] = 02 M
Organic Diluent
Dodecane
DM
1r Aring
DM
15 M Alanine
10 M Alanine
05 M Alanine
Am 15 M Alanine
Am 10 M Alanine
Am 05 M Alanine
[DTPA] = 0050 M
[HDEHP] = 02 M
Organic Diluent
Dodecane
pH 2
1r Aring
Figure 31 The effect of pH on an L-alanine-buffered TALSPEAK system
Figure 32 Distribution ratios of Ln3+
Y3+
in a TALSPEAK system 1 mM LnY3+
1 M
lactate 005 M DTPA pH 7 extracted using 05 M HDEHP in 14-DIPB4
110
3112 Concentration Effects
The effect of the concentration of L-alanine was also considered and it was
found that the effect on the trend of separation factors across the lanthanide series was
the same as for lactate and the changes were negligible as can be seen from Figure 33
Slower extraction rates were observed for the heaviest lanthanides at lower buffer
concentrations (05 M than 10 or 15 M) for both L-alanine and lactic acid Since it was
found that there was no benefit to changing the L-alanine buffer concentration further
studies were carried out to investigate the potential of using the amino acid to carry out
the process at the lower pH of 2 as although the separation factors are lower than in
lactic acid buffered systems the values are still high enough to give sufficient
separation (see Table 31)
086 088 09 092 094 096 098 1
10-2
10-1
100
101
102
5x10²
086 088 09 092 094 096 098 1
10-2
10-1
100
101
102
5x10²
pH 1
pH 2
pH 3
Am pH 1
Am pH 2
Am pH 3
[Alanine] = 05 M
[DTPA] = 0050 M
[HDEHP] = 02 M
Organic Diluent
Dodecane
DM
1r Aring
DM
15 M Alanine
10 M Alanine
05 M Alanine
Am 15 M Alanine
Am 10 M Alanine
Am 05 M Alanine
[DTPA] = 0050 M
[HDEHP] = 02 M
Organic Diluent
Dodecane
pH 2
1r Aring
Figure 33 The effect of buffer concentration on an L-alanine-buffered TALSPEAK
system
111
Table 31 Distribution ratios and separation factors for a number of L-alanine buffered
TALSPEAK systems as pH and buffer concentration are varied compared to a
traditional lactic acid system
Conc pH DAm Separation Factors (SF)
(M) LaAm CeAm NdAm EuAm
L-Alanine 15 2 038 plusmn 001 165 plusmn 5 61 plusmn 1 28 plusmn 1 64 plusmn 1
L-Alanine 10 2 039 plusmn 002 176 plusmn 10 54 plusmn 3 24 plusmn 1 55 plusmn 3
L-Alanine 05 2 047 plusmn 006 165 plusmn 24 64 plusmn 3 28 plusmn 8 66 plusmn 8
L-Alanine 05 3 012 plusmn 001 147 plusmn 17 45 plusmn 5 9 plusmn 1 25 plusmn 3
Lactic
Acid
10 3 0009 380 140 mdash 91
3113 Studies at pH 2
Further investigations at pH 2 into the potential of using amino acids as a
combined buffer and soft donor showed that no separation occurs when DTPA is not
present indicating that amino acids do not act as holdback reagents in their own right
Previous work by Tanner and Choppin5 showed that at low pH the glycine zwitterion
forms inner-sphere monodentate complexes with M3+
ions including Ln3+
and An3+
Aziz et al67
later showed the same is true for L-alanine with Eu3+
and Am3+
at pH 36
whereby weak monodentate complexes form Krishnan and Plane8 showed that glycine
complexes metal ions solely through the COO- group on the amino acid No co-
ordination through the amino group has been reported
312 Other Amino Acids
Other amino acids L-arginine L-histidine and L-methionine were also
considered and further investigations were carried out (Figure 34) These three amino
acids are larger and more hydrophobic than L-alanine and are therefore less soluble at
higher concentrations (lt05 M) at pH values greater than pH 1 Again no separation
was observed when the amino acids were used without DTPA With Na5DTPA it was
found that the DAm values for Arg and Met were lower than those for L-alanine leading
to an increase in separation factor possibly due to co-ordination of the Am3+
ion with
soft donor atoms on the amino acids (Table 32) The DAm in the His system however
was similar to the Ala system suggesting that there is no coordination of the metal ion
112
with the α-amine or imidazole groups It is not known if the amino acids are co-
ordinating or chelating through soft donor atoms to the metal ion Further studies are
currently being carried out at the INL to determine stability constants and to use time-
resolved fluorescence to probe inner co-ordination sphere changes in order to
investigate the interactions of amino acids with the trivalent metal ions
Figure 34 Chemical structures of L-arginine (top) L-histidine (bottom left)
and L-methionine (bottom right)
Table 32 Distribution ratios and separation factors for a number of amino acid
buffered TALSPEAK systems
When extended further studies on these amino acids found that the kinetic
issues which affected separation of the heavier lanthanides using L-alanine at pH 3
(Figure 31) were also affecting separation with L-arginine at pH 2 as well as pH 3
Conc pH pKa DAm3+ Separation Factors (SF)
(M) LaAm CeAm NdAm EuAm
L- Arg 05 2 182 027 plusmn 001 184 plusmn 26 40 plusmn 3 27 plusmn 2 72 plusmn 4
L- His 05 2 180 040 plusmn 001 208 plusmn 8 95 plusmn 3 24 plusmn 5 83 plusmn 1
L-Met 05 2 213 017 plusmn 001 271 plusmn 18 97 plusmn 3 26 plusmn 1 60 plusmn 3
113
suggesting that longer chain amino acids may not suitable replacements for lactate
Based on these data the most promising replacement buffer is L-alanine at pH 2
32 L-alanine System Optimisation at pH 2
Following from the initial work carried out by Grimes et al at the INL further
studies were begun for this research project The speciation of DTPA was modelled
using HySS (Hyperquad Simulation and Speciation) software using literature pKa
values (Figure 35)9 At pH 1 the dominant DTPA species present in solution are
H7DTPA2+
and H6DTPA+ which both repel MA
3+ and Ln
3+ ions and so the species are
ineffective as holdback reagents At pH 2 the dominant species are H5DTPA (65 )
H4DTPA- (24 ) and H3DTPA
2- (11 ) The species with the greatest electrostatic
attraction under these conditions is to MA3+
Ln3+
ions is H3DTPA2-
At pH 3 a much
higher proportion of this species is present (87 ) than at pH 2 making pH 2 less
favourable for effective separation However the conditions can be optimised in order
to maximise separation by changing the concentrations of extractant and holdback
reagent For industrial purposes conducting the process at a lower pH is preferable as it
is easier for process operators to control higher acid concentrations Optimisation
studies using L-alanine as a buffer at pH 2 were carried out during a placement at the
INL
114
Figure 35 DTPA speciation as a function of pH modelled using HySS sofware using
literature pKa values
321 [Na5DTPA] Dependence
The concentration of Na5DTPA used in traditional TALSPEAK systems is 005
M Initial optimisation studies were carried out using a [Na5DTPA] range of 006 M to
010 M in increments of 001 M The L-alanine concentration was 05 M
115
Figure 36 [Na5DTPA] dependence of L-alanine system (05 M) at pH 2
Experiments were carried out using traditional TALSPEAK methods at pH 2
The extractant was HDEHP (02 M) in dodecane Separations were conducted to
measure the separation of Eu3+
over Am3+
A graph of log[DTPA] vs logDEuAm can be
seen in Figure 36 The slope of the line for Am3+
is approximately -1 indicating that
the metal ions are each bound to 1 DTPA5-
molecule The R2 value is close to 1 and the
errors are small The slope of the line for Eu3+
is also approximately -1 Separation
factors for the data were between 66 and 80 and the DAm were between 026 and 042
which are still 2 orders of magnitude higher than that for a traditional TALSPEAK
system (DAm = 0009) The Na5DTPA concentration was therefore increased further in
order to bring the DAm lower to prevent as much Am3+
being partitioned into the organic
phase
y = -09383x - 15277 Rsup2 = 09854
y = -11258x + 01381 Rsup2 = 09289
-10
-05
00
05
10
15
20
-125 -12 -115 -11 -105 -1 -095
log
DEu
Am
log [Na5DTPA]
Am Extraction
Eu Extraction
116
Figure 37 Eu3+
Am3+
separation for [Na5DTPA] dependence of L-alanine system (05
M) at pH 2
Experiments were carried out as before but using Na5DTPA concentrations of
02 M 03 M 04 M and 05 M A graph of log[DTPA] vs logDEuAm was plotted
(Figure 37) At 05 M [Na5DTPA] H5DTPA began to precipitate out due to the low pH
used and so data for this concentration is unreliable and was not plotted on the graph
The data is good as the R2 values are close to 1 and the errors are small However the
slope is not exactly -1 (slope = -080 for Eu and -085 for Am) this is likely to be due to
competition and activity effects from the increased [Na5DTPA] and therefore increased
Na+ concentration Separation factors for the data were around the same (between 65
and 72) but the DAm values decreased to 008 for the 04 M Na5DTPA meaning much
less Am3+
is being partitioned into the organic phase
322 [HDEHP] Dependence
Experiments were carried out as for the [Na5DTPA] dependence but using
HDEHP extractant concentrations of 04 M 06 M 08 M and 10 M in dodecane for
each of the Na5DTPA concentrations 02 M 03 M and 04 M Graphs of log[DTPA] vs
logDEuAm were plotted (Figures 38-310)
y = -08451x - 14757 Rsup2 = 09936
y = -07958x + 03998 Rsup2 = 0998
-15
-10
-05
00
05
10
15
-11 -1 -09 -08 -07 -06 -05 -04 -03
log
DEu
Am
log [Na5DTPA]
Am Extraction Eu Extraction
117
Figure 38 Eu3+
Am3+
separation for [HDEHP] dependence of L-alanine system (05
M) at pH 2 using 02 M Na5DTPA
Figure 39 Eu3+
Am3+
separation for [HDEHP] dependence of L-alanine system (05
M) at pH 2 using 03 M Na5DTPA
y = 13522x + 02972 Rsup2 = 09283
y = 09682x + 19794 Rsup2 = 09561
-05
00
05
10
15
20
25
-05 -04 -03 -02 -01 0 01
log
DEu
Am
log [HDEHP]
Am Extraction
Eu Extraction
y = 14702x + 00193 Rsup2 = 09981
y = 11892x + 17129 Rsup2 = 09713
-10
-05
00
05
10
15
20
-05 -04 -03 -02 -01 0 01
log
DEu
Am
log [HDEHP]
Am Extraction
Eu Extraction
118
Figure 310 Eu3+
Am3+
separation for [HDEHP] dependence of L-alanine system (05
M) at pH 2 using 04 M Na5DTPA
The R2 values for these data are close to 1 and the errors are generally small
making the data good quality The slope of each data set should be +3 indicating that
the metal ions are each bound to 3 HDEHP molecules in the organic phase1011
However the slopes are not quite +3 this is likely to be due to activity effects and
competition from the increased Na+ concentration as a result of increasing the
Na5DTPA concentration
323 L-alanine Optimisation Summary
The results of the optimisation of a TALSPEAK system using 05 M L-alanine
as a buffer are summarised in Tables 33 and 34
Table 33 Separation factors for L-alanine optimisation studies
[HDEHP] (M)
[Na5DTPA]
(M)
02 04 06 08 10
02 72 plusmn 3 70 plusmn 6 43 plusmn 6 61 plusmn 9 49 plusmn 2
03 70 plusmn 1 62 plusmn 7 59 plusmn 9 56 plusmn 5 46 plusmn 8
04 71 plusmn 5 60 plusmn 4 74 plusmn 4 70 plusmn 7 67 plusmn 1
y = 11522x - 00047 Rsup2 = 09867
y = 12575x + 18424 Rsup2 = 09976
-10
-05
00
05
10
15
20
25
-05 -04 -03 -02 -01 0 01
log
DEu
Am
log [HDEHP]
Am Extraction
Eu Extraction
119
Table 34 DAm values for L-alanine optimisation studies Error plusmn 001
[HDEHP] (M)
[Na5DTPA]
(M)
02 04 06 08 10
02 012 053 121 126 203
03 010 027 050 077 102
04 008 036 051 077 102
Table 33 shows the separation factors are generally similar for each condition
and there is no particular set of conditions that gives the highest value although the
better separation factors tend to be achieved at the lower extractant concentrations The
DAm values (Table 34) are best at the lowest extractant concentrations and highest
holdback concentration as would be expected The best set of conditions is 04 M
Na5DTPA and 02 M HDEHP with the best DAm achievable being 008 and best SF 71 plusmn
5 Despite optimisation the L-alanine system is still not as efficient as the traditional
lactate system as the distribution of Am3+
is one order of magnitude higher and the
separation is lower however the L-alanine system allows the separation to be carried
out at a lower pH which is beneficial for an industrial process
33 Other Amino Acid Studies
331 Initial Tests with Other Amino Acids
Several initial tests were carried out using other amino acids as buffers It had
been found previously that L-arginine at pH 2 gave poor separation of the heavier
lanthanides (Section 312) so further studies were carried out using 05 M L-methionine
and L-histidine to see how effective these amino acids could be as potential buffers
Results from initial tests using TALSEPAK conditions at varied pH values can be seen
in Table 35
120
Table 35 Separation factors and DAmEu values for traditional TALSPEAK systems
with different buffers at varying pH values
From Table 35 it can be seen that L-histidine gives good separation data at pH
3 The DAm of 007 is comparable to the optimised L-alanine system in Section 32 and
the separation factor is high at 99 comparable to the original lactate TALSPEAK
system Further investigations were subsequently carried out in order to determine if the
same kinetic issues arise with L-histidine as with L-arginine and L-alanine L-
methionine was not investigated further as the separation data at pH 2 was not very
promising and it is insoluble at 05 M at pH 3
332 Studies with L-Histidine
The distribution ratios of La-Ho were determined by ICP-MS for a 05 M L-
histidine system at pH 2 and pH 3 (Figure 311)
Buffer pH DAm
DEu
SF
Lactic Acid 3 0009 0819 91
L-Methionine 1 547 6017 11
2 018 1016 57
L-Histidine 1 468 9579 20
2 053 4463 84
3 007 660 99
121
Figure 311 Distribution ratios of La3+
-Ho3+
and Am3+
with 05 M L-histidine buffer at
pH 2 and pH 3
The distribution ratios for the L-histidine system at pH 2 generally resemble
those on a traditional TALSPEAK curve at pH 3 with the D values decreasing towards
neodymium and then increasing with the later lanthanides However the pH 3 L-
histidine system exhibits decreasing D values with the heavier lanthanide elements
demonstrating the same kinetic problems as the L-alanine and L-arginine systems at
higher pH
34 Summary of Separations with Amino Acid Buffers
Previous work carried out at the Idaho National Laboratory by Grimes showed
that amino acids do not act as holdback reagents in their own right and no separation of
Ln3+
Am3+
is achieved when they are used without Na5DTPA in solution However
investigations showed that when used alongside Na5DTPA good separation can be
attained when using 05 M L-alanine at pH 2 pH 2 is less favourable than pH 3 for
separations using DTPA as more protonated forms of the molecule are present in
solution and the holdback reagent is not able to bind as strongly to metal ions However
optimisation of the system in order to maximise the separation whilst keeping Am3+
partitioning to a minimum by changing the concentrations of holdback reagent and
extractant proved to be successful The best conditions were found to be 04 M
Na5DTPA and 02 M HDEHP giving a separation factor of 71 plusmn 5 with a DAm value of
008 Although this separation is not as good as a traditional lactate TALSPEAK
001
01
1
10
56 57 58 59 60 61 62 63 64 65 66 67 68
Dis
trib
uti
on
Rat
io
Atomic Number
His pH 2
His pH 3
Am pH 2
Am pH 3
122
system the use of L-alanine as a buffer allows the process to be carried out at pH 2
which is a much more preferable pH for industry
When investigations were carried out using other amino acids at varying pH
values it was found that L-methionine was too poorly soluble at pH 3 and did not give
very good separation data at pH 2 L-arginine was found to have kinetic issues at pH 2
and 3 giving poor separation of the heavier lanthanides However L-histidine gave
good separation data at pH 3 with a SFEuAm of 99 comparable to that of the original
TALSPEAK process and a DAm of 007 comparable to the optimised alanine system
Studies of the lanthanides La-Ho using L-histidine at pH 3 however showed that the
same kinetic problems arise as for L-arginine and L-alanine as the DLn decreases for
later lanthanides indicating that L-histidine is no more promising as a buffer than the
other amino acids
123
1 TS Grimes RD Tillotson and LR Martin Solv Extraction and Ion Exchange
2014 32 378-390
2 B Weaver and T A Kappelmann Talspeak A new method of separating americium
and curium from the lanthanides by extraction from an aqueous solution of an
aminopolyacetic acid complex with a monoacidic organophosphate or phosphonate
Oak Ridge National Laboratory 1964 1-60
3 Z Kolarik G Koch and W Kuhn J Inorg Nucl Chem 1974 36 905-909
4 KL Nash Solv Extraction and Ion Exchange 2015 33 1-55
5 S P Tanner and G R Choppin Inorg Chem 1968 7 2046-2048
6 A Aziz and S J Lyle J Inorg Nucl Chem 1971 33 3407-3408
7 A Aziz S J Lyle and J E Newbery J Inorg Nucl Chem 1971 33 1757-1764
8 K Krishnan and R Plane Inorg Chem 1967 6 55-60
9 NJ Bridges LE Roy and CL Klug Computation and Spectroscopic Investigation of
the DTPA Complexes US Department of Energy 2012
10 TS Grimes G Tian L Rao and KL Nash Inorg Chem 2012 51 6299-6307
11 G Lumetta AV Gelis and GF Vandegrift Solv Extraction and Ion Exchange
2010 28 3 287-312
124
4 STUDIES USING L-GLUTATHIONE AS A BUFFER IN A TALSPEAK
SYSTEM
The TALSPEAK process (Trivalent Actinide Lanthanide Separation by
Phosphorus reagent Extraction from Aqueous Complexation) which is currently being
developed in the USA for separation of minor actinides (MA) from lanthanides (Ln)
from nuclear waste uses lactic acid as a buffer (pH 36) and the chelator DTPA
(diethylenetriaminepentaacetic acid) as a holdback reagent to retain Am3+
in an aqueous
phase allowing Ln3+
to be extracted by phosphate extractant HDEHP (di-
(2ethylhexyl)phosphoric acid) into an organic phase Studies have been carried out on
the potential of using amino acids as a combined buffer and soft-donor in order to
simplify the TALSPEAK process (Chapters 2 amp 3) however it was found that amino
acids do not act as holdback reagents in their own right although they have been shown
to allow the pH of the process to be lowered to pH 2 which is more favourable for an
industrial process
Although amino acids have been shown not to act as holdback reagents and are
therefore unable to replace lactic acid and DTPA5-
as a combined buffer and soft donor
based on the data obtained from the individual amino acid studies it was considered
that larger ligands with more soft donors such as short-chain peptides may be more
suitable A range of potential molecules were considered including a selection of simple
peptides including eisenin (pGlu-Gln-Ala-OH) and norophthalmic acid (γ-Glu-Ala-
Gly) (Figure 41) and B vitamins including biotin (B7) and folic acid (B9) (Figure
42)
125
Figure 41 Molecular structures of eisenin (top) and norophthalmic acid
(bottom)
Figure 42 Molecular structures of biotinvitamin B7 (top) and folic acid
vitamin B9 (bottom)
The tripeptide L-glutathione (reduced form) was chosen for further study as it
has a fairly simple structure contains several soft-donor atoms and its amino acid
constituents showed promise for buffer activity It is also relatively cheap and easy to
procure L-glutathione (GSH) consists of a chain comprising three amino acids L-
cysteinemdashL-glutamic acidmdashglycine (Figure 43)
126
Figure 43 Molecular structure of L-glutathione (reduced form)
Glutathione is naturally produced in all cells in the human body It is an
antioxidant with numerous functions most of which are related to the ability of its
sulphur atom to scavenge free radicals or donate electrons GSH regulates cell growth
and division by absorbing oxide radicals present in the cell which would prevent cell
growth repairs DNA by donating electrons removed from DNA strands by free radicals
aiding in DNA synthesis assists in protein synthesis by reacting (sulphur atom) with
undesirable S-S bonds to break them and allow for the correct pairing metabolises
toxins by co-ordinating with them through the S atom making them more water soluble
for excretion and recycles other antioxidants (such as vitamins C and E) by donating
electrons1 As a cysteine-containing tripeptide it is also a provider of the amino acid
cysteine in the body and is involved in amino acid transport in and out of cells
Properties of glutathione which are of particular interest to MA3+
Ln3+
separation
studies are its ability to conjugate to heavy metals (to allow them to be removed from
the body like DTPA23
and its resistance to radiation (due to its ability to scavenge free
radicals) which decreases radiation damage in the body45
but also would be beneficial
for spent nuclear fuel (SNF) reprocessing where free radicals and high levels of
radiation are present
As is the case for lactate6 and amino acid
7 complexes of lanthanides stability
constants of Ln-GSH complexes increase across the lanthanide series from La-Lu as the
Lewis acidity of the metal ions increases Log β values range from 556 for La3+
to 751
for Ho3+
with GSH indicating slightly higher stability of Ln-GSH complexes than of
lactate and amino acid complexes of Ln3+
with log β = 633 for Ln(lactate)3 formation
and values ranging from 582-665 for L-alanine with Ln3+
when Ln = La-Sm (Section
242) Garg et al also reported that the stability of Ln-GSH complexes was found to
decrease as ionic strength increases and that the optimum stability of the complexes was
in solutions within the pH range of 340-348 (77 complex formation)8
127
Solvent extraction experiments were initially performed in order to investigate
the separation ability of GSH with Am3+
and Eu3+
and conditions were then optimised
in order to achieve maximum separation Interaction of the buffer with various
components in solution including lanthanide ions was probed using various techniques
including luminescence spectroscopy which was also used in determining the
susceptibility of the buffer to radiolysis and ICP-MS
41 Solvent Extraction and Separation using GSH
411 [L-Glutathione] and pH Dependence
4111 [GSH] Dependence without Na5DTPA at pH 4
L-glutathione has pKa values of 212 (COOH) 359 (COOH) 875 (NH2) and
965 (SH)9 and so with two pKa values below 4 and optimum stability at pH 34 initial
studies were carried out at pH 4 as it would be expected that the glutathione would
complex to metal ions most effectively around this pH and be more likely to act as a
holdback reagent Although pH 4 is a higher pH than that used currently in the
TALSPEAK process and therefore less desirable if proven to improve the process it
may still have potential if satisfactory separation is achieved
Initial studies using L-glutathione as a buffer without the presence of Na5DTPA
in the system showed that as with amino acids GSH is ineffective as a holdback
reagent on its own as there was no separation observed between Eu3+
and Am3+
Over a
GSH concentration range of 01 M to 05 M the separation factors ranged from 038-
585 plusmn 108 Glutathione is insoluble at concentrations above 05 M at pH 4 at room
temperature
4112 [GSH] and pH Dependence with Na5DTPA
Further experiments were then carried out using GSH as a buffer in the presence
of Na5DTPA in order to see if there was any improvement in the separation with this
buffer over the traditional lactic acid buffer The experiments used 005 M Na5DTPA
and 01-05 M GSH over a pH range of 2-4 under TALSPEAK conditions (02 M
HDEHP in n-dodecane)
128
Figure 44 Eu3+
Am3+
distribution for [GSH] dependence with 005 M Na5DTPA at pH
2 extracted using 02 M HDEHP in dodecane Results were averaged from 3 repeat
tests
Figure 45 Eu3+
Am3+
distribution for [GSH] dependence with 005 M Na5DTPA at pH
3 extracted using 02 M HDEHP in dodecane Results were averaged from 3 repeat
tests
Plots of log[GSH] vs logDEuAm for systems at pH 2 and 3 are displayed in
Figures 44 and 45 The graphs show that increasing the concentration of GSH does not
affect the separation of Eu3+
over Am3+
since the distribution ratios for each remain
-02
0
02
04
06
08
1
12
14
16
18
-11 -09 -07 -05 -03
log
DEu
Am
log [GSH]
Am Extraction
Eu Extraction
-1
-08
-06
-04
-02
0
02
04
06
08
1
12
14
-11 -09 -07 -05 -03
log
DEu
Am
log [GSH]
Am Extraction
Eu Extraction
129
relatively constant At pH 2 the average DAm is 103 and DEu is 3013 giving an
average separation factor of 29 plusmn 8 At pH 3 the extraction of both metals is lower with
DAm averaging at 018 and DEu at 1423 giving an average separation of 79 plusmn 13 Both
data sets for pH2 and pH 3 show a slope of almost zero suggesting that the metal ions
are not bound to any GSH molecules which would be consistent with the L-glutathione
just acting as a buffer These separation factors are lower than for the original
TALSPEAK buffered system using lactate (SF = 91 at pH 36) However at pH 4 the
slopes change on the graph and a difference in separation can be observed as the molar
concentration of GSH is increased
Figure 46 Eu3+
Am3+
distribution for [GSH] dependence with 005 M Na5DTPA at pH
4 Results were averaged from 3 repeat tests
At pH 4 as the concentration of L-glutathione is increased the separation factor
increases (Figure 46) The value DEu initially increases as the GSH concentration is
increased from 01-02 M but then remains constant at ~6 However DAm values
decrease linearly as the buffer concentration is increased from 01-05 M giving rise to
increased partitioning and separation values The results from the extraction
experiments at pH 4 are given in Table 41
-15
-10
-05
00
05
10
-11 -09 -07 -05 -03
log
DEu
Am
log [GSH]
Am Extraction
Eu Extraction
130
Table 41 Eu3+
Am3+
distribution and separation for [GSH] dependence with 005 M
Na5DTPA at pH 4
[GSH] (M) DAm DEu SF
01 073 plusmn 027 100 plusmn 041 14 plusmn 13
02 021 plusmn 011 658 plusmn 054 31 plusmn 14
03 016 plusmn 005 578 plusmn 097 37 plusmn 19
04 007 plusmn 002 590 plusmn 043 82 plusmn 19
05 006 plusmn 001 617 plusmn 097 104 plusmn 33
The results show that the L-glutathione is interacting with the DTPA in some
way at pH 4 to allow the separation to increase as a function of GSH concentration only
in the presence of Na5DTPA up to a SF of 104 at 05 M GSH concentration
comparable to separation achieved in the original lactate buffered TALSPEAK process
Figure 47 GSH speciation as a function of pH modelled using HySS software using
literature pKa values of 212 (COOH) 359 (COOH) 875 (NH2) and 965 (SH)9
131
Figure 48 H2GSH- species dominant in solution at pH 4
The speciation of GSH at pH 4 was modelled using HySS (Hyperquad Simulation and
Speciation) software using literature pKa values (Figure 47) At pH 4 the dominant
GSH species is the H2GSH- species (Figure 48) with both carboxylic acids
deprotonated This suggests that deprotonation of the second COOH group allows the
ligand to interact through the COO- to the metal complex Indeed several studies by
Faulkner et al have shown that molecules containing carboxylate functionalities
readily bind with 7-coordinate lanthanide(III) polyaminocarboxylate complexes in a
bidentate manner here DO3A (DO3A = [4710-tris-carboxymethyl-14710-tetraaza-
cyclododec-1-yl]-acetic acid) (Figure 49) and a similar binding interaction with the
related DTPA actinide(III)lanthanide(III) may be anticipated
Figure 49 A ternary Nd DO3A-pyrazine amine carboxylate complex reported by
Faulkner at al (left) and anticipated bidentate chelation of GSH with Am-DTPA at pH
4 (right)10
132
412 [Na5DTPA] Dependence at pH 4
The highest concentration of buffer (05 M) gave the highest separation factors
in the [GSH] dependence study at pH 4 so this concentration was chosen for the next
study on [Na5DTPA] dependence (Figure 410) Relatively high concentrations of
Na5DTPA were chosen (005-06 M) to make the results comparable to those obtained
in the optimisation of the L-alanine system (Section 32) The graphs plotted for the
[Na5DTPA] dependence were not plotted as log plots as it is not known how the
Na5DTPA and GSH interact and what competition effects may be present so the direct
correlation between the complexant concentration and D values have been plotted to
make interpretation more simple
Figure 410 Eu3+
and Am3+
distribution for [Na5DTPA] dependence with 05 M GSH
buffer at pH 4 curves fitted as polynominal order 2 for both Am3+
and Eu3+
Results
were averaged from 3 repeat tests
y = 19018x2 - 23123x + 72258 Rsup2 = 09937
y = 0442x2 - 03543x + 00659 Rsup2 = 0781
00
00
01
01
02
-20
-10
00
10
20
30
40
50
60
70
-01 26E-15 01 02 03 04 05 06 D
Am
DEu
[Na5DTPA] (M)
Eu extraction
Am extraction
133
Table 42 Eu3+
Am3+
distribution and separation for [Na5DTPA] dependence with 05
M GSH buffer at pH 4
[Na5DTPA] (M) DAm DEu SF
005 00650 plusmn ˂0001 624 plusmn 076 96 plusmn 11
01 00196 plusmn ˂0001 480 plusmn 057 245 plusmn 29
02 00039 plusmn ˂0001 361 plusmn 052 917 plusmn 133
03 00020 plusmn ˂0001 207 plusmn 017 1037 plusmn 85
04 00010 plusmn ˂0001 084 plusmn 008 833 plusmn 80
05 00060 plusmn ˂0001 042 plusmn 005 70 plusmn 9
06 00058 plusmn ˂0001 024 plusmn 005 41 plusmn 7
These data show that as the concentration of Na5DTPA is increased the
separation factor increases dramatically up to 03 M Na5DTPA with a maximum of
1037 85 (Table 42) After this peak there is a rapid decrease in separation as the
concentration of Na5DTPA is increased further up to 06 M The DAm decreases at a
steady rate as [Na5DTPA] is increased from 005 M to 04 M after which the DAm
increases slightly and remains fairly constant The DEu decreases at a slower rate
between 005 M and 02 M complexant decreasing more rapidly from 02 M to 06 M
The SF significantly decreases as the concentration of Na5DTPA is increased from 04
to 05 M Although it is unclear why this is without detailed structural analysis the
stoichiometry of DTPAGSH becomes 11 at 05 M which may alter the interaction
between the two constituents The separation factors achieved here are extremely high
(a factor of 10 higher than the current TALSPEAK system and the optimised alanine
system (Chapter 3)) whilst still maintaining low extraction of Am3+
413 [HDEHP] Dependence at pH 4
The extractant concentration dependence was measured for the systems
containing 05 M buffer and 03 M and 04 M Na5DTPA These Na5DTPA
concentrations were chosen for comparison as the 03 M was found to give the highest
separation factor and 04 M seemed to be the point where the separation began to
decrease The graphs plotted for the [HDEHP] dependence have also been plotted by
direct correlation between the extractant concentration and D values
134
Figure 411 Eu3+
and Am3+
distribution for [HDEHP] dependence with 03 M
Na5DTPA and 05 M GSH buffer at pH 4 curve for Eu3+
fitted as polynominal order 2
linear correlation for Am3+
Results were averaged from 3 repeat tests
Table 43 Eu3+
Am3+
distribution and separation for [HDEHP] dependence with 03 M
Na5DTPA and 05 M GSH buffer at pH 4
[HDEHP] (M) DAm DEu SF
02 00020 plusmn ˂0001 207 plusmn 017 1037 plusmn 85
04 00018 plusmn ˂0001 223 plusmn 003 1238 plusmn 17
06 00022 plusmn ˂0001 239 plusmn 006 1097 plusmn 15
08 00024 plusmn ˂0001 218 plusmn 005 906 plusmn 21
10 00031 plusmn ˂0001 165 plusmn 003 535 plusmn 9
At 03 M Na5DTPA the separation factor increases as the extractant
concentration is increased from 02 to 04 M after which the SF begins to decrease
again (Figure 411) The DAm increases slightly as the HDEHP concentration is
increased but the DEu increases and then decreases like the SF The separation factors
for the lower concentrations of extractant are very high with the optimum separation at
04 M giving a SF of 1238 (Table 43)
y = -30649x2 + 3243x + 15029 Rsup2 = 09467
y = 00013x + 00015 Rsup2 = 08028
0000
0002
0004
0006
0008
0010
0012
0014
00
05
10
15
20
25
30
0 02 04 06 08 1 12
DA
m
DEu
[HDEHP] (M)
Eu extraction
Am extraction
135
Figure 412 Eu3+
and Am3+
distribution for [HDEHP] dependence with 04 M
Na5DTPA and 05 M GSH buffer at pH 4 linear correlation for both Am3+
and Eu3+
Results were averaged from 3 repeat tests
Table 44 Eu3+
Am3+
distribution and separation for [HDEHP] dependence with 04 M
Na5DTPA and 05 M GSH buffer at pH 4
[HDEHP] (M) DAm DEu SF
02 0001 plusmn ˂0001 084 plusmn 008 833 plusmn 80
04 0251 plusmn ˂0001 081 plusmn 003 454 plusmn 30
06 0698 plusmn 0014 077 plusmn 001 110 plusmn 010
08 1026 plusmn 0009 078 plusmn 004 076 plusmn 005
10 1410 plusmn 0022 067 plusmn 003 047 plusmn 003
At 04 M Na5DTPA the separation factor decreases rapidly as the extractant
concentration is increased The DAm increases by a factor of 1000 but the DEu only
decreases slightly making the SF decrease significantly (Figure 412 and Table 44)
This would be consistent with the complexant and buffer interacting at higher
Na5DTPA concentrations as the stoichiometry nears 11 possibly forming an adduct
which no longer successfully holds back Am3+
Further structural studies are needed on
these systems in order to determine the complexation mechanisms in the solution under
these conditions
y = -01882x + 08847 Rsup2 = 08326
y = 17968x - 04007 Rsup2 = 09946
-0500
0000
0500
1000
1500
2000
00
01
02
03
04
05
06
07
08
09
10
0 02 04 06 08 1 12
DA
m
DEu
[HDEHP] (M)
Eu extraction
Am extraction
136
42 Luminescence Studies using GSH with Eu3+
Further studies on the glutathione systems were carried out on lanthanide
systems in order to gain some insight into the co-ordination of the buffer with the ions
with and without Na5DTPA present Control measurements were taken of Eu(NO3)3 in
water with no other reagents Eu(NO3)3 with Na5DTPA with no GSH and Eu(NO3)3
with GSH without Na5DTPA for comparison purposes (Figure 413) All luminescence
spectra were recorded and averaged from 5 repeat measurements
Figure 413 Corrected emission spectra of Eu(NO3)3 (1 mM) Eu(NO3)3 with GSH (05
M) and Eu(NO3)3 with Na5DTPA (005 M) in H2O following excitation at 397 nm
A first set of experiments was then carried out to mimic the separation and
solvent extraction studies performed at the INL (Section 41) At the same concentration
of Eu(NO3)3 the J=2 band of Eu3+
increases in intensity upon the addition of GSH
indicating a change in symmetrycrystal field and a weak but detectable interaction with
GSH (the J=1 and J=4 bands are the same intensity with and without GSH) Upon the
addition of Na5DTPA to the system the crystal field changes and the J=4 band shifts
position slightly indicating that a different species is forming which is consistent with
the formation of [EuDTPA]2-
0
1
2
3
4
5
6
550 600 650 700
Emis
sio
n In
ten
sity
(au
) x
10
00
0
Wavelength (nm)
Eu3+ in H2O
Eu with GSH
Eu with DTPA
137
421 [GSH] and pH Dependence without DTPA at pH 4
4211 Aqueous Phase Studies
Emission spectra of Eu3+
(1 mM Eu(NO3)3) in H2O and D2O were measured at
pHpD 4 as the concentration of [GSH] was varied from 01 M to 05 M The spectra
can be seen in Figures 414 and 415
Figure 414 Emission spectra of Eu(NO3)3 in H2O at pH 4 over a GSH concentration
range of 01 ndash 05 M following excitation at 397 nm
The spectra show an increase in emission intensity of the J=2 band as the GSH
concentration is increased from 01-02 M followed by a decrease at 03 M and a
further increase at 04 and 05 M whereas the opposite trend is observed with the J=4
peak The J=1J=2 peak ratios were determined and a t-test was carried out on them to
determine whether they were significantly different and hence whether the co-ordination
mode of the GSH to the Eu3+
changed as the buffer concentration was increased The
J=1J=2 values ranged from 0364-0718 and were found to be significantly different
The spectra are similar to that recorded for the free ion in solution but the J=1J=2
ratios vary slightly and there are some differences in the fine structure of the emission
bands This indicates that GSH is interacting with Eu3+
under these conditions albeit
weakly and the surrounding water molecules are in fast exchange with the buffer
molecules The solution dynamics were investigated further and the spectra were
recorded in D2O in order to minimise quenching caused by fast exchange of O-H
oscillators and to determine the inner sphere hydration number of Eu3+
in each case (q)
00
01
02
03
04
05
06
07
550 600 650 700
Emis
sio
n In
ten
sity
(au
) x
10
00
0
Wavelength (nm)
01 M GSH
02 M GSH
03 M GSH
04 M GSH
05 M GSH
138
Figure 415 Emission spectra of Eu(NO3)3 in D2O at pH 4 over a GSH concentration
range of 01 ndash 05 M following excitation at 397 nm
In D2O it can be seen that the emission intensity increases as the GSH
concentration is increased from 01-03 M followed by a decrease at 04 M and a slight
increase at 05 M This time the J=1J=2 values ranged from 0324-0748 but were
found not to be significantly different suggesting that the co-ordination mode of the
GSH to the metal ion is not changing as the concentration is increased which would be
expected as the buffer is not forming a stable complex with the ion and is in exchange
with surrounding solvent molecules
The number of water molecules bound to the Eu3+
ion (q) was calculated for
each of the samples using the Horrocks equations (Equations 19 and 110) The results
can be found in Table 45 There is a large range in q between different concentrations
with no clear pattern to the lifetimes or number of bound water molecules other than
generally q tends to increase from around 1 to 5 at the highest concentrations of GSH
This could be explained by the increasing ionic strength decreasing the stability of any
Eu-GSH complex and the solvent molecules are also in fast exchange with the buffer
00
02
04
06
08
10
12
550 600 650 700
Emis
sio
n In
ten
sity
(au
) x
10
00
0
Wavelength (nm)
01 M GSH
02 M GSH
03 M GSH
04 M GSH
05 M GSH
139
Table 45 Luminescence lifetimes and q values for Eu3+
with GSH at pHD 4
Error on lifetimes plusmn 10
[GSH]
(M)
τ D2O (μs) τ H2O (μs) q plusmn 02
01 1487 428 17
02 785 353 16
03 829 440 11
04 1545 161 58
05 1016 168 52
4211 Extraction Studies
Extractions were carried out on the Eu3+
samples containing GSH using 02 M
HDEHP in dodecane for the organic phase The emission spectra of both the aqueous
and organic phases post-extraction can be seen in Figure 416
Figure 416 Emission spectra of aqueous and organic phases after Eu3+
extraction at
pH 4 using a GSH concentration range of 01 ndash 05 M following excitation at 397 nm
The Eu-HDEHP complex formed in the organic phase has different symmetry to
Eu3+
complexes in the aqueous phase as can be seen by the different profile of the
emission spectra of the organic phases The spectra show good extraction of the Eu3+
into the organic phase for all concentrations of GSH with little or no metal ion left in the
aqueous phase The J=1J=2 values ranged from 0794-1214 for the organic phase and
were found not to be significantly different as expected as the buffer is unlikely to
00
01
01
02
02
03
03
550 600 650 700
Emis
sio
n In
ten
sity
(au
) x
10
00
0
Wavelength (nm)
01 M GSH Aq 02 M GSH Aq 03 M GSH Aq 04 M GSH Aq 05 M GSH Aq 01 M GSH Org 02 M GSH Org 03 M GSH Org 04 M GSH Org 05 M GSH Org
140
affect the co-ordination of metal ion in the organic phase as the Eu3+
ion is extracted as
the HDEHP complex seen by the different emission profile in the organic phase
spectrum11
422 [GSH] and pH Dependence with DTPA
4221 Aqueous Phase Studies
Emission spectra of Eu3+
(1 mM Eu(NO3)3) in H2O and D2O with 005 M
Na5DTPA were measured over a pHpD range of 2-4 as the concentration of [GSH] was
varied from 01 M to 05 M The D2O spectra can be seen in Figures 417 to 419 The
H2O spectra closely resemble those recorded in D2O but with lower relative emission
intensites as expected (Appendix 1)
Figure 417 Emission spectra of Eu3+
in D2O at pD 2 with 005 M Na5DTPA over a
GSH concentration range of 01 ndash 05 M following excitation at 397 nm
00
02
04
06
08
10
12
14
16
550 600 650 700
Emis
sio
n In
ten
sity
(au
) x
10
00
0
Wavelength (nm)
01 M GSH
02 M GSH
03 M GSH
04 M GSH
05 M GSH
141
Figure 418 Emission spectra of Eu3+
in D2O at pD 3 with 005 M Na5DTPA over a
GSH concentration range of 01 ndash 05 M following excitation at 397 nm
Figure 419 Emission spectra of Eu3+
in D2O at pD 4 with 005 M Na5DTPA over a
GSH concentration range of 01 ndash 05 M following excitation at 397 nm
It can be seen that in all samples a Eu-DTPA complex has formed The spectra
are all almost identical for each pD and for each buffer concentration with the emission
intensity being slightly higher for pD 3 and 4 with the same concentration of Eu3+
00
02
04
06
08
10
12
14
16
550 600 650 700
Emis
sio
n In
ten
sity
(au
) x
10
00
0
Wavelength (nm)
01 M GSH
02 M GSH
03 M GSH
04 M GSH
05 M GSH
00
02
04
06
08
10
12
14
16
550 600 650 700
Emis
sio
n In
ten
sity
(au
) x
10
00
0
Wavelength (nm)
01 M GSH
02 M GSH
03 M GSH
04 M GSH
05 M GSH
142
Table 46 J=1J=2 peak ratios and t-test results for Eu-DTPA at pD 2-4 over a GSH
concentration range of 01-05 M following excitation at 397 nm
J=1J=2
[GSH] (M)
01 02 03 04 05 st dev t-test
pD 2 0335 0399 0379 0375 0361 0024 No sig diff
pD 3 0440 0433 0451 0439 0419 0012 No sig diff
pD 4 0438 0467 0413 0469 0454 0023 No sig diff
st dev 0060 0034 0036 0048 0047
t-test Sig diff Sig diff Sig diff Sig diff Sig diff
The J=1J=2 peak height ratios were recorded for each emission spectrum and t-
tests were carried out on the peak ratios using the t-test data analysis tool in Microsoft
Excel accounting for the standard deviations between the ratios (Table 46) For each
pH as the concentration of GSH is increased the range in the ratios remains small and
there is no significant difference between the values suggesting that there is no change
in the co-ordination mode of the buffer to the metal ion as the concentration of GSH is
increased However a significant difference was observed between the data sets upon
changing pH as the J=1J=2 ratio increases from pD 2 to pD 4 indicating that the co-
ordination mode of glutathione is different at different pH values This is consistent
with the pKa values of GSH as at pH 2 both of the carboxylate groups will be
protonated with the dominant species present in solution shifting from 5050
H3GSHH2GSH to 5050 H4GSHH3GSH (Figure 47)
The luminescence lifetimes of each sample were recorded in H2O and D2O in
order to determine the q value of the complexes using the modified Horrocks equation
(Equation 110) These results are summarised in Table 47
143
Table 47 Luminescence lifetimes and q values for Eu-DTPA at pH 2-4 over a GSH
concentration range of 01-05 M
[GSH] (M) τ D2O (μs) τ H2O (μs) q plusmn 02
pH 2 01 1699 plusmn 7 607 plusmn 9 10
pH 2 02 1692 plusmn 10 619 plusmn 10 09
pH 2 03 1686 plusmn 9 629 plusmn 9 09
pH 2 04 1636 plusmn 12 607 plusmn 13 09
pH 2 05 1596 plusmn 11 629 plusmn 13 09
pH 3 01 1755 plusmn 14 626 plusmn 7 09
pH 3 02 1737 plusmn 13 626 plusmn 15 09
pH 3 03 1723 plusmn 5 626 plusmn 13 09
pH 3 04 1720 plusmn 14 635 plusmn 17 09
pH 3 05 1677 plusmn 9 641 plusmn 14 09
pH 4 01 1778 plusmn 14 593 plusmn 16 10
pH 4 02 1747 plusmn 13 640 plusmn 15 09
pH 4 03 1679 plusmn 15 669 plusmn 18 08
pH 4 04 1689 plusmn 14 623 plusmn 15 09
pH 4 05 1679 plusmn 13 652 plusmn 19 08
All of the complexes have approximately 1 water molecule in the inner
hydration sphere This is consistent with the formation of a [Eu(DTPA)]2-
complex The
values are only slightly less than 1 (compared to [Eu(DTPA)]2-
itself where q = 11)
and in most cases is not significantly different This indicates that any interaction of
GSH with the Eu3+
centre is very weak and that the buffer may be in fast exchange with
the bound water molecule
4222 Extraction Studies
Extractions were carried out on the samples using 02 M HDEHP in dodecane
for the organic phase in the absence of DTPA The emission spectra of both the aqueous
and organic phases post-extraction can be seen in Figures 420 and 421
144
Figure 420 Emission spectra of aqueous phases after Eu3+
extraction at pH 2-4 over a
GSH concentration range of 01-05 M following excitation at 397 nm
Figure 421 Emission spectra of organic phases after Eu3+
extraction at pH 2-4 over a
GSH concentration range of 01-05 M following excitation at 397 nm
The extraction data show that the best Eu3+
extraction occurs at pH 3 under these
conditions although as seen from the separation data obtained at INL (Section 41) this
is not the best pH for separation of metal ions The J=1J=2 peak height ratios were
recorded for each emission spectrum and t-tests were carried out on the peak ratios
using the t-test data analysis tool in Microsoft Excel accounting for the standard
deviations between the ratios The J=1J=2 peak ratios for the aqueous phases show no
significant difference within the pH 4 data as the GSH concentration is increased and
00
05
10
15
20
25
30
35
40
45
50
550 600 650 700
Emis
sio
n In
ten
sity
(au
) H
un
dre
ds
Wavelength (nm)
01 M GSH pH 4 Aq
03 M GSH pH 4 Aq
05 M GSH pH 4 Aq
05 M GSH pH 3 Aq
05 M GSH pH 2 Aq
00
02
04
06
08
10
12
14
550 600 650 700
Emis
sio
n In
ten
sity
(au
) H
un
dre
ds
Wavelength (nm)
01 M GSH pH 4 Org
03 M GSH pH 4 Org
05 M GSH pH 4 Org
05 M GSH pH 3 Org
05 M GSH pH 2 Org
145
the standard deviation is small (Table 48) however a significant difference is observed
between each of the pH values for the same buffer concentration 05 M which is again
consistent with the co-ordination mode of glutathione changing with pH Interestingly
under these experimental conditions the extraction of Eu3+
as the HDEHPDEHP
organic soluble complexes is not very efficient since the emission intensities are
unusually low This suggests that in the absence of competing Am3+
ions GSH is
interacting relatively strongly with the Eu3+
ion in aqueous solution
Table 48 J=1J=2 peak ratios and t-test results for Eu-DTPA at pH 2-4 as [GSH] is
varied
J=1J=2
[GSH] (M)
01 03 05 st dev t-test
pD 4 0202 0276 0247 0037 No sig diff
pD 3 - - 0100 - -
pD 2 - - 0500 - -
st dev - - 0202
t-test - - Sig diff
423 [Na5DTPA] Dependence at pH 4
4231 Aqueous Phase Studies
The [Na5DTPA] dependence study carried out at the INL was also repeated in
order to gain luminescence data for the experiment The conditions used were pH 4 05
M GSH and [Na5DTPA] concentrations ranging from 005 ndash 06 M The emission
spectra can be seen in Figure 422
146
Figure 422 Emission spectra of Eu(NO3)3 in D2O at pD 4 with 05 M GSH over a
Na5DTPA concentration range of 005 ndash 06 M following excitation at 397 nm
The emission intensity of the complex decreases as the concentration of
Na5DTPA is increased from 005 M to 06 M This is likely to be due to the introduction
of more O-H oscillators and therefore increased quenching as the Na5DTPA stock
solution is aqueous and there is no deuterated alternative available The emission
spectra in water do not show this decrease in intensity (Figure 423)
Figure 423 Emission spectra of Eu(NO3)3 in H2O at pH 4 with 05 M GSH over a
Na5DTPA concentration range of 005 ndash 06 M following excitation at 397 nm
0
5
10
15
20
25
30
35
550 600 650 700
Emis
sio
n In
ten
sity
(au
) x
10
00
0
Wavelength (nm)
005 M DTPA
01 M DTPA
02 M DTPA
03 M DTPA
04 M DTPA
05 M DTPA
06 M DTPA
0
2
4
6
8
10
12
14
16
550 600 650 700
Emis
sio
n In
ten
sity
(au
) x
10
00
0
Wavelength (nm)
005 M DTPA
01 M DTPA
02 M DTPA
03 M DTPA
04 M DTPA
05 M DTPA
06 M DTPA
147
Table 49 J=1J=2 peak ratios and t-test results for Eu-DTPA with 05 M GSH in
D2OH2O at pDpH 4 over a Na5DTPA concentration range of 005-06 M
J=1J=2
[Na5DTPA] (M)
005 01 02 03 04 05 06 stdev t-test
D2O 0437 0441 0431 0437 0428 0425 0403 0013
No sig
diff
H2O 0450 0440 0437 0449 0422 0424 0428 0011
No sig
diff
The J=1J=2 peak height ratios were recorded for each emission spectrum and t-
tests were carried out on the peak ratios using the t-test data analysis tool in Microsoft
Excel accounting for the standard deviations between the ratios The J=1J=2 peak
ratios show no significant difference for either the D2O or H2O samples as the
Na5DTPA concentration is increased (Table 49) suggesting that the co-ordination
mode of the DTPA does not change as the concentration is increased The luminescence
lifetimes of the samples show a decrease across the D2O samples as the concentration of
Na5DTPA increases This is consistent with the decreased emission intensity due to
greater quenching of the samples as more water is introduced However there is a slight
increase across the H2O samples as the holdback concentration increased as quenching
is reduced in these samples due to the chelating effect of the DTPA molecules therefore
the results obtained in water for this study are likely to be most accurate The lifetimes
and q values are tabulated in Table 410 Although the q values are likely to be
unreliable especially for the highest Na5DTPA concentrations it can be seen that there
is still approximately 1 H2O molecule in the inner hydration sphere of the complexes
consistent with [Eu(DTPA)]2-
formation again implying very little or weak binding
with GSH
148
Table 410 Luminescence lifetimes and q values for Eu-DTPA with 05 M GSH at pH
4 over a Na5DTPA concentration range of 005-06 M following excitation at 397 nm
[Na5DTPA]
(M)
τ D2O (μs) τ H2O (μs) q plusmn 02
005 1679 plusmn 3 652 plusmn 2 08
01 1549 plusmn 4 659 plusmn 2 10
02 1348 plusmn 4 666 plusmn 3 09
03 1179 plusmn 4 665 plusmn 3 08
04 1076 plusmn 4 674 plusmn 4 07
05 978 plusmn 4 698 plusmn 4 05
06 916 plusmn 5 714 plusmn 5 03
4232 Extraction Studies
Extractions were carried out on the samples using 02 M HDEHP in dodecane
for the organic phase The emission spectra of both the aqueous and organic phases
post-extraction can be seen in Figure 424
Figure 424 Emission spectra of aqueous and organic phases after Eu3+
extraction with
05 M GSH at pH 4 over a Na5DTPA concentration range of 005-06 M following
excitation at 397 nm
0
1
2
3
4
5
6
7
550 600 650 700
Emis
sio
n In
ten
sity
(au
) H
un
dre
ds
Wavelength (nm)
01 M DTPA Aq
03 M DTPA Aq
05 M DTPA Aq
01 M DTPA Org
03 M DTPA Org
05 M DTPA Org
149
As expected the extraction data show that the best Eu3+
extraction occurs with
01 M Na5DTPA the lowest concentration of holdback reagent and that very little
extraction occurs at 03 M and 05 M Na5DTPA under these conditions The J=1J=2
peak ratios for the aqueous phases show no significant difference as the Na5DTPA
concentration is increased (Table 411) Unfortunately here the extraction is too weak
and the emission intensity too low to obtain reliable J=1J=2 peak ratios for the organic
phase
Table 411 J=1J=2 peak ratios and t-test results for Eu3+
in the aqueous phase with 05
M GSH at pH 4 as [Na5DTPA] is varied after extraction with 02 M HDEHP
Na5DTPA (M) 01 03 05 st dev t-test
J=1J=2 0552 0578 0502 0039 No sig
diff
424 [HDEHP] Dependence at pH 4
An HDEHP concentration dependence study was carried out under the same
conditions as the study at INL 05 M GSH 03 M Na5DTPA pH 4 and an extractant
concentration range of 04-10 M HDEHP in dodecane Equilibration time was for 30
minutes The emission spectra of the phases after extraction can be seen in Figures 425
and 426
150
Figure 425 Emission spectra of aqueous phases after Eu3+
extraction with 05 M GSH
and 03 M Na5DTPA at pH 4 over an HDEHP concentration range of 02-10 M
following excitation at 397 nm
The J=1J=2 peak ratios for the aqueous phases show no significant difference as
the HDEHP concentration is increased (Table 412) as expected since the co-ordination
mode of the aqueous phase should be unaffected by the organic phase Unfortunately
again the extraction is too weak and the emission intensity too low to obtain reliable
J=1J=2 peak ratios for the organic phase
Table 412 J=1J=2 peak ratios and t-test results for Eu3+
in the aqueous phase with 05
M GSH and 03 M Na5DTPA at pH 4 as [HDEHP] is varied after extraction
HDEHP (M) 04 06 08 10 st dev t-test
J=1J=2 0472 0499 0455 0510 0025 No sig
diff
00
02
04
06
08
10
12
550 600 650 700
Emis
sio
n In
ten
sity
(au
) x
10
00
0
Wavelength (nm)
04 M HDEHP Aq
06 M HDEHP Aq
08 M HDEHP Aq
10 M HDEHP Aq
151
Figure 426 Emission spectra of organic phases after Eu3+
extraction with 05 M GSH
and 03 M Na5DTPA at pH 4 over an HDEHP concentration range of 02-10 M
following excitation at 397 nm
The lowest Eu3+
extraction is with 04 M HDEHP with better extraction at
higher HDEHP concentrations Although better extraction is obtained at higher
concentrations Am3+
is also extracted to a higher extent decreasing the separation
factor (Section 413)
43 Radiolysis Studies using GSH at pH 4
431 Aqueous Phase Studies
In order to determine how resistant the glutathione buffered system is to
radiolysis a selection of aqueous samples at pHpD 4 containing 05 M GSH and a
Na5DTPA concentration range of 005-06 M were irradiated at the Dalton Cumbrian
Facility using a 60
Co irradiator The samples were exposed to 7 kGy γ-radiation and
analysed by luminescence spectroscopy The emission spectra of the samples can be
seen in Figure 427
00
00
00
01
01
01
01
550 600 650 700
Emis
sio
n In
ten
sity
(au
) x
10
00
0
Wavelength (nm)
04 M HDEHP Org
06 M HDEHP Org
08 M HDEHP Org
10 M HDEHP Org
152
Figure 427 Emission spectra of Eu(NO3)3 in H2O at pH 4 with 05 M GSH over a
Na5DTPA concentration range of 005 ndash 06 M after irradiation with 7 kGy γ-radiation
following excitation at 397 nm
The spectra of the samples show a lower emission intensity after irradiation
(Figure 427) than beforehand (Figure 423) but the profile remains the same indicating
that the radiation has little or no degrading effect on the complex in the aqueous phase
The decreased intensity is likely to be due to increased quenching effects caused by
residual radicals present as a result of irradiating the solvent The J=1J=2 ratios and co-
ordination mode remained unchanged (Table 413) as did the luminescence lifetimes of
the samples and the q values (Table 414)
00
01
01
02
02
03
03
04
550 600 650 700
Emis
sio
n In
ten
sity
(au
) x
10
00
0
Wavelength (nm)
005 M DTPA
01 M DTPA
02 M DTPA
03 M DTPA
04 M DTPA
05 M DTPA
06 M DTPA
153
Table 413 J=1J=2 peak ratios and t-test results for Eu-DTPA with 05 M GSH in
D2OH2O at pDpH 4 over a Na5DTPA concentration range of 01-06 M after
irradiation with 7 kGy γ-radiation
[Na5DTPA] (M)
01 02 03 04 05 06 st
dev
t-test
J=1J=2 0477 0481 0452 0401 0407 0411 0036
No sig
diff
Table 414 Luminescence lifetimes and q values for Eu-DTPA with 05 M
GSH at pH 4 over a Na5DTPA concentration range of 01-06 M after irradiation with 7
kGy γ-radiation
[Na5DTPA] (M) τ H2O (μs) τ D2O (μs) q plusmn 02
01 648 plusmn 4 1895 plusmn 12 10
02 661 plusmn 6 1678 plusmn 10 09
03 670 plusmn 6 1536 plusmn 11 08
04 679 plusmn 5 1462 plusmn 9 07
05 701 plusmn 7 1328 plusmn 10 05
06 696 plusmn 6 1211 plusmn 8 03
432 Extraction Studies
Extractions were then carried out on a selection of the irradiated samples using
02 M HDEHP in dodecane with Eu3+
The resultant emission spectra of both the
aqueous and organic phases post-extraction can be seen in Figure 428
154
Figure 428 Emission spectra of aqueous and organic phases after Eu3+
extraction from
irradiated aqueous phase at pH 4 containing 05 M GSH over a Na5DTPA concentration
range of 01-06 M
As expected the extraction data show that the best Eu3+
extraction occurs with
01 M Na5DTPA the lowest concentration of holdback reagent and that very little
extraction occurs at 03 M and 05 M Na5DTPA under these conditions With the
exception of the 01 M Na5DTPA sample for which the extraction decreases after
irradiation the emission intensity remains relatively constant for each of the phases of
the samples after irradiation The J=1J=2 ratios and co-ordination mode for the aqueous
phase remained unchanged (Table 415) Again the extraction is too weak and the
emission intensity too low to obtain reliable J=1J=2 peak ratios for the organic phase
Table 415 J=1J=2 peak ratios and t-test results for Eu3+
in the aqueous phase with 05
M GSH and at pH 4 as [Na5DTPA] is varied after extraction with 02 M HDEHP in
dodecane from an aqueous phase irradiated at 7 kGy γ ndashradiation
Na5DTPA (M) 01 03 05 st dev t-test
J=1J=2 0505 0563 0551 0031 No sig diff
44 Luminescence Studies using GSH with Dy3+
As well as obtaining primary extraction data for GSH with Eu3+
under a variety
of conditions it is also important to consider the behaviour and extraction of other Ln3+
ions with the buffer in order to achieve effective lanthanide-actinide separation
0
1
2
3
4
5
6
7
8
9
10
550 600 650 700
Emis
sio
n In
ten
sity
(au
) Hu
nd
red
s
Wavelength (nm)
01 M DTPA Aq
03 M DTPA Aq
05 M DTPA Aq
01 M DTPA Org
03 M DTPA Org
05 M DTPA Org
155
Dysprosium(III) was chosen for a preliminary study as it is later in the lanthanide series
representing the heavier metal ions and how they may behave under such conditions
Also like Eu3+
it is emissive in the visible region of the electromagnetic spectrum and
so may be easily analysed by luminescence spectroscopy
441 Dy3+
Complexation Studies
Initial data were obtained for Dy3+
and emission spectra were recorded for the
free ion from Dy(NO3)3 Dy-DTPA (005 M Na5DTPA) and Dy(NO3)3 with GSH (05
M) all in aqueous solution (Figure 429) A concentration of 005 M Na5DTPA was
chosen for the dysprosium experiments as the emission intensity of Dy3+
is relatively
weak and this technique is not sensitive enough to observe any extraction of the metal
from high Na5DTPA concentrations
Figure 429 Emission spectra of Dy(NO3)3 (10 mM) Dy-DTPA (10 mM Dy(NO3)3
005 M Na5DTPA) and Dy(NO3)3 (10 mM) with GSH (05 M) in H2O following
excitation at 352 nm Note that the tail of ligand emission can be seen in the Dy DTPA
and Dy GSH solutions at shorter wavelengths
The spectra show that the emission intensity of the 7F92 rarr
6H152 and
7F92 rarr
6H132 transitions is slightly higher when GSH buffer is present in solution than for the
free ion alone and the intensity is much greater when Na5DTPA is present in the
solution showing formation of a Dy-DTPA complex Interestingly evidence for
binding of GSH and DTPA with Dy3+
is further manifested in the emission spectra by
the presence of residual ligand emission at higher energy These samples were then
00
02
04
06
08
10
12
14
16
425 475 525 575 625 675
Emis
sio
n In
ten
sity
(au
) x
10
00
0
Wavelength (nm)
Dy H2O
Dy DTPA
Dy GSH
7F92 rarr
6H152
7F92 rarr
6H132
156
extracted into an organic phase of 10 M HDEHP in dodecane (Figure 430) as 02 M
extractant was found to be too low to observe any Dy3+
extraction due to the overall
weak emission of the ion relative to Eu3+
Figure 430 Emission spectra of aqueous and organic phases of Dy(NO3)3 Dy-DTPA
and Dy(NO3)3 with GSH after extraction with 10 M HDEHP following excitation at
352 nm
The spectra show that without Na5DTPA present the Dy3+
is extracted into the
organic phase but for the Dy-DTPA complex little or no metal extraction is observed in
the absence of competitive binding with Am3+
This may indicate that the metal is not
being extracted into the organic phase and that the heavier lanthanides may suffer the
same kinetic issues present for amino acid buffers at higher pH (Section 332) or that
this technique is not sensitive enough to obtain good extraction data for less emissive
lanthanides
442 pH Dependence Studies
To attempt to determine whether kinetic issues arise for heavier lanthanides with
GSH buffer at higher pH values a pH study was carried out on Dy-DTPA systems
containing 005 M Na5DTPA and 05 M GSH over a pH range of 2-4 One sample
containing 03 M Na5DTPA was also measured analogous to the europium data sets
The extraction data can be seen in Figure 431
00
02
04
06
08
10
12
14
425 475 525 575 625 675
Emis
sio
n In
ten
sity
(au
) x
10
00
0
Wavelength (nm)
Dy H2O Aq
Dy DTPA Aq
Dy GSH Aq
Dy H2O Org
Dy DTPA Org
Dy GSH Org
157
Figure 431 Emission spectra of aqueous and organic phases of Dy(NO3)3 Dy-DTPA
and Dy(NO3)3 with GSH after extraction with 10 M HDEHP following 352 nm
excitation
The extraction is lowest for the sample with the highest Na5DTPA
concentration as would be expected As the pH increases the extraction of Dy3+
decreases suggesting that the same kinetic issues may also be present in for the GSH
system Further investigation using a more sensitive technique such as ICP-MS is
necessary to confirm this (Section 46)
45 Luminescence Studies using GSH with Mixed Ln3+
Systems at pH 4
The Dy3+
luminescence work was extended to solutions of a mixture of 4
luminescent lanthanide ions (Sm3+
Eu3+
Tb3+
and Dy3+
) to be able to probe the relative
extraction of different lanthanides from a mixture relevant to a real TALSPEAK type
process The spectra are colour coded to each ionrsquos luminescent colour under UV light
irradiation
451 Complexation Studies
Initial data were obtained for each lanthanide ion and emission spectra were
recorded for Ln(NO3)3 Ln-DTPA (005 M Na5DTPA) and Ln(NO3)3 with GSH (05
M) all in aqueous solution (Figures 432-434) analogous to the Dy3+
data
00
01
02
03
04
05
06
07
08
09
10
550 560 570 580 590
Emis
sio
n In
ten
sity
(au
) x 1
00
00
Wavelength (nm)
pH 2 Aq
pH 3 Aq
pH 4 Aq
pH 4 (03 M DTPA) Aq
pH 2 Org
pH 3 Org
pH 4 Org
pH 4 (03 M DTPA) Org
158
Figure 432 Emission spectra of Ln(NO3)3 (1 mM EuTbSm3+
10 mM Dy3+
) in H2O
at pH 4 following direct excitation (405 nm for Sm3+
397 nm for Eu3+
366 nm for Tb3+
and 352 nm for Dy3+
)
Figure 433 Emission spectra of Ln(NO3)3 (1 mM EuTbSm3+
10 mM Dy3+
) with
GSH (05 M) at pH 4 in H2O following direct excitation (405 nm for Sm3+
397 nm for
Eu3+
366 nm for Tb3+
and 352 nm for Dy3+
)
0
5
10
15
20
25
30
35
40
45
50
450 500 550 600 650 700 750
Emis
sio
n In
ten
sity
(au
) H
un
dre
ds
Wavelength (nm)
Sm
Eu
Tb
Dy
0
2
4
6
8
10
12
14
16
18
20
450 500 550 600 650 700 750
Emis
sio
n In
ten
sity
(au
) Th
ou
san
ds
Wavelength (nm)
Sm
Eu
Tb
Dy
159
Figure 434 Emission spectra of Ln-DTPA (1 mM EuTbSm3+
10 mM Dy3+
005 M
Na5DTPA) in H2O at pH 4 following direct excitation (405 nm for Sm3+
397 nm for
Eu3+
366 nm for Tb3+
and 352 nm for Dy3+
)
For all of the metal ions the emission intensity is greater in the sample with
GSH than for the free ions in solution due to reduced quenching by the presence of the
buffer The profiles of all of the spectra remain the same showing that although the
glutathione may be in exchange with surrounding water molecules a stable complex
between the buffer and metal ions is not being formed The emission intensity is much
greater for each of the metal ions with Na5DTPA due to the formation of a Ln-DTPA
complex in each case and the peak splitting observed for the Eu3+
complex can also be
seen for the Tb3+
complex as the emission spectra of these ions are more sensitive to
their co-ordination environment than Sm3+
or Dy3+
Table 416 Luminescence lifetimes for lanthanide samples at pH 4
Sample Lifetime (μs)
Sm(III) Eu (III) Tb(III) Dy (III)
Ln3+
341 plusmn 1 121 plusmn 25 394 plusmn 19 525 plusmn 1
Ln3+
with
GSH
686 plusmn 1 184 plusmn 8 558 plusmn 28 830 plusmn 1
Ln-DTPA 11 plusmn 1 671 plusmn 4 1930 plusmn 20 14 plusmn 1
0
1
2
3
4
5
6
7
450 500 550 600 650 700 750
Emis
sio
n In
ten
sity
(au
) x
10
00
0
Wavelength (nm)
Sm
Eu
Tb
Dy
160
The luminescence lifetimes of all the metal ions (Table 416) are in the expected
ranges for these ions in aqueous solutions and exhibit the same pattern as the emission
intensities increasing as GSH is added to the metal solutions and being greatest for the
Ln-DTPA complexes The q values were calculated for Eu3+
and Tb3+
as calculations of
q for Sm3+
and Dy3+
are unreliable and were as expected with a hydration number of
around 8 for the M3+
ion in solution co-ordination of around 5 for the M3+
ion with
GSH (consistent with the [GSH] dependence studies in Section 421) and 1 water
molecule bound to the Ln-DTPA complex
Table 417 Luminescence lifetimes and q values for Eu3+
and Tb3+
samples at pH 4
Sample Lifetime (μs) q
Eu (III)
H2O
Eu (III)
D2O
Tb(III)
H2O
Tb (III)
D2O
Eu(III) Tb(III)
Ln3+
121 plusmn 25 2309 plusmn 38 394 plusmn 19 1698 plusmn 16 82 82
Ln3+
with
GSH
184 plusmn 8 1658 plusmn 26 558 plusmn 28 1889 plusmn 12 52 53
Ln-DTPA 671 plusmn 4 2066 plusmn 15 1930 plusmn 20 3546 plusmn 27 09 09
452 pH Dependence Studies
As with the dysprosium study extractions were carried out on the mixed
lanthanide samples under the same conditions The aqueous phases contained 005 M
Na5DTPA and 05 M GSH over a pH range of 2-4 The emission spectra of each
aqueous sample before extraction were also recorded but were found to be the same for
each pH The luminescence lifetimes of the samples were also very similar (Table 418)
consistent with the Eu3+
data (Section 422) The q values for Eu3+
and Tb3+
are as
expected with 1 water molecule bound to each Ln-DTPA complex (Table 419) As a
representative example the spectra for the pH 4 sample can be seen in Figure 435
161
Figure 435 Emission spectra of Ln(NO3)3 (1 mM EuTbSm3+
10 mM Dy3+
) with
GSH (05 M) and Na5DTPA (005 M) following direct excitation (405 nm for Sm3+
397
nm for Eu3+
366 nm for Tb3+
and 352 nm for Dy3+
)
Table 418 Luminescence lifetimes for aqueous phases before extraction over a
pH range of 2-4
Sample Lifetime (μs)
Sm(III) Eu (III) Tb(III) Dy (III)
pH 2 12 plusmn 1 677 plusmn 9 1851 plusmn 21 14 plusmn 1
pH 3 12 plusmn 1 715 plusmn 9 1934 plusmn 21 13 plusmn 1
pH 4 12 plusmn 1 699 plusmn 7 1912 plusmn 26 14 plusmn 1
Table 419 Luminescence lifetimes and q values for Eu3+
and Tb3+
samples before
extraction over a pH range of 2-4
Sample Lifetime (μs) q
Eu (III)
H2O
Eu (III)
D2O
Tb(III)
H2O
Tb (III)
D2O
Eu(III) Tb(III)
pH 2 677 plusmn 9 2897 plusmn 27 1851 plusmn 21 3765 plusmn 31 09 10
pH 3 715 plusmn 9 3011 plusmn 13 1934 plusmn 21 3705 plusmn 22 08 09
pH 4 699 plusmn 7 3032 plusmn 15 1912 plusmn 26 3815 plusmn 16 09 10
00
10
20
30
40
50
60
70
450 500 550 600 650 700 750
Emis
sio
n In
ten
sity
(au
) x
10
00
0
Wavelength (nm)
Sm
Eu
Tb
Dy
162
The spectra for the aqueous and organic phases after extraction with 10 M
HDEHP in dodecane (in order to ensure sufficient enough extraction to be observed by
this technique) are plotted in Figures 436-438
Figure 436 Emission spectra of aqueous and organic phases of Ln3+
with 05 M GSH
and 005 M Na5DTPA after extraction with 10 M HDEHP at pH 2 following direct
excitation (405 nm for Sm3+
397 nm for Eu3+
366 nm for Tb3+
and 352 nm for Dy3+
)
Figure 437 Emission spectra of aqueous and organic phases of Ln3+
with 05 M GSH
and 005 M Na5DTPA after extraction with 10 M HDEHP at pH 3 following direct
excitation (405 nm for Sm3+
397 nm for Eu3+
366 nm for Tb3+
and 352 nm for Dy3+
)
00
05
10
15
20
25
30
450 500 550 600 650 700 750
Emis
sio
n In
ten
sity
(au
) x
10
00
0
Wavelength (nm)
Sm Aq
Eu Aq
Tb Aq
Dy Aq
Sm Org
Eu Org
Tb Org
Dy Org
00
05
10
15
20
25
30
450 500 550 600 650 700 750
Emis
sio
n In
ten
sity
(au
) x
10
00
0
Wavelength (nm)
Sm Aq
Eu Aq
Tb Aq
Dy Aq
Sm Org
Eu Org
Tb Org
Dy Org
163
Figure 438 Emission spectra of aqueous and organic phases of Ln3+
with 05 M GSH
and 005 M Na5DTPA after extraction with 10 M HDEHP at pH 4 following direct
excitation (405 nm for Sm3+
397 nm for Eu3+
366 nm for Tb3+
and 352 nm for Dy3+
)
At all three pH values the order of extractability is Sm gt Eu gt Tb gt Dy
showing that the heavier lanthanides are the most difficult to extract The above data
demonstrate that extraction of Ln3+
is reasonably good at pH 2 and 3 but slightly lower
at pH 3 However at pH 4 extraction of all lanthanide ions is drastically reduced
particularly for Tb3+
and Dy3+
which have very low relative concentrations in the
organic phase Although the extraction of Sm3+
and Eu3+
is also greatly reduced there is
still some extraction of these metals into the organic phase This is consistent with the
previously obtained dysprosium results suggesting that there may be kinetic issues
present for heavier lanthanides at high pH The trend in relative extraction efficiency of
the Ln3+
ions approximately follows the relative stability constants of GSH-Ln
complexes Lighter Ln-GSH complexes are less stable an effect of charge density of the
Ln3+
cations so are extracted more efficiently This was investigated further by ICP-
MS
46 ICP-MS Studies with GSH
In order to determine whether a TALSPEAK type system using glutathione as a
buffer had the same kinetic issues as the amino acid systems whereby poor separation of
the heavier lanthanides was observed ICP-MS was carried out on extracted samples
containing 10 lanthanides (La-Ho with the exception of Pm) at pH 2 3 and 4 to
00
05
10
15
20
25
30
35
450 500 550 600 650 700 750
Emis
sio
n In
ten
sity
(au
) x
10
00
0
Wavelength (nm)
Sm Aq
Eu Aq
Tb Aq
Dy Aq
Sm Org
Eu Org
Tb Org
Dy Org
164
determine the distribution pattern of the series using GSH as a buffer The DLn values
can be seen in Figures 439 and 440 for the pH 2 and pH 3 data sets
Figure 439 DLn for varying GSH concentration at pH 2 with 005 M Na5DTPA after
extraction with 02 M HDEHP in dodecane
Figure 440 DLn for varying GSH concentration at pH 3 with 005 M Na5DTPA after
extraction with 02 M HDEHP in dodecane
0
5
10
15
20
25
30
35
40
56 57 58 59 60 61 62 63 64 65 66 67 68
Dis
trib
uti
on
Rat
io
Atomic Number
01 M GSH
02 M GSH
03 M GSH
04 M GSH
05 M GSH
Am3+
0
5
10
15
20
25
30
35
56 57 58 59 60 61 62 63 64 65 66 67 68
Dis
trib
uti
on
Rat
io
Atomic Number
01 M GSH
02 M GSH
03 M GSH
04 M GSH
05 M GSH
Am3+
165
The data set for pH 2 resembles a typical TALSPEAK curve as also
demonstrated by amino acids at pH 2 (Section 3) However at pH 3 the distribution of
the metal ions continues to decrease across the lanthanide series indicating that higher
pH is less favourable for extraction of the heavier lanthanides This may be explained
by the fact that the stability of Ln-GSH complexes is lower at lower pH values making
the metal ions easier to extract The analysis was also repeated for samples at pH 4 but
for some of the later lanthanides in the series the quantity of metal ion present was
below the limit of detection of the technique (004 ng mL-1
) so the data could not
accurately be plotted Corresponding separation factors can be seen in Table 420 and
plotted in Appendix 2 (for pH 2 and 3) Separation factors for all lanthanides are fairly
low at pH 2 compared to the original TALSPEAK process (SFEuAm = 91) The data also
show that for the earlier lanthanides as the pH is increased very high separation factors
can be achieved but separation is much lower for later lanthanides with increasing pH
This indicates that unfortunately the same kinetic issues are likely to be a problem at
higher pH for the glutathione buffered system as for the amino acid systems
166
Table 420 SFLnAm for varying GSH concentration over a pH range of 2-4 with
005 M Na5DTPA after extraction with 02 M HDEHP in dodecane
pH
[GSH]
(M)
SF
La Ce Pr Nd Sm Eu Gd Tb Dy Ho
2 01 234 171 148 107 136 158 216 222 237 234
2 02 244 176 145 103 134 146 215 229 239 244
2 03 263 183 145 105 137 165 243 244 281 289
2 04 239 170 151 111 145 168 218 237 259 265
2 05 278 197 164 117 162 189 257 269 300 314
3 01 1735 972 477 276 163 104 112 53 41 38
3 02 1953 841 433 256 320 266 290 130 89 77
3 03 1898 785 388 220 152 90 95 39 28 24
3 04 2046 812 412 243 196 121 126 53 38 34
3 05 2145 705 312 139 36 16 20 04 02 00
4 01 3777 141 12 - - - - - - -
4 02 5548 231 36 06 - - - - - -
4 03 2768 239 27 - - - - - - -
4 04 1620 150 21 01 - - - - - -
4 05 1589 286 48 11 - - - - - -
47 1H NMR Studies on GSH Systems
The glutathione systems were additionally studied by 1H NMR spectroscopy in
order to confirm the complexation observed by luminescence spectroscopy Spectra
were recorded in D2O for GSH GSH after irradiation Eu(NO3)3 with GSH (150)
Na5DTPA with GSH (110) and Eu-DTPA with GSH (1550
Eu(NO3)3Na5DTPAGSH) (Figures 441 a-e)
167
GSH0011resp
45 40 35 30 25 20 15 10
Chemical Shift (ppm)
0
005
010
Norm
alized Inte
nsity
197201200100200099
c
d
gb
i
f
44
944
844
6
38
9
37
637
437
2
28
628
628
528
4
24
924
824
724
624
524
4
21
120
920
720
5
GSH Irradiated0011resp
45 40 35 30 25 20 15 10
Chemical Shift (ppm)
0
005
010
015
020
025
Norm
alized Inte
nsity
133151244272014101206498131111059100
m
c
d
n
g
q
b
l
i
p
f
47
0
44
7 44
544
442
942
841
641
541
140
940
940
738
137
737
537
3
36
736
6
29
929
728
428
328
1
26
7
24
6
24
424
324
223
823
022
822
6
20
720
520
419
6
19
519
419
319
1
a
b
168
Eu GSH0011resp
45 40 35 30 25 20 15 10
Chemical Shift (ppm)
005
010
015
Norm
alized Inte
nsity
035183050206177050088216024026100
d
g
b
i
f
c
45
044
844
7
42
0 41
841
741
341
241
138
0 37
837
737
136
9 30
230
1
28
928
728
628
428
328
1
25
124
924
724
624
424
2 23
3 23
122
921
020
820
720
519
919
819
719
6
GSH DTPA0011resp
45 40 35 30 25 20 15 10
Chemical Shift (ppm)
0
005
010
015
Norm
alized Inte
nsity
032158045179156092075366021025099
c
d
g
DTPA
DTPA
DTPA
b
DTPA
i
f
45
044
9 44
744
6
41
941
841
741
241
141
0
37
937
737
537
036
8
34
133
633
5
30
730
530
1
28
928
628
528
428
228
0
25
024
824
624
524
324
1 23
223
022
821
020
820
620
419
719
5
c
d
169
EuDTPA GSH0011resp
45 40 35 30 25 20 15 10
Chemical Shift (ppm)
0
0005
0010
0015
0020
0025
0030
0035
0040
0045
0050
0055
Norm
alized Inte
nsity
180181200200212103673021100
47
0
44
244
1
38
4
36
836
3
32
832
0 30
230
129
9 28
628
528
328
1
24
724
624
524
424
3
20
820
720
520
3
Figure 441 1H NMR spectra for GSH in D2O under a range of conditions at 298 K a)
GSH b) GSH after irradiation with 7 kGy γ-radiation c) Eu(NO3)3 with GSH d) GSH
with Na5DTPA e) Eu-DTPA with GSH
Figure 442 1H
1NMR proton assignments for GSH (top) and γ-Glu-Cys (bottom)
It can be seen from spectra ldquoardquo and ldquobrdquo that there is some degradation of GSH
after irradiation with 7 kGy γ-radiation from a 60
Co irradiator shown by the presence of
e
170
γ-Glu-Cys fragments12
(Figure 442) The buffer seems to be susceptible to γ-radiolysis
and the integration ratios show that the γ-Glu-Cys fragments are present in a significant
quantity as the ratios are comparable to those of the intact GSH Spectrum ldquocrdquo shows
that the buffer does not form a stable complex with Eu3+
as there is only slight shifting
of the peaks indicating weak interaction and perhaps fast dynamic exchange on the
timescale of the NMR experiment There is also no notable paramagnetic broadening as
would be expected if a Eu3+
complex is formed Spectrum ldquoerdquo does show slight
paramagnetic broadening relative to spectrum ldquodrdquo (Na5DTPA with GSH) confirming
the formation of the Eu-DTPA complex seen in previous emission spectra (Section
422)
48 Summary and Conclusion of Glutathione Work
Since amino acids have not been shown to act as holdback reagents by
themselves the potential of using the tripeptide L-glutathione was investigated Initial
separation studies were carried out using glutathione at pH 4 as is was anticipated that
based on its pKa values glutathione would be most likely to act as a successful
holdback reagent at this pH despite the unfavourable increase of pH Preliminary
investigations found that like amino acids GSH is ineffective as a holdback reagent on
its own as there was no separation observed between Eu3+
and Am3+
when used without
Na5DTPA
Subsequent investigations were carried out using GSH alongside Na5DTPA to
determine whether separation was improved with the tripeptide buffer At pH 2 and pH
3 it was found that the glutathione acts solely as a buffer as the separation factor in each
case was independent of GSH concentration However at pH 4 separation between
Eu3+
and Am3+
was found to increase as the buffer concentration was increased
suggesting that the glutathione is interacting with the Ln-DTPA complexes at this pH
This could be explained by the increase in stability of Ln-GSH complexes as the pH is
increased A buffer concentration of 05 M was then used for all further optimisation
experiments
At 05 M GSH the separation factor was found to increase dramatically as a
function of Na5DTPA concentration up to 03 M Na5DTPA After this peak there was
a rapid decrease in separation as the concentration is increased further up to 06 M
Na5DTPA as the stoichiometry is close to 11 GSHDTPA The separation factors
achieved here were extremely high (~1000) ndash a factor of 10 higher than the current
171
TALSPEAK system and the optimised alanine system whilst still maintaining low Am3+
extraction
At 03 M Na5DTPA the separation factor then increased as the extractant
concentration was increased from 02 to 04 M HDEHP in dodecane after which the SF
began to decrease again with the optimum separation at 04 M giving a SF of 1238 At
04 M Na5DTPA however the separation factor decreases rapidly as the extractant
concentration is increased due to the DAm increasing by a factor of 1000 consistent with
the complexant and buffer possibly forming some kind of adduct which no longer
successfully holds back Am3+
at higher Na5DTPA concentrations
Luminescence experiments mimicking the separation studies showed that the
glutathione does not form a stable complex with the Eu3+
ion and is in exchange with
surrounding solvent molecules even at the highest buffer concentrations preventing the
GSH from acting as a holdback reagent and allowing extraction of the metal into the
organic phase Proton NMR spectroscopy confirmed that although the glutathione may
be in exchange with surrounding water molecules no stable complexes between the
buffer and metal ions are formed (Appendix 8)
In samples containing Na5DTPA a Eu-DTPA complex can be clearly observed
in the emission spectra with or without the presence of GSH over a pH range of 2-4
The J=1J=2 peak ratios showed that there is no change in the co-ordination mode of the
buffer to the metal ion as the concentration of GSH is increased for each pH However
across the data sets the co-ordination mode of glutathione was found to be different at
different pH values as expected based on pKa values and increasing stability constant
with pH
At 05 M GSH the co-ordination mode of the Eu-DTPA complex in the aqueous
phase was found not to change as [Na5DTPA] was changed with metal extraction
typically decreasing as the holdback reagent increases and at 03 M Na5DTPA with 05
M GSH extraction was found to increase as HDEHP concentration increased as
expected Unfortunately luminescence spectroscopy does not seem to be a sensitive
enough technique to gain much information from samples post-extraction using these
conditions
In order to determine how resistant the glutathione buffered system is to
radiolysis a selection of samples were irradiated with 7 kGy γ-radiation and analysed
by luminescence and 1H NMR spectroscopies The radiation was seen to have some
degrading effect on the buffer in the aqueous phase with slightly decreased
luminescence emission intensity of complexes post-irradiation and evidence of
172
significant quantities of γ-Glu-Cys fragments present in the 1H NMR spectrum
However the emission profiles co-ordination mode and luminescence lifetimes of the
samples remained unchanged Extraction also seemed to be unaffected with the
emission remaining relatively constant for each of the phases of the samples after
irradiation
Initial data obtained on the glutathione system with europium(III) and
americium(III) seemed promising as after optimisation very high separation factors
were achieved and despite the buffer being susceptible to radiolysis extraction of
lanthanide ions was still high after irradiation However in order to be a successful
alternative to the current TALSPEAK system it is essential that effective separation of
all lanthanides from MA3+
can occur Further luminescence experiments were carried
out firstly on an analogous dysprosium system in order to represent heavier lanthanide
elements followed by a mixture of 4 lanthanide metals in the same samples
For the dysprosium study as the pH was increased from 2-4 the extraction of
Dy3+
decreased suggesting that the same kinetic issues noted for heavier lanthanides in
the amino acid systems may also be present for the GSH system at higher pH values In
the mixed samples the same pattern was observed with extraction of Ln3+
decreasing as
pH was increased At pH 4 extraction of all lanthanide ions was very low particularly
for Tb3+
and Dy3+
which are both heavier than Sm3+
and Eu3+
ICP-MS was carried out
on a series of samples containing a mixture of 10 lanthanides in order to confirm
whether the heavier lanthanides are in fact subject to kinetic issues with GSH
ICP-MS data was consistent with the luminescence data showing decreased
extraction of heavier lanthanides as pH increases from 2 to 4 The quantity of metal
extracted was so low it was below the limit of detection for some of the heavier metals
at pH 4 forcing the conclusion that unfortunately the same kinetic issues are a problem
at higher pH for the glutathione buffered system as for the amino acid systems Further
optimisation of the system to exploit the combined liquid-liquid extraction efficiencies
as a function of atomic number may allow the development of an extraction process of
lighter over heavier lanthanides for rare earth recycling which is currently a
strategically important goal13
173
1 ImmuneHealthSciencecom What Glutathione (GSH) is and how it affects your
immune health httpwwwimmunehealthsciencecomglutathionehtml 2015
2 ME Sears Scientific World Journal 2013 2013 219840
3 L Patrick Mercury toxicity and antioxidants Part I Role of glutathione and alpha-
lipoic acid in the treatment of mercury toxicity Alternative Medicine 2002
4 EA Bump and JM Brown Pharmacol Ther 1990 47 1 117-136
5 JB Mitchell and A Russo Br J Cancer 1987 55 Suppl VIII 96-104
6 VV Nikonorov J Anal Chem 2010 65 4 359-365
7 A Miličević and N Raos Acta Chim Slov 2014 61 904-908
8 BS Garg BK Singh DN Kumar and PK Sing Indian J Chem 2003 42A 79-83
9 Sigma Aldrich Product Information
httpwwwsigmaaldrichcometcmedialibdocsSigma-AldrichProduct_Information_
Sheetg4251pisPar0001Filetmpg4251pispdf
10 SJA Pope BP Burton-Pye R Berridge T Khan PJ Skabara and S Faulkner
Dalton Trans 2006 2907-2912
11 TS Grimes MP Jensen L Debeer-Schmidt K Littrell and KL Nash J Phys
Chem B 2012 116 46 13722-13730
12 RJ Hopkinson PS Barlow CJ Schofield and TDW Claridge Org Biomol
Chem 2010 8 4915-4920
13 LS Natrajan and MH Langford Paden f-Block Elements Recovery in A Hunt ed
Element Recovery and Sustainability RSC 2013 6 140-184
174
5 MODIFIED DTPA LIGANDS AS COMBINED BUFFERS AND SOFT
DONORS IN A TALSPEAK SYSTEM
Amino acids and the tripeptide L-glutathione have been shown not to be suitable
as a combined buffer and soft-donor for potential replacement of DTPA
(diethylenetriaminepentaacetic acid) and the lactate buffer used in the TALSPEAK
process (Trivalent Actinide Lanthanide Separation by Phosphorus reagent Extraction
from Aqueous Complexation) an advanced reprocessing technique currently being
developed in the USA They do not act as holdback reagents in their own right as they
do not bind preferentially to minor actinide (MA3+
) over lanthanide (Ln3+
) ions
preventing enhanced selective extraction of Ln3+
by HDEHP (di-
(2ethylhexyl)phosphoric acid) into an organic phase The possibility of synthesising a
combined buffer and soft-donor with DTPA and amino acid functionality was therefore
considered
By incorporating additional soft donors onto the DTPA structural framework
from amino acids the overall system would be simplified to just two components rather
than three This could be achieved by incorporating an amino acid or other soft donor
compounds into the DTPA scaffold itself (Figure 51) This strategy may increase the
complexation affinity binding constants and associated thermodynamic parameters to
the MA3+
ion improving the separation and slowing down the kinetics of the exchange
processes if the ligand has a significant specificity for MA3+
over Ln3+
This is
especially true if two of the carboxylic acid moieties are replaced by relatively softer
donors here amide groups
A report on bis(methionine)-appended DTPA was published by Hazari et al in
2010 on the use of Tc-DTPA-bis(methionine) in tumour imaging1 however there are no
literature reports on the synthesis or use of amino acid appended or any modified DTPA
ligands for solvent extraction and separation studies
The work described in this chapter was performed in collaboration with an
MChem student a summer student and the Institute for Waste disposal (INE)
Karlsruhe Germany The initial ligand syntheses were carried out jointly between
myself and the MChem student and all luminescence analysis was performed jointly
The refining of the syntheses and characterisation of the ligands was carried out by a
summer student All separation work using the ligands was carried out by colleagues at
INE
175
Figure 51 General structure of DTPA-amino acid ligands
51 Ligand Synthesis and Characterisation
A route for the synthesis of DTPA-bis(amino acids) was devised involving ring
opening of the anhydride of DTPA with an amine group of the amino acid in question
whereby the amino acid is incorporated onto two of the side arms of the DTPA
according to Scheme1234
Initially the reaction was attempted using the acid forms of
the amino acid L-alanine however the reaction was found to be unsuccessful since only
an amino acid dimer could be isolated In order to allow optimisation of the reaction
conditions whilst avoiding competitive side reactions the reactions were repeated using
the methyl or ethyl ester protected forms of the amino acids Here commercially
available methyl esters of L-alanine L-arginine and L-histidine and the ethyl ester of L-
serine were used The amide coupling reactions with these amino acid derivatives using
triethylamine as the base proceeded in high yield However isolation and purification of
the products was found to be quite difficult as the reaction products are very
hygroscopic and stubbornly retain residual triethylamine salts Therefore the relatively
impure ligands were isolated for further studies following multiple re-precipitations and
re-crystallisation All the ligands were characterised by 1H NMR spectroscopy
MALDI-MS and elemental analysis (Section 742)
Scheme 1 Synthesis of DTPA-bis(amino) alkyl esters
Protected
Protected Protected
176
52 Luminescence Studies on Ligand Systems at pH 2 3 and 4
521 Aqueous Phase Studies
The DTPA-amino acid ligands synthesised were studied by luminescence
spectroscopy in a TALSPEAK type system The ligands self-buffer at approximately
pH 2 at 50 mM concentration but to ensure consistency in studies the pH of systems
were adjusted to exact pH values (plusmn 01) Aqueous phases were prepared containing 50
mM ligand and 1 mM Eu(NO3)3 at pHpD 2 3 and 4 for each of the four synthesised
ligands Samples were measured in D2O and H2O The emission spectra of the D2O
samples can be seen in Figures 52-54 The spectra for the samples in H2O are identical
but with lower relative emission intensities
Figure 52 Emission spectra of Eu(NO3)3 with DTPA-bis(amino ester) ligands in D2O
at pD 2 following excitation at 397 nm
0
5
10
15
20
25
30
35
550 575 600 625 650 675 700
Emis
sio
n In
ten
sity
(au
) x
10
00
0
Wavelength (nm)
Ala-DTPA
Arg-DTPA
His-DTPA
Ser-DTPA
177
Figure 53 Emission spectra of Eu(NO3)3 with DTPA-bis(amino ester) ligands in D2O
at pD 3 following excitation at 397 nm
Figure 54 Emission spectra of Eu(NO3)3 with DTPA-bis(amino ester) ligands in D2O
at pD 4 following excitation at 397 nm
The emission spectra are all very similar and show clear complexation of the
Eu3+
ion with each ligand There is little difference in emission intensity and form of the
spectra across all of the samples which indicates that all of the ligands present the same
coordination environment to the Eu3+
centre as expected
Table 51 J=1J=2 peak ratios and t-test results for Eu- DTPA-bis(amino ester)
complexes at pD 2-4
0
5
10
15
20
25
30
35
550 575 600 625 650 675 700
Emis
sio
n In
ten
sity
(au
) x
10
00
0
Wavelength (nm)
Ala-DTPA
Arg-DTPA
His-DTPA
Ser-DTPA
0
5
10
15
20
25
30
550 575 600 625 650 675 700
Emis
sio
n In
ten
sity
(au
) x
10
00
0
Wavelength (nm)
Ala-DTPA
Arg-DTPA
His-DTPA
Ser-DTPA
178
DTPA-
(AlaOMe)2
DTPA-
(ArgOMe)2
DTPA-
(HisOMe)2
DTPA-
(SerOEt)2
st dev t-test
pD 2 0359 0381 0404 0353 0023
No sig
diff
pD 3 0394 0425 0417 0381 0020
No sig
diff
pD 4 0391 0427 0432 0423 0019
No sig
diff
st dev 0019 0026 0014 0035
t-test No sig
diff
No sig
diff
No sig
diff
No sig
diff
The J=1J=2 peak height ratios were recorded for each emission spectrum and t-
tests were carried out on the peak ratios using the t-test data analysis tool in Microsoft
Excel accounting for the standard deviations between the ratios (Table 51) For each
data set the range in the ratios is small and there is no significant difference between
the values again suggesting that the co-ordination mode of the each of the ligands to the
metal ion is the same Across the data sets unlike the glutathione system (Chapter 4)
no significant difference was observed either as pD increases from pD 2 to pD 4
indicating that the co-ordination mode of the complexes is not changing with pH
The luminescence lifetimes of each sample were recorded in H2O and D2O in
order to determine the q value of the complexes using the modified Horrocks equation
(Equation 110) These results are summarised in Table 52
179
Table 52 Luminescence lifetimes and q values for Eu-DTPA-bis(amino ester)
complexes at pD 2-4 recorded at the emission maximum (617 nm) following 397 nm
excitation
pH amp Ligand τ D2O (μs) τ H2O (μs) q plusmn 02
pH 2 DTPA-(AlaOMe)2 1794 plusmn 7 587 plusmn 8 09
pH 2 DTPA-(ArgOMe)2 1828 plusmn 12 626 plusmn 10 08
pH 2 DTPA-(HisOMe)2 1816 plusmn 10 614 plusmn 9 09
pH 2 DTPA-(SerOEt)2 1759 plusmn 9 563 plusmn 11 10
pH 3 DTPA-(AlaOMe)2 1981 plusmn 12 587 plusmn 11 10
pH 3 DTPA-(ArgOMe)2 2335 plusmn 16 604 plusmn 12 10
pH 3 DTPA-(HisOMe)2 1963 plusmn 8 607 plusmn 13 09
pH 3 DTPA-(SerOEt)2 1839 plusmn 13 588 plusmn 12 09
pH 4 DTPA-(AlaOMe)2 1908 plusmn 17 608 plusmn 11 09
pH 4 DTPA-(ArgOMe)2 1907 plusmn 13 601 plusmn 17 09
pH 4 DTPA-(HisOMe)2 1905 plusmn 14 604 plusmn 15 09
pH 4 DTPA-(SerOEt)2 1890 plusmn 10 609 plusmn 16 09
All of the complexes have approximately 1 water molecule in the inner
hydration sphere This is consistent with the formation of a Eu-DTPA-amide ligand
complex The values are generally slightly less than 1 in contrast to [Eu-DTPA]2-
itself
where q = 11 indicating the likely fast exchange of the bound water molecule with
other surrounding water molecules and that the amino ester appendage may inhibit the
close approach of more than one water molecule due to steric reasons
522 Extraction Studies
Extractions were carried out on the samples using 06 M HDEHP in dodecane
for the organic phase The emission spectra of both the aqueous and organic phases
post-extraction can be seen in Figures 55-58
180
Figure 55 Emission spectra of aqueous phases after Eu3+
extraction from an aqueous
phase containing DTPA-bis(amino ester) ligands (50 mM) at pH 2 following excitation
at 397 nm
Figure 56 Emission spectra of aqueous and organic phases after Eu3+
extraction from
an aqueous phase containing DTPA-bis(amino ester) ligands (50 mM) at pH 2
following excitation at 397 nm
0
0
0
0
0
1
1
550 575 600 625 650 675 700
Emis
sio
n In
ten
sity
(au
) Th
ou
san
ds
Wavelength (nm)
Ala-DTPA Aq
Arg-DTPA Aq
His-DTPA Aq
Ser-DTPA Aq
0
10
20
30
40
50
60
70
550 575 600 625 650 675 700
Emis
sio
n In
ten
sity
(au
) Th
ou
san
ds
Wavelength (nm)
Ala-DTPA Aq Arg-DTPA Aq His-DTPA Aq Ser-DTPA Aq Ala-DTPA Org Arg-DTPA Org His-DTPA Org Ser-DTPA Org
181
Figure 57 Emission spectra of aqueous and organic phases after Eu3+
extraction from
an aqueous phase containing DTPA-bis(amino ester) ligands (50 mM) at pH 3
following excitation at 397 nm
Figure 58 Emission spectra of aqueous and organic phases after Eu3+
extraction from
an aqueous phase containing DTPA-bis(amino ester) ligands (50 mM) at pH 4
following excitation at 397 nm
0
2
4
6
8
10
12
550 575 600 625 650 675 700
Emis
sio
n In
ten
sity
(au
) x
10
00
0
Wavelength (nm)
Ala-DTPA Aq Arg-DTPA Aq His-DTPA Aq Ser-DTPA Aq Ala-DTPA Org Arg-DTPA Org His-DTPA Org Ser-DTPA Org
0
1
2
3
4
5
6
7
550 575 600 625 650 675 700
Emis
sio
n In
ten
sity
(au
) x
10
00
0
Wavelength (nm)
Ala-DTPA Aq
Arg-DTPA Aq
His-DTPA Aq
Ser-DTPA Aq
Ala-DTPA Org
Arg-DTPA Org
His-DTPA Org
Ser-DTPA Org
182
The Eu-HDEHP complex formed in the organic phase has different symmetry to
Eu-DTPA complexes in the aqueous phase as can be seen be the different profile of the
emission spectra of the organic phases The extraction data show that the best Eu3+
extraction occurs at pH 2 under these conditions as there is complete metal extraction
into the organic phase for all of the ligands and very little or no metal remaining in the
aqueous phase Above pH 2 the extraction of Eu3+
decreases leaving some of the metal
ion in the aqueous phase at pH 3 and an even higher proportion at pH 4 At pH 3
extraction is relatively higher with the DTPA-(SerOEt)2 ligand than any of the other
ligands and at pH 4 extraction is higher with DTPA-(HisOMe)2 and DTPA-(ArgOMe)2
The J=1J=2 peak ratios for the organic phases (Table 53) show no significant
difference in co-ordination mode within the pH 2 or pH 4 data for each ligand however
the co-ordination can be seen to change slightly with each ligand at pH 3 Also no
significant difference is observed as pH is changed for DTPA-(ArgOMe)2 and DTPA-
(AlaOMe)2 however there is a significant difference observed for DTPA-(SerOEt)2 and
DTPA-(HisOMe)2 as pH is changed Each emission spectrum was recorded 5 times and
an average taken and repeat measurements were also taken so whilst the data is
reproducible it appears to be inconsistent and difficult to explain without further
investigation into the co-ordination environment at different pH values by means other
than luminescence spectroscopy although it can be seen that pH 2 is optimum for
extraction using these ligands
Table 53 J=1J=2 peak ratios and t-test results for organic phases after extraction after
Eu3+
extraction aqueous phases containing DTPA-bis(amino ester) ligands (50 mM) at
pH 2-4
DTPA-
(AlaOMe)2
DTPA-
(ArgOMe)2
DTPA-
(HisOMe)2
DTPA-
(SerOEt)2
st dev t-test
pH 2 0208 0207 0198 0208 0005 No sig diff
pH 3 0210 0213 0311 0347 0069 Sig diff
pH 4 0182 0210 0206 0205 0013 No sig diff
st dev 0016 0003 0063 0081
t-test No sig diff No sig diff Sig diff Sig diff
183
53 Radiolysis Studies on Ligand Systems at pH 2
531 Aqueous Phase Studies
In order to determine how resistant the ligand are to radiolysis a selection of
samples at pHpD 2 containing 50 m M ligand and 1 mM Eu(NO3)3 were irradiated at
the Dalton Cumbrian Facility using a 60
Co irradiator The samples were exposed to 7
kGy γ-radiation and analysed by luminescence spectroscopy The emission spectra of
the D2O samples can be seen in Figure 59 The spectra for the samples in H2O are the
same but with lower emission intensity
Figure 59 Emission spectra of Eu(NO3)3 in D2O with DTPA-bis(amino ester) ligands
(50 mM) at pH 2 after irradiation with 7 kGy γ-radiation and following excitation at
397 nm
The spectra of the samples are the same after irradiation as beforehand
indicating that the radiation has little or no degrading effect on the complexes in the
aqueous phase The J=1J=2 ratios and co-ordination mode remained unchanged (Table
54) as do the luminescence lifetimes and q values of the samples (Table 55)
0
5
10
15
20
25
30
35
550 575 600 625 650 675 700
Emis
sio
n In
ten
sity
(au
) Th
ou
san
ds
Wavelength (nm)
Ala-DTPA
Arg-DTPA
His-DTPA
Ser-DTPA
184
Table 54 J=1J=2 peak ratios and t-test results for Eu-DTPA-bis(amino ester)
complexes at pD 2 after irradiation with 7 kGy γ-radiation
DTPA-
(AlaOMe)2
DTPA-
(ArgOMe)2
DTPA-
(HisOMe)2
DTPA-
(SerOEt)2 st dev t-test
J=1J=2 0357 0395 0412 0362 0026 No sig
diff
Table 55 Luminescence lifetimes and q values for Eu-DTPA-bis(amino ester)
complexes at pD 2-4 after irradiation with 7 kGy γ-radiation
Ligand τ D2O (μs) τ H2O (μs) q plusmn 02
DTPA-(AlaOMe)2 1818 plusmn 7 613 plusmn 8 09
DTPA-(ArgOMe)2 1843 plusmn 12 586 plusmn 10 10
DTPA-(HisOMe)2 1803 plusmn 10 629 plusmn 9 08
DTPA-(SerOEt)2 1809 plusmn 9 598 plusmn 11 09
532 Extraction Studies
Extractions were then carried out on some of the irradiated samples using 06 M
HDEHP in dodecane The emission spectra of both the aqueous and organic phases
post-extraction can be seen in Figure 510
Figure 510 Emission spectra of aqueous and organic phases after Eu3+
extraction from
an irradiated (7 kGy γ-radiation) aqueous phase containing DTPA-bis(amino ester)
ligands (50 mM) at pH 2 following excitation at 397 nm
0
1
2
3
4
5
6
550 575 600 625 650 675 700
Emis
sio
n In
ten
sity
(au
) Th
ou
san
ds
Wavelength (nm)
Ala-DTPA Aq Arg-DTPA Aq His-DTPA Aq Ser-DTPA Aq Ala-DTPA Org Arg-DTPA Org His-DTPA Org
185
The emission profiles of the samples are the same after irradiation as
beforehand indicating that the radiation has little or no degrading effect on the
complexes in the aqueous phase The emission intensity is lower for the organic phases
after irradiation than beforehand possibly due to increased quenching effects caused by
radicals present as a result of irradiating the solvents The J=1J=2 ratios and co-
ordination mode for the organic phase remained unchanged (Table 56) and the
luminescence lifetimes can be seen to decrease only slightly after irradiation consistent
with the decrease in emission intensity (Table 57)
Table 56 J=1J=2 peak ratios and t-test results for the organic phases after Eu3+
extraction from aqueous phases containing DTPA-bis(amino ester) ligands (50 mM) at
pH 2 one of which had been irradiated with 7 kGy γ-radiation
DTPA-
(AlaOMe)2
DTPA-
(ArgOMe)2
DTPA-
(HisOMe)2
DTPA-
(SerOEt)2
st dev t-test
J=1J=2 0241 0233 0198 0231 0019
No sig
diff
Table 57 Luminescence lifetimes and q values for the organic phases after Eu3+
extraction from aqueous phases containing DTPA-bis(amino ester) ligands (50 mM) at
pH 2 one of which had been irradiated with 7 kGy γ-radiation
Ligand τ organic phase
without irradiation
(micros)
τ organic phase after
irradiation
DTPA-(AlaOMe)2 2151 plusmn 21 1829 plusmn 18
DTPA-(ArgOMe)2 1881 plusmn 19 1821 plusmn 17
DTPA-(HisOMe)2 2265 plusmn 18 2227 plusmn 18
DTPA-(SerOEt)2 1856 plusmn 20 1777 plusmn 19
54 Separation Work on Ligand Systems
Some separation work using these ligands was carried out with the help of
Andreas Geist at KIT-INE in Germany Extractions were performed under TALSPEAK
conditions but using kerosene as the organic phase due to availability
186
541 AmEu Separation in Ligand Systems
A stock spiking solution of 241
Am + 152
Eu (1 kBq mL-1
) was added to a solution
of yttrium and lanthanides (10 mgdm3 of each Ln(NO3)3) with each ligand (50 mM) for
DTPA-(ArgOMe)2 DTPA-(SerOEt)2 DTPA-(HisOMe)2 at pH 1-2 The aqueous phases
were contacted with HDEHP (02 M) in kerosene and shaken for 30 minutes The
phases were then separated and the Am3+
and Eu3+
concentrations in each phase were
determined by Gamma counting The separation factors for all ligands under these
conditions were found to be approximately 100 across the pH range measured Graphs
of these data are plotted in Figures 511-513 These values are comparable with the
original TALSPEAK process using lactate (SF = 91) Although the TALSPEAK
process uses dodecane rather than kerosene and as such the results are therefore not
directly comparable they still show selectivity between Am3+
and Eu3+
for these
ligands However the DAm using these ligands is 2-3 orders of magnitude higher than in
the original TALSPEAK process (~025-200 compared to 0009) indicating that Am3+
is not being held back sufficiently by the ligand for this to be a viable process and that
more work is needed to decrease the partitioning of Am3+
into the organic phase This
may be possible with optimisation of the systems by varying the pH concentration of
ligand concentration of extractant and by modifying the solubility of the ligands ie by
cleavage of the methyl and ethyl ester groups to generate the amino acid Nevertheless
these results are particularly encouraging
Figure 511 Separation factors and distribution ratios for Eu3+
Am3+
using DTPA-
(ArgOMe)2 (005 M) at pH 1-2 extracted using HDEHP (02 M) in kerosene
187
Figure 512 Separation factors and distribution ratios for Eu3+
Am3+
using DTPA-
(SerOEt)2 (005 M) at pH 1-2 extracted using HDEHP (02 M) in kerosene
Figure 513 Separation factors and distribution ratios for Eu3+
Am3+
using DTPA-
(HisOMe)2 (005 M) at pH 1-2 extracted using HDEHP (02 M) in kerosene
542 Ln Separation in Ligand Systems
In addition to the Eu3+
Am3+
separation studies carried out at KIT-INE using
these amino ester appended DTPA ligands further experiments were conducted to
observe the separation across the lanthanide series by ICP-MS under the same
conditions The graphs of the distribution ratios for each Ln3+
and Am3+
can be seen in
Figures 514-516 for each ligand as well as the separation factor for Nd3+
Am3+
(as
188
Nd3+
is the most difficult lanthanide to extract) The SFNdAm in each case is 30-40 over
the pH range 1-2 These separation factors are good only slightly lower than the
original lactate-buffered TALSPEAK process (SFNdAm ~ 55) and the distribution ratios
for the heavier lanthanides are particularly high higher than the original process with a
greater proportion of them having D values of over 1000 (Figures 514-516)
Figure 514 Distribution ratios for Ln3+
using DTPA-(ArgOMe)2 (005 M) at pH 1-2
extracted using HDEHP (02 M) in kerosene
189
Figure 515 Distribution ratios for Ln3+
using DTPA-(SerOEt)2 (005 M) at pH 1-2
extracted using HDEHP (02 M) in kerosene
Figure 516 Distribution ratios for Ln3+
using DTPA-(HisOMe)2 (005 M) at pH 1-2
extracted using HDEHP (02 M) in kerosene
190
55 Summary and Conclusion of Modified DTPA Ligand Work
After initial difficulties synthesising amino acid appended DTPA ligands the
ligands were successfully synthesised in good yields (~60 ) for DTPA-(AlaOMe)2
DTPA-(ArgOMe)2 DTPA-(SerOEt)2 and DTPA-(HisOMe)2 using ester protected
versions of the amino acids The ligands were shown by luminescence spectroscopy to
complex to Eu3+
at pH 2 3 and 4 forming Eu-DTPA-bis(amino ester) adduct with 1
water molecule in fast exchange in the inner hydration sphere Under TALSPEAK
conditions the ligands were found to be more effective holdback reagents at the lower
pH of 2 but also effectively extract Eu3+
over Am3+
as low as pH 15 This is in stark
contrast to the original TALSPEAK process The co-ordination mode of the ligands to
the metal ion was consistent for all of the ligands but was found to change slightly upon
changing pH although the overall coordination number of Eu3+
with the ligands
remained as approximately 8 (with the 9th
coordination site being completed by one
water molecule) Studies showed that the ligands are relatively resistant to radiolysis
when subjected to 7 kGy γ radiation as there was no change in their luminescence
emission profile co-ordination mode or hydration number after irradiation
Results from separation studies conducted at KIT-INE using gamma counting
and ICP-MS showed that the modified DTPA ligands successfully allowed separation
between Ln3+
Am3+
giving good separation factors comparable to the original lactate-
buffered TALSPEAK process (SFEuAm ~100) even for Nd3+
which is the most difficult
lanthanide to extract in the process (SFNdAm ~30-40) The extraction efficiency of all the
ligands broadly relates to the atomic number of the lanthanide ions (apart from La3+
Ce3+
and Pr3+
) with the heavier ions being preferentially extracted as expected The
separation factors of individual lanthanide pairs range from approximately 25 to gt 100
and for the Dy3+
Nd3+
pair of particular economic importance are quite reasonable SF
DyNd ~ 30
However the distibution ratio for Am3+
is higher than desired (025-200 vs
0009) and so optimisation of the systems would be necessary to try to reduce DAm for
the combined buffer soft-donor system to be viable Another step would also be to try to
deprotect the amino acids on the ligands hydrolysing the esters back to carboxylic acid
groups to see if that would increase the holdback ability of the ligands and possibly
decrease the distribution ratio of Am3+
191
1 PP Hazari G Shukla V Goel K Chuttani N Kumar R Sharma and AK Mishra
Bioconjugate Chem 2010 21 229-239
2 X Wang X Wang Y Wang and Z Guo Chem Comm 2011 47 8127-8129 ESI
3 SJ Pope BJ Coe S Faulkner and R H Laye Dalton Trans 2005 1482-1490
4 S J Pope B J Coe and S Faulkner Chem Commun 2004 1550-1551
192
6 SUMMARY CONCLUSIONS amp FUTURE WORK
61 Summary amp Conclusions
One technique for reprocessing SNF currently being developed in the USA is
the TALSPEAK process an advanced reprocessing method for the separation of Ln3+
and MA3+
components The traditional process developed in the 1960s uses DTPA to
act as a holdback reagent for MA3+
in a lactate buffered aqueous phase at pH 36
allowing Ln3+
to be selectively extracted by organophosphate HDEHP into an organic
phase of DIPB or dodecane TALSPEAK is one of the most promising techniques being
researched due to its numerous advantages particularly its relative resistance to
irradiation and ability to be carried out without the need for high reagent concentrations
Additionally it gives high separation factors in the region of ~50-100 which is
comparable to other advanced reprocessing methods currently being developed1 Since
the chemistry of the process is very complex and not particularly well understood it
would be an advantage to simplify the process by removing the need for a separate
holdback reagent and buffer
Recent studies have shown that complexants with soft donor atoms such as N or
S (relative to O) can be used to separate MA3+
from Ln3+
23
Initial research was carried
out by our collaborators at the Idaho National Lab testing the suitability of amino acids
(L-alanine L-arginine L-histidine and L-methionine) as a potential combined buffer
and soft donor by determining whether amino acids preferentially bind to MA3+
Another benefit to using amino acids would be the scope for carrying out the process at
a lower pH (~ pH 2) due to the lower pKa values of the carboxylic acid groups of the
amino acids than on DTPA Lower pH values are preferred by industry as higher acid
concentrations are easier to control on a large scale and are also known to increase the
Ln3+
distribution coefficients4
This work carried out by Grimes5 showed that amino acids do not act as
holdback reagents in their own right and that no separation of Ln3+
Am3+
is achieved
when they are used without Na5DTPA in solution However investigations showed that
when used alongside Na5DTPA good separation (SFEuAm ~ 66) can be achieved when
using 05 M L-alanine at pH 2 (cf ~25 at pH 3) however the DAm value was relatively
high than at the lower pH (DAm 047 at pH 2 cf 012 at pH 3) as more protonated forms
of the DTPA molecule are present in solution at low pH and the holdback reagent is not
able to bind as strongly to metal ions allowing more Am3+
to be partitioned into the
organic phase
193
However optimisation of the system in order to maximise the separation whilst
keeping Am3+
partitioning to a minimum by changing the concentrations of holdback
reagent and extractant proved to be successful The optimum conditions were found to
be 04 M Na5DTPA and 02 M HDEHP giving a separation factor of 71 plusmn 5 with a DAm
value of 008 Although this separation is not as good as a traditional lactate
TALSPEAK system (SF = 91 DAm = 0009) the use of L-alanine (pKa = 235) as a
buffer would allow the process to be carried out at pH 2 which is a much more
preferable pH for industry
Separations were carried out using other amino acids at varying pH values and it
was found that L-methionine was too poorly soluble at pH 3 and did not give very good
separation data at pH 2 L-arginine was found to have kinetic issues at pH 2 and 3
giving poor separation of the heavier lanthanides The amino acid L-histidine (pKa =
182) however gave good separation data at pH 3 with a SFEuAm of 99 comparable to
that of the original TALSPEAK process and a DAm of 007 comparable to the optimised
L-alanine system Unfortunately ICP-MS studies on lanthanides La-Ho using L-
histidine at pH 3 showed that the same kinetic problems arise for this system as for L-
alanine at pH 3 and L-arginine at pH 2 and 3 as the DLn value decreases for later
lanthanides
The interaction of the buffers glycine L-alanine L-serine L-phenylalanine and
lactate (for comparison) with Eu3+
and [Eu(DTPA)]2-
systems was investigated by
luminescence and 1H NMR spectroscopies As expected it was found that amino acids
and lactate do not form stable complexes with either the free metal ion or the metal-
DTPA complex and that the buffers are likely to be in fast exchange with surrounding
solvent molecules as the number of water molecules in the inner hydration sphere (q) of
Eu3+
was reduced from 9 to ~6 when buffers were added to the aqua ion in solution
Luminescence studies on L-phenylalanine (like other amino acids) showed that it does
not bind to the metal ion as there was no sensitised emission from Tb3+
ion when
excited into the phenyl chromophore of the amino acid when the two components were
in solution Emission spectra of Eu3+
and Cm3+
aqua ions and their corresponding
DTPA complexes showed no change in emission profile upon the addition of amino
acidslactate There was also no change in q when buffers were added to metal-DTPA
complexes in solution for Eu3+
or Cm3+
Radiolysis studies carried out on lactate and amino acid buffered [Eu(DTPA)]2-
systems showed that the systems are relatively resistant to γ-radiation when exposed to
5 kGy γ-radiation This is consistent with previous work conducted by the INL showing
194
that separation systems using L-alanine as a buffer are more resistant to radiolysis than
the original TALSPEAK process using lactate67
A 05 M L-alanine buffered
TALSPEAK system using 04 M Na5DTPA and 02 M HDEHP at pH 2 can therefore
be seen to be a promising alternative to the traditional lactate buffered system as it has
been shown to give good separation data with fairly low extraction of Am3+
and the
buffer is also more resistant to radiolysis than lactate Additionally it allows the process
to be carried out at a lower pH of 2 which is much more practical for industrial
operation
Since amino acids were found not to act as holdback reagents in their own right
the potential of using the larger tripeptide L-glutathione (GSH) was investigated Initial
separation studies carried out using glutathione at pH 4 (as GSH has 2 pKa values
below 4 and Garg et al reported that the optimum stability for Ln-GSH complexes
occurs in solutions between pH 34-348)8 Preliminary investigations found that as
with the amino acids studied GSH is ineffective as a holdback reagent on its own as
there was no separation observed between Eu3+
and Am3+
when used without
Na5DTPA
Analogous to the amino acid studies subsequent investigations were carried out
using GSH alongside Na5DTPA to determine whether separation was improved with the
tripeptide buffer A pH dependence study found that at pH 2 and pH 3 the glutathione
acts solely as a buffer in the systems as the separation factor in each case was
independent of GSH concentration However at pH 4 interestingly separation between
Eu3+
and Am3+
was found to increase as the buffer concentration was increased up to
05 M suggesting that the glutathione is interacting with the Ln-DTPA complexes at
this pH This could be explained by the increase in stability of Ln-GSH complexes as
the pH is increased
Using 05 M GSH the separation factor was found to increase dramatically as a
function of Na5DTPA concentration up to 03 M Na5DTPA After this peak there was
a rapid decrease in separation as the concentration was increased further up to 06 M
Na5DTPA as the stoichiometry is close to 11 GSHDTPA The separation factors
achieved here were extremely high (~1000) ndash a factor of 10 higher than the current
TALSPEAK system and the optimised L-alanine system whilst still maintaining low
Am3+
extraction (DAm = 0002 with 03 M Na5DTPA) lower than in the traditional
TALSPEAK process
At 03 M Na5DTPA the separation factor then increased as the extractant
concentration was increased from 02 to 04 M HDEHP in dodecane after which the SF
195
began to decrease again with the optimum separation at 04 M extractant giving a SF
of 1238 (DAm = 00018) At 04 M Na5DTPA however the separation factor decreases
rapidly as the extractant concentration is increased due to the DAm increasing by a
factor of 1000 consistent with the complexant and buffer possibly forming an adduct
which no longer successfully holds back Am3+
at higher Na5DTPA concentrations
Luminescence experiments mimicking the separation studies showed that the
glutathione does not form a stable complex with the Eu3+
ion and is in exchange with
surrounding solvent molecules comparable to the amino acid buffer studies even at the
highest buffer concentrations 1H NMR spectroscopy confirmed that although the
glutathione may be in exchange with surrounding water molecules no kinetically stable
complexes between the buffer and metal ions are formed In samples containing
Na5DTPA a Eu-DTPA complex can be clearly observed in the emission spectra with
or without the presence of GSH over a pH range of 2-4 The J=1J=2 peak ratios
showed that there is no change in the co-ordination mode of the buffer to the metal ion
as the concentration of GSH is increased for each pH however across the data sets the
co-ordination mode of glutathione was found to be different at different pH values as
expected based on pKa values and increasing stability constant with pH
The co-ordination mode of the Eu-DTPA in the aqueous phase with 05 M GSH
was found not to change as [Na5DTPA] was changed with metal extraction typically
decreasing as the holdback reagent increases and at 03 M Na5DTPA with 05 M GSH
extraction was found to increase as HDEHP concentration increased as expected
The GSH buffered system was found to be susceptible to radiolysis when
subjected 7 kGy γ-radiation from a 60
Co irradiator and seen to degrade into γ-Glu-Cys
fragments However the degradation was seen to have little effect on the extraction of
metal ions from the aqueous phase when analysed by luminescence spectroscopy with
only slightly decreased emission intensity post-irradiation The emission profiles co-
ordination mode and luminescent lifetimes of the samples remained unchanged
In order to be a successful alternative to the current TALSPEAK system it is
essential that effective separation of all lanthanides from MA3+
can occur Further
luminescence experiments were carried out firstly on analogous dysprosium systems in
order to represent heavier lanthanide elements followed by a mixture of four different
lanthanide metals in the same samples (Sm3+
Eu3+
Tb3+
and Dy3+
) For the dysprosium
study as the pH was increased from 2-4 the extraction of Dy3+
decreased suggesting
that the same kinetic issues noted for heavier lanthanides in the amino acid systems may
also be present for the GSH system at higher pH values In the mixed samples the same
196
pattern was observed with extraction of Ln3+
decreasing as pH was increased At pH 4
extraction of all lanthanide ions was very low particularly for Tb3+
and Dy3+
which are
both heavier than Sm3+
and Eu3+
ICP-MS carried out on a series of samples containing
a mixture of 10 lanthanides (La3+
-Ho3+
) was consistent with the luminescence data
showing decreased extraction of heavier lanthanides as pH increases from 2 to 4 The
quantity of metal extracted was so low it was below the limit of detection for some of
the heavier metals at pH 4 forcing the conclusion that unfortunately the same kinetic
issues are a problem at higher pH for the glutathione buffered system as for the amino
acid systems
Initial data obtained on the glutathione system with europium(III) and
americium(III) seemed promising as after optimisation very high separation factors for
Eu3+
Am3+
were achieved (~1000) with very low Am3+
partitioning (DAm ~0002) and
although the buffer was found to be susceptible to radiolysis extraction of lanthanide
ions still remained high after irradiation However subsequent studies with heavier
lanthanides showed that the GSH buffered system is subject to the same kinetic
problems as some of the amino acid systems
Based on the results from studies using amino acid and glutathione buffered
systems demonstrating that Ln3+
MA3+
separation cannot be achieved without the
presence of DTPA and a buffer the possibility of synthesising a combined buffer and
soft-donor was considered Amino acids were appended onto DTPA through reaction of
amino acid esters with DTPA dianhydride to form DTPA-(AlaOMe)2 DTPA-
(ArgOMe)2 DTPA-(SerOEt)2 and DTPA-(HisOMe)2 in good yields (~ 60 ) The
ligands were shown by luminescence spectroscopy to complex to Eu3+
at pH 2 3 and 4
forming Eu-DTPA-AA2 adducts with 1 water molecule in fast exchange in the inner
hydration sphere Under TALSPEAK conditions the ligands were found to be more
effective holdback reagents at the lower pH of 2 and even at pH 15 The co-ordination
mode of the ligands to the metal ion was consistent for all of the ligands being typical
of lanthanide DTPA-amide ligands known in the literature910
but was found to change
upon changing pH These ligands were also found to be relatively resistant to radiolysis
when subjected to 7 kGy γ radiation from a 60
Co irradiator as there was no change in
their luminescent emission profile co-ordination mode or hydration number after
irradiation
Results from separation studies conducted at KIT-INE using gamma counting
and ICP-MS showed that the modified DTPA ligands successfully allowed separation
between Ln3+
Am3+
giving good separation factors comparable to the original lactate-
197
buffered TALSPEAK process (SFEuAm ~100) even for Nd3+
which is the most difficult
lanthanide to extract in the process (SFNdAm ~30-40) The extraction efficiency of all the
ligands broadly relates to the atomic number of the lanthanide ions (apart from La3+
Ce3+
and Pr3+
) with the heavier ions being preferentially extracted as expected The
separation factors of individual lanthanide pairs range from approximately 25 to gt 100
and for the Dy3+
Nd3+
pair of particular economic importance are quite reasonable SF
DyNd ~ 30
However the distibution ratio for Am3+
is much higher than desired for the
modified DTPA ligands (DAm = 025-200 vs DAm 0009) and so optimisation of the
systems would be necessary to try to reduce DAm for the combined buffer soft-donor
system to be viable Initial studies on combined DTPA-bis(amino ester) ligands is
promising allowing the TALSPEAK process chemistry to be simplified and providing a
system which could be buffered to a lower pH (pH 2) as preferred by industry The
synthesis of the ligands is quite moisture sensitive and the products are very
hygroscopic and difficult to purify making the application of them on an industrial
scale potentially problematic but the simplification of the process on a laboratory scale
would allow the chemistry of the TALSPEAK process to be further investigated and
better understood for future developments
Although there are a number of variations of the TALSPEAK process being
developed including the TALSQuEAK (Trivalent Actinide Lanthanide Separation
using Quicker Extractants and Aqueous Complexes) process11
which uses alternative
extractant HEH[EHP]12
and alternative holdback reagent HEDTA13
the use of amino
acid and short-chain peptide buffers is unique to this project in collaboration with the
Idaho National Laboratory There has been some investigation into the use of malonate
buffers for TALSPEAK14
but there are no other reports of the use of amino acids or
peptides in the literature Additionally there are few published reports on the use of
luminescence spectroscopy in TALSPEAK studies chiefly on the complexation of Eu3+
with lactate15
complexation of Eu3+
Cm3+
with DTPA16
and complexation of Eu3+
with
HDEHP in the organic phase17
There is no literature on systems as a whole
A report on bis(methionine)-appended DTPA was published by Hazari et al in
2010 on the use of Tc-DTPA-bis(methionine) in tumour imaging18
however there are
no literature reports on the synthesis or use of amino acid appended or any modified
DTPA ligands for solvent extraction and separation studies
198
62 Future Work
As only a small selection of amino acids have been tested as buffers it would be
interesting to try more of them The original selections were made on the basis of their
chemical structures solubilities and previous work conducted at INL plus presence of
any soft donor atoms L-alanine was selected as it has the most similar structure to lactic
acid although glycine may be worth considering as well based on its also very similar
structure and high aqueous solubility Results with L-arginine and L-methionine were
not very promising possibly due to their longer chain backbones so it may be worth
considering the similar shorter-chain amino acids L-cysteine and L-threonine as these
have similar structures to L-serine which along with glycine was one of the amino
acids investigated by luminescence spectroscopy Although L-cysteine has poor
solubility like L-methionine it would be interesting to see how these amino acids
behave as buffers when subjected to the same separation and optimisation tests as L-
alanine Similarly medium length chain amino acids L-glutamic acid L-aspartic acid
L-asparagine and L-glutamine may also be worth considering (Figure 61)
Figure 61 Chemical structures of amino acids taken from reference 1919
199
In addition to investigating other amino acid buffer systems as discussed in
Chapter 4 there may be some benefit to carrying out experiments with other short chain
peptides such as eisenin and norophthalmic acid as well as some of the B vitamins that
were considered (vitamins B7 and 9) before L-glutathione was selected From the
results obtained with L-glutathione demonstrating that the tripeptide interacts with the
Ln-DTPA complex under certain conditions it is possible that these other peptides may
also interact and potentially aid in extraction of Ln3+
or selective holdback of MA3+
Although the desired result was not achieved with L-glutathione as it seems to
suffer the same kinetic issues which have been common with amino acids causing very
good extraction of the lighter lanthanides but very poor extraction of the heavier
lanthanides further optimisation of the GSH system to exploit the combined liquid-
liquid extraction efficiencies as a function of atomic number may allow the
development of an extraction process of lighter over heavier lanthanides for rare earth
recycling which is currently a strategically important goal20
Initial studies on the modified DTPA ligands showed promising results for a
combined buffer and soft-donor although there is still much work to be done in this
area It would be useful to determine the stability constants of the ligands with
lanthanides and with Am3+
and Cm3+
if possible preferably by potentiomenty which
has proven to be the most reliable method for determining stability constants for these
types of complexes21
The next step in process development with the ligands would be
to optimise the systems (as was done for the L-alanine and GSH buffered systems) in
order to reduce the partitioning of Am3+
and decrease DAm as much as possible ideally
to the same of magnitude of the lactate and GSH buffered systems by altering pH
concentration of ligand and concentration of extractant to maximise separation and
minimise americium distribution
A further step would also be to try to deprotect the amino acids on the DTPA-
amino ester ligands hydrolysing the esters back to carboxylic acid groups to see if that
would increase the holdback ability of the ligands and possibly decrease the distribution
ratio of Am3+
It is envisioned that the research presented in this thesis could be applied to
current and new technologies and challenges faced in the future of the nuclear industry
in particular towards the development of a TALSPEAK-style advanced reprocessing
procedure for implementation in the USA within the near future
200
1 G Modolo A Geist and M Miguirditchian Minor actinide separations in the
reprocessing of spent nuclear fuels recent advances in Europe in R Taylor ed
Reprocessing and Recycling of Spent Nuclear Fuel Woodhead Publishing UK 2015
10 245-279
2 M P Jensen and A H Bond J Am Chem Soc 2002 124 9870-9877
3 L R Martin B J Mincher and N C Schmitt J Radioanal Nucl Chem 2009 282
523-526
4 B Weaver and T A Kappelmann Talspeak A new method of separating americium
and curium from the lanthanides by extraction from an aqueous solution of an
aminopolyacetic acid complex with a monoacidic organophosphate or phosphonate
Oak Ridge National Laboratory 1964 1-60
5 TS Grimes RD Tillotson and LR Martin Solv Extraction and Ion Exchange
2014 32 378-390
6 Dr Leigh Martin Idaho National Laboratory unpublished results
7 LR Martin S P Mezyk and BJ Mincher J Phys Chem A 2009 113 141-145
8 BS Garg BK Singh DN Kumar and PK Sing Indian J Chem 2003 42A 79-83
9 C L Davies N G Housden and A-K Duhme-Klair Angew Chem Int Ed Engl 2008
47 8856
10 SJA Pope Polyhedron 2007 26 17 4818-4824
11 JC Braley JC Carter SI Sinkov KL Nash and GJ Lumetta J Coord Chem
2012 65 16 2862-2876
12 GJ Lumetta AJ Casella BM Rapko TG Levitskaia NK Pence JC Carter
CM Niver and MR Smoot Solv Extraction Ion Exchange 2015 33 346-361
13 JC Braley TS Grimes and KL Nash Ind Eng Chem Res 2012 15 629-638
14 JL Lapka and KL Nash Solv Extraction Ion Exchange 2015 33 346-361
15 G Tian LR Martin and L Rao Inorg Chem 2010 49 10598-10605
16 G Tian LR Martin and L Rao Inorg Chem 2015 54 1232-1239
17 TS Grimes G Tian L Rao and KL Nash Inorg Chem 2012 51 6299-6307
18 PP Hazari G Shukla V Goel K Chuttani N Kumar R Sharma and AK
Mishra Bioconjugate Chem 2010 21 229-239
19 DWhite Wisegeek What are Amino Acids httpwwwwisegeekorgwhat-are-
amino-acidshtm 2015
20 LS Natrajan and MH Langford Paden f-Block Elements Recovery in A Hunt ed
Element Recovery and Sustainability RSC 2013 6 140-184
21 G Tian LR Martin and LRao Inorg Chem 2015 54 1232-1239
201
7 EXPERIMENTAL SECTION
71 Chemicals and Reagents
All chemicals and solvents were purchased from Sigma-Aldrich chemical
company and were used as received Radioisotopes were supplied by the Idaho National
Laboratory or the Institute for Nuclear Waste Disposal (INE) and were used in
accordance with the local rules for manipulation of high specific activity materials
711 Handling Radioisotopes at INL
In order to handle radioisotopes at INL it was necessary to compete the
RadWorker 2 training and theory and practical examinations Upon entering a radiation
area (laboratory) it was a requirement to sign onto the dosimetry record system and
collect a dosimeter which was to be worn on the chest at all times in the area When
handling radioactive material within the designated controlled areas (fume hoods) extra
layers of PPE (personal protective equipment) such as triple layered shoulder length
gloves were to be worn and disposed of immediately upon leaving the controlled area in
designated radioactive waste bins It was then a requirement to monitor the upper body
area carefully with an alpha and a beta radiation detector Whilst working in the
controlled area any potentially contaminated PPE or samples had to be disposed of and
immediately replaced in the case of PPE After preparing sealed samples in the
controlled areas a Radiological Control worker would assist with swabbing each
sample to check for contamination before it could be removed from the area for further
analysis Samples were not to be opened outside of controlled areas and were returned
to the controlled area fume hood to be disposed of by solidification Upon leaving
radiation areas a full body scan was conducted and dose records updated as dosimeters
were returned
72 Complexation studies of Ln3+
amp An3+
with amino acids in TALSPEAK systems
721 Preparation of samples for luminescence studies
7211 Stock solutions
Stock solutions (10 mM 10 mL) were made up for each lanthanide (EuTb)
using the corresponding lanthanide nitrate salt Ln(NO3)3xH2O in H2O or D2O as
required A stock solution of Na5DTPA in H2OD2O (1 M 50 mL) was made up from a
40 wv Na5DTPA solution in H2O by dilution (2517 g into 50 mL) Stock solutions
of amino acids (Gly L-Ala L-Ser) in H2OD2O (125 M 20 mL) were prepared from
202
the crystalline form of each amino acid and a stock solution of DL-lactic acid was
prepared by dilution (225 g in 20 mL) For the sensitisation study with L-Phe due to
poor solubility of L-Phe a 0625 M stock solution in D2O was made using the powdered
form of the amino acid Additionally a stock solution of HDEHP in n-dodecane (645 g
in 100 mL 02 M) was prepared All reagents were purchased from Sigma-Aldrich
Stock solutions
10 mM EuTb(NO3)3 in H2OD2O
1 M Na5DTPA in H2OD2O
125 M GlyL-AlaL-SerLactate in H2OD2O
0625 M L-Phe in D2O
02 M HDEHP in n-dodecane
7212 Preparation of aqueous samples
5 mL samples were prepared using the stock solutions above Ln(NO3)3xH2O
(05 mL) was added to each amino acid solution (4 mL) with either Na5DTPA solution
(05 mL) or H2OD2O (05 mL) depending on whether the samples contained DTPA
This produced individual samples with concentrations of 1 mM Ln3+
1 M amino
acidlactate (05 M for L-Phe) and 01 M Na5DTPA if applicable The pHpD of
samples was adjusted individually with concentrated HNO3 and NaOH to minimise
change in volume using a Mettler Toledo Seven Compact pHion Meter pD (-log10
deuterium ion concentration) was calculated using Equation 71 to account for the
activity coefficient difference between the different isotopes of the hydrogen ion where
pH = the meter reading from a calibrated pH electrode All samples were repeated in
triplicate analagous to the solvent extraction samples performed at INL
Equation 71
7213 Preparation of extracted samples
Aqueous samples were prepared using the stock solutions above Na5DTPA
solution (05 mL) was added to amino acid solution (4 mL) and the mixture was pre-
equilibrated by contacting with n-dodecane and shaken using a Scientific Industries
Vortex Genie 2 Mixer and Shaker for 15 minutes The phases were allowed to separate
and the organic layer was discarded Ln(NO3)3 solution (05 mL) was added to the
aqueous phase and the pH was adjusted individually with concentrated HNO3 and
NaOH to minimise change in volume using a Mettler Toledo Seven Compact pHion
203
Meter The pD was calculated using Equation 71 The aqueous phases were contacted
with HDEHP in n-dodecane (5 mL 02 M) The solutions were then shaken again for 15
minutes left to settle and separated into the two phases for analysis All samples were
repeated in triplicate analagous to the solvent extraction samples performed at INL
722 Radiolysis of samples
Fricke dosimetry can be used to determine dose rates from radiation sources
such as from a 60
Co irradiator used to irradiate samples for radiolysis studies at the
Dalton Cumbrian Facility An aerated iron(II) sulphate solution is irradiated to give free
radicals according to the following reactions
H2O rarr H + OH
OH + Fe2+
rarr Fe3+
+ HO-
H + O2 rarr HO2
H+ + Fe
2+ + HO2 rarr Fe
3+ + H2O2
H2O2 + Fe2+
rarr Fe(OH)2+
+ OH
HO2 + Fe3+
rarr Fe2+
+ O2 + H+
This means that each H radical causes the oxidation of 3 Fe2+
ions to Fe3+
The amount
of Fe3+
present can then be measured using UV-visible spectroscopy and the dose rate
calculated from this1
7221 Preparation of Fricke solution
A Fricke solution was needed for the first set of radiolysis experiments carried
out using the 60
Co irradiator at the DCF as it allows the amount of exposure to be
calculated for each sample position during irradiation
FeSO47H2O (020206 g 133 mM) NaCl (003031 g 052 mM) and H2SO4 (95-98
11 mL) were added to deionised water (500 mL) The resulting Fricke solution was
then air-saturated and stored away from natural and artificial light sources
7222 Calculating dose rates
The UV-vis spectra of Fricke solution was then read before and after irradiation
and the following equation used to work out the dose rate
The dose can be calculated from the equation designed by Spinks and Woods (Equation
72)2
204
Equation 72
Where
F (Faradayrsquos constant) = 0965 x 109 A mol
-1
εFe(III) = Fe(III) molar extinction coefficient = 2174 M-1
cm-1
ρ = Fricke solution density = 1204 g mL-1
G = Critical Dose Value for Fe3+
= 148 molecules per 100 eV for x-rays
V = Volume of sample (mL) = 1
ODi = Optical density of irradiated solution
ODb = Optical density of non-irradiated control
The Spinks and Woods equation is specific to X-rays and must be adjusted so that it can
be applied to the use of γ-rays (Equation 73)
For γ-rays
εFe(III) = 2197 M-1
cm-1
G = 162 molecules per eV
Equation 73
Equation 74
Due to the design of the irradiator different positions in the machine receive
slightly different dose rates resulting in each sample receiving slightly different
amounts of radiation although the variation in dose is not significant and each sample
was calculated to receive an average of 114 Gy min-1
205
Table 71 Dose rates received at each sample position in the 60
Co irradiator at DCF
Position Dose Rate (Gy
min-1
)
1 1084678
2 1171864
3 1183066
4 1103841
73 Solvent extraction and separation studies using amino acids and glutathione at
INL
731 Preparation of samples
7311 Stock solutions for amino acid studies
A stock solution of Na5DTPA in H2O (1 M 100 mL) was made up from a 40
wv Na5DTPA solution in H2O by dilution (2517 g into 50 mL) A stock solution of L-
alanine in H2O (1 M 200 mL) was prepared from its crystalline form Additionally a
stock solution of HDEHP in n-dodecane (3224 g in 100 mL 1 M) was prepared This
was subsequently diluted with n-dodecane to prepare stock solutions of 02 04 06 and
08 M HDEHP in n-dodecane stock solutions as well
Stock solutions
1 M Na5DTPA in H2O
1 M L-Ala in H2O
10 08 06 04 02 M HDEHP in n-dodecane
7312 [Na5DTPA] dependence SX samples for amino acid studies
5 mL aqueous samples were prepared using the stock solutions above L-alanine
solution (25 mL) was added to a calculated volume of Na5DTPA solution to produce
samples with the desired DTPA concentration (006 007 008 009 01 02 03 04
05 M) when made up to 5 mL with water The pH of samples was adjusted individually
with concentrated HNO3 and NaOH to minimise change in volume using a Mettler
Toledo Seven Compact pHion Meter 02 M HDEHP in n-dodecane was used for the
solvent extraction All samples were repeated in triplicate
7313 [HDEHP] dependence SX samples for amino acid studies
5 mL aqueous samples were prepared using the stock solutions above L-alanine
solution (25 mL) was added to a calculated volume of Na5DTPA solution to produce
samples with the desired DTPA concentration (01 02 03 04 05 M) when made up
206
to 5 mL with water The pH of samples was adjusted individually with concentrated
HNO3 and NaOH to minimise change in volume using a Mettler Toledo Seven
Compact pHion Meter 02 04 06 08 and 10 M HDEHP in n-dodecane was used for
the solvent extraction All samples were repeated in triplicate
7314 Other amino acid SX samples for amino acid studies
5 mL aqueous samples were prepared for L-His and L-Met buffered systems
The Na5DTPA stock solution (025 mL) was added to L-His (0388 g) and L-Met (0373
g) separately to make samples with concentrations of 005 M Na5DTPA and 05 M
amino acid when made up to 5 mL with water The powdered forms of the amino acids
were used due to their poor solubility The pH of samples was adjusted individually
with concentrated HNO3 and NaOH to minimise change in volume using a Mettler
Toledo Seven Compact pHion Meter 02 M HDEHP in n-dodecane was used for the
solvent extraction All samples were repeated in triplicate
7315 Stock solutions for glutathione studies
A stock solution of Na5DTPA in H2O (1 M 100 mL) was made up from a 40
wv Na5DTPA solution in H2O by dilution (2517 g into 50 mL) Additionally a stock
solution of HDEHP in n-dodecane (3224g in 100mL 1 M) was prepared This was
subsequently diluted with n-dodecane to prepare stock solutions of 02 04 06 and 08
M HDEHP in n-dodecane stock solutions as well
Stock solutions
1 M Na5DTPA in H2O
10 08 06 04 02 M HDEHP in n-dodecane
7316 [GSH] dependence SX samples without Na5DTPA
GSH (0768 g) was dissolved in water (5 mL) to make a 05 M solution The
powdered form of the peptide was used due to its poor solubility The pH of sample was
adjusted with concentrated HNO3 and NaOH to minimise change in volume using a
Mettler Toledo Seven Compact pHion Meter 02 M HDEHP in n-dodecane was used
for the solvent extraction All samples were repeated in triplicate
7317 [GSH] and pH dependence SX samples with Na5DTPA
5 mL aqueous samples were prepared for GSH buffered systems The Na5DTPA
stock solution (025 mL) was added to varying quantities of GSH to make samples with
207
concentrations of 005 M Na5DTPA and the desired concentration of GSH (01 02 03
04 05 M) when made up to 5 mL with water The pH of samples was adjusted
individually with concentrated HNO3 and NaOH to minimise change in volume using
a Mettler Toledo Seven Compact pHion Meter 02 M HDEHP in n-dodecane was used
for the solvent extraction All samples were repeated in triplicate
7318 [Na5DTPA] dependence SX samples for GSH studies
5 mL aqueous samples were prepared for GSH buffered systems GSH (0768 g)
was added to a calculated volume of Na5DTPA solution to produce samples with
concentrations of 05 M GSH and the desired DTPA concentration (005 01 02 03
04 05 06 M) when made up to 5 mL with water The pH of samples was adjusted
individually with concentrated HNO3 and NaOH to minimise change in volume using
a Mettler Toledo Seven Compact pHion Meter 02 M HDEHP in n-dodecane was used
for the solvent extraction All samples were repeated in triplicate
7319 [HDEHP] dependence SX samples for amino acid studies
5 mL aqueous samples were prepared for GSH buffered systems GSH (0768 g)
was added to a calculated volume of Na5DTPA solution to produce samples with the
concentrations of 05 M GSH and the desired DTPA concentration (03 M and 04 M)
when made up to 5 mL with water The pH of samples was adjusted individually with
concentrated HNO3 and NaOH to minimise change in volume using a Mettler Toledo
Seven Compact pHion Meter 02 04 06 08 and 10 M HDEHP in n-dodecane was
used for the solvent extraction All samples were repeated in triplicate
732 Gamma counting
2 mL of each sample was transferred into a 4 mL sample vial in duplicate One
of the duplicate sets of samples was contacted with 2 mL n-dodecane to pre-equilibrate
the aqueous phase and the other duplicate set was contacted with the stock solution of
HDEHP in n-dodecane to pre-equilibrate the organic phase All of the samples were
then shaken using a VWR Multi-Tube Vortexer for 15 minutes Samples were then
placed in a Boeco S-8 Centrifuge for 5 minutes at 5400 rpm to separate the layers
The organic phase of the pre-equilibrated aqueous phase was discarded and the
aqueous phase of the pre-equilibrated organic phase was discarded 05 mL each
retained phase was then contacted in a 2 mL sample vial in triplicate and spiked with 10
microL 241
Am or 154
Eu stock solutions (1 kBq mL-1
) Samples were then shaken again using
208
a VWR Multi-Tube Vortexer for another 30 minutes before being placed in a Boeco S-
8 Centrifuge for 5 minutes at 5400 rpm to separate the layers
300 microL of each organic phase was transferred into counting tubes and 300 microL of
each aqueous phase was transferred into separate tubes Control tubes containing 300
microL HNO3 spiked with 10 microL 241
Am or 154
Eu stock solutions (1 kBq mL-1
) were also
prepared γ counting was performed on the samples using a Packard Cobra II Gamma
Counter Results were averaged from each of the samples in triplicate
733 ICP-MS
Samples were made up as for SX samples with other amino acids for L-His and
(Section 7314) and for GSH (Section 7318) 2 mL of each sample was transferred
into a 4 mL sample vial 10 microL mixed Ln 110 stock solution (5 mgL-1
of each of La
Ce Pr Nd Sm Eu Gd Tb Dy Ho) was spiked into each sample and samples were
contacted with 2 mL HDEHP in n-dodecane (02 M) All of the samples were then
shaken using a VWR Multi-Tube Vortexer for 15 minutes Samples were then placed in
a Boeco S-8 Centrifuge for 5 minutes at 5400 rpm to separate the layers
The organic phase was discarded and 10 microL of the aqueous phase was
transferred into ICP-MS vials containing 10 mL 2 HNO3 in triplicate Control tubes
containing 10 mL 2 HNO3 spiked with 10 microL mixed Ln 110 stock solution were
also prepared ICP-MS was carried out to determine the concentration of each
lanthanide in the organic and aqueous phase Results were averaged from each of the
samples in triplicate
74 Luminescence studies and solvent extraction using glutathione at UoM
741 Preparation of luminescence samples
7411 Stock solutions for GSH studies
Stock solutions (10 mM (100 mM for Dy3+
) 10 mL) were made up for each
lanthanide (EuTbDySm) using the corresponding lanthanide nitrate salt
Ln(NO3)3xH2O in H2O or D2O as required A mixed lanthanide solution was also made
up to contain the same concentrations of each of the lanthanides above A stock solution
of Na5DTPA in H2OD2O (1 M 50 mL) was made up from a 40 wv Na5DTPA
solution in H2O by dilution (2517 g into 50 mL) Additionally a stock solution of
HDEHP in n-dodecane (3224 g in 100 mL 1 M) was prepared This was subsequently
diluted with n-dodecane to prepare stock solutions of 02 04 06 and 08 M HDEHP in
n-dodecane stock solutions as well All reagents were purchased from Sigma-Aldrich
209
Stock solutions
10 mM EuTbSm(NO3)3 in H2OD2O
100 mM Dy(NO3)3 in H2OD2O
Mixed Ln solution with 10 mM EuTbSm(NO3)3 in H2OD2O and 100 mM Dy(NO3)3
1 M Na5DTPA in H2OD2O
10 08 06 04 02 M HDEHP in n-dodecane
7412 Preparation of aqueous samples
Samples were made up using the stock solutions above in the same way as for
the solvent extraction and separation studies carried out at INL (Sections 7312 to
7319) pD was calculated using Equation 71
7413 Preparation of extracted samples
5 mL aqueous samples were prepared using the stock solutions above GSH
(0768 g) was added to a calculated volume of Na5DTPA solution to produce samples
with the concentrations of 05 M GSH and the desired DTPA concentration (varied
according to the study) when made up to 5 mL with water The mixture was pre-
equilibrated by contacting with n-dodecane and shaken using a Scientific Industries
Vortex Genie 2 Mixer and Shaker for 15 minutes The phases were allowed to separate
and the organic layer was discarded Ln(NO3)3 solution (05 mL) was added to the
aqueous phase and the pH was adjusted individually with concentrated HNO3 and
NaOH to minimise change in volume using a Mettler Toledo Seven Compact pHion
Meter pD was calculated using Equation 71 The aqueous phases were contacted with
5 mL HDEHP in n-dodecane (varied according to the study) The solutions were then
shaken again for 15 minutes left to settle and separated into the two phases for analysis
All samples were repeated in triplicate analagous to the solvent extraction samples
performed at INL
742 Radiolysis of GSH samples
Radiolysis experiments on GSH buffered systems were carried out using the
60Co irradiator at DCF These irradiations were undertaken at a later date than the initial
amino acid radiolysis studies (Section 722) using a new calibrated sample holder with
known dose rates and so preparation and use of a Fricke solution was not necessary
Samples received an average of 7 kGy γ radiation
210
75 Modified DTPA Ligands
751 Synthesis of modified DTPA ligands
L-alanine methyl ester hydrochloride (0837 g 62 mmol) was dissolved in DMF
(15 mL) and added dropwise to DTPA dianhydride (107 g 3 mmol) in DMF (75 mL)
and 3 mL triethylamine (TEA) with stirring under nitrogen in an ice bath at 0 degC The
ice bath was removed after 2 hours and the reaction was left to stir at room temperature
for 48 hours The reaction was quenched with H2O (75 mL) and the solvent evaporated
to ~10 mL The resulting yellow oil was added dropwise to acetone (100 mL) with
stirring and the product precipitated The product was collected by sinter filtration
(porosity 3) under nitrogen as a crude white powder (yield 132 g 78) It was washed
with diethyl ether (3 x 20 mL) chloroform (3 x 20 mL) and diethyl ether again (3 x 20
mL) This was then dried under vacuum to give a white micro-crystalline product
(yield 1031 g 61 ) Multiple re-precipitations were performed to reduce the amount
of associated ammonium salts in the product Samples were dried under vacuum and
freeze-dried but water and solvent impurities continued to remain present
The synthesis was repeated using L-arginine methyl ester dihydrochloride (157 g 6
mmol) L-serine ethyl ester hydrochloride (102 g 6 mmol) and L-histidine methyl ester
(145 g 6 mmol)
Yields
DTPA-(AlaOMe)2 132 g 78 (MW 56356 gmol-1
)
DTPA-(ArgOMe)2 1331 g 60 (MW 73378 gmol-1
)
DTPA-(SerOEt)2 1053 g 56 (MW 62361 gmol-1
)
DTPA-(HisOMe)2 1730 g 83 (MW 69569 gmol-1
)
752 Characterisation of modified DTPA ligands by MALDI-MS
MALDI-MS was used to characterise the synthesised ligands Samples were
dissolved in methanol for analysis These analyses confirm that the ligands are the
desired ones as the protonated monomolecular ion [M+H]+ is visible in each case The
[M+Na]+ and [M+K]
+ ions can also be found in each spectrum The range begins at mz
= 200 so it is therefore not possible to verify the presence of triethylamine (M =
10119gmol) the amino acid starting material or any solvents using this technique The
spectra show a numerous peaks indicating that the ligands have decomposed during
analysis making interpretation difficult The spectrum for DTPA-(AlaOMe)2 can be
found in Appendix 6
211
DTPA-(AlaOMe)2 mz 565 (100) [M+H]+ 587 (37) [M+Na]
+ 603 (39) [M+K]
+
DTPA-(ArgOMe)2 mz 734 (100) [M+H]+ 756 (18) [M+Na]
+ 772 (9) [M+K]
+
DTPA-(SerOEt)2 mz 624 (100) [M+H]+ 646 (60) [M+Na]
+ 662 (15) [M+K]
+
DTPA-(HisOMe)2 mz 697 (100) [M+H]+ 719 (22) [M+Na]
+ 735 (10) [M+K]
+
753 Characterisation of modified DTPA ligands by NMR spectroscopy
NMR spectroscopy was performed on ligand samples in D2O (9992 atom D
Sigma Aldrich) at 400 MHz The 1H NMR spectra of DTPA-(AlaOMe)2 with suggested
peak assignments can be found in Appendix 7
The 1H NMR spectra are difficult to interpret and assign due to the number of
peaks and their proximity to each other There are also impurities observable in the
spectra 13
C NMR spectra were also recorded and were simpler to interpret due to the
DEPT 135 spectra and enabled the quaternary CH CH2 and CH3 carbons to be
distinguished 1H NMR assignments were made using HSQC relating each peak in a
1H
spectrum to its corresponding carbon Solvent impurities were determined from known
solvent shifts (DMF acetone ethanol chloroform andor diethyl ether)3 DMF is the
most prevalent impurity due to it being the most difficult solvent to remove Some
starting material from amino acid esters can also be observed in small quantities
Triethylammonium chloride is also present in a small amount (11 ppm and 30 pmm)
7531 1H NMR Spectroscopy
1H NMR Shifts (400 mHz D2O)
DTPA-(AlaOMe)2 δ ppm 125 (d 3JHH =734 Hz 6 H H8) 311 (t
3JHH =100 Hz 4 H
H5) 323 (t 3JHH =569 Hz 4 H H4) 348 - 355 (m 2 H H6 and H7) 362 - 369 (m
4 H H2) 375 - 387 (m 4 H H3) 418 - 425 (m 2 H H1)
DTPA-(ArgOMe)2 δ ppm 154 (dq 2JHH =1449 Hz
3JHH 730 Hz 4 H H9) 169 - 189
(m 4 H H8) 302 - 317 (m 4 H H10 ) 325 (s 8 H H4 and H5) 362 (s 4 H H2)
365 (s 6 H H7) 368 (s 2 H H6) 375 - 384 (m 4 H H3) 436 - 444 (m 2 H H1)
DTPA-(SerOEt)2 δ ppm 117 (t 3JHH =706 Hz 6 H H7) 327 (s 8 H H4 and H5)
364 - 372 (m 6 H H2 and H6) 378 - 393 (m 9 H) H3 and H9) 414 (q 3JHH =706
Hz 4 H H8) 452 (dd 3JHH =479 378 Hz 2 H H1)
DTPA-(HisOMe)2 δ ppm 297 - 323 (m 12 H H4 H5 and H8) 331 (s 4 H H2) 349
(s 4 H H3) 358 (s 6 H H7) 362 (m 2 H H6) 370 - 375 (m 1 H H3) 464 - 466
(m 2 H H1) 714 (s 2 H H9) 843 (s 2 H H10)
212
Figure 71 1H NMR proton assignments for DTPA-(AlaOMe)2
Figure 72 1H NMR proton assignments for DTPA-(ArgOMe)2
Figure 73 1H NMR proton assignments for DTPA-(SerOEt)2
213
Figure 74 1H NMR proton assignments for DTPA-(HisOMe)2
7532 13
C NMR Spectroscopy
13CNMR Shifts (400 mHz D2O)
DTPA-(AlaOMe)2 δ ppm 158 (CH3 C12) 485 (CH C1) 511 (CH2 C5) 514 (CH2
C4) 529 (CH3 C7) 543 (CH2 C6) 563 (CH2 C2) 564 (CH2 C3) 1686 (q-C C9)
1718 (q-C C11) 1721 (q-C C10) 1746 (q-C C8)
DTPA-(ArgOMe)2 δ ppm 243 (CH2 C13) 275 (CH2 C12) 404 (CH2 C14) 512
(CH2 C5) 518 (CH2 C4) 523 (CH C1) 530 (CH3 C7) 548 (CH2 C6) 564 (CH2
C2) 568 (CH2 C3) 1567 (q-C C15) 1698 (q-C C9) 1716 (q-C C11) 1728 (q-C
C10) 1735 (q-C C8)
DTPA-(SerOEt)2 δ ppm 132 (CH3 C8) 512 (CH2 C5) 514 (CH2 C4) 545 (CH2
C6) 549 (CH C1) 563 (CH2 C2) 565 (CH2 C3) 607 (CH2 C13) 628 (CH2 C7)
1693 (q-C C9) 1712 (q-C C10) 1717 (q-c C11) 1723 (CH3 C8)
DTPA-(HisOMe)2 δ ppm 257 (CH2 C12) 505 (CH2 C5) 517 (CH C1) 525 (CH2
C4) 531 (CH3 C7) 551 (CH2 C6) 568 (CH2 C2) 572 (CH2 C3) 1170 (CH C14)
1286 (q-C C13) 1333 (CH C15) 1711 (q-C C9) 1714 (q-C C11) 1716 (q-C
C10) 1746 (q-C C8)
214
Figure 75 13
C NMR carbon assignments for DTPA-(AlaOMe)2
Figure 76 13
C NMR carbon assignments for DTPA-(ArgOMe)2
Figure 77 13
C NMR carbon assignments for DTPA-(SerOEt)2
215
Figure 78 13
C NMR carbon assignments for DTPA-(HisOMe)2
754 Characterisation of modified DTPA ligands by elemental analysis
Elemental analysis was also performed on the ligands for characterisation Since
the ligands do contain impurities despite several purification steps the elemental
analysis is not quite as predicted for pure samples Chlorine was found to also be
present from residual triethylammonium chloride as identified by NMR spectroscopy in
addition to residual solvents despite prolonged drying under vacuum
Table 72 Elemental analysis results for modified DTPA ligands P = predicted
proportion present () A = actual proportion present ()
C () H () N () Cl () Na ()
Ligand P A P A P A P A P A
DTPA-(AlaOMe)2
4689 4224 662 685 1243 1146 0 475 0 0
DTPA-(ArgOMe)2
4583 3896 701 637 2100 1643 0 1427 0 0
DTPA-(SerOEt)2
4622 4300 663 755 1123 1041 0 240 0 0
DTPA-(HisOMe)2
4834 3985 594 668 1812 1458 0 595 0 0
216
755 Luminescence studies with modified DTPA ligands
7551 Stock solutions
A stock solution (10 mM 10 mL) was made up for Eu(NO3)3xH2O in H2O or
D2O as required Additionally a stock solution of HDEHP in n-dodecane (1935 g in
100 mL 06 M) was prepared All reagents were purchased from Sigma-Aldrich
Stock solutions
10 mM EuTb(NO3)3 in H2OD2O
06 M HDEHP in n-dodecane
7552 Preparation of aqueous samples
2 mL samples were prepared for aqueous phases The Eu(NO3)3 stock solution
(02 mL) was added calculated quantities of each ligand to make samples with
concentrations of 1 mM Eu(NO3)3 and 005 M ligand when made up to 2 mL with H2O
or D2O The pH of samples was adjusted individually with concentrated HNO3 and
NaOH to minimise change in volume using a Mettler Toledo Seven Compact pHion
Meter pD was calculated using Equation 71
7553 Preparation of extracted samples
Aqueous samples were prepared as above (Section 7413) Due to the small
quantities of ligand available pre-equilibration was not possible as the same samples
used for aqueous phase studies were subsequently used for extraction studies The
aqueous phases were contacted with HDEHP in n-dodecane (2 mL 06 M) The
solutions were then shaken using a Scientific Industries Vortex Genie 2 Mixer and
Shaker for 15 minutes left to settle and separated into the two phases for analysis
7554 Radiolysis of ligand samples
Radiolysis experiments on modified DTPA ligand systems were carried out
using the 60
Co irradiator at DCF These irradiations were undertaken at the same time as
the GSH irradiations at a later date than the initial amino acid radiolysis studies
(Section 722) using the new calibrated sample holder with known dose rates and so
preparation and use of a Fricke solution was not necessary Samples received an average
of 7 kGy γ radiation
217
76 Instruments
761 FTS MODEL 812 System 60
Co Irradiator
All irradiations at the Dalton Cumbrian Facility were carried out using a 60
Co
irradiator which can allow multiple dose rates as it comprises two individual source
rods Radiation is generated by the decay of 60
Co to 60
Ni causing emission of β-
particles and γ-rays
Samples (5 mL for amino acid and GSH systems 2 mL for modified DTPA
ligand systems) were transferred into glass vials with plastic screw tops and placed
inside the irradiator mounted on a pre-designed rig Multiple samples were able to be
irradiated at once due to the design of the sample holder (Figure 79)
Figure 79 60
Co Irradiator at DCF (left) sample holder (top right) and sample holder
inside the irradiator (bottom right)
762 Edinburgh Instrument FP920 Phosphorescence Lifetime Spectrometer
All luminescence studies were carried out using an Edinburgh Instrument FP920
Phosphorescence Lifetime Spectrometer Steady state emission and excitation spectra
were recorded in quartz cuvettes on an Edinburgh Instrument FP920 Phosphorescence
Lifetime Spectrometer equipped with a 5 watt microsecond pulsed xenon flashlamp
(with single 300 mm focal length excitation and emission monochromators in Czerny
Turner configuration) and a red sensitive photomultiplier in peltier (air cooled) housing
(Hamamatsu R928P) Lifetime data were recorded following excitation with the
flashlamp and using time correlated single photon counting (PCS900 plug-in PC card
for fast photon counting) Lifetimes were obtained by tail fit on the data obtained
218
Table 73 Emission and excitation wavelengths for Ln3+
ions
763 Packard Cobra II Gamma Counter
Activity in separation samples prepared at the INL was measured using a Cobra
II Gamma Counter an automated gamma counter Background samples were counted in
addition in order allow correction for background radiation levels Samples run on
automated protocols run until the counting error is within 1 or the sample has run for
20 minutes
764 Bruker UltrashieldTM
400 NMR Spectrometer
NMR measurements were carried out using a Bruker UltrashieldTM
400
spectrometer of operating frequency 400 MHz (1H) and 162 MHz (
13C) with a variable
temperature unit set at 295 K unless otherwise stated The instrument was controlled
remotely using Bruker Topspin 21 software
Ln3+
Emission (nm) Excitation (nm)
Eu 617 395
Tb 545 379
Sm 600 403
Dy 575 352
219
1 CB Şenvar Chemical Dosimetry of Gamma Rays Neutrons and Accelerated
Electrons University of Ankara 1959 1-28
2 JWT Spinks and RJ Woods An Introduction to Radiation Chemistry Wiley-
Interscience Canada 3rd edn 1990
3 HE Gottlieb V Kotlyar and A Nudelman J Org Chem 1997 62 7512-7515
220
APPENDICES
APPENDIX 1 - Emission spectra for [GSH] pH dependence studies with DTPA in H2O
Figure A Emission spectra of Eu3+
in H2O at pH 2 with 005 M Na5DTPA over a GSH
concentration range of 01 ndash 05 M following excitation at 397 nm
Figure B Emission spectra of Eu3+
in H2O at pH 3 with 005 M Na5DTPA over a GSH
concentration range of 01 ndash 05 M following excitation at 397 nm
00
02
04
06
08
10
12
14
550 600 650 700
Emis
sio
n In
ten
sity
(au
) x
10
00
0
Wavelength (nm)
01 M GSH
02 M GSH
03 M GSH
04 M GSH
05 M GSH
00
02
04
06
08
10
12
14
550 600 650 700
Emis
sio
n In
ten
sity
(au
) x
10
00
0
Wavelength (nm)
01 M GSH
02 M GSH
03 M GSH
04 M GSH
05 M GSH
221
Figure C Emission spectra of Eu3+
in H2O at pH 4 with 005 M Na5DTPA over a GSH
concentration range of 01 ndash 05 M following excitation at 397 nm
00
02
04
06
08
10
12
14
550 600 650 700
Emis
sio
n In
ten
sity
(au
) x
10
00
0
Wavelength (nm)
01 M GSH
02 M GSH
03 M GSH
04 M GSH
05 M GSH
222
APPENDIX 2 - SFLnAm for varying GSH concentration over a pH range of 2-4 with
005 M Na5DTPA after extraction with 02 M HDEHP in dodecane
Figure D SFLnAm for varying GSH concentration at pH 2 with 005 M Na5DTPA after
extraction with 02 M HDEHP in dodecane
Figure E SFLnAm for varying GSH concentration at pH 3 with 005 M Na5DTPA after
extraction with 02 M HDEHP in dodecane
0
5
10
15
20
25
30
35
40
56 57 58 59 60 61 62 63 64 65 66 67 68
Sep
arat
ion
Fac
tor
Atomic Number
01 M GSH
02 M GSH
03 M GSH
04 M GSH
05 M GSH
0
50
100
150
200
250
56 57 58 59 60 61 62 63 64 65 66 67 68
Sep
arat
ion
Fac
tor
Atomic Number
01 M GSH
02 M GSH
03 M GSH
04 M GSH
05 M GSH
223
APPENDIX 3 - Natural pH values for modified DTPA ligands (005 M) with Eu(NO3)3
(1 mM)
Table F Natural pH values for modified DTPA ligands (005 M) with Eu(NO3)3 (1
mM)
Ligand Natural pH with Eu(NO3)3
DTPA-(AlaOMe)2 243
DTPA-(ArgOMe)2 238
DTPA-(SerOEt)2 240
DTPA-(HisOMe)2 286
224
APPENDIX 4 - Emission spectra for Eu(NO3)3 with modified DTPA ligands in H2O
Figure G Emission spectra for Eu(NO3)3 with modified DTPA ligands in H2O at pH 2
Figure H Emission spectra for Eu(NO3)3 with modified DTPA ligands in H2O at pH 3
0
2
4
6
8
10
12
550 575 600 625 650 675 700
Emis
sio
n In
ten
sity
(au
) x
10
00
0
Wavelength (nm)
Ala-DTPA
Arg-DTPA
Hist-DTPA
Ser-DTPA
0
2
4
6
8
10
12
14
550 575 600 625 650 675 700
Emis
sio
n In
ten
sity
(au
) x
10
00
0
Wavelength (nm)
Ala-DTPA
Arg-DTPA
Hist-DTPA
Ser-DTPA
225
Figure I Emission spectra for Eu(NO3)3 with modified DTPA ligands in H2O at pH 4
0
1
2
3
4
5
6
7
8
9
10
550 575 600 625 650 675 700
Emis
sio
n In
ten
sity
(au
) x
10
00
0
Wavelength (nm)
Ala-DTPA
Arg-DTPA
Hist-DTPA
Ser-DTPA
226
APPENDIX 5 - Emission spectra for radiolysis studies on Eu(NO3)3 in H2O with
DTPA-di(amino acid) ligands
Figure J Emission spectra for Eu(NO3)3 in H2O with DTPA-di(amino acid) ligands
(005 M) at pH 2 after irradiation with 7 kGy γ-radiation
Figure K Emission spectra for Eu(NO3)3 in H2O with DTPA-di(amino acid) ligands
(005 M) at pH 3 after irradiation with 7 kGy γ-radiation
00
05
10
15
20
25
550 575 600 625 650 675 700
Emis
sio
n In
tem
sity
(au
) x
10
00
0
Wavelength (nm)
Ala-DTPA
Arg-DTPA
Hist-DTPA
Ser-DTPA
00
05
10
15
20
25
550 575 600 625 650 675 700
Emis
sio
n In
ten
sity
(au
) x
10
00
0
Wavelength (nm)
Ala-DTPA
Arg-DTPA
Hist-DTPA
Ser-DTPA
227
Figure L Emission spectra for Eu(NO3)3 in H2O with DTPA-di(amino acid) ligands
(005 M) at pH 4 after irradiation with 7 kGy γ-radiation
00
05
10
15
20
25
550 575 600 625 650 675 700
Emis
sio
n In
ten
sity
(au
) x
10
00
0
Wavelength (nm)
Ala-DTPA
Arg-DTPA
Hist-DTPA
Ser-DTPA
228
APPENDIX 6 - MALDI-MS spectrum for DTPA-(AlaOMe)2
[M+H]+
[M+Na]+ [M+K]
+
229
AP
PE
ND
IX 7
- 1H N
MR
spectru
m fo
r DT
PA
-(AlaO
Me)
2
230
GSH1ESP
45 40 35 30 25 20 15
Chemical Shift (ppm)
01
02
03
04
05
06
07
08
09
Norm
alize
d In
tensi
ty
Water
44
944
844
6
38
9
37
6 37
437
2 28
628
628
528
4
24
924
8 24
724
624
524
4
21
1 20
920
720
5
AP
PE
ND
IX 8
- 1H N
MR
spectru
m fo
r GS
H
231
EUGSHESP
45 40 35 30 25 20 15
Chemical Shift (ppm)
01
02
03
04
05
06
07
08
09
Norm
alized Inte
nsity
Water
45
044
844
7
41
8
38
037
837
7
37
136
9
30
230
1
28
7 28
628
4
24
9 24
724
624
423
323
1
21
020
820
720
5
AP
PE
ND
IX 8
a - 1H N
MR
spectru
m fo
r Eu(N
O3 )
3 + G
SH
232

6
46 ICP-MS Studies with GSH
47 1H NMR Studies on GSH Systems
48 Summary and Conclusion of Glutathione Work
References
5 Modified DTPA Ligands as Combined Buffers and Soft Donors
in a TALSPEAK System
51 Ligand Synthesis
52 Luminescence Studies on Ligand Systems at pH 2 3 and 4
521 Aqueous Phase Studies
522 Extraction Studies
53 Radiolysis Studies on Ligand Systems at pH 2
531 Aqueous Phase Studies
532 Extraction Studies
54 Separation Work on Ligand Systems
541 AmEu Separation in Ligand Systems
542 Ln Separation in Ligand Systems
55 Summary and Conclusion of Modified DTPA Ligand
Work
References
6 Summary Conclusions and Future Work
61 Summary amp Conclusions
62 Future Work
References
7 Experimental Section
71 Chemicals and Reagents
711 Handling Radioisotopes at INL
72 Complexation studies of Ln3+
amp An3+
with amino acids in
TALSPEAK systems
721 Preparation of samples for luminescence studies
7211 Stock solutions
7212 Preparation of aqueous samples
7213 Preparation of extracted samples
163
166
170
173
174
175
176
176
179
183
183
184
185
186
187
190
191
192
192
198
200
201
201
201
201
201
201
202
202
7
722 Radiolysis of samples
7221 Preparation of Fricke solution
7222 Calculating dose rates
73 Solvent extraction and separation studies using amino
acids and glutathione at INL
731 Preparation of samples
7311 Stock solutions for amino acid studies
7312 [Na5DTPA] dependence SX samples for
amino acid studies
7313 [HDEHP] dependence SX samples for
amino acid studies
7314 Other amino acid SX samples for amino
acid studies
7315 Stock solutions for glutathione studies
7316 [GSH] dependence SX samples without
Na5DTPA
7317 [GSH] and pH dependence SX samples
with Na5DTPA
7318 [Na5DTPA] dependence SX samples for
GSH studies
7319 [HDEHP] dependence SX samples for
amino acid studies
732 Gamma counting
733 ICP-MS
74 Luminescence studies and solvent extraction using
glutathione at UoM
741 Preparation of luminescence samples
7411 Stock solutions for GSH studies
7412 Preparation of aqueous samples
7413 Preparation of extracted samples
742 Radiolysis of GSH samples
74 Modified DTPA Ligands
751 Synthesis of modified DTPA ligands
752 Characterisation of modified DTPA ligands by
MALDI-MS
203
203
203
205
205
205
205
205
206
206
206
206
207
207
207
208
208
208
208
209
209
210
210
210
210
8
753 Characterisation of modified DTPA ligands by
NMR spectroscopy
7531 1H NMR Spectroscopy
7532 13
C NMR Spectroscopy
754 Characterisation of modified DTPA ligands by
elemental analysis
755 Luminescence studies with modified DTPA
ligands
7551 Stock solutions
7552 Preparation of aqueous samples
7553 Preparation of extracted samples
7554 Radiolysis of ligand samples
76 Instruments
761 FTS MODEL 812 System 60
Co Irradiator
762 Edinburgh Instrument FP920 Phosphorescence
Lifetime Spectrometer
763 Packard Cobra II Gamma Counter
764 Bruker UltrashieldTM
400 NMR Spectrometer
References
Appendices
Appendix 1 - Emission spectra for [GSH] pH dependence
studies with DTPA in H2O
Appendix 2 - SFLnAm for varying GSH concentration over a
pH range of 2-4 with 005 M Na5DTPA after
extraction with 02 M HDEHP in dodecane
Appendix 3 - Natural pH values for modified DTPA ligands
(005 M) with Eu(NO3)3 (1 mM)
Appendix 4 - APPENDIX 4 - Emission spectra for Eu(NO3)3
with modified DTPA ligands in H2O
Appendix 5 - Emission spectra for radiolysis studies on
Eu(NO3)3 in H2O with DTPA-di(amino acid)
ligands
Appendix 6 - MALDI-MS spectrum for DTPA-(AlaOMe)2
211
211
213
215
216
216
216
216
216
217
217
217
218
218
219
220
220
222
223
224
226
228
9
Appendix 7 - 1H NMR spectrum for DTPA-(AlaOMe)2
Appendix 8 - 1H NMR spectrum for GSH
Appendix 8a - 1H NMR spectrum for Eu(NO3)3 + GSH
Total Word Count 50439
229
230
231
10
LIST OF TABLES
Table 11 Electronic properties of the lanthanides
Table 12 Electronic properties of the actinides
Table 13 Available oxidation states of the actinides and colours of
ions in solution where applicable
Table 14 Luminescence of lanthanide ions
Table 15 Luminescence of actinide ions
Table 16 Approximate compositions of SNF in Light Water
Reactors (LWR)
Table 21 Luminescence lifetimes and q values for Eu3+
with amino
acidslactate
Table 22 Luminescence lifetimes and q values for [Eu(DTPA)]2-
with amino acidslactate
Table 23 Separation factors for Eu3+
Am3+
in the presence of L-
alanine at 05 M under TALSPEAK conditions when subjected
to different doses of γ-radiation
Table 24 Luminescence lifetimes for aqueous and organic phases for
[Eu(DTPA)]2-
systems before and after irradiation at pH 36
Table 25 Luminescence lifetimes and q values for [Eu(DTPA)]2-
systems before and after irradiation at pH 36
Table 31 Distribution ratios and separation factors for a number of
L-alanine buffered TALSPEAK systems as pH and buffer
concentration are varied compared to a traditional lactic acid
system
Table 32 Distribution ratios and separation factors for a number of
amino acid buffered TALSPEAK systems
Table 33 Separation factors for L-alanine optimisation studies
Table 34 DAm values for L-alanine optimisation studies
Table 35 Separation factors and DAmEu values for traditional
TALSPEAK systems with different buffers at varying pH
values
Table 41 Eu3+
Am3+
distribution and separation for [GSH]
dependence with 005 M Na5DTPA at pH 4
11
Table 42 Eu3+
Am3+
distribution and separation for [Na5DTPA]
dependence with 05 M GSH buffer at pH 4
Table 43 Eu3+
Am3+
distribution and separation for [HDEHP]
dependence with 03 M Na5DTPA and 05 M GSH buffer at
pH 4
Table 44 Eu3+
Am3+
distribution and separation for [HDEHP]
dependence with 04 M Na5DTPA and 05 M GSH buffer at
pH 4
Table 45 Luminescence lifetimes and q values for Eu3+
with GSH at
pHD 4
Table 46 J=1J=2 peak ratios and t-test results for Eu-DTPA at pD
2-4 over a GSH concentration range of 01-05 M following
excitation at 397 nm
Table 47 Luminescence lifetimes and q values for Eu-DTPA at pH
2-4 over a GSH concentration range of 01-05 M
Table 48 J=1J=2 peak ratios and t-test results for Eu-DTPA at pH
2-4 as [GSH] is varied
Table 49 J=1J=2 peak ratios and t-test results for Eu-DTPA with
05 M GSH in D2OH2O at pDpH 4 over a Na5DTPA
concentration range of 005-06 M
Table 410 Luminescence lifetimes and q values for Eu-DTPA with
05 M GSH at pH 4 over a Na5DTPA concentration range of
005-06 M following excitation at 397 nm
Table 411 J=1J=2 peak ratios and t-test results for Eu3+
in the
aqueous phase with 05 M GSH at pH 4 as [Na5DTPA] is
varied after extraction with 02 M HDEHP
Table 412 J=1J=2 peak ratios and t-test results for Eu3+
in the
aqueous phase with 05 M GSH and 03 M Na5DTPA at pH 4
as [HDEHP] is varied after extraction
Table 413 J=1J=2 peak ratios and t-test results for Eu-DTPA with
05 M GSH in D2OH2O at pDpH 4 over a Na5DTPA
concentration range of 01-06 M after irradiation with 7 kGy
γ-radiation
12
Table 414 Luminescence lifetimes and q values for Eu-DTPA with
05 M GSH at pH 4 over a Na5DTPA concentration range of
01-06 M after irradiation with 7 kGy γ-radiation
Table 414 Luminescence lifetimes and q values for Eu-DTPA with
05 M GSH at pH 4 over a Na5DTPA concentration range of
01-06 M after irradiation with 7 kGy γ-radiation
Table 415 J=1J=2 peak ratios and t-test results for Eu3+
in the
aqueous phase with 05 M GSH and at pH 4 as [Na5DTPA] is
varied after extraction with 02 M HDEHP in dodecane from
an aqueous phase irradiated at 7 kGy γ ndashradiation
Table 416 Luminescence lifetimes for lanthanide samples at pH 4
Table 417 Luminescence lifetimes and q values for Eu3+
and Tb3+
samples at pH 4
Table 418 Luminescence lifetimes for aqueous phases before
extraction over a pH range of 2-4
Table 419 Luminescence lifetimes and q values for Eu3+
and Tb3+
samples before extraction over a pH range of 2-4
Table 420 SFLnAm for varying GSH concentration over a pH range
of 2-4 with 005 M Na5DTPA after extraction with 02 M
HDEHP in dodecane
Table 51 J=1J=2 peak ratios and t-test results for Eu- DTPA-
bis(amino ester) complexes at pD 2-4
Table 52 Luminescence lifetimes and q values for Eu-DTPA-
bis(amino ester) complexes at pD 2-4 recorded at the emission
maximum (617 nm) following 397 nm excitation
Table 53 J=1J=2 peak ratios and t-test results for organic phases
after extraction after Eu3+
extraction aqueous phases
containing DTPA-bis(amino ester) ligands (50 mM) at pH 2-4
Table 54 J=1J=2 peak ratios and t-test results for Eu-DTPA-
bis(amino ester) complexes at pD 2 after irradiation with 7
kGy γ-radiation
Table 55 Luminescence lifetimes and q values for Eu-DTPA-
bis(amino ester) complexes at pD 2-4 after irradiation with 7
kGy γ-radiation
13
Table 56 J=1J=2 peak ratios and t-test results for the organic phases
after Eu3+
extraction from aqueous phases containing DTPA-
bis(amino ester) ligands (50 mM) at pH 2 one of which had
been irradiated with 7 kGy γ-radiation
Table 57 Luminescence lifetimes and q values for the organic
phases after Eu3+
extraction from aqueous phases containing
DTPA-bis(amino ester) ligands (50 mM) at pH 2 one of which
had been irradiated with 7 kGy γ-radiation
Table 71 Dose rates received at each sample position in the 60
Co
irradiator at DCF
Table 72 Elemental analysis results for modified DTPA ligands P =
predicted proportion present () A = actual proportion
present ()
Table 73 Emission and excitation wavelengths for Ln3+
ions
14
LIST OF FIGURES
Figure 11 Jablonski diagram showing fluorescence and
phosphorescence
Figure 12 Energy transfer pathway for sensitised luminescence of
Ln3+
complexes
Figure 13 Energy level diagram showing the ground and excited
states of a selection of lanthanides and vibrational oscillators
Figure 14 The energy gaps between the lowest emissive states and
ground states of a selection of lanthanides and actinides
Figure 15 Chain reaction generated by fission of 235
U into 92
Kr and
141
Ba
Figure 16 The Nuclear Fuel Cycle
Figure 17 Chemical structure of TBP (Tri-nbutyl phosphate)
Figure 18 PUREX flow diagram
Figure 19 Chemical structure of CMPO (NN-diisobutyl-2-
(octyl(phenyl)phosphoryl)acetamide)
Figure 110 TRUEX flow diagram
Figure 111 Chemical structure of DMDBTDMA
Figure 112 Chemical structure of DMDOHEMA
Figure 113 Example DIAMEX flow diagram
Figure 114 General chemical structure of BTPs
Figure 115 Chemical structure of TODGA
Figure 116 Chemical structure of HEDTA
Figure 117 SANEX flow diagram for TODGA process
Figure 118 General chemical structure of BTBPs
Figure 119 Chemical structure of CyMe4-BTBP
Figure 120 Chemical structure of CyMe4-BTPhen
Figure 121 GANEX flow diagram
Figure 122 Chemical structure of TRPO
Figure 123 Chemical structure of CYANEX 301
Figure 124 Chemical structure of TTHA
Figure 125 TRPO flow diagram using TTHA
Figure 126 TRPO flow diagram using HNO3 and oxalic acid
Figure 127 LUCA flow diagram
15
Figure 128 Chemical structure of TEDGA
Figure 129 Chemical structure of DTPA
Figure 130 Chemical structure of HDEHP
Figure 131 Chemical structure of HEH[ϕP]
Figure 132 Chemical structure of lactic acid pKa = 386
Figure 133 The solvent extraction process used in TALSPEAK Step
1 Binding of DTPA to M3+
in the aqueous phase at pH 36
buffered by lactic acid Step 2 Selective extraction of Ln3+
into the organic phase by HDEHP from the aqueous phase due
to preferential binding of DTPA to MA3+
Figure 134 Effect of Na5DTPA concentration on distribution ratios
of MA3+
and Ln3+
in TALSPEAK process using 1 M lactate
buffer and 03 M HDEHP in DIPB extractant
Figure 135 TALSPEAK flow diagram
Figure 21 XAS molecular structure of Gd(III)-DTPA
Figure 22 Chemical structure of [Eu(DTPA)]2-
Figure 23 1H NMR spectrum of [Eu(DTPA)]
2- in D2O at 278 K at
pD = 36
Figure 24 1H NMR spectra of DTPA in D2O at 278 K at varying pD
a) pD 7 [DTPA]5-
b) pD 36 [H3DTPA]2-
c) pD 2 [H5DTPA]
Figure 25 Emission spectrum of Eu3+
(aq) and [Eu(DTPA)]2-
in D2O
at pD 36
Figure 26 1H NMR spectrum for [Am(DTPA)xH2O]
2- in 41 vv
MeODD2O with NaOD over a temperature range at pH 3
Figure 27 Emission spectrum of Cm3+
and [Cm(DTPA)]2-
in
perchloric acid at pH 3 by direct excitation with a NdYAG
pumped dye laser at 3966 nm
Figure 28 Emission spectrum of Eu-lactate as a function of lactate
concentration
Figure 29 Co-ordination mode of lactate to Eu3+
Figure 210 Chemical structures of L-alanine (top) glycine (bottom
left) and L-serine (bottom right)
Figure 211 1H NMR spectrum of Eu(NO3)3xH2O (10 mM) with L-
alanine in D2O at 278 K
16
Figure 212 1H NMR spectrum of L-alanine in D2O at 278 K
Figure 213 1H NMR spectrum of [Eu(DTPA)]
2- (10 mM) with L-
alanine (1 M) in D2O at 278 K
Figure 214 Emission spectra of [Tb(DTPA)]2-
in D2O at pD 3 with
and without the presence of L-phenylalanine (05 M) excited at
250 nm and 379 nm Excitation spectrum of [Tb(DTPA)]2-
in
D2O at pD 3 with L-phenylalanine (05 M) at 545 nm
Figure 215 Chemical structure of L-phenylalanine
Figure 216 Emission spectra of Eu(NO3)3 in D2O at pD 36 with and
without the presence of amino acidslactate (1 M) excited at
395 nm at 298 K
Figure 217 Emission spectra of Eu-DTPA in D2O at pD 36 with and
without the presence of amino acidslactate (1 M) excited at
395 nm
Figure 218 Emission spectrum of [Cm(DTPA)]2-
in H2O with and
without L-alanine (25 mM) at pH 3 by direct excitation at 396
nm
Figure 219 Graph illustrating the rates of reaction of the middotOH radical
with L-alanine compared to lactic acid and the lactate ion
Figure 220 Distribution ratios for Ln3+
and Am3+
in the presence of
L-alanine at 05 M pH 2 at different doses of γ-radiation
Figure 221 Emission spectra of Eu3+
in D2O at pD 36 with and
without the presence of amino acidslactate excited at 395 nm
before 5 kGy γ-irradiation
Figure 222 Emission spectra of Eu3+
in D2O at pD 36 with and
without the presence of amino acidslactate excited at 395 nm
after 5 kGy γ-irradiation
Figure 31 The effect of pH on an L-alanine-buffered TALSPEAK
system
Figure 32 Distribution ratios of Ln3+
Y3+
in a TALSPEAK system 1
mM LnY3+
1 M lactate 005 M DTPA pH 7 extracted using
05 M HDEHP in 14-DIPB
Figure 33 The effect of buffer concentration on an L-alanine-
buffered TALSPEAK system
17
Figure 34 Chemical structures of L-arginine (top) L-histidine
(bottom left) and L-methionine (bottom right)
Figure 35 DTPA speciation as a function of pH modelled using
HySS sofware using literature pKa values
Figure 36 [Na5DTPA] dependence of L-alanine system (05 M) at
pH 2
Figure 37 Eu3+
Am3+
separation for [Na5DTPA] dependence of L-
alanine system (05 M) at pH 2
Figure 38 Eu3+
Am3+
separation for [HDEHP] dependence of L-
alanine system (05 M) at pH 2 using 02 M Na5DTPA
Figure 39 Eu3+
Am3+
separation for [HDEHP] dependence of L-
alanine system (05 M) at pH 2 using 03 M Na5DTPA
Figure 310 Eu3+
Am3+
separation for [HDEHP] dependence of L-
alanine system (05 M) at pH 2 using 04 M Na5DTPA
Figure 311 Distribution ratios of La3+
-Ho3+
and Am3+
with 05 M L-
histidine buffer at pH 2 and pH 3
Figure 41 Molecular structures of eisenin (top) and norophthalmic
acid (bottom)
Figure 42 Molecular structures of biotinvitamin B7 (top) and folic
acid vitamin B9 (bottom)
Figure 43 Molecular structure of L-glutathione (reduced form)
Figure 44 Eu3+
Am3+
distribution for [GSH] dependence with 005
M Na5DTPA at pH 2 extracted using 02 M HDEHP in
dodecane Results were averaged from 3 repeat tests
Figure 45 Eu3+
Am3+
distribution for [GSH] dependence with 005
M Na5DTPA at pH 3 extracted using 02 M HDEHP in
dodecane Results were averaged from 3 repeat tests
Figure 46 Eu3+
Am3+
distribution for [GSH] dependence with 005
M Na5DTPA at pH 4 Results were averaged from 3 repeat
tests
Figure 47 GSH speciation as a function of pH modelled using
HySS software using literature pKa values
Figure 48 H2GSH- species dominant in solution at pH 4
18
Figure 49 A ternary Nd DO3A-pyrazine amine carboxylate complex
reported by Faulkner at al (left) and anticipated bidentate
chelation of GSH with Am-DTPA at pH 4 (right)
Figure 410 Eu3+
and Am3+
distribution for [Na5DTPA] dependence
with 05 M GSH buffer at pH 4 curves fitted as polynominal
order 2 for both Am3+
and Eu3+
Results were averaged from 3
repeat tests
Figure 411 Eu3+
and Am3+
distribution for [HDEHP] dependence
with 03 M Na5DTPA and 05 M GSH buffer at pH 4 curve
for Eu3+
fitted as polynominal order 2 linear correlation for
Am3+
Results were averaged from 3 repeat tests
Figure 412 Eu3+
and Am3+
distribution for [HDEHP] dependence
with 04 M Na5DTPA and 05 M GSH buffer at pH 4 linear
correlation for both Am3+
and Eu3+
Results were averaged
from 3 repeat tests
Figure 413 Corrected emission spectra of Eu(NO3)3 (1 mM)
Eu(NO3)3 with GSH (05 M) and Eu(NO3)3 with Na5DTPA
(005 M) in H2O following excitation at 397 nm
Figure 414 Emission spectra of Eu(NO3)3 in H2O at pH 4 over a
GSH concentration range of 01 ndash 05 M following excitation
at 397 nm
Figure 415 Emission spectra of Eu(NO3)3 in D2O at pH 4 over a
GSH concentration range of 01 ndash 05 M following excitation
at 397 nm
Figure 416 Emission spectra of aqueous and organic phases after
Eu3+
extraction at pH 4 using a GSH concentration range of
01 ndash 05 M following excitation at 397 nm
Figure 417 Emission spectra of Eu3+
in D2O at pD 2 with 005 M
Na5DTPA over a GSH concentration range of 01 ndash 05 M
following excitation at 397 nm
Figure 418 Emission spectra of Eu3+
in D2O at pD 3 with 005 M
Na5DTPA over a GSH concentration range of 01 ndash 05 M
following excitation at 397 nm
19
Figure 419 Emission spectra of Eu3+
in D2O at pD 4 with 005 M
Na5DTPA over a GSH concentration range of 01 ndash 05 M
following excitation at 397 nm
Figure 420 Emission spectra of aqueous phases after Eu3+
extraction
at pH 2-4 over a GSH concentration range of 01-05 M
following excitation at 397 nm
Figure 421 Emission spectra of organic phases after Eu3+
extraction
at pH 2-4 over a GSH concentration range of 01-05 M
following excitation at 397 nm
Figure 422 Emission spectra of Eu(NO3)3 in D2O at pD 4 with 05
M GSH over a Na5DTPA concentration range of 005 ndash 06 M
following excitation at 397 nm
Figure 423 Emission spectra of Eu(NO3)3 in H2O at pH 4 with 05
M GSH over a Na5DTPA concentration range of 005 ndash 06 M
following excitation at 397 nm
Figure 424 Emission spectra of aqueous and organic phases after
Eu3+
extraction with 05 M GSH at pH 4 over a Na5DTPA
concentration range of 005-06 M following excitation at 397
nm
Figure 425 Emission spectra of aqueous phases after Eu3+
extraction
with 05 M GSH and 03 M Na5DTPA at pH 4 over an
HDEHP concentration range of 02-10 M following
excitation at 397 nm
Figure 426 Emission spectra of organic phases after Eu3+
extraction
with 05 M GSH and 03 M Na5DTPA at pH 4 over an
HDEHP concentration range of 02-10 M following
excitation at 397 nm
Figure 427 Emission spectra of Eu(NO3)3 in H2O at pH 4 with 05
M GSH over a Na5DTPA concentration range of 005 ndash 06 M
after irradiation with 7 kGy γ-radiation following excitation at
397 nm
Figure 428 Emission spectra of aqueous and organic phases after
Eu3+
extraction from irradiated aqueous phase at pH 4
containing 05 M GSH over a Na5DTPA concentration range
of 01-06 M
20
Figure 429 Emission spectra of Dy(NO3)3 Dy-DTPA and Dy(NO3)3
with GSH in H2O following excitation at 352 nm Note that
the tail of ligand emission can be seen in the Dy DTPA and
Dy GSH solutions at shorter wavelengths
Figure 430 Emission spectra of aqueous and organic phases of
Dy(NO3)3 Dy-DTPA and Dy(NO3)3 with GSH after extraction
with 10 M HDEHP following excitation at 352 nm
Figure 431 Emission spectra of aqueous and organic phases of
Dy(NO3)3 Dy-DTPA and Dy(NO3)3 with GSH after extraction
with 10 M HDEHP following 352 nm excitation
Figure 432 Emission spectra of Ln(NO3)3 (1 mM EuTbSm3+
10
mM Dy3+
) in H2O at pH 4 following direct excitation (405 nm
for Sm3+
397 nm for Eu3+
366 nm for Tb3+
and 352 nm for
Dy3+
)
Figure 433 Emission spectra of Ln(NO3)3 (1 mM EuTbSm3+
10
mM Dy3+
) with GSH (05 M) at pH 4 in H2O following direct
excitation (405 nm for Sm3+
397 nm for Eu3+
366 nm for Tb3+
and 352 nm for Dy3+
)
Figure 434 Emission spectra of Ln-DTPA (1 mM EuTbSm3+
10
mM Dy3+
005 M Na5DTPA) in H2O at pH 4 following direct
excitation (405 nm for Sm3+
397 nm for Eu3+
366 nm for Tb3+
and 352 nm for Dy3+
)
Figure 435 Emission spectra of Ln(NO3)3 (1 mM EuTbSm3+
10
mM Dy3+
) with GSH (05 M) and Na5DTPA (005 M)
following direct excitation (405 nm for Sm3+
397 nm for Eu3+
366 nm for Tb3+
and 352 nm for Dy3+
)
Figure 436 Emission spectra of aqueous and organic phases of Ln3+
with 05 M GSH and 005 M Na5DTPA after extraction with
10 M HDEHP at pH 2 following direct excitation (405 nm for
Sm3+
397 nm for Eu3+
366 nm for Tb3+
and 352 nm for Dy3+
)
Figure 437 Emission spectra of aqueous and organic phases of Ln3+
with 05 M GSH and 005 M Na5DTPA after extraction with
10 M HDEHP at pH 3 following direct excitation (405 nm for
Sm3+
397 nm for Eu3+
366 nm for Tb3+
and 352 nm for
Dy3+
)
21
Figure 438 Emission spectra of aqueous and organic phases of Ln3+
with 05 M GSH and 005 M Na5DTPA after extraction with
10 M HDEHP at pH 4 following direct excitation (405 nm for
Sm3+
397 nm for Eu3+
366 nm for Tb3+
and 352 nm for
Dy3+
)
Figure 439 DLn for varying GSH concentration at pH 2 with 005 M
Na5DTPA after extraction with 02 M HDEHP in dodecane
Figure 440 DLn for varying GSH concentration at pH 3 with 005 M
Na5DTPA after extraction with 02 M HDEHP in dodecane
Figure 441 1H NMR spectra for GSH in D2O under a range of
conditions at 298 K a) GSH b) GSH after irradiation with 7
kGy γ-radiation c) Eu(NO3)3 with GSH d) GSH with
Na5DTPA e) Eu-DTPA with GSH
Figure 442 1H
1NMR proton assignments for GSH (top) and γ-Glu-
Cys (bottom)
Figure 51 General structure of DTPA-amino acid ligands
Figure 52 Emission spectra of Eu(NO3)3 with DTPA-bis(amino
ester) ligands in D2O at pD 2 following excitation at 397 nm
Figure 53 Emission spectra of Eu(NO3)3 with DTPA-bis(amino
ester) ligands in D2O at pD 3 following excitation at 397 nm
Figure 54 Emission spectra of Eu(NO3)3 with DTPA-bis(amino
ester) ligands in D2O at pD 4 following excitation at 397 nm
Figure 55 Emission spectra of aqueous phases after Eu3+
extraction
from an aqueous phase containing DTPA-bis(amino ester)
ligands (50 mM) at pH 2 following excitation at 397 nm
Figure 56 Emission spectra of aqueous and organic phases after Eu3+
extraction from an aqueous phase containing DTPA-bis(amino
ester) ligands (50 mM) at pH 2 following excitation at 397
nm
Figure 57 Emission spectra of aqueous and organic phases after Eu3+
extraction from an aqueous phase containing DTPA-bis(amino
ester) ligands (50 mM) at pH 3 following excitation at 397
nm
22
Figure 58 Emission spectra of aqueous and organic phases after Eu3+
extraction from an aqueous phase containing DTPA-bis(amino
ester) ligands (50 mM) at pH 4 following excitation at 397
nm
Figure 59 Emission spectra of Eu(NO3)3 in D2O with DTPA-
bis(amino ester) ligands (50 mM) at pH 2 after irradiation
with 7 kGy γ- radiation and following excitation at 397 nm
Figure 510 Emission spectra of aqueous and organic phases after
Eu3+
extraction from an irradiated (7 kGy γ-radiation) aqueous
phase containing DTPA-bis(amino ester) ligands (50 mM) at
pH 2 following excitation at 397 nm
Figure 511 Separation factors and distribution ratios for Eu3+
Am3+
using DTPA-(ArgOMe)2 (005 M) at pH 1-2 extracted using
HDEHP (02 M) in kerosene
Figure 512 Separation factors and distribution ratios for Eu3+
Am3+
using DTPA-(SerOEt)2 (005 M) at pH 1-2 extracted using
HDEHP (02 M) in kerosene
Figure 513 Separation factors and distribution ratios for Eu3+
Am3+
using DTPA-(HisOMe)2 (005 M) at pH 1-2 extracted using
HDEHP (02 M) in kerosene
Figure 514 Distribution ratios for Ln3+
using DTPA-(ArgOMe)2
(005 M) at pH 1-2 extracted using HDEHP (02 M) in
kerosene
Figure 515 Distribution ratios for Ln3+
using DTPA-(SerOEt)2 (005
M) at pH 1-2 extracted using HDEHP (02 M) in kerosene
Figure 516 Distribution ratios for Ln3+
using DTPA-(HisOMe)2
(005 M) at pH 1-2 extracted using HDEHP (02 M) in
kerosene
Figure 61 Chemical structures of amino acids
Figure 71 1H NMR proton assignments for DTPA-(AlaOMe)2
Figure 72 1H NMR proton assignments for DTPA-(ArgOMe)2
Figure 73 1H NMR proton assignments for DTPA-(SerOEt)2
Figure 74 1H NMR proton assignments for DTPA-(HisOMe)2
Figure 75 13
C NMR carbon assignments for DTPA-(AlaOMe)2
Figure 76 13
C NMR carbon assignments for DTPA-(ArgOMe)2
23
Figure 77 13
C NMR carbon assignments for DTPA-(SerOEt)2
Figure 78 13
C NMR carbon assignments for DTPA-(HisOMe)2
Figure 79 60
Co Irradiator at DCF (left) sample holder (top right)
and sample holder inside the irradiator (bottom right)
24
ABSTRACT
The University of Manchester
Madeleine Hilton Langford Paden
PhD
Development of a Simplified Soft-Donor Technique for Trivalent Actinide-Lanthanide
Separations
2015
The necessity of reprocessing spent nuclear fuel has arisen from increasing
awareness and concern for the environment in addition to the potential of minimising
proliferation A number of different reprocessing techniques are currently being
developed around the world to allow useful spent nuclear fuel (SNF) to be recycled and
reused and the remaining waste to be treated One such technique currently being
developed in the USA is the TALSPEAK process an advanced reprocessing method for
the separation of trivalent lanthanide (Ln3+
) and minor actinide (MA3+
) components
This process developed in the 1960s at Oak Ridge National Laboratory uses DTPA to
act as a holdback reagent for MA3+
in a lactate buffered aqueous phase at pH 36
allowing Ln3+
to be selectively extracted by organophosphate HDEHP into an organic
phase of DIPB or dodecane
TALSPEAK is one of the most promising techniques being researched due to its
numerous advantages particularly its relative resistance to radiolysis and its ability to
be carried out without the need for high reagent concentrations Additionally it gives
high separation factors in the region of ~50-100 comparable to other advanced
reprocessing methods under development The chemistry of the process is very complex
and not particularly well understood so it would be advantageous to simplify the process
by removing the need for a separate holdback reagent and buffer
In collaboration with colleagues at the Idaho National Lab the use of amino
acids as a potential combined buffer and soft donor was investigated Although it was
found that amino acids do not act as holdback reagents in their own right optimisation
of an L-alanine buffered TALSPEAK system with DTPA was found to allow the
process to be carried out effectively at a lower pH of 2 which is more preferable for
industrial application
As an extension of this separation studies were carried out using the tripeptide
L-glutathione (GSH) to determine its potential for use as a combined buffer and soft-
donor As with the studies with amino acids it was found that GSH also does not act as
a holdback reagent in its own right however it does interact with Ln-DTPA complexes
at pH 4 When optimised at this pH separation factors of up to 1200 were achieved for
Eu3+
Am3+
whilst still maintaining low MA3+
partitioning However further studies by
ICP-MS and luminescence spectroscopy showed that a GSH buffered system was not
effective for extraction of heavier lanthanides although the results show the potential
for further investigation into other short and longer chain peptide buffered systems and
possibly lanthanide-lanthanide separations
Further studies were carried on amino acid appended DTPA ligands which were
synthesised in a one step reaction in order to create a combined buffer and soft donor
The ligands were found to self-buffer at around pH 2 and allow successful separation of
Eu3+
Am3+
(SF ~ 100) The results from initial investigations by luminescence
spectroscopy and solvent extraction are promising and are presented here Further work
is needed on these systems in order to optimise their extraction capability and minimise
Am3+
partitioning In the future this work could promote studies for better
understanding of TALSPEAK chemistry that could be used in industrial partitioning
processes
25
DECLARATION
No portion of the work referred to in the thesis has been submitted in support of an
application for another degree or qualification of this or any other university or other
institute of learning
26
COPYRIGHT STATEMENT
The author of this thesis (including any appendices andor schedules to this thesis) owns
certain copyright or related rights in it (the ldquoCopyrightrdquo) and she has given The
University of Manchester certain rights to use such Copyright including for
administrative purposes
ii Copies of this thesis either in full or in extracts and whether in hard or electronic
copy may be made only in accordance with the Copyright Designs and Patents Act
1988 (as amended) and regulations issued under it or where appropriate in accordance
with licensing agreements which the University has from time to time This page must
form part of any such copies made
iii The ownership of certain Copyright patents designs trade marks and other
intellectual property (the ldquoIntellectual Propertyrdquo) and any reproductions of copyright
works in the thesis for example graphs and tables (ldquoReproductionsrdquo) which may be
described in this thesis may not be owned by the author and may be owned by third
parties Such Intellectual Property and Reproductions cannot and must not be made
available for use without the prior written permission of the owner(s) of the relevant
Intellectual Property andor Reproductions
iv Further information on the conditions under which disclosure publication and
commercialisation of this thesis the Copyright and any Intellectual Property andor
Reproductions described in it may take place is available in the University IP Policy
(see httpdocumentsmanchesteracukDocuInfoaspxDocID=487) in any relevant
Thesis restriction declarations deposited in the University Library The University
Libraryrsquos regulations (see httpwwwmanchesteracuklibraryaboutusregulations) and
in The Universityrsquos policy on Presentation of Theses
27
ACKNOWLEDGEMENTS
Firstly I would like to thank my University supervisors Dr Louise Natrajan and
Dr Clint Sharrad for their support and encouragement during my PhD and for their help
and guidance when needed I would also like to thank Dr Leigh Martin my industrial
supervisor at the Idaho National Lab for the opportunity to work there and gain valuable
new experience
For all of his help in the lab general advice and knowledge on the TALSPEAK
process I would particularly like to thank Dr Travis Grimes from the INL - I could not
have done it without you - and for much of the help and advice I received in
Manchester (as well as lending an ear when I needed to vent) I would like to thank Dr
Adam Swinburne
Thank you also to Dr Andreas Geist for conducting some separation studies for
me at KIT-INE Your contributions have been very valuable and I am most grateful for
all of your help
Sarah Hendley Kevin Beal Andrew Alker and Adrien Moll as Masters and
placement students have helped with various parts of the work in this thesis and
deserve great thanks for their contributions Additionally thank you to Dr Michael
Andrews for helping Adrien so much in the lab whilst I was finishing off my
experiments and beginning to write up my thesis I appreciate the time you spent even
though you had so much to do yourself
Further thanks to Prof Simon Pimblott Greg Horne and Logan Barr for
accommodating me and my Masters students at DCF for irradiation studies and to Greg
especially for giving up your precious time to help us
Dr Tamara Griffiths and Dr Catherine Riddle made working in the lab at the
INL a very enjoyable experience for me and kept me sane and encouraged in times of
desperation Many thanks to you wonderful ladies Also thank you to the Aqueous
Separations and Radiochemistry group (Jack Leigh Peter Travis Rocky Dean Cathy
Bruce Guy and Brandi) Terry Todd and other staff at the INL (Steve Chris Jake all
of the radcons the Analytical group and other placement students) who likewise made
me feel very welcome in a place so far from home
I would additionally like to thank Teams NatrajanMillsSharrad (Sean Adam
Simon Lucy Lizzie Debbie Chloe Mike Pete Kathryn Toria Jen (honorary
member) Dr David Mills Ally Conrad Aruna Helen Tamara Kate Dan Chris
Dave Charles Peter Zana Rich Hugues and Tim) and the Centre for Radiochemistry
28
Research at the University of Manchester for general lab help and support and for
making Manchester a great place to work And to my conference buddies Tamara
Debbie Kate and Adam for making conferences as much about the social side as the
work
Thank you to the INL KIT and Diamond Light Source for the opportunities to
carry out work using their specialist equipment and to Dr Louise Natrajan Dr Sean
Woodall Dr Daniel Whittaker Dr Tamara Griffiths Dr Clint Sharrad Dr Leigh Martin
and Dr Travis Grimes for helping with some of the work carried out
I could not have done this PhD without funding from Batelle Energy Alliance
through the INL and the University of Manchester so thank you
On a personal note a big thank you to Steph my room mate for making my 9
months living in Idaho so much fun And also to Cathy and Glen Shelby Natalie and
Leigh and Marie for all the fun times too Lastly but not least I would like to give huge
thanks to my (non-chemistry non-Idaho) friends and family for their support over the
past 4 years especially my wonderful husband Lee - youre amazing and my rock as
always - and my parents for everything over the past 26 years
It was worth it in the end
29
LIST OF SYMBOLS amp UNITS
gt greater than
˂ less than
plusmn plus or minus
percent
degC degrees Celsius
α alpha
β beta
γ gamma
δ chemical shift
Δ change in
ε molar extinction coefficient
λ wavelength
microL microlitres
micros microseconds
ρ density
τ lifetime
ν frequency
ν= energy level
wavenumber
Aring angstroms
A proportionality constant for q taking into account the
inner hydration sphere
ABS optical density difference between ODi and ODb
amu atomic mass units
au arbitrary units
B correction factor for q taking into account the outer
hydration sphere
Bq Becquerel
cm centimetres
D (pD D2O MeOD) deuterium
dm3 decimetres cubed (litres)
E energy
F Faradays constant
30
g grams
G critical dose value
Gy Gray
h Plancks constant
Hz Hertz
J Joules
J= rotational energy level
K Kelvin
kBq kiloBecquerel
kg kilograms
kGy kiloGray
kJ kiloJoules
L litres
log β stability constant
M molar (moldm-3
)
mg milligrams
MHz megaHertz
min minute(s)
mL millilitres
mm millimetres
mM millimolar
mol moles
mmol millimoles
ms milliseconds
ng nanograms
nm nanometres
ns nanoseconds
ODi optical density of irradiated solution
ODb optical density of non-irradiated control solution
ppm parts per million
s seconds
t time
Zeff effective nuclear charge
31
LIST OF ABBREVIATIONS amp ACRONYMS
An actinides
aq aqueous
BT nack-energy Transfer
BTBP bis-triazinbipyridine
BTP bis-triazinylpyridine
CEA Commissariat agrave lrsquoEacutenergie Atomique et aux Eacutenergies
Alternatives
CE-ICP-MS capillary electrophoresis ndash inductively coupled plasma ndash
mass spectrometry
cf confer Latin compare
CMPO carbomoylmethylphosphine oxide
CP corrosion products
CYANEX 301 bis(244-trimethylpentyl)phosphinodithioic acid
CyMe4-BTBP 66-bis(5588-tetramethyl-5678-tetrahydrobenzo
[e][124]triazin-3-yl)-22-bipyridine
D distribution ratio
DCF Dalton Cumbrian Facility
DEPT distortionless enhancement by polarization transfer
DFT density functional theory
DIAMEX DIAMide EXtraxtion
DIPB diisopropyl benzene
DMDBTDMA dimethyldibutyltetradecylmalonamide
DMDOHEMA dimethyldicotylhexylethoxymalonamide
DMF dimethylformamide
DNA deoxyribonucleic acid
DO3A 147 tris(carboxymethyl) 14710 tetraazacyclododecane
DOTA 14710-tetraazacyclododecane-14710-tetraacetic acid
DTPA diethylenetriaminepentaacetic Acid
EC electron capture
EDTA ethylenediaminetetraacetic acid
eg exempli gratia Latin for example
ET electron transfer
32
et al et alli Latin and others
EURACT-NMR Transnational Access to Unique European Actinide and
Radiological NMR Facilities
EXAm EXtraction of Americium
FP fission products
GANEX Grouped ActiNide EXtraction
GSH glutathione
HDEHP (di-(2ethylhexyl)phosphoric acid
HEH[ΦP] (2-ethylhexyl)phenylphosphonic acid
HEH[EHP] (2-ethylhexyl)phosphonic acid mono-2-ethylhexyl ester
HEDTA (2-hydroxyethyl) ethylenediaminetatraacetic acid
HSQC heteronuclear single quantum correlation
I ionic strength
IC internal conversion
ICP-MS inductively coupled plasma ndash mass spectrometry
ie id est Latin that is
INL Idaho National Laboratory
IR infra-red
iSANEX Innovative SANEX
ISC inter-system crossing
KIT-INE Karlsruhe Institute of Technology - Institut fuumlr Nukleare
Entsorgung (Institute for Nuclear Waste Disposal)
Lac lactate
LASER light amplification by stimulated emission of radiation
LINAC linear accelerator
Ln lanthanides
LUCA Lanthaniden Und Curium Americium trennung
LWR light water reactor
M metal
MA minor actinides
MALDI-MS matrix-assisted laser desorption ionization mass
spectrometry
MOX mixed oxide
MRI magnetic resonance imaging
Nd-YAG neodymium-yttrium aluminium garnet
33
nIR near-infra-red
NMR nuclear magnetic resonance
NPH normal paraffinic hydrocarbon
NR non-radiative decay
org organic
PPE personal protective equipment
PUREX Plutonium and Uranium Refinement by EXtraction
q number of solvent molecules in the inner hydration sphere
SANEX Selective ActiNide EXtraction
SF separation factor
SNF spent nuclear fuel
SX solvent extraction
TALSPEAK Trivalent Actinide Lanthanide Separation by Phosphorus
reagent Extraction from Aqueous Complexation
TALSQuEAK Trivalent Actinide Lanthanide Separation using Quicker
Extractants and Aqueous Complexes
TBP tributyl phosphate
TEA triethylamine
TEDGA NNNrsquoNrsquo-tetraethyl-diglycolamide
TEHP tris(2-ethylhexyl)phosphate
TM transition metals
TODGA tetraoctyldiglycolamide
TPH tetrapropylene hydrogenated
TRLFS time-resolved LASER-induced fluorescence spectrocopy
TRPO trialkylphosphine oxide
TRUEX TRans-Uranic EXtraction
TTHA triethylenetetramine hexaacetate
SF spontaneous fission
SNF spent nuclear fuel
UoM The University of Manchester
UV ultra-violet
UV-vis ultra-violet-visible
vs versus Latin against
XAS x-ray absorption spectroscopy
34
AMINO ACID ABBREVIATIONS
Amino Acid 3 Letter Abbreviation
Alanine Ala
Arginine Arg
Asparagine Asn
Aspartic acid Asp
Cysteine Cys
Glutamic Acid Glu
Glutamine Gln
Glycine Gly
Histidine His
Isoleucine Ile
Leucine Leu
Lysine Lys
Methionine Met
Phenylalanine Phe
Proline Pro
Serine Ser
Threonine Thr
Tryptophan Trp
Tyrosine Tyr
Valine Val
35
1 INTRODUCTION
11 The Actinides and Lanthanides
111 Background
The ldquorare earthrdquo or lanthanide elements (Ln) can be found between barium and
hafnium in the periodic table in the first of the two rows containing the f-block
elements The f-block elements are all metallic and have 4f or 5f valence electron
subshells the lanthanides Ce-Lu are also often referred to as the ldquo4frdquo elements1
Although often considered to be part of the lanthanide series lanthanum is not usually
considered to be a ldquo4frdquo element as it has no f-electrons The 4f elements all have
relatively high abundances despite often being termed the ldquorare earthrdquo elements except
for promethium (Pm) which is radioactive and does not occur in nature2 All of the 4f
elements except promethium were discovered and had all successfully been isolated by
the early 20th
century Promethium was not discovered until 19473
The actinide elements (An) can be found between radium and rutherfordium in
the periodic table and are also known as the 5f elements as their valence shell is the 5f
shell They are all radioactive as none of them have any stable isotopes Although often
considered to be part of the actinide series actinium is not usually considered to be a
ldquo5frdquo element due to its electronic configuration of 5f 0 Despite this thorium which also
has a ground state electronic configuration of 5f 0 is considered to be a 5f element The
first actinide element to be discovered was uranium which was discovered in 1789 by
Klaproth in the mineral pitchblende Thorium and protactinium had also both been
discovered by 1913 but the later actinides were not synthesised until the Second World
War initially by Seaborg4
112 Sources of the Lanthanides and Actinides
The naturally occurring lanthanide elements are found in two minerals
primarily monazite and bastnaumlsite which are ores of mixed lanthanide metals and have
the general formulae LnPO4 and LnCO3F respectively Monazite also contains
radioactive thorium so is the less favourable of the two sources of lanthanides
commercially5
Ac Th Pa and U are the only naturally occurring actinide (An) elements
Uranium is less abundant than thorium (24 ppm vs 81 ppm) in the Earthrsquos crust but is
found in numerous minerals in oxide form including pitchblende (uraninite) and
36
carnotite Protactinium is one of the rarest elements in the world and is found at trace
levels in some uranium ores
The remaining 11 (Np-Lr) elements in the An series must be synthesised
Neptunium to fermium can be synthesised by neutron bombardment whereby a neutron
is captured by a heavy element atom and a γ-ray is emitted This is followed by the
emission of a β- particle in a β
- decay process to form a new element with an increased
atomic mass (see Scheme 11) However as this is a relatively improbable process
synthesis of the heaviest elements is impossible by this method and so synthesis of the
heavier elements is carried out by bombardment with light atoms although again this is
also an unfavourable reaction6
238U (n γ)
239U rarr
239Np rarr
239Pu (n γ)
240Pu (n γ)
241Pu rarr
241Am (n γ)
242mAm rarr
242Cm
Scheme 11 Formation of 242
Cm by a series of neutron capture and β- decay
processes6
113 Properties of the 4f Elements
The shapes of the f -orbitals have a variety of different representations dependent
on molecular symmetry The electron configurations for the metals and Ln3+
ions can be
seen in Table 11 along with values for the third and fourth ionisation energies
Gadolinium (Gd) and lutetuim (Lu) both have a 5d electron giving more stable half-full
or full 4f orbitals respectively Cerium (Ce) is also thought to possess a 5d electron The
most common oxidation state for the lanthanide ions is +3 whereby both of the 6s
electrons and either the 5d electron (if applicable) or one 4f electron are lost The first
two ionisation energies of the lanthanide elements are all relatively low corresponding
to the removal of the 6s electrons The third ionisation energy is also sufficiently low to
allow the generation of the Ln3+
ion in each case by removal of the 5d electron or a 4f
electron The fourth ionisation energies are generally significantly higher as the 4f
orbital becomes more stabilised as the first three electrons are removed This makes the
+4 oxidation state rare but can be formed by Ce Pr and Tb under certain conditions
Samarium (Sm) europium (Eu) and ytterbium (Yb) can form Ln2+
ions relatively
readily
β- β
- β
- β
-
23 mins 23 days 13 years 16 hours
37
Table 11 Electronic properties of the lanthanides 7
Symbol Name Electron
Configuration
(Metal)
Electron
Configuration
(Ln3+
)
3rd
Ionisation
Energy
(kJmol-1
)
4th
Ionisation
Energy
(kJmol-1
)
La Lanthanum [Xe]5d16s
2 [Xe] 1850 4819
Ce Cerium [Xe]4f15d
16s
2 [Xe]4f
1 1949 3547
Pr Praseodymium [Xe]4f36s
2 [Xe]4f
2 2086 3761
Nd Neodymium [Xe]4f46s
2 [Xe]4f
3 2130 3899
Pm Promethium [Xe]4f56s
2 [Xe]4f
4 2150 3970
Sm Samarium [Xe]4f66s
2 [Xe]4f
5 2260 3990
Eu Europium [Xe]4f76s
2 [Xe]4f
6 2404 4110
Gd Gadolinium [Xe]4f75d
16s
2 [Xe]4f
7 1990 4250
Tb Terbium [Xe]4f96s
2 [Xe]4f
8 2114 3839
Dy Dysprosium [Xe]4f10
6s2 [Xe]4f
9 2200 4001
Ho Holmium [Xe]4f11
6s2 [Xe]4f
10 2204 4100
Er Erbium [Xe]4f12
6s2 [Xe]4f
11 2194 4115
Tm Thulium [Xe]4f13
6s2 [Xe]4f
12 2285 4119
Yb Ytterbium [Xe]4f14
6s2 [Xe]4f
13 2415 4220
Lu Lutetium [Xe]4f14
5d16s
2 [Xe]4f
14 2022 4360
114 Properties of the 5f Elements
As previously stated the valence electron sub-shell for the actinides is the 5f
shell The electron configuration of the actinides is shown in Table 12 Thorium has no
5f electron but has 6d2 configuration as an empty 5f shell is more favoured Curium has
a 6d electron giving rise to a more stable half full 5f subshell
The actinide elements have a wide range of available oxidation states
particularly for the earlier metals For the heavier elements however the most common
oxidation state for the metal ions is +3 having lost both of the 7s electrons and either a
6d electron (if applicable) or one 5f electron The available oxidation states for each of
the actinides can be seen in Table 13 Ionisation energy values are not available for all
of the actinides although the standard electrode potentials for the reduction of An4+
to
An3+
and An3+
to An2+
can be used to give an indication of the ion stabilities The +4
38
oxidation state is the most favoured for Th as it gives rise to empty 6d and 7s shells but
An4+
generally becomes less favoured across the series and may only be found in
solution for americium and curium complexes Conversely the stability of the +2
oxidation state generally increases across the series with an irregularity at Cm which
does not have an available +2 oxidation state due to the stability of the half full 5f
subshell of Cm3+
The variety of oxidation states found in the earlier actinides suggests
that all of the valence electrons are available for bonding in these elements7
Table 12 Electronic properties of the actinides7
Symbol Name Electron
Config
(Metal)
Electron
Config
(An2+
)
Electron
Config
(An3+
)
Electron
Config
(An4+
)
Th Thorium [Rn]6d27s
2 NA [Rn]6d
1 [Rn]
Pa Protactinium [Rn]5f26d
17s
2 NA [Rn]5f
2 [Rn]5f
1
U Uranium [Rn]5f36d
17s
2 NA [Rn]5f
3 [Rn]5f
2
Np Neptunium [Rn]5f46d
17s
2 NA
[Rn]5f
4 [Rn]5f
3
Pu Plutonium [Rn]5f67s
2 NA [Rn]5f
5 [Rn]5f
4
Am Americium [Rn]5f77s
2 [Rn]5f
7 [Rn]5f
6 [Rn]5f
5
Cm Curium [Rn]5f76d
17s
2 NA [Rn]5f
7 [Rn]5f
6
Bk Berkelium [Rn]5f97s
2 NA [Rn]5f
8 [Rn]5f
7
Cf Californium [Rn]5f10
7s2 [Rn]5f
10 [Rn]5f
9 [Rn]5f
8
Es Einsteinium [Rn]5f11
7s2 [Rn]5f
11 [Rn]5f
10 [Rn]5f
9
Fm Fermium [Rn]5f12
7s2 [Rn]5f
12 [Rn]5f
11 [Rn]5f
10
Md Mendelevium [Rn]5f13
7s2 [Rn]5f
13 [Rn]5f
12 [Rn]5f
11
No Nobelium [Rn]5f14
7s2 [Rn]5f
14 [Rn]5f
13 NA
Lr Lawrencium [Rn]5f14
6d17s
2 NA [Rn]5f
14 NA
39
Table 13 Available oxidation states of the actinides and colours of ions in solution
where applicable Ions in black text are either not found in aqueous solution or are
unknown8
115 Relativistic Effects
Relativistic effects are much more important for heavy elements than light
elements as they are proportional to an atomrsquos mass The Special Theory of Relativity
as devised by Einstein shows that as the velocity (ν) of a particle increases towards the
speed of light (c) its mass (m) increases to infinity as shown in equation 11 where m0
is the rest mass of the particle This is the relativistic mass increase
Equation 11
For example the relativistic mass increase of a 1s electron in uranium (found to
be 135 me) can be calculated using the average radial velocity of the electrons (νrad)
which is roughly equivalent to the atomic number Z for 1s electrons and the rest mass
of an electron (me) This is shown in equation 12
Equation 12
This effect causes a contraction of 1s electron subshell due to the inverse
relationship between electron mass and the Bohr radius of an atom meaning that the
shell is held more closely to the nucleus and stabilised A similar effect is true for p
electrons The relationship can be seen in equation 13 where α0 is the Bohr radius e is
the elementary charge and ħ is the reduced Planckrsquos constant
Equation 13
7 NpO23+
PuO23+
AmO65-
6 UO22+
NpO22+
PuO22+
AmO22
+5 PaO2
+UO2
+NpO2
+PuO2
+AmO2
+
4 Th4+
Pa4+
U4+
Np4+
Pu4+
Am4+
Cm4+
Bk4+
Cf4+
3 Ac3+
Th3+
Pa3+
U3+
Np3+
Pu3+
Am3+
Cm3+
Bk3+
Cf3+
Es3+
Fm3+
Md3+
No3+
Lr3+
2 Am2+
Cf2+
Es2+
Fm2+
Md2+
No2+
Ac Th Pa U Np Pu Am Cm Bk Cf Es Fm Md No Lr
Most stable in aqueous solution Accessible Only found in solid complexes
40
This explains why relativistic effects are more significant for larger nuclei as the
mass increase is dependent on Z Conversely to the stabilisation of s and p electrons by
relativistic effects valence f and d orbitals are expanded further from the nucleus and
destabilised due to effective shielding of the s and p electrons of the nucleus The effect
is greater in the actinides due to the increased number of electrons and is responsible for
the variety of oxidation states exhibited by An as the valence 5f electrons are further
from the nucleus and are therefore more available for bonding Relativistic effects are
much less important for the lanthanides than the actinides as the actinides are more
destabilised by the effects7
116 Lanthanide and Actinide Contraction
There is a general decrease in the size of the metallic and ionic radii of the
lanthanides across the series explained by the fact that 4f electrons are considered to be
ldquocore-likerdquo so are not available for bonding This causes crystal field effects to be minor
in lanthanide complexes The ldquocore-likerdquo property of the 4f electrons prevents them
from shielding valence electrons in outer subshells from the nucleus allowing the
effective nuclear charge (Zeff) to increase and causing contraction of the atoms and ions
across the series The lanthanide contraction is responsible for the small size difference
between the second and third row transition metals
The ionic radii of the actinides for the +3 +4 and +5 oxidation states gradually
decrease in size across the series although the metallic radii do not follow the same
trend The effect of the trend on the chemistry of the elements is not well known as the
later elements cannot be made with large enough yields to study and they decay too
rapidly The gradual decrease is due to the fact that 5f-electrons are poor at shielding s
and p electrons from the nucleus due to their greater radial extension allowing the
effective nuclear charge (Zeff) to increase and the s and p electrons to be held more
closely to the nucleus
117 Co-ordination Chemistry of the Lanthanides and Actinides in Solution
Lanthanide ions are hard Lewis acids and so co-ordinate readily with hard bases
The core-like nature of the 4f electrons prevents them from interacting significantly with
ligand orbitals and means that lanthanide complexes are bonded electrostatically The
co-ordination geometry of complexes is therefore determined predominantly by the
steric interactions of the ligands The high charge density of the Ln3+
ions allows them
41
to form ionic bonds however this means that many lanthanide complexes are labile in
solution
Actinide ions are also hard Lewis acids co-ordinating easily with hard bases
The greater radial extension of the 5f electrons caused by relativistic effects gives rise
to greater chemical activity in the actinides than the lanthanides as the 5f electrons are
more available for bonding This also explains the tendency of the early actinides to
form covalent bonds however the later actinides mainly interact electrostatically like
the lanthanides
Actinide ions are found as An3+
for the later elements in the series except for
No which is found as No2+
and they behave much like the lanthanides However for
some of the early actinides linear actinyl ions (AnO2+ and AnO2
2+) can be observed in
addition to free ions and are often more stable particularly for U91011
Lanthanide and actinide complexes often have high co-ordination numbers
typically 8 or 9 in aqueous solution (although co-ordination numbers as high as 12 have
been reported) due to their large size The Ln3+
ion forms readily in aqueous solution
and the An3+
ion is the common form for the later actinides however the solution state
chemistry of the early actinide ions is complicated Americium is mainly found in the
+3 oxidation state in solution although it also forms the AmO22+
ion The Am7+
oxidation state has been known to exist but is unstable except in very alkaline
conditions
It is difficult to determine the exact co-ordination numbers and geometries of Ln
and An ion complexes in solution due to the lability of the complexes particularly for
lanthanides
1171 Hydrolysis
The solvation of metal cations by water particularly cations with a high charge
density such as Ln3+
and An3+
ions will result in some hydrolysis The cations polarise
the O-H bonds of the solvent allowing the hydrated metal cations to act as Broslashnsted
acids An example can be seen in Equation 14
Equation 14 [Eu(H2O)8]3+
+ H2O rarr [Eu(H2O)7(OH)]2+
+ H3O+
The acidity of the Ln3+
cations increases across the series as the charge density
increases For the An ions the acidity increases as follows
AnO2+ lt An
3+ lt AnO2
2+ lt An
4+
42
Generally the acidity increases with increasing charge density like Ln The
position of AnO22+
can be explained by the fact that the O2-
ions do not fully reduce the
charge on the An ion and so the effective charge of the ion is seen to be +331
1172 Monodentate Ligands
Substituting water for other monodentate ligands in aqueous solution is
challenging for lanthanides as the complexes are labile and the high charge density of
the ion and affinity for a polar environment means that it will often remain solvated
Isolating monodentate complexes from water is almost impossible as Ln3+
ions having a
high enthalpy of hydration making complex formation endothermic Complexation can
be achieved much more easily by the use of macrocyclic or chelating ligands
Conversely it is much easier to form monodentate actinide complexes in water
such as salts which will become hydrated rather than completely substituted by water
molecules However complexation is still much easier with macrocycles or chelates in
aqueous solution12
1173 Chelates and Macrocycles
When a chelate or macrocycle ligates to an ion the reaction entropy increases as
water molecules are eliminated from the complex (see Equation 15) which is
thermodynamically favourable As a chelating or macrocyclic ligand bonds to the metal
ion the remainder of the ligand is considered to be in close proximity to the ion giving
it an ldquoartificially highrdquo concentration and is therefore more likely to bond than
surrounding ions or ligands
Equation 15 [Eu(H2O)8]3+
+ EDTA4-
rarr [Eu(EDTA)(H2O)3]- + 6H2O
Chelating complexes increase in stability across lanthanide and actinide series
This is because the Coulombic attraction between the ligand and the metal increases
with charge density However there is a slight irregularity in this trend for the
lanthanides where a slight dip can be seen at Gd3+
as this is thought to be the point at
which the co-ordination number changes from 9 to 8 often referred to as the
lsquogadolinium breakrsquo12
43
12 Analytical Methods
121 NMR Spectroscopy
Most lanthanide and actinide complexes are paramagnetic as they have unpaired
electrons The nuclei of paramagnetic complexes are subjected to a local magnetic field
in addition to the field generated by the spectrometer causing the complexes to have
larger chemical shifts NMR spectra of paramagnetic complexes often have broad peaks
as they have faster spin-lattice relaxation times due to strong spin-orbit coupling13
The
relationship is explained by the Heisenberg Uncertainty Principle which links energy
(E) and time (t) in Equation 16 where h is Planckrsquos constant
Equation 16
Considering the relationship between energy and frequency (ν) in Equation 17
the Heisenberg equation can be rearranged to show the inverse relationship between the
change in frequency (Δν) or ldquospectral linewidthrdquo (defined as the peak width of the
signal at half of its maximum height) and the lifetime of the excited state or in this case
spin-lattice relaxation time (Δt) See Equation 1814
Equation 17
Equation 18
122 Luminescence Spectroscopy
1221 Fluorescence and Phosphorescence
Fluorescence and phosphorescence are both types of luminescence Radiation is
used to excite electrons into a higher electronic energy level which then emit photons
(light) as they relax back down to their ground state Fluorescence is a relatively fast
process (picoseconds to milliseconds) as it is an allowed transition by the spin selection
rule not involving a change in spin multiplicity Phosphorescence is a slower process
(milliseconds to seconds) as it does involve a change in electron spin from a singlet to a
triplet excited state ndash it is formally ldquospin-forbiddenrdquo The processes can be seen in the
Jablonski diagram in Figure 11 By contrast f-f transitions whereby f-electrons are
excited into other f-subshells are formally Laporte forbidden so direct excitation of the
4f electrons is unfavourable These rules are relaxed a little by vibronic (vibrational and
44
electronic) coupling in which a vibration in the molecule causes the temporary
lowering of the symmetry of the metal allowing the d and p orbitals to share symmetry
The transition has some drarrp character and so becomes more intense However for
vibronic coupling to take place the valence orbitals must interact with incoming
ligands For the transitions that occur in the visible region of the spectrum this explains
why the colours of Ln3+
ions are weak as the valence 4f shell interacts poorly with
ligands due to their core-like nature Vibronic coupling is greater in actinide ions
Figure 11 Jablonski diagram showing fluorescence and phosphorescence15
1222 Lanthanide Luminescence
Lanthanide ions in which f-f transitions can occur are luminescent and emit
across a range of the electromagnetic spectrum from the Ultra-Violet (UV) range to the
visible (vis) or near-infra-red (nIR) region of the spectrum (Table 14) La3+
does not
possess any f-electrons and Lu3+
has a full 4f shell so these two ions are not
luminescent
45
Table 14 Luminescence of lanthanide ions
Luminescent ions which emit
in the nIR region of the
spectrum
Colours of luminescent ions
which emit in the visible and
UV regions of the spectrum
Pr3+
Sm3+
Nd3+
Eu3+
Ho3+
Tb3+
Er3+
Dy3+
Yb3+
Tm3+
Gd3+
(UV)
Ce3+
(UV)
Lanthanide ions have long luminescence lifetimes as their transitions are
formally forbidden Since the interaction between the metal ion and the ligand is
negligible in lanthanides the emission spectra of lanthanide complexes have narrow
emission lines resembling the spectra of the free ions Solid lanthanide compounds and
complexes also tend to be luminescent1617
1223 Actinide Luminescence
Actinide ions in which f-f transitions can occur are luminescent and also emit
across a range of the electromagnetic spectrum from the UV range to the infra-red IR or
nIR region (Table 15) Ac3+
and Th4+
do not have any f-electrons and Lr3+
has a full 4f
shell so these two ions are not luminescent No luminescence studies have been
performed on Fm3+
Md3+
or No2+
The remaining An have luminescent ions but studies
have been most widely performed on UO22+
Am3+
and Cm3+
as these are the most
widely available have fewer problems associated with radioactivity and safety and are
the most well understood
46
Table 15 Luminescence of actinide ions
Luminescent ions which emit
in the IRnIR region of the
spectrum
Colours of luminescent ions which
emit in the visible and UV regions
of the spectrum
NpO22+
Pa4+
(UV) Pa4+
Pa4+
Pa4+
Pa4+
Am3+
U4+
(UV) U4+
Es3+
UO2+
UO22+
UO22+
UO22+
UO22+
Am3+
Am3+
Am3+
Am3+
Cm3+
Bk3+
Cf3+
Unlike lanthanides actinide emission spectra and lifetimes vary depending on
the species and bound species or counter ions although most lifetimes for An are short
(lt 20 ns) with the exceptions of the 5f0 species UO2
2+ (which has lifetimes varying
from 130 ns to 300 μs) and Cm3+
which has a lifetime of ~65 μs and is known to have
the highest luminescence quantum yield of the An ions allowing it to be studied in very
low concentrations which is useful due to its low availability Luminescence studies on
solid state An compounds are unreliable as they are susceptible to radioluminescence
whereby the energy released by radioactive decay can result in the generation of an
emissive excited state718
1224 Sensitised Luminescence and Antennae
Sensitisation of luminescence can occur if an ldquoantennardquo is present which is a
sensitising chromophore An electron is excited on the ion by energy transferred from
the chromophore The antenna must be in close proximity to the ion for energy transfer
to take place and so antennae are usually used as ligands
Antennae are predominantly organic aromatic materials bonded to macrocycles
(as these are easier to ligate to the metal ions in solution) During sensitisation an
electron from the chromophore is excited from its ground state to a singlet excited state
Energy may then be transferred to a triplet excited state by inter-system crossing (ISC)
where the potential curves of the two states intersect at similar energies Although this
spin forbidden spin orbit coupling makes it possible by slightly shifting the electronrsquos
energy levels Energy from the triplet state is then transferred to the metal ionrsquos excited
47
state The ion can then relax to its ground state by luminescence This is the most
common pathway for sensitised emission however it is possible to transfer energy
directly from the singlet excited state on the chromophore to the ion (Figure 12)
Figure 12 Energy transfer pathway for sensitised luminescence of Ln3+
complexes 1S
represents an excited singlet state 3T an excited triplet state and f and frsquo represent
excited states of the Ln3+
ion 19
1225 Russell-Saunders Coupling
ldquoTerm symbolsrdquo are used to label ground state and excited state energy levels
for lanthanide ions Term symbols are derived from Russell-Saunders coupling and
account for the net atomic orbital angular momentum and the net spin angular momenta
of the state determined from the sum of the individual angular momenta of an ionrsquos
electrons Term symbols take the form
(2S+1)LJ
where S is the spin multiplicity of the state L corresponds to the ldquolrdquo quantum number
for the state and J is the coupling of L and S Excited states have several possible J
values although the ground state always has a single J value which can be determined
by Hundrsquos rules The Russell-Saunders coupling scheme is only useful for lanthanide
ions and cannot be applied to actinide ions as spin-orbit coupling is much greater in An
and the 5f orbitals have different properties to the 4f orbitals in particular the greater
importance of relativistic effects (see Section 115) However Russell-Saunders terms
have been used as a basis for assigning ground and excited state terms20
F = Fluorescence P = Phosphorescence L = Luminescence NR = Non Radiative Decay ISC = Inter System Crossing ET = Energy Transfer BT = Back-energy Transfer IC = Internal Conversion
48
1226 Quenching
The excited states of the trivalent lanthanides and actinides are readily quenched
in solution Quenching occurs when the vibrational energy levels of high energy
oscillators (such as C-H N-H or O-H bonds) within the molecule or its environment
(solvent) have a similar energy to the excited state of an ion Inter-System Crossing
(ISC) from the excited state to these vibrational levels can occur causing non-radiative
decay preventing luminescence The efficiency of this non-radiative decay is dependent
upon the energy gap between the emissive state and the ground state of the ion and also
on the number of quanta (energy levels) of the oscillator If the non-radiative decay is
favourable and happens faster than luminescence quenching will occur Quenching
reduces the intensity lifetime and quantum yield of luminescence If the ionrsquos emissive
state is close in energy to the triplet excited state of the ligand (lt 20000 cm-1
) thermal
quenching may also occur whereby energy is transferred backwards to the triplet
excited state of the chromophore21
1227 Quenching in Lanthanides and Actinides
Tb3+
is less susceptible to vibrational quenching than other lanthanide ions as the
energy gap between the lowest emissive state and the ground state of Tb3+
is very high
(20500 cm-1
) It is however susceptible to thermal quenching and back energy transfer
Eu3+
also has a large energy gap (17250 cm-1
) This results in a relatively greater
emission intensity for these ions
Other lanthanide ions such as Pr3+
Ho3+
Er3+
Tm3+
Yb3+
Dy3+
and Sm3+
with
smaller energy gaps are more easily quenched giving less intense emission Er3+
has the
smallest energy gap close to the υ=0 energy level of O-H so is the most easily
quenched (see Figure 13) The lower energy levels of the oscillators provide better
overlap with the energy levels of the ions due to a better overlap with the wavefunction
therefore ions which have energy levels that overlap with the lower quanta of the
oscillators will also be more easily quenched Gd3+
has the highest energy gap of the
lanthanide ions (32000 cm-1
) and cannot be sensitised by conventional UV absorbing
chromophores
49
Nd3+Eu3+ Tb3+Yb3+ O-H O-DTm3+ Sm3+ Pr3+ Er3+
3H4
4I132
4I112
3H4
3H5
3H6
3H6
3H5
3H4
0
20000
4I92
4I112
4I132
4I152
4F32
2H92
4S32
4F92
2H112
4G52
4G72
4G92
(2D2P)32
4G1125D4
7F07F17F27F37F4
7F5
7F67F0
7F1
7F2
7F3
7F4
7F5
7F6
5D0
5D1
5D2
2F52
2F72
10000
6H52
6H72
6H92
6H112
6H132
4F32
4G52
4F32
4F12
4F52
4F72
4G72
4F92
4F112
3F2
3F4
3P0
3P1
3F3
1I6
1G4
4I92
4F92
4S32
4F72
3F4
3F3
3F2
1G4
E
cm
-1
=0
=1
=2
=3
=4
=5
=0
=1
=2
=3
=4
=5
=6
=7
2H112
1D2
Figure 13 Energy level diagram showing the ground and excited states of a selection
of lanthanides and vibrational oscillators Emissive states are shown in red The energy
levels of O-H and O-D oscillations are shown in blue22
Actinides are also susceptible to quenching even more so than the lanthanides
as all of them have smaller energy gaps between the lowest emissive state and the
ground state The energy gaps of some actinides compared to lanthanides can be seen in
Figure 14
50
Figure 14 The energy gaps between the lowest emissive states and ground
states of a selection of lanthanides and actinides represented by arrows23
1228 Suitable Solvents for Luminescent Complexes
In addition to quenching by vibrational oscillators on ligands luminescence can
also be quenched by solvents High energy oscillators must therefore be eliminated from
the solvent in order for luminescence to take place in the solution phase This is
generally achieved by using deuterated (or fluorinated) solvents such as D2O It is also
important to use strongly co-ordinating solvents that would replace the labile ligands
The Horrocks equation can be used to calculate the number of co-ordinated solvent
molecules (q) to an ion whether it is a free ion or co-ordinated to a ligand The original
Horrocks equation (Equation 19) and modified Horrocks equation for q lt 2 (Equation
110) are shown below
Equation 19
Equation 110
The Horrocks equation uses the emission lifetimes (τ) to determine q A is the
proportionality constant taking into account the inner hydration sphere and B is a
correction factor taking into account the outer hydration sphere A and B values are
experimentally determined constants and are available for Sm3+
Eu3+
Tb3+
Nd3+
Yb3+
Am3+
and Cm3+
Inner sphere hydration (q) values can be effectively determined from
51
solutions of water and methanol For the original Horrocks equation A = 105 for Eu3+
and A = 42 for Tb3+
and for the modified Horrocks equation (when q lt 2 ) A = 12 ms
and B = (025 ndash 0075x) ms-1
(where x = the number of exchangeable N-H oscillators)
for Eu3+
and A = 5 ms and B = 006 ms-1
for Tb3+
242526
13 Nuclear Theory
131 Nuclear Power
Currently all nuclear energy irrespective of use is generated by nuclear fission
Nuclear fission is the splitting of a fissile nucleus into two smaller nuclei often aided by
the collision of an incoming particle or neutron The nucleus captures the neutron
which makes it unstable and it breaks into two fragments The splitting process releases
more neutrons which may continue to cause fission of more nuclei generating a chain
reaction An example of a chain reaction caused by 235
U fission can be seen in Figure
15
Figure 15 Chain reaction generated by fission of 235
U into 92
Kr and 141
Ba27
Fission of heavy radioactive actinide elements is exothermic and a chain
reaction can occur if there are enough fissile nuclei present The amount of fissile
material required for a self-sustaining chain reaction is the ldquocritical massrdquo and any mass
above this is referred to as a ldquosupercritical massrdquo which if not controlled can lead to a
runaway chain reaction and a nuclear explosion
52
235U fission is used to generate nuclear power The fission products (FP) collide
with other atoms and their kinetic energy in converted into heat which is absorbed by
the cooling water and then used to drive steam turbines to generate electricity Control
rods are used in the reactor to control the neutron flux and prevent a runaway chain
reaction These are often made of boron nitride which is a neutron absorber
Moderators are also used to slow down the neutrons to the optimum energy for fission
(~2 kJ mol-1
) and these tend to be light nuclei (12
C or 2H)
132 The Nuclear Fuel Cycle
Uranium is mined in its ore form from the ground mainly in Middle Eastern
countries Canada Australia and Africa The ore is then milled to extract the uranium as
ldquoyellowcakerdquo which is mixed oxides of triuranium octoxide (U3O8) uranium dioxide
(UO2) and uranium trioxide (UO3) by leaching with acid or alkali followed by
precipitation The remaining ore ldquotailingsrdquo are disposed of as radioactive waste
The yellowcake is then further processed as only 07 of uranium is fissile
235U the dominant isotope is
238U The uranium oxide is enriched by increasing the ratio
of 235
U238
U to approximately 35-5 235
U This is done by converting all of the mixed
oxides into uranium dioxide and then to uranium hexafluoride (UF6) gas and separating
it into two streams ndash one of which is enriched in 235
U and the other depleted
The enriched UF6 is then converted back to UO2 which can be pressed and
heated to 1400 degC to form fuel pellets The depleted uranium is treated as waste The
fuel pellets are subsequently encased in metal rods which can then be used in a fuel
assembly in a reactor
After 18-36 months the build-up of fission products is such that the efficiency
of the fuel decreases so the fuel rods are removed and replaced The used fuel is then
stored for months or years in water which absorbs the heat until the radiation levels
decrease sufficiently for it to be disposed of or reprocessed As there are no disposal
facilities at present for nuclear fuel waste it is simply isolated from the environment
and left in storage until facilities become available28
A diagram of the Nuclear Fuel
Cycle can be seen in Figure 16
The once-through or ldquoopenrdquo fuel cycle whereby waste is stored for disposal is
favoured by a number of countries including Canada parts of Europe and the USA
presently although some research on reprocessing techniques is being carried out in
these areas as reprocessing is becoming increasingly important for the future of nuclear
power A ldquoclosedrdquo fuel cycle whereby the waste is recycled and reused is becoming
53
more and more favoured as a result of this and has been performed in some parts of the
world for many years including the UK and other parts of Europe Russia and Japan29
Figure 16 The Nuclear Fuel Cycle30
133 Spent Nuclear Fuel and Reprocessing
The reprocessing of spent nuclear fuel (SNF) is essential for preventing the
exhaustion of uranium supplies and reducing the volume and radiotoxicity of the waste
produced
Current reprocessing techniques involve the removal of re-usable uranium and
plutonium present in the waste which can be recycled and reused together in mixed
oxide (MOX) reactors to produce more nuclear power31
The amount of waste
remaining in storage at present worldwide that could be reprocessed is approximately
200000 tonnes with a global reprocessing capacity of around 4000 tonnes per year
90000 tonnes have been reprocessed over the last 50 years
In addition to the reusable U and Pu in the spent nuclear fuel (SNF) there are
also a variety of other fission products (FP) present such as minor actinides (MA) Np
Am and Cm Ln and transition metals (TM) in addition to corrosion products (CP)
54
from steel containers and pipes in the system as a result of radiolysis erosion and
ageing of equipment These are TM chiefly cobalt (Co) chromium (Cr) iron (Fe) and
manganese (Mn) The composition of SNF can be seen in Table 16 Recently research
into the removal of the other actinides from the waste has become important in order to
transmute them into shorter-lived radionuclides so that their radioactivity will not
persist for as long making the disposal process easier and faster This coupled with a
similar approach for any remaining plutonium will make the waste proliferation
resistant as it would not allow the Pu to be recovered from storage in the future for
proliferation purposes
Table 16 Approximate compositions of SNF in Light Water Reactors (LWR)32
Constituent of SNF
U 956
Stable FP (including Ln) 29
Pu 09
Cs amp Sr (FP) 03
I amp Tc (FP) 01
Other long-lived FP 01
MA 01
Although MA only make up 01 of fission products they are highly radiotoxic
and extremely long-lived and so it would be beneficial to separate MA from the
remaining fission products so that they can be transmutated into shorter lived
radionuclides by neutron bombardment The necessity of the separation arises from the
presence of Ln as Ln are known to be neutron scavengers or ldquoneutron poisonsrdquo 33
meaning that they have a high neutron cross section and are able to absorb neutrons
preventing transmutation of other species present
Neptunium is relatively simple to remove from the mixture of fission products
as it has a variety of oxidation states that can be utilised in the process34
However the
predominant trivalent minor actinides (MAs) Am and Cm are much more difficult to
separate from the remaining lanthanide waste due to the similarities in the chemistries
of the elements and the electrostatic nature of interactions of the hard Lewis acidic Ln3+
ions with ligands35
Much of this new research is focussed on separating Am3+
and
Cm3+
from Ln3+
55
134 Solvent Extraction
Currently there are no MA-Ln separation techniques employed commercially
although a number of different processes are being developed particularly in the USA
and Europe with a drive to implement a working process within the next 5 years
Despite differences in the chemistry between the techniques under development all of
them use solvent extraction as the ultimate separation technique
Solvent extraction is the process of separation of two (or more) species using
two immiscible liquids (usually an organic and aqueous phase) by the use of
complexing agents to selectively move only one species between phases This may or
may not be aided by the use of a complexing agent which binds preferentially to one of
the species36
The success of this technique varies between compounds and solvent systems
and can be determined using a separation factor (SF) This is a ratio based on the
distribution ratios (D) of the elements to be separated (Equations 111 and 112)
Equation 111
Equation 112
There are a number of existing methods for removing radiotoxic elements from
fission products these are discussed over the next few sections
1341 PUREX
PUREX (Plutonium and Uranium Refinement by Extraction) is the process used
by nuclear plants that carry out reprocessing to remove U and Pu from the waste in
order to reuse it (Figure 18) Strong nitric acid (~ 4M HNO3) is used to dissolve the
waste in an aqueous phase to form hydrated nitrate complexes of the corresponding
oxides of U and Pu (Equations 113 and 114) High concentrations of acid (2-6 M) are
used to increase the solubility of the oxides
Equation 113 UO22+
+ 2NO3- (aq) rarrUO2(NO3)2xH2O
Equation 114 PuO22+
+ 2NO3- (aq) rarrPuO2(NO3)2xH2O
56
The plutonium complex is then reduced using nitrogen tetroxide (N2O4) to the
corresponding Pu4+
complex and the solution is filtered to remove any precipitates
(Equation 115)
Equation 115 PuO2(NO3)2xH2O + N2O4 rarr Pu(NO3)4xH2O
The solution is then contacted with an organic phase (kerosene) containing tri-
nbutyl phosphate (TBP) as an extracting agent (Figure 17) which forms complexes
with the U and Pu nitrate hydrates to move them into the organic phase (Equations 116
and 117)
Equation 116 UO2(NO3)2xH2O + 2TBP rarr UO2(NO3)2(TBP)2
Equation 117 PuO2(NO3)2xH2O + 2TBP rarr Pu(NO3)4(TBP)2
However Tc and Np are also extracted at this point This is a disadvantage for
the purpose of the PUREX process but is advantageous for subsequent MA-Ln
separation processes which could follow The UO22+
and NpO2+ TBP complexes are
then separated from the Pu4+
and TcO4- complexes by reduction of Pu
4+ to Pu
3+ with
hydrazine (N2H4) and extraction back into water (Equations 118 and 119)3738
Equation 118 N2H4 + H2O harr N2H5+ + OH
-
Equation 119 Pu(NO3)4(TBP)2 + N2H5+ rarr Pu(NO3)3(TBP)2 + N2H5NO3
The Pu3+
and TcO4- are then separated from each other through another
extraction cycle and then a ldquostrippingrdquo solution of nitric acid hydroxylamine and
sulphuric acid to obtain pure Pu The UO22+
and NpO2+ are also extracted back into
aqueous solution and separated from each other through another extraction cycle Pure
U is obtained by using aqueous nitric acid for stripping (back-extraction)39
The process
has been proven to work well and it is an advantage that the organic phase can be reused
after stripping However the process has a few drawbacks ndash the need for high acid
concentrations makes it less environmentally friendly the need for redox control and
less stable oxidation states makes it longer and complicated and the use of phosphorus
reagents makes the products more difficult to dispose of as phosphorus waste is not
57
incinerable and so any radioactive waste must be separated from the phosphorus before
treatment40
Figure 17 Chemical structure of TBP (Tri-nbutyl phosphate)
Figure 18 PUREX flow diagram41
1342 TRUEX
TRUEX (TRansUranic EXtraction) is an example of advanced reprocessing
(removal of MA and Ln) that is being developed in the USA The principle of the
process is to selectively remove Am and Cm (MA) and Ln from the other fission
58
products left in the raffinate after the PUREX process (Figure 110) A combination of
extractants is used carbamoylmethylphosphine oxide (CMPO) (Figure 19) and TBP (as
in the PUREX process) The benefit of the combined extractant system is that the
process is effective over a range of acidities (07-5 M HNO3) The raffinate (in nitric
acid) from the PUREX process is contacted with the extractant in an organic phase of
normal paraffinic hydrocarbon (NPH) Oxalic acid is then added to prevent the co-
extraction of zirconium (Zr) and molybdenum (Mo) with the MA An additional wash is
also performed using sodium carbonate (Na2CO3) to prevent any other fission products
from being co-extracted The extractants selectively remove the MA and Ln into the
organic phase leaving the remaining fission products in the aqueous phase The MA
and Ln are then stripped using nitric acid and can be reprocessed further as required
However a main drawback is that the lanthanides are still present with the MA so
further reprocessing is required 42
Figure 19 Chemical structure of CMPO (NN-diisobutyl-2-
(octyl(phenyl)phosphoryl)acetamide)
59
Figure 110 TRUEX flow diagram
1343 DIAMEX
The DIAMEX (DIAMide Extraction) process is another example of advanced
reprocessing and is currently under development in France by the CEA (Commissariat agrave
lEnergie Atomique et aux Energies Alternatives) (Figure 113) It is similar to the
TRUEX process as the process selectively removes Am and Cm (MA) and Ln from the
PUREX raffinate The process is being researched using a variety of different diamides
as the extractant the most promising of which have been shown to be NNrsquo-dimethyl-
NNrsquo-dibutyl-tetradecylmalonamide (DMDBTDMA) (Figure 111) and NNrsquo-dimethyl-
NNrsquo-dioctyl-hexylethoxymalonamide (DMDOHEMA) (Figure 112)4344
The nitric
acid PUREX raffinate is contacted with the extractant in an organic phase of tetra-
propylene-hydrogenated (TPH) a synthetic branched form of dodecane45
Oxalic acid is
then added to prevent the co-extraction of Zr and Mo with the MA as in the TRUEX
process and the extractant selectively removes the MA and Ln into the organic phase
leaving behind the other fission products in the aqueous phase The MA and Ln are then
stripped using nitric acid and can be reprocessed further as required
The main benefit of this process compared to the TRUEX process is that the
organic waste only contains C H N and O as P reagents are not used so the waste can
be disposed of more easily However like the TRUEX process a main drawback is that
the lanthanides are still present with the MA so further reprocessing is required 46
Figure 111 Chemical structure of DMDBTDMA (N1N3-dibutyl-N1N3-
dimethyl-2-tetradecylmalonamide)
60
Figure 112 Chemical structure of DMDOHEMA (N1N3-dibutyl-2-(2-
(hexyloxy)ethyl)-N1N3-dimethylmalonamide)
Figure 113 Example DIAMEX flow diagram
1344 SANEX
SANEX (Selective ActiNide EXtraction) is another process being developed by
CEA and is intended to be coupled with a TRUEX or DIAMEX type process and is the
next step in the advanced reprocessing whereby the MA and Ln are separated from
each other so that the MA can be treated (Figure 117) Complexing agents such as bis-
triazinyl-pyridines BTPs and their bipyridine variants (BTBPs) (Figure 114) have been
widely studied with a more recent complexing agent tetraoctyldiglycolamide (TODGA)
(Figure 115) being studied47
The complexing agents have been found to preferentially
bind to the MA allow only the MA to be extracted into an organic phase using TBP
leaving the Ln in the aqueous phase Oxalic acid and (2-hydroxyethyl)-
61
ethylenediaminetriacetic acid (HEDTA) (Figure 116) are used to prevent the co-
extraction of any other fission products The chemistry of this process is poorly
understood however and more research is needed48
However many of these extractant
molecules suffered problems that preclude them from use in plant-scale extractions
including poor stability slow extraction kinetics the use of citric acid as a buffer and
inefficient back extraction due to high An3+ affinities
Figure 114 General chemical structure of BTPs (66-di(124-triazin-3-yl)-22-
bipyridine)
Figure 115 Chemical structure of TODGA (22-oxybis(NN-dioctylacetamide))
Figure 116 Chemical structure of HEDTA (22-((2-((carboxymethyl)(2-
hydroxyethyl)amino)ethyl)azanediyl)diacetic acid)
62
Figure 117 SANEX flow diagram for TODGA process
1345 i-SANEX
The innovative SANEX (or i-SANEX) process is also currently under
development at the CEA49
Essentially it is a modified DIAMEX process with selective
back extraction of Am3+
and Cm3+
from the organic phase The MA3+
and Ln3+
ions are
initially extracted from the PUREX raffinate using TODGA and then a hydrophilic
complexant that is selective for MA3+
is employed to back extract the minor actinides
from the loaded organic phase into the aqueous phase In order to retain the lanthanide
ions in the organic phase a nitrate salt is added to the stripping solution Hydrophilic
extracting agents that have been used to demonstrate this technique are DTPA
(diethylenetriaminepentaacetic acid) and the sulphonated BTP derivative 26-bis(56-
di(sulphophenyl)-124-triazin-3-yl)pyridine SFrsquos of up to 1000 are achievable in this
process50
One other option that has been suggested is to add a second stripping agent
such as HDEHP to the organic phase in order to retain the lanthanides in the organic
phase at low pH One major drawback of this process however is the limited operative
acidity range (ca pH 3) which means that buffering agents need to be added to the
aqueous phase in the back extraction step Another reprocessing concept currently under
investigation is the 1-cycle SANEX with the intention to directly extract the trivalent
actinides selectively from the PUREX raffinate A system consisting of 015 M
CyMe4BTBP and 0005 M TODGA in a mixture of 40 TPH and 60 1-octanol has
been proposed51
63
1346 GANEX
The GANEX (Grouped ActiNide EXtraction) process is relatively new and is a
complete separation process combining the principles of the PUREX and TRUEX
processes in order to separate all of the An (U Pu and MA) from the Ln and both from
the other fission products (Figure 121) A complexing agent bis-triazin-bipyridine
(BTBP) (Figure 118) and its variants (such as CyMe4-BTBP (Figure 119) and CyMe4-
BTPhen (Figure 120))52
have been tested and found to be effective in selectively
coordinating to and extracting MA high separation factors of Am3+
over Eu3+
gt 1000
have been documented In the proposed process BTBP is dissolved in cyclohexanone
(as it is soluble in this solvent and has faster extraction kinetics) and used alongside
TBP which extracts U and Pu and is stable against radiolysis and hydrolysis especially
the CyMe4 variant If proven to be successful this process would simplify reprocessing
making it much simpler however much more work is needed before this process could
become operational as co-extraction of fission products is currently a problem53
For the
most attractive candidate to date the CyMe4-BTBP extractant has been successfully
tested for the extraction of genuine actinidelanthanide feed through a 16-stage
centrifugal contactor setup with excellent recoveries for americium and curium
(gt999) but has been shown to undergo radiolytic degradation at doses that will be
encountered at the high minor actinide loadings obtained in the reprocessing of for
example fast reactor fuels The kinetics for actinide extraction with CyMe4-BTBP are
still relatively slow so the addition of a phase-transfer catalyst is necessary (eg NNprime-
dimethyl-NNprime-dioctylethylethoxymalonamide (DMDOHEMA)) if this extractant is to
be used for large- scale partitioning
Figure 118 General chemical structure of BTBPs (66rsquo-bis(124-triazin-3-yl)-22rsquo-
bipyridine)
64
Figure 119 Chemical structure of CyMe4-BTBP (66-bis(5588-tetramethyl-5678-
tetrahydrobenzo[e][124]triazin-3-yl)-22-bipyridine)
Figure 120 Chemical structure of CyMe4-BTPhen (29-bis-(124-triazin-3-yl)-110-
phenanthroline)
65
Figure 121 GANEX flow diagram
1347 TRPO
Another advanced reprocessing extraction process being developed in China is
the TRPO (TRialkyl Phosphine Oxide) process which involves the separation of all
actinides in stages to remove Np and Pu together AmCm and Ln together and isolate
U There are two processes being researched both of which use TRPO (Figure 122) as
the extractant but differ in the other reagents used One system uses TTHA (triethylene
tetramine hexaacetate) (Figure 124) as a complexing agent to selectively bind to
different actinides preferentially at different pH values to allow selective extraction
buffered by lactic acid (Figure 125) The other process uses nitric acid to extract MA
and Ln followed by oxalic acid to extract Pu and Np Both processes then use sodium
carbonate to strip the remaining U from solution (Figure 126) The main advantage of
the first system is that MA and Ln can subsequently be separated from each other using
CYANEX 301 (Figure 123) with the main disadvantage being the need for buffering
due to pH dependence The main advantage of the second system is that the separation
between components is excellent and virtually discrete but the main disadvantage is that
MA and Ln cannot be later separated from each other using CYANEX 301 due to the
high acidity of the solution54
66
Figure 124 Chemical structure of TTHA (3-(2-((2-
(bis(carboxymethyl)amino)ethyl)(carboxymethyl)amino)ethyl)-6-
(carboxymethyl)octanedioic acid)
Figure 125 TRPO flow diagram using TTHA
Figure 122 Chemical structure of TRPO
(trialkyl phosphine oxide R = C6 ndash C8)
Figure 123 Chemical structure of
CYANEX 301 (bis(244-
trimethylpentyl)phosphinodithioic acid)
67
Figure 126 TRPO flow diagram using HNO3 and oxalic acid
1348 LUCA
LUCA (Lanthaniden Und Curium Americium trennung lanthanide and curium
americium separation) is a relatively new process currently being developed in
Germany and is designed to follow the SANEX or DIAMEX processes The process
involves the selective separation of Am3+
from Cm3+
Cf3+
and Ln3+
after co-extraction
A combined extractant system of bis(chlorophenyl)dithiophosphinic acid
((ClPh)2PSSH) and tris(2-ethylhexyl)phosphate (TEHP) in isooctane and tert-butyl
benzene is used Advantages of the LUCA process include high recovery after stripping
and that the phosphinic acid is more stable to hydrolysis and radiolysis than CYANEX
301 however the phosphinic acid was found to be unstable in high HNO3
concentrations55
At present as with the majority of the MALn processes described the
exact origin of the selectivity remains unclear however it is clear that in general
simple extractant molecules are favourable
68
Figure 127 LUCA flow diagram
1349 EXAm
The EXAm (Extraction of Americium) process is another relatively new process
developed by the CEA for the extraction of only americium from a PUREX raffinate56
Americium is the main cause of heat emissions in SNF wastes and so selective removal
and reprocessing of Am is favourable for vitrified waste disposal Separation of Am3+
from Cm3+
was considered as Cm reprocessing would be difficult to implement due to
high neutron emissions which would require very thick shielding
The process uses a mixture of two extractants (DMDOHEMA and HDEHP) in
TPH from a 4-6 M HNO3 FP solution TEDGA (NNNrsquoNrsquo-tetraethyl-diglycolamide)
(Figure 128) is used as the complexing agent to selectively retain Cm3+
and Ln3+
in
solution allowing extraction of Am3+
Advantages of the process are that the use of
TEDGA over TODGA allows increased separation of Am3+
Cm3+
and TEDGA is
relatively resistant to radiolysis However the chemistry remains quite poorly
understood and separation factors are still quite low at ~25 due to the very similar
chemistry of the two metal ions57
Figure 128 Chemical structure of TEDGA (NNNrsquoNrsquo-tetraethyl-diglycolamide)
69
137 TALSPEAK
TALSPEAK (Trivalent Actinide Lanthanide Separation by Phosphorus reagent
Extraction from Aqueous Complexation) is a further effective method of advanced
reprocessing by solvent extraction The process was initially developed at Oak Ridge
National Laboratory in Tennessee USA during the 1960s and it is still being refined
The process is designed to allow the separation of MA3+
(Am3+
and Cm3+
) from
Ln3+
and yttrium (Y3+
) from the other fission products and from each other to allow MA
to be reprocessed further by transmutation Although it is still under development the
TALSPEAK process has a number of benefits over other similar processes discussed in
Section 126 The process is resistant to irradiation and allows the separation to be
carried out without the need for high acid and salt concentrations It also has added
benefits in that it has already been performed on a pilot plant scale and uses cost
effective readily available reagents58
Additionally it can be carried out using relatively
inexpensive stainless steel equipment The process is very promising despite its
potential disadvantage that it involves removing the major constituent from the minor
constituent as studies have shown the separation is effective enough for this not to be a
problem
1371 The Process
In the process the MA preferentially form complexes with an aminopolyacetic
acid chelate over the lanthanides This allows the lanthanides to be better extracted into
an organic phase by a mono-acidic organophosphate or phosphonate (Figures 132 and
134) The most effective complexing agent to date is DTPA (diethylenetriamine
pentaacetic acid) (Figure 129) in the pH 25-35 range giving relatively high SFs (~50
for Nd3+
the most difficult to extract Ln3+
ion) and the most effective extracting agents
are HDEHP (di(2-ethylhexyl)phosphoric acid) (Figure 130) and HEH[ϕP] (2-
ethylhexyl phenyl phosphonic acid) (Figure 131) The extraction can be carried out
without the use of a complexing agent although the separation is not as discrete and is
significantly enhanced by the addition of an aminopolyacetic acid such as DTPA
Without DTPA Eu3+
Am3+
separation factors using 03 M HDEHP are around 40 59
whereas SF ~90 can be achieved when the complexing agent is used with the extractant
Other aminopolyacetic acids have been tested such as TTHA and EDTA but are not as
effective or tend to be less soluble60
70
Figure 129 Chemical structure of DTPA (2222-
((((carboxymethyl)azanediyl)bis(ethane-21-diyl))bis(azanetriyl))tetraacetic acid)
TALSPEAK Process
1 The fission product mixture (1 M) is dissolved in a carboxylic acid which acts
as a buffer and a solubiliser for the complexing agent lactic acid is often used
for this (Figure 132) Lactic acid (pKa 386)61
has been found to be the best
buffer for the process as it gives the best phase separation Nitrate may be
present from the original raffinate but this has been found not to decrease
separation
2 The solution is ldquoscrubbedrdquo with a mixture of Na5DTPA (01 M) in the same
carboxylic acid (1 M) at pH 36 ndash 38 The DTPA5-
complexes to the MA3+
and
Ln3+
but binds more strongly to the MA3+
This pH range is the optimum pH for
DTPA5-
activity as it complexes more strongly at higher pH values but
separation is better in more acidic conditions
Figure 130 Chemical structure of
HDEHP (bis(2-ethylhexyl) hydrogen
phosphate)
Figure 131 Chemical structure of
HEH[ϕP] ((2-(2-
ethylhexyl)phenyl)phosphonic acid)
71
3 The extractant is dilute HDEHP (05 M) in a hydrocarbon solution such as
DIPB (diisopropyl benzene found to give the best separation) which is then
contacted with the aqueous solution containing the LnMA[DTPA]2-
The Ln3+
ions are extracted into the organic phase by the phosphate causing dissociation
of the DTPA5-
and leaving the free DTPA5-
in the aqueous solution The
MA[DTPA]2-
complexes remain in the aqueous solution as DTPA5-
is bound
strongly enough to MA3+
to prevent the complexes from dissociating HEH[ϕP]
gives a better extraction although it makes stripping more difficult
4 After the Ln3+
ions are removed a second scrub is carried out at lower pH (15)
and a lower concentration of the complexing agent (005 M Na5DTPA) in lactic
acid (1 M) in order to extract the MA3+
The lower pH increases the extraction
rate as the DTPA5-
binds less strongly to the MA3+
allowing them to be
extracted more easily at the phase boundary where DTPA5-
dissociates The
phosphate (03 M HDEHP) is dissolved in n-dodecane (a more favourable
diluent) for the second extraction to remove the MA3+
into the organic phase
The use of n-dodecane was found to give better extraction but poorer
separation If Ln3+
and Y3+
are the only fission products present in the original
raffinate solution the MA3+
can be recovered by precipitation with oxalate from
the raffinate
5 Stripping is then carried out using 1 M HNO3 Nitric acid prevents the use of
corrosive chlorides This process can also be used to extract Cf3+
and Es3+
but it
has been found that more concentrated acid is needed for heavier actinides
Figure 132 Chemical structure of lactic acid pKa = 386
72
Figure 133 The solvent extraction process used in TALSPEAK Step 1 Binding of
DTPA to M3+
in the aqueous phase at pH 36 buffered by lactic acid Step 2 Selective
extraction of Ln3+
into the organic phase by HDEHP from the aqueous phase due to
preferential binding of DTPA to MA3+
Additional Notes on the Process
Initial extraction data for the process reported by Weaver et al in 1964 was
obtained by adding isotopic tracers to the aqueous solutions contacting them with the
organic phase performing the separation and measuring the activity by scintillation
counting with a γ-detector Extractions were all repeated 2-3 times to verify the results
and the contact time was 20 minutes which was much longer than necessary
Extractions performed using Na5DTPA and H5DTPA were found to give the same
results at the same pH values although pH adjustment was needed as Na5DTPA is more
alkaline than H5DTPA but H5DTPA is much less soluble The extraction of heavier
lanthanides was found to be slower but did not affect the separation Increasing the
concentration of HDEHP was found to give better separation but made the initial
equilibration time too long and increasing the concentration of DTPA decreased the
separation (Figure 134)
1 2
73
Figure 134 Effect of Na5DTPA concentration on distribution ratios of MA3+
and Ln3+
in TALSPEAK process using 1 M lactate buffer and 03 M HDEHP in DIPB extractant
60
The process is based on the preferential binding of the complexant to the
trivalent actinides over lanthanides Initially this was thought to be due to the fact that
An3+
binding is more covalent than Ln3+
binding However this was found not to be the
sole reason and it is understood that the organic ligand plays a role in the selectivity
The chemistry of the complexation of the ions with the ligand is not yet fully
understood and much work is needed to gain an insight into this complicated
chemistry62
74
Figure 135 TALSPEAK flow diagram
138 Reprocessing Summary
The necessity of reprocessing has arisen from increasing awareness and concern
for the environment in addition to the potential of maximising finite resources whilst
minimising proliferation There are a number of different processes currently under
development none of which have yet been implemented on a commercial scale except
for the PUREX process
The principles of all these process are often very similar although extraction
techniques and reagents vary somewhat There are a number of factors which must be
considered when developing a suitable solvent extraction process for SNF reprocessing
including the ease of stripping (back-extraction) the need for low volatility non-
flammable solvents the potential of the process to be continuous how to minimise
waste production the resistance of the process to radiolysis and degradation
practicality and efficiency of the process and the economic viability63
While some of the chemistry is understood such as the redox chemistry in the
PUREX process much of it is not thus limiting the potential to develop an efficient
process The sheer complexity of the waste content makes partitioning very difficult
and without a full understanding of the chemistry involved in the processes designing
75
an effective working process will be very challenging All of the processes currently
under development have advantages and disadvantages but all are ultimately heading
towards the same goal separation of the actinides from the lanthanides in order allow
the transmutation of the actinides into shorter lived radionuclides for the purpose of
reducing the long-term radiotoxicity of the waste and the volume of waste building up
in storage
TALSPEAK is one of the most promising techniques being researched due to its
numerous advantages particularly its relative resistance to irradiation and ability to be
carried out without the need for high reagent concentrations Additionally it gives
separation factors of ~50-100 comparable to the SANEX process which uses BTP one
of the most effective complexing agents However its main disadvantage is the poor
understanding of the separation mechanisms and complexation chemistry surrounding
it The main focus of research here will be the TALSPEAK process with a view to
improving the understanding of this chemistry and modifying the process to improve its
practicality
14 Project Objectives and Thesis Outline
Recent studies have shown that complexants with soft donor atoms compared to
oxygen (such as N or S) can be used to separate the MA from Ln6465
Initial research in
this area was carried out by our collaborators at Idaho National Lab using amino acids
as a potential buffer and soft donor which if proven to be successful would be able to
eliminate the need for the separate complexing agent and buffer simplifying the process
if amino acids were found to preferentially bind to the MA66
Another benefit to this
change would be the scope for carrying out the process at a lower pH due to the lower
pKa values of the carboxylic acid groups of the amino acids than on DTPA enabling
the system to be buffered to pH 1-2 rather than ~35 Lower pH values are preferred by
industry as higher acid concentrations are easier to control on a large scale pH control
is essential for the distribution ratios for the separation and there is a strong correlation
between the two Low pH values have been found to increase D however DTPA
protonates and precipitates out of the solution at the lowest values The use of amino
acids in place of the complexing agent would allow a lower pH to be used as they would
not fully protonate increasing the SF and making the process more efficient as binding
constants and ligand affinities would be higher To this end several avenues of research
have been explored
76
Chapter 2 presents initial studies carried out using amino acids in a TALSPEAK
system the interaction of amino acids with lanthanide and actinide ions and their
complexes in solution and the susceptibility of amino acid systems to radiolysis
Chapter 3 discusses work carried out at the INL on an L-alanine-buffered
system optimisation of the alanine system at pH 2 in order to maximise separation
potential and the consideration of other amino acid buffers over a range of pH values
Chapter 4 is focussed on an L-glutathione (GSH) buffered system GSH is a
tripeptide showing promise for an improved TALSPEAK system the next step after
research using single amino acids Data was initially obtained via solvent extraction in
order to investigate the separation ability of GSH and conditions were then optimised in
order to achieve maximum separation Interaction of the buffer with various
components in solution including lanthanide ions was probed using various techniques
including luminescence spectroscopy which was also used in determining the
susceptibility of the buffer to -radiolysis
Chapter 5 details the synthesis of amino acid appended DTPA ligands and their
complexation with lanthanide ions as well as their extraction and separation abilities
under different conditions along with radiolysis resistant investigations
77
1 S Cotton Lanthanide and Actinide Chemistry ed D Woolins R Crabtree D
Atwood and G Meyer John Wiley amp Sons Chichester UK 2006 1 1-7
2 C H Evans Episodes from the History of the Rare Earth Elements Kluwer
Academic Publishers Dordrecht Netherlands 1996
3 S Cotton Education in Chemistry 1999 36 4 96 WR Wilmarth RG Haire JP
Young DW Ramey JR Peterson J Less Common Metals 1988 141 275
4 LR Morss NM Edelstein and J Fuger The Chemistry of the Actindie and
Transactinide Elements Springer The Netherlands 4th edn 2010
5 AP Jones F Wall CT Williams Rare Earth Minerals Chemistry Origin and Ore
Deposits ed AP Jones F Wall and CT Williams Chapman and Hall London UK
1966 1 6-10
6 JJ Katz and GT Seaborg The Chemistry of The Actinide Elements Methuen amp Co
Ltd The Pitman Press Great Britain 1957
7 N Kaltsoyannis and P Scott The f elements ed R G Compton S G Davies J
Evans and L F Gladden Oxford University Press United States 1st edn 1999
8 Greenwood NN and Earnshaw A Chemistry of the Elements Butterworth-
Heinemann Great Britain 2nd edn1997
9 MB Jones AJ Gaunt Chem Rev 2012 DOI 101021cr300198m
10 L Natrajan F Burdet J Peacutecaut M Mazzanti J Am Chem Soc 2006 128 7152
11 C Fillaux D Guillaumont J-C Berthet R Copping D Shuh T Tyliszczak C
Den Auwer Phys Chem Chem Phys 2010 12 14253
12 HC Aspinall Chemistry of the f-block Elements ed D Phillips P OrsquoBrien and S
Roberts Gordon and Breach Science Publishers Singapore 2001 vol 5
13 F Gendron K Sharkas and J Autschbach J Phys Chem Lett 2015 6 2183-
2188
14 VBE Thomsen J Chem Educ 1995 72 (7) 616-618
15 Dr Louise Natrajan School of Chemistry The University of Manchester
16 JP Leonard CB Nolan F Stomeo and T Gunnlaugsson Topics in Current
Chemistry 2007 vol 281 pp1-43
17 Y Ma and Y Wang Co-ord Chem Rev 2010 254 972-990
18 LS Natrajan AN Swinburne MB Andrews S Randall and SL Heath Coordin
Chem Rev 2014 266-267 171-193
19 A Bettencourt-Dias Dalton Trans 2007 2229-2241
20 E Hashem AN Swinburne C Schulzke JD Kelly RC Evans JA Platts A
Kerridge LS Natrajan and RJ Baker RSC Adv 2013 3 4350
78
21 C Turro PK Fu and PM Bradley Met Ions Biol Syst 2003 40 323-353
22 Dr Louise Natrajan School of Chemistry The University of Manchester
23 I Billard and G Geipel Springer Ser Fluoresc 2008 5 465-492
24 A Beeby IM Clarkson RS Dickins S Faulkner D Parker L Royle AS de
Sousa JAG Williams and M Woods J Chem Soc Perkin Trans 2 1999 493-504
25 WD Horrocks and DR Sudnick J Am Chem Soc 1979 101 334
26 RM Supkowski and WD Horrocks Inorg Chim Acta 2002 340 44-48
27 Dummiesreg Nuclear Fission Basics httpwwwdummiescomhow-
tocontentnuclear-fission-basicshtml 2015
28 PE Hodgson Nuclear Power Energy and the Environment Imperial College Press
Great Britain 1999
29 P Dyck and MJ Crijns Rising Needs IAEA Bulletin 1998 40 1
30 World Nuclear Association The Nuclear Fuel Cycle httpwwwworld-
nuclearorginfoinf03html 2011
31 Nuclearmatterscouk Re-use of Plutonium as MOX Fuel
httpnuclearmatterscouk201202re-use-of-plutonium-as-mox-fuel 2012
32 World Nuclear Association Processing of Used Nuclear Fuel 2012
httpwwwworld-nuclearorginfoinf69htmla
33 United States Nuclear Regulatory Commission Neutron poison httpwwwnrcgov
2012
34 K L Nash Solvent Extraction and Ion Exchange 1993 114 729-768
35 M P Jensen L R Morss J V Beitz and D D Ensor Journal of Alloys and
Compounds 2000 303-304 137-141
36 Advanced Separation Techniques for Nuclear Fuel Reprocessing and Radioactive
Waste Treatment ed KL Nash and GL Lumetta Woodhead Publishing 1st edn
Cambridge UK 2011
37 CS Dileep Poonam Jagasia PS Dhami PV Achuthan AD Moorthy U
Jambunathan SK Munshi PK Dey and BS Tomar BARC Newsletter 2007 285
130-134
38 H Schmieder G Petrich and A Hollmann J Inorg Nucl Chem 1981 43 (12)
3373-3376
39 SC Tripathi and A Ramanujam Sep Sci and Technol 2003 38 2307
40 G Thiollet and C Musikas Solv Extr Ion Exch 1989 7 813
41 GL De Poorter and CK Rofer-De Poorter 720872 1976 US Pat 4080273 1978
79
42 EP Horwitz DC Kalina H Diamond GF Vandegrift and WW Schulz Solv
Extr Ion Exch 1985 31 75-109
43 A Banc P Bauduin and O Diat Chem Phys Lett 2010 494 (4-6) 301-305
44 J Muller L Bethon N Zorz and J-P Simonin Proceedings of the First ACSEPT
International Workshop 2010
45 C Brassier-Lecarme P Baron JL Chevalier and C Madic Hydrometallurgy
1997 47 57-67
46 O Courson R Malmbeck G Pagliosa K Romer B Satmark J-P Glatz P Baron
and C Madic Radiochim Acta 2000 88 865-871
47 M Sypula A Wilden C Schreinemachers and G Modolo Proceedings of the First
ACSEPT International Workshop 2010
48 C Hill L Berthon P Bros J-P Dancausse and D Guillaneux Nuclear Energy
Agency 7th Information Exchange Meeting Session II 2002
49 S Bourg C Hill C Caravaca C Rhodes C Ekberg R Taylor A Geist G
Modolo L Cassayre G de Angelis A Espartero S Bouvet N Ouvrier Nucl Eng
Des 2011 241 3427 G Modolo A Wilden A Geist D Magnusson R Malmbeck
Radiochim Acta 2012 100 715
50 A Geist U Muumlllich D Magnusson P Kaden G Modolo A Wilden T Zevaco
Solv Extr Ion Exchange 2012 30 433
51 A Wilden C Schreinemachers M Sypula G Modolo Solv Extr Ion Exch 2011
29 190
52 FW Lewis LM Harwood MJ Hudson MGB Drew V Hubscher-Bruder V
Videva F Arnaud-Neu K Stamberg and S Vyas Inorg Chem 2013 52 4993-5005
53 E Aneheim C Ekberg A Fermvik M R St J Foreman T Retegan and G
Skarnemark Solv Extr Ion Exch 2010 284 437-458
54 M Wei X Liu and J Chen J Radioanal Nucl Chem 2012 291 717-723
55 G Modolo P Kluxen A Geist Radiochim Acta 2010 98 193
56 C Rostaing C Poinssot D Warin P Baron and B Lorrain Procedia Chem 2012
7 349-357
57 S Chapron C Marie G Arrachart M Miguirditchian and S Pellet-Rostaing Solv
Extraction and Ion Exchange 2015 33 236-248
58 M Milsson and K L Nash Solvent Extraction and Ion Exchange 2009 273 354-
377
59 G Lumetta AV Gelis and GF Vandegrift Solv Extraction and Ion Exchange
2010 28 3 287-312
80
60 B Weaver and T A Kappelmann Talspeak A new method of separating americium
and curium from the lanthanides by extraction from an aqueous solution of an
aminopolyacetic acid complex with a monoacidic organophosphate or phosphonate
Oak Ridge National Laboratory 1964 1-60
61 K W Raymond General Organic and Biological Chemistry An Integrated
Approach John Wiley amp Sons USA 3rd edn 2010 7 253
62 L Karmazin M Mazzanti C Gateau C Hill and J Peacutecaut Chem Commun 2002
2892-2893
63 KL Nash Actinide Solution Chemistry Proceedings of the Eighth Actinide
Conference Actinides 2005
64 M P Jensen and A H Bond J Am Chem Soc 2002 124 9870-9877
65 L R Martin B J Mincher and N C Schmitt J Radioanal Nucl Chem 2009
282 523-526
66 S Oumlzҫubukҫu K Mandal S Wegner M P Jensen and C He Inorg Chem 2011
50 7937-7939
81
2 COMPLEXATION STUDIES OF Ln amp An WITH DTPA AND BUFFERS
UNDER TALSPEAK CONDITIONS
DTPA (diethylenetriaminepentaacetic acid) is an amino polycarboxylic acid
used to act as a holdback reagent in the TALSPEAK process (Trivalent Actinide
Lanthanide Separation by Phosphorus reagent Extraction from Aqueous Complexation)
an advanced reprocessing technique currently being developed in the USA (Section
137) DTPA is the chelating agent used as it has been shown to complex more strongly
to trivalent minor actinide ions (MA3+
) than lanthanide ions (Ln3+
) in aqueous solution
allowing selective extraction of lanthanides into an organic phase by organophosphate
HDEHP (di-(2ethylhexyl)phosphoric acid) to separate the two components
21 Introduction to An-DTPA and Ln-DTPA Complexes
It is widely known that DTPA ligands bind very well to metal ions in aqueous
media It is commonly used to extract heavy metals from soils for environmental
reasons1 and to treat heavy metal poisoning through its ability to chelate to heavy
metals making them more water soluble and able to be removed from the body
naturally by excretion2 Lanthanide DTPA complexes have been well established
although there is actually very little structural data available on them Most literature
references to lanthanide DTPA complexes discuss their use as MRI contrast agents the
most common choice being Gd-DTPA3 Other reported applications of DTPA-based
lanthanide complexes are for use as biological luminescent probes particularly with Eu4
and Tb5 Due to the highly hygroscopic nature of Ln-DTPA complexes solid state
structural analysis has only been reported in two instances as molecular structures
determined by X-ray absorption spectroscopy (XAS) one for Gd(III)-DTPA (Figure
21) and one for Eu(II)-DTPA6 Most solution state structural analysis for lanthanide
DTPA complexes has been carried out recently in order to better understand MALn
separation and TALSPEAK chemistry The only literature available on An-DTPA
complexes is related to separations chemistry except for actinium-DTPA used in
radiotherapy7
82
Figure 21 XAS molecular structure of Gd(III)-DTPA8
211 Stability of Ln-DTPA and An-DTPA Complexes
Reports on the formation of trivalent actinide complexes with DTPA detail that
the stability of AnDTPA2-
complexes (the dominant DTPA species present at pH 36
which is the pH currently used in the TALSPEAK process) is greater than the stability
of LnDTPA2-
complexes allowing the selective extraction on Ln3+
to take place For
LnDTPA2-
complexes stability constants range from log β = 1948 for La increasing
across the series up to log β = 2283 for Dy (with a slight dip at Gd) decreasing slightly
for the heavier Ln3+
complexes
Stability constants in the literature for AnDTPA2-
have been determined by a
range of techniques including TRLFS CE-ICP-MS spectrophotometry and solvent
extraction and range from log β = 2257 to 2403 for AmDTPA2-
and from log β = 2238
- 2348 for CmDTPA2-
at an ionic strength (I) of 01 M However there is some dispute
on whether AnHDTPA- complexes are also present in solution and this needs to be
accounted for when calculating stability constants as some of these values have been
determined with and some without consideration of AnHDTPA-9101112
Studies conducted by Martin et al determined stability constants of log β =
2219 - 2085 for CmDTPA2-
at I = 1 M over a temperature range of 10-70 degC
compared to log β = 2131 - 2033 for EuDTPA2-
over the same temperature range The
complex EuHDTPA- was found to have a stability constant of log β = 227 - 210 under
TALSPEAK conditions Europium(III)is used as a standard comparison to Am3+
Cm3+
due to the close similarity in chemistry between the elements as a result of their
electronic structures This data clearly shows that the Cm3+
has a higher binding
83
strength to DTPA5-
than Eu3+
The greater exothermic enthalpy of complexation of
CmDTPA2-
than EuDTPA2-
(-407 kJ mol-1
vs -336 kJ mol-1
) determined by
microcalorimetry indicated stronger covalent bonding of Cm3+
to DTPA5-
than Eu3+
Luminescence spectroscopy carried out in support of these studies found that
CmDTPA2-
has a shorter luminescence lifetime than EuDTPA2-
(268 micros in H2O 815 micros
in D2O for Cm3+
cf 630 micros in H2O 6200 micros in D2O for Eu3+
) This along with the
biexponential decay pattern indicating the presence of two species for Cm3+
was
attributed to faster exchange between Eu3+
and the ligandsolvent than for Cm3+
suggesting that the exchange for Eu3+
is not distinguishable on the luminescence
timescale and therefore less susceptible to the associated quenching effects This may be
due to the more ionic bonding of Eu3+
to the ligand
The pKa for the protonation of MDTPA2-
to MHDTPA- (M = metal ion) is 227
for Eu and 025 for Cm indicating that CmHDTPA- is only likely to be present in
solutions of very low pH (pH ltlt 1) It was hypothesised that the presence of
LnHDTPA- facilitates the exchange between ligand and solvent explaining the
observed difference in luminescence lifetime data consistent with stronger
complexation of MA3+
to DTPA and slower kinetics of MA3+
extraction as the
MDTPA2-
is less likely to dissociate13
212 Co-ordination Chemistry of Ln-DTPA and An-DTPA Complexes
It is known that Ln3+
ions co-ordinate to DTPA5-
in aqueous solution at pH 36
through the 5 deprotonated carboxylate groups (COO-) on the molecule and through the
three nitrogen atoms on the DTPA backbone forming an octadentate complex with one
water molecule in its inner hydration sphere giving the Eu3+
ion a co-ordination number
of 9 in the shape of a distorted capped square antiprism This is also the case for the
LnHDTPA- species
Figure 22 Chemical structure of [Eu(DTPA)]2-
84
The co-ordination mode of DTPA5-
to MA3+
is the same as for Ln3+
octadentate
(Figure 21) with a co-ordination number of 9 due to 1 water molecule bound to the
metal ion Hydration numbers of 2 have been reported for Cm-DTPA complexes but
have been found not to be stable14
DFT optimisation of CmDTPA2-
and EuDTPA2-
structures conducted by Martin
et al found that the M-O bond lengths were similar for both metal ions but that the M-
N bond lengths were shorter for Cm3+
than Eu3+
(by 004-008 Aring) Considering that
Cm3+
has a larger ionic radius than Eu3+
this suggests that Cm3+
binds more strongly to
the intermediate N donors on the DTPA molecule Further optimisations showed that
significant changes in bond lengths upon protonation of MDTPA2-
to MHDTPA-
indicated that M-N interactions are weakened to a greater extent for Cm3+
than Eu3+
so
that MHDTPA- is less likely to form for Cm
3+ in solution than Eu
3+ This data is
consistent with the pKa data for the complexes (Section 211)
22 Ln-DTPA Complexation Studies
As a first experiment (in order to verify the experimental procedures for
subsequent studies) the complex [Eu(DTPA)H2O]2-
was formed from europium nitrate
(1 mM) and Na5DTPA (005 M) in H2O and D2O at pH 36 and characterised by 1H
NMR spectroscopy (for the complex in D2O) and luminescence spectroscopy (D2O and
H2O)
221 1H NMR Studies of Ln-DTPA
1H NMR spectra are difficult to fully assign for Ln
3+ DTPA complexes due to
both the paramagnetic nature of the ions and the (fast) chemical exchange of the CH2
carboxylate and ethylene diamine backbone protons which results in significant
spectral broadening However complex formation can be verified at lower temperatures
(here 5 degC) where this conformational exchange is slowed down so the paramagnetic
broadening and shifting of the CH2 DTPA proton resonances can be observed in the 1H
NMR spectrum (Figure 23) by comparison with uncomplexed DTPA (Figures 24a-c)
85
EUDTPAESP
15 10 5 0 -5 -10 -15 -20
Chemical Shift (ppm)
0
0005
0010
0015
0020
0025
0030
0035
0040
0045
0050
0055
Norm
alized Inte
nsity
152
8
99
196
6
88
4
53
7
42
536
033
528
7
15
8
-01
1
-16
1
-40
6
-57
3-6
33
-105
3
-126
8
-148
3
-170
2
-184
7
Figure 23 1H NMR spectrum of [Eu(DTPA)]
2- in D2O at 278 K at pD = 36
DTPA pH71resp
55 50 45 40 35 30 25 20
Chemical Shift (ppm)
0
0005
0010
0015
0020
0025
0030
0035
0040
0045
0050
0055
0060
Norm
alized Inte
nsity
199100215418
DEUTERIUM OXIDE
Water
38
1
34
033
833
632
8
30
630
530
3
a
86
DTPA pH361resp
55 50 45 40 35 30 25 20
Chemical Shift (ppm)
0
0005
0010
0015
0020
0025
0030
0035
0040
0045
0050
0055
0060
Norm
alized Inte
nsity
204206100421
Water
47
647
5
38
5
35
634
634
434
3
31
531
431
2
DTPA pH21resp
55 50 45 40 35 30 25 20
Chemical Shift (ppm)
0
0005
0010
0015
0020
0025
0030
0035
0040
0045
0050
0055
0060
Norm
alized Inte
nsity
202199100406
Water
47
5 46
9
39
0
35
4
34
033
933
7
31
130
930
8
Figure 24 1H NMR spectra of DTPA in D2O at 278 K at varying pD a) pD 7
[DTPA]5-
b) pD 36 [H3DTPA]2-
c) pD 2 [H5DTPA]
222 Luminescence Studies of Ln-DTPA
Emission spectra were recorded for Eu
3+ (1 mM) with and without DTPA
5- (005
M) present in aqueous solution (Figure 25) following 397 nm excitation directly into
the 5L6 f-f absorption band
15 The formation of [Eu(DTPA)]
2- can be observed by the
splitting of the peaks in the emission spectrum of the complex compared to the free
Eu3+
(aq) representing the 5D0 rarr
7FJ transitions where J = 0 1 2 3 and 4 This is due to
crystal field splitting caused by the ligand and is indicative of strong binding of the
ligand to Eu3+
ion at pH 361617
The emission intensity is also significantly enhanced
upon the complexation of Eu3+
to DTPA5-
as the chelating ligand forms an octadentate
b
c
87
complex significantly lowering the degree of quenching of the emission by surrounding
solvent molecules
Figure 25 Emission spectrum of Eu3+
(aq) and [Eu(DTPA)]2-
in D2O at pD 36
Additionally the luminescence lifetimes of the free Eu3+
(aq) and the
[Eu(DTPA)]2-
complex were measured in D2O and H2O This allows calculation of q
which represents the number of bound solvent molecules in the inner hydration sphere
of the metal ion The original Horrocks equation18
(Equation 19) and modified
Horrocks equation1920
for q lt 2 (Equation 110) are shown below
Equation 21
Equation 22
The Horrocks equation uses the emission lifetimes (τ) to determine q A is the
proportionality constant taking into account the inner hydration sphere and B is a
correction factor taking into account the outer hydration sphere A and B values are
experimentally determined constants and are available for Sm3+
Eu3+
Tb3+
Nd3+
Yb3+
Am3+
and Cm3+
The q values can be effectively determined from solutions of water and
methanol For the original Horrocksrsquo equation A = 105 for Eu3+
and A = 42 for Tb3+
and for the modified Horrocksrsquo equation (when q lt 2 ) A = 12 ms and B = (025 ndash
0
2
4
6
8
10
12
14
16
18
550 570 590 610 630 650 670 690 710
Emis
sio
n In
ten
sity
(au
) x
10
00
0
Wavelength (nm)
[Eu(DTPA)]2-
Eu3+
5D0 rarr 7F0
5D0 rarr 7F1
5D0 rarr 7F2
5D0 rarr 7F3
5D0 rarr 7F4
88
0075x) ms-1
(where x = the number of exchangeable N-H oscillators) for Eu3+
and A =
5 ms and B = 006 ms-1
for Tb3+
The q value was found to be 9 for Eu3+
(aq) suggesting that the Eu3+
ion is
surrounded by 9 solvent molecules forming [Eu(H2O)9]3+
in aqueous solution as
expected For [Eu(DTPA)]2-
formed at pH 36 q was found to be 14 plusmn 02 showing that
only 1 water molecule is bound to the metal ion This compares well to the literature
values reported at pH 7 where the lifetimes are similar and q = 1121
23 An-DTPA Complexation Studies
The aminopolycarboxylate DTPA5-
chelates even more strongly to An3+
ions
than Ln3+
ions Preliminary 1H NMR and luminescence analyses were carried out by
Louise Natrajan at KIT-INE in Karlsruhe Germany on Am3+
and Cm3+
complexation
with DTPA as part of the FP7 EURACT-NMR scheme (Scheme 21)
Scheme 21 Complexation of DTPA to Am3+
and Cm3+
231 1H NMR Studies of An-DTPA
The complex [Am(DTPA)xH2O]2-
was formed and analysed by 1H NMR in a
41 ratio of MeODD2O with an additional drop of NaOD to ensure complex formation
from a dried acidic americium nitrate stock salt and Na5DTPA The spectra were taken
over a temperature range of 210-365 K at ~ pD 3 (Figure 26) Note here that the exact
pD of the solution could not be accurately measured due to the high specific activity of
the 241
Am isotope used From the spectrum it can be seen that at pD 3 there is a DTPA
complex formed and that at higher temperatures there are some dynamic exchange
processes occurring as the resonances become broader and the spectrum becomes
simpler This is most likely due to conformational changes in the DTPA ligand
(movement of the carboxylates and the ethylene bridge protons analogous to DOTA
and DO3A derivatives)22
The Am3+
ion is essentially diamagnetic as it has a 7F0 ground state and the
magnetic moment is calculated as 0 based on the Russell Saunders coupling scheme
89
The same is true for the isoelectronic lanthanide analogue Eu3+
but in this ion
significant paramagnetism is induced at room temperature due to low-lying energy
levels that are thermally populated according to the Boltzmann distribution Thermal
mixing of J states induces a paramagnetic shift but in the case of Am3+
the second J
level lies much higher in energy (~ 4000 cm-1
higher) so may only be populated and
induce a paramagnetic shifting of proton resonances at higher temperatures2324
Indeed
a slight shift of the proton resonances with temperature is observed for
[Am(DTPA)xH2O]2-
potentially indicating a small contribution of the Am3+
7F1 excited
state to the chemical shift of the proton resonances
Figure 26 1H NMR spectrum for [Am(DTPA)xH2O]
2- in 41 vv MeODD2O with
NaOD over a temperature range at pH 3
232 Luminescence Studies of An-DTPA
Emission spectra were recorded for solutions of
243Cm
3+ (015 microM Cm
3+ in 32
mM HClO4 diluted to 1 mL with H2O) with and without Na5DTPA (02 M) present in
aqueous solution following direct excitation at 3966 nm into the f-f absorption band of
Cm3+
(Figure 27) The formation of [Cm(DTPA)]2-
can be observed by the immediate
formation of a new red shifted emission band at 607 nm attributed to the 6D72
8S72
transition in the complex compared to that in free Cm
3+(aq)
at 593 nm The f-f transitions
in Cm3+
are much more sensitive to the coordination environment than Ln3+
due to more
210 K
265 K
300 K
365 K
90
spin orbit coupling and the fact the 5f orbitals are more spatially diffuse than the 4f
orbitals resulting in a much greater difference in emission spectra upon complexation
for actinides than lanthanides
Figure 27 Emission spectrum of Cm3+
and [Cm(DTPA)]2-
in perchloric acid at pH 3
by direct excitation with a NdYAG pumped dye laser at 3966 nm
Similarly to Eu3+
the inner hydration sphere of the free Cm3+
ion is known to
contain 9 water molecules25
In 1998 Kimura and Choppin developed a modified
version of the Horrocks equation in order to allow q to be calculated from aqueousnon-
aqueous solvent mixtures (Equation 23)26
Equation 23
The lifetime of the [Cm(DTPA)]2-
complex in H2O is 510 micros and is significantly
longer than that of the aqua ion which is determined as 68 micros The radiative lifetime of
the complex can be directly inserted into this equation and indicates that there are 16
water molecules (between 1 and 2) co-ordinated to the metal ion again showing the
formation of an octadentate complex with DTPA ligand analogously to Eu3+
24 Introduction to Buffer Interaction with Ln3+
and Ln-DTPA Complexes
241 Interaction of Lactate with Ln3+
and Ln-DTPA Complexes
A lactic acidlactate buffer is used in the TALSPEAK process to buffer the
system to pH 36 Lactate (Lac) is known to co-ordinate to M3+
ions27
to form
40
45
50
55
60
65
70
75
80
570 590 610 630
Emis
sio
n In
ten
sity
(au
) Tho
usa
nd
s
Wavelength (nm)
Cm3+(aq)
[Cm(DTPA)]2-
91
M3+
(CH3CH(OH)COO-)3 Equations 24a-c show the formation of Eu
3+-lactate
complexes
Equation 24a-c
(a)
(b)
(c)
Stability constants for each of the species formed in Equations 24a-c were
determined by Martin et al over a temperature range of 0-70 degC Log β values were
found to be 290-281 for Eu(Lac)2+
log β = 490-449 for Eu(Lac)2+ and log β = 624-
633 for Eu(Lac)3 Luminescence spectroscopy of Eu-lactate formation showed that as
the concentration of lactate was increased from 0 mM to 73 mM the emission intensity
of the J=2 peak (5D0 rarr
7F2 transition) at 615-620 nm increased but the J=1 peak (
5D0 rarr
7F1 transition) at 590-600 nm was not significantly affected changing the J=1J=2 peak
ratio suggesting that the co-ordination mode of the lactate to the Eu3+
ion changes as a
function of lactate concentration as the J=1 peak is a magnetic dipole transition which is
insensitive to the co-ordination of the ion (Figure 28)28
Figure 28 Emission spectrum of Eu-lactate as a function of lactate concentration28
The luminescence lifetimes of Eu3+
in water also increased as the lactate
concentration was increased indicating that the number of water molecules directly co-
ordinated to the metal ion decreases from ~9 to ~5 due to complexation with lactate
Luminescence and thermodynamic data suggest that lactate co-ordinates in a bidentate
92
mode to Ln3+
ions through the deprotonated carboxylate group and also through the α-
hydroxyl group (Figure 29) making Ln-lactate complexes more stable than simple
monocarboxylates with monodentate co-ordination28
Figure 29 Co-ordination mode of lactate to Eu3+
28
The interaction of lactate ions with metal-DTPA complexes is less well
understood It is considered that there is an exchange between the Ln3+
ion and the
lactate and DTPA ligands The concentration of lactate has been shown by Nash et al to
affect the complexation and dissociation of [Ln(DTPA)]2-
however it is not understood
whether this is due to the changing pH with lactate concentration since extraction in the
TALSPEAK process is heavily dependent on pH29
TALSPEAK extractions using
lactate without DTPA show poor separation of Ln3+
over Am3+
DTPA is required to
achieve separation of MA3+
from Ln3+
as lactic acid acts only as a buffer and not a
holdback reagent
Research has shown previously that binary complexes are dominant in the
TALSPEAK process chiefly in the form of MDTPA2-
and M(Lac)n3-n
Studies carried
out using spectrophotometry luminescence spectroscopy and thermometric
experiments have shown that ternary M3+
-DTPA-lactate complexes with lactate co-
ordinated directly to the metal centre are only present in very small quantities and so
will have negligible effect on metal separation However it is possible that outer sphere
ternary M3+
-DTPA-lactate complexes may form where the lactate interacts with the
DTPA molecule although it is expected these would also be present only in minor
quantities and so would also have negligible effect on metal separation30
242 Interaction of Amino Acids with Ln3+
and Ln-DTPA Complexes
The potential of using amino acids as a combined buffer and soft donor was
considered as it was thought that the increased number of softer donors on amino acids
93
compared to lactate may remove the need for the separate buffer and DTPA holdback
reagent if amino acids were found to preferentially bind to MA3+
in solution There have
been few studies on the interaction of amino acids with lanthanide ions and none with
actinide ions or with DTPA Stability constants for amino acids with lanthanide ions31
can be found in the literature and like stability of lactate complexes with Ln3+
ions32
generally tend to increase across the lanthanide series from La-Lu as the Lewis acidity
of the metal ions increases The values are close to the stability constants for Ln-lactate
complexes averaging at around 5-6 depending on the metal ion and amino acid Log β
values for La-Sm with glycine range from 532-584 and with L-alanine log β = 582-
668
25 Studies on Buffer Interaction with M3+
and [M(DTPA)]2-
Initial studies in this area considered the interaction of various amino acids and
lactate with lanthanide ions in TALSPEAK systems The amino acids glycine L-alanine
and L-serine (Figure 210) were chosen to begin this research due to their similarity in
molecular structure to lactate and good solubility in water
Figure 210 Chemical structures of L-alanine (top) glycine (bottom left) and L-serine
(bottom right)
251 1H NMR Studies on Buffer Interactions
L-alanine (1 M) was added to Eu(NO3)3 (10 mM) in D2O and analysed by
1H
NMR spectroscopy (Figure 211) The spectrum shows that L-alanine complexes
weakly with the metal ion as there is minimal paramagnetic line broadening and only
slight shifting of the proton resonances from that of L-alanine itself (Figure 212)
94
New Eu Ala0011resp
55 50 45 40 35 30 25 20 15 10 05 0
Chemical Shift (ppm)
0
005
010
015
Norm
alized Inte
nsity
310100
CH3
CH
Water
47
147
1
35
5
12
712
6
Figure 211 1H NMR spectrum of Eu(NO3)3xH2O (10 mM) with L-alanine in D2O at
278 K
Ala1resp
55 50 45 40 35 30 25 20 15 10 05 0
Chemical Shift (ppm)
0
01
02
03
04
05
06
07
08
09
10
Norm
alized Inte
nsity
336100
CH3
CH
Water
36
536
336
2
13
3
Figure 212 1H NMR spectrum of L-alanine in D2O at 278 K
95
The interaction of L-alanine (1 M) with [Eu(DTPA)]2-
(10 mM) in D2O was also
investigated by 1H NMR spectroscopy (Figure 213) This spectrum shows that the L-
alanine does not bind to the europium DTPA complex on the experimental timescale as
there is no paramagnetic broadening or shifting of the amino acid peaks and the ligand
is present as uncomplexed ligand
EuDTPA Ala1esp
15 10 5 0 -5 -10 -15 -20
Chemical Shift (ppm)
0005
0010
0015
0020
0025
0030
0035
Norm
alized Inte
nsity
150
5 96
892
185
2
75
4
50
4
39
533
231
625
8
14
6
05
0
-13
1
-44
2
-63
3-6
86
-108
2
-127
6
-143
1
-169
0
-183
9
Figure 213 1H NMR spectrum of [Eu(DTPA)]
2- (10 mM) with L-alanine (1 M) in D2O
at 278 K
252 Luminescence Studies on Buffer Interactions
2521 Sensitisation Tests
Luminescence studies on a [Tb(DTPA)]2-
(1 mM) complex in the presence of
the amino acid L-phenylalanine (05 M) (Figure 215) at pH 3 were initially carried out
in order to determine if sensitised emission occurs whereby energy would be
transferred from the phenyl chromophore of the amino acid to the metal ion This could
potentially occur if the amino acid was in close proximity (ie bound) to the metal ion
and would give some indication into the interaction between the amino acid and the
metal ion However sensitised emission was found not to occur as when the complex
was excited in the region of the phenyl chromophore (250 nm) no emission occurred
When excited directly into the f-f region of the Tb3+
complex at 379 nm there was a
slight decrease in emission intensity upon the addition of L-phenylalanine however the
decrease is not significant The excitation spectrum was recorded of the emission at 545
96
nm and showed only the presence of f-f transitions and no contribution from the organic
region (Figure 214)
Figure 214 Emission spectra of [Tb(DTPA)]2-
in D2O at pD 3 with and without the
presence of L-phenylalanine (05 M) excited at 250 nm and 379 nm Excitation
spectrum of [Tb(DTPA)]2-
in D2O at pD 3 with L-phenylalanine (05 M) at 545 nm
Figure 215 Chemical structure of L-phenylalanine
2522 Aqueous Phase Lanthanide Studies without Na5DTPA
Emission spectra of Eu3+
(1 mM Eu(NO3)3) were taken in D2O and H2O with the
presence of different amino acidslactate (1 M) in order to determine whether the amino
acids bind to the metal ions at pH 36 (TALSPEAK pH) The emission spectrum of the
free metal ion in solution was also measured for comparison (Figure 216)
0
100
200
300
400
500
600
700
0
5
10
15
20
25
30
220 320 420 520 620
Ab
sorp
tio
n In
ten
sity
(au
) Th
ou
san
ds
Emis
sio
n In
ten
sity
(au
) Th
ou
san
ds
Wavelength (nm)
TbDTPA exc 379 nm
TbDTPA + Phe exc 250 nm
TbDTPA + Phe exc 379 nm
Excitation of TbDTPA + Phe at 545 nm
97
Figure 216 Emission spectra of Eu(NO3)3 in D2O at pD 36 with and without the
presence of amino acidslactate (1 M) excited at 395 nm at 298 K
The emission intensity increases upon the addition of amino acidslactate to Eu3+
in D2O This shows that the amino acids are interacting with the metal ion however the
emission spectra resemble that of the free aqua ion suggesting that the amino acids and
lactate are not binding to the metal ion The presence of the amino acids at such a high
concentration will reduce quenching effects from the surrounding solvent molecules
which may be one explanation for the increased emission intensity At pH 36 the
amino acids will be in their zwitterionic form (H3N+-CHR-COO
-) and so are likely to
co-ordinate with the free metal ion in the same manner as lactate however this co-
ordination appears to be very weak and they are probably in fast exchange with
surrounding water molecules
The q values of the Eu3+
ions were calculated from the luminescence lifetimes in
H2O and D2O using the original Horrocks equation (Equation 19) The results can be
seen in Table 21
0
2
4
6
8
10
12
14
550 570 590 610 630 650 670 690 710
Emis
sio
n In
ten
sity
(au
) x
10
00
0
Wavelength (nm)
Eu3+
Eu-Lactate
Eu-Gly
Eu-Ala
Eu-Ser
98
Table 21 Luminescence lifetimes and q values for Eu3+
with amino acidslactate
Estimated error on lifetimes = plusmn 10 and on q plusmn 02
The number of bound solvent molecules in the inner hydration sphere of Eu3+
decreases with the addition of amino acidslactate from 9 to approximately 6 This is
consistent with possible fast exchange of water molecules with co-ordinated amino
acids and shows that an average of 3 amino acidslactate ions are co-ordinating to the
metal
2523 Aqueous Phase Lanthanide Studies with Na5DTPA
Emission spectra of Eu(NO3)3 (1 mM) with Na5DTPA (01 M) were recorded in
D2O and H2O with the presence of different amino acidslactate (1 M) at pH 36 in order
to determine whether the amino acids bind to the complexed metal (Figure 217)
Figure 217 Emission spectra of Eu-DTPA in D2O at pD 36 with and without the
presence of amino acidslactate (1 M) excited at 395 nm
0
5
10
15
20
25
550 600 650 700
Emis
sio
n In
ten
sity
(au
) x
10
00
0
Wavelength (nm)
EuDTPA
EuDTPA-Lactate
EuDTPA-Gly
EuDTPA-Ala
EuDTPA-Ser
τ in H2O (ms) τ in D2O (ms) q
Eu3+
011 165 89
Eu Lactate 016 194 60
Eu Gly 016 183 60
Eu Ala 016 187 60
Eu Ser 019 147 48
99
The emission intensity does not change upon the addition of amino acidslactate
to [Eu(DTPA)]2-
in D2O These spectra also do not change shape and there is no
observable shift resembling that of the [Eu(DTPA)]2-
species suggesting that the amino
acids and lactate are not binding to the metal complex
The q values of the Eu3+
ions were calculated from the luminescence lifetimes in
H2O and D2O using the original Horrocks equation (Equation 19) The results can be
seen in Table 22
Table 22 Luminescence lifetimes and q values for [Eu(DTPA)]2-
with amino
acidslactate Estimated error on lifetimes = plusmn 10 and on q plusmn 02
From these kinetic data it is clear that q does not change for [Eu(DTPA)]2-
upon
the addition of amino acidslactate showing that there is no significant interaction with
the Eu3+
ion and they do not bind to the metal ion of the complex This may be due to
steric factors as the DTPA5-
is octadentate and fully complexed to the metal ion leaving
room for only 1-2 solvent molecules to bind to the ion and making it difficult for any
larger species to exchange
2524 Aqueous Phase Actinide Studies with Na5DTPA
In order to determine whether amino acids interacted any more with actinides
than lanthanides the emission spectrum of [Cm(DTPA)]2-
(1 mM) was taken with the
addition of L-alanine (25 mM) at KIT-INE Karlsruhe (Figure 218)
τ in H2O τ in D2O q
Eu DTPA 063 230 23
Eu DTPA Lactate 063 216 22
Eu DTPA Gly 065 203 20
Eu DTPA Ala 065 209 21
Eu DTPA Ser 065 208 21
100
Figure 218 Emission spectrum of [Cm(DTPA)]2-
in H2O with and without L-alanine
(25 mM) at pH 3 by direct excitation at 396 nm The spectra are reported uncorrected
for differences in the incident laser power for clarity
Upon addition of L-alanine there is no change in the emission spectrum - no red
shift or change in emission intensity (quantum yield) compared to complexation of
Cm3+
to DTPA5-
(Figure 26) Moreover the luminescence lifetime is the same as
[Cm(DTPA)]2-
and there is no change in the calculated value of q indicating either no
interaction of the L-alanine with the complex or a very weak interaction such as fast
exchange of the buffer and bound solvent molecules showing that the L-alanine does
not strongly interact with Cm3+
253 Radiolysis Studies on Amino Acid Buffered Systems
2531 Previous Studies at the INL
The TALSPEAK process is known to be relatively resistant to radiation effects
both alpha and gamma radiation when compared to the PUREX and SANEX
processes33
The use of lactic acid buffer has been shown to reduce the degradation of
DTPA by radiolysis34
although the chemistry of the lactic acidlactate ion interaction
with the system is still not clear α radiolysis experiments were carried out at INL by the
Martin group initially on lactic acid and then on an L-alanine system in order to
determine the temperature-dependent rate constants of the reaction of the hydroxyl
radical (middotOH) with the buffers at pH 3 (Figure 219) It is thought that at this pH
oxidising reactions are dominant since dissolved O2 in the solution would remove most
40
45
50
55
60
65
70
75
80
570 580 590 600 610 620 630 640
Emis
sio
n In
ten
sity
(au
) Tho
usa
nd
s
Wavelength (nm)
[Cm(DTPA)]2-
[Cm(DTPA)]2- + Ala
101
of the hydrated electrons (e-(aq)) and middotH radicals caused by radiolysis leaving middotOH
radicals present in solution The rate constants were measured using Linear Accelerator
(LINAC) electron pulse radiolysis
Measurements showed that the reaction rate of the middotOH radical with L-alanine is
slower than with lactic acid suggesting that a modified version of the TALSPEAK
process using amino acids would be more resistant to radiolysis
Figure 219 Graph illustrating the rates of reaction of the middotOH radical with L-
alanine compared to lactic acid and the lactate ion 35
Further studies at the INL were carried out on the L-alanine to measure the
effect of γ-radiation on the separation of Eu3+
from Am3+
These studies were carried
out by varying the γ radiation dose (5 ndash 50 kGy) the pH (2 ndash 3) and the L-alanine
concentration (05 ndash 15 M) The extraction of Ln3+
ions was found not to be affected by
increasing the dose to both phases and the extraction of Am3+
was found to increase
only slightly as the dose was increased (Figure 220) The results show that the effect of
γ-radiation on the separation factors is negligible with increasing dose (Table 23)
32 33 34 3517
18
19
20
21
Alanine (pH 30)
Lactate ion (pH 60)
Lactic acid (pH 10)
ToC k M
-1 s
-1Error
1046 59E7 49E6
306 849E7 421E6
305 832E7 419E6
402 102E8 816E6
Arrhenius OH amp lactate at pH 30
Int ln(A) = 2353 plusmn 115
Ea = 1333 plusmn 289 kJ mol-1
R2 = 0990
ln (
kM
-1 s
-1)
103Temp (K)
102
Figure 220 Distribution ratios for Ln3+
and Am3+
in the presence of L-alanine
at 05 M pH 2 at different doses of γ-radiation36
Table 23 Separation factors for Eu3+
Am3+
in the presence of L-alanine at 05 M under
TALSPEAK conditions when subjected to different doses of γ-radiationError Bookmark
not defined
Separation Factor EuAm
5 kGy 10 kGy 50 kGy 100 kGy
pH 2 5620 5519 5132 5103
pH 3 1595 1653 1589 1252
2532 Irradiation Studies using Amino Acid Buffers
The [Eu(DTPA)]2-
systems at pH 36 were irradiated with γ radiation using a
60Co irradiator at the Dalton Cumbrian Facility to determine the effect of radiation on a
range of amino acid buffers
103
Figure 221 Emission spectra of Eu3+
in D2O at pD 36 with and without the presence
of amino acidslactate excited at 395 nm before 5 kGy γ-irradiation
Figure 222 Emission spectra of Eu3+
in D2O at pD 36 with and without the presence
of amino acidslactate excited at 395 nm after 5 kGy γ-irradiation
The emission intensity of the irradiated samples (Figure 222) was lower than
before irradiation (Figure 221) which is likely to be due to quenching effects from
radicals produced by degradation of the solvent However the spectral profiles remain
0
50
100
150
200
250
550 600 650 700
Emis
sio
n In
ten
sity
(au
) Th
ou
san
ds
Wavelength (nm)
EuDTPA
EuDTPA-Lactate
EuDTPA-Gly
EuDTPA-Ala
EuDTPA-Ser
0
20
40
60
80
100
120
140
550 600 650 700
Emis
sio
n In
ten
sity
(au
) Th
ou
san
ds
Wavelength (nm)
EuDTPA
EuDTPA-Lactate
EuDTPA-Gly
EuDTPA-Ala
EuDTPA-Ser
104
the same and still resemble that of [Eu(DTPA)]2-
and t-tests showed that there was no
significant difference between the spectra of each of the buffers
The luminescence lifetimes were also measured for samples before and after
irradiation and before and after extraction into an organic phase (02 M HDEHP in
dodecane) (Table 24)
Table 24 Luminescence lifetimes for aqueous and organic phases for
[Eu(DTPA)]2-
systems before and after irradiation at pH 36 Estimated error on
lifetimes = plusmn 10
Table 25 Luminescence lifetimes and q values for [Eu(DTPA)]2-
systems before and
after irradiation at pH 36 Estimated error on lifetimes = plusmn 10 and on q = plusmn 02
τ of aqueous
phase
before
irradiation
(ms)
τ of aqueous
phase
after
irradiation
(ms)
τ of
organic
phase
before
irradiation
(ms)
τ of
organic
phase
after
irradiation
(ms)
Eu DTPA 063 066 222 262
Eu DTPA Lactate 063 063 241 251
Eu DTPA Gly 065 064 247 249
Eu DTPA Ala 065 065 211 238
Eu DTPA Ser 065 062 260 251
τ of
aqueous
phase
before
irr [H2O]
(ms)
τ of
aqueous
phase
after
irr[H2O]
(ms)
τ of
aqueous
phase
before irr
[D2O] (ms)
τ of
aqueous
phase
after irr
[D2O] (ms)
q
before
irr
q after
irr
Eu DTPA 063 066 230 227 11 10
Eu DTPA
Lactate
063 063 216 210 10 10
Eu DTPA
Gly
065 064 203 208 10 10
Eu DTPA
Ala
065 065 209 211 10 10
Eu DTPA
Ser
065 062 208 206 10 10
105
There was negligible change in luminescence lifetime before and after
irradiation for both aqueous and organic sample sets There was also no change in
hydration number q before and after irradiation of the aqueous phase (Table 25)
These data along with the consistent profiles of the emission spectra is analogous with
the radiolysis data from the INL and shows that the amino acid buffers glycine alanine
and serine are relatively resistant to -radiolysis
254 Buffer Interaction Summary
The potential of using amino acids as a combined buffer and soft donor was
initially investigated by considering the interaction of the buffers glycine L-alanine L-
serine L-phenylalanine and lactate (for comparison) with Eu3+
and [Eu(DTPA)]2-
systems It was found by 1H NMR and luminescence spectroscopies that amino acids
and lactate do not form stable complexes with either the free metal ion or the metal-
DTPA complex and that the buffers may be in fast exchange with surrounding solvent
molecules Luminescence studies on L-phenylalanine showed that this amino acid does
not bind to the metal ion as there was no sensitised emission from Tb3+
ion when
excited into the phenyl chromophore of the amino acid when the two components were
in solution Emission spectra of Eu3+
and Cm3+
aqua ions and their corresponding
DTPA complexes showed no change (no peak splitting or shifting) upon the addition of
amino acidslactate
The number of water molecules in the inner hydration sphere (q) of Eu3+
was
reduced from 9 to ~6 when buffers were added to the aqua ion in solution suggesting
that the amino acids are interacting with the metal ion but are likely to be in fast
exchange with surrounding solvent molecules There was no change in q when buffers
were added to metal-DTPA complexes in solution for Eu3+
or Cm3+
Radiolysis studies were carried out on lactate and amino acid buffered
[Eu(DTPA)]2-
systems and it was found that the systems are relatively resistant to γ-
radiation when exposed to 5 kGy This is consistent with previous work conducted by
the INL showing that separation systems using L-alanine as a buffer are more resistant
to radiolysis than the original TALSPEAK process using lactate
106
1 G Muumlhlbachovaacute Rostlinnaaacute Vyacuteroba 2002 48 12 536ndash542
2 JSF Swaran and V Pachauri Int J Environ Res Public Health 2010 7 7 2745-
2788
3 M Regueiro-Figueroa and C Platas-Iglesias J Phys Chem A 2015 119 6436-
6445
4 N Mignet Q de Chermont T Randrianarivelo J Seguin C Richard M Bessodes
and D Scherman Eur Biophys J 2006 35 155-161
5 CL Davies and A-K Duhme-Klair Tetrahedron Lett 2011 52 4515-4517
6 G Moreau L Burai L Helm J Purans and AE Merbach J Phys Chem A 2003
107 758-769
7 KA Deal IA Davis S Mirzadeh SJ Kennel and MW Brechbiel J Med Chem
1999 42 15 2988ndash2992
8 S Beacutenazeth J Purans M-C Chalbot MK Nguyen-van-Duong L Nicolas K
Keller amp A Gaudemer Inorg Chem 1998 37 3667-3674
9 A Delle Site RD Baybarz J Inorg Nucl Chem 1969 31 2201
10 IA Lebedev VT Filimonov AB Shalinets GN Yakovlev Sov Radiochem
1968 10 94
11 I Bayat KFK
Berichte-1291 Karlsruhe Germany 1970
12 P Thakur JL Conca CJ Dodge AJ Francis GR Choppin Radiochim Acta
2013 101 221
13 G Tian LR Martin and LRao Inorg Chem 2015 54 1232-1239
14 S Leguay T Vercouter S Topin J Aupais D Guillaumont M Miguirditchian P
Moisy and C Le Naour Inorg Chem 2012 51 12638-12649
15 M Nazarov and D Young Noh New Generation of Europium and Terbium
Activated Phosphors 2011 247
16 K N Shinde S J Dhoble H C Swart and K Park Phosphate Phosphors for Solid
State Lighting Springer Series in Materials Science Springer 2012 174 41-59
17 K S Wong T Sun X-L Liu J Pei and W Huang Thin Solid Films 2002 417 85-
89
18 WD Horrocks and DR Sudnick J Am Chem Soc 1979 101 334
19 A Beeby IM Clarkson RS Dickins S Faulkner D Parker L Royle AS de
Sousa JAG Williams and M Woods J Chem Soc Perkin Trans 2 1999 493-504
20 RM Supkowski and WD Horrocks Inorg Chim Acta 2002 340 44-48
107
21 CF Geraldes AD Sherry WP Cacheris KT Kuan RD 3rd Brown SH
Koenig and M Spiller Magn Reson Med 1988 8 2 191-9
22 E Csajboacutek I Baacutenyai and E Bruumlcher Dalton Trans 2004 14 2152-2156
23 JJ Howland and M Calvin J Chem Phys 1950 83 239
24 J E Sansonetti and W C Martin Handbook of Basic Atomic Spectroscopic Data
httpphysicsnistgovPhysRefDataHandbookTables National Institute of Science
and Technology USA 2005
25 T Kimura and G R Choppin J Alloys Compounds 1994 213 313
26 T Kimura Y Kato H Takeishi and G R Choppin J Alloys Compounds 1998
271273 719
27 T L Griffiths Investigations of Ternary Complexes Relevant to the Nuclear Fuel
Cycle 2011 The University of Manchester PhD Thesis
28 G Tian LR Martin and L Rao Inorg Chem 2010 49 10598-10605
29 K L Nash D Brigham T C Shehee and A Martin Dalton Trans 2012 41
14547-14556
30 CJ Leggett G Liu and MP Jensen Solv Extraction and Ion Exchange 2010 28
313-334
31 A Miličević and N Raos Acta Chim Slov 2014 61 904-908
32 VV Nikonorov J Anal Chem 2010 65 4 359-365
33 D Magnusson B Christiansen R Malmbeck and JP Glatz Radiochim Acta 2009
97 9 497-502
34 B Weaver and T A Kappelmann Talspeak A new method of separating americium
and curium from the lanthanides by extraction from an aqueous solution of an
aminopolyacetic acid complex with a monoacidic organophosphate or phosphonate
Oak Ridge National Laboratory 1964 1-60
35 LR Martin S P Mezyk and BJ Mincher J Phys Chem A 2009 113 141-145
36 Dr Leigh Martin Idaho National Laboratory unpublished results
108
3 SOLVENT EXTRACTION AND OPTIMISATION STUDIES WITH AMINO
ACID BUFFERS
As discussed in Chapter 2 the potential of using amino acids as a combined
buffer and soft donor to replace the lactate buffer and holdback reagent DTPA
(diethylenetriaminepentaacetic acid) in the TALSPEAK process (Trivalent Actinide
Lanthanide Separation by Phosphorus reagent Extraction from Aqueous Complexation)
was investigated Initial complexation studies by 1H NMR and luminescence
spectroscopies showed that amino acids do not form stable complexes with actinide or
lanthanide ions or AnLn-DTPA complexes in aqueous solution and that like lactate
they are in fast exchange with surrounding water molecules Separation studies were
carried out by our collaborators at the Idaho National Lab (Travis Grimes Richard
Tillotson and Leigh Martin) to determine whether amino acids could be used as buffers
or as combined bufferssoft-donors to facilitate Ln3+
MA3+
separation A summary of
this work can be found below in Section 31 Their initial studies were used as the basis
for the work conducted as part of this research project (Sections 32 and 33)
31 Previous work at the INL1
311 L-alanine Studies
3111 pH Studies on L-alanine
L-alanine was initially chosen as a potential replacement for lactic acid as a
buffer as the two molecules differ only by the α-group (α-amino on L-alanine compared
to α-hydroxy group on lactic acid) The pKa values of the compounds are 24-26 for L-
alanine and 36-38 for lactic acid depending on the background electrolyte Studies
carried out on the L-alanine found that the separation factors were in fact reduced
compared to the traditional TALSPEAK method when L-alanine was used as a buffer at
pH 2 and pH 3 in place of lactic acid The separation factors were generally lower as the
distribution ratios for Am3+
(DAm) were significantly increased (2 orders of magnitude
higher) when L-alanine was used at pH 3 (DAm 012) and pH 2 (DAm 038-047)
compared to lactic acid at pH 3 (DAm 0009) However the studies carried out at pH 2
resembled a typical TALSPEAK curve and gave overall the best separation of
lanthanides over Am3+
as can be seen in Figure 31 Although separation occurs in the
L-alanine system at pH 3 the separation is better at pH 2 At pH 3 it can be seen that
separation is decreased for the heavier lanthanides This is due to slow phase-transfer
kinetics previously reported by Weaver and Kappelmann2 and Kolarik
3 A pH 1 system
109
does not allow separation of the earlier lanthanides from americium The distribution
ratios for lanthanides in a typical TALSPEAK system can be seen in Figure 32 for
comparison
086 088 09 092 094 096 098 1
10-2
10-1
100
101
102
5x10²
086 088 09 092 094 096 098 1
10-2
10-1
100
101
102
5x10²
pH 1
pH 2
pH 3
Am pH 1
Am pH 2
Am pH 3
[Alanine] = 05 M
[DTPA] = 0050 M
[HDEHP] = 02 M
Organic Diluent
Dodecane
DM
1r Aring
DM
15 M Alanine
10 M Alanine
05 M Alanine
Am 15 M Alanine
Am 10 M Alanine
Am 05 M Alanine
[DTPA] = 0050 M
[HDEHP] = 02 M
Organic Diluent
Dodecane
pH 2
1r Aring
Figure 31 The effect of pH on an L-alanine-buffered TALSPEAK system
Figure 32 Distribution ratios of Ln3+
Y3+
in a TALSPEAK system 1 mM LnY3+
1 M
lactate 005 M DTPA pH 7 extracted using 05 M HDEHP in 14-DIPB4
110
3112 Concentration Effects
The effect of the concentration of L-alanine was also considered and it was
found that the effect on the trend of separation factors across the lanthanide series was
the same as for lactate and the changes were negligible as can be seen from Figure 33
Slower extraction rates were observed for the heaviest lanthanides at lower buffer
concentrations (05 M than 10 or 15 M) for both L-alanine and lactic acid Since it was
found that there was no benefit to changing the L-alanine buffer concentration further
studies were carried out to investigate the potential of using the amino acid to carry out
the process at the lower pH of 2 as although the separation factors are lower than in
lactic acid buffered systems the values are still high enough to give sufficient
separation (see Table 31)
086 088 09 092 094 096 098 1
10-2
10-1
100
101
102
5x10²
086 088 09 092 094 096 098 1
10-2
10-1
100
101
102
5x10²
pH 1
pH 2
pH 3
Am pH 1
Am pH 2
Am pH 3
[Alanine] = 05 M
[DTPA] = 0050 M
[HDEHP] = 02 M
Organic Diluent
Dodecane
DM
1r Aring
DM
15 M Alanine
10 M Alanine
05 M Alanine
Am 15 M Alanine
Am 10 M Alanine
Am 05 M Alanine
[DTPA] = 0050 M
[HDEHP] = 02 M
Organic Diluent
Dodecane
pH 2
1r Aring
Figure 33 The effect of buffer concentration on an L-alanine-buffered TALSPEAK
system
111
Table 31 Distribution ratios and separation factors for a number of L-alanine buffered
TALSPEAK systems as pH and buffer concentration are varied compared to a
traditional lactic acid system
Conc pH DAm Separation Factors (SF)
(M) LaAm CeAm NdAm EuAm
L-Alanine 15 2 038 plusmn 001 165 plusmn 5 61 plusmn 1 28 plusmn 1 64 plusmn 1
L-Alanine 10 2 039 plusmn 002 176 plusmn 10 54 plusmn 3 24 plusmn 1 55 plusmn 3
L-Alanine 05 2 047 plusmn 006 165 plusmn 24 64 plusmn 3 28 plusmn 8 66 plusmn 8
L-Alanine 05 3 012 plusmn 001 147 plusmn 17 45 plusmn 5 9 plusmn 1 25 plusmn 3
Lactic
Acid
10 3 0009 380 140 mdash 91
3113 Studies at pH 2
Further investigations at pH 2 into the potential of using amino acids as a
combined buffer and soft donor showed that no separation occurs when DTPA is not
present indicating that amino acids do not act as holdback reagents in their own right
Previous work by Tanner and Choppin5 showed that at low pH the glycine zwitterion
forms inner-sphere monodentate complexes with M3+
ions including Ln3+
and An3+
Aziz et al67
later showed the same is true for L-alanine with Eu3+
and Am3+
at pH 36
whereby weak monodentate complexes form Krishnan and Plane8 showed that glycine
complexes metal ions solely through the COO- group on the amino acid No co-
ordination through the amino group has been reported
312 Other Amino Acids
Other amino acids L-arginine L-histidine and L-methionine were also
considered and further investigations were carried out (Figure 34) These three amino
acids are larger and more hydrophobic than L-alanine and are therefore less soluble at
higher concentrations (lt05 M) at pH values greater than pH 1 Again no separation
was observed when the amino acids were used without DTPA With Na5DTPA it was
found that the DAm values for Arg and Met were lower than those for L-alanine leading
to an increase in separation factor possibly due to co-ordination of the Am3+
ion with
soft donor atoms on the amino acids (Table 32) The DAm in the His system however
was similar to the Ala system suggesting that there is no coordination of the metal ion
112
with the α-amine or imidazole groups It is not known if the amino acids are co-
ordinating or chelating through soft donor atoms to the metal ion Further studies are
currently being carried out at the INL to determine stability constants and to use time-
resolved fluorescence to probe inner co-ordination sphere changes in order to
investigate the interactions of amino acids with the trivalent metal ions
Figure 34 Chemical structures of L-arginine (top) L-histidine (bottom left)
and L-methionine (bottom right)
Table 32 Distribution ratios and separation factors for a number of amino acid
buffered TALSPEAK systems
When extended further studies on these amino acids found that the kinetic
issues which affected separation of the heavier lanthanides using L-alanine at pH 3
(Figure 31) were also affecting separation with L-arginine at pH 2 as well as pH 3
Conc pH pKa DAm3+ Separation Factors (SF)
(M) LaAm CeAm NdAm EuAm
L- Arg 05 2 182 027 plusmn 001 184 plusmn 26 40 plusmn 3 27 plusmn 2 72 plusmn 4
L- His 05 2 180 040 plusmn 001 208 plusmn 8 95 plusmn 3 24 plusmn 5 83 plusmn 1
L-Met 05 2 213 017 plusmn 001 271 plusmn 18 97 plusmn 3 26 plusmn 1 60 plusmn 3
113
suggesting that longer chain amino acids may not suitable replacements for lactate
Based on these data the most promising replacement buffer is L-alanine at pH 2
32 L-alanine System Optimisation at pH 2
Following from the initial work carried out by Grimes et al at the INL further
studies were begun for this research project The speciation of DTPA was modelled
using HySS (Hyperquad Simulation and Speciation) software using literature pKa
values (Figure 35)9 At pH 1 the dominant DTPA species present in solution are
H7DTPA2+
and H6DTPA+ which both repel MA
3+ and Ln
3+ ions and so the species are
ineffective as holdback reagents At pH 2 the dominant species are H5DTPA (65 )
H4DTPA- (24 ) and H3DTPA
2- (11 ) The species with the greatest electrostatic
attraction under these conditions is to MA3+
Ln3+
ions is H3DTPA2-
At pH 3 a much
higher proportion of this species is present (87 ) than at pH 2 making pH 2 less
favourable for effective separation However the conditions can be optimised in order
to maximise separation by changing the concentrations of extractant and holdback
reagent For industrial purposes conducting the process at a lower pH is preferable as it
is easier for process operators to control higher acid concentrations Optimisation
studies using L-alanine as a buffer at pH 2 were carried out during a placement at the
INL
114
Figure 35 DTPA speciation as a function of pH modelled using HySS sofware using
literature pKa values
321 [Na5DTPA] Dependence
The concentration of Na5DTPA used in traditional TALSPEAK systems is 005
M Initial optimisation studies were carried out using a [Na5DTPA] range of 006 M to
010 M in increments of 001 M The L-alanine concentration was 05 M
115
Figure 36 [Na5DTPA] dependence of L-alanine system (05 M) at pH 2
Experiments were carried out using traditional TALSPEAK methods at pH 2
The extractant was HDEHP (02 M) in dodecane Separations were conducted to
measure the separation of Eu3+
over Am3+
A graph of log[DTPA] vs logDEuAm can be
seen in Figure 36 The slope of the line for Am3+
is approximately -1 indicating that
the metal ions are each bound to 1 DTPA5-
molecule The R2 value is close to 1 and the
errors are small The slope of the line for Eu3+
is also approximately -1 Separation
factors for the data were between 66 and 80 and the DAm were between 026 and 042
which are still 2 orders of magnitude higher than that for a traditional TALSPEAK
system (DAm = 0009) The Na5DTPA concentration was therefore increased further in
order to bring the DAm lower to prevent as much Am3+
being partitioned into the organic
phase
y = -09383x - 15277 Rsup2 = 09854
y = -11258x + 01381 Rsup2 = 09289
-10
-05
00
05
10
15
20
-125 -12 -115 -11 -105 -1 -095
log
DEu
Am
log [Na5DTPA]
Am Extraction
Eu Extraction
116
Figure 37 Eu3+
Am3+
separation for [Na5DTPA] dependence of L-alanine system (05
M) at pH 2
Experiments were carried out as before but using Na5DTPA concentrations of
02 M 03 M 04 M and 05 M A graph of log[DTPA] vs logDEuAm was plotted
(Figure 37) At 05 M [Na5DTPA] H5DTPA began to precipitate out due to the low pH
used and so data for this concentration is unreliable and was not plotted on the graph
The data is good as the R2 values are close to 1 and the errors are small However the
slope is not exactly -1 (slope = -080 for Eu and -085 for Am) this is likely to be due to
competition and activity effects from the increased [Na5DTPA] and therefore increased
Na+ concentration Separation factors for the data were around the same (between 65
and 72) but the DAm values decreased to 008 for the 04 M Na5DTPA meaning much
less Am3+
is being partitioned into the organic phase
322 [HDEHP] Dependence
Experiments were carried out as for the [Na5DTPA] dependence but using
HDEHP extractant concentrations of 04 M 06 M 08 M and 10 M in dodecane for
each of the Na5DTPA concentrations 02 M 03 M and 04 M Graphs of log[DTPA] vs
logDEuAm were plotted (Figures 38-310)
y = -08451x - 14757 Rsup2 = 09936
y = -07958x + 03998 Rsup2 = 0998
-15
-10
-05
00
05
10
15
-11 -1 -09 -08 -07 -06 -05 -04 -03
log
DEu
Am
log [Na5DTPA]
Am Extraction Eu Extraction
117
Figure 38 Eu3+
Am3+
separation for [HDEHP] dependence of L-alanine system (05
M) at pH 2 using 02 M Na5DTPA
Figure 39 Eu3+
Am3+
separation for [HDEHP] dependence of L-alanine system (05
M) at pH 2 using 03 M Na5DTPA
y = 13522x + 02972 Rsup2 = 09283
y = 09682x + 19794 Rsup2 = 09561
-05
00
05
10
15
20
25
-05 -04 -03 -02 -01 0 01
log
DEu
Am
log [HDEHP]
Am Extraction
Eu Extraction
y = 14702x + 00193 Rsup2 = 09981
y = 11892x + 17129 Rsup2 = 09713
-10
-05
00
05
10
15
20
-05 -04 -03 -02 -01 0 01
log
DEu
Am
log [HDEHP]
Am Extraction
Eu Extraction
118
Figure 310 Eu3+
Am3+
separation for [HDEHP] dependence of L-alanine system (05
M) at pH 2 using 04 M Na5DTPA
The R2 values for these data are close to 1 and the errors are generally small
making the data good quality The slope of each data set should be +3 indicating that
the metal ions are each bound to 3 HDEHP molecules in the organic phase1011
However the slopes are not quite +3 this is likely to be due to activity effects and
competition from the increased Na+ concentration as a result of increasing the
Na5DTPA concentration
323 L-alanine Optimisation Summary
The results of the optimisation of a TALSPEAK system using 05 M L-alanine
as a buffer are summarised in Tables 33 and 34
Table 33 Separation factors for L-alanine optimisation studies
[HDEHP] (M)
[Na5DTPA]
(M)
02 04 06 08 10
02 72 plusmn 3 70 plusmn 6 43 plusmn 6 61 plusmn 9 49 plusmn 2
03 70 plusmn 1 62 plusmn 7 59 plusmn 9 56 plusmn 5 46 plusmn 8
04 71 plusmn 5 60 plusmn 4 74 plusmn 4 70 plusmn 7 67 plusmn 1
y = 11522x - 00047 Rsup2 = 09867
y = 12575x + 18424 Rsup2 = 09976
-10
-05
00
05
10
15
20
25
-05 -04 -03 -02 -01 0 01
log
DEu
Am
log [HDEHP]
Am Extraction
Eu Extraction
119
Table 34 DAm values for L-alanine optimisation studies Error plusmn 001
[HDEHP] (M)
[Na5DTPA]
(M)
02 04 06 08 10
02 012 053 121 126 203
03 010 027 050 077 102
04 008 036 051 077 102
Table 33 shows the separation factors are generally similar for each condition
and there is no particular set of conditions that gives the highest value although the
better separation factors tend to be achieved at the lower extractant concentrations The
DAm values (Table 34) are best at the lowest extractant concentrations and highest
holdback concentration as would be expected The best set of conditions is 04 M
Na5DTPA and 02 M HDEHP with the best DAm achievable being 008 and best SF 71 plusmn
5 Despite optimisation the L-alanine system is still not as efficient as the traditional
lactate system as the distribution of Am3+
is one order of magnitude higher and the
separation is lower however the L-alanine system allows the separation to be carried
out at a lower pH which is beneficial for an industrial process
33 Other Amino Acid Studies
331 Initial Tests with Other Amino Acids
Several initial tests were carried out using other amino acids as buffers It had
been found previously that L-arginine at pH 2 gave poor separation of the heavier
lanthanides (Section 312) so further studies were carried out using 05 M L-methionine
and L-histidine to see how effective these amino acids could be as potential buffers
Results from initial tests using TALSEPAK conditions at varied pH values can be seen
in Table 35
120
Table 35 Separation factors and DAmEu values for traditional TALSPEAK systems
with different buffers at varying pH values
From Table 35 it can be seen that L-histidine gives good separation data at pH
3 The DAm of 007 is comparable to the optimised L-alanine system in Section 32 and
the separation factor is high at 99 comparable to the original lactate TALSPEAK
system Further investigations were subsequently carried out in order to determine if the
same kinetic issues arise with L-histidine as with L-arginine and L-alanine L-
methionine was not investigated further as the separation data at pH 2 was not very
promising and it is insoluble at 05 M at pH 3
332 Studies with L-Histidine
The distribution ratios of La-Ho were determined by ICP-MS for a 05 M L-
histidine system at pH 2 and pH 3 (Figure 311)
Buffer pH DAm
DEu
SF
Lactic Acid 3 0009 0819 91
L-Methionine 1 547 6017 11
2 018 1016 57
L-Histidine 1 468 9579 20
2 053 4463 84
3 007 660 99
121
Figure 311 Distribution ratios of La3+
-Ho3+
and Am3+
with 05 M L-histidine buffer at
pH 2 and pH 3
The distribution ratios for the L-histidine system at pH 2 generally resemble
those on a traditional TALSPEAK curve at pH 3 with the D values decreasing towards
neodymium and then increasing with the later lanthanides However the pH 3 L-
histidine system exhibits decreasing D values with the heavier lanthanide elements
demonstrating the same kinetic problems as the L-alanine and L-arginine systems at
higher pH
34 Summary of Separations with Amino Acid Buffers
Previous work carried out at the Idaho National Laboratory by Grimes showed
that amino acids do not act as holdback reagents in their own right and no separation of
Ln3+
Am3+
is achieved when they are used without Na5DTPA in solution However
investigations showed that when used alongside Na5DTPA good separation can be
attained when using 05 M L-alanine at pH 2 pH 2 is less favourable than pH 3 for
separations using DTPA as more protonated forms of the molecule are present in
solution and the holdback reagent is not able to bind as strongly to metal ions However
optimisation of the system in order to maximise the separation whilst keeping Am3+
partitioning to a minimum by changing the concentrations of holdback reagent and
extractant proved to be successful The best conditions were found to be 04 M
Na5DTPA and 02 M HDEHP giving a separation factor of 71 plusmn 5 with a DAm value of
008 Although this separation is not as good as a traditional lactate TALSPEAK
001
01
1
10
56 57 58 59 60 61 62 63 64 65 66 67 68
Dis
trib
uti
on
Rat
io
Atomic Number
His pH 2
His pH 3
Am pH 2
Am pH 3
122
system the use of L-alanine as a buffer allows the process to be carried out at pH 2
which is a much more preferable pH for industry
When investigations were carried out using other amino acids at varying pH
values it was found that L-methionine was too poorly soluble at pH 3 and did not give
very good separation data at pH 2 L-arginine was found to have kinetic issues at pH 2
and 3 giving poor separation of the heavier lanthanides However L-histidine gave
good separation data at pH 3 with a SFEuAm of 99 comparable to that of the original
TALSPEAK process and a DAm of 007 comparable to the optimised alanine system
Studies of the lanthanides La-Ho using L-histidine at pH 3 however showed that the
same kinetic problems arise as for L-arginine and L-alanine as the DLn decreases for
later lanthanides indicating that L-histidine is no more promising as a buffer than the
other amino acids
123
1 TS Grimes RD Tillotson and LR Martin Solv Extraction and Ion Exchange
2014 32 378-390
2 B Weaver and T A Kappelmann Talspeak A new method of separating americium
and curium from the lanthanides by extraction from an aqueous solution of an
aminopolyacetic acid complex with a monoacidic organophosphate or phosphonate
Oak Ridge National Laboratory 1964 1-60
3 Z Kolarik G Koch and W Kuhn J Inorg Nucl Chem 1974 36 905-909
4 KL Nash Solv Extraction and Ion Exchange 2015 33 1-55
5 S P Tanner and G R Choppin Inorg Chem 1968 7 2046-2048
6 A Aziz and S J Lyle J Inorg Nucl Chem 1971 33 3407-3408
7 A Aziz S J Lyle and J E Newbery J Inorg Nucl Chem 1971 33 1757-1764
8 K Krishnan and R Plane Inorg Chem 1967 6 55-60
9 NJ Bridges LE Roy and CL Klug Computation and Spectroscopic Investigation of
the DTPA Complexes US Department of Energy 2012
10 TS Grimes G Tian L Rao and KL Nash Inorg Chem 2012 51 6299-6307
11 G Lumetta AV Gelis and GF Vandegrift Solv Extraction and Ion Exchange
2010 28 3 287-312
124
4 STUDIES USING L-GLUTATHIONE AS A BUFFER IN A TALSPEAK
SYSTEM
The TALSPEAK process (Trivalent Actinide Lanthanide Separation by
Phosphorus reagent Extraction from Aqueous Complexation) which is currently being
developed in the USA for separation of minor actinides (MA) from lanthanides (Ln)
from nuclear waste uses lactic acid as a buffer (pH 36) and the chelator DTPA
(diethylenetriaminepentaacetic acid) as a holdback reagent to retain Am3+
in an aqueous
phase allowing Ln3+
to be extracted by phosphate extractant HDEHP (di-
(2ethylhexyl)phosphoric acid) into an organic phase Studies have been carried out on
the potential of using amino acids as a combined buffer and soft-donor in order to
simplify the TALSPEAK process (Chapters 2 amp 3) however it was found that amino
acids do not act as holdback reagents in their own right although they have been shown
to allow the pH of the process to be lowered to pH 2 which is more favourable for an
industrial process
Although amino acids have been shown not to act as holdback reagents and are
therefore unable to replace lactic acid and DTPA5-
as a combined buffer and soft donor
based on the data obtained from the individual amino acid studies it was considered
that larger ligands with more soft donors such as short-chain peptides may be more
suitable A range of potential molecules were considered including a selection of simple
peptides including eisenin (pGlu-Gln-Ala-OH) and norophthalmic acid (γ-Glu-Ala-
Gly) (Figure 41) and B vitamins including biotin (B7) and folic acid (B9) (Figure
42)
125
Figure 41 Molecular structures of eisenin (top) and norophthalmic acid
(bottom)
Figure 42 Molecular structures of biotinvitamin B7 (top) and folic acid
vitamin B9 (bottom)
The tripeptide L-glutathione (reduced form) was chosen for further study as it
has a fairly simple structure contains several soft-donor atoms and its amino acid
constituents showed promise for buffer activity It is also relatively cheap and easy to
procure L-glutathione (GSH) consists of a chain comprising three amino acids L-
cysteinemdashL-glutamic acidmdashglycine (Figure 43)
126
Figure 43 Molecular structure of L-glutathione (reduced form)
Glutathione is naturally produced in all cells in the human body It is an
antioxidant with numerous functions most of which are related to the ability of its
sulphur atom to scavenge free radicals or donate electrons GSH regulates cell growth
and division by absorbing oxide radicals present in the cell which would prevent cell
growth repairs DNA by donating electrons removed from DNA strands by free radicals
aiding in DNA synthesis assists in protein synthesis by reacting (sulphur atom) with
undesirable S-S bonds to break them and allow for the correct pairing metabolises
toxins by co-ordinating with them through the S atom making them more water soluble
for excretion and recycles other antioxidants (such as vitamins C and E) by donating
electrons1 As a cysteine-containing tripeptide it is also a provider of the amino acid
cysteine in the body and is involved in amino acid transport in and out of cells
Properties of glutathione which are of particular interest to MA3+
Ln3+
separation
studies are its ability to conjugate to heavy metals (to allow them to be removed from
the body like DTPA23
and its resistance to radiation (due to its ability to scavenge free
radicals) which decreases radiation damage in the body45
but also would be beneficial
for spent nuclear fuel (SNF) reprocessing where free radicals and high levels of
radiation are present
As is the case for lactate6 and amino acid
7 complexes of lanthanides stability
constants of Ln-GSH complexes increase across the lanthanide series from La-Lu as the
Lewis acidity of the metal ions increases Log β values range from 556 for La3+
to 751
for Ho3+
with GSH indicating slightly higher stability of Ln-GSH complexes than of
lactate and amino acid complexes of Ln3+
with log β = 633 for Ln(lactate)3 formation
and values ranging from 582-665 for L-alanine with Ln3+
when Ln = La-Sm (Section
242) Garg et al also reported that the stability of Ln-GSH complexes was found to
decrease as ionic strength increases and that the optimum stability of the complexes was
in solutions within the pH range of 340-348 (77 complex formation)8
127
Solvent extraction experiments were initially performed in order to investigate
the separation ability of GSH with Am3+
and Eu3+
and conditions were then optimised
in order to achieve maximum separation Interaction of the buffer with various
components in solution including lanthanide ions was probed using various techniques
including luminescence spectroscopy which was also used in determining the
susceptibility of the buffer to radiolysis and ICP-MS
41 Solvent Extraction and Separation using GSH
411 [L-Glutathione] and pH Dependence
4111 [GSH] Dependence without Na5DTPA at pH 4
L-glutathione has pKa values of 212 (COOH) 359 (COOH) 875 (NH2) and
965 (SH)9 and so with two pKa values below 4 and optimum stability at pH 34 initial
studies were carried out at pH 4 as it would be expected that the glutathione would
complex to metal ions most effectively around this pH and be more likely to act as a
holdback reagent Although pH 4 is a higher pH than that used currently in the
TALSPEAK process and therefore less desirable if proven to improve the process it
may still have potential if satisfactory separation is achieved
Initial studies using L-glutathione as a buffer without the presence of Na5DTPA
in the system showed that as with amino acids GSH is ineffective as a holdback
reagent on its own as there was no separation observed between Eu3+
and Am3+
Over a
GSH concentration range of 01 M to 05 M the separation factors ranged from 038-
585 plusmn 108 Glutathione is insoluble at concentrations above 05 M at pH 4 at room
temperature
4112 [GSH] and pH Dependence with Na5DTPA
Further experiments were then carried out using GSH as a buffer in the presence
of Na5DTPA in order to see if there was any improvement in the separation with this
buffer over the traditional lactic acid buffer The experiments used 005 M Na5DTPA
and 01-05 M GSH over a pH range of 2-4 under TALSPEAK conditions (02 M
HDEHP in n-dodecane)
128
Figure 44 Eu3+
Am3+
distribution for [GSH] dependence with 005 M Na5DTPA at pH
2 extracted using 02 M HDEHP in dodecane Results were averaged from 3 repeat
tests
Figure 45 Eu3+
Am3+
distribution for [GSH] dependence with 005 M Na5DTPA at pH
3 extracted using 02 M HDEHP in dodecane Results were averaged from 3 repeat
tests
Plots of log[GSH] vs logDEuAm for systems at pH 2 and 3 are displayed in
Figures 44 and 45 The graphs show that increasing the concentration of GSH does not
affect the separation of Eu3+
over Am3+
since the distribution ratios for each remain
-02
0
02
04
06
08
1
12
14
16
18
-11 -09 -07 -05 -03
log
DEu
Am
log [GSH]
Am Extraction
Eu Extraction
-1
-08
-06
-04
-02
0
02
04
06
08
1
12
14
-11 -09 -07 -05 -03
log
DEu
Am
log [GSH]
Am Extraction
Eu Extraction
129
relatively constant At pH 2 the average DAm is 103 and DEu is 3013 giving an
average separation factor of 29 plusmn 8 At pH 3 the extraction of both metals is lower with
DAm averaging at 018 and DEu at 1423 giving an average separation of 79 plusmn 13 Both
data sets for pH2 and pH 3 show a slope of almost zero suggesting that the metal ions
are not bound to any GSH molecules which would be consistent with the L-glutathione
just acting as a buffer These separation factors are lower than for the original
TALSPEAK buffered system using lactate (SF = 91 at pH 36) However at pH 4 the
slopes change on the graph and a difference in separation can be observed as the molar
concentration of GSH is increased
Figure 46 Eu3+
Am3+
distribution for [GSH] dependence with 005 M Na5DTPA at pH
4 Results were averaged from 3 repeat tests
At pH 4 as the concentration of L-glutathione is increased the separation factor
increases (Figure 46) The value DEu initially increases as the GSH concentration is
increased from 01-02 M but then remains constant at ~6 However DAm values
decrease linearly as the buffer concentration is increased from 01-05 M giving rise to
increased partitioning and separation values The results from the extraction
experiments at pH 4 are given in Table 41
-15
-10
-05
00
05
10
-11 -09 -07 -05 -03
log
DEu
Am
log [GSH]
Am Extraction
Eu Extraction
130
Table 41 Eu3+
Am3+
distribution and separation for [GSH] dependence with 005 M
Na5DTPA at pH 4
[GSH] (M) DAm DEu SF
01 073 plusmn 027 100 plusmn 041 14 plusmn 13
02 021 plusmn 011 658 plusmn 054 31 plusmn 14
03 016 plusmn 005 578 plusmn 097 37 plusmn 19
04 007 plusmn 002 590 plusmn 043 82 plusmn 19
05 006 plusmn 001 617 plusmn 097 104 plusmn 33
The results show that the L-glutathione is interacting with the DTPA in some
way at pH 4 to allow the separation to increase as a function of GSH concentration only
in the presence of Na5DTPA up to a SF of 104 at 05 M GSH concentration
comparable to separation achieved in the original lactate buffered TALSPEAK process
Figure 47 GSH speciation as a function of pH modelled using HySS software using
literature pKa values of 212 (COOH) 359 (COOH) 875 (NH2) and 965 (SH)9
131
Figure 48 H2GSH- species dominant in solution at pH 4
The speciation of GSH at pH 4 was modelled using HySS (Hyperquad Simulation and
Speciation) software using literature pKa values (Figure 47) At pH 4 the dominant
GSH species is the H2GSH- species (Figure 48) with both carboxylic acids
deprotonated This suggests that deprotonation of the second COOH group allows the
ligand to interact through the COO- to the metal complex Indeed several studies by
Faulkner et al have shown that molecules containing carboxylate functionalities
readily bind with 7-coordinate lanthanide(III) polyaminocarboxylate complexes in a
bidentate manner here DO3A (DO3A = [4710-tris-carboxymethyl-14710-tetraaza-
cyclododec-1-yl]-acetic acid) (Figure 49) and a similar binding interaction with the
related DTPA actinide(III)lanthanide(III) may be anticipated
Figure 49 A ternary Nd DO3A-pyrazine amine carboxylate complex reported by
Faulkner at al (left) and anticipated bidentate chelation of GSH with Am-DTPA at pH
4 (right)10
132
412 [Na5DTPA] Dependence at pH 4
The highest concentration of buffer (05 M) gave the highest separation factors
in the [GSH] dependence study at pH 4 so this concentration was chosen for the next
study on [Na5DTPA] dependence (Figure 410) Relatively high concentrations of
Na5DTPA were chosen (005-06 M) to make the results comparable to those obtained
in the optimisation of the L-alanine system (Section 32) The graphs plotted for the
[Na5DTPA] dependence were not plotted as log plots as it is not known how the
Na5DTPA and GSH interact and what competition effects may be present so the direct
correlation between the complexant concentration and D values have been plotted to
make interpretation more simple
Figure 410 Eu3+
and Am3+
distribution for [Na5DTPA] dependence with 05 M GSH
buffer at pH 4 curves fitted as polynominal order 2 for both Am3+
and Eu3+
Results
were averaged from 3 repeat tests
y = 19018x2 - 23123x + 72258 Rsup2 = 09937
y = 0442x2 - 03543x + 00659 Rsup2 = 0781
00
00
01
01
02
-20
-10
00
10
20
30
40
50
60
70
-01 26E-15 01 02 03 04 05 06 D
Am
DEu
[Na5DTPA] (M)
Eu extraction
Am extraction
133
Table 42 Eu3+
Am3+
distribution and separation for [Na5DTPA] dependence with 05
M GSH buffer at pH 4
[Na5DTPA] (M) DAm DEu SF
005 00650 plusmn ˂0001 624 plusmn 076 96 plusmn 11
01 00196 plusmn ˂0001 480 plusmn 057 245 plusmn 29
02 00039 plusmn ˂0001 361 plusmn 052 917 plusmn 133
03 00020 plusmn ˂0001 207 plusmn 017 1037 plusmn 85
04 00010 plusmn ˂0001 084 plusmn 008 833 plusmn 80
05 00060 plusmn ˂0001 042 plusmn 005 70 plusmn 9
06 00058 plusmn ˂0001 024 plusmn 005 41 plusmn 7
These data show that as the concentration of Na5DTPA is increased the
separation factor increases dramatically up to 03 M Na5DTPA with a maximum of
1037 85 (Table 42) After this peak there is a rapid decrease in separation as the
concentration of Na5DTPA is increased further up to 06 M The DAm decreases at a
steady rate as [Na5DTPA] is increased from 005 M to 04 M after which the DAm
increases slightly and remains fairly constant The DEu decreases at a slower rate
between 005 M and 02 M complexant decreasing more rapidly from 02 M to 06 M
The SF significantly decreases as the concentration of Na5DTPA is increased from 04
to 05 M Although it is unclear why this is without detailed structural analysis the
stoichiometry of DTPAGSH becomes 11 at 05 M which may alter the interaction
between the two constituents The separation factors achieved here are extremely high
(a factor of 10 higher than the current TALSPEAK system and the optimised alanine
system (Chapter 3)) whilst still maintaining low extraction of Am3+
413 [HDEHP] Dependence at pH 4
The extractant concentration dependence was measured for the systems
containing 05 M buffer and 03 M and 04 M Na5DTPA These Na5DTPA
concentrations were chosen for comparison as the 03 M was found to give the highest
separation factor and 04 M seemed to be the point where the separation began to
decrease The graphs plotted for the [HDEHP] dependence have also been plotted by
direct correlation between the extractant concentration and D values
134
Figure 411 Eu3+
and Am3+
distribution for [HDEHP] dependence with 03 M
Na5DTPA and 05 M GSH buffer at pH 4 curve for Eu3+
fitted as polynominal order 2
linear correlation for Am3+
Results were averaged from 3 repeat tests
Table 43 Eu3+
Am3+
distribution and separation for [HDEHP] dependence with 03 M
Na5DTPA and 05 M GSH buffer at pH 4
[HDEHP] (M) DAm DEu SF
02 00020 plusmn ˂0001 207 plusmn 017 1037 plusmn 85
04 00018 plusmn ˂0001 223 plusmn 003 1238 plusmn 17
06 00022 plusmn ˂0001 239 plusmn 006 1097 plusmn 15
08 00024 plusmn ˂0001 218 plusmn 005 906 plusmn 21
10 00031 plusmn ˂0001 165 plusmn 003 535 plusmn 9
At 03 M Na5DTPA the separation factor increases as the extractant
concentration is increased from 02 to 04 M after which the SF begins to decrease
again (Figure 411) The DAm increases slightly as the HDEHP concentration is
increased but the DEu increases and then decreases like the SF The separation factors
for the lower concentrations of extractant are very high with the optimum separation at
04 M giving a SF of 1238 (Table 43)
y = -30649x2 + 3243x + 15029 Rsup2 = 09467
y = 00013x + 00015 Rsup2 = 08028
0000
0002
0004
0006
0008
0010
0012
0014
00
05
10
15
20
25
30
0 02 04 06 08 1 12
DA
m
DEu
[HDEHP] (M)
Eu extraction
Am extraction
135
Figure 412 Eu3+
and Am3+
distribution for [HDEHP] dependence with 04 M
Na5DTPA and 05 M GSH buffer at pH 4 linear correlation for both Am3+
and Eu3+
Results were averaged from 3 repeat tests
Table 44 Eu3+
Am3+
distribution and separation for [HDEHP] dependence with 04 M
Na5DTPA and 05 M GSH buffer at pH 4
[HDEHP] (M) DAm DEu SF
02 0001 plusmn ˂0001 084 plusmn 008 833 plusmn 80
04 0251 plusmn ˂0001 081 plusmn 003 454 plusmn 30
06 0698 plusmn 0014 077 plusmn 001 110 plusmn 010
08 1026 plusmn 0009 078 plusmn 004 076 plusmn 005
10 1410 plusmn 0022 067 plusmn 003 047 plusmn 003
At 04 M Na5DTPA the separation factor decreases rapidly as the extractant
concentration is increased The DAm increases by a factor of 1000 but the DEu only
decreases slightly making the SF decrease significantly (Figure 412 and Table 44)
This would be consistent with the complexant and buffer interacting at higher
Na5DTPA concentrations as the stoichiometry nears 11 possibly forming an adduct
which no longer successfully holds back Am3+
Further structural studies are needed on
these systems in order to determine the complexation mechanisms in the solution under
these conditions
y = -01882x + 08847 Rsup2 = 08326
y = 17968x - 04007 Rsup2 = 09946
-0500
0000
0500
1000
1500
2000
00
01
02
03
04
05
06
07
08
09
10
0 02 04 06 08 1 12
DA
m
DEu
[HDEHP] (M)
Eu extraction
Am extraction
136
42 Luminescence Studies using GSH with Eu3+
Further studies on the glutathione systems were carried out on lanthanide
systems in order to gain some insight into the co-ordination of the buffer with the ions
with and without Na5DTPA present Control measurements were taken of Eu(NO3)3 in
water with no other reagents Eu(NO3)3 with Na5DTPA with no GSH and Eu(NO3)3
with GSH without Na5DTPA for comparison purposes (Figure 413) All luminescence
spectra were recorded and averaged from 5 repeat measurements
Figure 413 Corrected emission spectra of Eu(NO3)3 (1 mM) Eu(NO3)3 with GSH (05
M) and Eu(NO3)3 with Na5DTPA (005 M) in H2O following excitation at 397 nm
A first set of experiments was then carried out to mimic the separation and
solvent extraction studies performed at the INL (Section 41) At the same concentration
of Eu(NO3)3 the J=2 band of Eu3+
increases in intensity upon the addition of GSH
indicating a change in symmetrycrystal field and a weak but detectable interaction with
GSH (the J=1 and J=4 bands are the same intensity with and without GSH) Upon the
addition of Na5DTPA to the system the crystal field changes and the J=4 band shifts
position slightly indicating that a different species is forming which is consistent with
the formation of [EuDTPA]2-
0
1
2
3
4
5
6
550 600 650 700
Emis
sio
n In
ten
sity
(au
) x
10
00
0
Wavelength (nm)
Eu3+ in H2O
Eu with GSH
Eu with DTPA
137
421 [GSH] and pH Dependence without DTPA at pH 4
4211 Aqueous Phase Studies
Emission spectra of Eu3+
(1 mM Eu(NO3)3) in H2O and D2O were measured at
pHpD 4 as the concentration of [GSH] was varied from 01 M to 05 M The spectra
can be seen in Figures 414 and 415
Figure 414 Emission spectra of Eu(NO3)3 in H2O at pH 4 over a GSH concentration
range of 01 ndash 05 M following excitation at 397 nm
The spectra show an increase in emission intensity of the J=2 band as the GSH
concentration is increased from 01-02 M followed by a decrease at 03 M and a
further increase at 04 and 05 M whereas the opposite trend is observed with the J=4
peak The J=1J=2 peak ratios were determined and a t-test was carried out on them to
determine whether they were significantly different and hence whether the co-ordination
mode of the GSH to the Eu3+
changed as the buffer concentration was increased The
J=1J=2 values ranged from 0364-0718 and were found to be significantly different
The spectra are similar to that recorded for the free ion in solution but the J=1J=2
ratios vary slightly and there are some differences in the fine structure of the emission
bands This indicates that GSH is interacting with Eu3+
under these conditions albeit
weakly and the surrounding water molecules are in fast exchange with the buffer
molecules The solution dynamics were investigated further and the spectra were
recorded in D2O in order to minimise quenching caused by fast exchange of O-H
oscillators and to determine the inner sphere hydration number of Eu3+
in each case (q)
00
01
02
03
04
05
06
07
550 600 650 700
Emis
sio
n In
ten
sity
(au
) x
10
00
0
Wavelength (nm)
01 M GSH
02 M GSH
03 M GSH
04 M GSH
05 M GSH
138
Figure 415 Emission spectra of Eu(NO3)3 in D2O at pH 4 over a GSH concentration
range of 01 ndash 05 M following excitation at 397 nm
In D2O it can be seen that the emission intensity increases as the GSH
concentration is increased from 01-03 M followed by a decrease at 04 M and a slight
increase at 05 M This time the J=1J=2 values ranged from 0324-0748 but were
found not to be significantly different suggesting that the co-ordination mode of the
GSH to the metal ion is not changing as the concentration is increased which would be
expected as the buffer is not forming a stable complex with the ion and is in exchange
with surrounding solvent molecules
The number of water molecules bound to the Eu3+
ion (q) was calculated for
each of the samples using the Horrocks equations (Equations 19 and 110) The results
can be found in Table 45 There is a large range in q between different concentrations
with no clear pattern to the lifetimes or number of bound water molecules other than
generally q tends to increase from around 1 to 5 at the highest concentrations of GSH
This could be explained by the increasing ionic strength decreasing the stability of any
Eu-GSH complex and the solvent molecules are also in fast exchange with the buffer
00
02
04
06
08
10
12
550 600 650 700
Emis
sio
n In
ten
sity
(au
) x
10
00
0
Wavelength (nm)
01 M GSH
02 M GSH
03 M GSH
04 M GSH
05 M GSH
139
Table 45 Luminescence lifetimes and q values for Eu3+
with GSH at pHD 4
Error on lifetimes plusmn 10
[GSH]
(M)
τ D2O (μs) τ H2O (μs) q plusmn 02
01 1487 428 17
02 785 353 16
03 829 440 11
04 1545 161 58
05 1016 168 52
4211 Extraction Studies
Extractions were carried out on the Eu3+
samples containing GSH using 02 M
HDEHP in dodecane for the organic phase The emission spectra of both the aqueous
and organic phases post-extraction can be seen in Figure 416
Figure 416 Emission spectra of aqueous and organic phases after Eu3+
extraction at
pH 4 using a GSH concentration range of 01 ndash 05 M following excitation at 397 nm
The Eu-HDEHP complex formed in the organic phase has different symmetry to
Eu3+
complexes in the aqueous phase as can be seen by the different profile of the
emission spectra of the organic phases The spectra show good extraction of the Eu3+
into the organic phase for all concentrations of GSH with little or no metal ion left in the
aqueous phase The J=1J=2 values ranged from 0794-1214 for the organic phase and
were found not to be significantly different as expected as the buffer is unlikely to
00
01
01
02
02
03
03
550 600 650 700
Emis
sio
n In
ten
sity
(au
) x
10
00
0
Wavelength (nm)
01 M GSH Aq 02 M GSH Aq 03 M GSH Aq 04 M GSH Aq 05 M GSH Aq 01 M GSH Org 02 M GSH Org 03 M GSH Org 04 M GSH Org 05 M GSH Org
140
affect the co-ordination of metal ion in the organic phase as the Eu3+
ion is extracted as
the HDEHP complex seen by the different emission profile in the organic phase
spectrum11
422 [GSH] and pH Dependence with DTPA
4221 Aqueous Phase Studies
Emission spectra of Eu3+
(1 mM Eu(NO3)3) in H2O and D2O with 005 M
Na5DTPA were measured over a pHpD range of 2-4 as the concentration of [GSH] was
varied from 01 M to 05 M The D2O spectra can be seen in Figures 417 to 419 The
H2O spectra closely resemble those recorded in D2O but with lower relative emission
intensites as expected (Appendix 1)
Figure 417 Emission spectra of Eu3+
in D2O at pD 2 with 005 M Na5DTPA over a
GSH concentration range of 01 ndash 05 M following excitation at 397 nm
00
02
04
06
08
10
12
14
16
550 600 650 700
Emis
sio
n In
ten
sity
(au
) x
10
00
0
Wavelength (nm)
01 M GSH
02 M GSH
03 M GSH
04 M GSH
05 M GSH
141
Figure 418 Emission spectra of Eu3+
in D2O at pD 3 with 005 M Na5DTPA over a
GSH concentration range of 01 ndash 05 M following excitation at 397 nm
Figure 419 Emission spectra of Eu3+
in D2O at pD 4 with 005 M Na5DTPA over a
GSH concentration range of 01 ndash 05 M following excitation at 397 nm
It can be seen that in all samples a Eu-DTPA complex has formed The spectra
are all almost identical for each pD and for each buffer concentration with the emission
intensity being slightly higher for pD 3 and 4 with the same concentration of Eu3+
00
02
04
06
08
10
12
14
16
550 600 650 700
Emis
sio
n In
ten
sity
(au
) x
10
00
0
Wavelength (nm)
01 M GSH
02 M GSH
03 M GSH
04 M GSH
05 M GSH
00
02
04
06
08
10
12
14
16
550 600 650 700
Emis
sio
n In
ten
sity
(au
) x
10
00
0
Wavelength (nm)
01 M GSH
02 M GSH
03 M GSH
04 M GSH
05 M GSH
142
Table 46 J=1J=2 peak ratios and t-test results for Eu-DTPA at pD 2-4 over a GSH
concentration range of 01-05 M following excitation at 397 nm
J=1J=2
[GSH] (M)
01 02 03 04 05 st dev t-test
pD 2 0335 0399 0379 0375 0361 0024 No sig diff
pD 3 0440 0433 0451 0439 0419 0012 No sig diff
pD 4 0438 0467 0413 0469 0454 0023 No sig diff
st dev 0060 0034 0036 0048 0047
t-test Sig diff Sig diff Sig diff Sig diff Sig diff
The J=1J=2 peak height ratios were recorded for each emission spectrum and t-
tests were carried out on the peak ratios using the t-test data analysis tool in Microsoft
Excel accounting for the standard deviations between the ratios (Table 46) For each
pH as the concentration of GSH is increased the range in the ratios remains small and
there is no significant difference between the values suggesting that there is no change
in the co-ordination mode of the buffer to the metal ion as the concentration of GSH is
increased However a significant difference was observed between the data sets upon
changing pH as the J=1J=2 ratio increases from pD 2 to pD 4 indicating that the co-
ordination mode of glutathione is different at different pH values This is consistent
with the pKa values of GSH as at pH 2 both of the carboxylate groups will be
protonated with the dominant species present in solution shifting from 5050
H3GSHH2GSH to 5050 H4GSHH3GSH (Figure 47)
The luminescence lifetimes of each sample were recorded in H2O and D2O in
order to determine the q value of the complexes using the modified Horrocks equation
(Equation 110) These results are summarised in Table 47
143
Table 47 Luminescence lifetimes and q values for Eu-DTPA at pH 2-4 over a GSH
concentration range of 01-05 M
[GSH] (M) τ D2O (μs) τ H2O (μs) q plusmn 02
pH 2 01 1699 plusmn 7 607 plusmn 9 10
pH 2 02 1692 plusmn 10 619 plusmn 10 09
pH 2 03 1686 plusmn 9 629 plusmn 9 09
pH 2 04 1636 plusmn 12 607 plusmn 13 09
pH 2 05 1596 plusmn 11 629 plusmn 13 09
pH 3 01 1755 plusmn 14 626 plusmn 7 09
pH 3 02 1737 plusmn 13 626 plusmn 15 09
pH 3 03 1723 plusmn 5 626 plusmn 13 09
pH 3 04 1720 plusmn 14 635 plusmn 17 09
pH 3 05 1677 plusmn 9 641 plusmn 14 09
pH 4 01 1778 plusmn 14 593 plusmn 16 10
pH 4 02 1747 plusmn 13 640 plusmn 15 09
pH 4 03 1679 plusmn 15 669 plusmn 18 08
pH 4 04 1689 plusmn 14 623 plusmn 15 09
pH 4 05 1679 plusmn 13 652 plusmn 19 08
All of the complexes have approximately 1 water molecule in the inner
hydration sphere This is consistent with the formation of a [Eu(DTPA)]2-
complex The
values are only slightly less than 1 (compared to [Eu(DTPA)]2-
itself where q = 11)
and in most cases is not significantly different This indicates that any interaction of
GSH with the Eu3+
centre is very weak and that the buffer may be in fast exchange with
the bound water molecule
4222 Extraction Studies
Extractions were carried out on the samples using 02 M HDEHP in dodecane
for the organic phase in the absence of DTPA The emission spectra of both the aqueous
and organic phases post-extraction can be seen in Figures 420 and 421
144
Figure 420 Emission spectra of aqueous phases after Eu3+
extraction at pH 2-4 over a
GSH concentration range of 01-05 M following excitation at 397 nm
Figure 421 Emission spectra of organic phases after Eu3+
extraction at pH 2-4 over a
GSH concentration range of 01-05 M following excitation at 397 nm
The extraction data show that the best Eu3+
extraction occurs at pH 3 under these
conditions although as seen from the separation data obtained at INL (Section 41) this
is not the best pH for separation of metal ions The J=1J=2 peak height ratios were
recorded for each emission spectrum and t-tests were carried out on the peak ratios
using the t-test data analysis tool in Microsoft Excel accounting for the standard
deviations between the ratios The J=1J=2 peak ratios for the aqueous phases show no
significant difference within the pH 4 data as the GSH concentration is increased and
00
05
10
15
20
25
30
35
40
45
50
550 600 650 700
Emis
sio
n In
ten
sity
(au
) H
un
dre
ds
Wavelength (nm)
01 M GSH pH 4 Aq
03 M GSH pH 4 Aq
05 M GSH pH 4 Aq
05 M GSH pH 3 Aq
05 M GSH pH 2 Aq
00
02
04
06
08
10
12
14
550 600 650 700
Emis
sio
n In
ten
sity
(au
) H
un
dre
ds
Wavelength (nm)
01 M GSH pH 4 Org
03 M GSH pH 4 Org
05 M GSH pH 4 Org
05 M GSH pH 3 Org
05 M GSH pH 2 Org
145
the standard deviation is small (Table 48) however a significant difference is observed
between each of the pH values for the same buffer concentration 05 M which is again
consistent with the co-ordination mode of glutathione changing with pH Interestingly
under these experimental conditions the extraction of Eu3+
as the HDEHPDEHP
organic soluble complexes is not very efficient since the emission intensities are
unusually low This suggests that in the absence of competing Am3+
ions GSH is
interacting relatively strongly with the Eu3+
ion in aqueous solution
Table 48 J=1J=2 peak ratios and t-test results for Eu-DTPA at pH 2-4 as [GSH] is
varied
J=1J=2
[GSH] (M)
01 03 05 st dev t-test
pD 4 0202 0276 0247 0037 No sig diff
pD 3 - - 0100 - -
pD 2 - - 0500 - -
st dev - - 0202
t-test - - Sig diff
423 [Na5DTPA] Dependence at pH 4
4231 Aqueous Phase Studies
The [Na5DTPA] dependence study carried out at the INL was also repeated in
order to gain luminescence data for the experiment The conditions used were pH 4 05
M GSH and [Na5DTPA] concentrations ranging from 005 ndash 06 M The emission
spectra can be seen in Figure 422
146
Figure 422 Emission spectra of Eu(NO3)3 in D2O at pD 4 with 05 M GSH over a
Na5DTPA concentration range of 005 ndash 06 M following excitation at 397 nm
The emission intensity of the complex decreases as the concentration of
Na5DTPA is increased from 005 M to 06 M This is likely to be due to the introduction
of more O-H oscillators and therefore increased quenching as the Na5DTPA stock
solution is aqueous and there is no deuterated alternative available The emission
spectra in water do not show this decrease in intensity (Figure 423)
Figure 423 Emission spectra of Eu(NO3)3 in H2O at pH 4 with 05 M GSH over a
Na5DTPA concentration range of 005 ndash 06 M following excitation at 397 nm
0
5
10
15
20
25
30
35
550 600 650 700
Emis
sio
n In
ten
sity
(au
) x
10
00
0
Wavelength (nm)
005 M DTPA
01 M DTPA
02 M DTPA
03 M DTPA
04 M DTPA
05 M DTPA
06 M DTPA
0
2
4
6
8
10
12
14
16
550 600 650 700
Emis
sio
n In
ten
sity
(au
) x
10
00
0
Wavelength (nm)
005 M DTPA
01 M DTPA
02 M DTPA
03 M DTPA
04 M DTPA
05 M DTPA
06 M DTPA
147
Table 49 J=1J=2 peak ratios and t-test results for Eu-DTPA with 05 M GSH in
D2OH2O at pDpH 4 over a Na5DTPA concentration range of 005-06 M
J=1J=2
[Na5DTPA] (M)
005 01 02 03 04 05 06 stdev t-test
D2O 0437 0441 0431 0437 0428 0425 0403 0013
No sig
diff
H2O 0450 0440 0437 0449 0422 0424 0428 0011
No sig
diff
The J=1J=2 peak height ratios were recorded for each emission spectrum and t-
tests were carried out on the peak ratios using the t-test data analysis tool in Microsoft
Excel accounting for the standard deviations between the ratios The J=1J=2 peak
ratios show no significant difference for either the D2O or H2O samples as the
Na5DTPA concentration is increased (Table 49) suggesting that the co-ordination
mode of the DTPA does not change as the concentration is increased The luminescence
lifetimes of the samples show a decrease across the D2O samples as the concentration of
Na5DTPA increases This is consistent with the decreased emission intensity due to
greater quenching of the samples as more water is introduced However there is a slight
increase across the H2O samples as the holdback concentration increased as quenching
is reduced in these samples due to the chelating effect of the DTPA molecules therefore
the results obtained in water for this study are likely to be most accurate The lifetimes
and q values are tabulated in Table 410 Although the q values are likely to be
unreliable especially for the highest Na5DTPA concentrations it can be seen that there
is still approximately 1 H2O molecule in the inner hydration sphere of the complexes
consistent with [Eu(DTPA)]2-
formation again implying very little or weak binding
with GSH
148
Table 410 Luminescence lifetimes and q values for Eu-DTPA with 05 M GSH at pH
4 over a Na5DTPA concentration range of 005-06 M following excitation at 397 nm
[Na5DTPA]
(M)
τ D2O (μs) τ H2O (μs) q plusmn 02
005 1679 plusmn 3 652 plusmn 2 08
01 1549 plusmn 4 659 plusmn 2 10
02 1348 plusmn 4 666 plusmn 3 09
03 1179 plusmn 4 665 plusmn 3 08
04 1076 plusmn 4 674 plusmn 4 07
05 978 plusmn 4 698 plusmn 4 05
06 916 plusmn 5 714 plusmn 5 03
4232 Extraction Studies
Extractions were carried out on the samples using 02 M HDEHP in dodecane
for the organic phase The emission spectra of both the aqueous and organic phases
post-extraction can be seen in Figure 424
Figure 424 Emission spectra of aqueous and organic phases after Eu3+
extraction with
05 M GSH at pH 4 over a Na5DTPA concentration range of 005-06 M following
excitation at 397 nm
0
1
2
3
4
5
6
7
550 600 650 700
Emis
sio
n In
ten
sity
(au
) H
un
dre
ds
Wavelength (nm)
01 M DTPA Aq
03 M DTPA Aq
05 M DTPA Aq
01 M DTPA Org
03 M DTPA Org
05 M DTPA Org
149
As expected the extraction data show that the best Eu3+
extraction occurs with
01 M Na5DTPA the lowest concentration of holdback reagent and that very little
extraction occurs at 03 M and 05 M Na5DTPA under these conditions The J=1J=2
peak ratios for the aqueous phases show no significant difference as the Na5DTPA
concentration is increased (Table 411) Unfortunately here the extraction is too weak
and the emission intensity too low to obtain reliable J=1J=2 peak ratios for the organic
phase
Table 411 J=1J=2 peak ratios and t-test results for Eu3+
in the aqueous phase with 05
M GSH at pH 4 as [Na5DTPA] is varied after extraction with 02 M HDEHP
Na5DTPA (M) 01 03 05 st dev t-test
J=1J=2 0552 0578 0502 0039 No sig
diff
424 [HDEHP] Dependence at pH 4
An HDEHP concentration dependence study was carried out under the same
conditions as the study at INL 05 M GSH 03 M Na5DTPA pH 4 and an extractant
concentration range of 04-10 M HDEHP in dodecane Equilibration time was for 30
minutes The emission spectra of the phases after extraction can be seen in Figures 425
and 426
150
Figure 425 Emission spectra of aqueous phases after Eu3+
extraction with 05 M GSH
and 03 M Na5DTPA at pH 4 over an HDEHP concentration range of 02-10 M
following excitation at 397 nm
The J=1J=2 peak ratios for the aqueous phases show no significant difference as
the HDEHP concentration is increased (Table 412) as expected since the co-ordination
mode of the aqueous phase should be unaffected by the organic phase Unfortunately
again the extraction is too weak and the emission intensity too low to obtain reliable
J=1J=2 peak ratios for the organic phase
Table 412 J=1J=2 peak ratios and t-test results for Eu3+
in the aqueous phase with 05
M GSH and 03 M Na5DTPA at pH 4 as [HDEHP] is varied after extraction
HDEHP (M) 04 06 08 10 st dev t-test
J=1J=2 0472 0499 0455 0510 0025 No sig
diff
00
02
04
06
08
10
12
550 600 650 700
Emis
sio
n In
ten
sity
(au
) x
10
00
0
Wavelength (nm)
04 M HDEHP Aq
06 M HDEHP Aq
08 M HDEHP Aq
10 M HDEHP Aq
151
Figure 426 Emission spectra of organic phases after Eu3+
extraction with 05 M GSH
and 03 M Na5DTPA at pH 4 over an HDEHP concentration range of 02-10 M
following excitation at 397 nm
The lowest Eu3+
extraction is with 04 M HDEHP with better extraction at
higher HDEHP concentrations Although better extraction is obtained at higher
concentrations Am3+
is also extracted to a higher extent decreasing the separation
factor (Section 413)
43 Radiolysis Studies using GSH at pH 4
431 Aqueous Phase Studies
In order to determine how resistant the glutathione buffered system is to
radiolysis a selection of aqueous samples at pHpD 4 containing 05 M GSH and a
Na5DTPA concentration range of 005-06 M were irradiated at the Dalton Cumbrian
Facility using a 60
Co irradiator The samples were exposed to 7 kGy γ-radiation and
analysed by luminescence spectroscopy The emission spectra of the samples can be
seen in Figure 427
00
00
00
01
01
01
01
550 600 650 700
Emis
sio
n In
ten
sity
(au
) x
10
00
0
Wavelength (nm)
04 M HDEHP Org
06 M HDEHP Org
08 M HDEHP Org
10 M HDEHP Org
152
Figure 427 Emission spectra of Eu(NO3)3 in H2O at pH 4 with 05 M GSH over a
Na5DTPA concentration range of 005 ndash 06 M after irradiation with 7 kGy γ-radiation
following excitation at 397 nm
The spectra of the samples show a lower emission intensity after irradiation
(Figure 427) than beforehand (Figure 423) but the profile remains the same indicating
that the radiation has little or no degrading effect on the complex in the aqueous phase
The decreased intensity is likely to be due to increased quenching effects caused by
residual radicals present as a result of irradiating the solvent The J=1J=2 ratios and co-
ordination mode remained unchanged (Table 413) as did the luminescence lifetimes of
the samples and the q values (Table 414)
00
01
01
02
02
03
03
04
550 600 650 700
Emis
sio
n In
ten
sity
(au
) x
10
00
0
Wavelength (nm)
005 M DTPA
01 M DTPA
02 M DTPA
03 M DTPA
04 M DTPA
05 M DTPA
06 M DTPA
153
Table 413 J=1J=2 peak ratios and t-test results for Eu-DTPA with 05 M GSH in
D2OH2O at pDpH 4 over a Na5DTPA concentration range of 01-06 M after
irradiation with 7 kGy γ-radiation
[Na5DTPA] (M)
01 02 03 04 05 06 st
dev
t-test
J=1J=2 0477 0481 0452 0401 0407 0411 0036
No sig
diff
Table 414 Luminescence lifetimes and q values for Eu-DTPA with 05 M
GSH at pH 4 over a Na5DTPA concentration range of 01-06 M after irradiation with 7
kGy γ-radiation
[Na5DTPA] (M) τ H2O (μs) τ D2O (μs) q plusmn 02
01 648 plusmn 4 1895 plusmn 12 10
02 661 plusmn 6 1678 plusmn 10 09
03 670 plusmn 6 1536 plusmn 11 08
04 679 plusmn 5 1462 plusmn 9 07
05 701 plusmn 7 1328 plusmn 10 05
06 696 plusmn 6 1211 plusmn 8 03
432 Extraction Studies
Extractions were then carried out on a selection of the irradiated samples using
02 M HDEHP in dodecane with Eu3+
The resultant emission spectra of both the
aqueous and organic phases post-extraction can be seen in Figure 428
154
Figure 428 Emission spectra of aqueous and organic phases after Eu3+
extraction from
irradiated aqueous phase at pH 4 containing 05 M GSH over a Na5DTPA concentration
range of 01-06 M
As expected the extraction data show that the best Eu3+
extraction occurs with
01 M Na5DTPA the lowest concentration of holdback reagent and that very little
extraction occurs at 03 M and 05 M Na5DTPA under these conditions With the
exception of the 01 M Na5DTPA sample for which the extraction decreases after
irradiation the emission intensity remains relatively constant for each of the phases of
the samples after irradiation The J=1J=2 ratios and co-ordination mode for the aqueous
phase remained unchanged (Table 415) Again the extraction is too weak and the
emission intensity too low to obtain reliable J=1J=2 peak ratios for the organic phase
Table 415 J=1J=2 peak ratios and t-test results for Eu3+
in the aqueous phase with 05
M GSH and at pH 4 as [Na5DTPA] is varied after extraction with 02 M HDEHP in
dodecane from an aqueous phase irradiated at 7 kGy γ ndashradiation
Na5DTPA (M) 01 03 05 st dev t-test
J=1J=2 0505 0563 0551 0031 No sig diff
44 Luminescence Studies using GSH with Dy3+
As well as obtaining primary extraction data for GSH with Eu3+
under a variety
of conditions it is also important to consider the behaviour and extraction of other Ln3+
ions with the buffer in order to achieve effective lanthanide-actinide separation
0
1
2
3
4
5
6
7
8
9
10
550 600 650 700
Emis
sio
n In
ten
sity
(au
) Hu
nd
red
s
Wavelength (nm)
01 M DTPA Aq
03 M DTPA Aq
05 M DTPA Aq
01 M DTPA Org
03 M DTPA Org
05 M DTPA Org
155
Dysprosium(III) was chosen for a preliminary study as it is later in the lanthanide series
representing the heavier metal ions and how they may behave under such conditions
Also like Eu3+
it is emissive in the visible region of the electromagnetic spectrum and
so may be easily analysed by luminescence spectroscopy
441 Dy3+
Complexation Studies
Initial data were obtained for Dy3+
and emission spectra were recorded for the
free ion from Dy(NO3)3 Dy-DTPA (005 M Na5DTPA) and Dy(NO3)3 with GSH (05
M) all in aqueous solution (Figure 429) A concentration of 005 M Na5DTPA was
chosen for the dysprosium experiments as the emission intensity of Dy3+
is relatively
weak and this technique is not sensitive enough to observe any extraction of the metal
from high Na5DTPA concentrations
Figure 429 Emission spectra of Dy(NO3)3 (10 mM) Dy-DTPA (10 mM Dy(NO3)3
005 M Na5DTPA) and Dy(NO3)3 (10 mM) with GSH (05 M) in H2O following
excitation at 352 nm Note that the tail of ligand emission can be seen in the Dy DTPA
and Dy GSH solutions at shorter wavelengths
The spectra show that the emission intensity of the 7F92 rarr
6H152 and
7F92 rarr
6H132 transitions is slightly higher when GSH buffer is present in solution than for the
free ion alone and the intensity is much greater when Na5DTPA is present in the
solution showing formation of a Dy-DTPA complex Interestingly evidence for
binding of GSH and DTPA with Dy3+
is further manifested in the emission spectra by
the presence of residual ligand emission at higher energy These samples were then
00
02
04
06
08
10
12
14
16
425 475 525 575 625 675
Emis
sio
n In
ten
sity
(au
) x
10
00
0
Wavelength (nm)
Dy H2O
Dy DTPA
Dy GSH
7F92 rarr
6H152
7F92 rarr
6H132
156
extracted into an organic phase of 10 M HDEHP in dodecane (Figure 430) as 02 M
extractant was found to be too low to observe any Dy3+
extraction due to the overall
weak emission of the ion relative to Eu3+
Figure 430 Emission spectra of aqueous and organic phases of Dy(NO3)3 Dy-DTPA
and Dy(NO3)3 with GSH after extraction with 10 M HDEHP following excitation at
352 nm
The spectra show that without Na5DTPA present the Dy3+
is extracted into the
organic phase but for the Dy-DTPA complex little or no metal extraction is observed in
the absence of competitive binding with Am3+
This may indicate that the metal is not
being extracted into the organic phase and that the heavier lanthanides may suffer the
same kinetic issues present for amino acid buffers at higher pH (Section 332) or that
this technique is not sensitive enough to obtain good extraction data for less emissive
lanthanides
442 pH Dependence Studies
To attempt to determine whether kinetic issues arise for heavier lanthanides with
GSH buffer at higher pH values a pH study was carried out on Dy-DTPA systems
containing 005 M Na5DTPA and 05 M GSH over a pH range of 2-4 One sample
containing 03 M Na5DTPA was also measured analogous to the europium data sets
The extraction data can be seen in Figure 431
00
02
04
06
08
10
12
14
425 475 525 575 625 675
Emis
sio
n In
ten
sity
(au
) x
10
00
0
Wavelength (nm)
Dy H2O Aq
Dy DTPA Aq
Dy GSH Aq
Dy H2O Org
Dy DTPA Org
Dy GSH Org
157
Figure 431 Emission spectra of aqueous and organic phases of Dy(NO3)3 Dy-DTPA
and Dy(NO3)3 with GSH after extraction with 10 M HDEHP following 352 nm
excitation
The extraction is lowest for the sample with the highest Na5DTPA
concentration as would be expected As the pH increases the extraction of Dy3+
decreases suggesting that the same kinetic issues may also be present in for the GSH
system Further investigation using a more sensitive technique such as ICP-MS is
necessary to confirm this (Section 46)
45 Luminescence Studies using GSH with Mixed Ln3+
Systems at pH 4
The Dy3+
luminescence work was extended to solutions of a mixture of 4
luminescent lanthanide ions (Sm3+
Eu3+
Tb3+
and Dy3+
) to be able to probe the relative
extraction of different lanthanides from a mixture relevant to a real TALSPEAK type
process The spectra are colour coded to each ionrsquos luminescent colour under UV light
irradiation
451 Complexation Studies
Initial data were obtained for each lanthanide ion and emission spectra were
recorded for Ln(NO3)3 Ln-DTPA (005 M Na5DTPA) and Ln(NO3)3 with GSH (05
M) all in aqueous solution (Figures 432-434) analogous to the Dy3+
data
00
01
02
03
04
05
06
07
08
09
10
550 560 570 580 590
Emis
sio
n In
ten
sity
(au
) x 1
00
00
Wavelength (nm)
pH 2 Aq
pH 3 Aq
pH 4 Aq
pH 4 (03 M DTPA) Aq
pH 2 Org
pH 3 Org
pH 4 Org
pH 4 (03 M DTPA) Org
158
Figure 432 Emission spectra of Ln(NO3)3 (1 mM EuTbSm3+
10 mM Dy3+
) in H2O
at pH 4 following direct excitation (405 nm for Sm3+
397 nm for Eu3+
366 nm for Tb3+
and 352 nm for Dy3+
)
Figure 433 Emission spectra of Ln(NO3)3 (1 mM EuTbSm3+
10 mM Dy3+
) with
GSH (05 M) at pH 4 in H2O following direct excitation (405 nm for Sm3+
397 nm for
Eu3+
366 nm for Tb3+
and 352 nm for Dy3+
)
0
5
10
15
20
25
30
35
40
45
50
450 500 550 600 650 700 750
Emis
sio
n In
ten
sity
(au
) H
un
dre
ds
Wavelength (nm)
Sm
Eu
Tb
Dy
0
2
4
6
8
10
12
14
16
18
20
450 500 550 600 650 700 750
Emis
sio
n In
ten
sity
(au
) Th
ou
san
ds
Wavelength (nm)
Sm
Eu
Tb
Dy
159
Figure 434 Emission spectra of Ln-DTPA (1 mM EuTbSm3+
10 mM Dy3+
005 M
Na5DTPA) in H2O at pH 4 following direct excitation (405 nm for Sm3+
397 nm for
Eu3+
366 nm for Tb3+
and 352 nm for Dy3+
)
For all of the metal ions the emission intensity is greater in the sample with
GSH than for the free ions in solution due to reduced quenching by the presence of the
buffer The profiles of all of the spectra remain the same showing that although the
glutathione may be in exchange with surrounding water molecules a stable complex
between the buffer and metal ions is not being formed The emission intensity is much
greater for each of the metal ions with Na5DTPA due to the formation of a Ln-DTPA
complex in each case and the peak splitting observed for the Eu3+
complex can also be
seen for the Tb3+
complex as the emission spectra of these ions are more sensitive to
their co-ordination environment than Sm3+
or Dy3+
Table 416 Luminescence lifetimes for lanthanide samples at pH 4
Sample Lifetime (μs)
Sm(III) Eu (III) Tb(III) Dy (III)
Ln3+
341 plusmn 1 121 plusmn 25 394 plusmn 19 525 plusmn 1
Ln3+
with
GSH
686 plusmn 1 184 plusmn 8 558 plusmn 28 830 plusmn 1
Ln-DTPA 11 plusmn 1 671 plusmn 4 1930 plusmn 20 14 plusmn 1
0
1
2
3
4
5
6
7
450 500 550 600 650 700 750
Emis
sio
n In
ten
sity
(au
) x
10
00
0
Wavelength (nm)
Sm
Eu
Tb
Dy
160
The luminescence lifetimes of all the metal ions (Table 416) are in the expected
ranges for these ions in aqueous solutions and exhibit the same pattern as the emission
intensities increasing as GSH is added to the metal solutions and being greatest for the
Ln-DTPA complexes The q values were calculated for Eu3+
and Tb3+
as calculations of
q for Sm3+
and Dy3+
are unreliable and were as expected with a hydration number of
around 8 for the M3+
ion in solution co-ordination of around 5 for the M3+
ion with
GSH (consistent with the [GSH] dependence studies in Section 421) and 1 water
molecule bound to the Ln-DTPA complex
Table 417 Luminescence lifetimes and q values for Eu3+
and Tb3+
samples at pH 4
Sample Lifetime (μs) q
Eu (III)
H2O
Eu (III)
D2O
Tb(III)
H2O
Tb (III)
D2O
Eu(III) Tb(III)
Ln3+
121 plusmn 25 2309 plusmn 38 394 plusmn 19 1698 plusmn 16 82 82
Ln3+
with
GSH
184 plusmn 8 1658 plusmn 26 558 plusmn 28 1889 plusmn 12 52 53
Ln-DTPA 671 plusmn 4 2066 plusmn 15 1930 plusmn 20 3546 plusmn 27 09 09
452 pH Dependence Studies
As with the dysprosium study extractions were carried out on the mixed
lanthanide samples under the same conditions The aqueous phases contained 005 M
Na5DTPA and 05 M GSH over a pH range of 2-4 The emission spectra of each
aqueous sample before extraction were also recorded but were found to be the same for
each pH The luminescence lifetimes of the samples were also very similar (Table 418)
consistent with the Eu3+
data (Section 422) The q values for Eu3+
and Tb3+
are as
expected with 1 water molecule bound to each Ln-DTPA complex (Table 419) As a
representative example the spectra for the pH 4 sample can be seen in Figure 435
161
Figure 435 Emission spectra of Ln(NO3)3 (1 mM EuTbSm3+
10 mM Dy3+
) with
GSH (05 M) and Na5DTPA (005 M) following direct excitation (405 nm for Sm3+
397
nm for Eu3+
366 nm for Tb3+
and 352 nm for Dy3+
)
Table 418 Luminescence lifetimes for aqueous phases before extraction over a
pH range of 2-4
Sample Lifetime (μs)
Sm(III) Eu (III) Tb(III) Dy (III)
pH 2 12 plusmn 1 677 plusmn 9 1851 plusmn 21 14 plusmn 1
pH 3 12 plusmn 1 715 plusmn 9 1934 plusmn 21 13 plusmn 1
pH 4 12 plusmn 1 699 plusmn 7 1912 plusmn 26 14 plusmn 1
Table 419 Luminescence lifetimes and q values for Eu3+
and Tb3+
samples before
extraction over a pH range of 2-4
Sample Lifetime (μs) q
Eu (III)
H2O
Eu (III)
D2O
Tb(III)
H2O
Tb (III)
D2O
Eu(III) Tb(III)
pH 2 677 plusmn 9 2897 plusmn 27 1851 plusmn 21 3765 plusmn 31 09 10
pH 3 715 plusmn 9 3011 plusmn 13 1934 plusmn 21 3705 plusmn 22 08 09
pH 4 699 plusmn 7 3032 plusmn 15 1912 plusmn 26 3815 plusmn 16 09 10
00
10
20
30
40
50
60
70
450 500 550 600 650 700 750
Emis
sio
n In
ten
sity
(au
) x
10
00
0
Wavelength (nm)
Sm
Eu
Tb
Dy
162
The spectra for the aqueous and organic phases after extraction with 10 M
HDEHP in dodecane (in order to ensure sufficient enough extraction to be observed by
this technique) are plotted in Figures 436-438
Figure 436 Emission spectra of aqueous and organic phases of Ln3+
with 05 M GSH
and 005 M Na5DTPA after extraction with 10 M HDEHP at pH 2 following direct
excitation (405 nm for Sm3+
397 nm for Eu3+
366 nm for Tb3+
and 352 nm for Dy3+
)
Figure 437 Emission spectra of aqueous and organic phases of Ln3+
with 05 M GSH
and 005 M Na5DTPA after extraction with 10 M HDEHP at pH 3 following direct
excitation (405 nm for Sm3+
397 nm for Eu3+
366 nm for Tb3+
and 352 nm for Dy3+
)
00
05
10
15
20
25
30
450 500 550 600 650 700 750
Emis
sio
n In
ten
sity
(au
) x
10
00
0
Wavelength (nm)
Sm Aq
Eu Aq
Tb Aq
Dy Aq
Sm Org
Eu Org
Tb Org
Dy Org
00
05
10
15
20
25
30
450 500 550 600 650 700 750
Emis
sio
n In
ten
sity
(au
) x
10
00
0
Wavelength (nm)
Sm Aq
Eu Aq
Tb Aq
Dy Aq
Sm Org
Eu Org
Tb Org
Dy Org
163
Figure 438 Emission spectra of aqueous and organic phases of Ln3+
with 05 M GSH
and 005 M Na5DTPA after extraction with 10 M HDEHP at pH 4 following direct
excitation (405 nm for Sm3+
397 nm for Eu3+
366 nm for Tb3+
and 352 nm for Dy3+
)
At all three pH values the order of extractability is Sm gt Eu gt Tb gt Dy
showing that the heavier lanthanides are the most difficult to extract The above data
demonstrate that extraction of Ln3+
is reasonably good at pH 2 and 3 but slightly lower
at pH 3 However at pH 4 extraction of all lanthanide ions is drastically reduced
particularly for Tb3+
and Dy3+
which have very low relative concentrations in the
organic phase Although the extraction of Sm3+
and Eu3+
is also greatly reduced there is
still some extraction of these metals into the organic phase This is consistent with the
previously obtained dysprosium results suggesting that there may be kinetic issues
present for heavier lanthanides at high pH The trend in relative extraction efficiency of
the Ln3+
ions approximately follows the relative stability constants of GSH-Ln
complexes Lighter Ln-GSH complexes are less stable an effect of charge density of the
Ln3+
cations so are extracted more efficiently This was investigated further by ICP-
MS
46 ICP-MS Studies with GSH
In order to determine whether a TALSPEAK type system using glutathione as a
buffer had the same kinetic issues as the amino acid systems whereby poor separation of
the heavier lanthanides was observed ICP-MS was carried out on extracted samples
containing 10 lanthanides (La-Ho with the exception of Pm) at pH 2 3 and 4 to
00
05
10
15
20
25
30
35
450 500 550 600 650 700 750
Emis
sio
n In
ten
sity
(au
) x
10
00
0
Wavelength (nm)
Sm Aq
Eu Aq
Tb Aq
Dy Aq
Sm Org
Eu Org
Tb Org
Dy Org
164
determine the distribution pattern of the series using GSH as a buffer The DLn values
can be seen in Figures 439 and 440 for the pH 2 and pH 3 data sets
Figure 439 DLn for varying GSH concentration at pH 2 with 005 M Na5DTPA after
extraction with 02 M HDEHP in dodecane
Figure 440 DLn for varying GSH concentration at pH 3 with 005 M Na5DTPA after
extraction with 02 M HDEHP in dodecane
0
5
10
15
20
25
30
35
40
56 57 58 59 60 61 62 63 64 65 66 67 68
Dis
trib
uti
on
Rat
io
Atomic Number
01 M GSH
02 M GSH
03 M GSH
04 M GSH
05 M GSH
Am3+
0
5
10
15
20
25
30
35
56 57 58 59 60 61 62 63 64 65 66 67 68
Dis
trib
uti
on
Rat
io
Atomic Number
01 M GSH
02 M GSH
03 M GSH
04 M GSH
05 M GSH
Am3+
165
The data set for pH 2 resembles a typical TALSPEAK curve as also
demonstrated by amino acids at pH 2 (Section 3) However at pH 3 the distribution of
the metal ions continues to decrease across the lanthanide series indicating that higher
pH is less favourable for extraction of the heavier lanthanides This may be explained
by the fact that the stability of Ln-GSH complexes is lower at lower pH values making
the metal ions easier to extract The analysis was also repeated for samples at pH 4 but
for some of the later lanthanides in the series the quantity of metal ion present was
below the limit of detection of the technique (004 ng mL-1
) so the data could not
accurately be plotted Corresponding separation factors can be seen in Table 420 and
plotted in Appendix 2 (for pH 2 and 3) Separation factors for all lanthanides are fairly
low at pH 2 compared to the original TALSPEAK process (SFEuAm = 91) The data also
show that for the earlier lanthanides as the pH is increased very high separation factors
can be achieved but separation is much lower for later lanthanides with increasing pH
This indicates that unfortunately the same kinetic issues are likely to be a problem at
higher pH for the glutathione buffered system as for the amino acid systems
166
Table 420 SFLnAm for varying GSH concentration over a pH range of 2-4 with
005 M Na5DTPA after extraction with 02 M HDEHP in dodecane
pH
[GSH]
(M)
SF
La Ce Pr Nd Sm Eu Gd Tb Dy Ho
2 01 234 171 148 107 136 158 216 222 237 234
2 02 244 176 145 103 134 146 215 229 239 244
2 03 263 183 145 105 137 165 243 244 281 289
2 04 239 170 151 111 145 168 218 237 259 265
2 05 278 197 164 117 162 189 257 269 300 314
3 01 1735 972 477 276 163 104 112 53 41 38
3 02 1953 841 433 256 320 266 290 130 89 77
3 03 1898 785 388 220 152 90 95 39 28 24
3 04 2046 812 412 243 196 121 126 53 38 34
3 05 2145 705 312 139 36 16 20 04 02 00
4 01 3777 141 12 - - - - - - -
4 02 5548 231 36 06 - - - - - -
4 03 2768 239 27 - - - - - - -
4 04 1620 150 21 01 - - - - - -
4 05 1589 286 48 11 - - - - - -
47 1H NMR Studies on GSH Systems
The glutathione systems were additionally studied by 1H NMR spectroscopy in
order to confirm the complexation observed by luminescence spectroscopy Spectra
were recorded in D2O for GSH GSH after irradiation Eu(NO3)3 with GSH (150)
Na5DTPA with GSH (110) and Eu-DTPA with GSH (1550
Eu(NO3)3Na5DTPAGSH) (Figures 441 a-e)
167
GSH0011resp
45 40 35 30 25 20 15 10
Chemical Shift (ppm)
0
005
010
Norm
alized Inte
nsity
197201200100200099
c
d
gb
i
f
44
944
844
6
38
9
37
637
437
2
28
628
628
528
4
24
924
824
724
624
524
4
21
120
920
720
5
GSH Irradiated0011resp
45 40 35 30 25 20 15 10
Chemical Shift (ppm)
0
005
010
015
020
025
Norm
alized Inte
nsity
133151244272014101206498131111059100
m
c
d
n
g
q
b
l
i
p
f
47
0
44
7 44
544
442
942
841
641
541
140
940
940
738
137
737
537
3
36
736
6
29
929
728
428
328
1
26
7
24
6
24
424
324
223
823
022
822
6
20
720
520
419
6
19
519
419
319
1
a
b
168
Eu GSH0011resp
45 40 35 30 25 20 15 10
Chemical Shift (ppm)
005
010
015
Norm
alized Inte
nsity
035183050206177050088216024026100
d
g
b
i
f
c
45
044
844
7
42
0 41
841
741
341
241
138
0 37
837
737
136
9 30
230
1
28
928
728
628
428
328
1
25
124
924
724
624
424
2 23
3 23
122
921
020
820
720
519
919
819
719
6
GSH DTPA0011resp
45 40 35 30 25 20 15 10
Chemical Shift (ppm)
0
005
010
015
Norm
alized Inte
nsity
032158045179156092075366021025099
c
d
g
DTPA
DTPA
DTPA
b
DTPA
i
f
45
044
9 44
744
6
41
941
841
741
241
141
0
37
937
737
537
036
8
34
133
633
5
30
730
530
1
28
928
628
528
428
228
0
25
024
824
624
524
324
1 23
223
022
821
020
820
620
419
719
5
c
d
169
EuDTPA GSH0011resp
45 40 35 30 25 20 15 10
Chemical Shift (ppm)
0
0005
0010
0015
0020
0025
0030
0035
0040
0045
0050
0055
Norm
alized Inte
nsity
180181200200212103673021100
47
0
44
244
1
38
4
36
836
3
32
832
0 30
230
129
9 28
628
528
328
1
24
724
624
524
424
3
20
820
720
520
3
Figure 441 1H NMR spectra for GSH in D2O under a range of conditions at 298 K a)
GSH b) GSH after irradiation with 7 kGy γ-radiation c) Eu(NO3)3 with GSH d) GSH
with Na5DTPA e) Eu-DTPA with GSH
Figure 442 1H
1NMR proton assignments for GSH (top) and γ-Glu-Cys (bottom)
It can be seen from spectra ldquoardquo and ldquobrdquo that there is some degradation of GSH
after irradiation with 7 kGy γ-radiation from a 60
Co irradiator shown by the presence of
e
170
γ-Glu-Cys fragments12
(Figure 442) The buffer seems to be susceptible to γ-radiolysis
and the integration ratios show that the γ-Glu-Cys fragments are present in a significant
quantity as the ratios are comparable to those of the intact GSH Spectrum ldquocrdquo shows
that the buffer does not form a stable complex with Eu3+
as there is only slight shifting
of the peaks indicating weak interaction and perhaps fast dynamic exchange on the
timescale of the NMR experiment There is also no notable paramagnetic broadening as
would be expected if a Eu3+
complex is formed Spectrum ldquoerdquo does show slight
paramagnetic broadening relative to spectrum ldquodrdquo (Na5DTPA with GSH) confirming
the formation of the Eu-DTPA complex seen in previous emission spectra (Section
422)
48 Summary and Conclusion of Glutathione Work
Since amino acids have not been shown to act as holdback reagents by
themselves the potential of using the tripeptide L-glutathione was investigated Initial
separation studies were carried out using glutathione at pH 4 as is was anticipated that
based on its pKa values glutathione would be most likely to act as a successful
holdback reagent at this pH despite the unfavourable increase of pH Preliminary
investigations found that like amino acids GSH is ineffective as a holdback reagent on
its own as there was no separation observed between Eu3+
and Am3+
when used without
Na5DTPA
Subsequent investigations were carried out using GSH alongside Na5DTPA to
determine whether separation was improved with the tripeptide buffer At pH 2 and pH
3 it was found that the glutathione acts solely as a buffer as the separation factor in each
case was independent of GSH concentration However at pH 4 separation between
Eu3+
and Am3+
was found to increase as the buffer concentration was increased
suggesting that the glutathione is interacting with the Ln-DTPA complexes at this pH
This could be explained by the increase in stability of Ln-GSH complexes as the pH is
increased A buffer concentration of 05 M was then used for all further optimisation
experiments
At 05 M GSH the separation factor was found to increase dramatically as a
function of Na5DTPA concentration up to 03 M Na5DTPA After this peak there was
a rapid decrease in separation as the concentration is increased further up to 06 M
Na5DTPA as the stoichiometry is close to 11 GSHDTPA The separation factors
achieved here were extremely high (~1000) ndash a factor of 10 higher than the current
171
TALSPEAK system and the optimised alanine system whilst still maintaining low Am3+
extraction
At 03 M Na5DTPA the separation factor then increased as the extractant
concentration was increased from 02 to 04 M HDEHP in dodecane after which the SF
began to decrease again with the optimum separation at 04 M giving a SF of 1238 At
04 M Na5DTPA however the separation factor decreases rapidly as the extractant
concentration is increased due to the DAm increasing by a factor of 1000 consistent with
the complexant and buffer possibly forming some kind of adduct which no longer
successfully holds back Am3+
at higher Na5DTPA concentrations
Luminescence experiments mimicking the separation studies showed that the
glutathione does not form a stable complex with the Eu3+
ion and is in exchange with
surrounding solvent molecules even at the highest buffer concentrations preventing the
GSH from acting as a holdback reagent and allowing extraction of the metal into the
organic phase Proton NMR spectroscopy confirmed that although the glutathione may
be in exchange with surrounding water molecules no stable complexes between the
buffer and metal ions are formed (Appendix 8)
In samples containing Na5DTPA a Eu-DTPA complex can be clearly observed
in the emission spectra with or without the presence of GSH over a pH range of 2-4
The J=1J=2 peak ratios showed that there is no change in the co-ordination mode of the
buffer to the metal ion as the concentration of GSH is increased for each pH However
across the data sets the co-ordination mode of glutathione was found to be different at
different pH values as expected based on pKa values and increasing stability constant
with pH
At 05 M GSH the co-ordination mode of the Eu-DTPA complex in the aqueous
phase was found not to change as [Na5DTPA] was changed with metal extraction
typically decreasing as the holdback reagent increases and at 03 M Na5DTPA with 05
M GSH extraction was found to increase as HDEHP concentration increased as
expected Unfortunately luminescence spectroscopy does not seem to be a sensitive
enough technique to gain much information from samples post-extraction using these
conditions
In order to determine how resistant the glutathione buffered system is to
radiolysis a selection of samples were irradiated with 7 kGy γ-radiation and analysed
by luminescence and 1H NMR spectroscopies The radiation was seen to have some
degrading effect on the buffer in the aqueous phase with slightly decreased
luminescence emission intensity of complexes post-irradiation and evidence of
172
significant quantities of γ-Glu-Cys fragments present in the 1H NMR spectrum
However the emission profiles co-ordination mode and luminescence lifetimes of the
samples remained unchanged Extraction also seemed to be unaffected with the
emission remaining relatively constant for each of the phases of the samples after
irradiation
Initial data obtained on the glutathione system with europium(III) and
americium(III) seemed promising as after optimisation very high separation factors
were achieved and despite the buffer being susceptible to radiolysis extraction of
lanthanide ions was still high after irradiation However in order to be a successful
alternative to the current TALSPEAK system it is essential that effective separation of
all lanthanides from MA3+
can occur Further luminescence experiments were carried
out firstly on an analogous dysprosium system in order to represent heavier lanthanide
elements followed by a mixture of 4 lanthanide metals in the same samples
For the dysprosium study as the pH was increased from 2-4 the extraction of
Dy3+
decreased suggesting that the same kinetic issues noted for heavier lanthanides in
the amino acid systems may also be present for the GSH system at higher pH values In
the mixed samples the same pattern was observed with extraction of Ln3+
decreasing as
pH was increased At pH 4 extraction of all lanthanide ions was very low particularly
for Tb3+
and Dy3+
which are both heavier than Sm3+
and Eu3+
ICP-MS was carried out
on a series of samples containing a mixture of 10 lanthanides in order to confirm
whether the heavier lanthanides are in fact subject to kinetic issues with GSH
ICP-MS data was consistent with the luminescence data showing decreased
extraction of heavier lanthanides as pH increases from 2 to 4 The quantity of metal
extracted was so low it was below the limit of detection for some of the heavier metals
at pH 4 forcing the conclusion that unfortunately the same kinetic issues are a problem
at higher pH for the glutathione buffered system as for the amino acid systems Further
optimisation of the system to exploit the combined liquid-liquid extraction efficiencies
as a function of atomic number may allow the development of an extraction process of
lighter over heavier lanthanides for rare earth recycling which is currently a
strategically important goal13
173
1 ImmuneHealthSciencecom What Glutathione (GSH) is and how it affects your
immune health httpwwwimmunehealthsciencecomglutathionehtml 2015
2 ME Sears Scientific World Journal 2013 2013 219840
3 L Patrick Mercury toxicity and antioxidants Part I Role of glutathione and alpha-
lipoic acid in the treatment of mercury toxicity Alternative Medicine 2002
4 EA Bump and JM Brown Pharmacol Ther 1990 47 1 117-136
5 JB Mitchell and A Russo Br J Cancer 1987 55 Suppl VIII 96-104
6 VV Nikonorov J Anal Chem 2010 65 4 359-365
7 A Miličević and N Raos Acta Chim Slov 2014 61 904-908
8 BS Garg BK Singh DN Kumar and PK Sing Indian J Chem 2003 42A 79-83
9 Sigma Aldrich Product Information
httpwwwsigmaaldrichcometcmedialibdocsSigma-AldrichProduct_Information_
Sheetg4251pisPar0001Filetmpg4251pispdf
10 SJA Pope BP Burton-Pye R Berridge T Khan PJ Skabara and S Faulkner
Dalton Trans 2006 2907-2912
11 TS Grimes MP Jensen L Debeer-Schmidt K Littrell and KL Nash J Phys
Chem B 2012 116 46 13722-13730
12 RJ Hopkinson PS Barlow CJ Schofield and TDW Claridge Org Biomol
Chem 2010 8 4915-4920
13 LS Natrajan and MH Langford Paden f-Block Elements Recovery in A Hunt ed
Element Recovery and Sustainability RSC 2013 6 140-184
174
5 MODIFIED DTPA LIGANDS AS COMBINED BUFFERS AND SOFT
DONORS IN A TALSPEAK SYSTEM
Amino acids and the tripeptide L-glutathione have been shown not to be suitable
as a combined buffer and soft-donor for potential replacement of DTPA
(diethylenetriaminepentaacetic acid) and the lactate buffer used in the TALSPEAK
process (Trivalent Actinide Lanthanide Separation by Phosphorus reagent Extraction
from Aqueous Complexation) an advanced reprocessing technique currently being
developed in the USA They do not act as holdback reagents in their own right as they
do not bind preferentially to minor actinide (MA3+
) over lanthanide (Ln3+
) ions
preventing enhanced selective extraction of Ln3+
by HDEHP (di-
(2ethylhexyl)phosphoric acid) into an organic phase The possibility of synthesising a
combined buffer and soft-donor with DTPA and amino acid functionality was therefore
considered
By incorporating additional soft donors onto the DTPA structural framework
from amino acids the overall system would be simplified to just two components rather
than three This could be achieved by incorporating an amino acid or other soft donor
compounds into the DTPA scaffold itself (Figure 51) This strategy may increase the
complexation affinity binding constants and associated thermodynamic parameters to
the MA3+
ion improving the separation and slowing down the kinetics of the exchange
processes if the ligand has a significant specificity for MA3+
over Ln3+
This is
especially true if two of the carboxylic acid moieties are replaced by relatively softer
donors here amide groups
A report on bis(methionine)-appended DTPA was published by Hazari et al in
2010 on the use of Tc-DTPA-bis(methionine) in tumour imaging1 however there are no
literature reports on the synthesis or use of amino acid appended or any modified DTPA
ligands for solvent extraction and separation studies
The work described in this chapter was performed in collaboration with an
MChem student a summer student and the Institute for Waste disposal (INE)
Karlsruhe Germany The initial ligand syntheses were carried out jointly between
myself and the MChem student and all luminescence analysis was performed jointly
The refining of the syntheses and characterisation of the ligands was carried out by a
summer student All separation work using the ligands was carried out by colleagues at
INE
175
Figure 51 General structure of DTPA-amino acid ligands
51 Ligand Synthesis and Characterisation
A route for the synthesis of DTPA-bis(amino acids) was devised involving ring
opening of the anhydride of DTPA with an amine group of the amino acid in question
whereby the amino acid is incorporated onto two of the side arms of the DTPA
according to Scheme1234
Initially the reaction was attempted using the acid forms of
the amino acid L-alanine however the reaction was found to be unsuccessful since only
an amino acid dimer could be isolated In order to allow optimisation of the reaction
conditions whilst avoiding competitive side reactions the reactions were repeated using
the methyl or ethyl ester protected forms of the amino acids Here commercially
available methyl esters of L-alanine L-arginine and L-histidine and the ethyl ester of L-
serine were used The amide coupling reactions with these amino acid derivatives using
triethylamine as the base proceeded in high yield However isolation and purification of
the products was found to be quite difficult as the reaction products are very
hygroscopic and stubbornly retain residual triethylamine salts Therefore the relatively
impure ligands were isolated for further studies following multiple re-precipitations and
re-crystallisation All the ligands were characterised by 1H NMR spectroscopy
MALDI-MS and elemental analysis (Section 742)
Scheme 1 Synthesis of DTPA-bis(amino) alkyl esters
Protected
Protected Protected
176
52 Luminescence Studies on Ligand Systems at pH 2 3 and 4
521 Aqueous Phase Studies
The DTPA-amino acid ligands synthesised were studied by luminescence
spectroscopy in a TALSPEAK type system The ligands self-buffer at approximately
pH 2 at 50 mM concentration but to ensure consistency in studies the pH of systems
were adjusted to exact pH values (plusmn 01) Aqueous phases were prepared containing 50
mM ligand and 1 mM Eu(NO3)3 at pHpD 2 3 and 4 for each of the four synthesised
ligands Samples were measured in D2O and H2O The emission spectra of the D2O
samples can be seen in Figures 52-54 The spectra for the samples in H2O are identical
but with lower relative emission intensities
Figure 52 Emission spectra of Eu(NO3)3 with DTPA-bis(amino ester) ligands in D2O
at pD 2 following excitation at 397 nm
0
5
10
15
20
25
30
35
550 575 600 625 650 675 700
Emis
sio
n In
ten
sity
(au
) x
10
00
0
Wavelength (nm)
Ala-DTPA
Arg-DTPA
His-DTPA
Ser-DTPA
177
Figure 53 Emission spectra of Eu(NO3)3 with DTPA-bis(amino ester) ligands in D2O
at pD 3 following excitation at 397 nm
Figure 54 Emission spectra of Eu(NO3)3 with DTPA-bis(amino ester) ligands in D2O
at pD 4 following excitation at 397 nm
The emission spectra are all very similar and show clear complexation of the
Eu3+
ion with each ligand There is little difference in emission intensity and form of the
spectra across all of the samples which indicates that all of the ligands present the same
coordination environment to the Eu3+
centre as expected
Table 51 J=1J=2 peak ratios and t-test results for Eu- DTPA-bis(amino ester)
complexes at pD 2-4
0
5
10
15
20
25
30
35
550 575 600 625 650 675 700
Emis
sio
n In
ten
sity
(au
) x
10
00
0
Wavelength (nm)
Ala-DTPA
Arg-DTPA
His-DTPA
Ser-DTPA
0
5
10
15
20
25
30
550 575 600 625 650 675 700
Emis
sio
n In
ten
sity
(au
) x
10
00
0
Wavelength (nm)
Ala-DTPA
Arg-DTPA
His-DTPA
Ser-DTPA
178
DTPA-
(AlaOMe)2
DTPA-
(ArgOMe)2
DTPA-
(HisOMe)2
DTPA-
(SerOEt)2
st dev t-test
pD 2 0359 0381 0404 0353 0023
No sig
diff
pD 3 0394 0425 0417 0381 0020
No sig
diff
pD 4 0391 0427 0432 0423 0019
No sig
diff
st dev 0019 0026 0014 0035
t-test No sig
diff
No sig
diff
No sig
diff
No sig
diff
The J=1J=2 peak height ratios were recorded for each emission spectrum and t-
tests were carried out on the peak ratios using the t-test data analysis tool in Microsoft
Excel accounting for the standard deviations between the ratios (Table 51) For each
data set the range in the ratios is small and there is no significant difference between
the values again suggesting that the co-ordination mode of the each of the ligands to the
metal ion is the same Across the data sets unlike the glutathione system (Chapter 4)
no significant difference was observed either as pD increases from pD 2 to pD 4
indicating that the co-ordination mode of the complexes is not changing with pH
The luminescence lifetimes of each sample were recorded in H2O and D2O in
order to determine the q value of the complexes using the modified Horrocks equation
(Equation 110) These results are summarised in Table 52
179
Table 52 Luminescence lifetimes and q values for Eu-DTPA-bis(amino ester)
complexes at pD 2-4 recorded at the emission maximum (617 nm) following 397 nm
excitation
pH amp Ligand τ D2O (μs) τ H2O (μs) q plusmn 02
pH 2 DTPA-(AlaOMe)2 1794 plusmn 7 587 plusmn 8 09
pH 2 DTPA-(ArgOMe)2 1828 plusmn 12 626 plusmn 10 08
pH 2 DTPA-(HisOMe)2 1816 plusmn 10 614 plusmn 9 09
pH 2 DTPA-(SerOEt)2 1759 plusmn 9 563 plusmn 11 10
pH 3 DTPA-(AlaOMe)2 1981 plusmn 12 587 plusmn 11 10
pH 3 DTPA-(ArgOMe)2 2335 plusmn 16 604 plusmn 12 10
pH 3 DTPA-(HisOMe)2 1963 plusmn 8 607 plusmn 13 09
pH 3 DTPA-(SerOEt)2 1839 plusmn 13 588 plusmn 12 09
pH 4 DTPA-(AlaOMe)2 1908 plusmn 17 608 plusmn 11 09
pH 4 DTPA-(ArgOMe)2 1907 plusmn 13 601 plusmn 17 09
pH 4 DTPA-(HisOMe)2 1905 plusmn 14 604 plusmn 15 09
pH 4 DTPA-(SerOEt)2 1890 plusmn 10 609 plusmn 16 09
All of the complexes have approximately 1 water molecule in the inner
hydration sphere This is consistent with the formation of a Eu-DTPA-amide ligand
complex The values are generally slightly less than 1 in contrast to [Eu-DTPA]2-
itself
where q = 11 indicating the likely fast exchange of the bound water molecule with
other surrounding water molecules and that the amino ester appendage may inhibit the
close approach of more than one water molecule due to steric reasons
522 Extraction Studies
Extractions were carried out on the samples using 06 M HDEHP in dodecane
for the organic phase The emission spectra of both the aqueous and organic phases
post-extraction can be seen in Figures 55-58
180
Figure 55 Emission spectra of aqueous phases after Eu3+
extraction from an aqueous
phase containing DTPA-bis(amino ester) ligands (50 mM) at pH 2 following excitation
at 397 nm
Figure 56 Emission spectra of aqueous and organic phases after Eu3+
extraction from
an aqueous phase containing DTPA-bis(amino ester) ligands (50 mM) at pH 2
following excitation at 397 nm
0
0
0
0
0
1
1
550 575 600 625 650 675 700
Emis
sio
n In
ten
sity
(au
) Th
ou
san
ds
Wavelength (nm)
Ala-DTPA Aq
Arg-DTPA Aq
His-DTPA Aq
Ser-DTPA Aq
0
10
20
30
40
50
60
70
550 575 600 625 650 675 700
Emis
sio
n In
ten
sity
(au
) Th
ou
san
ds
Wavelength (nm)
Ala-DTPA Aq Arg-DTPA Aq His-DTPA Aq Ser-DTPA Aq Ala-DTPA Org Arg-DTPA Org His-DTPA Org Ser-DTPA Org
181
Figure 57 Emission spectra of aqueous and organic phases after Eu3+
extraction from
an aqueous phase containing DTPA-bis(amino ester) ligands (50 mM) at pH 3
following excitation at 397 nm
Figure 58 Emission spectra of aqueous and organic phases after Eu3+
extraction from
an aqueous phase containing DTPA-bis(amino ester) ligands (50 mM) at pH 4
following excitation at 397 nm
0
2
4
6
8
10
12
550 575 600 625 650 675 700
Emis
sio
n In
ten
sity
(au
) x
10
00
0
Wavelength (nm)
Ala-DTPA Aq Arg-DTPA Aq His-DTPA Aq Ser-DTPA Aq Ala-DTPA Org Arg-DTPA Org His-DTPA Org Ser-DTPA Org
0
1
2
3
4
5
6
7
550 575 600 625 650 675 700
Emis
sio
n In
ten
sity
(au
) x
10
00
0
Wavelength (nm)
Ala-DTPA Aq
Arg-DTPA Aq
His-DTPA Aq
Ser-DTPA Aq
Ala-DTPA Org
Arg-DTPA Org
His-DTPA Org
Ser-DTPA Org
182
The Eu-HDEHP complex formed in the organic phase has different symmetry to
Eu-DTPA complexes in the aqueous phase as can be seen be the different profile of the
emission spectra of the organic phases The extraction data show that the best Eu3+
extraction occurs at pH 2 under these conditions as there is complete metal extraction
into the organic phase for all of the ligands and very little or no metal remaining in the
aqueous phase Above pH 2 the extraction of Eu3+
decreases leaving some of the metal
ion in the aqueous phase at pH 3 and an even higher proportion at pH 4 At pH 3
extraction is relatively higher with the DTPA-(SerOEt)2 ligand than any of the other
ligands and at pH 4 extraction is higher with DTPA-(HisOMe)2 and DTPA-(ArgOMe)2
The J=1J=2 peak ratios for the organic phases (Table 53) show no significant
difference in co-ordination mode within the pH 2 or pH 4 data for each ligand however
the co-ordination can be seen to change slightly with each ligand at pH 3 Also no
significant difference is observed as pH is changed for DTPA-(ArgOMe)2 and DTPA-
(AlaOMe)2 however there is a significant difference observed for DTPA-(SerOEt)2 and
DTPA-(HisOMe)2 as pH is changed Each emission spectrum was recorded 5 times and
an average taken and repeat measurements were also taken so whilst the data is
reproducible it appears to be inconsistent and difficult to explain without further
investigation into the co-ordination environment at different pH values by means other
than luminescence spectroscopy although it can be seen that pH 2 is optimum for
extraction using these ligands
Table 53 J=1J=2 peak ratios and t-test results for organic phases after extraction after
Eu3+
extraction aqueous phases containing DTPA-bis(amino ester) ligands (50 mM) at
pH 2-4
DTPA-
(AlaOMe)2
DTPA-
(ArgOMe)2
DTPA-
(HisOMe)2
DTPA-
(SerOEt)2
st dev t-test
pH 2 0208 0207 0198 0208 0005 No sig diff
pH 3 0210 0213 0311 0347 0069 Sig diff
pH 4 0182 0210 0206 0205 0013 No sig diff
st dev 0016 0003 0063 0081
t-test No sig diff No sig diff Sig diff Sig diff
183
53 Radiolysis Studies on Ligand Systems at pH 2
531 Aqueous Phase Studies
In order to determine how resistant the ligand are to radiolysis a selection of
samples at pHpD 2 containing 50 m M ligand and 1 mM Eu(NO3)3 were irradiated at
the Dalton Cumbrian Facility using a 60
Co irradiator The samples were exposed to 7
kGy γ-radiation and analysed by luminescence spectroscopy The emission spectra of
the D2O samples can be seen in Figure 59 The spectra for the samples in H2O are the
same but with lower emission intensity
Figure 59 Emission spectra of Eu(NO3)3 in D2O with DTPA-bis(amino ester) ligands
(50 mM) at pH 2 after irradiation with 7 kGy γ-radiation and following excitation at
397 nm
The spectra of the samples are the same after irradiation as beforehand
indicating that the radiation has little or no degrading effect on the complexes in the
aqueous phase The J=1J=2 ratios and co-ordination mode remained unchanged (Table
54) as do the luminescence lifetimes and q values of the samples (Table 55)
0
5
10
15
20
25
30
35
550 575 600 625 650 675 700
Emis
sio
n In
ten
sity
(au
) Th
ou
san
ds
Wavelength (nm)
Ala-DTPA
Arg-DTPA
His-DTPA
Ser-DTPA
184
Table 54 J=1J=2 peak ratios and t-test results for Eu-DTPA-bis(amino ester)
complexes at pD 2 after irradiation with 7 kGy γ-radiation
DTPA-
(AlaOMe)2
DTPA-
(ArgOMe)2
DTPA-
(HisOMe)2
DTPA-
(SerOEt)2 st dev t-test
J=1J=2 0357 0395 0412 0362 0026 No sig
diff
Table 55 Luminescence lifetimes and q values for Eu-DTPA-bis(amino ester)
complexes at pD 2-4 after irradiation with 7 kGy γ-radiation
Ligand τ D2O (μs) τ H2O (μs) q plusmn 02
DTPA-(AlaOMe)2 1818 plusmn 7 613 plusmn 8 09
DTPA-(ArgOMe)2 1843 plusmn 12 586 plusmn 10 10
DTPA-(HisOMe)2 1803 plusmn 10 629 plusmn 9 08
DTPA-(SerOEt)2 1809 plusmn 9 598 plusmn 11 09
532 Extraction Studies
Extractions were then carried out on some of the irradiated samples using 06 M
HDEHP in dodecane The emission spectra of both the aqueous and organic phases
post-extraction can be seen in Figure 510
Figure 510 Emission spectra of aqueous and organic phases after Eu3+
extraction from
an irradiated (7 kGy γ-radiation) aqueous phase containing DTPA-bis(amino ester)
ligands (50 mM) at pH 2 following excitation at 397 nm
0
1
2
3
4
5
6
550 575 600 625 650 675 700
Emis
sio
n In
ten
sity
(au
) Th
ou
san
ds
Wavelength (nm)
Ala-DTPA Aq Arg-DTPA Aq His-DTPA Aq Ser-DTPA Aq Ala-DTPA Org Arg-DTPA Org His-DTPA Org
185
The emission profiles of the samples are the same after irradiation as
beforehand indicating that the radiation has little or no degrading effect on the
complexes in the aqueous phase The emission intensity is lower for the organic phases
after irradiation than beforehand possibly due to increased quenching effects caused by
radicals present as a result of irradiating the solvents The J=1J=2 ratios and co-
ordination mode for the organic phase remained unchanged (Table 56) and the
luminescence lifetimes can be seen to decrease only slightly after irradiation consistent
with the decrease in emission intensity (Table 57)
Table 56 J=1J=2 peak ratios and t-test results for the organic phases after Eu3+
extraction from aqueous phases containing DTPA-bis(amino ester) ligands (50 mM) at
pH 2 one of which had been irradiated with 7 kGy γ-radiation
DTPA-
(AlaOMe)2
DTPA-
(ArgOMe)2
DTPA-
(HisOMe)2
DTPA-
(SerOEt)2
st dev t-test
J=1J=2 0241 0233 0198 0231 0019
No sig
diff
Table 57 Luminescence lifetimes and q values for the organic phases after Eu3+
extraction from aqueous phases containing DTPA-bis(amino ester) ligands (50 mM) at
pH 2 one of which had been irradiated with 7 kGy γ-radiation
Ligand τ organic phase
without irradiation
(micros)
τ organic phase after
irradiation
DTPA-(AlaOMe)2 2151 plusmn 21 1829 plusmn 18
DTPA-(ArgOMe)2 1881 plusmn 19 1821 plusmn 17
DTPA-(HisOMe)2 2265 plusmn 18 2227 plusmn 18
DTPA-(SerOEt)2 1856 plusmn 20 1777 plusmn 19
54 Separation Work on Ligand Systems
Some separation work using these ligands was carried out with the help of
Andreas Geist at KIT-INE in Germany Extractions were performed under TALSPEAK
conditions but using kerosene as the organic phase due to availability
186
541 AmEu Separation in Ligand Systems
A stock spiking solution of 241
Am + 152
Eu (1 kBq mL-1
) was added to a solution
of yttrium and lanthanides (10 mgdm3 of each Ln(NO3)3) with each ligand (50 mM) for
DTPA-(ArgOMe)2 DTPA-(SerOEt)2 DTPA-(HisOMe)2 at pH 1-2 The aqueous phases
were contacted with HDEHP (02 M) in kerosene and shaken for 30 minutes The
phases were then separated and the Am3+
and Eu3+
concentrations in each phase were
determined by Gamma counting The separation factors for all ligands under these
conditions were found to be approximately 100 across the pH range measured Graphs
of these data are plotted in Figures 511-513 These values are comparable with the
original TALSPEAK process using lactate (SF = 91) Although the TALSPEAK
process uses dodecane rather than kerosene and as such the results are therefore not
directly comparable they still show selectivity between Am3+
and Eu3+
for these
ligands However the DAm using these ligands is 2-3 orders of magnitude higher than in
the original TALSPEAK process (~025-200 compared to 0009) indicating that Am3+
is not being held back sufficiently by the ligand for this to be a viable process and that
more work is needed to decrease the partitioning of Am3+
into the organic phase This
may be possible with optimisation of the systems by varying the pH concentration of
ligand concentration of extractant and by modifying the solubility of the ligands ie by
cleavage of the methyl and ethyl ester groups to generate the amino acid Nevertheless
these results are particularly encouraging
Figure 511 Separation factors and distribution ratios for Eu3+
Am3+
using DTPA-
(ArgOMe)2 (005 M) at pH 1-2 extracted using HDEHP (02 M) in kerosene
187
Figure 512 Separation factors and distribution ratios for Eu3+
Am3+
using DTPA-
(SerOEt)2 (005 M) at pH 1-2 extracted using HDEHP (02 M) in kerosene
Figure 513 Separation factors and distribution ratios for Eu3+
Am3+
using DTPA-
(HisOMe)2 (005 M) at pH 1-2 extracted using HDEHP (02 M) in kerosene
542 Ln Separation in Ligand Systems
In addition to the Eu3+
Am3+
separation studies carried out at KIT-INE using
these amino ester appended DTPA ligands further experiments were conducted to
observe the separation across the lanthanide series by ICP-MS under the same
conditions The graphs of the distribution ratios for each Ln3+
and Am3+
can be seen in
Figures 514-516 for each ligand as well as the separation factor for Nd3+
Am3+
(as
188
Nd3+
is the most difficult lanthanide to extract) The SFNdAm in each case is 30-40 over
the pH range 1-2 These separation factors are good only slightly lower than the
original lactate-buffered TALSPEAK process (SFNdAm ~ 55) and the distribution ratios
for the heavier lanthanides are particularly high higher than the original process with a
greater proportion of them having D values of over 1000 (Figures 514-516)
Figure 514 Distribution ratios for Ln3+
using DTPA-(ArgOMe)2 (005 M) at pH 1-2
extracted using HDEHP (02 M) in kerosene
189
Figure 515 Distribution ratios for Ln3+
using DTPA-(SerOEt)2 (005 M) at pH 1-2
extracted using HDEHP (02 M) in kerosene
Figure 516 Distribution ratios for Ln3+
using DTPA-(HisOMe)2 (005 M) at pH 1-2
extracted using HDEHP (02 M) in kerosene
190
55 Summary and Conclusion of Modified DTPA Ligand Work
After initial difficulties synthesising amino acid appended DTPA ligands the
ligands were successfully synthesised in good yields (~60 ) for DTPA-(AlaOMe)2
DTPA-(ArgOMe)2 DTPA-(SerOEt)2 and DTPA-(HisOMe)2 using ester protected
versions of the amino acids The ligands were shown by luminescence spectroscopy to
complex to Eu3+
at pH 2 3 and 4 forming Eu-DTPA-bis(amino ester) adduct with 1
water molecule in fast exchange in the inner hydration sphere Under TALSPEAK
conditions the ligands were found to be more effective holdback reagents at the lower
pH of 2 but also effectively extract Eu3+
over Am3+
as low as pH 15 This is in stark
contrast to the original TALSPEAK process The co-ordination mode of the ligands to
the metal ion was consistent for all of the ligands but was found to change slightly upon
changing pH although the overall coordination number of Eu3+
with the ligands
remained as approximately 8 (with the 9th
coordination site being completed by one
water molecule) Studies showed that the ligands are relatively resistant to radiolysis
when subjected to 7 kGy γ radiation as there was no change in their luminescence
emission profile co-ordination mode or hydration number after irradiation
Results from separation studies conducted at KIT-INE using gamma counting
and ICP-MS showed that the modified DTPA ligands successfully allowed separation
between Ln3+
Am3+
giving good separation factors comparable to the original lactate-
buffered TALSPEAK process (SFEuAm ~100) even for Nd3+
which is the most difficult
lanthanide to extract in the process (SFNdAm ~30-40) The extraction efficiency of all the
ligands broadly relates to the atomic number of the lanthanide ions (apart from La3+
Ce3+
and Pr3+
) with the heavier ions being preferentially extracted as expected The
separation factors of individual lanthanide pairs range from approximately 25 to gt 100
and for the Dy3+
Nd3+
pair of particular economic importance are quite reasonable SF
DyNd ~ 30
However the distibution ratio for Am3+
is higher than desired (025-200 vs
0009) and so optimisation of the systems would be necessary to try to reduce DAm for
the combined buffer soft-donor system to be viable Another step would also be to try to
deprotect the amino acids on the ligands hydrolysing the esters back to carboxylic acid
groups to see if that would increase the holdback ability of the ligands and possibly
decrease the distribution ratio of Am3+
191
1 PP Hazari G Shukla V Goel K Chuttani N Kumar R Sharma and AK Mishra
Bioconjugate Chem 2010 21 229-239
2 X Wang X Wang Y Wang and Z Guo Chem Comm 2011 47 8127-8129 ESI
3 SJ Pope BJ Coe S Faulkner and R H Laye Dalton Trans 2005 1482-1490
4 S J Pope B J Coe and S Faulkner Chem Commun 2004 1550-1551
192
6 SUMMARY CONCLUSIONS amp FUTURE WORK
61 Summary amp Conclusions
One technique for reprocessing SNF currently being developed in the USA is
the TALSPEAK process an advanced reprocessing method for the separation of Ln3+
and MA3+
components The traditional process developed in the 1960s uses DTPA to
act as a holdback reagent for MA3+
in a lactate buffered aqueous phase at pH 36
allowing Ln3+
to be selectively extracted by organophosphate HDEHP into an organic
phase of DIPB or dodecane TALSPEAK is one of the most promising techniques being
researched due to its numerous advantages particularly its relative resistance to
irradiation and ability to be carried out without the need for high reagent concentrations
Additionally it gives high separation factors in the region of ~50-100 which is
comparable to other advanced reprocessing methods currently being developed1 Since
the chemistry of the process is very complex and not particularly well understood it
would be an advantage to simplify the process by removing the need for a separate
holdback reagent and buffer
Recent studies have shown that complexants with soft donor atoms such as N or
S (relative to O) can be used to separate MA3+
from Ln3+
23
Initial research was carried
out by our collaborators at the Idaho National Lab testing the suitability of amino acids
(L-alanine L-arginine L-histidine and L-methionine) as a potential combined buffer
and soft donor by determining whether amino acids preferentially bind to MA3+
Another benefit to using amino acids would be the scope for carrying out the process at
a lower pH (~ pH 2) due to the lower pKa values of the carboxylic acid groups of the
amino acids than on DTPA Lower pH values are preferred by industry as higher acid
concentrations are easier to control on a large scale and are also known to increase the
Ln3+
distribution coefficients4
This work carried out by Grimes5 showed that amino acids do not act as
holdback reagents in their own right and that no separation of Ln3+
Am3+
is achieved
when they are used without Na5DTPA in solution However investigations showed that
when used alongside Na5DTPA good separation (SFEuAm ~ 66) can be achieved when
using 05 M L-alanine at pH 2 (cf ~25 at pH 3) however the DAm value was relatively
high than at the lower pH (DAm 047 at pH 2 cf 012 at pH 3) as more protonated forms
of the DTPA molecule are present in solution at low pH and the holdback reagent is not
able to bind as strongly to metal ions allowing more Am3+
to be partitioned into the
organic phase
193
However optimisation of the system in order to maximise the separation whilst
keeping Am3+
partitioning to a minimum by changing the concentrations of holdback
reagent and extractant proved to be successful The optimum conditions were found to
be 04 M Na5DTPA and 02 M HDEHP giving a separation factor of 71 plusmn 5 with a DAm
value of 008 Although this separation is not as good as a traditional lactate
TALSPEAK system (SF = 91 DAm = 0009) the use of L-alanine (pKa = 235) as a
buffer would allow the process to be carried out at pH 2 which is a much more
preferable pH for industry
Separations were carried out using other amino acids at varying pH values and it
was found that L-methionine was too poorly soluble at pH 3 and did not give very good
separation data at pH 2 L-arginine was found to have kinetic issues at pH 2 and 3
giving poor separation of the heavier lanthanides The amino acid L-histidine (pKa =
182) however gave good separation data at pH 3 with a SFEuAm of 99 comparable to
that of the original TALSPEAK process and a DAm of 007 comparable to the optimised
L-alanine system Unfortunately ICP-MS studies on lanthanides La-Ho using L-
histidine at pH 3 showed that the same kinetic problems arise for this system as for L-
alanine at pH 3 and L-arginine at pH 2 and 3 as the DLn value decreases for later
lanthanides
The interaction of the buffers glycine L-alanine L-serine L-phenylalanine and
lactate (for comparison) with Eu3+
and [Eu(DTPA)]2-
systems was investigated by
luminescence and 1H NMR spectroscopies As expected it was found that amino acids
and lactate do not form stable complexes with either the free metal ion or the metal-
DTPA complex and that the buffers are likely to be in fast exchange with surrounding
solvent molecules as the number of water molecules in the inner hydration sphere (q) of
Eu3+
was reduced from 9 to ~6 when buffers were added to the aqua ion in solution
Luminescence studies on L-phenylalanine (like other amino acids) showed that it does
not bind to the metal ion as there was no sensitised emission from Tb3+
ion when
excited into the phenyl chromophore of the amino acid when the two components were
in solution Emission spectra of Eu3+
and Cm3+
aqua ions and their corresponding
DTPA complexes showed no change in emission profile upon the addition of amino
acidslactate There was also no change in q when buffers were added to metal-DTPA
complexes in solution for Eu3+
or Cm3+
Radiolysis studies carried out on lactate and amino acid buffered [Eu(DTPA)]2-
systems showed that the systems are relatively resistant to γ-radiation when exposed to
5 kGy γ-radiation This is consistent with previous work conducted by the INL showing
194
that separation systems using L-alanine as a buffer are more resistant to radiolysis than
the original TALSPEAK process using lactate67
A 05 M L-alanine buffered
TALSPEAK system using 04 M Na5DTPA and 02 M HDEHP at pH 2 can therefore
be seen to be a promising alternative to the traditional lactate buffered system as it has
been shown to give good separation data with fairly low extraction of Am3+
and the
buffer is also more resistant to radiolysis than lactate Additionally it allows the process
to be carried out at a lower pH of 2 which is much more practical for industrial
operation
Since amino acids were found not to act as holdback reagents in their own right
the potential of using the larger tripeptide L-glutathione (GSH) was investigated Initial
separation studies carried out using glutathione at pH 4 (as GSH has 2 pKa values
below 4 and Garg et al reported that the optimum stability for Ln-GSH complexes
occurs in solutions between pH 34-348)8 Preliminary investigations found that as
with the amino acids studied GSH is ineffective as a holdback reagent on its own as
there was no separation observed between Eu3+
and Am3+
when used without
Na5DTPA
Analogous to the amino acid studies subsequent investigations were carried out
using GSH alongside Na5DTPA to determine whether separation was improved with the
tripeptide buffer A pH dependence study found that at pH 2 and pH 3 the glutathione
acts solely as a buffer in the systems as the separation factor in each case was
independent of GSH concentration However at pH 4 interestingly separation between
Eu3+
and Am3+
was found to increase as the buffer concentration was increased up to
05 M suggesting that the glutathione is interacting with the Ln-DTPA complexes at
this pH This could be explained by the increase in stability of Ln-GSH complexes as
the pH is increased
Using 05 M GSH the separation factor was found to increase dramatically as a
function of Na5DTPA concentration up to 03 M Na5DTPA After this peak there was
a rapid decrease in separation as the concentration was increased further up to 06 M
Na5DTPA as the stoichiometry is close to 11 GSHDTPA The separation factors
achieved here were extremely high (~1000) ndash a factor of 10 higher than the current
TALSPEAK system and the optimised L-alanine system whilst still maintaining low
Am3+
extraction (DAm = 0002 with 03 M Na5DTPA) lower than in the traditional
TALSPEAK process
At 03 M Na5DTPA the separation factor then increased as the extractant
concentration was increased from 02 to 04 M HDEHP in dodecane after which the SF
195
began to decrease again with the optimum separation at 04 M extractant giving a SF
of 1238 (DAm = 00018) At 04 M Na5DTPA however the separation factor decreases
rapidly as the extractant concentration is increased due to the DAm increasing by a
factor of 1000 consistent with the complexant and buffer possibly forming an adduct
which no longer successfully holds back Am3+
at higher Na5DTPA concentrations
Luminescence experiments mimicking the separation studies showed that the
glutathione does not form a stable complex with the Eu3+
ion and is in exchange with
surrounding solvent molecules comparable to the amino acid buffer studies even at the
highest buffer concentrations 1H NMR spectroscopy confirmed that although the
glutathione may be in exchange with surrounding water molecules no kinetically stable
complexes between the buffer and metal ions are formed In samples containing
Na5DTPA a Eu-DTPA complex can be clearly observed in the emission spectra with
or without the presence of GSH over a pH range of 2-4 The J=1J=2 peak ratios
showed that there is no change in the co-ordination mode of the buffer to the metal ion
as the concentration of GSH is increased for each pH however across the data sets the
co-ordination mode of glutathione was found to be different at different pH values as
expected based on pKa values and increasing stability constant with pH
The co-ordination mode of the Eu-DTPA in the aqueous phase with 05 M GSH
was found not to change as [Na5DTPA] was changed with metal extraction typically
decreasing as the holdback reagent increases and at 03 M Na5DTPA with 05 M GSH
extraction was found to increase as HDEHP concentration increased as expected
The GSH buffered system was found to be susceptible to radiolysis when
subjected 7 kGy γ-radiation from a 60
Co irradiator and seen to degrade into γ-Glu-Cys
fragments However the degradation was seen to have little effect on the extraction of
metal ions from the aqueous phase when analysed by luminescence spectroscopy with
only slightly decreased emission intensity post-irradiation The emission profiles co-
ordination mode and luminescent lifetimes of the samples remained unchanged
In order to be a successful alternative to the current TALSPEAK system it is
essential that effective separation of all lanthanides from MA3+
can occur Further
luminescence experiments were carried out firstly on analogous dysprosium systems in
order to represent heavier lanthanide elements followed by a mixture of four different
lanthanide metals in the same samples (Sm3+
Eu3+
Tb3+
and Dy3+
) For the dysprosium
study as the pH was increased from 2-4 the extraction of Dy3+
decreased suggesting
that the same kinetic issues noted for heavier lanthanides in the amino acid systems may
also be present for the GSH system at higher pH values In the mixed samples the same
196
pattern was observed with extraction of Ln3+
decreasing as pH was increased At pH 4
extraction of all lanthanide ions was very low particularly for Tb3+
and Dy3+
which are
both heavier than Sm3+
and Eu3+
ICP-MS carried out on a series of samples containing
a mixture of 10 lanthanides (La3+
-Ho3+
) was consistent with the luminescence data
showing decreased extraction of heavier lanthanides as pH increases from 2 to 4 The
quantity of metal extracted was so low it was below the limit of detection for some of
the heavier metals at pH 4 forcing the conclusion that unfortunately the same kinetic
issues are a problem at higher pH for the glutathione buffered system as for the amino
acid systems
Initial data obtained on the glutathione system with europium(III) and
americium(III) seemed promising as after optimisation very high separation factors for
Eu3+
Am3+
were achieved (~1000) with very low Am3+
partitioning (DAm ~0002) and
although the buffer was found to be susceptible to radiolysis extraction of lanthanide
ions still remained high after irradiation However subsequent studies with heavier
lanthanides showed that the GSH buffered system is subject to the same kinetic
problems as some of the amino acid systems
Based on the results from studies using amino acid and glutathione buffered
systems demonstrating that Ln3+
MA3+
separation cannot be achieved without the
presence of DTPA and a buffer the possibility of synthesising a combined buffer and
soft-donor was considered Amino acids were appended onto DTPA through reaction of
amino acid esters with DTPA dianhydride to form DTPA-(AlaOMe)2 DTPA-
(ArgOMe)2 DTPA-(SerOEt)2 and DTPA-(HisOMe)2 in good yields (~ 60 ) The
ligands were shown by luminescence spectroscopy to complex to Eu3+
at pH 2 3 and 4
forming Eu-DTPA-AA2 adducts with 1 water molecule in fast exchange in the inner
hydration sphere Under TALSPEAK conditions the ligands were found to be more
effective holdback reagents at the lower pH of 2 and even at pH 15 The co-ordination
mode of the ligands to the metal ion was consistent for all of the ligands being typical
of lanthanide DTPA-amide ligands known in the literature910
but was found to change
upon changing pH These ligands were also found to be relatively resistant to radiolysis
when subjected to 7 kGy γ radiation from a 60
Co irradiator as there was no change in
their luminescent emission profile co-ordination mode or hydration number after
irradiation
Results from separation studies conducted at KIT-INE using gamma counting
and ICP-MS showed that the modified DTPA ligands successfully allowed separation
between Ln3+
Am3+
giving good separation factors comparable to the original lactate-
197
buffered TALSPEAK process (SFEuAm ~100) even for Nd3+
which is the most difficult
lanthanide to extract in the process (SFNdAm ~30-40) The extraction efficiency of all the
ligands broadly relates to the atomic number of the lanthanide ions (apart from La3+
Ce3+
and Pr3+
) with the heavier ions being preferentially extracted as expected The
separation factors of individual lanthanide pairs range from approximately 25 to gt 100
and for the Dy3+
Nd3+
pair of particular economic importance are quite reasonable SF
DyNd ~ 30
However the distibution ratio for Am3+
is much higher than desired for the
modified DTPA ligands (DAm = 025-200 vs DAm 0009) and so optimisation of the
systems would be necessary to try to reduce DAm for the combined buffer soft-donor
system to be viable Initial studies on combined DTPA-bis(amino ester) ligands is
promising allowing the TALSPEAK process chemistry to be simplified and providing a
system which could be buffered to a lower pH (pH 2) as preferred by industry The
synthesis of the ligands is quite moisture sensitive and the products are very
hygroscopic and difficult to purify making the application of them on an industrial
scale potentially problematic but the simplification of the process on a laboratory scale
would allow the chemistry of the TALSPEAK process to be further investigated and
better understood for future developments
Although there are a number of variations of the TALSPEAK process being
developed including the TALSQuEAK (Trivalent Actinide Lanthanide Separation
using Quicker Extractants and Aqueous Complexes) process11
which uses alternative
extractant HEH[EHP]12
and alternative holdback reagent HEDTA13
the use of amino
acid and short-chain peptide buffers is unique to this project in collaboration with the
Idaho National Laboratory There has been some investigation into the use of malonate
buffers for TALSPEAK14
but there are no other reports of the use of amino acids or
peptides in the literature Additionally there are few published reports on the use of
luminescence spectroscopy in TALSPEAK studies chiefly on the complexation of Eu3+
with lactate15
complexation of Eu3+
Cm3+
with DTPA16
and complexation of Eu3+
with
HDEHP in the organic phase17
There is no literature on systems as a whole
A report on bis(methionine)-appended DTPA was published by Hazari et al in
2010 on the use of Tc-DTPA-bis(methionine) in tumour imaging18
however there are
no literature reports on the synthesis or use of amino acid appended or any modified
DTPA ligands for solvent extraction and separation studies
198
62 Future Work
As only a small selection of amino acids have been tested as buffers it would be
interesting to try more of them The original selections were made on the basis of their
chemical structures solubilities and previous work conducted at INL plus presence of
any soft donor atoms L-alanine was selected as it has the most similar structure to lactic
acid although glycine may be worth considering as well based on its also very similar
structure and high aqueous solubility Results with L-arginine and L-methionine were
not very promising possibly due to their longer chain backbones so it may be worth
considering the similar shorter-chain amino acids L-cysteine and L-threonine as these
have similar structures to L-serine which along with glycine was one of the amino
acids investigated by luminescence spectroscopy Although L-cysteine has poor
solubility like L-methionine it would be interesting to see how these amino acids
behave as buffers when subjected to the same separation and optimisation tests as L-
alanine Similarly medium length chain amino acids L-glutamic acid L-aspartic acid
L-asparagine and L-glutamine may also be worth considering (Figure 61)
Figure 61 Chemical structures of amino acids taken from reference 1919
199
In addition to investigating other amino acid buffer systems as discussed in
Chapter 4 there may be some benefit to carrying out experiments with other short chain
peptides such as eisenin and norophthalmic acid as well as some of the B vitamins that
were considered (vitamins B7 and 9) before L-glutathione was selected From the
results obtained with L-glutathione demonstrating that the tripeptide interacts with the
Ln-DTPA complex under certain conditions it is possible that these other peptides may
also interact and potentially aid in extraction of Ln3+
or selective holdback of MA3+
Although the desired result was not achieved with L-glutathione as it seems to
suffer the same kinetic issues which have been common with amino acids causing very
good extraction of the lighter lanthanides but very poor extraction of the heavier
lanthanides further optimisation of the GSH system to exploit the combined liquid-
liquid extraction efficiencies as a function of atomic number may allow the
development of an extraction process of lighter over heavier lanthanides for rare earth
recycling which is currently a strategically important goal20
Initial studies on the modified DTPA ligands showed promising results for a
combined buffer and soft-donor although there is still much work to be done in this
area It would be useful to determine the stability constants of the ligands with
lanthanides and with Am3+
and Cm3+
if possible preferably by potentiomenty which
has proven to be the most reliable method for determining stability constants for these
types of complexes21
The next step in process development with the ligands would be
to optimise the systems (as was done for the L-alanine and GSH buffered systems) in
order to reduce the partitioning of Am3+
and decrease DAm as much as possible ideally
to the same of magnitude of the lactate and GSH buffered systems by altering pH
concentration of ligand and concentration of extractant to maximise separation and
minimise americium distribution
A further step would also be to try to deprotect the amino acids on the DTPA-
amino ester ligands hydrolysing the esters back to carboxylic acid groups to see if that
would increase the holdback ability of the ligands and possibly decrease the distribution
ratio of Am3+
It is envisioned that the research presented in this thesis could be applied to
current and new technologies and challenges faced in the future of the nuclear industry
in particular towards the development of a TALSPEAK-style advanced reprocessing
procedure for implementation in the USA within the near future
200
1 G Modolo A Geist and M Miguirditchian Minor actinide separations in the
reprocessing of spent nuclear fuels recent advances in Europe in R Taylor ed
Reprocessing and Recycling of Spent Nuclear Fuel Woodhead Publishing UK 2015
10 245-279
2 M P Jensen and A H Bond J Am Chem Soc 2002 124 9870-9877
3 L R Martin B J Mincher and N C Schmitt J Radioanal Nucl Chem 2009 282
523-526
4 B Weaver and T A Kappelmann Talspeak A new method of separating americium
and curium from the lanthanides by extraction from an aqueous solution of an
aminopolyacetic acid complex with a monoacidic organophosphate or phosphonate
Oak Ridge National Laboratory 1964 1-60
5 TS Grimes RD Tillotson and LR Martin Solv Extraction and Ion Exchange
2014 32 378-390
6 Dr Leigh Martin Idaho National Laboratory unpublished results
7 LR Martin S P Mezyk and BJ Mincher J Phys Chem A 2009 113 141-145
8 BS Garg BK Singh DN Kumar and PK Sing Indian J Chem 2003 42A 79-83
9 C L Davies N G Housden and A-K Duhme-Klair Angew Chem Int Ed Engl 2008
47 8856
10 SJA Pope Polyhedron 2007 26 17 4818-4824
11 JC Braley JC Carter SI Sinkov KL Nash and GJ Lumetta J Coord Chem
2012 65 16 2862-2876
12 GJ Lumetta AJ Casella BM Rapko TG Levitskaia NK Pence JC Carter
CM Niver and MR Smoot Solv Extraction Ion Exchange 2015 33 346-361
13 JC Braley TS Grimes and KL Nash Ind Eng Chem Res 2012 15 629-638
14 JL Lapka and KL Nash Solv Extraction Ion Exchange 2015 33 346-361
15 G Tian LR Martin and L Rao Inorg Chem 2010 49 10598-10605
16 G Tian LR Martin and L Rao Inorg Chem 2015 54 1232-1239
17 TS Grimes G Tian L Rao and KL Nash Inorg Chem 2012 51 6299-6307
18 PP Hazari G Shukla V Goel K Chuttani N Kumar R Sharma and AK
Mishra Bioconjugate Chem 2010 21 229-239
19 DWhite Wisegeek What are Amino Acids httpwwwwisegeekorgwhat-are-
amino-acidshtm 2015
20 LS Natrajan and MH Langford Paden f-Block Elements Recovery in A Hunt ed
Element Recovery and Sustainability RSC 2013 6 140-184
21 G Tian LR Martin and LRao Inorg Chem 2015 54 1232-1239
201
7 EXPERIMENTAL SECTION
71 Chemicals and Reagents
All chemicals and solvents were purchased from Sigma-Aldrich chemical
company and were used as received Radioisotopes were supplied by the Idaho National
Laboratory or the Institute for Nuclear Waste Disposal (INE) and were used in
accordance with the local rules for manipulation of high specific activity materials
711 Handling Radioisotopes at INL
In order to handle radioisotopes at INL it was necessary to compete the
RadWorker 2 training and theory and practical examinations Upon entering a radiation
area (laboratory) it was a requirement to sign onto the dosimetry record system and
collect a dosimeter which was to be worn on the chest at all times in the area When
handling radioactive material within the designated controlled areas (fume hoods) extra
layers of PPE (personal protective equipment) such as triple layered shoulder length
gloves were to be worn and disposed of immediately upon leaving the controlled area in
designated radioactive waste bins It was then a requirement to monitor the upper body
area carefully with an alpha and a beta radiation detector Whilst working in the
controlled area any potentially contaminated PPE or samples had to be disposed of and
immediately replaced in the case of PPE After preparing sealed samples in the
controlled areas a Radiological Control worker would assist with swabbing each
sample to check for contamination before it could be removed from the area for further
analysis Samples were not to be opened outside of controlled areas and were returned
to the controlled area fume hood to be disposed of by solidification Upon leaving
radiation areas a full body scan was conducted and dose records updated as dosimeters
were returned
72 Complexation studies of Ln3+
amp An3+
with amino acids in TALSPEAK systems
721 Preparation of samples for luminescence studies
7211 Stock solutions
Stock solutions (10 mM 10 mL) were made up for each lanthanide (EuTb)
using the corresponding lanthanide nitrate salt Ln(NO3)3xH2O in H2O or D2O as
required A stock solution of Na5DTPA in H2OD2O (1 M 50 mL) was made up from a
40 wv Na5DTPA solution in H2O by dilution (2517 g into 50 mL) Stock solutions
of amino acids (Gly L-Ala L-Ser) in H2OD2O (125 M 20 mL) were prepared from
202
the crystalline form of each amino acid and a stock solution of DL-lactic acid was
prepared by dilution (225 g in 20 mL) For the sensitisation study with L-Phe due to
poor solubility of L-Phe a 0625 M stock solution in D2O was made using the powdered
form of the amino acid Additionally a stock solution of HDEHP in n-dodecane (645 g
in 100 mL 02 M) was prepared All reagents were purchased from Sigma-Aldrich
Stock solutions
10 mM EuTb(NO3)3 in H2OD2O
1 M Na5DTPA in H2OD2O
125 M GlyL-AlaL-SerLactate in H2OD2O
0625 M L-Phe in D2O
02 M HDEHP in n-dodecane
7212 Preparation of aqueous samples
5 mL samples were prepared using the stock solutions above Ln(NO3)3xH2O
(05 mL) was added to each amino acid solution (4 mL) with either Na5DTPA solution
(05 mL) or H2OD2O (05 mL) depending on whether the samples contained DTPA
This produced individual samples with concentrations of 1 mM Ln3+
1 M amino
acidlactate (05 M for L-Phe) and 01 M Na5DTPA if applicable The pHpD of
samples was adjusted individually with concentrated HNO3 and NaOH to minimise
change in volume using a Mettler Toledo Seven Compact pHion Meter pD (-log10
deuterium ion concentration) was calculated using Equation 71 to account for the
activity coefficient difference between the different isotopes of the hydrogen ion where
pH = the meter reading from a calibrated pH electrode All samples were repeated in
triplicate analagous to the solvent extraction samples performed at INL
Equation 71
7213 Preparation of extracted samples
Aqueous samples were prepared using the stock solutions above Na5DTPA
solution (05 mL) was added to amino acid solution (4 mL) and the mixture was pre-
equilibrated by contacting with n-dodecane and shaken using a Scientific Industries
Vortex Genie 2 Mixer and Shaker for 15 minutes The phases were allowed to separate
and the organic layer was discarded Ln(NO3)3 solution (05 mL) was added to the
aqueous phase and the pH was adjusted individually with concentrated HNO3 and
NaOH to minimise change in volume using a Mettler Toledo Seven Compact pHion
203
Meter The pD was calculated using Equation 71 The aqueous phases were contacted
with HDEHP in n-dodecane (5 mL 02 M) The solutions were then shaken again for 15
minutes left to settle and separated into the two phases for analysis All samples were
repeated in triplicate analagous to the solvent extraction samples performed at INL
722 Radiolysis of samples
Fricke dosimetry can be used to determine dose rates from radiation sources
such as from a 60
Co irradiator used to irradiate samples for radiolysis studies at the
Dalton Cumbrian Facility An aerated iron(II) sulphate solution is irradiated to give free
radicals according to the following reactions
H2O rarr H + OH
OH + Fe2+
rarr Fe3+
+ HO-
H + O2 rarr HO2
H+ + Fe
2+ + HO2 rarr Fe
3+ + H2O2
H2O2 + Fe2+
rarr Fe(OH)2+
+ OH
HO2 + Fe3+
rarr Fe2+
+ O2 + H+
This means that each H radical causes the oxidation of 3 Fe2+
ions to Fe3+
The amount
of Fe3+
present can then be measured using UV-visible spectroscopy and the dose rate
calculated from this1
7221 Preparation of Fricke solution
A Fricke solution was needed for the first set of radiolysis experiments carried
out using the 60
Co irradiator at the DCF as it allows the amount of exposure to be
calculated for each sample position during irradiation
FeSO47H2O (020206 g 133 mM) NaCl (003031 g 052 mM) and H2SO4 (95-98
11 mL) were added to deionised water (500 mL) The resulting Fricke solution was
then air-saturated and stored away from natural and artificial light sources
7222 Calculating dose rates
The UV-vis spectra of Fricke solution was then read before and after irradiation
and the following equation used to work out the dose rate
The dose can be calculated from the equation designed by Spinks and Woods (Equation
72)2
204
Equation 72
Where
F (Faradayrsquos constant) = 0965 x 109 A mol
-1
εFe(III) = Fe(III) molar extinction coefficient = 2174 M-1
cm-1
ρ = Fricke solution density = 1204 g mL-1
G = Critical Dose Value for Fe3+
= 148 molecules per 100 eV for x-rays
V = Volume of sample (mL) = 1
ODi = Optical density of irradiated solution
ODb = Optical density of non-irradiated control
The Spinks and Woods equation is specific to X-rays and must be adjusted so that it can
be applied to the use of γ-rays (Equation 73)
For γ-rays
εFe(III) = 2197 M-1
cm-1
G = 162 molecules per eV
Equation 73
Equation 74
Due to the design of the irradiator different positions in the machine receive
slightly different dose rates resulting in each sample receiving slightly different
amounts of radiation although the variation in dose is not significant and each sample
was calculated to receive an average of 114 Gy min-1
205
Table 71 Dose rates received at each sample position in the 60
Co irradiator at DCF
Position Dose Rate (Gy
min-1
)
1 1084678
2 1171864
3 1183066
4 1103841
73 Solvent extraction and separation studies using amino acids and glutathione at
INL
731 Preparation of samples
7311 Stock solutions for amino acid studies
A stock solution of Na5DTPA in H2O (1 M 100 mL) was made up from a 40
wv Na5DTPA solution in H2O by dilution (2517 g into 50 mL) A stock solution of L-
alanine in H2O (1 M 200 mL) was prepared from its crystalline form Additionally a
stock solution of HDEHP in n-dodecane (3224 g in 100 mL 1 M) was prepared This
was subsequently diluted with n-dodecane to prepare stock solutions of 02 04 06 and
08 M HDEHP in n-dodecane stock solutions as well
Stock solutions
1 M Na5DTPA in H2O
1 M L-Ala in H2O
10 08 06 04 02 M HDEHP in n-dodecane
7312 [Na5DTPA] dependence SX samples for amino acid studies
5 mL aqueous samples were prepared using the stock solutions above L-alanine
solution (25 mL) was added to a calculated volume of Na5DTPA solution to produce
samples with the desired DTPA concentration (006 007 008 009 01 02 03 04
05 M) when made up to 5 mL with water The pH of samples was adjusted individually
with concentrated HNO3 and NaOH to minimise change in volume using a Mettler
Toledo Seven Compact pHion Meter 02 M HDEHP in n-dodecane was used for the
solvent extraction All samples were repeated in triplicate
7313 [HDEHP] dependence SX samples for amino acid studies
5 mL aqueous samples were prepared using the stock solutions above L-alanine
solution (25 mL) was added to a calculated volume of Na5DTPA solution to produce
samples with the desired DTPA concentration (01 02 03 04 05 M) when made up
206
to 5 mL with water The pH of samples was adjusted individually with concentrated
HNO3 and NaOH to minimise change in volume using a Mettler Toledo Seven
Compact pHion Meter 02 04 06 08 and 10 M HDEHP in n-dodecane was used for
the solvent extraction All samples were repeated in triplicate
7314 Other amino acid SX samples for amino acid studies
5 mL aqueous samples were prepared for L-His and L-Met buffered systems
The Na5DTPA stock solution (025 mL) was added to L-His (0388 g) and L-Met (0373
g) separately to make samples with concentrations of 005 M Na5DTPA and 05 M
amino acid when made up to 5 mL with water The powdered forms of the amino acids
were used due to their poor solubility The pH of samples was adjusted individually
with concentrated HNO3 and NaOH to minimise change in volume using a Mettler
Toledo Seven Compact pHion Meter 02 M HDEHP in n-dodecane was used for the
solvent extraction All samples were repeated in triplicate
7315 Stock solutions for glutathione studies
A stock solution of Na5DTPA in H2O (1 M 100 mL) was made up from a 40
wv Na5DTPA solution in H2O by dilution (2517 g into 50 mL) Additionally a stock
solution of HDEHP in n-dodecane (3224g in 100mL 1 M) was prepared This was
subsequently diluted with n-dodecane to prepare stock solutions of 02 04 06 and 08
M HDEHP in n-dodecane stock solutions as well
Stock solutions
1 M Na5DTPA in H2O
10 08 06 04 02 M HDEHP in n-dodecane
7316 [GSH] dependence SX samples without Na5DTPA
GSH (0768 g) was dissolved in water (5 mL) to make a 05 M solution The
powdered form of the peptide was used due to its poor solubility The pH of sample was
adjusted with concentrated HNO3 and NaOH to minimise change in volume using a
Mettler Toledo Seven Compact pHion Meter 02 M HDEHP in n-dodecane was used
for the solvent extraction All samples were repeated in triplicate
7317 [GSH] and pH dependence SX samples with Na5DTPA
5 mL aqueous samples were prepared for GSH buffered systems The Na5DTPA
stock solution (025 mL) was added to varying quantities of GSH to make samples with
207
concentrations of 005 M Na5DTPA and the desired concentration of GSH (01 02 03
04 05 M) when made up to 5 mL with water The pH of samples was adjusted
individually with concentrated HNO3 and NaOH to minimise change in volume using
a Mettler Toledo Seven Compact pHion Meter 02 M HDEHP in n-dodecane was used
for the solvent extraction All samples were repeated in triplicate
7318 [Na5DTPA] dependence SX samples for GSH studies
5 mL aqueous samples were prepared for GSH buffered systems GSH (0768 g)
was added to a calculated volume of Na5DTPA solution to produce samples with
concentrations of 05 M GSH and the desired DTPA concentration (005 01 02 03
04 05 06 M) when made up to 5 mL with water The pH of samples was adjusted
individually with concentrated HNO3 and NaOH to minimise change in volume using
a Mettler Toledo Seven Compact pHion Meter 02 M HDEHP in n-dodecane was used
for the solvent extraction All samples were repeated in triplicate
7319 [HDEHP] dependence SX samples for amino acid studies
5 mL aqueous samples were prepared for GSH buffered systems GSH (0768 g)
was added to a calculated volume of Na5DTPA solution to produce samples with the
concentrations of 05 M GSH and the desired DTPA concentration (03 M and 04 M)
when made up to 5 mL with water The pH of samples was adjusted individually with
concentrated HNO3 and NaOH to minimise change in volume using a Mettler Toledo
Seven Compact pHion Meter 02 04 06 08 and 10 M HDEHP in n-dodecane was
used for the solvent extraction All samples were repeated in triplicate
732 Gamma counting
2 mL of each sample was transferred into a 4 mL sample vial in duplicate One
of the duplicate sets of samples was contacted with 2 mL n-dodecane to pre-equilibrate
the aqueous phase and the other duplicate set was contacted with the stock solution of
HDEHP in n-dodecane to pre-equilibrate the organic phase All of the samples were
then shaken using a VWR Multi-Tube Vortexer for 15 minutes Samples were then
placed in a Boeco S-8 Centrifuge for 5 minutes at 5400 rpm to separate the layers
The organic phase of the pre-equilibrated aqueous phase was discarded and the
aqueous phase of the pre-equilibrated organic phase was discarded 05 mL each
retained phase was then contacted in a 2 mL sample vial in triplicate and spiked with 10
microL 241
Am or 154
Eu stock solutions (1 kBq mL-1
) Samples were then shaken again using
208
a VWR Multi-Tube Vortexer for another 30 minutes before being placed in a Boeco S-
8 Centrifuge for 5 minutes at 5400 rpm to separate the layers
300 microL of each organic phase was transferred into counting tubes and 300 microL of
each aqueous phase was transferred into separate tubes Control tubes containing 300
microL HNO3 spiked with 10 microL 241
Am or 154
Eu stock solutions (1 kBq mL-1
) were also
prepared γ counting was performed on the samples using a Packard Cobra II Gamma
Counter Results were averaged from each of the samples in triplicate
733 ICP-MS
Samples were made up as for SX samples with other amino acids for L-His and
(Section 7314) and for GSH (Section 7318) 2 mL of each sample was transferred
into a 4 mL sample vial 10 microL mixed Ln 110 stock solution (5 mgL-1
of each of La
Ce Pr Nd Sm Eu Gd Tb Dy Ho) was spiked into each sample and samples were
contacted with 2 mL HDEHP in n-dodecane (02 M) All of the samples were then
shaken using a VWR Multi-Tube Vortexer for 15 minutes Samples were then placed in
a Boeco S-8 Centrifuge for 5 minutes at 5400 rpm to separate the layers
The organic phase was discarded and 10 microL of the aqueous phase was
transferred into ICP-MS vials containing 10 mL 2 HNO3 in triplicate Control tubes
containing 10 mL 2 HNO3 spiked with 10 microL mixed Ln 110 stock solution were
also prepared ICP-MS was carried out to determine the concentration of each
lanthanide in the organic and aqueous phase Results were averaged from each of the
samples in triplicate
74 Luminescence studies and solvent extraction using glutathione at UoM
741 Preparation of luminescence samples
7411 Stock solutions for GSH studies
Stock solutions (10 mM (100 mM for Dy3+
) 10 mL) were made up for each
lanthanide (EuTbDySm) using the corresponding lanthanide nitrate salt
Ln(NO3)3xH2O in H2O or D2O as required A mixed lanthanide solution was also made
up to contain the same concentrations of each of the lanthanides above A stock solution
of Na5DTPA in H2OD2O (1 M 50 mL) was made up from a 40 wv Na5DTPA
solution in H2O by dilution (2517 g into 50 mL) Additionally a stock solution of
HDEHP in n-dodecane (3224 g in 100 mL 1 M) was prepared This was subsequently
diluted with n-dodecane to prepare stock solutions of 02 04 06 and 08 M HDEHP in
n-dodecane stock solutions as well All reagents were purchased from Sigma-Aldrich
209
Stock solutions
10 mM EuTbSm(NO3)3 in H2OD2O
100 mM Dy(NO3)3 in H2OD2O
Mixed Ln solution with 10 mM EuTbSm(NO3)3 in H2OD2O and 100 mM Dy(NO3)3
1 M Na5DTPA in H2OD2O
10 08 06 04 02 M HDEHP in n-dodecane
7412 Preparation of aqueous samples
Samples were made up using the stock solutions above in the same way as for
the solvent extraction and separation studies carried out at INL (Sections 7312 to
7319) pD was calculated using Equation 71
7413 Preparation of extracted samples
5 mL aqueous samples were prepared using the stock solutions above GSH
(0768 g) was added to a calculated volume of Na5DTPA solution to produce samples
with the concentrations of 05 M GSH and the desired DTPA concentration (varied
according to the study) when made up to 5 mL with water The mixture was pre-
equilibrated by contacting with n-dodecane and shaken using a Scientific Industries
Vortex Genie 2 Mixer and Shaker for 15 minutes The phases were allowed to separate
and the organic layer was discarded Ln(NO3)3 solution (05 mL) was added to the
aqueous phase and the pH was adjusted individually with concentrated HNO3 and
NaOH to minimise change in volume using a Mettler Toledo Seven Compact pHion
Meter pD was calculated using Equation 71 The aqueous phases were contacted with
5 mL HDEHP in n-dodecane (varied according to the study) The solutions were then
shaken again for 15 minutes left to settle and separated into the two phases for analysis
All samples were repeated in triplicate analagous to the solvent extraction samples
performed at INL
742 Radiolysis of GSH samples
Radiolysis experiments on GSH buffered systems were carried out using the
60Co irradiator at DCF These irradiations were undertaken at a later date than the initial
amino acid radiolysis studies (Section 722) using a new calibrated sample holder with
known dose rates and so preparation and use of a Fricke solution was not necessary
Samples received an average of 7 kGy γ radiation
210
75 Modified DTPA Ligands
751 Synthesis of modified DTPA ligands
L-alanine methyl ester hydrochloride (0837 g 62 mmol) was dissolved in DMF
(15 mL) and added dropwise to DTPA dianhydride (107 g 3 mmol) in DMF (75 mL)
and 3 mL triethylamine (TEA) with stirring under nitrogen in an ice bath at 0 degC The
ice bath was removed after 2 hours and the reaction was left to stir at room temperature
for 48 hours The reaction was quenched with H2O (75 mL) and the solvent evaporated
to ~10 mL The resulting yellow oil was added dropwise to acetone (100 mL) with
stirring and the product precipitated The product was collected by sinter filtration
(porosity 3) under nitrogen as a crude white powder (yield 132 g 78) It was washed
with diethyl ether (3 x 20 mL) chloroform (3 x 20 mL) and diethyl ether again (3 x 20
mL) This was then dried under vacuum to give a white micro-crystalline product
(yield 1031 g 61 ) Multiple re-precipitations were performed to reduce the amount
of associated ammonium salts in the product Samples were dried under vacuum and
freeze-dried but water and solvent impurities continued to remain present
The synthesis was repeated using L-arginine methyl ester dihydrochloride (157 g 6
mmol) L-serine ethyl ester hydrochloride (102 g 6 mmol) and L-histidine methyl ester
(145 g 6 mmol)
Yields
DTPA-(AlaOMe)2 132 g 78 (MW 56356 gmol-1
)
DTPA-(ArgOMe)2 1331 g 60 (MW 73378 gmol-1
)
DTPA-(SerOEt)2 1053 g 56 (MW 62361 gmol-1
)
DTPA-(HisOMe)2 1730 g 83 (MW 69569 gmol-1
)
752 Characterisation of modified DTPA ligands by MALDI-MS
MALDI-MS was used to characterise the synthesised ligands Samples were
dissolved in methanol for analysis These analyses confirm that the ligands are the
desired ones as the protonated monomolecular ion [M+H]+ is visible in each case The
[M+Na]+ and [M+K]
+ ions can also be found in each spectrum The range begins at mz
= 200 so it is therefore not possible to verify the presence of triethylamine (M =
10119gmol) the amino acid starting material or any solvents using this technique The
spectra show a numerous peaks indicating that the ligands have decomposed during
analysis making interpretation difficult The spectrum for DTPA-(AlaOMe)2 can be
found in Appendix 6
211
DTPA-(AlaOMe)2 mz 565 (100) [M+H]+ 587 (37) [M+Na]
+ 603 (39) [M+K]
+
DTPA-(ArgOMe)2 mz 734 (100) [M+H]+ 756 (18) [M+Na]
+ 772 (9) [M+K]
+
DTPA-(SerOEt)2 mz 624 (100) [M+H]+ 646 (60) [M+Na]
+ 662 (15) [M+K]
+
DTPA-(HisOMe)2 mz 697 (100) [M+H]+ 719 (22) [M+Na]
+ 735 (10) [M+K]
+
753 Characterisation of modified DTPA ligands by NMR spectroscopy
NMR spectroscopy was performed on ligand samples in D2O (9992 atom D
Sigma Aldrich) at 400 MHz The 1H NMR spectra of DTPA-(AlaOMe)2 with suggested
peak assignments can be found in Appendix 7
The 1H NMR spectra are difficult to interpret and assign due to the number of
peaks and their proximity to each other There are also impurities observable in the
spectra 13
C NMR spectra were also recorded and were simpler to interpret due to the
DEPT 135 spectra and enabled the quaternary CH CH2 and CH3 carbons to be
distinguished 1H NMR assignments were made using HSQC relating each peak in a
1H
spectrum to its corresponding carbon Solvent impurities were determined from known
solvent shifts (DMF acetone ethanol chloroform andor diethyl ether)3 DMF is the
most prevalent impurity due to it being the most difficult solvent to remove Some
starting material from amino acid esters can also be observed in small quantities
Triethylammonium chloride is also present in a small amount (11 ppm and 30 pmm)
7531 1H NMR Spectroscopy
1H NMR Shifts (400 mHz D2O)
DTPA-(AlaOMe)2 δ ppm 125 (d 3JHH =734 Hz 6 H H8) 311 (t
3JHH =100 Hz 4 H
H5) 323 (t 3JHH =569 Hz 4 H H4) 348 - 355 (m 2 H H6 and H7) 362 - 369 (m
4 H H2) 375 - 387 (m 4 H H3) 418 - 425 (m 2 H H1)
DTPA-(ArgOMe)2 δ ppm 154 (dq 2JHH =1449 Hz
3JHH 730 Hz 4 H H9) 169 - 189
(m 4 H H8) 302 - 317 (m 4 H H10 ) 325 (s 8 H H4 and H5) 362 (s 4 H H2)
365 (s 6 H H7) 368 (s 2 H H6) 375 - 384 (m 4 H H3) 436 - 444 (m 2 H H1)
DTPA-(SerOEt)2 δ ppm 117 (t 3JHH =706 Hz 6 H H7) 327 (s 8 H H4 and H5)
364 - 372 (m 6 H H2 and H6) 378 - 393 (m 9 H) H3 and H9) 414 (q 3JHH =706
Hz 4 H H8) 452 (dd 3JHH =479 378 Hz 2 H H1)
DTPA-(HisOMe)2 δ ppm 297 - 323 (m 12 H H4 H5 and H8) 331 (s 4 H H2) 349
(s 4 H H3) 358 (s 6 H H7) 362 (m 2 H H6) 370 - 375 (m 1 H H3) 464 - 466
(m 2 H H1) 714 (s 2 H H9) 843 (s 2 H H10)
212
Figure 71 1H NMR proton assignments for DTPA-(AlaOMe)2
Figure 72 1H NMR proton assignments for DTPA-(ArgOMe)2
Figure 73 1H NMR proton assignments for DTPA-(SerOEt)2
213
Figure 74 1H NMR proton assignments for DTPA-(HisOMe)2
7532 13
C NMR Spectroscopy
13CNMR Shifts (400 mHz D2O)
DTPA-(AlaOMe)2 δ ppm 158 (CH3 C12) 485 (CH C1) 511 (CH2 C5) 514 (CH2
C4) 529 (CH3 C7) 543 (CH2 C6) 563 (CH2 C2) 564 (CH2 C3) 1686 (q-C C9)
1718 (q-C C11) 1721 (q-C C10) 1746 (q-C C8)
DTPA-(ArgOMe)2 δ ppm 243 (CH2 C13) 275 (CH2 C12) 404 (CH2 C14) 512
(CH2 C5) 518 (CH2 C4) 523 (CH C1) 530 (CH3 C7) 548 (CH2 C6) 564 (CH2
C2) 568 (CH2 C3) 1567 (q-C C15) 1698 (q-C C9) 1716 (q-C C11) 1728 (q-C
C10) 1735 (q-C C8)
DTPA-(SerOEt)2 δ ppm 132 (CH3 C8) 512 (CH2 C5) 514 (CH2 C4) 545 (CH2
C6) 549 (CH C1) 563 (CH2 C2) 565 (CH2 C3) 607 (CH2 C13) 628 (CH2 C7)
1693 (q-C C9) 1712 (q-C C10) 1717 (q-c C11) 1723 (CH3 C8)
DTPA-(HisOMe)2 δ ppm 257 (CH2 C12) 505 (CH2 C5) 517 (CH C1) 525 (CH2
C4) 531 (CH3 C7) 551 (CH2 C6) 568 (CH2 C2) 572 (CH2 C3) 1170 (CH C14)
1286 (q-C C13) 1333 (CH C15) 1711 (q-C C9) 1714 (q-C C11) 1716 (q-C
C10) 1746 (q-C C8)
214
Figure 75 13
C NMR carbon assignments for DTPA-(AlaOMe)2
Figure 76 13
C NMR carbon assignments for DTPA-(ArgOMe)2
Figure 77 13
C NMR carbon assignments for DTPA-(SerOEt)2
215
Figure 78 13
C NMR carbon assignments for DTPA-(HisOMe)2
754 Characterisation of modified DTPA ligands by elemental analysis
Elemental analysis was also performed on the ligands for characterisation Since
the ligands do contain impurities despite several purification steps the elemental
analysis is not quite as predicted for pure samples Chlorine was found to also be
present from residual triethylammonium chloride as identified by NMR spectroscopy in
addition to residual solvents despite prolonged drying under vacuum
Table 72 Elemental analysis results for modified DTPA ligands P = predicted
proportion present () A = actual proportion present ()
C () H () N () Cl () Na ()
Ligand P A P A P A P A P A
DTPA-(AlaOMe)2
4689 4224 662 685 1243 1146 0 475 0 0
DTPA-(ArgOMe)2
4583 3896 701 637 2100 1643 0 1427 0 0
DTPA-(SerOEt)2
4622 4300 663 755 1123 1041 0 240 0 0
DTPA-(HisOMe)2
4834 3985 594 668 1812 1458 0 595 0 0
216
755 Luminescence studies with modified DTPA ligands
7551 Stock solutions
A stock solution (10 mM 10 mL) was made up for Eu(NO3)3xH2O in H2O or
D2O as required Additionally a stock solution of HDEHP in n-dodecane (1935 g in
100 mL 06 M) was prepared All reagents were purchased from Sigma-Aldrich
Stock solutions
10 mM EuTb(NO3)3 in H2OD2O
06 M HDEHP in n-dodecane
7552 Preparation of aqueous samples
2 mL samples were prepared for aqueous phases The Eu(NO3)3 stock solution
(02 mL) was added calculated quantities of each ligand to make samples with
concentrations of 1 mM Eu(NO3)3 and 005 M ligand when made up to 2 mL with H2O
or D2O The pH of samples was adjusted individually with concentrated HNO3 and
NaOH to minimise change in volume using a Mettler Toledo Seven Compact pHion
Meter pD was calculated using Equation 71
7553 Preparation of extracted samples
Aqueous samples were prepared as above (Section 7413) Due to the small
quantities of ligand available pre-equilibration was not possible as the same samples
used for aqueous phase studies were subsequently used for extraction studies The
aqueous phases were contacted with HDEHP in n-dodecane (2 mL 06 M) The
solutions were then shaken using a Scientific Industries Vortex Genie 2 Mixer and
Shaker for 15 minutes left to settle and separated into the two phases for analysis
7554 Radiolysis of ligand samples
Radiolysis experiments on modified DTPA ligand systems were carried out
using the 60
Co irradiator at DCF These irradiations were undertaken at the same time as
the GSH irradiations at a later date than the initial amino acid radiolysis studies
(Section 722) using the new calibrated sample holder with known dose rates and so
preparation and use of a Fricke solution was not necessary Samples received an average
of 7 kGy γ radiation
217
76 Instruments
761 FTS MODEL 812 System 60
Co Irradiator
All irradiations at the Dalton Cumbrian Facility were carried out using a 60
Co
irradiator which can allow multiple dose rates as it comprises two individual source
rods Radiation is generated by the decay of 60
Co to 60
Ni causing emission of β-
particles and γ-rays
Samples (5 mL for amino acid and GSH systems 2 mL for modified DTPA
ligand systems) were transferred into glass vials with plastic screw tops and placed
inside the irradiator mounted on a pre-designed rig Multiple samples were able to be
irradiated at once due to the design of the sample holder (Figure 79)
Figure 79 60
Co Irradiator at DCF (left) sample holder (top right) and sample holder
inside the irradiator (bottom right)
762 Edinburgh Instrument FP920 Phosphorescence Lifetime Spectrometer
All luminescence studies were carried out using an Edinburgh Instrument FP920
Phosphorescence Lifetime Spectrometer Steady state emission and excitation spectra
were recorded in quartz cuvettes on an Edinburgh Instrument FP920 Phosphorescence
Lifetime Spectrometer equipped with a 5 watt microsecond pulsed xenon flashlamp
(with single 300 mm focal length excitation and emission monochromators in Czerny
Turner configuration) and a red sensitive photomultiplier in peltier (air cooled) housing
(Hamamatsu R928P) Lifetime data were recorded following excitation with the
flashlamp and using time correlated single photon counting (PCS900 plug-in PC card
for fast photon counting) Lifetimes were obtained by tail fit on the data obtained
218
Table 73 Emission and excitation wavelengths for Ln3+
ions
763 Packard Cobra II Gamma Counter
Activity in separation samples prepared at the INL was measured using a Cobra
II Gamma Counter an automated gamma counter Background samples were counted in
addition in order allow correction for background radiation levels Samples run on
automated protocols run until the counting error is within 1 or the sample has run for
20 minutes
764 Bruker UltrashieldTM
400 NMR Spectrometer
NMR measurements were carried out using a Bruker UltrashieldTM
400
spectrometer of operating frequency 400 MHz (1H) and 162 MHz (
13C) with a variable
temperature unit set at 295 K unless otherwise stated The instrument was controlled
remotely using Bruker Topspin 21 software
Ln3+
Emission (nm) Excitation (nm)
Eu 617 395
Tb 545 379
Sm 600 403
Dy 575 352
219
1 CB Şenvar Chemical Dosimetry of Gamma Rays Neutrons and Accelerated
Electrons University of Ankara 1959 1-28
2 JWT Spinks and RJ Woods An Introduction to Radiation Chemistry Wiley-
Interscience Canada 3rd edn 1990
3 HE Gottlieb V Kotlyar and A Nudelman J Org Chem 1997 62 7512-7515
220
APPENDICES
APPENDIX 1 - Emission spectra for [GSH] pH dependence studies with DTPA in H2O
Figure A Emission spectra of Eu3+
in H2O at pH 2 with 005 M Na5DTPA over a GSH
concentration range of 01 ndash 05 M following excitation at 397 nm
Figure B Emission spectra of Eu3+
in H2O at pH 3 with 005 M Na5DTPA over a GSH
concentration range of 01 ndash 05 M following excitation at 397 nm
00
02
04
06
08
10
12
14
550 600 650 700
Emis
sio
n In
ten
sity
(au
) x
10
00
0
Wavelength (nm)
01 M GSH
02 M GSH
03 M GSH
04 M GSH
05 M GSH
00
02
04
06
08
10
12
14
550 600 650 700
Emis
sio
n In
ten
sity
(au
) x
10
00
0
Wavelength (nm)
01 M GSH
02 M GSH
03 M GSH
04 M GSH
05 M GSH
221
Figure C Emission spectra of Eu3+
in H2O at pH 4 with 005 M Na5DTPA over a GSH
concentration range of 01 ndash 05 M following excitation at 397 nm
00
02
04
06
08
10
12
14
550 600 650 700
Emis
sio
n In
ten
sity
(au
) x
10
00
0
Wavelength (nm)
01 M GSH
02 M GSH
03 M GSH
04 M GSH
05 M GSH
222
APPENDIX 2 - SFLnAm for varying GSH concentration over a pH range of 2-4 with
005 M Na5DTPA after extraction with 02 M HDEHP in dodecane
Figure D SFLnAm for varying GSH concentration at pH 2 with 005 M Na5DTPA after
extraction with 02 M HDEHP in dodecane
Figure E SFLnAm for varying GSH concentration at pH 3 with 005 M Na5DTPA after
extraction with 02 M HDEHP in dodecane
0
5
10
15
20
25
30
35
40
56 57 58 59 60 61 62 63 64 65 66 67 68
Sep
arat
ion
Fac
tor
Atomic Number
01 M GSH
02 M GSH
03 M GSH
04 M GSH
05 M GSH
0
50
100
150
200
250
56 57 58 59 60 61 62 63 64 65 66 67 68
Sep
arat
ion
Fac
tor
Atomic Number
01 M GSH
02 M GSH
03 M GSH
04 M GSH
05 M GSH
223
APPENDIX 3 - Natural pH values for modified DTPA ligands (005 M) with Eu(NO3)3
(1 mM)
Table F Natural pH values for modified DTPA ligands (005 M) with Eu(NO3)3 (1
mM)
Ligand Natural pH with Eu(NO3)3
DTPA-(AlaOMe)2 243
DTPA-(ArgOMe)2 238
DTPA-(SerOEt)2 240
DTPA-(HisOMe)2 286
224
APPENDIX 4 - Emission spectra for Eu(NO3)3 with modified DTPA ligands in H2O
Figure G Emission spectra for Eu(NO3)3 with modified DTPA ligands in H2O at pH 2
Figure H Emission spectra for Eu(NO3)3 with modified DTPA ligands in H2O at pH 3
0
2
4
6
8
10
12
550 575 600 625 650 675 700
Emis
sio
n In
ten
sity
(au
) x
10
00
0
Wavelength (nm)
Ala-DTPA
Arg-DTPA
Hist-DTPA
Ser-DTPA
0
2
4
6
8
10
12
14
550 575 600 625 650 675 700
Emis
sio
n In
ten
sity
(au
) x
10
00
0
Wavelength (nm)
Ala-DTPA
Arg-DTPA
Hist-DTPA
Ser-DTPA
225
Figure I Emission spectra for Eu(NO3)3 with modified DTPA ligands in H2O at pH 4
0
1
2
3
4
5
6
7
8
9
10
550 575 600 625 650 675 700
Emis
sio
n In
ten
sity
(au
) x
10
00
0
Wavelength (nm)
Ala-DTPA
Arg-DTPA
Hist-DTPA
Ser-DTPA
226
APPENDIX 5 - Emission spectra for radiolysis studies on Eu(NO3)3 in H2O with
DTPA-di(amino acid) ligands
Figure J Emission spectra for Eu(NO3)3 in H2O with DTPA-di(amino acid) ligands
(005 M) at pH 2 after irradiation with 7 kGy γ-radiation
Figure K Emission spectra for Eu(NO3)3 in H2O with DTPA-di(amino acid) ligands
(005 M) at pH 3 after irradiation with 7 kGy γ-radiation
00
05
10
15
20
25
550 575 600 625 650 675 700
Emis
sio
n In
tem
sity
(au
) x
10
00
0
Wavelength (nm)
Ala-DTPA
Arg-DTPA
Hist-DTPA
Ser-DTPA
00
05
10
15
20
25
550 575 600 625 650 675 700
Emis
sio
n In
ten
sity
(au
) x
10
00
0
Wavelength (nm)
Ala-DTPA
Arg-DTPA
Hist-DTPA
Ser-DTPA
227
Figure L Emission spectra for Eu(NO3)3 in H2O with DTPA-di(amino acid) ligands
(005 M) at pH 4 after irradiation with 7 kGy γ-radiation
00
05
10
15
20
25
550 575 600 625 650 675 700
Emis
sio
n In
ten
sity
(au
) x
10
00
0
Wavelength (nm)
Ala-DTPA
Arg-DTPA
Hist-DTPA
Ser-DTPA
228
APPENDIX 6 - MALDI-MS spectrum for DTPA-(AlaOMe)2
[M+H]+
[M+Na]+ [M+K]
+
229
AP
PE
ND
IX 7
- 1H N
MR
spectru
m fo
r DT
PA
-(AlaO
Me)
2
230
GSH1ESP
45 40 35 30 25 20 15
Chemical Shift (ppm)
01
02
03
04
05
06
07
08
09
Norm
alize
d In
tensi
ty
Water
44
944
844
6
38
9
37
6 37
437
2 28
628
628
528
4
24
924
8 24
724
624
524
4
21
1 20
920
720
5
AP
PE
ND
IX 8
- 1H N
MR
spectru
m fo
r GS
H
231
EUGSHESP
45 40 35 30 25 20 15
Chemical Shift (ppm)
01
02
03
04
05
06
07
08
09
Norm
alized Inte
nsity
Water
45
044
844
7
41
8
38
037
837
7
37
136
9
30
230
1
28
7 28
628
4
24
9 24
724
624
423
323
1
21
020
820
720
5
AP
PE
ND
IX 8
a - 1H N
MR
spectru
m fo
r Eu(N
O3 )
3 + G
SH
232


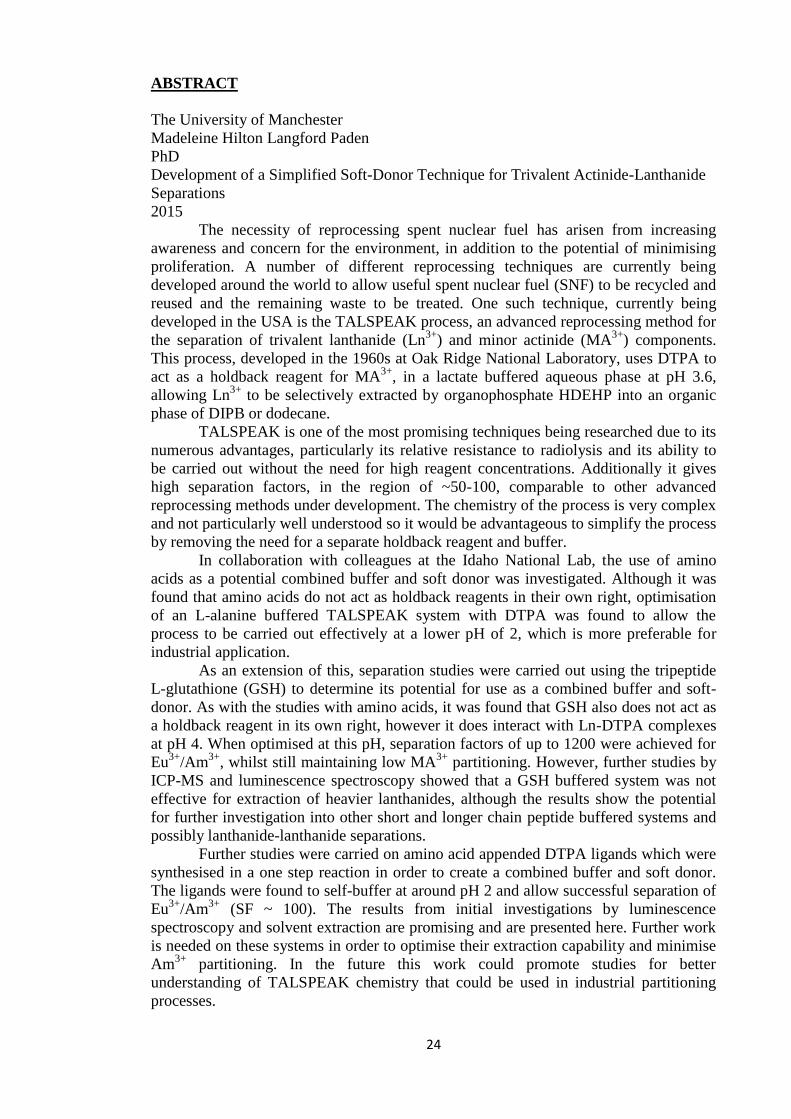


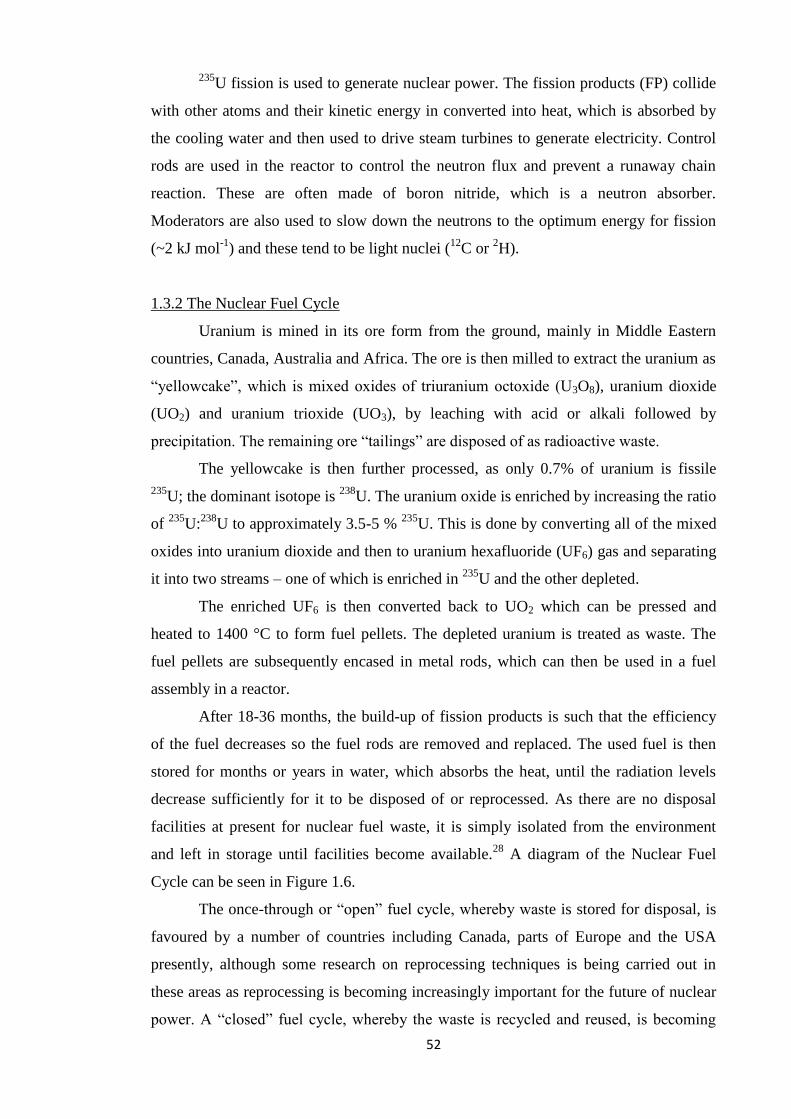


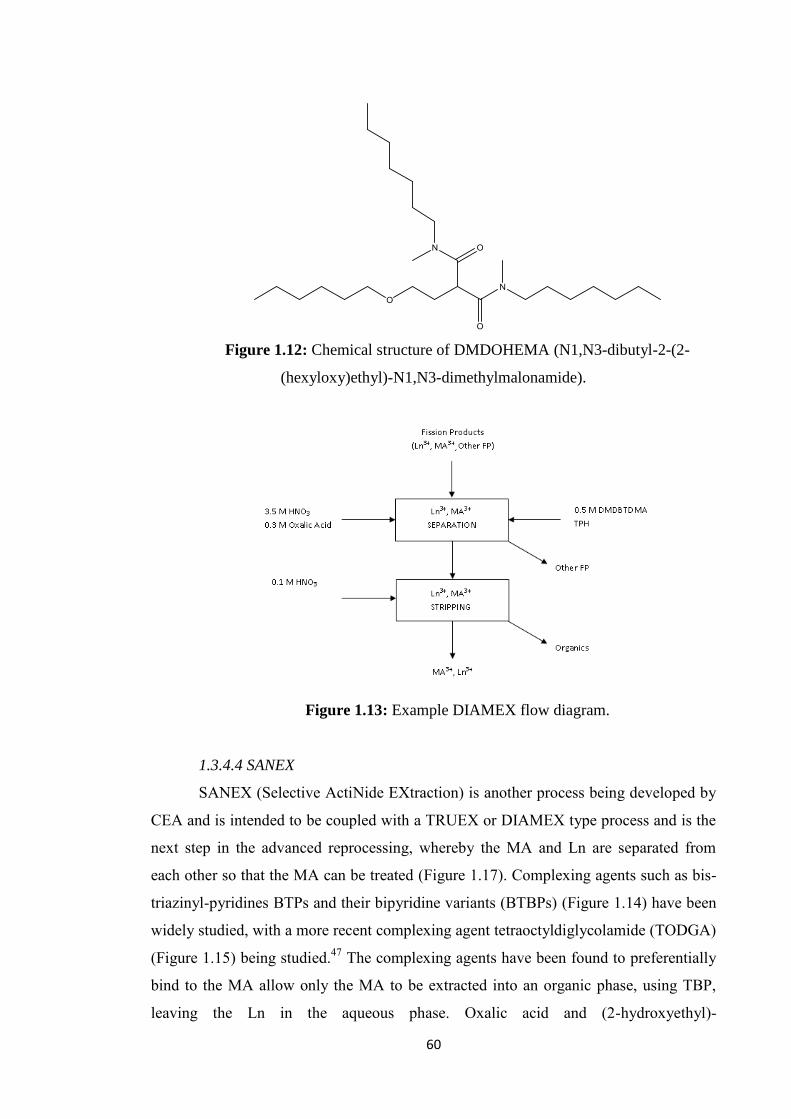


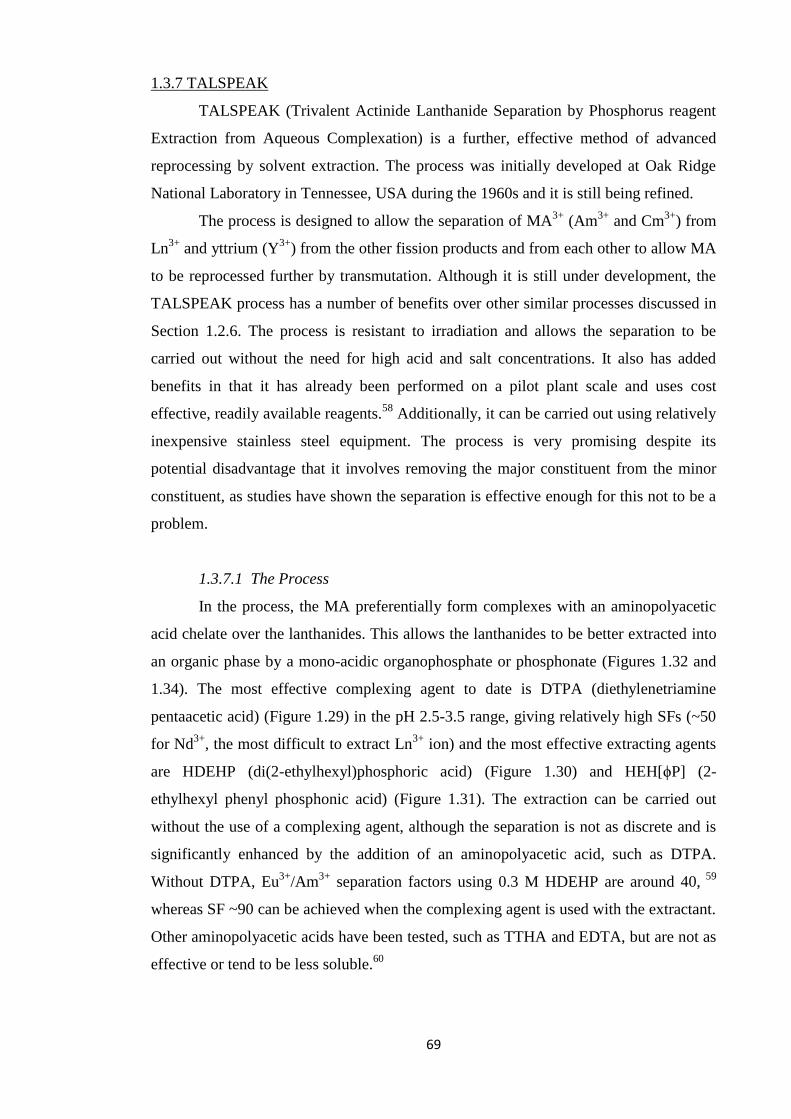


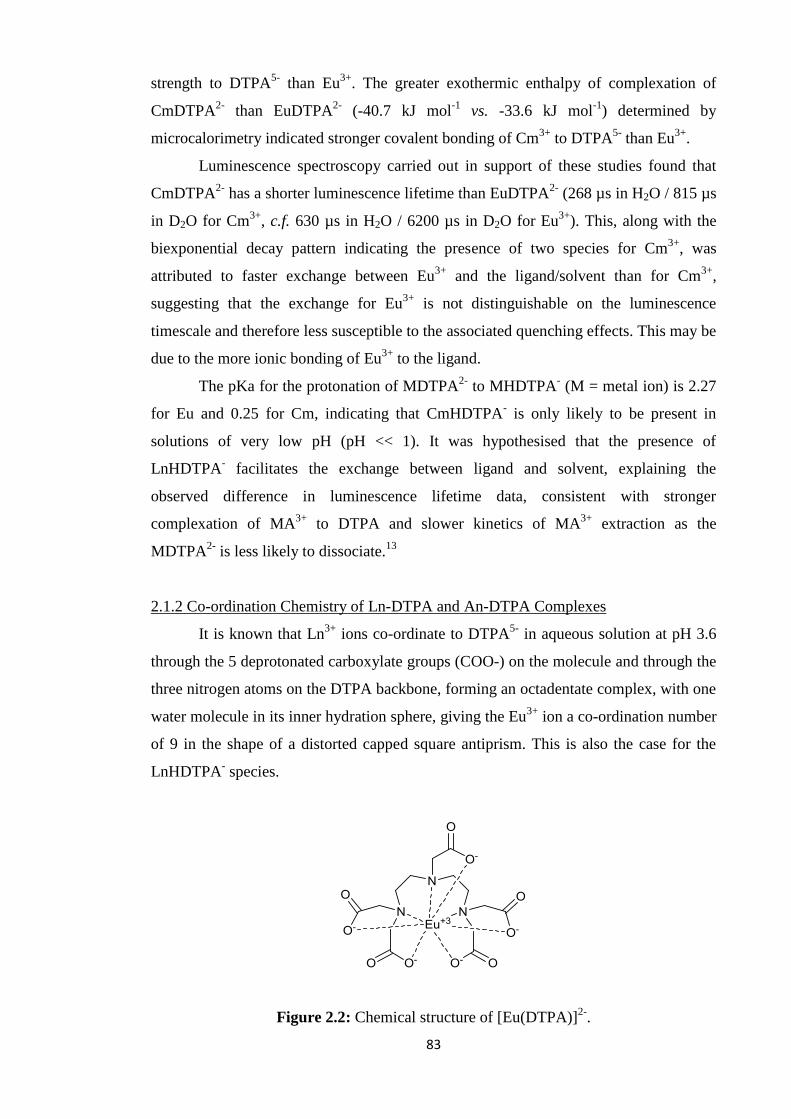


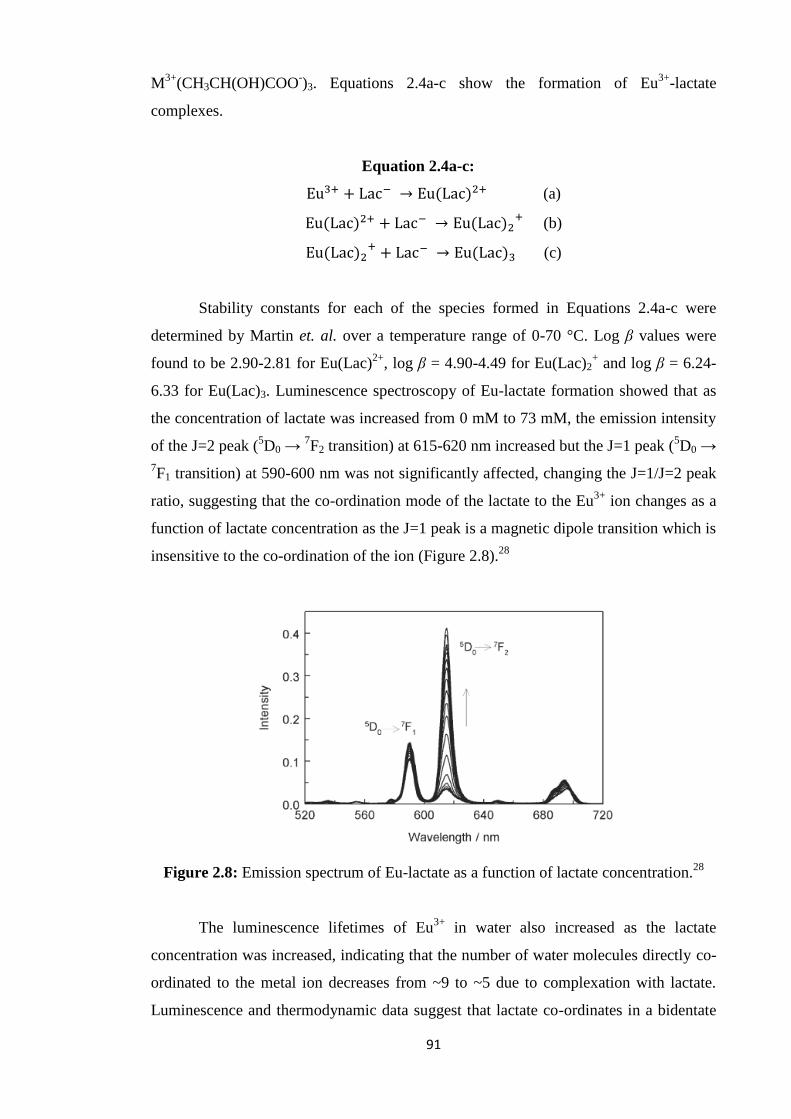
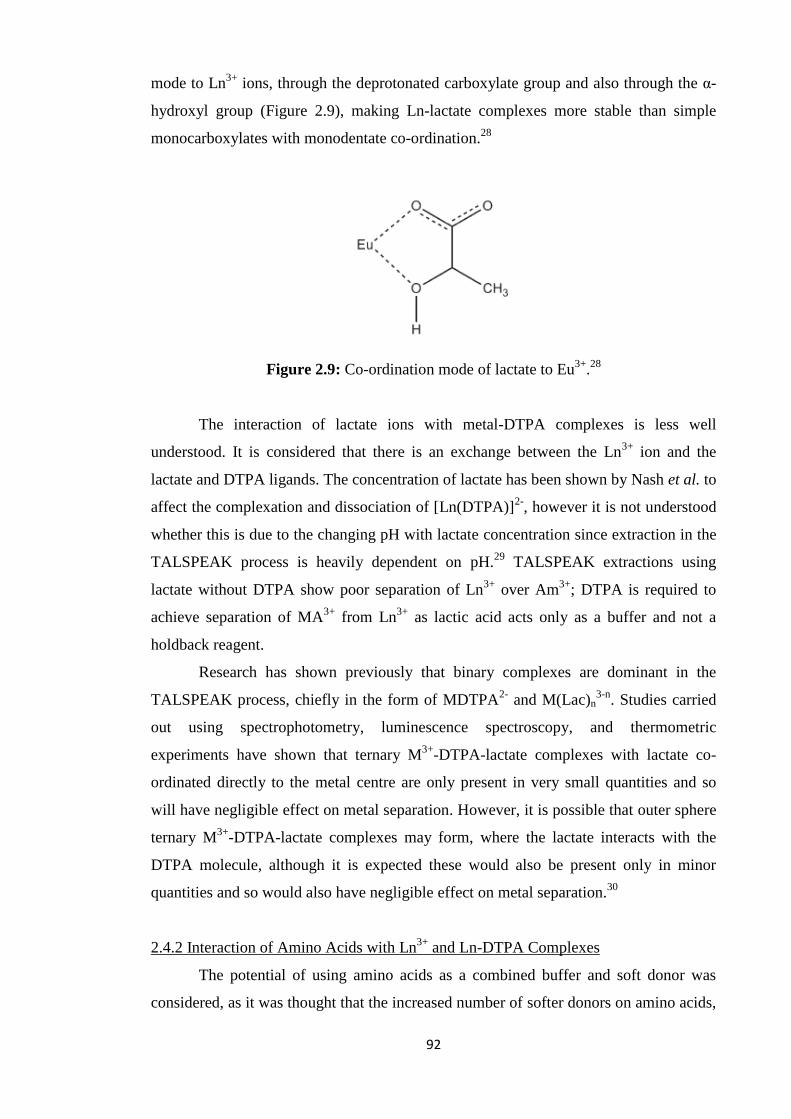
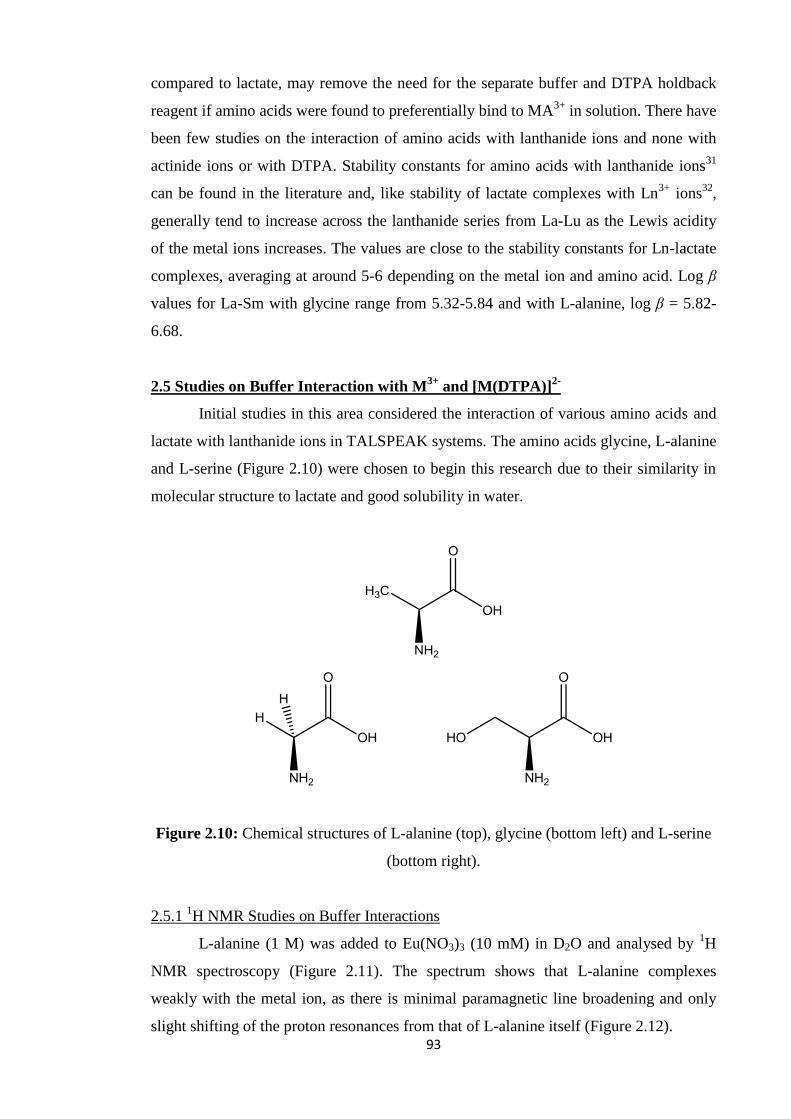


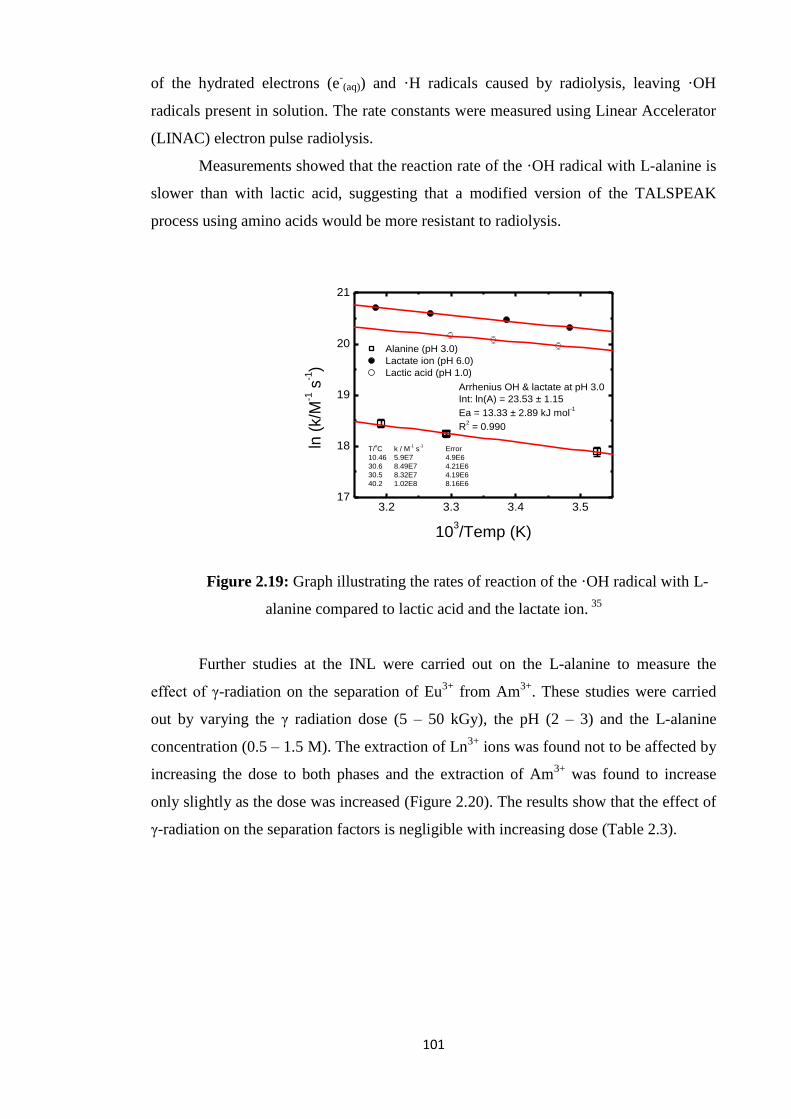
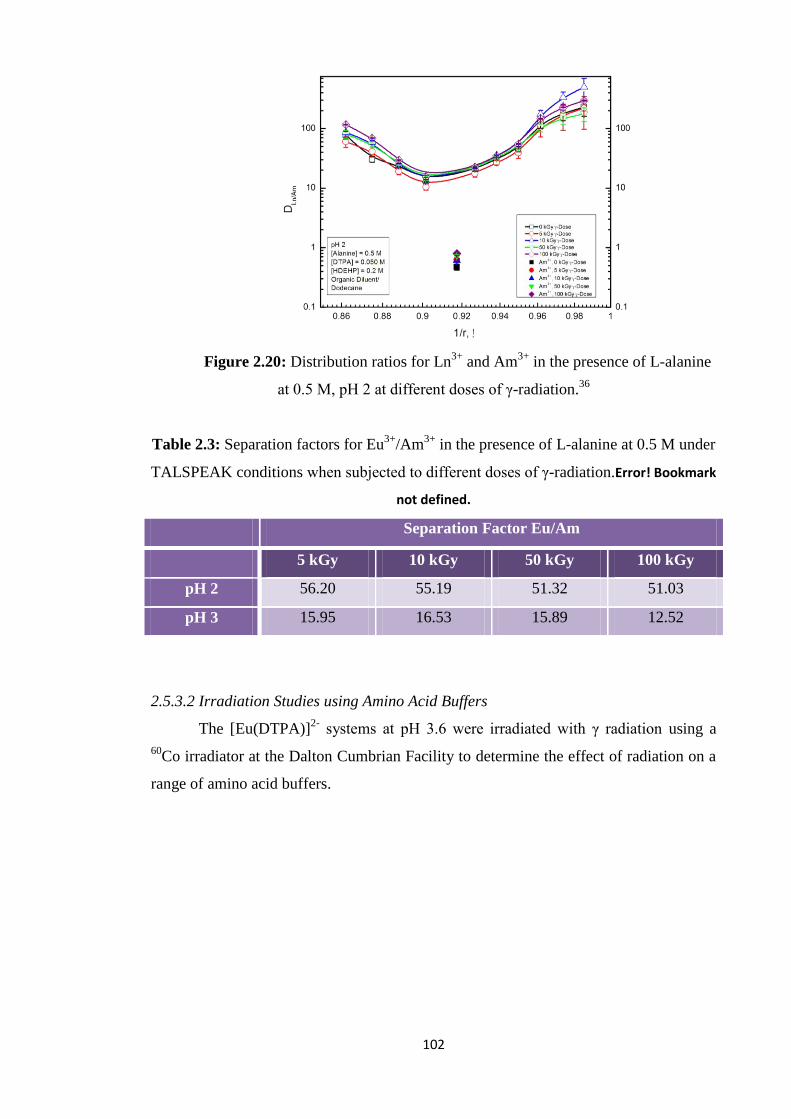


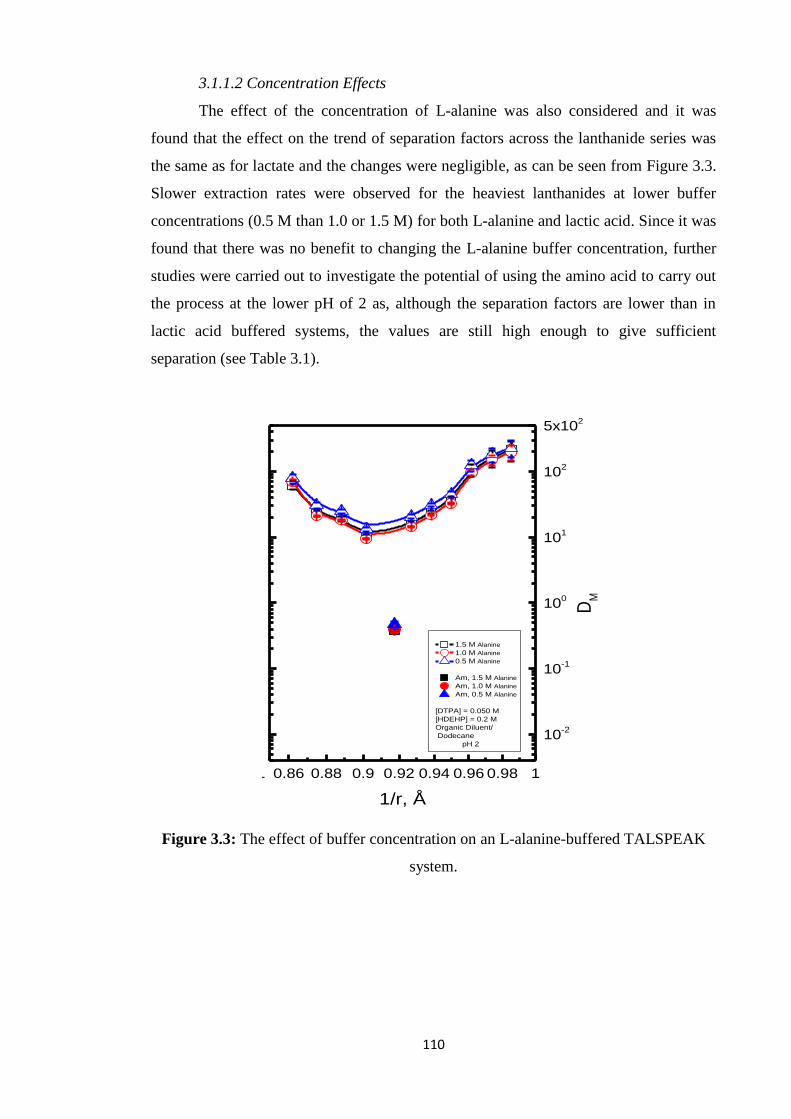


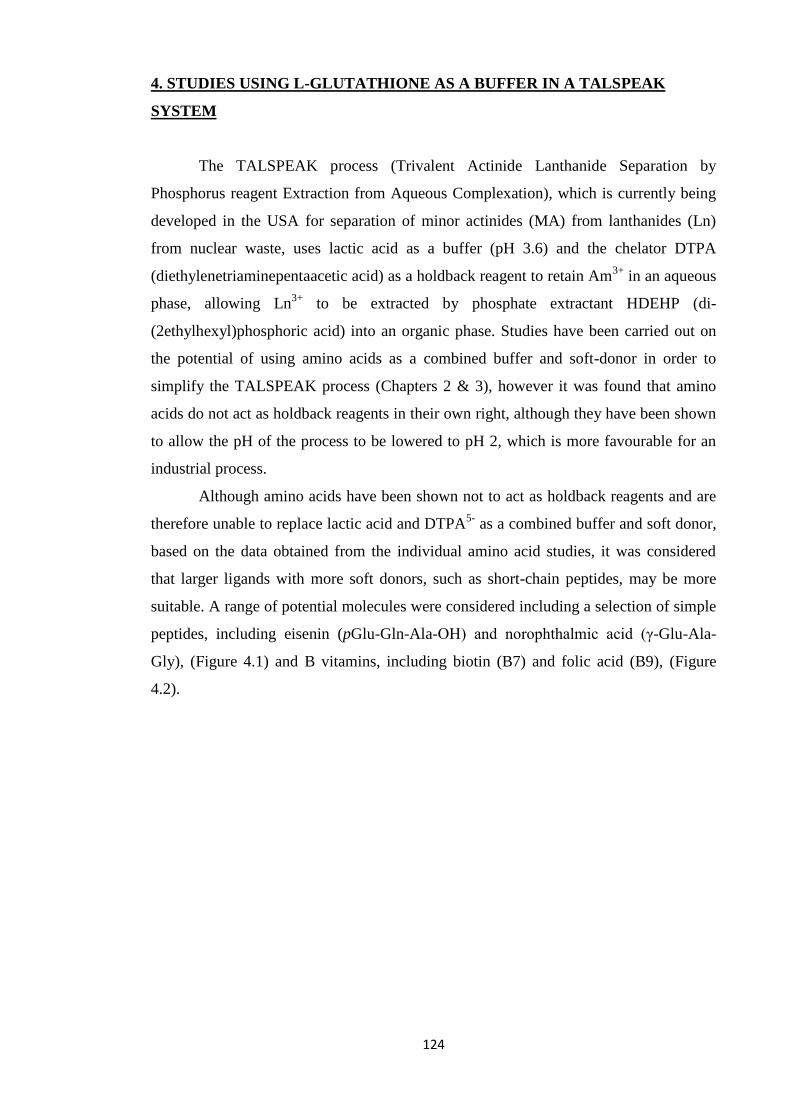


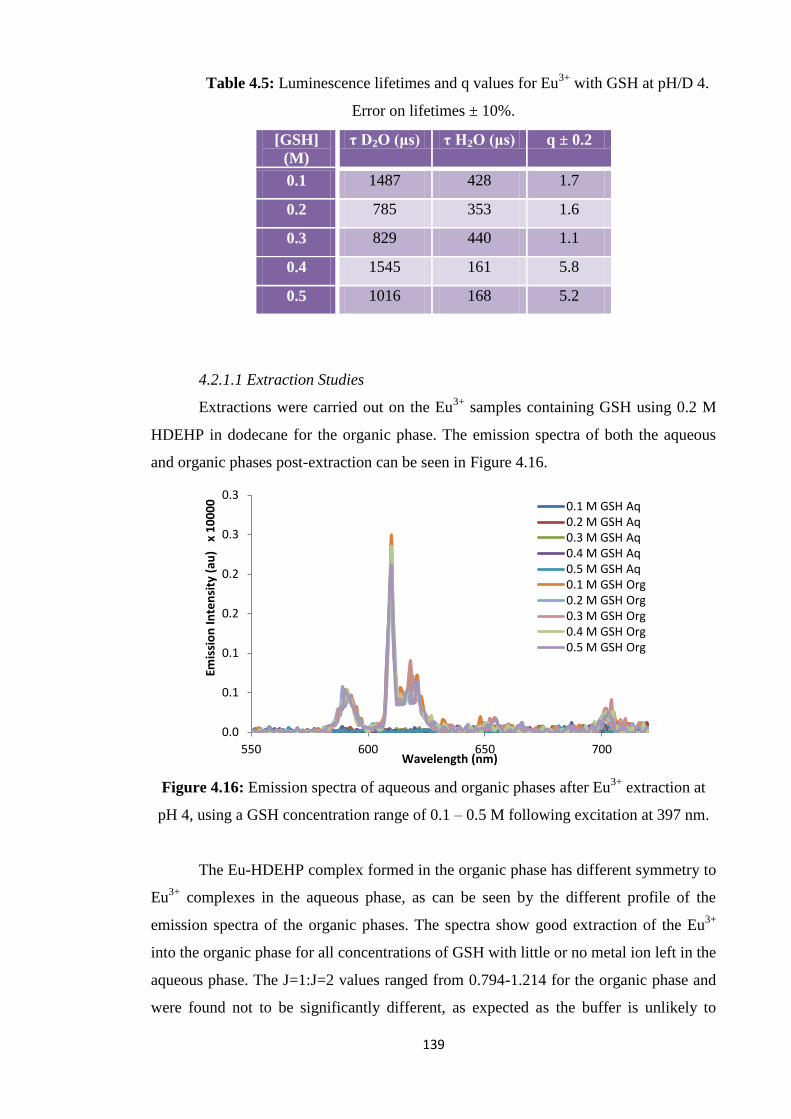


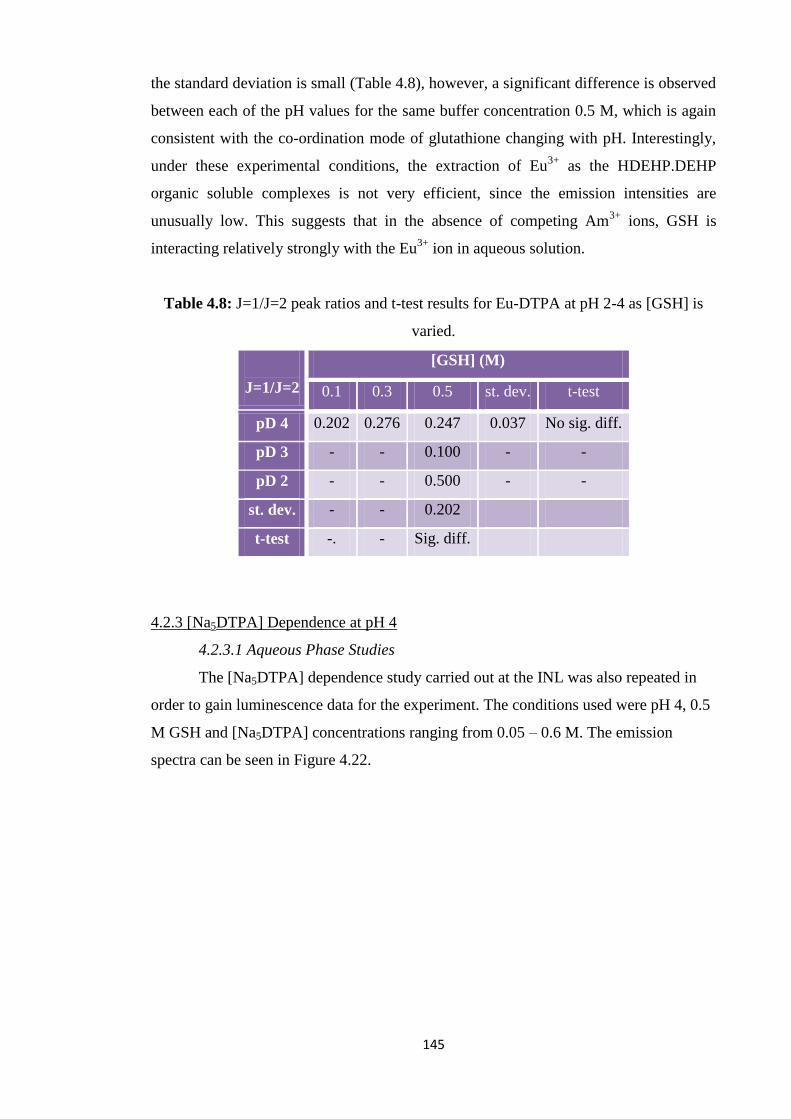


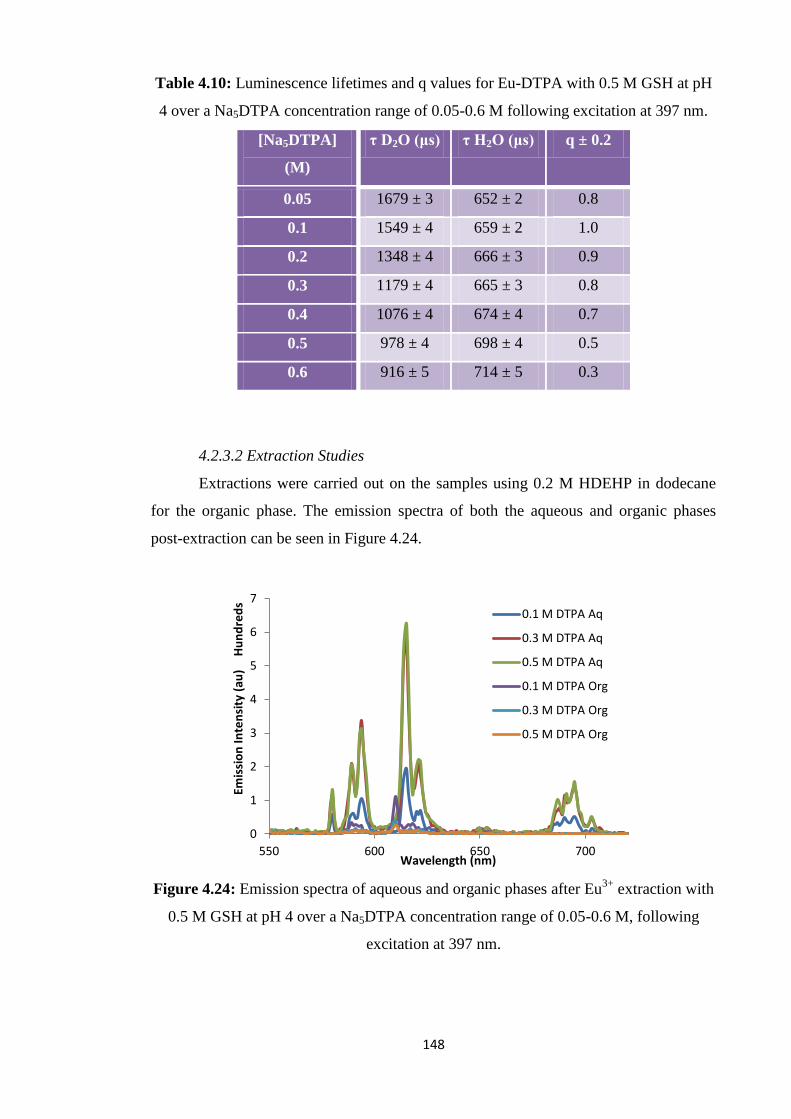


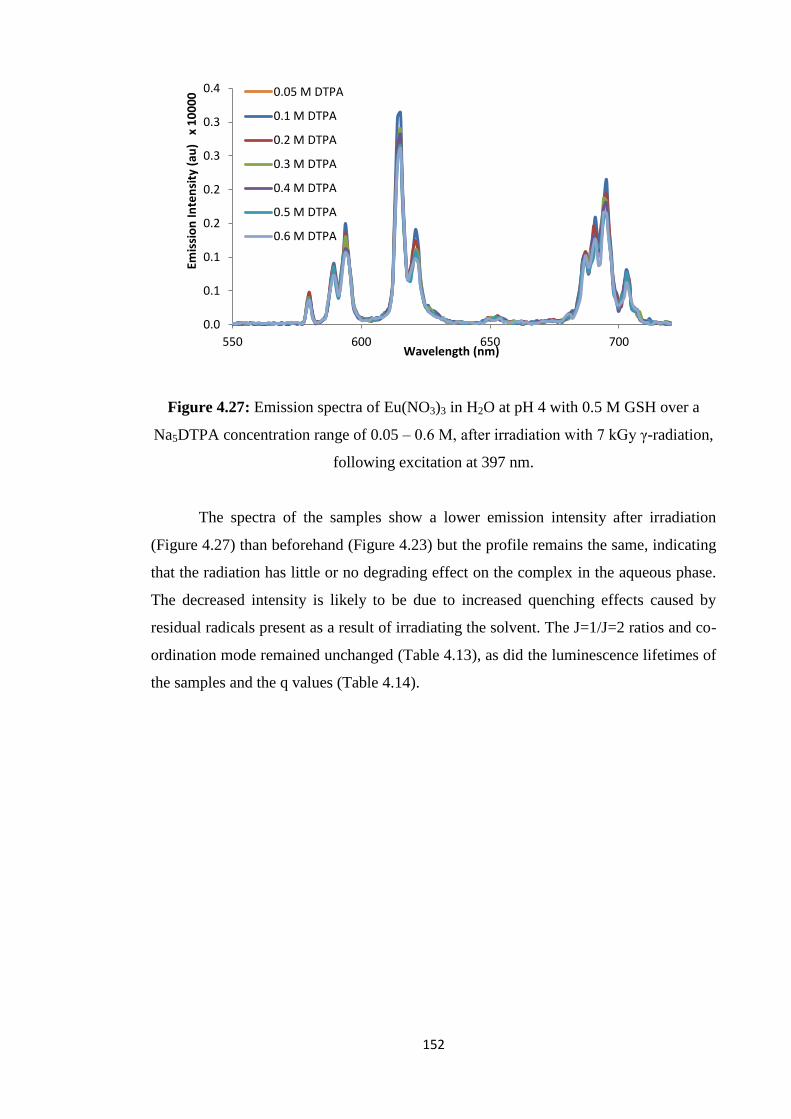


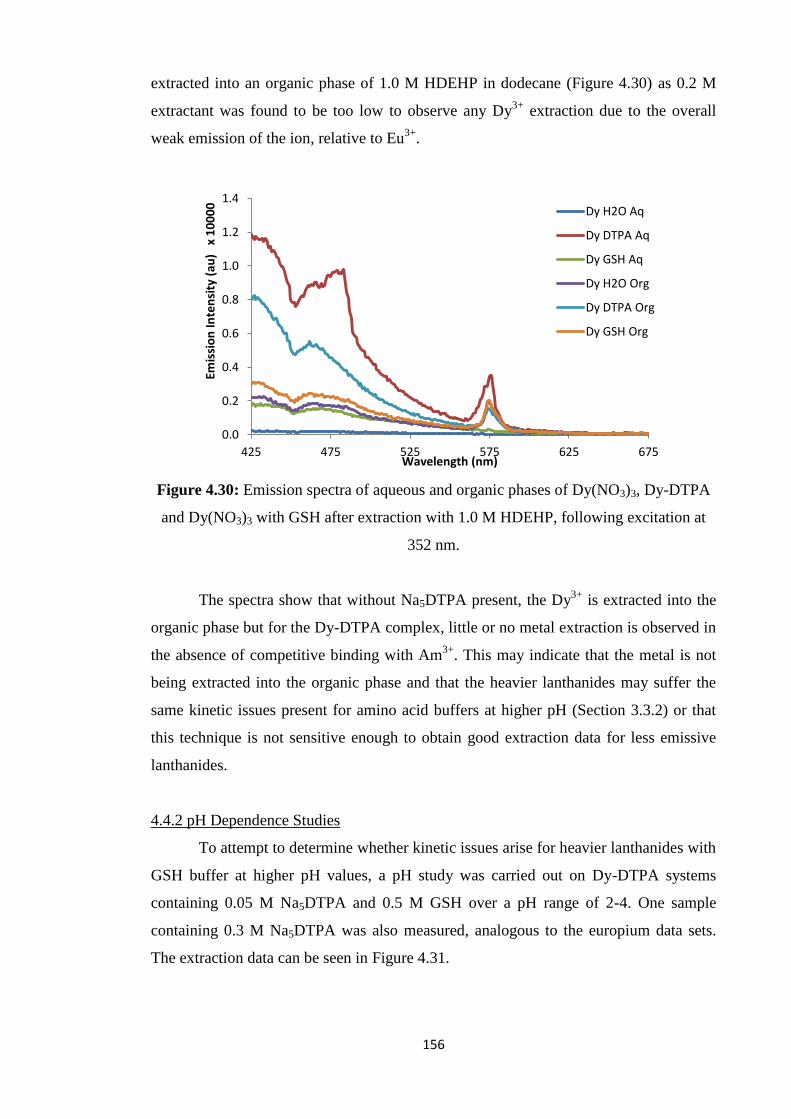


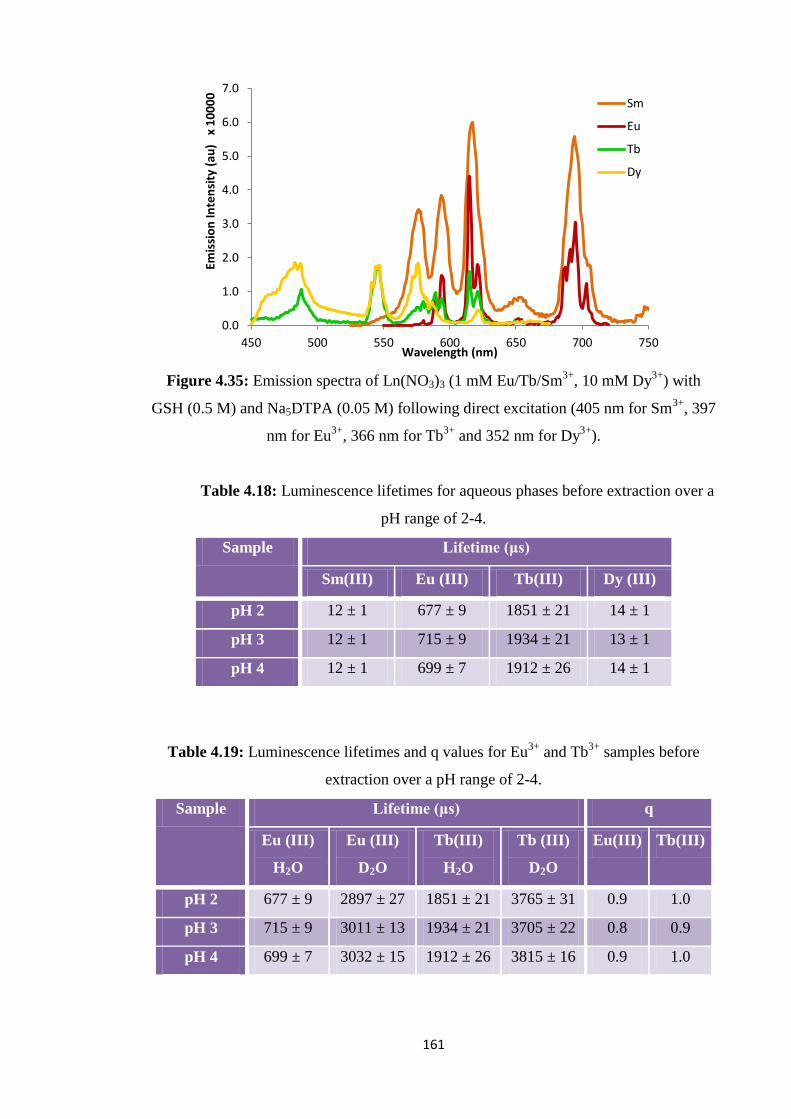


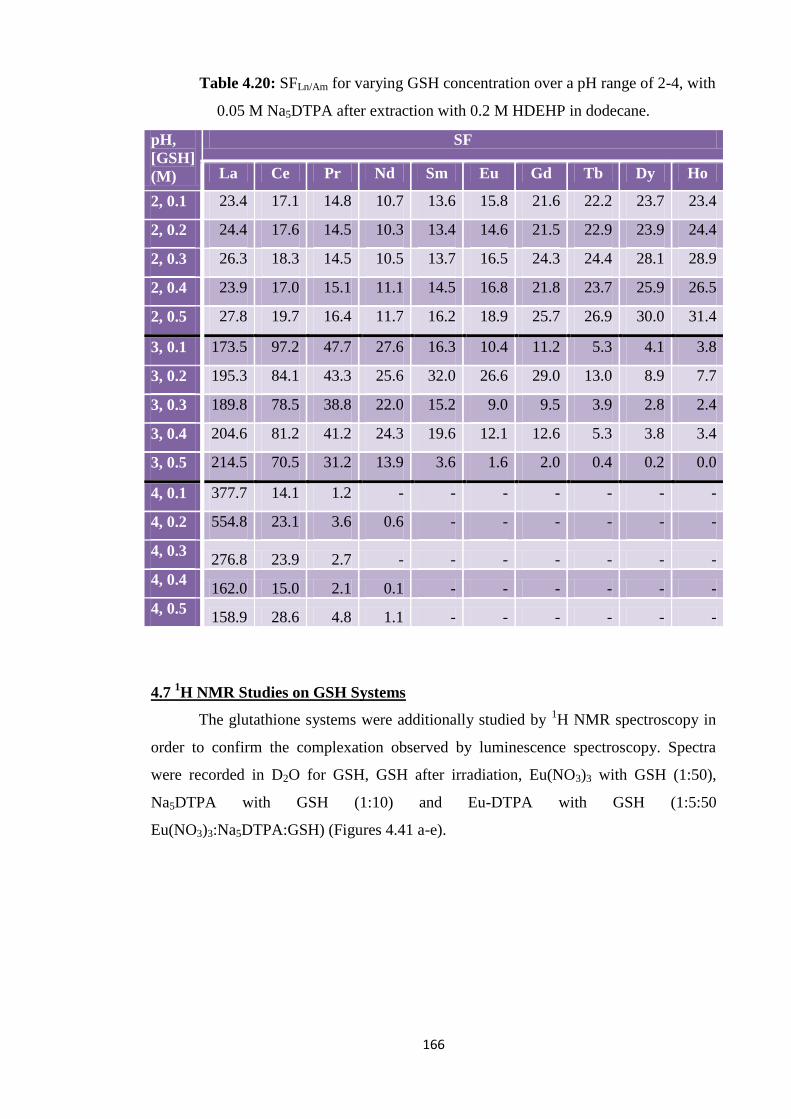


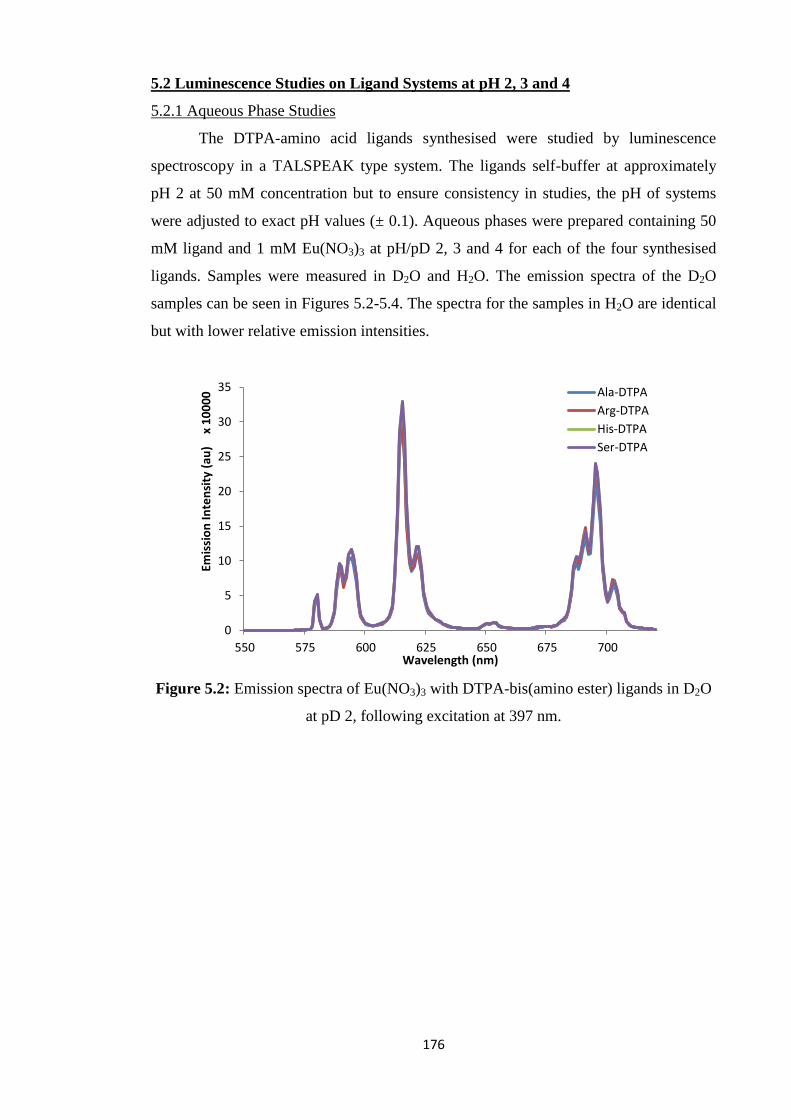


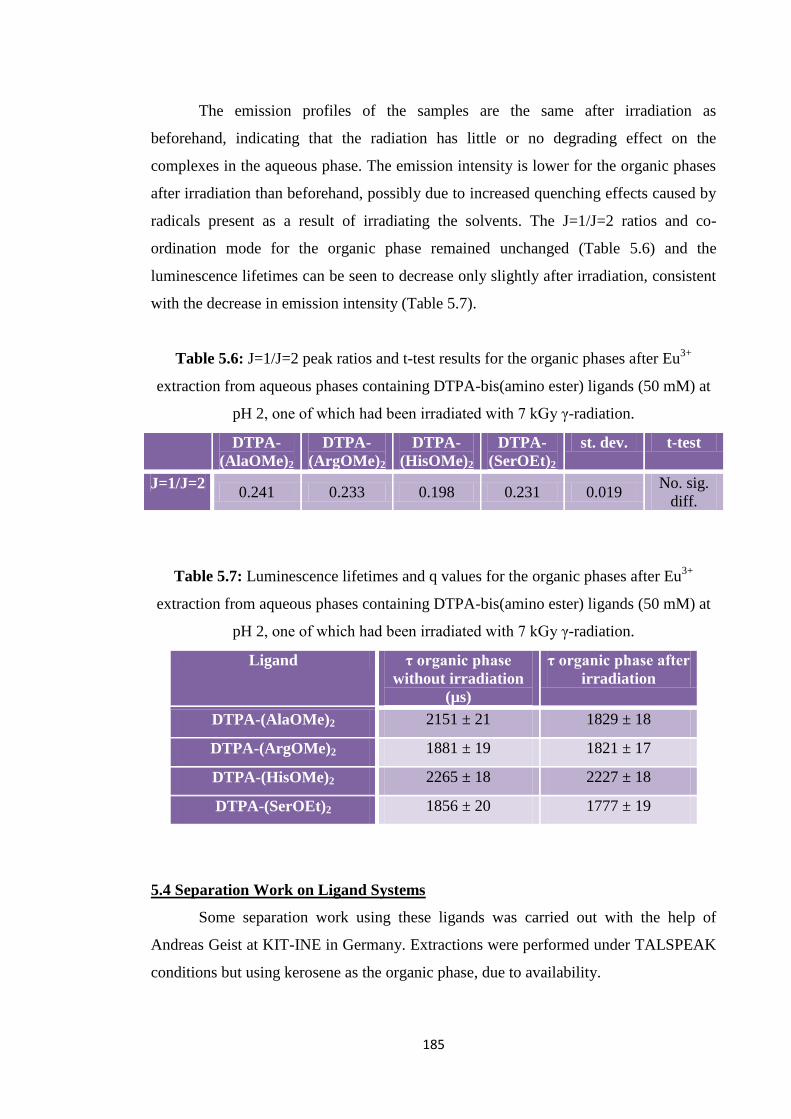
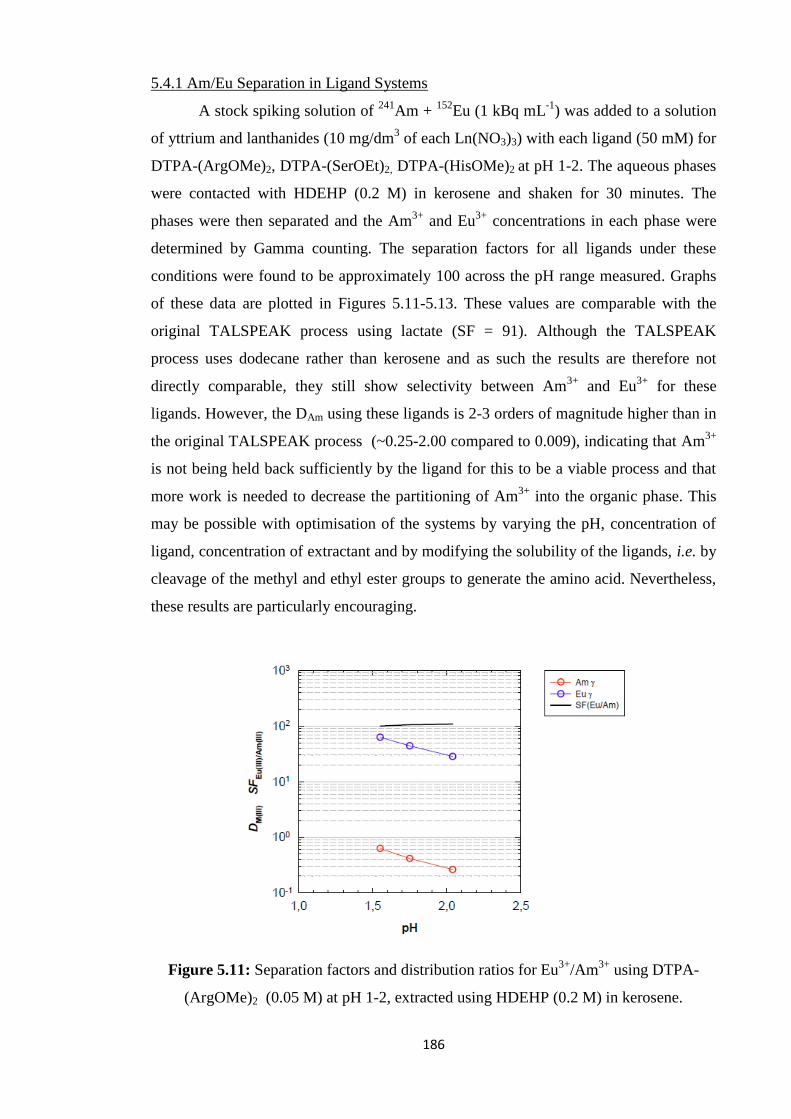

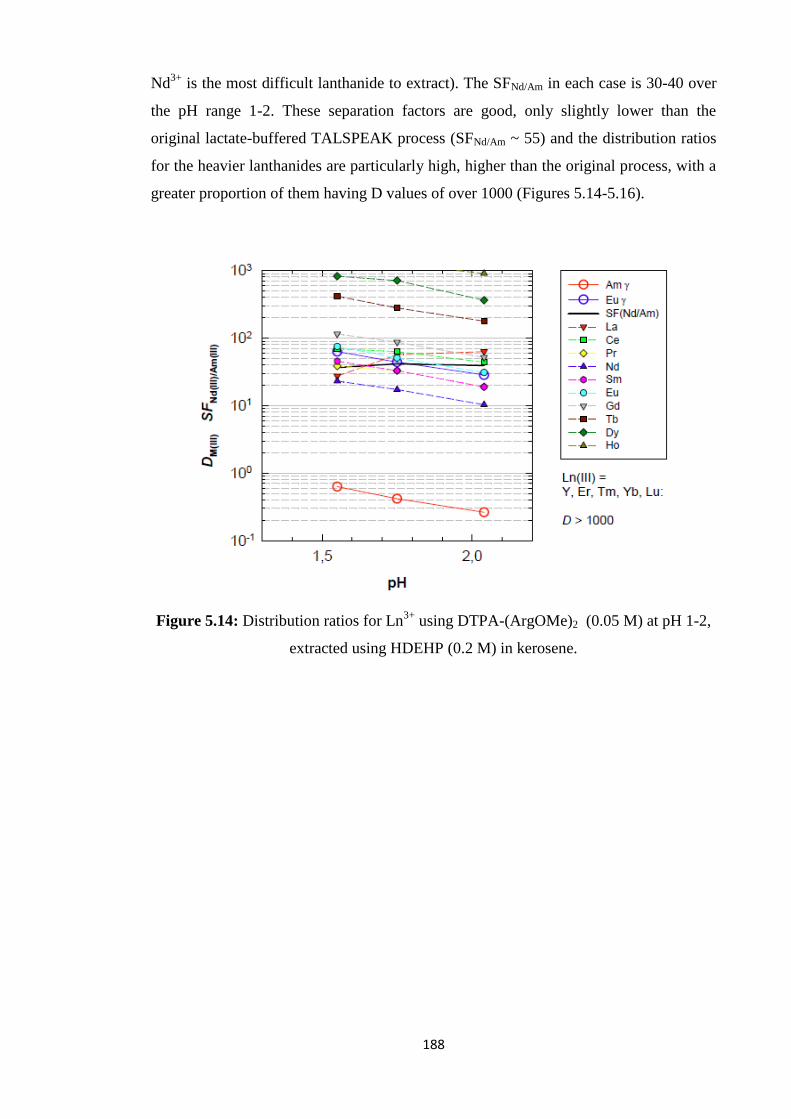


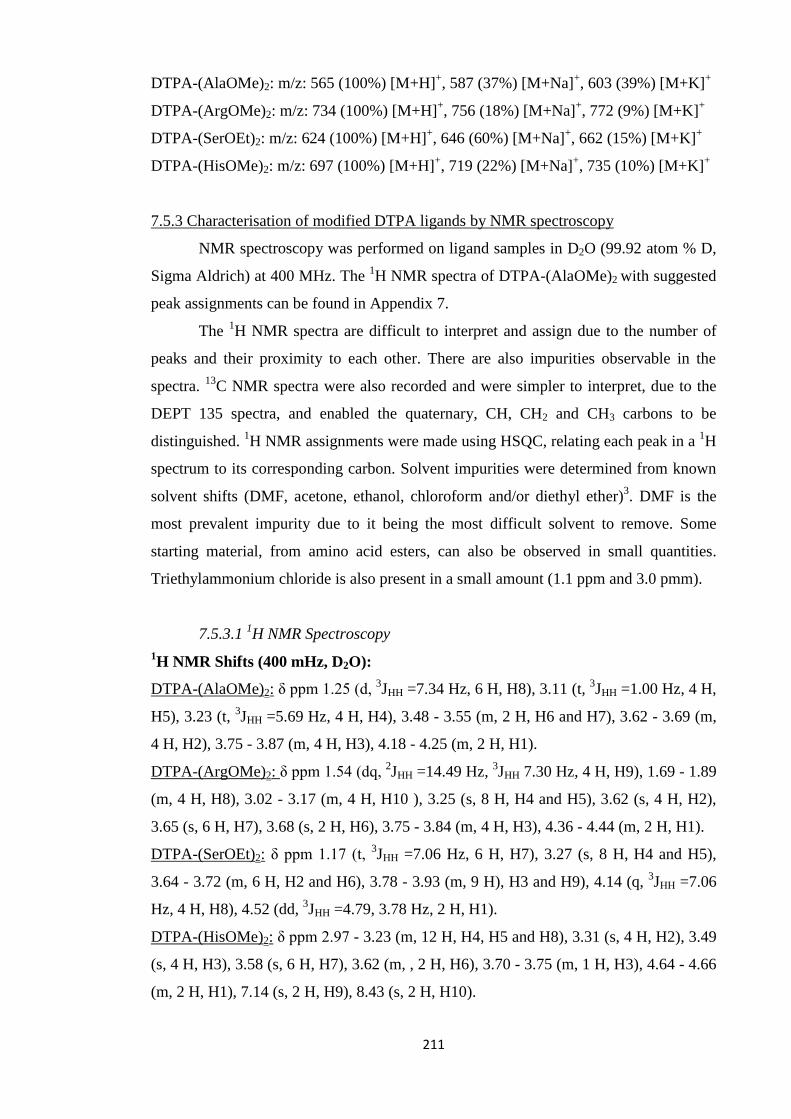


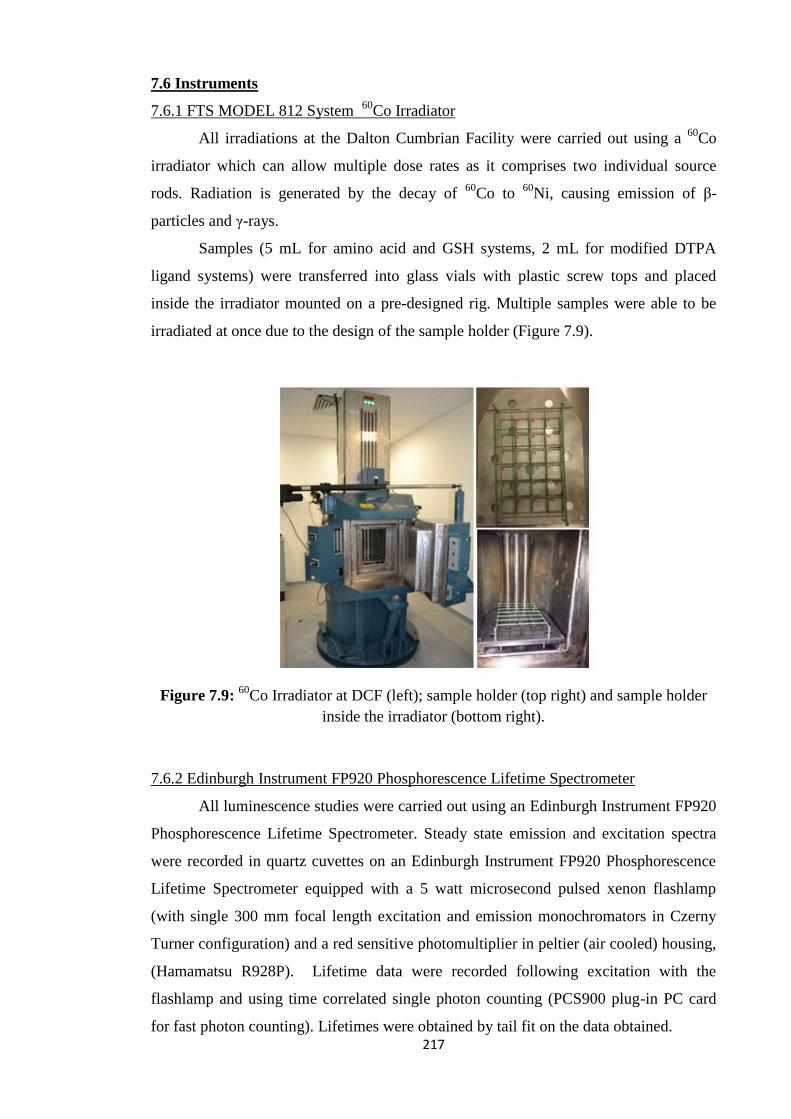


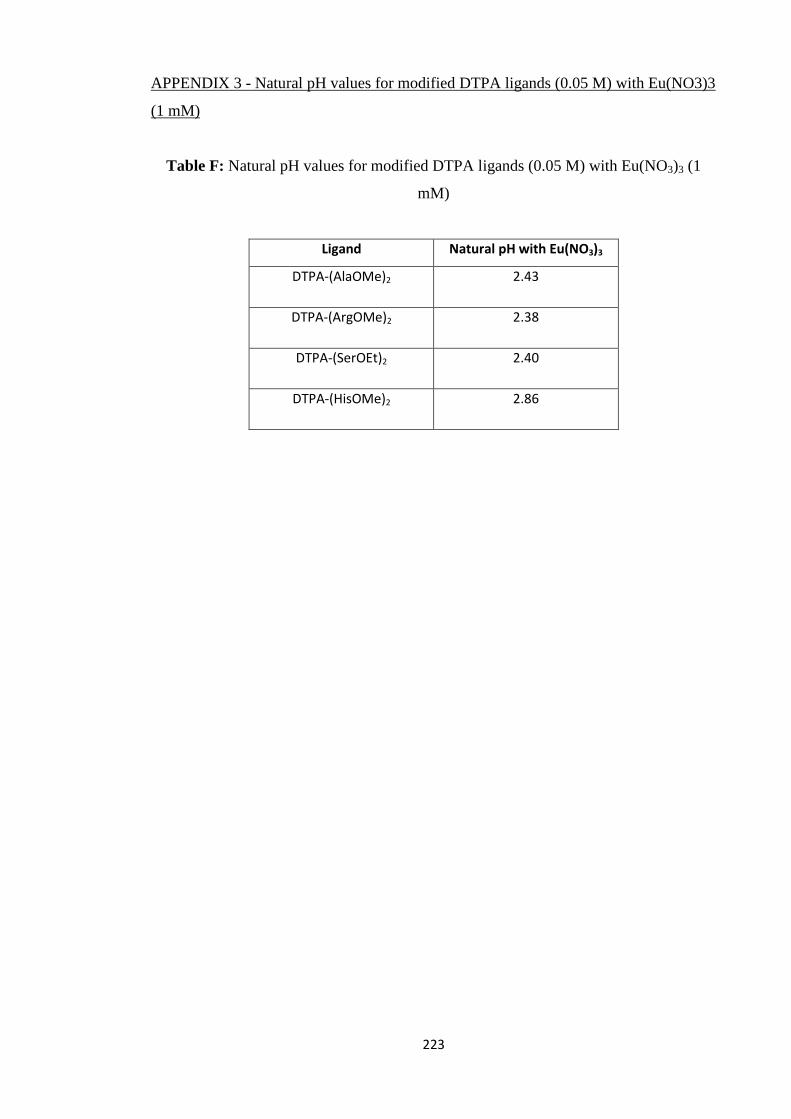


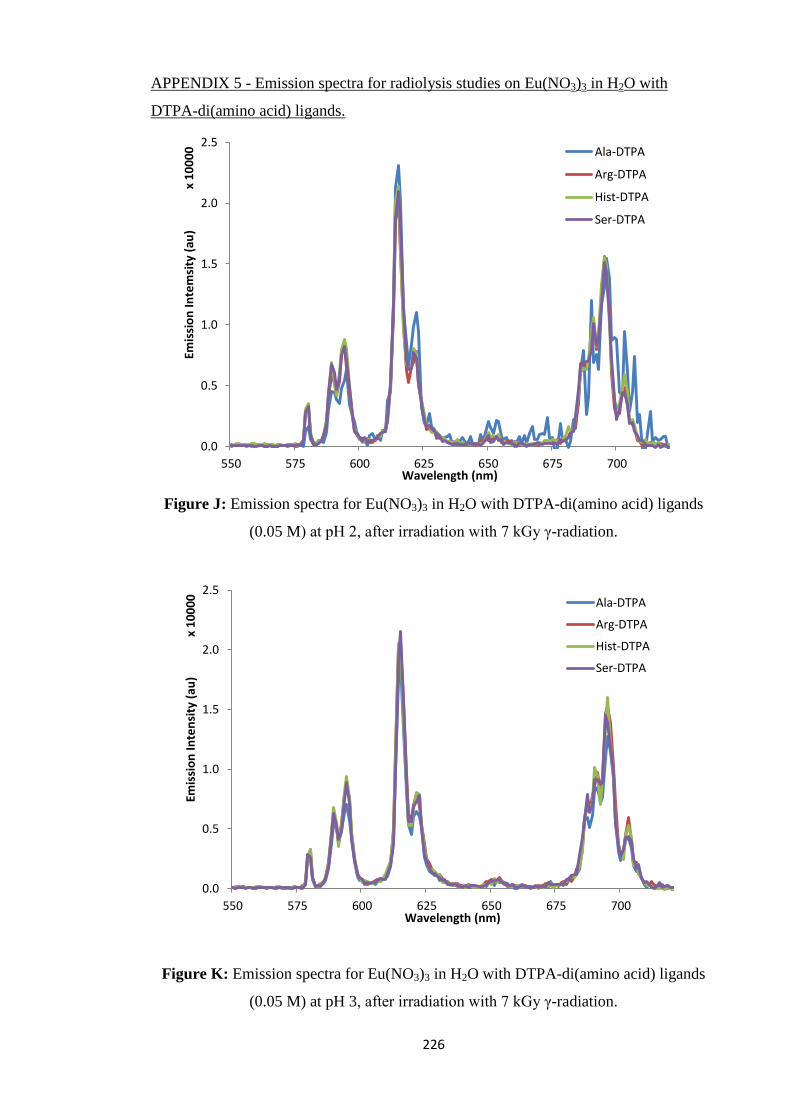


Recommended