Data Storytelling
From Headline to Climax: Creating an Evocative Data Story

The Brains Behind the Panel
Kerry Edelstein • President and
Founder, Research Narra3ve
• Professional data storyteller
• Research geek with storyteller clients
• Oversubscribed V2V mentor
• Sporadically funny
Sean Monahan • GM and Crea3ve
Director, Westside Corporate Crea3vity
• Professional performer and leadership/ communica3on coach
• Adver3sing professional turned improv ar3st
• Business owner • Funny on command
Sess
ion
Ove
rvie
w
Elisa Camahort Page • Co-‐founder and
research lead at BlogHer (now part of SheKnows Media)
• Founding Fellow of the Society for New Communica3ons Research
• Reality TV Talent Show Armchair Cri3c
Anon Male Editor • Builds news app and
mul3media content using data integra3on
• Leads team of data engineers and designers who develop interac3ve storytelling for a major na3onal media outlet
• Iden3ty to be revealed upon official HQ approval of par3cipa3on

Why this Panel? Se
ssio
n O
verv
iew
Consider this post today at Entrepreneur.com, entitled, “How Analytics and Data Can Undermine Leaders:
Creating narratives from data is a necessary management and content creation skill – and one in which most media and interactive employees aren’t adequately trained.
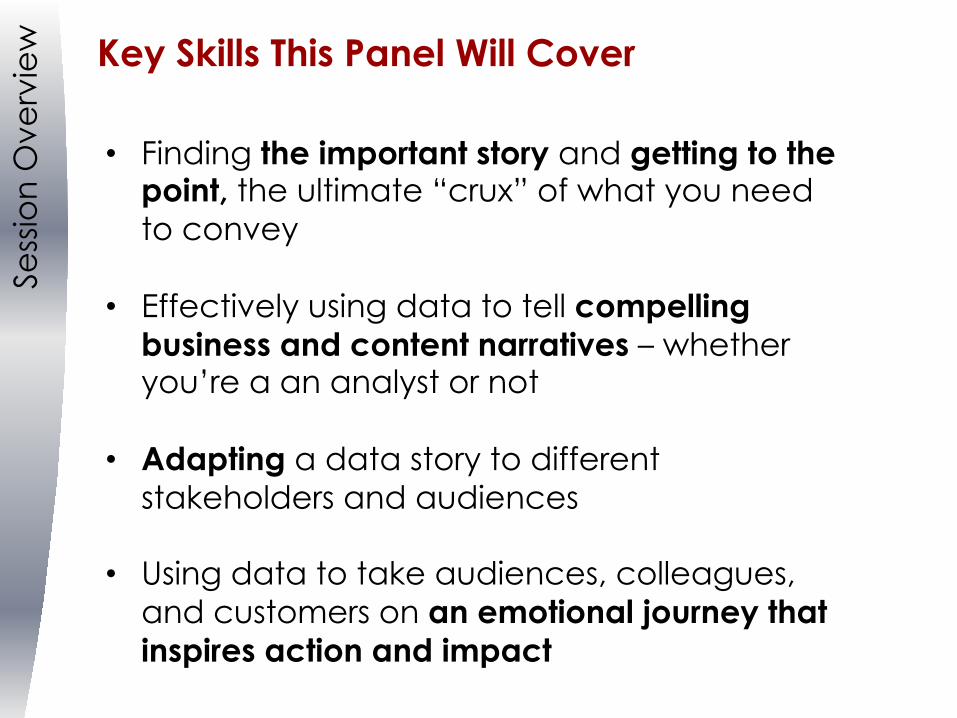
Key Skills This Panel Will Cover Se
ssio
n O
verv
iew
• Finding the important story and getting to the point, the ultimate “crux” of what you need to convey
• Effectively using data to tell compelling
business and content narratives – whether you’re a an analyst or not
• Adapting a data story to different stakeholders and audiences
• Using data to take audiences, colleagues,
and customers on an emotional journey that inspires action and impact

Data storytelling is a three step process. 1. Find the story – designing, searching, and
analyzing
2. Tell the story – developing and communicating a narrative, rational “proof”, relevant insights, and emotional messages
3. Manage the story – communicating effectively and adapting your style as necessary
Our Philosophy: What Makes for a Compelling Data Story?
Sess
ion
Ove
rvie
w

Finding a Data Story Often Means Looking in the Weeds….
Ste
p 1
: Fin
din
g t
he
Sto
ry

…And Then Getting Out of the Weeds and Getting to the Point
Ste
p 1
: Fin
din
g t
he
Sto
ry
Cringeworthy, yes. But this NY Times headline is to the point, and hits home.

Can You Tell Your Story in Six Words?
Ste
p 1
: Fin
din
g t
he
Sto
ry

In Finding Your Data Story, Ask Yourself:
Ste
p 1
: Fin
din
g t
he
Sto
ry
• How does this matter to our business?
• Why will my audience care?

You’ve Found the Story. Telling it Begins with Thinking Like a Storyteller.
• Who’s your audience?
• What is your main theme?
• How can your story create tension and then lead to payoff? What are the stakes?
• How have you paced your story?
• How are you moving your story forward?
• What feeling are you creating? What are your emotional hooks?
• How are you visually engaging audiences?
• What is your end destination?
Tip: “Storyboard” your
own report by starting with an
outline
Ste
p 2
: Te
llin
g t
he
Sto
ry

As a Data Storyteller, Emotion is Your Ally
Emotion… Ø Drives engagement Ø Creates memory Ø Humanizes the
storyteller
Your toolkit Ø Emotional hook Ø Universal truth Ø Tension points Ø Payoff
Ste
p 2
: Te
llin
g t
he
Sto
ry

Data Visualization: It’s More Than Dashboards and Interactive Charts
….like John Oliver.
Ste
p 2
: Te
llin
g t
he
Sto
ry
We can learn from unconventional data storytellers…

What is your personality as a data storyteller? Whatever it is: own it. • Humor • Uniqueness • Action/Energy • Shock value • Intellect • Trust • Charisma • Passion
We All Have a Voice, But What is It? St
ep
2: T
elli
ng
th
e S
tory
Funny And also though/ul

The story fat we mean. Because cookies are delicious.
Every Story Needs a Final Edit: Learn to Cut the Fat
“You can have the rest of this cookie.”
Ste
p 2
: Te
llin
g t
he
Sto
ry

You can read 12 pt font from the back of the room, right?
And Remember: The Way You Tell the Story Should Align with Where You’re Telling it
We once attended a
presentation in wh
ich the
lead presenter put
three
paragraphs up on a
slide and
then proceeded to
present to
a room full of exe
cutives.
While we appreciat
e story
exposition, a live
presentation is no
t the venue
for expansive visu
al prose.
You’re talking to
a room, not
writing an academi
c journal.
And the audience p
robably
came to hear what
you have to
say. If they’re re
ading,
they’re neither li
stening nor
paying attention.
Once upon a time an analyst spent 25 minutes explaining methodology and then ran out of time.
I wonder what he learned.
Ste
p 2
: Te
llin
g t
he
Sto
ry

But Wait, You’re Not Done! Now It’s Time to Manage the Story.
• The story doesn’t end when you deliver it.
• How are others reacting to your story?
• How are you reacting to their reaction?
• What are the dynamics in the room? (On the email chain….or the comments section…) How are you managing them?
Ste
p 3
: Ma
na
gin
g t
he
Sto
ry

Managing the Story Isn’t Always Easy
Sound familiar? • The story is “Your baby’s ugly”
• You’re not a trusted source (Why believe you)?
• You (or someone like you) said “the wrong thing” with this audience in the past
• Your audience has something to lose if you’re right
• What you’re saying costs a lot of money
How can we manage our own reaction, to that reaction?
How can we soften reactions such as defensiveness, anger, distrust?
Ste
p 3
: Ma
na
gin
g t
he
Sto
ry
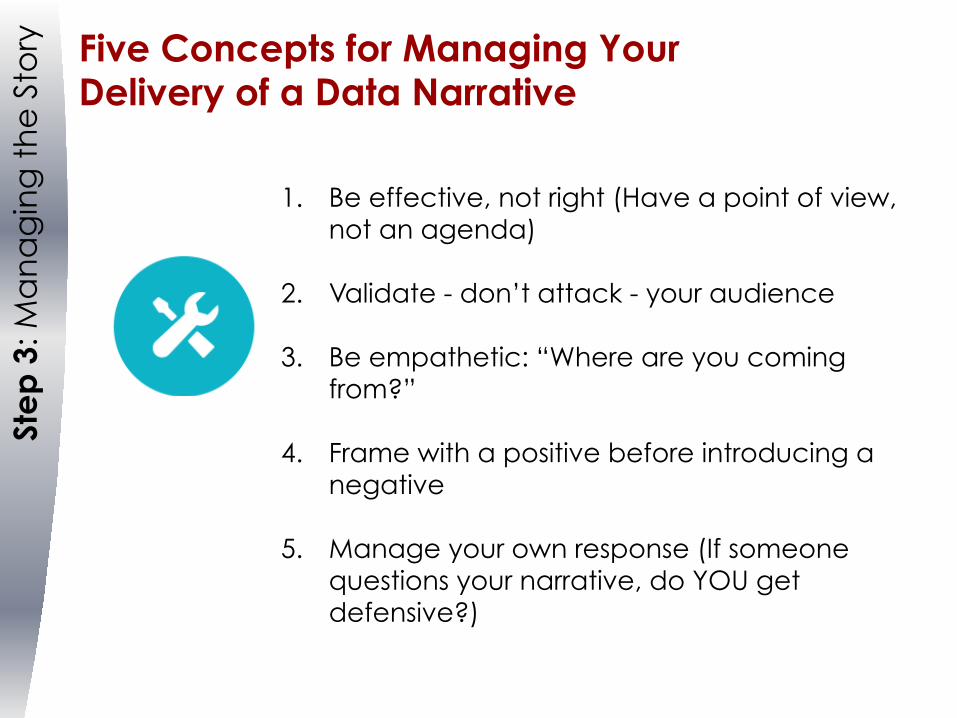
Five Concepts for Managing Your Delivery of a Data Narrative
1. Be effective, not right (Have a point of view, not an agenda)
2. Validate - don’t attack - your audience
3. Be empathetic: “Where are you coming from?”
4. Frame with a positive before introducing a negative
5. Manage your own response (If someone questions your narrative, do YOU get defensive?)
Ste
p 3
: Ma
na
gin
g t
he
Sto
ry

Learn these insights and more….
…from 4 different points of view
Data Storytelling
From Headline to Climax: Creating an Evocative Data Story
Our Panel Proposal for SXSW 2016
Recommended