Journal of the Science of Food and Agriculture J Sci Food Agric 79 :107–115 (1999)
Classification of French red wines according totheir geographical origin by the use ofmultivariate analysesHanne K Siverts en,* Borge Holen, Frithjof Nicolays en and Einar Ris vikNorwegian Food Res earch Ins titute ,Os lovn. 1 , N-1430 NorwayA� s ,
Abstract : The aim of this study was to obtain detailed descriptions and to classify 22 red wines from
four main wine regions in France based on both sensory and chemical analyses. The chemical data
included major acids, alcohols, esters, pH, total phenols and colour. Seventeen attributes were
included in the sensory data; twelve analytical and üve complex descriptions. A description of the
wines from the diþ erent French wine regions was obtained. A better classiücation, based on the
chemical data set, was achieved; 81.8% correctly classiüed wines, versus 63.6% based on the sensory
data set. A better choice of sensory attributes and a well trained panel can improve the correlation
between sensory descriptions and chemical analyses.
1999 Society of Chemical Industry(
Keywords: French red wines ; geographical origin ; classiücation; sensory ; chemical ; principal componentanalysis ; canonical discriminant analysis
INTRODUCTION
Wine is a product which contains numerous chemicalcompounds depending on the grape variety andmaturity, climate and soil of the viticultural area andviticultural and viniücation techniques. This causes avery large variation in qualities. The quality manage-ment function, dedicated to measuring conformanceto requirements and reporting any diþerences accu-rately, demands great eþorts in wine appraisal.
Sensory evaluation by expert wine tasters is usedto distinguish wines of great diversity that do notconform to reference groups, deüned as qualitywines produced in a speciüed wine region as given inthe EU legislation. In commercial wine handling,sensory assessment is not necessarily done from adescriptive analysis. Such assessment has a moresubjective character suitable for wine buyers, but oflittle value for corrective action in wine making orrapid training of new assessors.
Instrumental methods are precise and repro-ducible, but are not sufficient for a quality evaluationof wines to meet customer needs. Descriptivesensory analysis is a useful and complementary toolfor describing diþerences in wines and to reveal non-conformance to speciücations.
Several studies have been performed in order toclassify wines according to their geographical originor vintage year based on chemical analysis of volatilearoma components.1h6 Kwan and Kowalski7 classi-üed wines according to their origin and vintage
based on elemental composition, alcohols, total acids,solids and ash. Day et al8 used joint analysis of ele-mental and isotropic composition to diþerentiatewines. Seeber et al9 included amino acids in additionto volatile compounds to classify wines of the samevariety according to vintage. Etie� vant et al10,11 uti-lised data based on pigments and ýavonoid elements,amino acids, aromatic alcohols and major acids toclassify French red wines according to their geo-graphical origin.
Few studies have utilised sensory data alone or inaddition to chemical data, to discriminate amongwines according to their geographical origin.Heymann and Noble12 studied the information fromdescriptive analysis of commercial wines by compar-ing conügurations provided from principal com-ponent analysis (PCA) and canonical variate analysis(CVA). Guinard and Cliþ13 used PCA to comparesensory descriptions on Pinot Noir from three wineregions in California. Baumes et al14 and Rapp15used sniþ detectors to correlate sensory odours tochemical compounds.
The purpose of this study was to obtain sufficientinformation from both descriptive analysis andchemical analyses to be able to classify red winesfrom four diþerent geographical regions in France,and to describe similar and discriminating sensoryand chemical characteristics for these regions. PCAand canonical discriminate analysis (CDA) wereapplied to evaluate similarities between wines from
* Corres pondence to : Hanne K Siverts en, Norwegian Food Re-s earch Ins titute, Os lovn. 1, N-1430 NorwayA� s ,Contract/grant s pons or : A/S Vinmonopolet
(Received 5 January 1998; revis ed vers ion received 15 April
1998 ; accepted 8 June 1998)
( 1999 Society of Chemical Industry. J Sci Food Agric 0022-5142/99/$17.50 107
HK Sivertsen et al
the same region of origin and main diþerencesbetween wines from the diþerent regions, respec-tively.
MATERIALS AND METHODS
Wines
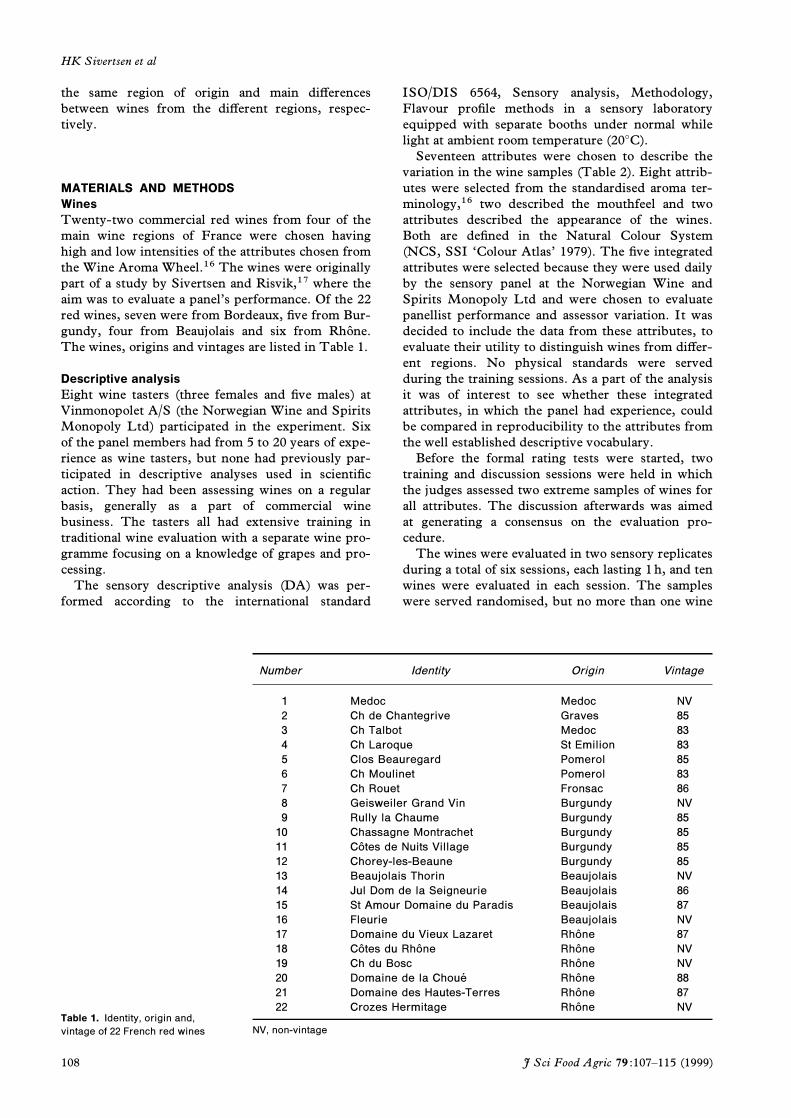
Twenty-two commercial red wines from four of themain wine regions of France were chosen havinghigh and low intensities of the attributes chosen fromthe Wine Aroma Wheel.16 The wines were originallypart of a study by Sivertsen and Risvik,17 where theaim was to evaluate a panel’s performance. Of the 22red wines, seven were from Bordeaux, üve from Bur-gundy, four from Beaujolais and six from Rhoü ne.The wines, origins and vintages are listed in Table 1.
Descriptive analysis
Eight wine tasters (three females and üve males) atVinmonopolet A/S (the Norwegian Wine and SpiritsMonopoly Ltd) participated in the experiment. Sixof the panel members had from 5 to 20 years of expe-rience as wine tasters, but none had previously par-ticipated in descriptive analyses used in scientiücaction. They had been assessing wines on a regularbasis, generally as a part of commercial winebusiness. The tasters all had extensive training intraditional wine evaluation with a separate wine pro-gramme focusing on a knowledge of grapes and pro-cessing.
The sensory descriptive analysis (DA) was per-formed according to the international standard
ISO/DIS 6564, Sensory analysis, Methodology,Flavour proüle methods in a sensory laboratoryequipped with separate booths under normal whilelight at ambient room temperature (20¡C).
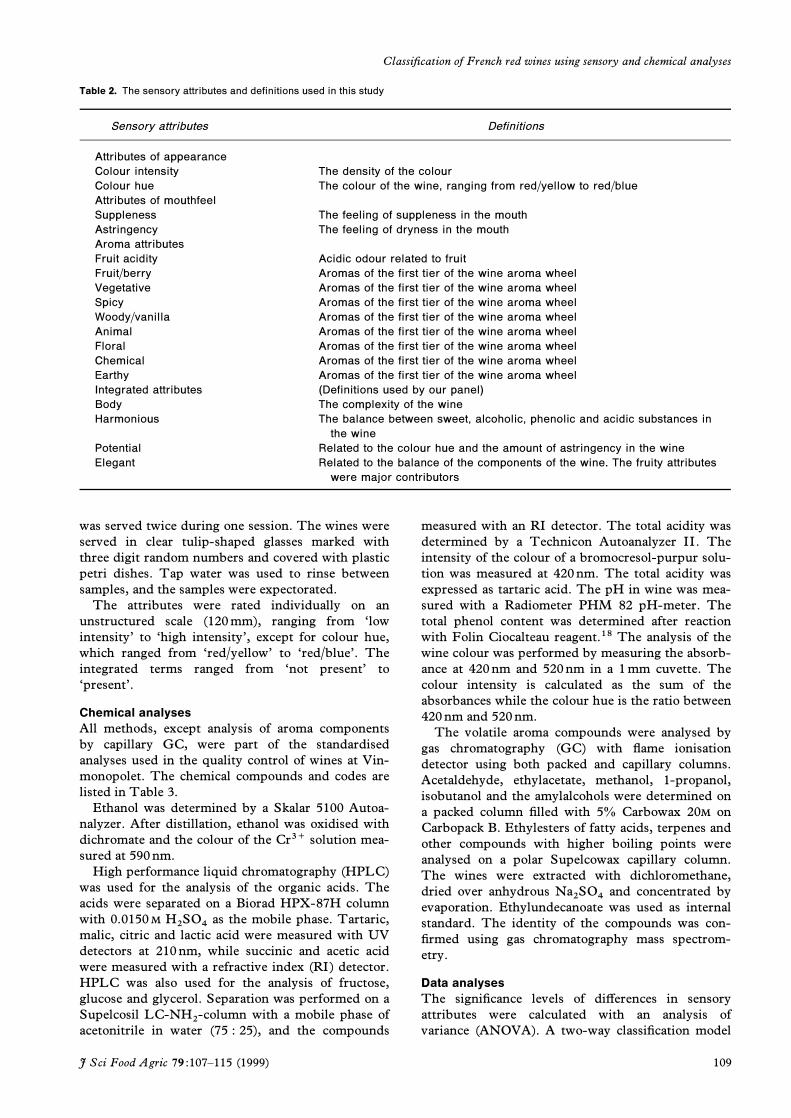
Seventeen attributes were chosen to describe thevariation in the wine samples (Table 2). Eight attrib-utes were selected from the standardised aroma ter-minology,16 two described the mouthfeel and twoattributes described the appearance of the wines.Both are deüned in the Natural Colour System(NCS, SSI ‘Colour Atlas’ 1979). The üve integratedattributes were selected because they were used dailyby the sensory panel at the Norwegian Wine andSpirits Monopoly Ltd and were chosen to evaluatepanellist performance and assessor variation. It wasdecided to include the data from these attributes, toevaluate their utility to distinguish wines from diþer-ent regions. No physical standards were servedduring the training sessions. As a part of the analysisit was of interest to see whether these integratedattributes, in which the panel had experience, couldbe compared in reproducibility to the attributes fromthe well established descriptive vocabulary.
Before the formal rating tests were started, twotraining and discussion sessions were held in whichthe judges assessed two extreme samples of wines forall attributes. The discussion afterwards was aimedat generating a consensus on the evaluation pro-cedure.
The wines were evaluated in two sensory replicatesduring a total of six sessions, each lasting 1h, and tenwines were evaluated in each session. The sampleswere served randomised, but no more than one wine
Number Identity Origin Vintage
1 Medoc Medoc NV
2 Ch de Chantegrive Graves 85
3 Ch Talbot Medoc 83
4 Ch Laroque St Emilion 83
5 Clos Beauregard Pomerol 85
6 Ch Moulinet Pomerol 83
7 Ch Rouet Frons ac 86
8 Geis weiler Grand Vin Burgundy NV
9 Rully la Chaume Burgundy 85
10 Chas s agne Montrachet Burgundy 85
11 Coü tes de Nuits Village Burgundy 85
12 Chorey-les -Beaune Burgundy 85
13 Beaujolais Thorin Beaujolais NV
14 Jul Dom de la Seigneurie Beaujolais 86
15 St Amour Domaine du Paradis Beaujolais 87
16 Fleurie Beaujolais NV
17 Domaine du Vieux Lazaret Rhoü ne 87
18 Coü tes du Rhoü ne Rhoü ne NV
19 Ch du Bos c Rhoü ne NV
20 Domaine de la Choue� Rhoü ne 88
21 Domaine des Hautes -Terres Rhoü ne 87
22 Crozes Hermitage Rhoü ne NV
NV, non-vintageTable 1. Identity, origin and,
vintage of 22 French red wines
108 J Sci Food Agric 79 :107–115 (1999)
Classiücation of French red wines using sensory and chemical analyses
Table 2. The s ens ory attributes and definitions us ed in this s tudy
Sens ory attributes Definitions
Attributes of appearance
Colour intens ity The dens ity of the colour
Colour hue The colour of the wine, ranging from red/yellow to red/blueAttributes of mouthfeel
Supplenes s The feeling of s upplenes s in the mouth
As tringency The feeling of drynes s in the mouth
Aroma attributes
Fruit acidity Acidic odour related to fruit
Fruit/berry Aromas of the firs t tier of the wine aroma wheel
Vegetative Aromas of the firs t tier of the wine aroma wheel
Spicy Aromas of the firs t tier of the wine aroma wheel
Woody/vanilla Aromas of the firs t tier of the wine aroma wheel
Animal Aromas of the firs t tier of the wine aroma wheel
Floral Aromas of the firs t tier of the wine aroma wheel
Chemical Aromas of the firs t tier of the wine aroma wheel
Earthy Aromas of the firs t tier of the wine aroma wheel
Integrated attributes (Definitions us ed by our panel)
Body The complexity of the wine
Harmonious The balance between s weet, alcoholic, phenolic and acidic s ubs tances in
the wine
Potential Related to the colour hue and the amount of as tringency in the wine
Elegant Related to the balance of the components of the wine. The fruity attributes
were major contributors
was served twice during one session. The wines wereserved in clear tulip-shaped glasses marked withthree digit random numbers and covered with plasticpetri dishes. Tap water was used to rinse betweensamples, and the samples were expectorated.
The attributes were rated individually on anunstructured scale (120mm), ranging from ‘lowintensity’ to ‘high intensity’, except for colour hue,which ranged from ‘red/yellow’ to ‘red/blue’. Theintegrated terms ranged from ‘not present’ to‘present’.
Chemical analyses
All methods, except analysis of aroma componentsby capillary GC, were part of the standardisedanalyses used in the quality control of wines at Vin-monopolet. The chemical compounds and codes arelisted in Table 3.
Ethanol was determined by a Skalar 5100 Autoa-nalyzer. After distillation, ethanol was oxidised withdichromate and the colour of the Cr3` solution mea-sured at 590nm.
High performance liquid chromatography (HPLC)was used for the analysis of the organic acids. Theacids were separated on a Biorad HPX-87H columnwith 0.0150M as the mobile phase. Tartaric,H2SO4malic, citric and lactic acid were measured with UVdetectors at 210nm, while succinic and acetic acidwere measured with a refractive index (RI) detector.HPLC was also used for the analysis of fructose,glucose and glycerol. Separation was performed on aSupelcosil with a mobile phase ofLC-NH2-columnacetonitrile in water (75 : 25), and the compounds
measured with an RI detector. The total acidity wasdetermined by a Technicon Autoanalyzer II. Theintensity of the colour of a bromocresol-purpur solu-tion was measured at 420nm. The total acidity wasexpressed as tartaric acid. The pH in wine was mea-sured with a Radiometer PHM 82 pH-meter. Thetotal phenol content was determined after reactionwith Folin Ciocalteau reagent.18 The analysis of thewine colour was performed by measuring the absorb-ance at 420nm and 520nm in a 1mm cuvette. Thecolour intensity is calculated as the sum of theabsorbances while the colour hue is the ratio between420nm and 520nm.
The volatile aroma compounds were analysed bygas chromatography (GC) with ýame ionisationdetector using both packed and capillary columns.Acetaldehyde, ethylacetate, methanol, 1-propanol,isobutanol and the amylalcohols were determined ona packed column ülled with 5% Carbowax 20M onCarbopack B. Ethylesters of fatty acids, terpenes andother compounds with higher boiling points wereanalysed on a polar Supelcowax capillary column.The wines were extracted with dichloromethane,dried over anhydrous and concentrated byNa2SO4evaporation. Ethylundecanoate was used as internalstandard. The identity of the compounds was con-ürmed using gas chromatography mass spectrom-etry.
Data analyses
The signiücance levels of diþerences in sensoryattributes were calculated with an analysis ofvariance (ANOVA). A two-way classiücation model
J Sci Food Agric 79 :107–115 (1999) 109
HK Sivertsen et al
Table 3. Chemical compounds
Number Chemical compound Units Code
1 Ethanol vol% ethanol
2 Ethylacetate mg lÉ1 etylac
3 Acetic acid g lÉ1 acetac
4 Total acidity g lÉ1 totacid
5 Citric acid g lÉ1 citricac
6 Tartaric acid g lÉ1 tartacid
7 Malic acid g lÉ1 malicac
8 Lactic acid g lÉ1 lacticac
9 Glycerol g lÉ1 glycerol
10 pH pH
11 Total phenol g lÉ1 totpheno
12 Colour hue colourhue
13 Colour intens ity colorint
14 Acetaldehyde mg lÉ1 acetald
15 Succinic acid g lÉ1 s uccac
16 Methanol mg lÉ1 methanol
17 1-propanol mg lÉ1 1-prop
18 Is obutanol mg lÉ1 is obutan
19 Active amylalcohol mg lÉ1 actamal
20 Is oamyl alcohol mg lÉ1 is amal
21 Is oamyl acetate mg lÉ1 is amacet
22 Ethyl hexanoate mg lÉ1 ethhex
23 Lactic acid ethyles ter mg lÉ1 lacaces t
24 1-hexanol mg lÉ1 1hexanol
25 Ethyl octanoate mg lÉ1 ethoctan
26 2,3-butandiol mg lÉ1 23butdi
27 Methylfurfural mg lÉ1 mefurfu
28 Ethyl decanoate mg lÉ1 ethdec
29 Diethyl s uccinate mg lÉ1 s ucacdie
30 Ethyl dodecanoate mg lÉ1 etdodec
31 2-phenylethanol mg lÉ1 2fenet
32 1-butanol mg lÉ1 1butanol
33 c-butyrolactone mg lÉ1 butyrola
34 3-methylthio-1-propanol mg lÉ1 1pro3met
35 Hexanoic acid mg lÉ1 hexanoac
was used with main eþects and interaction betweenthe wines and the assessors, where the assessors wereregarded as a random eþect. The ANOVA was per-formed by the General Linear Models Procedure(GLM)(SAS Institute Inc, Cary, NC, USA).
Principal component analysis (PCA) was used onthe sum of data in two replicates from the assessorsto ünd the major variation in sensory attributes andchemical compounds among the wines. As a vali-dation procedure a full cross-validation was run. ThePCA was performed by the Unscrambler version 5.5(Camo A/S, Trondheim, Norway, 1994).
Canonical discriminant analysis (CDA) was per-formed on the score matrix from the PCA to classifythe wines in four diþerent groups according to theirregion of origin, by procedures in the StatisticalAnalysis System (SAS Institute Inc, Cary, NC,USA). These were utilised on 35 chemical com-pounds ; 20 from the routine analyses and 15 com-pounds from the GC capillary analysis, and on thesensory attributes.
RESULTS AND DISCUSSION
Variability of sensory attributes among the wines
An analysis of variance (ANOVA) (Table 4) per-formed on the individual terms showed that allattributes were rated signiücantly diþerent across thewines at p \ 0.15, except for elegant. This attributewas excluded from further analyses. The other twoattributes were considered to be close to the accept-able limit of p \ 0.05 and therefore included in thedata set.
Evaluation of similar sensory characteristics within
and between wines of different regions
Principal component analysis (PCA) was applied tothe sum of data in two replicates from the assessorsforming the data matrix with 22 wines and 16sensory attributes, and the matrix of the raw datafrom the chemical analyses, with 22 wines and 35variables, in order to visualise and interpret regionaldiþerences. The data was scaled to unit variancebefore calibration.
Scores and loadings of the sensory data were com-bined in Fig 1. Principal components 1 (PC1) and 2(PC2) accounted for 39% and 31%, respectively, ofthe total variability, with a total of 14 interpretableprincipal components from the cross-validation pro-cedure. Table 5 shows the accumulative validatedexplained variance for each sensory attribute afterfour principal components. Most attributes had ahigher percent of explained variance associated withPC1 and PC2, but a few were related to other prin-
Table 4. Analys is of variance of attribute ratings , 22 wines , 8
as s es s ors , 2 s ens ory replicates
Attributes P-value
Wine As s es s or]wine
Colour intens ity 0.0001 0.4124
Colour hue 0.0001 0.3040
Supplenes s 0.0005 0.5523
As tringency 0.0001 0.3338
Fruit acidity 0.0001 0.4382
Fruit/berry aroma 0.0001 0.8693
Vegetative aroma 0.0001 0.1228
Spicy aroma 0.1171 0.2520
Woody/vanilla aroma 0.0001 0.9816
Animal aroma 0.0001 0.4598
Floral aroma 0.0001 0.5483
Chemical aroma 0.0716 0.6022
Earthy aroma 0.0003 0.2857
Body 0.0001 0.5324
Harmonious 0.0237 0.9453
Potential 0.0001 0.0806
Elegant 0.9729 0.7092
df 21 147
110 J Sci Food Agric 79 :107–115 (1999)
Classiücation of French red wines using sensory and chemical analyses
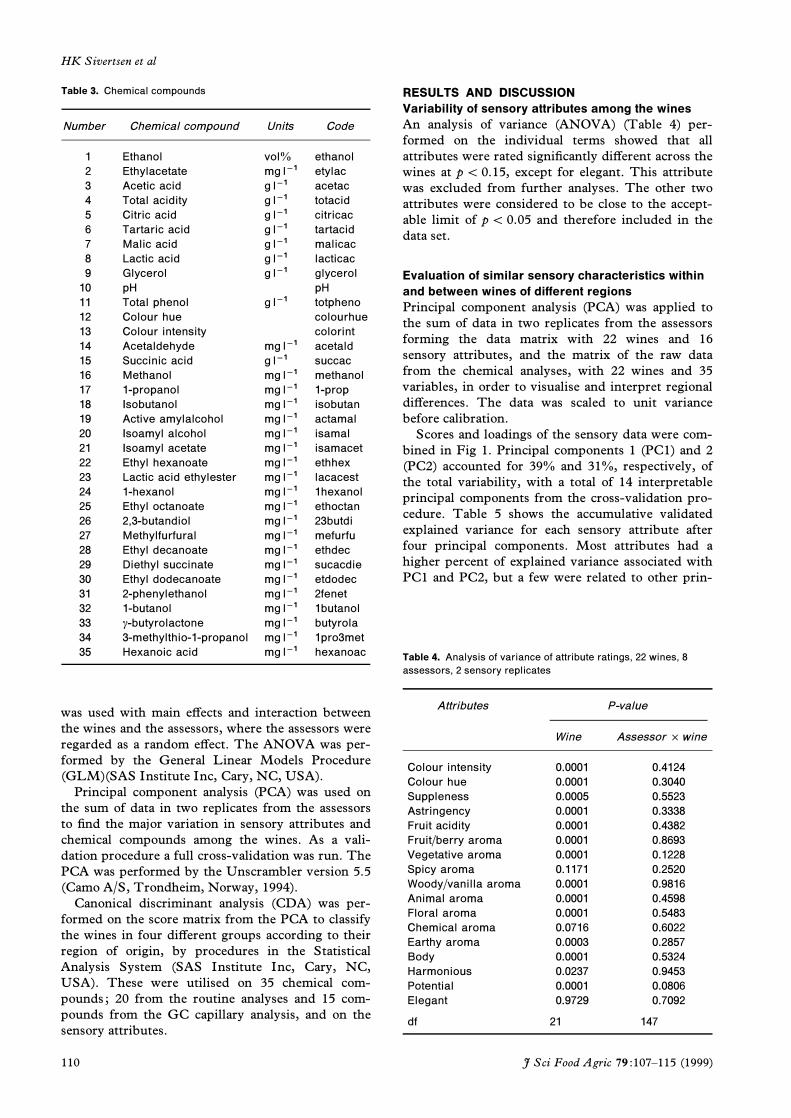
Figure 1. PCA s cores and loadings of the s ens ory data, 22 wines ,
11 panellis ts , 16 s ens ory attributes , 2 replicates , for principal
component 1 and 2. The numbers are explained in Table 1.
cipal components ; suppleness (PC3); vegetativearoma (PC4), and harmonious (PC3). Only PC1 andPC2 will be presented in this study, since only 13%of the explained variance was found in the remainingtwo principal components. The pattern found inthese results can be interpreted as an underlining ofwhat can be seen in the plot of PC1 and PC2.
From the initial PCA the wines were not clearlydivided into their regions of origin (Fig 1), but arough division can be seen in the plot. The Bordeauxwines can be described as rich in the woody, vanillaand animal aromas, partly earthy aroma, but also thespicy and vegetative aromas. They were described asastringent, with a strong colour intensity. A subdivi-sion of the Bordeaux wines due to vintage can beseen along PC2. The older wines (3, 4 and 6) wereassociated with the attributes woody, vanilla an
Table 5. Accumulative validated explained variance for each
s ens ory attribute with one to four principal components (PCA)
Sens ory attributes PC1 PC2 PC3 PC4
Colour intens ity 46.5 85.5 84.8 88.3
Colour hue 16.5 92.8 93.3 93.0
As tringency 43.2 78.1 78.1 86.6
Fruit acidity 28.3 79.2 86.2 85.8
Fruit/berry aroma 46.3 86.6 89.0 88.2
Vegetative aroma 33.7 36.8 33.2 90.2
Spicy aroma 41.7 56.0 52.8 52.5
Wood/vanilla aroma 69.9 76.2 83.6 86.9
Animal aroma 74.5 82.6 81.7 80.4
Floral aroma 58.5 77.9 77.4 76.6
Chemical aroma 1.8 53.7 68.5 73.9
Supplenes s 7.7 45.8 84.1 86.2
Earthy aroma 56.8 54.1 51.0 52.7
Body 78.4 89.8 89.2 93.2
Harmonious 0.0 26.9 90.3 90.8
Potential 16.5 91.6 91.0 90.6
chemical, while the younger wines (1, 2, 5 and 7)were associated with colour intensity, spicy, vegeta-tive, potential and body.
The majority of the Rhoü ne wines were describedas fruity, ýoral and with a stronger fruit acidity and amore red/blue colour hue than the other wines. TheBeaujolais and Burgundy wines showed commonalitywith suppleness and a chemical aroma.
The wines described by chemical constituents
Table 6 shows the accumulative explained variancefor each chemical constituent by four principal com-ponents. The four components accounted for 17, 19,12 and 7% of the explained variance, respectively,55% of the total explained variance. Thirteen prin-cipal components were optimal from the cross-validation procedure. The chemical constituentswere mainly associated with PC1 and PC2, but PC3was also of some importance. In general, most of the
Table 6. Accumulative validated explained variance for each
chemical compound with one to four principal components (PCA)
Chemical compounds PC1 PC2 PC3 PC4
Ethanol 0.0 0.0 30.1 30.1
Ethylacetate 54.8 52.6 71.9 70.7
Acetic acid 53.7 57.4 56.7 54.2
Total acidity 0.0 30.6 33.0 57.7
Citric acid 15.2 13.7 19.0 26.9
Tartaric acid 40.4 40.3 39.9 50.2
Malic acid 0.0 0.0 0.3 1.5
Lactic acid 21.7 23.0 19.2 16.4
Glycerol 27.3 27.6 64.5 66.0
pH 35.8 44.8 41.8 70.2
Total phenol 20.4 59.0 56.9 55.7
Colour hue 23.3 19.4 47.0 44.6
Colour intens ity 25.8 48.6 63.0 61.1
Acetaldehyde 0.0 0.0 12.9 14.7
Succinic acid 0.0 3.3 11.9 23.0
Methanol 7.1 58.3 60.5 62.3
1-propanol 0.0 36.6 57.1 61.5
Is obutanol 0.0 0.6 1.8 0.0
Active amylalcohol 0.0 65.3 82.9 88.5
Is oamyl alcohol 0.0 57.5 79.3 81.8
Is oamyl acetate 9.4 12.8 46.8 60.5
Ethyl hexanoate 0.0 69.5 90.9 90.5
Lactic acid ethyles ter 33.7 85.1 85.1 91.6
1-hexanol 29.8 47.2 59.5 65.1
Ethyl octanoate 0.0 49.8 61.6 63.4
2,3-butandiol 33.5 76.1 85.0 88.5
Methylfurfural 35.2 82.2 84.1 84.3
Ethyl decanoate 0.0 13.0 9.1 71.5
Diethyl s uccinate 47.4 49.2 47.9 54.6
Ethyl dodecanoate 0.0 8.1 3.2 54.9
2-phenylethanol 18.1 42.2 86.1 89.1
1-butanol 44.3 68.3 83.3 82.3
c-butyrolactone 36.1 32.8 40.2 45.4
3-methylthio-1-propanol 15.4 19.4 61.5 74.2
Hexanoic acid 6.3 2.0 1.5 0.0
J Sci Food Agric 79 :107–115 (1999) 111
HK Sivertsen et al
constituents connected to the other principal com-ponents can be seen as underlying phenomena ofwhat can be seen in PC1 and PC2. PC1 and PC2 willbe discussed in more detail.
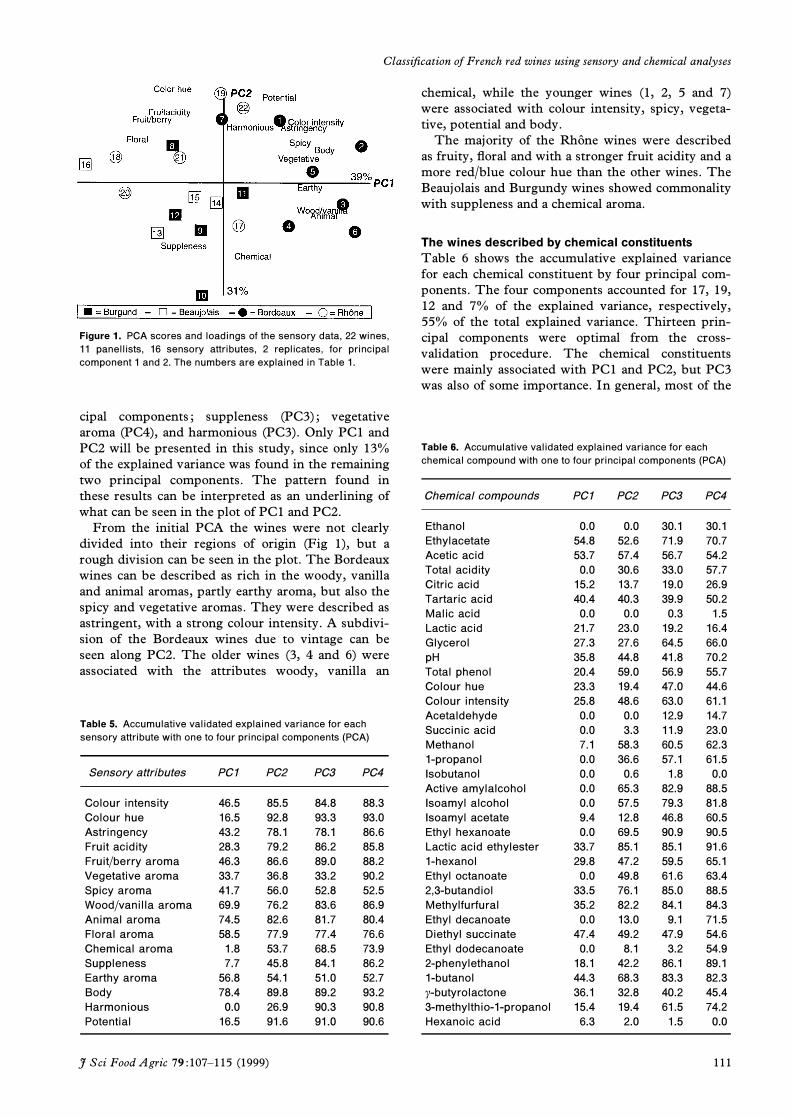
Figure 2 shows the grouping of the wines associ-ated with PC1 and PC2. The Bordeaux wines wereclearly separated from wines from the other regions.According to the loading values (Fig 3) the Bordeauxwines were described as rich in amylalcohols, meth-anol, total phenols, 2-phenylethanol, 3-methylthio-1-propanol, colour intensity, acetic acid and glycerol.They also had a higher pH than the other wines. TheBurgundy wines were separated from the Rhoü ne andthe Beaujolais wines, but not as distinctly as for theBordeaux wines. These wines were correlated with
Figure 2. PCA s cores of the chemical data, 22 wines , 11 panel-
lis ts , 35 chemical components , for principal component 1 and 2.
The wine numbers are identified in Table 1.
Figure 3. PCA loadings of the chemical data, 22 wines , 11 panel-
lis ts , 35 chemical components , for principal component 1 and 2.
The codes are explained in Table 3.
the loadings of ethyl hexanoate, lactic acid ethylester,methylfurfural, 2,3-butandiol, 1-hexanol and 1-propanol. The Beaujolais wines and the majority ofthe Rhoü ne wines were correlated to the loadings oftartaric acid, citric acid and ethyl octanoate, isoamylacetate and total acidity. Chemical constituents withloading values centred around the origin were notwell explained by these principal components.
The PCA scores of both the sensory and chemicaldata (PC1 and PC2) (Figs 1 and 2), show similar pat-terns. The Bordeaux wines were described with alarger number of attributes than the other wines,both from a sensory and a chemical point of view.
The suppleness of the Burgundy wines (Fig 1) canbe linked to a low amount of total phenols (Fig 3),since small amounts of phenols in the wine contrib-ute to a softer mouthfeel. In addition to beingsupple, the Beaujolais wines were described with ahigher intensity of the ýoral aromas. The highamount of esters associated with these wines is animportant contribution to such aromas. The colourhue associated with the Rhoü ne wines is negativelycorrelated to the chemical analyses of colour hue,corresponding to low instrumental values, indicatinga red/blue colour hue. High instrumental valuesindicate red/yellow colour hue.
By applying canonical discriminant analysis it waspossible to examine in detail the attributesresponsible for discriminating between groups, inthis case the geographic origin of the wines.
Canonical discriminant analysis of sensory and
chemical data
The canonical discriminant analysis (CDA) was per-formed on the score matrix from PCA in order toclassify the wines according to their geographicalorigin and to interpret the characteristics discrimi-nating among the regions, based on both sensory andchemical analyses. Twelve principal componentsgave the most optimal classiücation of the wines,based on the sensory data set, and six principal com-ponents based on the chemical data set. Tables 7 and8 show the number (percent in parentheses) of winesclassiüed into the four regions, for the sensory andchemical data, respectively. A total of 81.8% of thewines were correctly classiüed by the chemicalanalyses, and 63.6% by the sensory analysis. Chemi-cally, the Bordeaux wines were associated with theRhoü ne wines, while they were associated with theBurgundy wines according to the sensory evalu-ations. It is possible that some aromas common toboth groups of wines were important contributors to
Group 1 Bordeaux Burgundy Beaujolais Rhoü ne
1 5 (71.4) 2 (28.6) 0 0
2 0 4 (80.0) 1 (20.0) 0
3 0 0 2 (50.0) 2 (50.0)
4 0 0 3 (50.0) 3 (50.0)
Table 7. Number (percent in
parenthes es ) of correctly
clas s ified wines into each group
of wine regions
112 J Sci Food Agric 79 :107–115 (1999)
Classiücation of French red wines using sensory and chemical analyses
Group Bordeaux Burgundy Beaujolais Rhoü ne
1 5 (71.4) 0 0 2 (28.6)
2 0 4 (80.0) 0 1 (20.0)
3 0 0 4 (100.0) 0
4 0 1 (16.7) 0 5 (83.3)
Table 8. Number (percent in
parenthes es ) of correctly
clas s ified wines into each wine
region
the sensory evaluation, while the chemical intensitiesfor these attributes were low, and the opposite.
Figure 4 shows the ürst and second canonicalvariate of the sensory data, Fig 5 shows the ürst andsecond canonical variate of the scores of the chemicaldata set, and Fig 6 presents the ürst and the secondcanonical variate of the loadings of the chemical dataset.
The ürst canonical variate separated the wines intothree distinct regions, both according to the sensoryattributes and the chemical constituents (Figs 4 and5). The second canonical variate separated the Rhoü ne
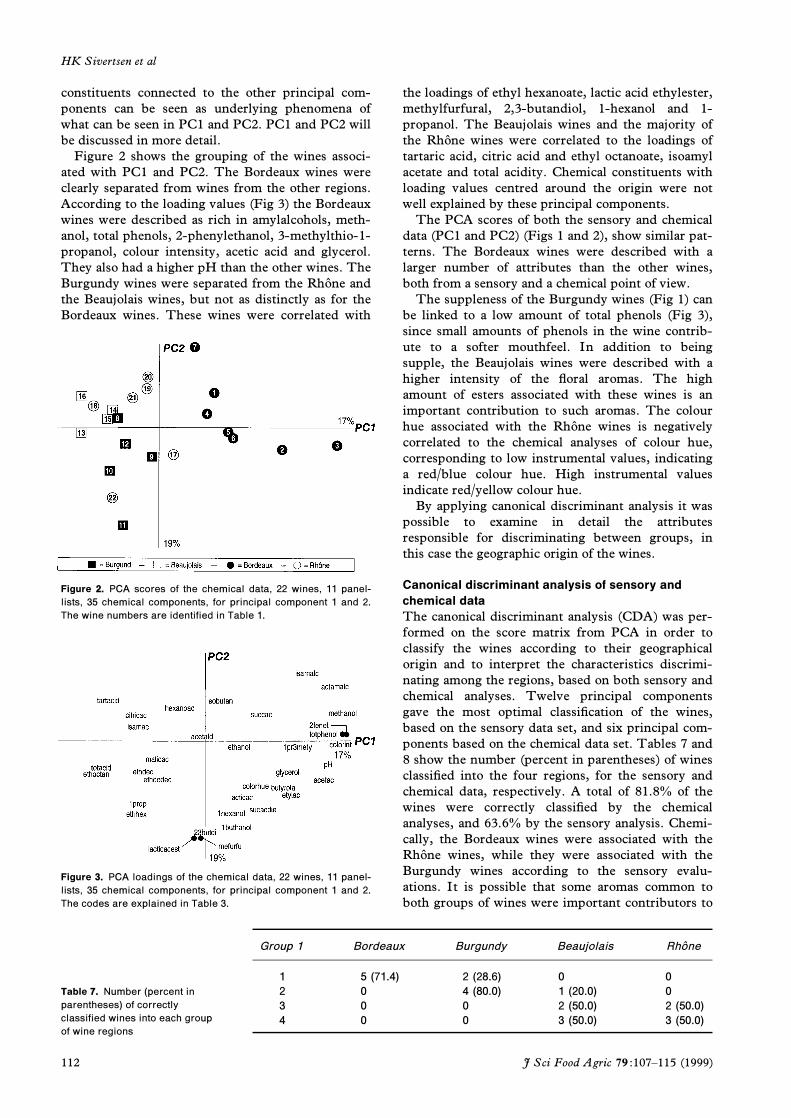
Figure 4. Dis criminant map of the wines and the s ens ory attrib-
utes , 22 wines , 11 panellis ts , 16 s ens ory attributes , 2 replicates ,
for canonical variate 1 and 2. The wine numbers are explained in
Table 1.
Figure 5. Dis criminant map of the wines from the chemical data,
22 wines , 11 panellis ts , 35 chemical components , for canonical
variate 1 and 2. The wine numbers are explained in Table 1.
wines and the Burgundy wines according to thesensory data set, and the Beaujolais wines and theRhoü ne wines, according to the chemical data set.This is well conürmed in Tables 7 and 8.
Figure 4 shows a grouping of the wines accordingtheir region of origin based on a few sensory attrib-utes. These were the colour attributes, the supple-ness, the fruit/berry, ýoral and earthy aromas, thefruit acidity and the integrated term harmonious.Harmonious and earthy were associated with theBordeaux wines. The Burgundy wines weredescribes as higher in intensity of the ýoral aromaand fruit acidity. The PCA (Fig 1) indicated both theBurgundy and the Beaujolais wines to be supple.According to the CDA, the Beaujolais wines wereperceived as more supple than the Burgundy wines.This indicates that suppleness was an importantfactor to diþerentiate between the Burgundy winesand the Burgundy wines and the Beaujolais wines,while the fruit acidity was an important contributorto the characterisation of the Burgundy wines. Thepoor separation of the Rhoü ne wines from the Beau-jolais wines in the plot may be caused by an impro-per choice of attributes. A more detailed descriptionof, among others, the spicy attributes could give abetter discrimination of wines from these relatedareas.
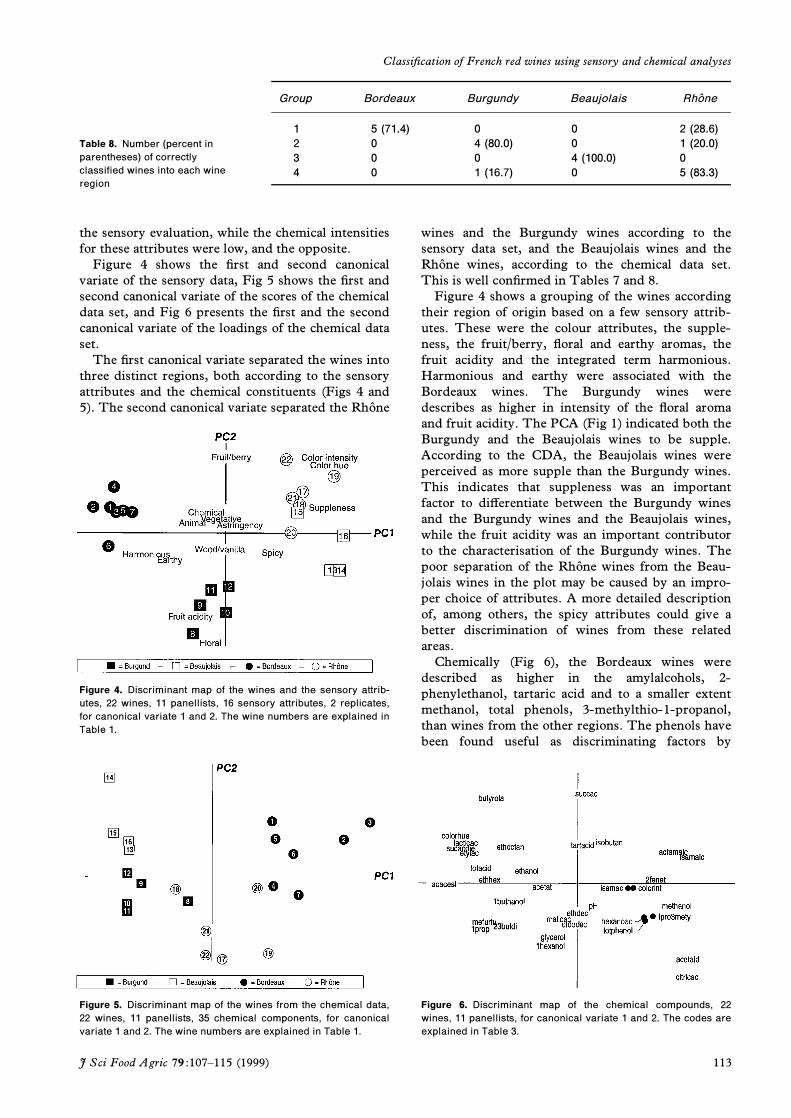
Chemically (Fig 6), the Bordeaux wines weredescribed as higher in the amylalcohols, 2-phenylethanol, tartaric acid and to a smaller extentmethanol, total phenols, 3-methylthio-1-propanol,than wines from the other regions. The phenols havebeen found useful as discriminating factors by
Figure 6. Dis criminant map of the chemical compounds , 22
wines , 11 panellis ts , for canonical variate 1 and 2. The codes are
explained in Table 3.
J Sci Food Agric 79 :107–115 (1999) 113
HK Sivertsen et al
others. In a study of wines from Bordeaux and theNarbonne district, Etie� vant and Schlich found thatcertain types of anthocyanins and some ýavonoidscould be used to discriminate between wines of dif-ferent regions. Forina et al.19 found that phenoliccompounds could diþerentiate among wines from thesame vineyard. In this study the related chemicalconstituents were total phenol and colour intensity.Both according to the PCA and the CDA theseattributes were described as high in intensity for theBordeaux wines, thus contributing to a separation ofthese wines from wines of the other regions. Theonly correlating sensory descriptors of the Bordeauxwines were harmonious and earthy, not colour inten-sity or astringency as expected. Astringency got ahigh score for both the Bordeaux and the Rhoü newines in the PCA. In the CDA the attribute was notconsidered an important discriminating factor, as itwas situated around the centre of the plot. Thecolour intensity was found to be a discriminatingfactor for the Rhoü ne wines, as is indicated in theCDA plot, where it was correlated to the Rhoü newines at the positive part of canonical variate 1, com-pared with the Bordeaux wines, situated on the nega-tive part. In the PCA, both Bordeaux and Rhoü newines were situated on the positive part of PC2, andboth correlating with the attribute.
The Rhoü ne wines were described with a highcontent of citric acid, malic acid, glycerol, 1-hexanol,ethyl dodecanoate and acetaldehyde, and to a smallerdegree hexanoic acid and total phenols. Citric acidwas found by Etie� vant et al.20 to be useful in classi-ücation of production area, but these authors werecritical of the use of acids as discriminating factors,since their concentrations are changed during viniü-cation. Kwan and Kowalski1 found that 2-phenylethanol and 1-hexanol could diþerentiatebetween Pinot Noir wines from France and theUnited States.
The esters diethyl succinate, ethylacetate and ethyloctanoate were indicated to be discriminating factorsfor the Beaujolais wines. This was also the case fortotal acidity, lactic acid, colour hue and c-butyrolactone.
The Burgundy wines were associated with ethylhexanoate, methylfurfural, 1-butanol, 1-propanol,2,3-butandiol, lactic acid ethylester and partly totalacidity. Apart from the 1-hexanol, which was associ-ated with the Rhoü ne wines in the CDA, this was inconformance with the PCA.
CONCLUSIONS
A general description and classiücation of 22 redwines from four diþerent regions of France wereobtained based on both sensory and chemical data. Abetter diþerentiation of the wines was achieved fromthe chemical data set. A better choice of wines andsensory descriptors, and a well trained panel willcontribute to a more detailed and useful correlation
of the sensory and chemical properties of the wines.Further investments in understanding sensory evalu-ation of wine by chemical analyses is therefore annecessary and interesting next step.
ACKNOWLEDGEMENTS
The authors want to express their gratitude to A/SVinmonopolet, the Norwegian Wine & SpiritsMonopoly, for ünancial and practical support. Wewish to thank Randi Sanderud, the lab personnel andthe tasters at A/S Vinmonopolet, for all their help.Also, many thanks to Ulla Dyrnes and TrineRomano, MATFORSK, Norwegian Food ResearchInstitute, for illustrations, and supervisor ProfessorTore for valuable support.HÔyem
REFERENCES1 Kwan WO and Kowalski BR, Pattern recognition analysis of
gas chromatographic data. Geographic classiücation of vinesof Vitis Vinifera cv. Pinot Noir from France and the UnitedStates. Agricultural and Food Chemistry 28 :356–359 (1980).
2 Noble AC, Flath RA and Forrey RR, Wine headspace analysis.Reproducibility and application to varietal classiücation. J
Agric Food Chem 28 :346–353 (1980).3 Marais J , van Rooyen PC and du Plessis CS, Classiücation of
white cultivar wines by origin using volatile aroma com-ponents. S Afr Enol Vitic 2 :45–49 (1981).
4 Schaefer AC, Tas T, Velisek J, Maarse H, ten Noever deBrauw MC and Slump P, Application of pattern recognitiontechniques in the diþerentiation of wines, in Instrumental
Analysis of Foods. Recent Progress. Volume 2, Ed by Chara-lambous G and Inglett G, Academic Press, pp 335–355(1983).
5 Moret I, Di Leo F, Giromini V and Scarponi G, Multiple dis-criminant analysis in the analytical diþerentiation of vene-tian white wines. 4. Application to several vintage years andcomparison with the K nearest-neighbour classiücation. J
Agric Food Chem 32 :329–333 (1984).6 Larrechi MS, Guasch J and Rius FX, The deünition of two
Catalan viticultural regions by classiücation methods. Acta
Alimentara 17 :177–182 (1988).7 Kwan WO and Kowalski BR, Classiücation of wines by apply-
ing pattern recognition to chemical composition data. J Food
Sci 43 :1320–1323 (1978).8 Day MP, Zhang B and Martin GJ, Determination of the geo-
graphical origin of wine using joint analysis of elemental andisotopic composition. II – Diþerentiation of the principalproduction zones in France for the 1990 vintage. J Sci Food
Agric 67 :113–123 (1995).9 Seeber R, Sferlazzo G, Leardi R, Dalla Serra A and Versini G,
Multivariate data analysis in classiücation of musts andwines of the same variety according to vintage year. J Agric
Food Chem 39 :1764–1769 (1991).10 Etie� vant P, Schlich P, Bouvier J-C, Symonds P and Bertrand
A, Varietal and geographic classiücation of French red winesin terms of elements, amino acids and aromatic alcohols. J
Sci Food Agric 45 :25–41 (1988).11 Etie� vant P, Schlich P, Bertrand A, Symonds P and Bouvier
J-C, Varietal and geographic classiücation of French redwines in terms of pigments and ýavonoid compounds. J Sci
Food Agric 42 :39–54 (1988).12 Heymann H and Noble AC, Comparison of canonical variate
and principal component analyses of wine descriptiveanalysis data. J Food Sci 54 :1355–1358 (1989).
13 Guinard JX and Cliþ M, Descriptive analysis of Pinot Noirfrom Cameros, Napa and Sonoma. Am J Enol Vitic 38 :211–215 (1987).
114 J Sci Food Agric 79 :107–115 (1999)
Classiücation of French red wines using sensory and chemical analyses
14 Baumes R, Cordonnier R, Nitz S and Drawert F, Identiüca-tion and determination of volatile constituents in wines fromdiþerent vine cultivars. J Sci Food Agric 37 :927–943 (1986).
15 Rapp A, Natural ýavours of wine correlation between instru-mental analysis and sensory perception. Fresenius J Anal
Chem 33 :777–785 (1990).16 Noble AC, Arnold RA, Buechsenstein J, Leach EJ, Schmidt
JO and Langron SP, Modiücation of a standardized systemof wines aroma terminology. Am J Enol Vitic 38 :143–146(1987).
17 Sivertsen HK and Risvik E, A study of sample and assessorvariation: A multivariate study of wine proüles. J Sensory
Studies 9 :293–312 (1994).
18 Singleton VL and Rossi Jr JA, Colorimetry of total phenolicswith phosphomolybdenium-phosphotungstic acid reagents.Am J Enol Vitic 16 :144–158 (1965).
19 Forina M, Armanino C, Castino M and Ubilgi M, Multi-variate data analysis as a discriminating method of the originof wines. Vitis 25 :189–201 (1986).
20 Etie� vant P, Schlich P, Cantagrel R, Bertrand A and BouvierJ-C, Varietal and geographic classiücation of French redwines in terms of major acids. J Sci Food Agric 46 :421–438(1989).
J Sci Food Agric 79 :107–115 (1999) 115
Recommended