
BioMed CentralBMC Genomics
ss
Open AcceResearch articleFunctional genomic delineation of TLR-induced transcriptional networksRan Elkon†1, Chaim Linhart†2, Yonit Halperin2, Yosef Shiloh1 and Ron Shamir*2Address: 1The David and Inez Myers Laboratory for Genetic Research, Department of Molecular Genetics and Biochemistry, Sackler School of Medicine, Tel Aviv University, Tel Aviv 69978, Israel and 2School of Computer Science, Tel Aviv University, Tel Aviv 69978, Israel
Email: Ran Elkon - [email protected]; Chaim Linhart - [email protected]; Yonit Halperin - [email protected]; Yosef Shiloh - [email protected]; Ron Shamir* - [email protected]
* Corresponding author †Equal contributors
AbstractBackground: The innate immune system is the first line of defense mechanisms protecting thehost from invading pathogens such as bacteria and viruses. The innate immunity responses aretriggered by recognition of prototypical pathogen components by cellular receptors. Prominentamong these pathogen sensors are Toll-like receptors (TLRs). We sought global delineation oftranscriptional networks induced by TLRs, analyzing four genome-wide expression datasets inmouse and human macrophages stimulated with pathogen-mimetic agents that engage variousTLRs.
Results: Combining computational analysis of expression profiles and cis-regulatory promotersequences, we dissected the TLR-induced transcriptional program into two major components: thefirst is universally activated by all examined TLRs, and the second is specific to activated TLR3 andTLR4. Our results point to NF-?B and ISRE-binding transcription factors as the key regulators ofthe universal and the TLR3/4-specific responses, respectively, and identify novel putative positiveand negative feedback loops in these transcriptional programs. Analysis of the kinetics of theinduced network showed that while NF-?B regulates mainly an early-induced and sustainedresponse, the ISRE element functions primarily in the induction of a delayed wave. We furtherdemonstrate that co-occurrence of the NF-?B and ISRE elements in the same promoter endowsits targets with enhanced responsiveness.
Conclusion: Our results enhance system-level understanding of the networks induced by TLRsand demonstrate the power of genomics approaches to delineate intricate transcriptional webs inmammalian systems. Such systems-level knowledge of the TLR network can be useful for designingways to pharmacologically manipulate the activity of the innate immunity in pathological conditionsin which either enhancement or repression of this branch of the immune system is desired.
BackgroundImmune systems in vertebrates have two basic arms:
innate and adaptive immunity. The innate immune sys-tem is the first line of defense protecting the host from
Published: 29 October 2007
BMC Genomics 2007, 8:394 doi:10.1186/1471-2164-8-394
Received: 4 July 2007Accepted: 29 October 2007
This article is available from: http://www.biomedcentral.com/1471-2164/8/394
© 2007 Elkon et al; licensee BioMed Central Ltd. This is an Open Access article distributed under the terms of the Creative Commons Attribution License (http://creativecommons.org/licenses/by/2.0), which permits unrestricted use, distribution, and reproduction in any medium, provided the original work is properly cited.
Page 1 of 16(page number not for citation purposes)
BMC Genomics 2007, 8:394 http://www.biomedcentral.com/1471-2164/8/394
invading pathogens such as bacteria and viruses. It con-sists of various types of leukocytes (e.g., blood monocytes,neutrophils, tissue macrophages, dendritic cells) that spe-cialize in phagocytosis (ingesting and digesting patho-gens) and in evoking a complex response at the site ofinfection, collectively known as inflammation. The adap-tive immunity arm is capable of specifically recognizingand selectively eliminating foreign microorganisms andmolecules. It relies on T and B lymphocytes that expressantigen-specific receptors. Upon encountering their spe-cific antigens, these lymphocytes undergo extensive pro-liferation (clone expansion), maturation and activation.There are multiple cross-talks between the innate andadaptive immunity arms. For example, the phagocyticcells are intimately involved in the activation of the adap-tive arm by functioning as antigen presenting cells (APCs)required for the activation of T lymphocytes, and TH lym-phocytes secrete stimulatory cytokines that enhancephagocytosis by the specialized phagocytic cells.
Innate immune responses to pathogens are triggered byrecognition of prototypical pathogen components, calledpathogen-associated molecular patterns (PAMPs),through cellular pattern recognition receptors (PRRs).Prominent among these pathogen sensors is the family ofToll-like receptors (TLRs). To date, ten and thirteen TLRgenes have been cloned in human and mouse, respec-tively; each of the TLRs appears to recognize a unique setof PAMPs [1,2]. TLR1, 2, 4, 5 and 6 are expressed on thecell surface membrane and recognize bacterial and fungalproducts, while TLR3, 7, 8 and 9 reside in intracellularendosomes and specialize in detection of pathogens'nucleic acids [3]. For example, lipopolysaccharide (LPS),which is a common structure of the cell wall of Gram-neg-ative bacteria, is recognized by the extracellular TLR4,whereas double-stranded RNA (dsRNA), which is a viralPAMP, triggers the intracellular TLR3 signaling. The func-tion of the other TLRs is less characterized.
After recognition of their ligands, TLRs trigger intricate cel-lular signaling pathways that endow the cells with antivi-ral and antibacterial states, which are acquired by theinduction of protein effectors that impede viral replica-tion and bacteria growth, and of inflammatory cytokines,chemokines and co-stimulatory molecules that enhancethe activation of the adaptive immune response [2,4]. Theactivation of this broad response is mediated by a signal-ing cascade that leads to stimulation of several transcrip-tion factors (TFs), primarily NF-?B, IRF3/7, and AP-1.Important among the induced cytokines are the interfer-ons (IFNs), whose secretion results in the induction of aset of IFN-stimulated genes (ISGs), which are vital compo-nents in the development of antiviral and antimicrobialcellular states [5]. The transactivation of the ISGs is con-trolled via the JAK/STAT signaling pathway either by an
IFN?/?-activated TF complex termed ISGF3 (composed ofSTAT1, STAT2 and IRF9), which binds to a regulatory ele-ment denoted as ISRE (IFN-stimulated response element)[5,6], or by an IFN?-activated STAT1 homodimer com-plex, which binds primarily to the GAS regulatory element[7].
The transcriptional program spanned by activated TLRsencompasses hundreds of genes. The advent of geneexpression microarrays and the availability of completesequences of the mouse and human genomes enablestudy of these networks on the system level. Here, we ana-lyzed four publicly available genome-wide datasets thatrecorded expression profiles in mouse and human macro-phages stimulated with various pathogen-mimetic agents,with the goal of obtaining global delineation of the tran-scriptional network activated by TLRs. Combining com-putational analyses of gene expression profiles and cis-regulatory promoter sequences, we dissected the TLR-induced transcriptional program into two major compo-nents: the first is universally activated by all examinedTLRs, and the second is specific to TLR3 and TLR4. Ourresults identify NF-?B as the key regulator of the universalTLR response and the ISRE element as the key control siteof the TLR3/4 specific component, and reveal, on agenomic scale, known and novel target genes regulated bythese elements. We also identify novel putative positiveand negative feedback loops in these transcriptional pro-grams, further increasing the complexity of the knowntightly regulated network induced in response to patho-gen invasion. Analysis of the kinetics of the induced net-work showed that while NF-?B regulates mainly an early-induced and sustained response, the ISRE element func-tions primarily in the induction of a delayed wave. Inaddition, we demonstrate that the pair of NF-?B and ISREelements constitutes a cis-regulatory module that endowsits targets with enhanced responsiveness to TLR3/4 activa-tion. By combining expression and promoter analyses, wesubstantially reduced the high level of noise inherent ingenome-wide analysis of such data, and obtained highlyreliable results supported by independent datasets fromboth human and mouse.
ResultsWe sought to obtain a global view of the transcriptionalprograms that are induced by activated TLRs, and to iden-tify components common to all TLRs and those specific tosome of them. To this end, we used four large-scale geneexpression datasets that examined global response inmouse and human macrophages stimulated with variousTLR stimulators [8-10] (Table 1). Our analysis flow isschematically sketched in Figure 1 and is described indetail in the sections below. In brief, starting with themouse datasets, we first partitioned the induced genesinto disjoint groups according to the subset of stimulators
Page 2 of 16(page number not for citation purposes)

BMC Genomics 2007, 8:394 http://www.biomedcentral.com/1471-2164/8/394
to which the genes were responsive. Applying computa-tional analysis of cis-regulatory promoter elements wesought to discover the major TFs that control each of theidentified response groups. Next, we analyzed the kineticsof the transcriptional network induced by LPS treatment,and identified the TFs that regulate each kinetic pattern.
Finally, we corroborated the results obtained on themouse datasets by demonstrating their validity in inde-pendent human datasets.
Analysis FlowFigure 1Analysis Flow. A schematic sketch of the major steps in our analysis. Using two comprehensive mouse gene expression data-sets, we partitioned the genes into distinct groups according to the subset of TLR stimulators to which they were responsive (A), and identified the TFs that control each response group by computational analysis of cis-regulatory promoter elements. We then characterized three kinetic patterns of the transcriptional network induced by LPS treatment (B), and again discov-ered the TFs that regulate each pattern. A similar analysis of two independent human datasets confirmed our main findings. Integrating the various sources of information points to novel putative targets of the studied TFs, adding new regulatory links to the transcriptional network of the innate immune system.
Indu
ctio
n
Induction & peak time
Early (<2h),Delayed ( 2h)
MmBMM(repeat for MmRAW)
LPS 0-24h
MmBMM+MmRAWAll 6 stimulators
Max{0-4h}
MmRAW MmBMM
�
�
Genesinduced by> 1.8-fold
������
Time
��
��
��
(213 genes)
(1425 genes)
�� �
����������� ���������������
��������������
���
� ������
6 stimulatorsTimepoints: 0-24h# of genes: 15,277 (MmBMM)
11,442 (MmRAW)
������������������������������� ������ �!�"# ���
$%��&��� �����"�� ���
(81 genes)
Analysis was repeated on human datasets:HsM1 (LPS+PIC, 5,215 genes)HsM2 (LPS, 7,981 genes)
Novel TF targets and transcriptional feedback loops:
Table 1: Summary of datasets analyzed in this study
Dataset MmBMM MmRAW HsM1 HsM2
Reference Gilchrist et al. (2006) [8] [11] Nau et al. (2002) [9] Jeffrey et al. (2006) [10]Organism Mouse Mouse Human HumanCells BMM RAW264.7 Mph MphStimulators LPS, CpG, PAM2, PAM3, PIC, R848 LPS, CpG, PAM2, PAM3, PIC, R848 LPS, PIC LPSTime-points 0 h, 20 m, 40 m, 1 h, 80 m, 2 h, 8 h*,
24 h*0 h, 1 h*, 2 h*, 4 h, 8 h*, 24 h* 0 h, 1 h, 2 h, 6 h, 12 h,
24 h0 h, 4 h
Microarray Affymetrix MG430 2.0 Two-channel oligonucleotide chip (Operon)
Affymetrix HU6800 Affymetrix HGU133A
# distinct annotated genes
15,277 11,442 5,215 7,981
Replicates Triplicates Quadrareplicates One (two at time 0 h) Duplicates
* time-points measured only for LPS
Page 3 of 16(page number not for citation purposes)
BMC Genomics 2007, 8:394 http://www.biomedcentral.com/1471-2164/8/394
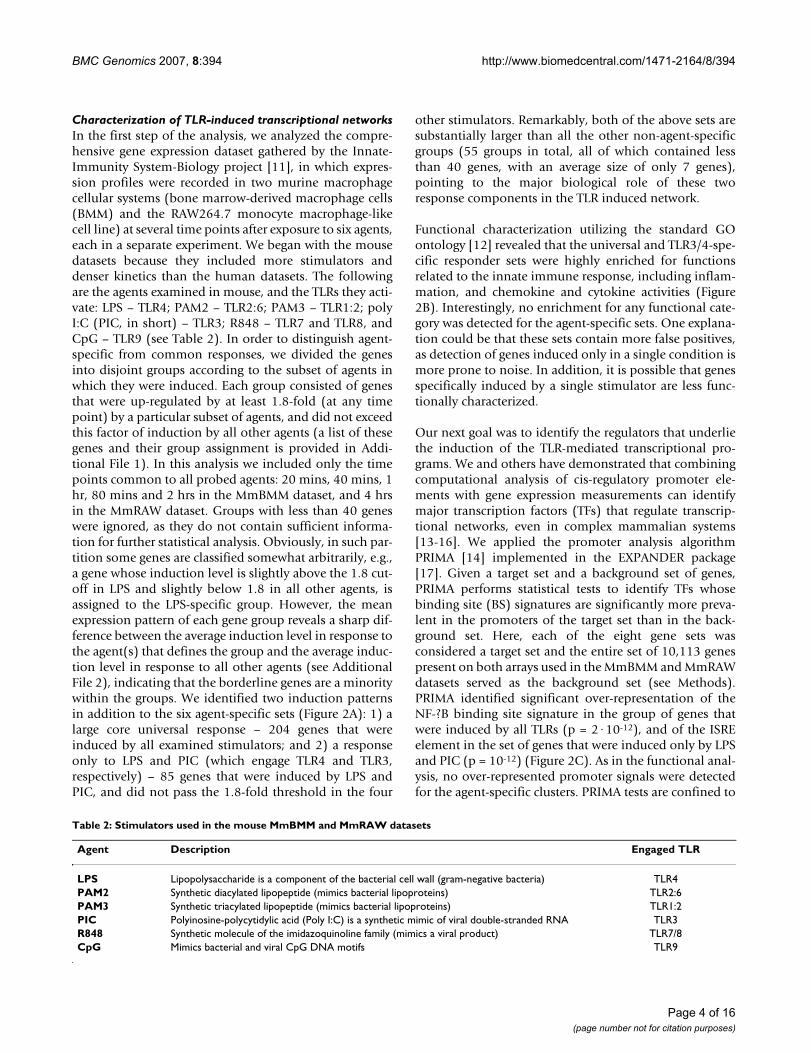
Characterization of TLR-induced transcriptional networksIn the first step of the analysis, we analyzed the compre-hensive gene expression dataset gathered by the Innate-Immunity System-Biology project [11], in which expres-sion profiles were recorded in two murine macrophagecellular systems (bone marrow-derived macrophage cells(BMM) and the RAW264.7 monocyte macrophage-likecell line) at several time points after exposure to six agents,each in a separate experiment. We began with the mousedatasets because they included more stimulators anddenser kinetics than the human datasets. The followingare the agents examined in mouse, and the TLRs they acti-vate: LPS – TLR4; PAM2 – TLR2:6; PAM3 – TLR1:2; polyI:C (PIC, in short) – TLR3; R848 – TLR7 and TLR8, andCpG – TLR9 (see Table 2). In order to distinguish agent-specific from common responses, we divided the genesinto disjoint groups according to the subset of agents inwhich they were induced. Each group consisted of genesthat were up-regulated by at least 1.8-fold (at any timepoint) by a particular subset of agents, and did not exceedthis factor of induction by all other agents (a list of thesegenes and their group assignment is provided in Addi-tional File 1). In this analysis we included only the timepoints common to all probed agents: 20 mins, 40 mins, 1hr, 80 mins and 2 hrs in the MmBMM dataset, and 4 hrsin the MmRAW dataset. Groups with less than 40 geneswere ignored, as they do not contain sufficient informa-tion for further statistical analysis. Obviously, in such par-tition some genes are classified somewhat arbitrarily, e.g.,a gene whose induction level is slightly above the 1.8 cut-off in LPS and slightly below 1.8 in all other agents, isassigned to the LPS-specific group. However, the meanexpression pattern of each gene group reveals a sharp dif-ference between the average induction level in response tothe agent(s) that defines the group and the average induc-tion level in response to all other agents (see AdditionalFile 2), indicating that the borderline genes are a minoritywithin the groups. We identified two induction patternsin addition to the six agent-specific sets (Figure 2A): 1) alarge core universal response – 204 genes that wereinduced by all examined stimulators; and 2) a responseonly to LPS and PIC (which engage TLR4 and TLR3,respectively) – 85 genes that were induced by LPS andPIC, and did not pass the 1.8-fold threshold in the four
other stimulators. Remarkably, both of the above sets aresubstantially larger than all the other non-agent-specificgroups (55 groups in total, all of which contained lessthan 40 genes, with an average size of only 7 genes),pointing to the major biological role of these tworesponse components in the TLR induced network.
Functional characterization utilizing the standard GOontology [12] revealed that the universal and TLR3/4-spe-cific responder sets were highly enriched for functionsrelated to the innate immune response, including inflam-mation, and chemokine and cytokine activities (Figure2B). Interestingly, no enrichment for any functional cate-gory was detected for the agent-specific sets. One explana-tion could be that these sets contain more false positives,as detection of genes induced only in a single condition ismore prone to noise. In addition, it is possible that genesspecifically induced by a single stimulator are less func-tionally characterized.
Our next goal was to identify the regulators that underliethe induction of the TLR-mediated transcriptional pro-grams. We and others have demonstrated that combiningcomputational analysis of cis-regulatory promoter ele-ments with gene expression measurements can identifymajor transcription factors (TFs) that regulate transcrip-tional networks, even in complex mammalian systems[13-16]. We applied the promoter analysis algorithmPRIMA [14] implemented in the EXPANDER package[17]. Given a target set and a background set of genes,PRIMA performs statistical tests to identify TFs whosebinding site (BS) signatures are significantly more preva-lent in the promoters of the target set than in the back-ground set. Here, each of the eight gene sets wasconsidered a target set and the entire set of 10,113 genespresent on both arrays used in the MmBMM and MmRAWdatasets served as the background set (see Methods).PRIMA identified significant over-representation of theNF-?B binding site signature in the group of genes thatwere induced by all TLRs (p = 2·10-12), and of the ISREelement in the set of genes that were induced only by LPSand PIC (p = 10-12) (Figure 2C). As in the functional anal-ysis, no over-represented promoter signals were detectedfor the agent-specific clusters. PRIMA tests are confined to
Table 2: Stimulators used in the mouse MmBMM and MmRAW datasets
Agent Description Engaged TLR
LPS Lipopolysaccharide is a component of the bacterial cell wall (gram-negative bacteria) TLR4PAM2 Synthetic diacylated lipopeptide (mimics bacterial lipoproteins) TLR2:6PAM3 Synthetic triacylated lipopeptide (mimics bacterial lipoproteins) TLR1:2PIC Polyinosine-polycytidylic acid (Poly I:C) is a synthetic mimic of viral double-stranded RNA TLR3R848 Synthetic molecule of the imidazoquinoline family (mimics a viral product) TLR7/8CpG Mimics bacterial and viral CpG DNA motifs TLR9
Page 4 of 16(page number not for citation purposes)

BMC Genomics 2007, 8:394 http://www.biomedcentral.com/1471-2164/8/394
TFs with characterized binding site signatures. Search fornovel elements using the MEME motif discovery tool [18]did not find any additional motif, except for the ubiqui-tous Sp1 signature in several sets. Taken together, the anal-ysis suggests that while NF-?B is universally activated byall TLRs, the TFs that act via the ISRE element (namely,IRF3/7 and the STAT1:STAT2:IRF9 (ISGF3) complex) areactivated specifically by the TLR4- and TLR3-mediated sig-naling pathways. Indeed, many key targets of NF-?B andthe ISRE element are in the universal and TLR3/4 sets,respectively, as shown in Figure 2A. Notably, in support ofthis model, the Nf-?b1, Nf-?b2, Rel and Relb subunits ofNF-?B are themselves included in the universal set (that is,they were induced in response to all agents), while Irf7,Stat1 and Stat2, which bind the ISRE, were specificallyinduced by the LPS and PIC treatments. (Irf9, the thirdcomponent of the ISGF3 complex, was up-regulated in
response to LPS and PIC as well, but only at late time-points – 8 h, 24 h for LPS, 4 h for PIC. As noted above,here we analyzed only time-points 0–4 h, which are com-mon to all the examined TLR-inducing agents.)
Carrying out a similar analysis on the sets of down-regu-lated genes (using the minimum expression value overtime-points 0–4 h in all six agents) did not yield any sig-nificant results. However, taking into account the latertime-points of 8 h and 24 h (measured only for LPS) iden-tified enrichment of cell-cycle related GO categories andTFs (namely, E2F, NF-Y; data not shown), reflecting pro-liferation arrest upon pathogen recognition.
Kinetics of the LPS-induced transcriptional responseExpression profiles in response to LPS stimulation wererecorded at denser time points (20 mins, 40 mins, 1 hr, 80
TLR-induced transcriptional programsFigure 2TLR-induced transcriptional programs. (A) Genes that were induced by at least one of the six examined TLR stimulators (induction of at least 1.8-fold at any time point) were partitioned into distinct sets according to their agent-induction pattern. Taking into account sets that contained at least 40 genes, only two complex induction patterns were identified in addition to the six agent-specific patterns: universal and LPS-PIC patterns. Selected genes are shown in the heat-map for each set (a com-plete list of genes is provided in Additional File 1). The maximum induction of the gene over the examined time points per stimulator is depicted in the heat-map. (B) Enriched GO functional categories were identified in the universal and LPS-PIC sets (p-values in parentheses are corrected for multiple testing using a bootstrap procedure on 1,000 randomly chosen gene sets of the same size as the true sets). (C) Highly significant over-represented cis-regulatory elements were identified in the promot-ers of the universal and LPS-PIC sets, pointing to a pivotal role for NF-?B and ISRE in the induction of these two components of the TLR-induced transcriptional program.
Page 5 of 16(page number not for citation purposes)
BMC Genomics 2007, 8:394 http://www.biomedcentral.com/1471-2164/8/394
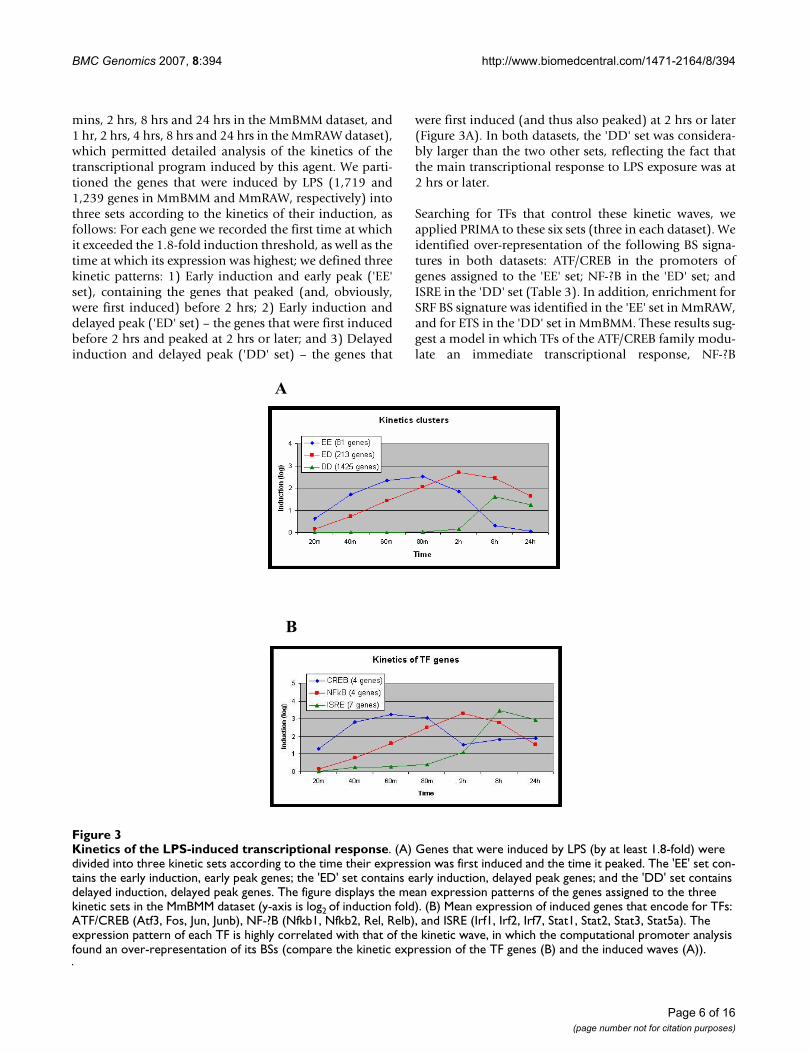
mins, 2 hrs, 8 hrs and 24 hrs in the MmBMM dataset, and1 hr, 2 hrs, 4 hrs, 8 hrs and 24 hrs in the MmRAW dataset),which permitted detailed analysis of the kinetics of thetranscriptional program induced by this agent. We parti-tioned the genes that were induced by LPS (1,719 and1,239 genes in MmBMM and MmRAW, respectively) intothree sets according to the kinetics of their induction, asfollows: For each gene we recorded the first time at whichit exceeded the 1.8-fold induction threshold, as well as thetime at which its expression was highest; we defined threekinetic patterns: 1) Early induction and early peak ('EE'set), containing the genes that peaked (and, obviously,were first induced) before 2 hrs; 2) Early induction anddelayed peak ('ED' set) – the genes that were first inducedbefore 2 hrs and peaked at 2 hrs or later; and 3) Delayedinduction and delayed peak ('DD' set) – the genes that
were first induced (and thus also peaked) at 2 hrs or later(Figure 3A). In both datasets, the 'DD' set was considera-bly larger than the two other sets, reflecting the fact thatthe main transcriptional response to LPS exposure was at2 hrs or later.
Searching for TFs that control these kinetic waves, weapplied PRIMA to these six sets (three in each dataset). Weidentified over-representation of the following BS signa-tures in both datasets: ATF/CREB in the promoters ofgenes assigned to the 'EE' set; NF-?B in the 'ED' set; andISRE in the 'DD' set (Table 3). In addition, enrichment forSRF BS signature was identified in the 'EE' set in MmRAW,and for ETS in the 'DD' set in MmBMM. These results sug-gest a model in which TFs of the ATF/CREB family modu-late an immediate transcriptional response, NF-?B
Kinetics of the LPS-induced transcriptional responseFigure 3Kinetics of the LPS-induced transcriptional response. (A) Genes that were induced by LPS (by at least 1.8-fold) were divided into three kinetic sets according to the time their expression was first induced and the time it peaked. The 'EE' set con-tains the early induction, early peak genes; the 'ED' set contains early induction, delayed peak genes; and the 'DD' set contains delayed induction, delayed peak genes. The figure displays the mean expression patterns of the genes assigned to the three kinetic sets in the MmBMM dataset (y-axis is log2 of induction fold). (B) Mean expression of induced genes that encode for TFs: ATF/CREB (Atf3, Fos, Jun, Junb), NF-?B (Nfkb1, Nfkb2, Rel, Relb), and ISRE (Irf1, Irf2, Irf7, Stat1, Stat2, Stat3, Stat5a). The expression pattern of each TF is highly correlated with that of the kinetic wave, in which the computational promoter analysis found an over-representation of its BSs (compare the kinetic expression of the TF genes (B) and the induced waves (A)).
�
�
Page 6 of 16(page number not for citation purposes)

BMC Genomics 2007, 8:394 http://www.biomedcentral.com/1471-2164/8/394
controls an early response that persists longer, and TFsthat act via the ISRE element (members of the IRF andSTAT families) regulate mainly the delayed transcriptionalresponse. Importantly, in accordance with this model, weobserved that genes that encoded for TFs of the respectivefamilies followed a kinetic pattern that was correlatedwith the one manifested by their putative targets (Figure 3and Table 3). To further corroborate this kinetic model,we carried out a complementary analysis in which wecompared the induction kinetics of putative targets of NF-?B and ISRE based on appearance of strong TF binding site(TFBS) motif hits in their promoters (as identified byPRIMA). Comparing the induction of the putative targetsof NF-?B or ISRE, but not both (82 and 112 genes, respec-tively), indeed showed that targets of NF-?B were inducedbefore targets of ISRE (p < 0.01 in both datasets; see Meth-ods). Similar statistical tests showed that genes whose pro-moter contained an ATF/CREB BS signature peaked atearlier time points than induced genes whose promoterdid not contain this cis-regulatory element (p < 0.0001 inboth datasets).
An additive effect of the pair of NF-?B and ISRE elementsThe above results suggest that NF-?B and the IRF-like TFsthat act via the ISRE element mainly regulate separatecomponents of the TLRs-induced program and differentresponse waves induced by LPS. Yet, genome-wide scanidentified 55 genes whose promoters contained hits forthese two regulatory elements. In 27 (49%) of these pro-moters, the ISRE element is located upstream to the NF-?Bputative site, indicating no order bias between the two ele-ments. We next examined whether there is an enhancedeffect when NF-?B and ISRE elements co-occur; in otherwords, do genes whose promoter contains both BSsexhibit a unique expression pattern? We did this by com-paring the expression of these genes after exposure to LPSto that of putative targets of each single element sepa-rately. Targets of the NF-?B+ISRE pair tended to havehigher expression values than genes with only one ofthese elements (Figure 4). Specifically, when the putativetargets of NF-?B were sorted in descending order accord-ing to their maximal expression value in MmBMM (over
all time points), the top 10% genes were significantlyenriched for the NF-?B+ISRE pair (p < 0.005; see Meth-ods). The top 10% genes with the ISRE element were alsoenriched for the pair (p < 0.05). This finding points to anadditive effect of these two regulatory elements thatboosts the induction of the respective target promotersbeyond the induction of genes controlled by only one ofthem. This suggests that the NF-?B and ISRE cis-elementsform together a functional regulatory module in promot-ers of genes that are induced by LPS. An alternative expla-nation for this observation is that the identification oftargets of a single cis-element is more prone to false-posi-tives than that of both elements, and therefore the expres-sion values we obtained for the set of putative targets ofNF-?B and ISRE separately were attenuated to a largerextent by false-positives than the expression of putativetargets of the module. However, previous studies support
Identification of the NFkB+ISRE cis-regulatory moduleFigure 4Identification of the NFkB+ISRE cis-regulatory mod-ule. Mean expression patterns after exposure to LPS (MmBMM dataset) were computed for three disjoint sets of genes – putative targets of each single element separately (604 NF-?B targets, 838 ISRE targets), and targets of both elements (55 genes), obtained by scanning the promoters of all the genes in the MmBMM dataset. Y-axis is average log2 of induction fold relative to time 0. Genes whose promoters contain hits for both NF-?B and ISRE elements were more strongly induced by LPS than genes whose promoters con-tain a hit for only one of these two elements.
Table 3: TFBS over-represented in kinetic waves induced by LPS
Kinetics set Enriched TFBS motifs Dataset # of genes p-value
EE ATF/CREB (M00177) MmBMM 81 1.0·10-8
MmRAW 100 1.1·10-5
SRF (M00810) MmRAW 100 4.1·10-6
ED NF-?B (M00053) MmBMM 213 2.3·10-7
MmRAW 133 2.9·10-6
DD ISRE (M00258) MmBMM 1425 1.7·10-17
MmRAW 1006 8.4·10-11
ETS (M00971) MmBMM 1425 1.9·10-8
Page 7 of 16(page number not for citation purposes)

BMC Genomics 2007, 8:394 http://www.biomedcentral.com/1471-2164/8/394
the additive effect of the NF-?B+ISRE module, reportingseveral genes that were co-regulated by NF-?B and ISRE.Doyle et al [1], for example, experimentally demonstratedfunctional cooperation between NF-?B and IRF3 in theinduction of IFN? and IP-10 (CXCL10) in response to LPS.
Corroboration of the findings on independent human macrophage datasetsThe results presented hitherto were inferred from analysisof responses of mouse macrophages to various TLR stim-uli. Seeking corroboration of our findings in human cells,we analyzed two publicly available datasets that profiledtranscriptional responses in immunologically challengedhuman macrophages. The first study, by Nau et al. [9],examined expression profiles in human monocyte-macro-phages at several time points (1 hr, 2 hrs, 6 hrs, 12 hrs and24 hrs) after stimulation by various agents; among themLPS and PIC are common to the stimuli examined by themouse datasets we analyzed (this dataset is hereaftercalled HsM1). The second study, by Jeffery et al. [10](hereafter called HsM2), profiled transcriptionalresponses in several human leukocytes challenged withvarious stimuli, among which monocyte-macrophagestreated with LPS for 4 hrs were relevant to our analysis (seeTable 1). These two studies provided us with independentdata that profiled the transcriptional network induced byactivated human macrophages, and allowed us to exam-ine whether our findings on the major roles of NF-?B andISRE elements in the activation of the transcriptional net-works induced by activated TLR4 (LPS) and TLR3 (PIC)are valid also in humans.
Analyzing the HsM1 dataset, we first identified the genesthat were induced by LPS alone or by PIC alone, or byboth treatments, and subjected these three gene sets tocomputational promoter analysis. In full accordance withthe results obtained on the mouse data, an unbiasedsearch for TFs that underlie the networks induced by LPSand PIC in HsM1 did not identify any signal in the sets ofgenes that responded specifically to either LPS or to PIC,but did detect a significant over-representation of NF-?Band ISRE elements in the promoters of genes that wereinduced by both agents (Table 4). This over-representa-tion reflects the superposition of the two components of
the TLR-induced transcriptional program: the universalresponse induced by all TLRs (mediated by NF-?B) andthe TLR3/4-specific component (regulated by TFs that actvia the ISRE element). These findings were further sup-ported by the second human macrophage dataset that weanalyzed: 505 genes were induced by at least 1.8-fold at 4hrs after LPS treatment in the HsM2 dataset. Unbiasedcomputational promoter analysis again detected only twosignals enriched in this gene set: NF-?B (p = 8.8·10-8) andISRE (1.4·10-12).
Next, we sought to demonstrate that the kinetic modelthat emerged in the analysis of the mouse datasetsremains valid for the human data. Following the analysisapplied to the mouse datasets, we partitioned the genesinduced by LPS and PIC in the human datasets to thethree kinetic sets: 'EE', 'ED' and 'DD' (again, using the 2 hrtime point as the boundary between early and delayedtime points), according to the kinetics of their activation,and searched for over-represented signals in the promot-ers of these gene sets. In agreement with the resultsobtained on the mouse dataset, here too we observed astrong enrichment for NF-?B and ISRE elements in the'ED' (early induction, delayed peak) and 'DD' (delayedinduction and peak) sets, respectively (Table 5). In con-trast to the results found on the mouse dataset (Table 3),we did not detect here an over-representation of ATF/CREB in the 'EE' set (representing early induction andpeak). This is probably due to the small size of this set andthe existence of only a single "early" time-point (1 hr),which might have hindered statistical detection ofenriched signals.
Last, we examined whether the additive effect between theNF-?B and ISRE cis-elements could be detected also in thehuman macrophage datasets. Indeed, the same statisticaltest we applied to the mouse data revealed that in bothHsM1 and HsM2, the 10% most highly induced putativetargets of each of the two elements were significantlyenriched for genes whose promoter contained a signaturefor both NF-?B and ISRE (Table 6).
DiscussionIn this study we systematically delineated the transcrip-tional program induced by stimulation of various TLRs inmacrophages. We dissected two major components of thisprogram: the first is a core response universally activatedby all examined TLRs, and the second is specifically acti-vated by TLR3 and TLR4. Our analysis identified NF-?Band IRF-like TFs binding ISRE as the key regulators ofthese two components and pointed to their respective tar-get genes on a genomic scale. While the involvement ofNF-?B and IRF-like TFs in response to TLR induction hasbeen known before, our study makes novel contributionsto several aspects of system-level understanding of the
Table 4: TFBS over-represented in the response induced by LPS and PIC in the HsM1 dataset
Set # of genes Enriched TFBS motifs
p-value
Induced only by LPS 196 --- ---Induced only by PIC 123 --- ---Induced by both LPS and PIC
75 NF-?B (M00053) 1.1·10-7
ISRE (M00258) 8.3·10-9
Page 8 of 16(page number not for citation purposes)

BMC Genomics 2007, 8:394 http://www.biomedcentral.com/1471-2164/8/394
transcriptional networks induced by innate immunity: (a)the combined, focused reanalysis of four independentdatasets identifying a clean, combinatorial response; (b)revealing the intricate kinetics of the transcriptionalresponse; (c) pinpointing novel specific genes involved ineach of the responses; (d) identification of NF-?B andISRE binding site locations over target genes; and (e) therefinement of the understanding of the regulatory cir-cuitry involved in innate immune response.
Novel targets of NF-?B and ISRE identified in this study(see selected examples in Tables 7 and 8) call for experi-mental validation. Typically, a genome-wide scan forputative TF targets is prone to a high rate of false positives.However, the candidates we identified are based ondiverse evidence that collectively increase the confidencethat they are true targets: their induction was triggered byseveral stimulators in multiple time points and in inde-pendent studies on two organisms; and in most cases therespective BS signature was identified in both the humanand mouse orthologous promoters.
The repertoire of the TLR universal response includes pro-inflammatory cytokines and chemokines (e.g., Ccl2-4,Csf1-3 and Cxcl1, which orchestrate innate immunityfight against pathogens), as well as co-stimulatory mole-cules (e.g., Il23a) that promote the activation of the T-cellbranch of the adaptive immunity. The universal responsealso contains many general stress-responsive genes (e.g.,Jun, Fos, Atf3, Egr1-3, Myc) that control cell proliferationand survival. Prominent among the genes specificallyinduced by TLR3 and TLR4 are the interferon (IFN)-induced genes (Figure 2A). IFN-induced genes comprisepotent antiviral molecules (e.g., Mx2, Isg20, Oas2-3, Prkr)and are therefore expected to be induced by TLR3, which
is activated by virally derived dsRNA. However, IFNs alsohave an important role in linking innate and adaptiveimmunity by regulating the induction of genes thatenhance T-cell activation and antigen-presentation capac-ity in response to pathogen infection (e.g., Il15, Tap1,Psmb8), which explains their induction by bacterial stim-uli such as LPS [19,20].
Without any prior knowledge on TLR signaling, our com-putational promoter analysis revealed NF-?B as the piv-otal regulator of the universal-TLR transcriptionalresponse. This finding is in line with current biologicalknowledge. Several molecular mechanisms throughwhich NF-?B is activated by TLR signaling have been char-acterized [2,20]. The first depends on Myd88 and is uti-lized by all TLRs with the exception of TLR3. ActivatedTLRs recruit Myd88, which then associates with membersof the IRAK family, initiating a cascade in which TRAF6and TAK1 (official symbol: MAP3K7) are sequentiallyactivated. TAK1 in turn promotes downstream activationof the IKK complex, which leads to the activation of NF-?Bby directly phosphorylating, and thereby removing theinhibitory effect of, the members of the I?B family on NF-?B (Figure 5). On the other hand, TLR3 activates NF-?B ina Myd88-independent manner: The TRIF adaptor protein(TICAM1) is recruited to activated TLR3, and then directlyinteracts with TRAF6, which presumably leads to the acti-vation of NF-?B using the same cascade described abovefor the Myd88-depndent pathway [20] (Figure 5). Sub-stantiating the universal role of NF-?B in the TLR-inducednetwork, we observed that the NF?B1, NF?B2, Rel andRelb subunits of the NF-?B heterodimer were induced byall examined stimuli.
Table 6: Statistical significance of increased expression of NF-?B+ISRE module.
Dataset MmBMM MmRAW HsM1 HsM2
Targets of module vs. targets of NF-?B 0.0045 0.089 0.059 0.0034Targets of module vs. targets of ISRE 0.041 0.089 0.015 0.0039
The table shows the p-values of the enrichment of the module's putative targets within the top 10% targets of NF-?B/ISRE, based on the genes' maximum induction (across all time-points) in response to LPS.
Table 5: TFBS over-represented in kinetic waves induced by LPS and PIC in the HsM1 dataset
Kinetics set TFBS motif Stimulator # of genes p-value
EE --- LPS 12PIC 80 ---
ED NF-?B (M00053) LPS 34 7.6·10-7
PIC 7 ---DD ISRE (M00258) LPS 225 1.8·10-5*
PIC 111 1.9·10-7
* a similar TFBS motif of the same element (M00972) received p-value 8.4·10-7.
Page 9 of 16(page number not for citation purposes)

BMC Genomics 2007, 8:394 http://www.biomedcentral.com/1471-2164/8/394
Superimposed on the TLR universal program, we detecteda robust TLR3/4-specific response, and demonstrated bypromoter analysis that its key regulator is the ISRE ele-
ment. In addition, our results indicate that this ISRE-mediated response is kinetically delayed compared to theNF-?B-regulated program. These findings too are corrobo-
Table 8: Predicted ISRE target genes in the specific response to LPS and PIC
Symbol ISRE BS (location) LPS maximum induction (log2) LPS kinetics Validated BS
Human Mouse MmBMM MmRAW HsM1 HsM2
IFNB1 GGGAGAAGTGAAAGT (-59)
GGGAGAACTGAAAGT (-150)
5.53 0.44 3.28 x ED/DD** [2]
TOR3A GCGGTTTCATTTCCC (161)
ACTGTTTCATTTTCC (-485)
4.08 2.31 x -0.19 DD [48]
OAS3 GAAAGAAACGAAACT (-29,108)
GGAGAAAACGAAAGT (-77,0)
5.21 2.85 x 2.42 DD [49, 50]
OAS2 TCAGTTTCAGTTTCC (49)
TGAGTTTCGATTTCC (-74)
3.24 2.1 2.56 2.53 DD [50]
OASL TTGAGAATCGAAACT (-288)
CACAAAAGAGAAACT (-159)
7.93 5.79 2.7 3.98 ED/DD** [50]
CFB (BF)
CTTGTTTCACTTTCA (-98)
ATAGTTTCTGTTTCC (-148)
8.38 3.32 2.04 x DD [51]
TRIM21 GCGGAAACTGAAAGT (9)
GAGGAAACTGAAAGT (-30,4)
2.65 1.52 2.73 0.22 DD [52]
IFIH1 ATCGAAACAGAAACC (-178)
ATCGAAACAGAAACC (-65)
4.55 2.92 x 3.09 DD/ED* ---
NMI N/F ACCGAAAGTGAAAGT (71) 3.31 1.54 1.61 1.36 DD ---LGP2 TCAGTTTCAGTTTCC
(-1)TCAGTTTCATTTCTA (-1)
1.87 2.07 x x DD ---
RTP4 (IFRG28)
ACAGAAACAGAAACT (-39,-15)
TTGGAAACCGAAACT (-84,-58,-35)
2.65 1.59 x 2.33 DD ---
BATF2 GGAGAAACTGAAACT (-2)
GGAGAAACTGAAACT (-95)
5.64 1.9 x x DD ---
STAT2 CTAGTTTCGGTTCCG (-353)
CTGGTTTCAGTTTCC (-303)
5.94 2.01 1.5 1.5 DD ---
See legend of Table 7.
Table 7: Predicted NF-?B target genes in the universal TLR response network.
Symbol NFkB BS (location) LPS maximum induction (log2) LPS Validated
Human Mouse MmBMM MmRAW HsM1 HsM2 kinetics BSCXCL10 GGGAAATTCC (-176) GGGAAATTCC (-233) 10.42 5.47 7.98 6.9 ED [41]RELB GGGGTTTTCC (-107) GGGGTTTTCC (-96) 4.3 1.27 0.77 1.46 ED/EE* [42]NFKBIA TGGAAATTCC (-84) GGGAAACCCC (-81) 4.1 4.25 3.35 2.58 ED [43]NFKB2 GGGAATTCCC (-101,-73) CGGGAATTCC (-102,-74) 3.56 3.82 1.17 1.72 ED [44]SDC4 N/F GGGGAATTCC (-81) 1.53 2.78 1.01 2.02 DD/ED* [45]CD69 GGGAAAATCC (-222) GGGAAAATCC (-220,-155) 8.3 1.82 0.88 3.11 ED/DD* [46]BIRC3 GGAAATCCCC (-177) GGAAATCCCC (-60) 2.97 0.75 3.19 4.03 ED [47]MAP3K8 GGAAAACCCC (-724) CGGAATTTCC (-490) 3.42 0.46 0.65 2.98 ED ---BATF N/F GGGATTTTCC (-233) 4.51 3.07 3.31 1.04 DD ---IRG1 N/F TGGAAATTCC (-50) 10.8 7.69 x x ED ---RIPK2 GGGGCTTTCC (-310) GGGATTTTCC (-521) 2.51 x x 3.23 ED ---GCH1 CGGGCTTTCC (-11) N/F 3.19 0.82 6.19 3.64 ED/
DD**---
TNIP1 GGGGACTTTC (-68) N/F 3.51 -0.64 3.01 2.46 ED/DD**
---
Promoter sequences matching the PWMs of NF-?B and ISRE were identified by the PRIMA software; mapping between human and mouse orthologous genes was downloaded from the Ensembl web-site; sequences are shown on the coding strand; in cases of multiple matches, the sequence of the first listed match is shown; "N/F" means no putative BS was found. For each gene, the tables indicate (the log2 of) its maximum fold-induction (over all time-points) in response to LPS in all four datasets, as well as its kinetic pattern (in case of conflicting patterns in different datasets, the default pattern is in MmBMM, * is in MmRAW, and ** is in HsM1). References for validated BSs are given in the last column.
Page 10 of 16(page number not for citation purposes)

BMC Genomics 2007, 8:394 http://www.biomedcentral.com/1471-2164/8/394
rated by current biological knowledge. The ISRE cis-ele-ment is bound by members of the IRF and STAT TFfamilies. Several studies demonstrated the existence oftwo waves of activation of TFs that act via ISRE by TLR3and TLR4 [1,20-22]. The emerging model is that IRF3,which is post-translationally activated by TLR3 and TLR4via a cascade that involves the TRIF (TICAM1) and TRAM(TICAM2) adaptor proteins and their downstream kinasesIKK? (IKBKE) and TBK1, promotes an early wave of IFN-?gene induction (Figure 5) [1,23]. Once IFN-? is producedand secreted, it engages the type-I IFN receptor in bothparacrine and autocrine fashion, thereby triggering theJAK-STAT signaling cascade that culminates in the activa-tion of the ISGF3 TF complex, which is comprised ofSTAT1, STAT2 and IRF9 (official symbol: ISGF3G) [24].ISGF3 induces the expression of IRF7, which in turn fur-
ther activates the expression of type-I IFNs. In this way, apositive loop is established, which ensures persistentexpression of IFN-stimulated genes that enhance the anti-viral and antimicrobial cellular state [20]. Strikingly, infull compliance with this model, we observed that IFN-?and the IRF7, STAT1 and STAT2 TFs were specificallyinduced by LPS and PIC in the datasets we analyzed (Fig-ure 5).
Our analysis points to novel feedback loops in the TLR-induced network, further increasing the known complex-ity of the regulatory circuits that modulate its inductionand repression (see Figure 5 and Tables 7, 8): We identi-fied IFIH1 (also known as MDA5) and LGP2 as novelputative targets regulated by the ISRE element. IFIH1 is anon-TLR cytoplasmic sensor that detects actively replicat-
TLR-induced signaling pathways and transcriptional programsFigure 5TLR-induced signaling pathways and transcriptional programs. The map, constructed using our SPIKE knowledge-base of signaling pathways [40], presents current knowledge on signaling cascades emanating from activated TLRs and culminat-ing in activation of several key TFs and their respective target genes to achieve robust antiviral and antimicrobial responses. SPIKE maps contain nodes representing three biological entities: gene/proteins (violet nodes); protein complexes (green nodes, e.g., the ISGF3 complex); and gene families (yellow nodes, e.g., the I?B family of NF-?B inhibitors). The map contains two types of edges: Blue edges represent regulations between genes/proteins. Arrowheads (?) correspond to activation, and T-shaped edges (---|) represent inhibition. Green edges represent containment relations between nodes (e.g., the relationships between a complex and its components). Red and green dots within a node indicate that not all the regulation and containment relations stored in SPIKE's DB for that node are displayed on the map. Genes that were universally induced by all examined TLRs are marked by a red bar to the left of the node; genes that were specifically induced by LPS and PIC (which activate TLR4 and TLR3, respectively) are marked by a yellow bar. Novel regulatory links identified in this study that close feedback loops within the TLR-induced network are emphasized in the map by a dashed arrow.
Page 11 of 16(page number not for citation purposes)

BMC Genomics 2007, 8:394 http://www.biomedcentral.com/1471-2164/8/394
ing viruses [2,25], and triggers the induction of the NF-?Band IRF3 pathways via the activation of the adaptor pro-tein VISA (also known as cardif or IPS-1) [26]. Moreover,it has been recently demonstrated that IFIH1 detects cyto-plasmic dsRNA generated during viral replication (whileTLR3 detects viral dsRNA phagocytosed in endosomes),and that this sensor also binds to PIC and mediates type IIFN responses to this synthetic analog of viral dsRNA [27].Therefore, the transcriptional program induced by PICstimulation probably reflects a combined outcome of theactivation of TLR3-mediated and IFIH1-mediated path-ways.
Interestingly, the second putative ISRE target we identi-fied, LGP2, is a direct negative regulator of IFIH1 [28]. Thesimultaneous activation of positive and negative regula-tors of the same pathway seems to be a recurrent theme inthe logic of cellular signaling networks. Another novelputative positive loop in the ISRE-regulated network ismediated by NMI, which enhances the transcriptionalactivity of STAT-1 [29]. In the NF-?B-regulated transcrip-tional response, which is universally activated by allexamined TLRs, we identified MAP3K8 (also known asTPL-2 and COT) and RIPK2 as novel targets that form pos-itive feedback loops which reinforce the persistent activa-tion of this network [30,31], and TNIP1 as a regulator thatforms a negative feedback loop which inhibits the I?Kcomplex, thereby contributing to the turning-off of thisresponse [32].
The kinetic analysis of the response to LPS also suggests arole for the ATF/CREB cis-regulatory element. We identi-fied a significant over-representation of this signature onpromoters of genes whose expression peaked at very earlytime points (before 2 hrs). Two alternative interpretationsof the role played by these elements are consistent withthis rapid pattern of induction: According to the first,members of the ATF/CREB family activate this early andvery short response; the second interpretation ascribes aninhibitory effect to these elements, implying that the TF(s)that act via them repress the expression of their targetgenes, and therefore the induction of these targetsdeclines shortly after their activation. A recent study byGilchrist et al. [8] demonstrating that ATF3 negatively reg-ulates a subset of NF-?B target genes induced by TLR4 sup-ports the second interpretation. Notably, the ATF3 geneitself is included in the TLR universal response, pointingto a negative loop that regulates a sub-network of TLR-induced transcriptional program.
The computational promoter analysis ferreted out themajor regulators of the two components of the TLR-induced network. This complex transcriptional network islikely regulated by additional TFs, which were notdetected by promoter analysis. Indeed, the TLR universal
response contains several other TFs in addition to thosediscussed above (e.g., Egr1-3, c-Myc, Ets2, Fos). This couldbe explained by the fact that our statistical promoter anal-ysis detects TFs with a relatively high number of direct tar-gets, whose BSs are located within the scanned promoterregion and which were responsive beyond a certainthreshold in the studied conditions. It is thereforeexpected to miss TFs that: (a) have a small number ofdirectly induced targets; (b) bind at large distances fromthe transcription start site; (c) regulate the TLR network byinteracting with other TFs rather than directly binding tothe DNA; or (d) have a very subtle (though, perhaps, bio-logically important) influence on the expression of theirtargets.
Our results suggest mainly distinct programs mediated bythe NF-?B and ISRE cis-elements. However, when the twoelements co-occured in the same target promoter, wedetected an additive effect that boosts the induction of thetarget genes. This finding further defines the NF-?B+ISREpair as a functional transcriptional module, and adds sev-eral novel candidates to the list of genes reported to becontrolled by it [1,33-35] (Tables 7, 8). Importantly, IFN-? is among the genes whose promoters were empiricallydemonstrated to be under the regulation of the NF-?B+ISRE pair [1].
ConclusionOur analysis demonstrates the power of functionalgenomics approaches to delineate intricate transcriptionalnetworks in mammalian systems. Microarray data areoften noisy and do not distinguish between direct and sec-ondary responses. Likewise, large-scale promoter scan-ning for putative TF targets produces many false positivesdue to the short and degenerate nature of BS signatures.Combining these two sources of information, and aug-menting them by utilizing datasets and promotersequences from both human and mouse, gave us an accu-rate, system-level delineation of the TLR-induced tran-scriptional program, and identified highly reliableputative direct targets of its key regulators. The findingsreported in this study generalize, on a genomic scale, thecurrent knowledge on the identity, function, kinetics andmodular organization of the transcriptional regulatorsthat mobilize the innate immune response, which is oftenbased on studies of specific genes. Such knowledge can beuseful for designing ways to pharmacologically manipu-late the activity of the innate immunity in pathologicalconditions in which either enhancement or repression ofthis branch of the immune system is desired.
MethodsMicroarray datasetsThe four expression datasets analyzed in this study aresummarized in Table 1. We used the original normalized
Page 12 of 16(page number not for citation purposes)

BMC Genomics 2007, 8:394 http://www.biomedcentral.com/1471-2164/8/394
probe expression values, as provided by the authors. Ineach dataset, we averaged measurements over replicatesamples, and then, for each probe, we divided expressionvalues in treated samples by the values in the correspond-ing control samples (time 0 hr). These fold-change ratioswere log (base2)-transformed and averaged over probesthat correspond to the same gene. Mapping probes in theMmBMM, HsM1 and HsM2 datasets to Ensembl gene idswas done using annotation files provided by Affymetrix.The MmRAW dataset included the Entrez-Gene id of eachprobe; we used Biomart [36] to map Entrez-Gene ids toEnsembl gene ids. The HsM1 experiment measuredresponses of macrophages cultured with LPS derived fromE. coli (LPS_E) and Salmonella typhi (LPS_S). We regardedLPS_E and LPS_S as duplicates and averaged over thesetwo conditions.
Definition of stimulator-induced genesIn all datasets except HsM1, a gene was considered to beinduced by a given stimulator if its expression level in oneor more of the time points was at least 1.8-fold higherthan its expression at time 0. The results we report are notsensitive to the chosen cutoff and remained consistent fora wide range of values (from 1.5- to 2-fold). In HsM1 weused a more stringent threshold of 3.5-fold, since theexpression values in this dataset showed a much largervariance, probably because no replicates were performed(except for time 0). This threshold was chosen so that asimilar percentage of the genes will be considered inducedin HsM1 as in the other datasets.
Groups of genes induced by subsets of stimulatorsThe two mouse datasets – MmBMM and MmRAW – share10,113 genes. Using the maximum induction-fold of eachof these genes, computed over six time-points (20 mins-2hrs in MmBMM, and 4 hrs in MmRAW), for each of the sixstimulators (LPS, PAM2, PAM3, PIC, R848 and CpG), wepartitioned the genes into groups as follows. We enumer-ated all 63 (= 26-1) non-empty subsets of the six stimula-tors, and for each such subset we collected all the genesthat were induced in those stimulators and not induced inthe others. Ignoring sets with less than 40 genes, weobtained eight gene sets (Figure 2A): six agent-specific sets(i.e., genes that were induced only in one of the six stim-ulators), an LPS-PIC specific set, and a universal responseset.
In humans, we repeated the above analysis for the LPS andPIC stimulators in the HsM1 dataset. Here, we used all fivetime-points (1 hr–24 hrs), and an induction threshold of3.5-fold (see Table 4).
Functional categories analysisIdentification of enriched Gene Ontology (GO) biologicalprocesses categories was done using the TANGO algo-
rithm implemented in the EXPANDER package [17]. Inbrief, TANGO calculates the statistical significance of GOcategories' over-representation within a given set of genesby computing the upper tail of the hypergeometric distri-bution. In order to account for multiple testing, a majorchallenge in such an analysis due to the strong dependen-cies among GO categories, TANGO estimates fixed p-val-ues using an empirical distribution based on 1,000randomly chosen gene sets. We report all GO categorieswith an enrichment p-value less than 10-5 (before correct-ing for multiple testing) (see Figure 2B). Association ofmouse genes with GO categories was downloaded fromthe GO web-site [37] (Sep 2006).
Computational promoter analysisIdentification of enriched BS signature of known TFs wasdone using our PRIMA algorithm [14], which is imple-mented in the EXPANDER package. PRIMA identifies TFswhose BS signatures are significantly abundant in the pro-moters of a specified group of genes, given their distribu-tion in the promoters of the entire background set (i.e., allthe genes present on the chip). PRIMA uses positionweight matrices (PWMs) as models for regulatory sitesthat are bound by TFs. 498 PWMs that represent humanor mouse TFBSs were obtained from the TRANSFAC data-base (release 10.2, June 2006) [38]. Promoter sequencescorresponding to all known human and mouse geneswere extracted from the Ensembl project (release 40, Sep2006) [39]. PRIMA scanned both strands of each pro-moter sequence in the region from 600 bps upstream to100 bps downstream of the putative transcription startsite (TSS). Repetitive elements were masked out. Adetailed description of how PRIMA determines PWM cut-offs, identifies putative TFBSs, and computes enrichmentscores is given in [14]. We report TFs with an enrichmentp-value less than 10-5. We used this stringent thresholddue to the large number of PWMs examined. Note, how-ever, that there is a very high level of redundancy in theTRANSFAC database. For example, there are seven differ-ent PWMs for NF-?B, which are naturally all very similar.Thus, the actual number of independent multiple testsperformed by PRIMA is considerably less than the totalnumber of PWMs. For each of the TFs reported in thisstudy, we chose the PWM that gave the best overall results(in terms of enrichment): M00053 for NF-?B, M00258 forISRE, and M00177 for ATF/CREB; other PWMs of theseTFs often gave very similar p-values.
We also subjected each of the eight TLR-induced gene sets(Figure 2) to the MEME program (version 3.0.3) [18].MEME is a tool for discovering motifs de-novo in a groupof related DNA sequences. MEME was run with a 4th-orderMarkov background model, which we constructed usingall the mouse promoter sequences (from 600 bpsupstream to 100 bps downstream the TSS). We searched
Page 13 of 16(page number not for citation purposes)

BMC Genomics 2007, 8:394 http://www.biomedcentral.com/1471-2164/8/394
for motifs of length 8 and 10, and used the followingoptions: "-dna -revcomp -mod zoops -evt 0.001 -text -nos-tatus".
Statistical tests for the kinetics of TF targetsIn order to statistically evaluate the difference in theinduction time of NF-?B and ISRE targets, we counted thenumber of putative targets of these elements, denoted s1and s2, respectively, that were induced up to 1 hr after LPStreatment. (genes whose promoter contained both theNF-?B and ISRE signatures were ignored in this test).Given the total number of putative targets (induced at anytime-point), denoted t1 and t2, respectively, we computedthe probability that out of s1 + s2 early-induced genes, atleast s1 of them are targets of NF-?B. A small probabilityindicates that statistically significant number of the early-induced genes is regulated by NF-?B. This probability isgiven by the hypergeometric tail distribution:
Using a similar statistical test, we showed that the peaktime of putative targets of ATF/CREB is significantly earlierthan that of all other induced genes. Denoting by t1 (t2)the number of LPS-induced genes that are (are not) puta-tive targets of ATF/CREB, out of which s1 (s2) reached theirmaximal expression at or before 1 hr, we computed thehypergeometric probability as above.
Statistical evaluation of increased induction of targets of NF-?B+ISRETo examine whether there is a significant additive effectbetween the NF-?B and ISRE elements, we performed thefollowing test: Given the total number of genes whosepromoter contains signatures of both NF-?B and ISRE, oronly NF-?B, denoted t1 and t2, respectively, we checkedwhether there is an enrichment of NF-?B+ISRE joint tar-gets within the 10% most highly induced NF-?B targets.Here, genes were ranked based on their maximum induc-tion in response to LPS. Let s1 and s2 denote the number ofNF-?B+ISRE and NF-?B (but not ISRE) targets, respec-tively, whose induction-fold is above the aforementioned10% threshold (i.e., s1 + s2 = (t1 + t2)/10). Then, using thestandard hypergeometric score (Equation 1), we com-puted the probability to observe at least s1 highly-inducedNF-?B+ISRE targets, given t1, t2 and s2. For example, in theMmBMM dataset, we found an NF-?B signature in 659genes, of which 55 also contained an ISRE element;among the 65 NF-?B targets with highest induction byLPS, 12 genes also had an ISRE element.
Thus, t1 = 55, t2 = 604, s1 = 12, and s2 = 53, which gives p =0.004.
The above test evaluates the increased expression of puta-tive targets of the pair NF-?B+ISRE with respect to all NF-?B targets. We performed a similar test to check theincreased expression of NF-?B+ISRE relative to all ISREtargets.
Authors' contributionsRE and CL conceived the study, carried out the analysesand drafted the manuscript. YH participated in the dataanalysis and developed the methods for the kinetic analy-sis. RS and YS participated in the design of the study, ledand funded it and reviewed the manuscript. All authorsread and approved the final manuscript.
Additional material
AcknowledgementsWe thank Richard Young, Richard Jenner and the Innate-Immunity System-Biology project for making their microarray data publicly available. We thank Ioannis Xenarios, Gideon Schreiber and Diego Jaitin for reading the manuscript and providing helpful advice. R. Elkon was supported by an Eshkol Fellowship from the Ministry of Science, Israel. R. Shamir was sup-ported by the Wolfson Foundation.
References1. Doyle S, Vaidya S, O'Connell R, Dadgostar H, Dempsey P, Wu T, Rao
G, Sun R, Haberland M, Modlin R, Cheng G: IRF3 mediates aTLR3/TLR4-specific antiviral gene program. Immunity 2002,17:251-263.
2. Kawai T, Akira S: TLR signaling. Cell Death Differ 2006, 13:816-825.3. Zhong B, Tien P, Shu HB: Innate immune responses: crosstalk
of signaling and regulation of gene transcription. Virology 2006,352:14-21.
4. Oda K, Kitano H: A comprehensive map of the toll-like recep-tor signaling network. Mol Syst Biol 2006, 2:2006 0015.
5. Grandvaux N, Servant MJ, tenOever B, Sen GC, Balachandran S, Bar-ber GN, Lin R, Hiscott J: Transcriptional profiling of interferonregulatory factor 3 target genes: direct involvement in theregulation of interferon-stimulated genes. J Virol 2002,76:5532-5539.
6. Decker T, Muller M, Stockinger S: The yin and yang of type Iinterferon activity in bacterial infection. Nat Rev Immunol 2005,5:675-687.
P
t
i
t
s s i
t t
s si s
t s s
=
⎛
⎝⎜
⎞
⎠⎟ + −⎛
⎝⎜
⎞
⎠⎟
++
⎛
⎝⎜
⎞
⎠⎟=
+{1 2
1 2
1 2
1 21
1 1 2min , }}∑ (1)
Additional file 1The file lists the genes that were induced by TLR activation and their assignment into the agent specific, LPS+PIC and universal clusters.Click here for file[http://www.biomedcentral.com/content/supplementary/1471-2164-8-394-S1.xls]
Additional file 2The mean expression pattern of each gene cluster (representative genes of each cluster are shown in Figure 2A).Click here for file[http://www.biomedcentral.com/content/supplementary/1471-2164-8-394-S2.xls]
Page 14 of 16(page number not for citation purposes)

BMC Genomics 2007, 8:394 http://www.biomedcentral.com/1471-2164/8/394
7. Schroder K, Hertzog PJ, Ravasi T, Hume DA: Interferon-gamma:an overview of signals, mechanisms and functions. J Leukoc Biol2004, 75:163-189.
8. Gilchrist M, Thorsson V, Li B, Rust AG, Korb M, Kennedy K, Hai T,Bolouri H, Aderem A: Systems biology approaches identifyATF3 as a negative regulator of Toll-like receptor 4. Nature2006, 441:173-178.
9. Nau GJ, Richmond JF, Schlesinger A, Jennings EG, Lander ES, YoungRA: Human macrophage activation programs induced bybacterial pathogens. Proc Natl Acad Sci USA 2002, 99:1503-1508.
10. Jeffrey KL, Brummer T, Rolph MS, Liu SM, Callejas NA, Grumont RJ,Gillieron C, Mackay F, Grey S, Camps M, Rommel C, Gerondakis SD,Mackay CR: Positive regulation of immune cell function andinflammatory responses by phosphatase PAC-1. Nat Immunol2006, 7:274-283.
11. The Innate-Immunity System-Biology project [http://www.systemsbiology-immunity.org]
12. Ashburner M, Ball CA, Blake JA, Botstein D, Butler H, Cherry JM,Davis AP, Dolinski K, Dwight SS, Eppig JT, Harris MA, Hill DP, Issel-Tarver L, Kasarskis A, Lewis S, Matese JC, Richardson JE, Ringwald M,Rubin GM, Sherlock G: Gene ontology: tool for the unificationof biology. The Gene Ontology Consortium. Nat Genet 2000,25:25-29.
13. Das D, Nahle Z, Zhang MQ: Adaptively inferring human tran-scriptional subnetworks. Mol Syst Biol 2006, 2:2006 0029.
14. Elkon R, Linhart C, Sharan R, Shamir R, Shiloh Y: Genome-wide insilico identification of transcriptional regulators controllingthe cell cycle in human cells. Genome Res 2003, 13:773-780.
15. Zhu Z, Shendure J, Church GM: Discovering functional tran-scription-factor combinations in the human cell cycle.Genome Res 2005, 15:848-855.
16. Blais A, Tsikitis M, Acosta-Alvear D, Sharan R, Kluger Y, Dynlacht BD:An initial blueprint for myogenic differentiation. Genes Dev2005, 19:553-569.
17. Shamir R, Maron-Katz A, Tanay A, Linhart C, Steinfeld I, Sharan R, Shi-loh Y, Elkon R: EXPANDER--an integrative program suite formicroarray data analysis. BMC Bioinformatics 2005, 6:232.
18. Bailey TL, Elkan C: Fitting a mixture model by expectationmaximization to discover motifs in biopolymers. Proc Int ConfIntell Syst Mol Biol 1994, 2:28-36.
19. Hoebe K, Beutler B: LPS, dsRNA and the interferon bridge toadaptive immune responses: Trif, Tram, and other TIRadaptor proteins. J Endotoxin Res 2004, 10:130-136.
20. Moynagh PN: TLR signalling and activation of IRFs: revisitingold friends from the NF-kappaB pathway. Trends Immunol 2005,26:469-476.
21. Taniguchi T, Ogasawara K, Takaoka A, Tanaka N: IRF family oftranscription factors as regulators of host defense. Annu RevImmunol 2001, 19:623-655.
22. Jenner RG, Young RA: Insights into host responses against path-ogens from transcriptional profiling. Nat Rev Microbiol 2005,3:281-294.
23. Fitzgerald KA, McWhirter SM, Faia KL, Rowe DC, Latz E, GolenbockDT, Coyle AJ, Liao SM, Maniatis T: IKKepsilon and TBK1 areessential components of the IRF3 signaling pathway. NatImmunol 2003, 4:491-496.
24. Shuai K, Liu B: Regulation of JAK-STAT signalling in theimmune system. Nat Rev Immunol 2003, 3:900-911.
25. Kato H, Takeuchi O, Sato S, Yoneyama M, Yamamoto M, Matsui K,Uematsu S, Jung A, Kawai T, Ishii KJ, Yamaguchi O, Otsu K, TsujimuraT, Koh CS, Reis e Sousa C, Matsuura Y, Fujita T, Akira S: Differentialroles of MDA5 and RIG-I helicases in the recognition of RNAviruses. Nature 2006, 441:101-105.
26. Meylan E, Curran J, Hofmann K, Moradpour D, Binder M, Barten-schlager R, Tschopp J: Cardif is an adaptor protein in the RIG-Iantiviral pathway and is targeted by hepatitis C virus. Nature2005, 437:1167-1172.
27. Gitlin L, Barchet W, Gilfillan S, Cella M, Beutler B, Flavell RA, Dia-mond MS, Colonna M: Essential role of mda-5 in type I IFNresponses to polyriboinosinic:polyribocytidylic acid andencephalomyocarditis picornavirus. Proc Natl Acad Sci USA 2006,103:8459-8464.
28. Yoneyama M, Kikuchi M, Matsumoto K, Imaizumi T, Miyagishi M,Taira K, Foy E, Loo YM, Gale M Jr, Akira S, Yonehara S, Kato A, FujitaT: Shared and unique functions of the DExD/H-box helicases
RIG-I, MDA5, and LGP2 in antiviral innate immunity. J Immu-nol 2005, 175:2851-2858.
29. Zhu M, John S, Berg M, Leonard WJ: Functional association ofNmi with Stat5 and Stat1 in IL-2- and IFNgamma-mediatedsignaling. Cell 1999, 96:121-130.
30. Ruefli-Brasse AA, Lee WP, Hurst S, Dixit VM: Rip2 participates inBcl10 signaling and T-cell receptor-mediated NF-kappaBactivation. J Biol Chem 2004, 279:1570-1574.
31. Lin X, Cunningham ET Jr, Mu Y, Geleziunas R, Greene WC: Theproto-oncogene Cot kinase participates in CD3/CD28 induc-tion of NF-kappaB acting through the NF-kappaB-inducingkinase and IkappaB kinases. Immunity 1999, 10:271-280.
32. Mauro C, Pacifico F, Lavorgna A, Mellone S, Iannetti A, Acquaviva R,Formisano S, Vito P, Leonardi A: ABIN-1 binds to NEMO/IKKgamma and co-operates with A20 in inhibiting NF-kap-paB. J Biol Chem 2006, 281:18482-18488.
33. Jahnke A, Johnson JP: Synergistic activation of intercellularadhesion molecule 1 (ICAM-1) by TNF-alpha and IFN-gamma is mediated by p65/p50 and p65/c-Rel and interferon-responsive factor Stat1 alpha (p91) that can be activated byboth IFN-gamma and IFN-alpha. FEBS Lett 1994, 354:220-226.
34. Ohmori Y, Hamilton TA: The interferon-stimulated responseelement and a kappa B site mediate synergistic induction ofmurine IP-10 gene transcription by IFN-gamma and TNF-alpha. J Immunol 1995, 154:5235-5244.
35. Ohmori Y, Schreiber RD, Hamilton TA: Synergy between inter-feron-gamma and tumor necrosis factor-alpha in transcrip-tional activation is mediated by cooperation between signaltransducer and activator of transcription 1 and nuclear fac-tor kappaB. J Biol Chem 1997, 272:14899-14907.
36. Biomart [http://www.biomart.org/]37. GO [http://www.geneontology.org]38. Matys V, Fricke E, Geffers R, Gossling E, Haubrock M, Hehl R, Hor-
nischer K, Karas D, Kel AE, Kel-Margoulis OV, Kloos DU, Land S,Lewicki-Potapov B, Michael H, Munch R, Reuter I, Rotert S, Saxel H,Scheer M, Thiele S, Wingender E: TRANSFAC: transcriptionalregulation, from patterns to profiles. Nucleic Acids Res 2003,31:374-378.
39. Birney E, Andrews TD, Bevan P, Caccamo M, Chen Y, Clarke L,Coates G, Cuff J, Curwen V, Cutts T, Down T, Eyras E, Fernandez-Suarez XM, Gane P, Gibbins B, Gilbert J, Hammond M, Hotz HR, IyerV, Jekosch K, Kahari A, Kasprzyk A, Keefe D, Keenan S, LehvaslaihoH, McVicker G, Melsopp C, Meidl P, Mongin E, Pettett R, et al.: Anoverview of Ensembl. Genome Res 2004, 14:925-928.
40. SPIKE [http://www.cs.tau.ac.il/~spike/]41. Ohmori Y, Hamilton TA: Cooperative interaction between
interferon (IFN) stimulus response element and kappa Bsequence motifs controls IFN gamma- and lipopolysaccha-ride-stimulated transcription from the murine IP-10 pro-moter. J Biol Chem 1993, 268:6677-6688.
42. Bren GD, Solan NJ, Miyoshi H, Pennington KN, Pobst LJ, Paya CV:Transcription of the RelB gene is regulated by NF-kappaB.Oncogene 2001, 20:7722-7733.
43. Haskill S, Beg AA, Tompkins SM, Morris JS, Yurochko AD, Sampson-Johannes A, Mondal K, Ralph P, Baldwin AS Jr: Characterization ofan immediate-early gene induced in adherent monocytesthat encodes I kappa B-like activity. Cell 1991, 65:1281-1289.
44. Lombardi L, Ciana P, Cappellini C, Trecca D, Guerrini L, Migliazza A,Maiolo AT, Neri A: Structural and functional characterizationof the promoter regions of the NFKB2 gene. Nucleic Acids Res1995, 23:2328-2336.
45. Zhang Y, Pasparakis M, Kollias G, Simons M: Myocyte-dependentregulation of endothelial cell syndecan-4 expression. Role ofTNF-alpha. J Biol Chem 1999, 274:14786-14790.
46. Lopez-Cabrera M, Munoz E, Blazquez MV, Ursa MA, Santis AG,Sanchez-Madrid F: Transcriptional regulation of the geneencoding the human C-type lectin leukocyte receptor AIM/CD69 and functional characterization of its tumor necrosisfactor-alpha-responsive elements. J Biol Chem 1995,270:21545-21551.
47. Stehlik C, de Martin R, Binder BR, Lipp J: Cytokine inducedexpression of porcine inhibitor of apoptosis protein (iap)family member is regulated by NF-kappa B. Biochem BiophysRes Commun 1998, 243:827-832.
Page 15 of 16(page number not for citation purposes)

BMC Genomics 2007, 8:394 http://www.biomedcentral.com/1471-2164/8/394
Publish with BioMed Central and every scientist can read your work free of charge
"BioMed Central will be the most significant development for disseminating the results of biomedical research in our lifetime."
Sir Paul Nurse, Cancer Research UK
Your research papers will be:
available free of charge to the entire biomedical community
peer reviewed and published immediately upon acceptance
cited in PubMed and archived on PubMed Central
yours — you keep the copyright
Submit your manuscript here:http://www.biomedcentral.com/info/publishing_adv.asp
BioMedcentral
48. Theofilopoulos AN, Baccala R, Beutler B, Kono DH: Type I inter-ferons (alpha/beta) in immunity and autoimmunity. Annu RevImmunol 2005, 23:307-336.
49. Bottrel RL, Yang YL, Levy DE, Tomai M, Reis LF: The immuneresponse modifier imiquimod requires STAT-1 for inductionof interferon, interferon-stimulated genes, and interleukin-6.Antimicrob Agents Chemother 1999, 43:856-861.
50. Mashimo T, Glaser P, Lucas M, Simon-Chazottes D, Ceccaldi PE,Montagutelli X, Despres P, Guenet JL: Structural and functionalgenomics and evolutionary relationships in the cluster ofgenes encoding murine 2',5'-oligoadenylate synthetases.Genomics 2003, 82:537-552.
51. Huang Y, Krein PM, Winston BW: Characterization of IFN-gamma regulation of the complement factor B gene in mac-rophages. Eur J Immunol 2001, 31:3676-3686.
52. Rhodes DA, Ihrke G, Reinicke AT, Malcherek G, Towey M, IsenbergDA, Trowsdale J: The 52 000 MW Ro/SS-A autoantigen inSjogren's syndrome/systemic lupus erythematosus (Ro52) isan interferon-gamma inducible tripartite motif protein asso-ciated with membrane proximal structures. Immunology 2002,106:246-256.
Page 16 of 16(page number not for citation purposes)
Recommended


![BMC Genomics BioMed Central1].pdf · BioMed Central Page 1 of 18 (page number not for citation purposes) BMC Genomics Research article Open Access Global patterns of sequence evolution](https://img.dokumen.tips/doc/110x75/5f4da8b84673135f021818e3/bmc-genomics-biomed-central-1pdf-biomed-central-page-1-of-18-page-number-not.jpg)


