Embed Size (px)
Citation preview

BioMed CentralBMC Genomics
ss
Open AcceResearch articleDArT markers: diversity analyses, genomes comparison, mapping and integration with SSR markers in Triticum monococcumHai-Chun Jing*1,4, Carlos Bayon1, Kostya Kanyuka1, Simon Berry2, Peter Wenzl3, Eric Huttner3, Andrzej Kilian3 and Kim E Hammond-Kosack*1Address: 1Centre for Sustainable Pest and Disease Management, Department of Plant Pathology and Microbiology, Rothamsted Research, Harpenden, Hertfordshire, AL5 2JQ, UK, 2Nickerson-Advanta, Woolpit Business Park, Woolpit, Bury St Edmunds, Suffolk, IP30 0RA, UK, 3Diversity Arrays Technology P/L and Triticarte Pty Ltd, 1 Wilf Crane Cr., Yarralumla, Canberra, ACT 2600, Australia and 4Centre for Bioenergy Plants Research and Development, Institute of Botany, Chinese Academy of Sciences, Beijing, 100093, PR China
Email: Hai-Chun Jing* - [email protected]; Carlos Bayon - [email protected]; Kostya Kanyuka - [email protected]; Simon Berry - [email protected]; Peter Wenzl - [email protected]; Eric Huttner - [email protected]; Andrzej Kilian - [email protected]; Kim E Hammond-Kosack* - [email protected]
* Corresponding authors
AbstractBackground: Triticum monococcum (2n = 2x = 14) is an ancient diploid wheat with many useful traits andis used as a model for wheat gene discovery. DArT (Diversity Arrays Technology) employs a hybridisation-based approach to type thousands of genomic loci in parallel. DArT markers were developed for T.monococcum to assess genetic diversity, compare relationships with hexaploid genomes, and construct agenetic linkage map integrating DArT and microsatellite markers.
Results: A DArT array, consisting of 2304 hexaploid wheat, 1536 tetraploid wheat, 1536 T. monococcumas well as 1536 T. boeoticum representative genomic clones, was used to fingerprint 16 T. monococcumaccessions of diverse geographical origins. In total, 846 polymorphic DArT markers were identified, ofwhich 317 were of T. monococcum origin, 246 of hexaploid, 157 of tetraploid, and 126 of T. boeoticumgenomes. The fingerprinting data indicated that the geographic origin of T. monococcum accessions waspartially correlated with their genetic variation. DArT markers could also well distinguish the geneticdifferences amongst a panel of 23 hexaploid wheat and nine T. monococcum genomes. For the first time,274 DArT markers were integrated with 82 simple sequence repeat (SSR) and two morphological traitloci in a genetic map spanning 1062.72 cM in T. monococcum. Six chromosomes were represented by singlelinkage groups, and chromosome 4Am was formed by three linkage groups. The DArT and SSR genetic locitended to form independent clusters along the chromosomes. Segregation distortion was observed forone third of the DArT loci. The Ba (black awn) locus was refined to a 23.2 cM region between the DArTmarker locus wPt-2584 and the microsatellite locus Xgwmd33 on 1Am; and the Hl (hairy leaf) locus to a 4.0cM region between DArT loci 376589 and 469591 on 5Am.
Conclusion: DArT is a rapid and efficient approach to develop many new molecular markers for geneticstudies in T. monococcum. The constructed genetic linkage map will facilitate localisation and map-basedcloning of genes of interest, comparative mapping as well as genome organisation and evolution studiesbetween this ancient diploid species and other crops.
Published: 30 September 2009
BMC Genomics 2009, 10:458 doi:10.1186/1471-2164-10-458
Received: 9 February 2009Accepted: 30 September 2009
This article is available from: http://www.biomedcentral.com/1471-2164/10/458
© 2009 Jing et al; licensee BioMed Central Ltd. This is an Open Access article distributed under the terms of the Creative Commons Attribution License (http://creativecommons.org/licenses/by/2.0), which permits unrestricted use, distribution, and reproduction in any medium, provided the original work is properly cited.
Page 1 of 17(page number not for citation purposes)

BMC Genomics 2009, 10:458 http://www.biomedcentral.com/1471-2164/10/458
BackgroundTriticum monococcum (2n = 2x = 14), generally known aseinkorn wheat, is an ancient diploid species domesticatedin the Fertile Crescent ~10,000 years ago ([1]. This speciesdominated human farming activities in the Neolithicperiod. However, the cultivation area gradually decreasedduring the Bronze Age due to domestication of tetraploidand hexaploid wheat [2]. In modern times T. monococcumremains cultivated at low scale only in the mountainousareas of several Mediterranean countries. This species hasnot been bred intensively and therefore retained itsgenetic diversity [3].
Wild relatives of hexaploid wheat are known to be impor-tant sources of traits for wheat genetic improvement. T.monococcum (AmAm) is closely related to T. urartu (AuAu),the donor of the A-genome of hexaploid wheat [4-6].Recently, T. monococcum has gradually been recognised asan attractive diploid model for exploitation of usefultraits, discovery of novel genes and variant alleles, andfunctional genomics. Many traits have been examined inT. monococcum which can be useful for modern wheatbreeding [7-9]. T. monococcum has also been successfullyused for gene discovery in a subgenome map-based clon-ing approach, as exemplified by the cloning of the leaf rustresistance gene Lr10 [10,11], the vernalisation genesVRN1 and VRN2 [12,13], the domestication locus Q[14,15], and a member of the senescence and nutrientremobilisation controlling NAC gene family [16]. Naturaland artificially mutagenised T. monococcum populationshave been made available and were used to identify andmap genes of agronomic importance [17,18]. Further-more, TILLING (Targeting Induced Local Lesions INGenomes) and VIGS (Virus Induced Gene Silencing) plat-forms for functional genomics are under development inseveral laboratories (http://www.wgin.org.uk; http://www.plantsciences.ucdavis.edu/dubcovsky). Thus, in theforeseeable future T. monococcum is expected to play animportant role in wheat genetic and genomic studies.
Globally, thousands of accessions of T. monococcum havebeen collected and retained in major germplasm stockcentres. In order to use T. monococcum resources efficientlyin programmes on genetic improvement of hexaploidwheat, it is necessary to assess diversity of this species atthe genome level. For this, high-throughput molecularmarker technologies are needed. T. monococcum has beenshown to possess a high level of polymorphism at DNAmarker loci[19]. RFLP (Restriction fragment length poly-morphism) and AFLP (Amplified fragment length poly-morphism) markers have been developed and used forgenerating genetic linkage maps and for mutation map-ping, map-based cloning, and genome synteny compari-sons [4,20-23]. These markers have also been used toresolve the site of the T. monococcum domestication [1].
Microsatellite markers (also called simple sequencerepeats or SSRs) have been tested in T. monococcum incomparison with hexaploid wheat and its A-genomedonor diploid species T. urartu. This information has beenused to produce a genetic map integrating RFLPs and SSRs[24,25]. However, the aforementioned markers are prima-rily gel-based and sequence-dependent. The cost per datapoint, labour-intensive assay procedures and the limita-tion of polymorphism of the current marker technologiesrestricts their application to whole-genome scanapproaches such as large-scale genotyping of germplasmcollections, association mapping, pedigree analysis andQTL (Quantitative Trait Loci) Mapping As You Go [26].
Diversity Arrays Technology (DArT) has been developedas a sequence-independent and micro-array hybridisa-tion-based marker system [27]. DArT generates medium-density genome scans by scoring the presence versusabsence of DNA fragments in representations of genomicDNA samples. It simultaneously determines hundreds tothousands of polymorphic loci in a single assay [27,28].Since its initial development in rice, DArT has beenemployed in genetic mapping, genotyping and diversityassessment in barley [28-31], Arabidopsis [32], cassava[33], sorghum [34], hexaploid and durum wheat [35-38],and approximately 30 other plant species (DiversityArrays Technolgy P/L, unpublished data). DArT has alsobeen used to study pan-genomic evolution in non-modelorganisms [39] because of its high-throughput and cost-effective nature.
We report here the results of a study aimed to (1) developa T. monococcum diversity array (DArT) for high-through-put genome-wide genotyping, (2) assess the utility of theDArT technology for analysis of genetic diversity in a rep-resentative collection of T. monococcum accessions, (3)compare the relationships between the Am-genome andother Triticum genomes using DArT markers, (4) producea genetic linkage map for T. monococcum integrating DArTand SSR markers, and (5) refine the genome locations oftwo morphological trait loci.
ResultsArray compositionA total of 1536 DArT clones were developed from a PstI/TaqI representation generated from a mixture of DNA oftwo T. monococcum accessions MDR002 and MDR308[35]. These two accessions were the parents for a largemapping population, which had previously been geno-typed with SSR markers and used for mapping severalagronomically important traits [8,9]. In a parallel project,a substantial number of DArT clones were developed fromgenomic representations of other Triticum species withdifferent ploidy levels (Triticarte P/L, unpublished). Wecombined clones from all projects to assemble a custom-
Page 2 of 17(page number not for citation purposes)
BMC Genomics 2009, 10:458 http://www.biomedcentral.com/1471-2164/10/458
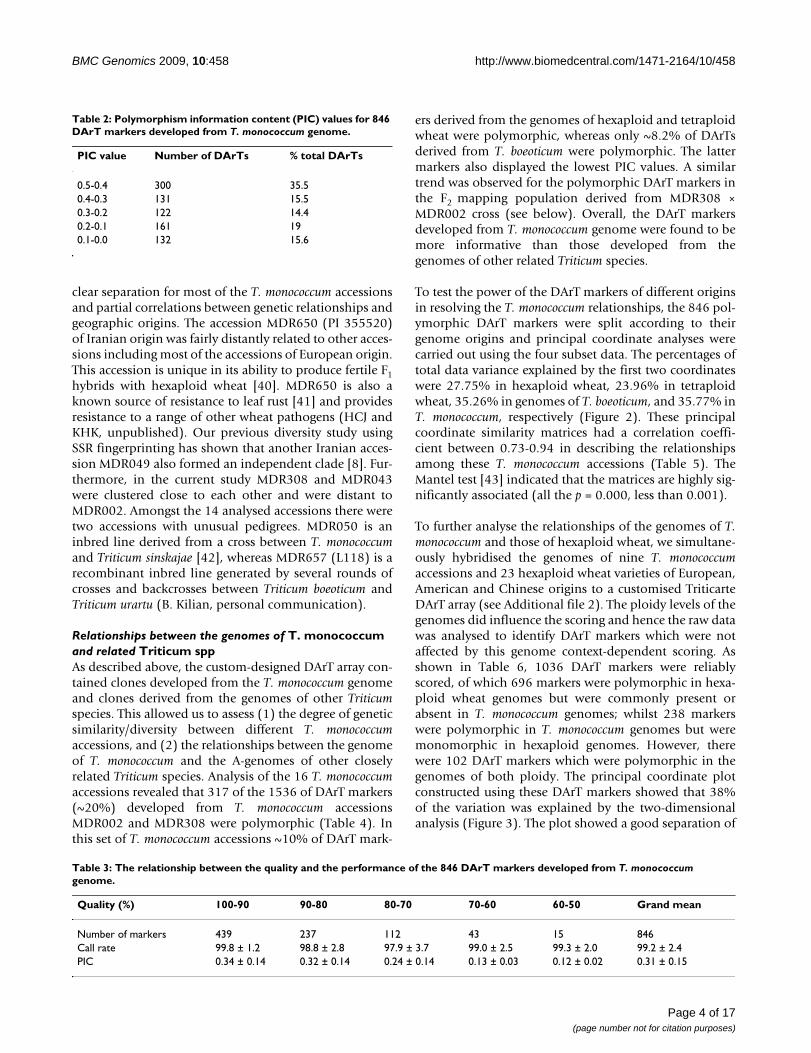
designed array containing 1536 clones derived from thetwo T. monococcum accessions, 2304 clones derived fromhexaploid wheats (including the Triticarte Wheat 2.3array), 1536 clones derived from tetraploid durum wheat(including the Triticarte Durum 2.0 array), and 1536clones derived from 15 Iranian accessions of T. boeoticumBoiss., which is the wild relative of T. monococcum (seeAdditional file 1; Ali Mehrabi, unpublished data).
Genetic diversity amongst T. monococcum accessions revealed by DArTThe composite array was used to assess the genetic diver-sity amongst sixteen T. monococcum accessions listed inTable 1. They were pre-selected based on their geographi-cal origins, useful traits, available molecular and genetictools, as well as genetic relationships assessed using SSRfingerprinting [8].
In total, 846 DArT markers were identified as polymor-phic amongst the 16 accessions. Polymorphism Informa-tion Content (PIC) values for these markers wererelatively low, with only 35.5% of DArTs having PIC val-
ues of 0.4-0.5 and 34.6% with PIC values < 0.2 (Table 2).The average mean PIC value was 0.31. When the qualityof the DArT markers (measured as the % of total variancein hybridisation intensity between the two clusters:present and absent) was analysed against their perform-ance, which is determined through call rate and PIC val-ues, more than half of the polymorphic DArT markers (n= 439) were in the 90-100% quality category with an aver-age PIC value of 0.34 and call rate of 99.8%, respectively(Table 3). The average PIC value decreased with the aver-age quality value. PIC values were > 0.30 when the markerquality was > 80%. However, PIC values were reduced to0.24, 0.13 and 0.12 for markers with the quality values of70-80%, 60-70% and 50-60%, respectively.
This set of polymorphic DArT markers was used to assessthe genetic diversity of the 16 T. monococcum accessions. AJaccard similarity matrix was generated and used to con-struct a principal coordinate plot deciphering the geneticrelationships among the accessions (Figure 1). The firsttwo principal coordinates derived from the scores jointlyexplained 23.74% of the total data variance. There was a
Table 1: T. monococcum accessions used in this study
Accession Variety Origin Country Year of collection Growth habit Donors Resources
MDR001 flavescens Algeria - Spring JIC6 Transformable12
MDR002 atriaristatum Balkans - Spring JIC Transformable12, mapping population
MDR024 hornemannii; flavescens Chechen 1904 Spring VIR7
MDR037 macedonicum Armenia 1934 Spring VIRMDR040 vulgare; macedonicum Bulgaria 1940 Spring VIR Mapping populationMDR043 vulgare Greece 1950 Spring VIR Mapping populationMDR044 hornemannii Turkey 1965 Spring VIR Mapping populationMDR045 vulgare Denmark 1970 Spring VIRMDR046 atriaristatum/macedonicum Romania 1970 Spring VIRMDR047 macedonicum; vulgare Hungary 1970 Winter VIRMDR049 pseudohornemannii Iran Winter VIRMDR0501 Italy Spring JIC EMS mutagenised population13
MDR217 Turkey Spring USDA8 Mapping populationMDR229 Spain Spring USDA Mapping populationMDR3082 Italy Spring UC Davis9 BAC library, genetic map, EST
library, mapping populationsMDR6503 Iran USDAMDR6524 Turkey ACPFG10 Mapping populationsMDR6575 ? MPI11 Mapping populations
1Selection from a cross between T. monococcum and T. sinskajae (Korzun et al., 1998) [42].2T. monococcum DV92; provided by Jorge Dubcovsky, UC Davies, USA.3T. monococcum PI 355520 from USDA, ARS, USA.4T. monococcum AUS16273-2; provided by Dr. Yuri Shavrukov, ACPFG, Australia.5T. monococcum L118; provided by Benjamin Killian, MPI, Cologne, Germany.6John Innes Centre, Norwich, United Kingdom.7N. I. Vavilov Institute of Plant Industry, St. Petersburg, Russian Federation.8United States Department of Agriculture, Agricultural Research Service, Aberdeen, ID, USA.9University of California, Davis, CA, USA.10Australian Centre for Plant Functional Genomics, Canberra, Australia.11Max Planck Institute, Cologne, Germany.12Huw Jones, Rothamsted Research, Harpenden, UK, personal communication.13Kay Denyer, John Innes Centre, UK, personal communication.
Page 3 of 17(page number not for citation purposes)
BMC Genomics 2009, 10:458 http://www.biomedcentral.com/1471-2164/10/458
clear separation for most of the T. monococcum accessionsand partial correlations between genetic relationships andgeographic origins. The accession MDR650 (PI 355520)of Iranian origin was fairly distantly related to other acces-sions including most of the accessions of European origin.This accession is unique in its ability to produce fertile F1hybrids with hexaploid wheat [40]. MDR650 is also aknown source of resistance to leaf rust [41] and providesresistance to a range of other wheat pathogens (HCJ andKHK, unpublished). Our previous diversity study usingSSR fingerprinting has shown that another Iranian acces-sion MDR049 also formed an independent clade [8]. Fur-thermore, in the current study MDR308 and MDR043were clustered close to each other and were distant toMDR002. Amongst the 14 analysed accessions there weretwo accessions with unusual pedigrees. MDR050 is aninbred line derived from a cross between T. monococcumand Triticum sinskajae [42], whereas MDR657 (L118) is arecombinant inbred line generated by several rounds ofcrosses and backcrosses between Triticum boeoticum andTriticum urartu (B. Kilian, personal communication).
Relationships between the genomes of T. monococcum and related Triticum sppAs described above, the custom-designed DArT array con-tained clones developed from the T. monococcum genomeand clones derived from the genomes of other Triticumspecies. This allowed us to assess (1) the degree of geneticsimilarity/diversity between different T. monococcumaccessions, and (2) the relationships between the genomeof T. monococcum and the A-genomes of other closelyrelated Triticum species. Analysis of the 16 T. monococcumaccessions revealed that 317 of the 1536 of DArT markers(~20%) developed from T. monococcum accessionsMDR002 and MDR308 were polymorphic (Table 4). Inthis set of T. monococcum accessions ~10% of DArT mark-
ers derived from the genomes of hexaploid and tetraploidwheat were polymorphic, whereas only ~8.2% of DArTsderived from T. boeoticum were polymorphic. The lattermarkers also displayed the lowest PIC values. A similartrend was observed for the polymorphic DArT markers inthe F2 mapping population derived from MDR308 ×MDR002 cross (see below). Overall, the DArT markersdeveloped from T. monococcum genome were found to bemore informative than those developed from thegenomes of other related Triticum species.
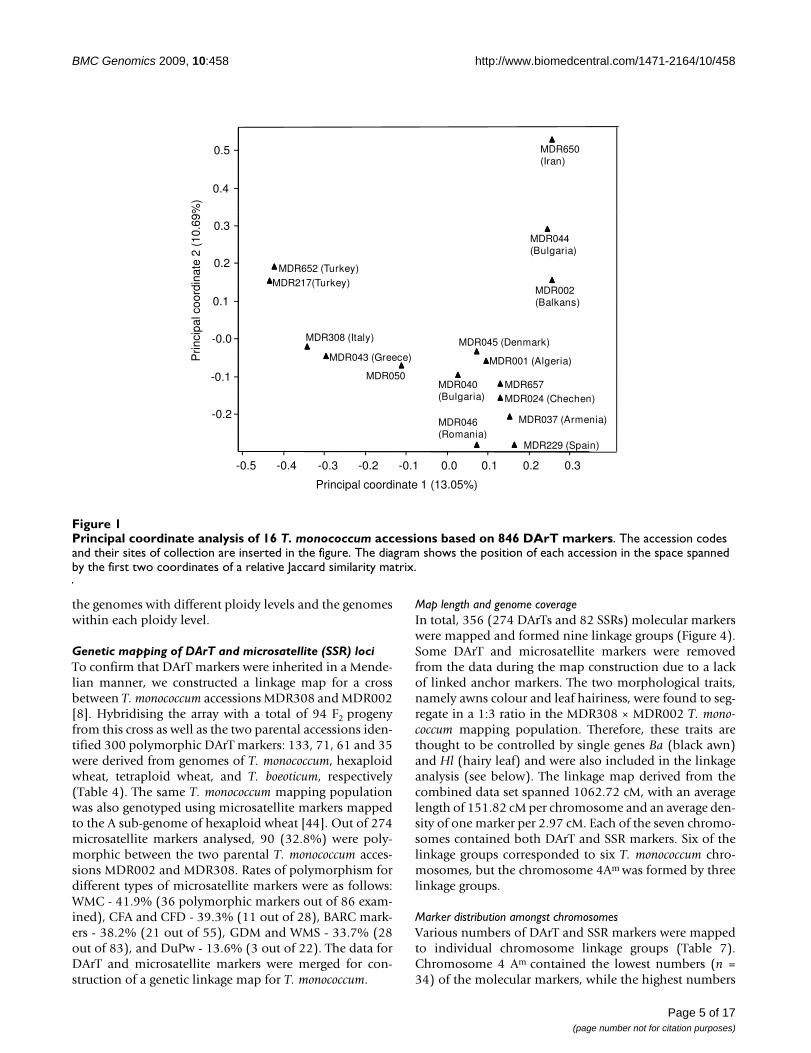
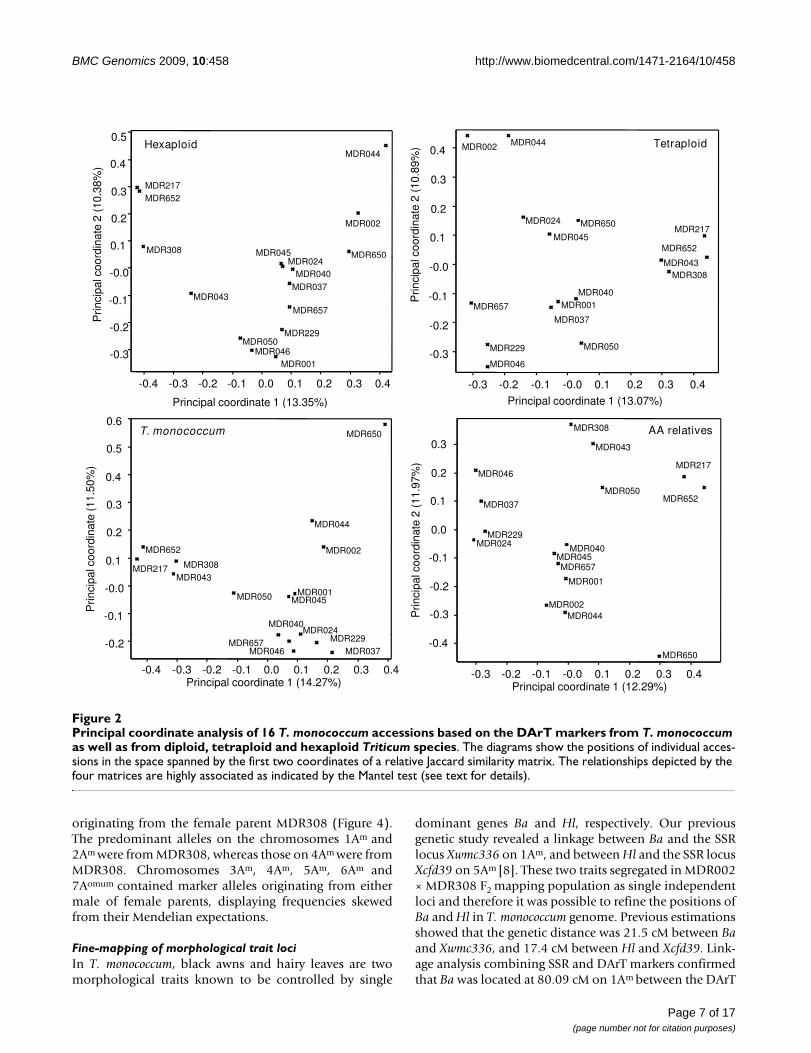
To test the power of the DArT markers of different originsin resolving the T. monococcum relationships, the 846 pol-ymorphic DArT markers were split according to theirgenome origins and principal coordinate analyses werecarried out using the four subset data. The percentages oftotal data variance explained by the first two coordinateswere 27.75% in hexaploid wheat, 23.96% in tetraploidwheat, 35.26% in genomes of T. boeoticum, and 35.77% inT. monococcum, respectively (Figure 2). These principalcoordinate similarity matrices had a correlation coeffi-cient between 0.73-0.94 in describing the relationshipsamong these T. monococcum accessions (Table 5). TheMantel test [43] indicated that the matrices are highly sig-nificantly associated (all the p = 0.000, less than 0.001).
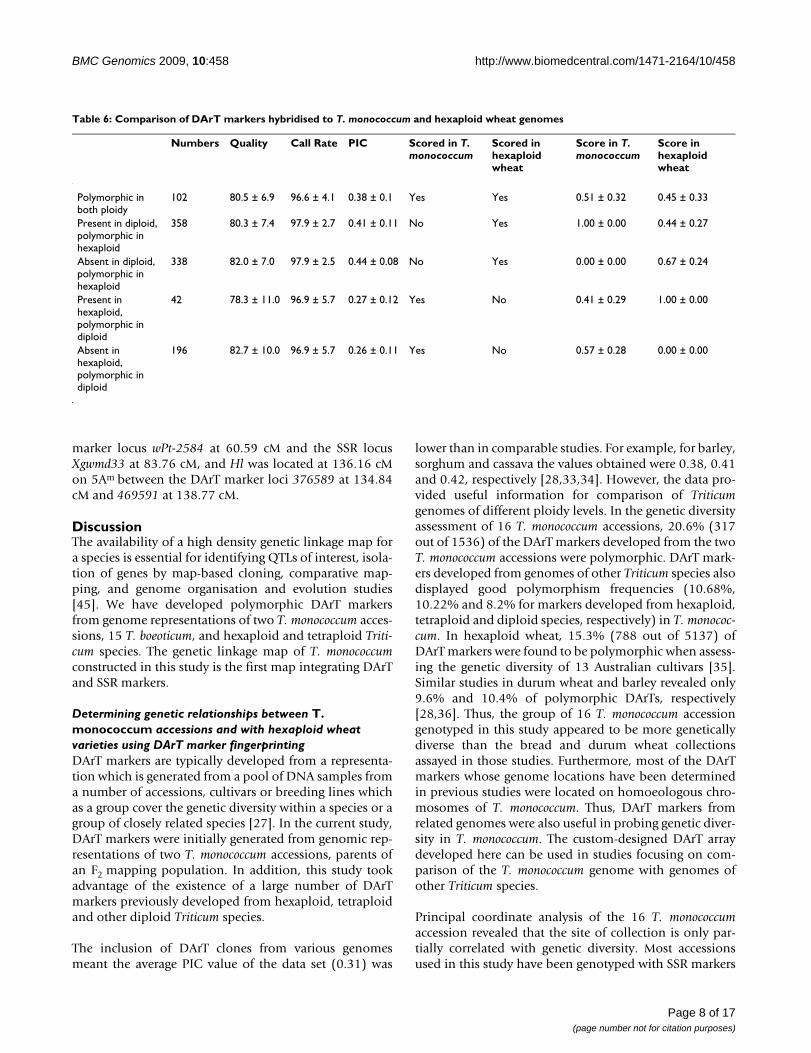
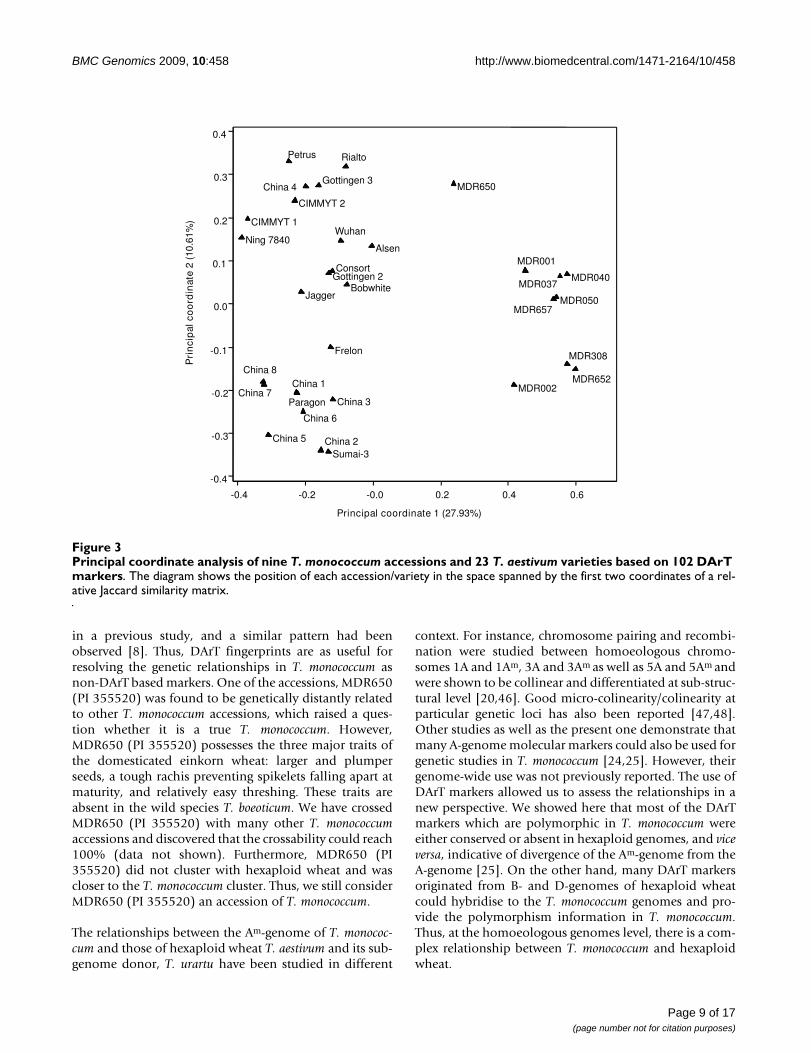
To further analyse the relationships of the genomes of T.monococcum and those of hexaploid wheat, we simultane-ously hybridised the genomes of nine T. monococcumaccessions and 23 hexaploid wheat varieties of European,American and Chinese origins to a customised TriticarteDArT array (see Additional file 2). The ploidy levels of thegenomes did influence the scoring and hence the raw datawas analysed to identify DArT markers which were notaffected by this genome context-dependent scoring. Asshown in Table 6, 1036 DArT markers were reliablyscored, of which 696 markers were polymorphic in hexa-ploid wheat genomes but were commonly present orabsent in T. monococcum genomes; whilst 238 markerswere polymorphic in T. monococcum genomes but weremonomorphic in hexaploid genomes. However, therewere 102 DArT markers which were polymorphic in thegenomes of both ploidy. The principal coordinate plotconstructed using these DArT markers showed that 38%of the variation was explained by the two-dimensionalanalysis (Figure 3). The plot showed a good separation of
Table 2: Polymorphism information content (PIC) values for 846 DArT markers developed from T. monococcum genome.
PIC value Number of DArTs % total DArTs
0.5-0.4 300 35.50.4-0.3 131 15.50.3-0.2 122 14.40.2-0.1 161 190.1-0.0 132 15.6
Table 3: The relationship between the quality and the performance of the 846 DArT markers developed from T. monococcum genome.
Quality (%) 100-90 90-80 80-70 70-60 60-50 Grand mean
Number of markers 439 237 112 43 15 846Call rate 99.8 ± 1.2 98.8 ± 2.8 97.9 ± 3.7 99.0 ± 2.5 99.3 ± 2.0 99.2 ± 2.4PIC 0.34 ± 0.14 0.32 ± 0.14 0.24 ± 0.14 0.13 ± 0.03 0.12 ± 0.02 0.31 ± 0.15
Page 4 of 17(page number not for citation purposes)
BMC Genomics 2009, 10:458 http://www.biomedcentral.com/1471-2164/10/458
the genomes with different ploidy levels and the genomeswithin each ploidy level.
Genetic mapping of DArT and microsatellite (SSR) lociTo confirm that DArT markers were inherited in a Mende-lian manner, we constructed a linkage map for a crossbetween T. monococcum accessions MDR308 and MDR002[8]. Hybridising the array with a total of 94 F2 progenyfrom this cross as well as the two parental accessions iden-tified 300 polymorphic DArT markers: 133, 71, 61 and 35were derived from genomes of T. monococcum, hexaploidwheat, tetraploid wheat, and T. boeoticum, respectively(Table 4). The same T. monococcum mapping populationwas also genotyped using microsatellite markers mappedto the A sub-genome of hexaploid wheat [44]. Out of 274microsatellite markers analysed, 90 (32.8%) were poly-morphic between the two parental T. monococcum acces-sions MDR002 and MDR308. Rates of polymorphism fordifferent types of microsatellite markers were as follows:WMC - 41.9% (36 polymorphic markers out of 86 exam-ined), CFA and CFD - 39.3% (11 out of 28), BARC mark-ers - 38.2% (21 out of 55), GDM and WMS - 33.7% (28out of 83), and DuPw - 13.6% (3 out of 22). The data forDArT and microsatellite markers were merged for con-struction of a genetic linkage map for T. monococcum.
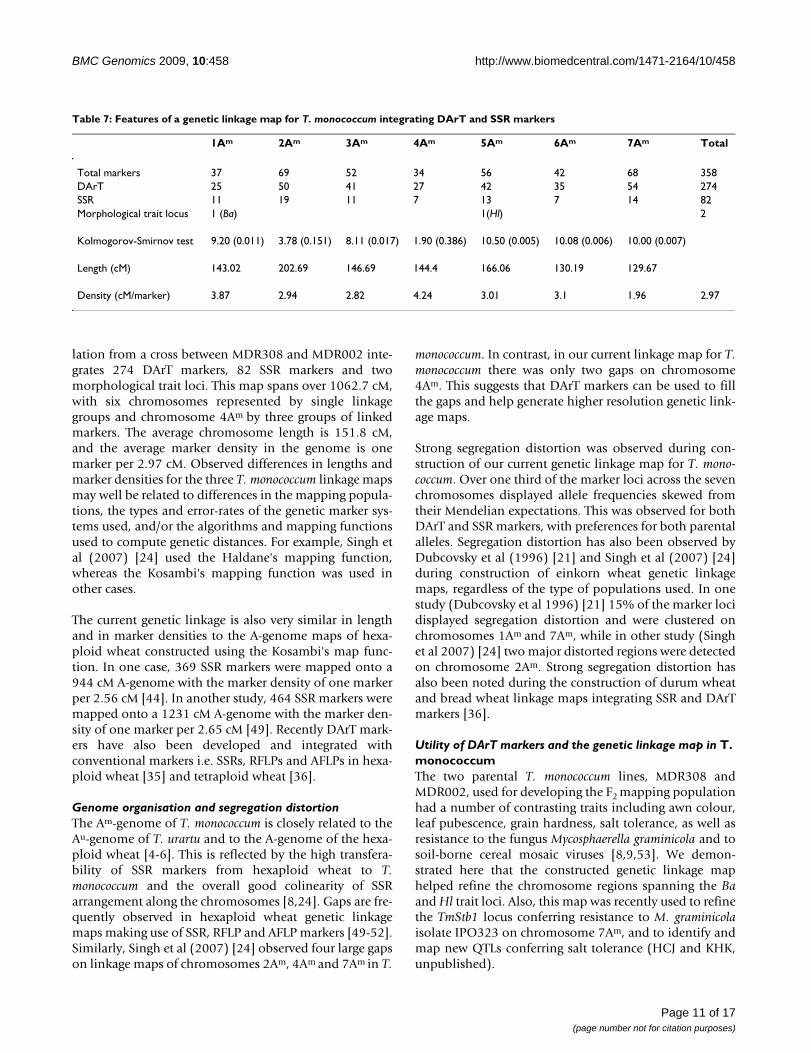
Map length and genome coverageIn total, 356 (274 DArTs and 82 SSRs) molecular markerswere mapped and formed nine linkage groups (Figure 4).Some DArT and microsatellite markers were removedfrom the data during the map construction due to a lackof linked anchor markers. The two morphological traits,namely awns colour and leaf hairiness, were found to seg-regate in a 1:3 ratio in the MDR308 × MDR002 T. mono-coccum mapping population. Therefore, these traits arethought to be controlled by single genes Ba (black awn)and Hl (hairy leaf) and were also included in the linkageanalysis (see below). The linkage map derived from thecombined data set spanned 1062.72 cM, with an averagelength of 151.82 cM per chromosome and an average den-sity of one marker per 2.97 cM. Each of the seven chromo-somes contained both DArT and SSR markers. Six of thelinkage groups corresponded to six T. monococcum chro-mosomes, but the chromosome 4Am was formed by threelinkage groups.
Marker distribution amongst chromosomesVarious numbers of DArT and SSR markers were mappedto individual chromosome linkage groups (Table 7).Chromosome 4 Am contained the lowest numbers (n =34) of the molecular markers, while the highest numbers
Principal coordinate analysis of 16 T. monococcum accessions based on 846 DArT markersFigure 1Principal coordinate analysis of 16 T. monococcum accessions based on 846 DArT markers. The accession codes and their sites of collection are inserted in the figure. The diagram shows the position of each accession in the space spanned by the first two coordinates of a relative Jaccard similarity matrix.
MDR6500.5(Iran)
0.4%
)
MDR652 (Turkey)
MDR044(Bulgaria)
0.2
0.3
te 2
(10
.69%
MDR652 (Turkey)MDR217(Turkey)
MDR002(Balkans)0.1
al c
oord
ina
MDR043 (Greece)
MDR040MDR050
MDR045 (Denmark)MDR308 (Italy)
MDR001 (Algeria)
MDR657-0.1
-0.0
Prin
cipa
MDR040(Bulgaria)
MDR037 (Armenia)
MDR024 (Chechen)
MDR046(Romania)
MDR657
-0.2
MDR229 (Spain)(Romania)
0.3-0.5 0.20.0-0.2-0.4 -0.1-0.3 0.1
Principal coordinate 1 (13.05%)
Page 5 of 17(page number not for citation purposes)

BMC Genomics 2009, 10:458 http://www.biomedcentral.com/1471-2164/10/458
(n = 68) were found on chromosome 7 Am. Kolmogorov-Smirnov tests were performed to compare nonparametri-cally the equality of the distributions of the DArT and SSRmarkers along individual chromosomes. The resultsshowed that chromosomes 1Am, 3Am, 5Am, 6Am and 7Am
had p-values smaller than 0.05 but chromosomes 2Am and4Am had larger p-values. These results suggest that DArTand SSR tended to form independent clusters on chromo-somes in T. monococcum.
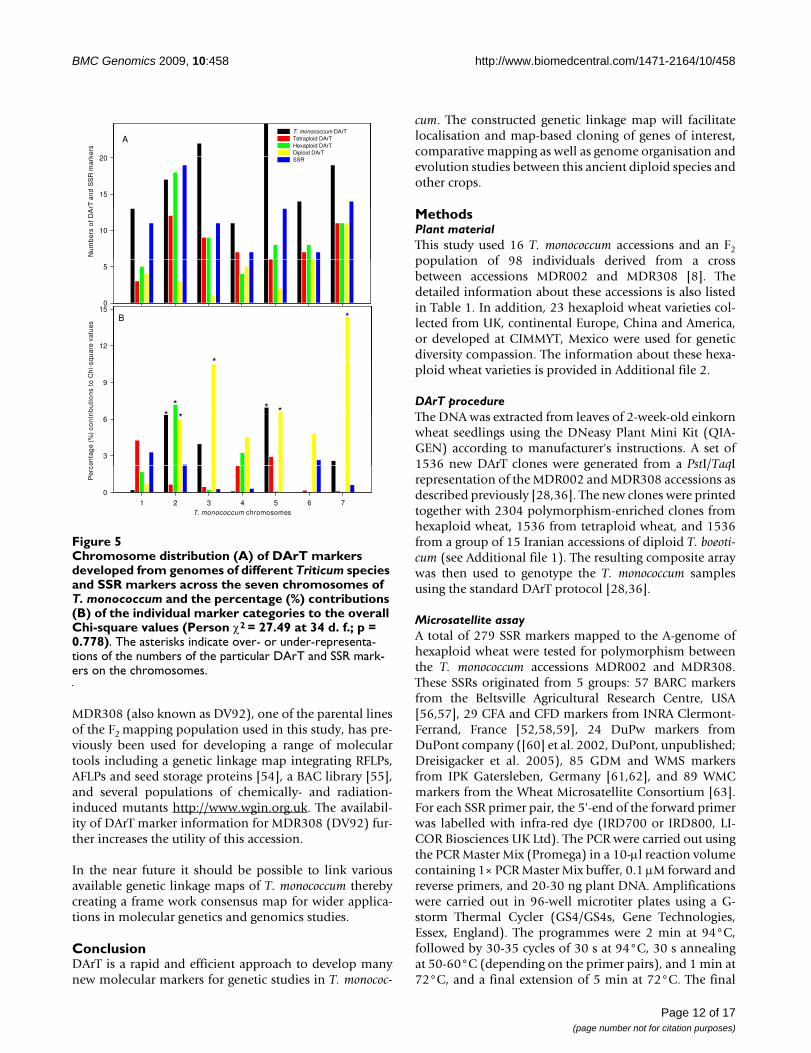
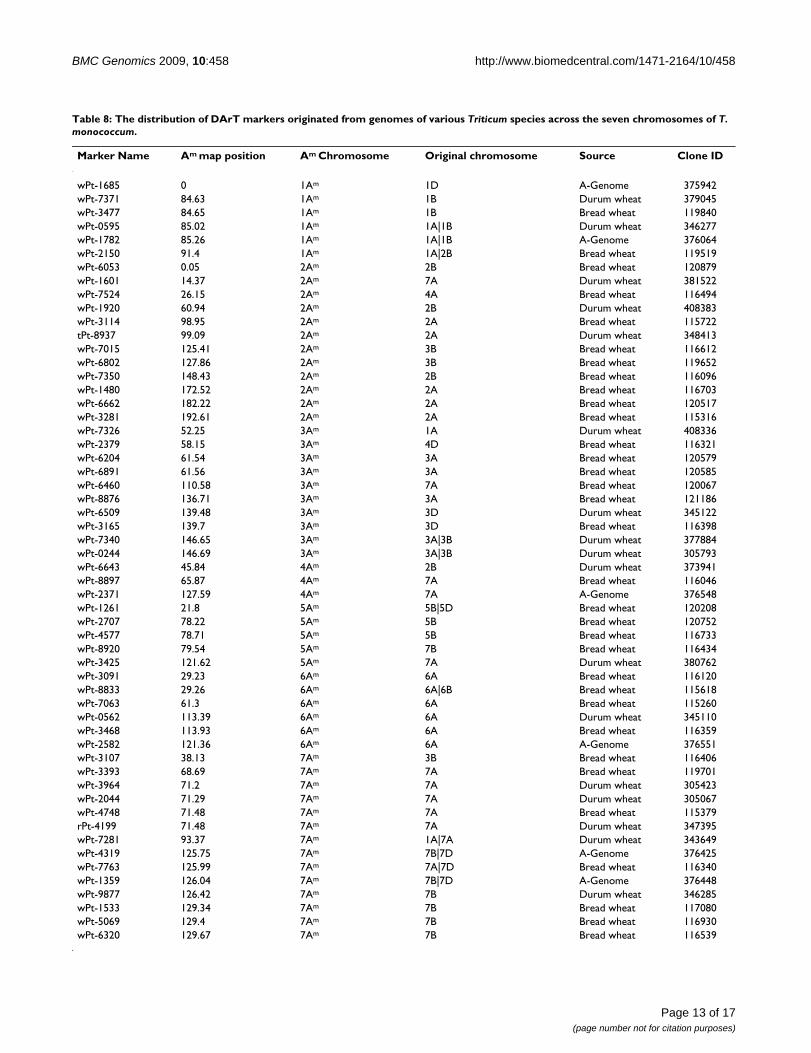
Distribution of DArT markers derived from genomes of different Triticum speciesThe mapped 274 polymorphic DArT markers werederived from T. aestivum, T. durum, T. monococcum and T.boeoticum. Figure 5 shows the numbers of the four cate-gory DArT markers and SSR markers on the seven chromo-somes. Chi-square goodness-of-fit test of associationsbetween origins of DArT markers and T. monococcum link-age groups showed that the distribution of DArT markersarising from different genomes and SSR markers was atrandom across chromosomes (Pearson χ2 = 27.49 with 34d.f., probability level under null hypothesis p = 0.778).However, in some cases, DArT markers of certain originswere either over- or under-numbered. For instance, therelated A genome DArT markers were under-representedon chromosomes 3Am, but over-represented on 7Am.
Fifty-eight of these markers are with known locations ingenomes of hexaploid and tetraploid wheat (Triticarte P/
L, unpublished); only 33 are of A-genome origins (Table8), suggesting that B and D genomes of other Triticum spe-cies could provide substantial polymorphic informationin the Am genome of T. monococcum. Each of the seven T.monococcum chromosomes carried loci of the DArT mark-ers that were previously mapped to homoeologous chro-mosomes in the B- or D-genomes of Triticum species(Figure 4). Also, the map positions of some of the A-genome derived DArTs determined in our study disagreedwith those obtained in previous studies. For instance,some of the markers thought to map to 4A and 7A in hex-aploid and tetraploid wheat were mapped to the chromo-some 2Am in T. monococcum, whereas some other DArTsthought to map to 7A in hexaploid and tetraploid wheatwere mapped to either 4Am or 5Am in our study (Table 8,and Figure 4).
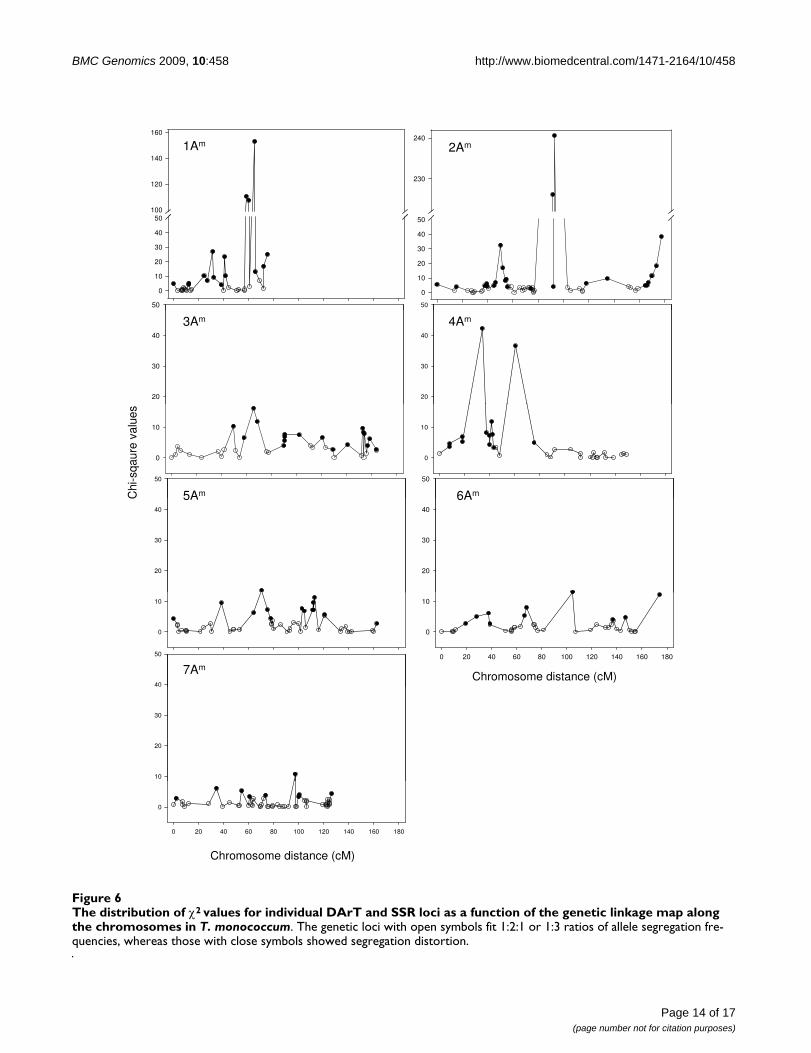
Segregation distortionIn total, 156 markers were significantly distorted from theexpected Mendelian segregation ratios (P < 0.05). Thesewere more or less equally distributed across the genome(Figure 6). The chromosomes 1Am, 2Am, 3Am, 4Am, 5Am,6Am and 7Am contained 37.8% (17/37), 43.5% (30/69),46.2% (24/52), 38.2% (13/34), 30.4% (17/56), 30.9%(13/42) and 14.7% (10/68) of markers displaying strongallelic frequency distortion, respectively. For some mark-ers the segregation distortion was in favour of alleles orig-inating from the male parent MDR002, whereas for othermarkers the segregation distortion was in favour of alleles
Table 4: Number and feature of polymorphic DArT markers identified in this study
Hexaploid wheat Tertraploid wheat T. boeoticum T. monococcum
Total DArT 2304 1536 1536 1536
Polymorphic among 16 accessions 246 (10.68%) 157 (10.22%) 126 (8.20%) 317 (20.64%)Mean quality (%) 86.3 ± 9.6 86.7 ± 9.3 85.0 ± 10.6 88.7 ± 8.8Mean call rate (%) 99.3 ± 2.1 99.1 ± 2.1 99.3 ± 2.1 99.1 ± 2.6Mean PIC 0.30 ± 0.14 0.32 ± 0.15 0.29 ± 0.15 0.32 ± 0.14
Polymorphic between MDR002 and MDR308 71 (3.08%) 61 (3.97%) 35 (2.28%) 133 (8.66%)Mean quality (%) 84.1 ± 6.0 83.3 ± 4.6 82.3 ± 4.9 85.3 ± 5.6Mean call rate (%) 93.8 ± 3.6 93.5 ± 2.8 93.1 ± 2.7 94.6 ± 3.0Mean PIC 0.42 ± 0.06 0.43 ± 0.05 0.43 ± 0.04 0.40 ± 0.07
Table 5: Correlation between pairs of similarity matrices describing the relationships of T. monococcum accessions generated by using DArT markers from different origins.
Whole DArT set Hexaploid Tetraploid T. monococcum T. boeoticum
Whole DArT set *Hexaploid 0.92 (0.000) *Tetraploid 0.87 (0.000) 0.76 (0.000) *T. monococcum 0.94 (0.000) 0.79 (0.000) 0.75 (0.000) *T. boeoticum 0.86 (0.000) 0.75 (0.000) 0.73 (0.000) 0.73 (0.000) *
Numbers between parentheses are the p-values for testing the null hypothesis of no association by Mantel test.
Page 6 of 17(page number not for citation purposes)
BMC Genomics 2009, 10:458 http://www.biomedcentral.com/1471-2164/10/458
originating from the female parent MDR308 (Figure 4).The predominant alleles on the chromosomes 1Am and2Am were from MDR308, whereas those on 4Am were fromMDR308. Chromosomes 3Am, 4Am, 5Am, 6Am and7Aomum contained marker alleles originating from eithermale of female parents, displaying frequencies skewedfrom their Mendelian expectations.
Fine-mapping of morphological trait lociIn T. monococcum, black awns and hairy leaves are twomorphological traits known to be controlled by single
dominant genes Ba and Hl, respectively. Our previousgenetic study revealed a linkage between Ba and the SSRlocus Xwmc336 on 1Am, and between Hl and the SSR locusXcfd39 on 5Am [8]. These two traits segregated in MDR002× MDR308 F2 mapping population as single independentloci and therefore it was possible to refine the positions ofBa and Hl in T. monococcum genome. Previous estimationsshowed that the genetic distance was 21.5 cM between Baand Xwmc336, and 17.4 cM between Hl and Xcfd39. Link-age analysis combining SSR and DArT markers confirmedthat Ba was located at 80.09 cM on 1Am between the DArT
Principal coordinate analysis of 16 T. monococcum accessions based on the DArT markers from T. monococcum as well as from diploid, tetraploid and hexaploid Triticum speciesFigure 2Principal coordinate analysis of 16 T. monococcum accessions based on the DArT markers from T. monococcum as well as from diploid, tetraploid and hexaploid Triticum species. The diagrams show the positions of individual acces-sions in the space spanned by the first two coordinates of a relative Jaccard similarity matrix. The relationships depicted by the four matrices are highly associated as indicated by the Mantel test (see text for details).
MDR217
MDR044
0.5
0.4
8%)
Hexaploid MDR044MDR002
0.3
0.4
0.89
%) Tetraploid
MDR650
MDR652
MDR045MDR308
MDR217
MDR002
0.1
0.2
0.3
rdin
ate
2 (1
0.38
MDR650
MDR652
MDR024
MDR045MDR217
0.1
0.2
0.3
coor
dina
te 2
(1
MDR650
MDR043
MDR040
MDR229
MDR037
MDR024
MDR657
-0.2
-0.0
-0.1
Prin
cipa
l coo MDR043
MDR040
MDR037
MDR308
MDR001MDR657
-0.2
-0.1
-0.0
Prin
cipa
l
MDR229MDR050
MDR046MDR001
-0.4
-0.3
0.30.1-0.1-0.3 0.40.0-0.2 0.2
Principal coordinate 1 (13.35%)
MDR229 MDR050
MDR046
0.4
-0.3
0.2-0.0-0.2-0.3 0.3-0.1 0.1
Principal coordinate 1 (13.07%)
MDR6500.6
0.4
0.5
0%)
T. monococcumMDR043
MDR308
MDR217MDR0460.2
0.3
97%
)AA relatives
MDR652
MDR044
MDR0020 1
0.2
0.3
oord
inat
e (1
1.50
MDR652
MDR040
MDR229
MDR037
MDR050
MDR024
MDR045-0 1
0.0
0.1
ordi
nate
2 (
11.9
MDR043
MDR040
MDR050
MDR024
MDR045
MDR308MDR217
MDR001
-0.1
0.1
-0.0
Prin
cipa
l co MDR045
MDR044MDR002
MDR001
MDR657
-0.3
-0.2
0.1
Prin
cipa
l coo
MDR229MDR037MDR046
MDR657
-0.4
-0.2
0.30.1-0.1-0.3 0.40.0-0.2 0.2Principal coordinate 1 (14.27%)
MDR650
0.4
-0.4
0.2-0.0-0.2-0.3 0.3-0.1 0.1Principal coordinate 1 (12.29%)
Page 7 of 17(page number not for citation purposes)
BMC Genomics 2009, 10:458 http://www.biomedcentral.com/1471-2164/10/458
marker locus wPt-2584 at 60.59 cM and the SSR locusXgwmd33 at 83.76 cM, and Hl was located at 136.16 cMon 5Am between the DArT marker loci 376589 at 134.84cM and 469591 at 138.77 cM.
DiscussionThe availability of a high density genetic linkage map fora species is essential for identifying QTLs of interest, isola-tion of genes by map-based cloning, comparative map-ping, and genome organisation and evolution studies[45]. We have developed polymorphic DArT markersfrom genome representations of two T. monococcum acces-sions, 15 T. boeoticum, and hexaploid and tetraploid Triti-cum species. The genetic linkage map of T. monococcumconstructed in this study is the first map integrating DArTand SSR markers.
Determining genetic relationships between T. monococcum accessions and with hexaploid wheat varieties using DArT marker fingerprintingDArT markers are typically developed from a representa-tion which is generated from a pool of DNA samples froma number of accessions, cultivars or breeding lines whichas a group cover the genetic diversity within a species or agroup of closely related species [27]. In the current study,DArT markers were initially generated from genomic rep-resentations of two T. monococcum accessions, parents ofan F2 mapping population. In addition, this study tookadvantage of the existence of a large number of DArTmarkers previously developed from hexaploid, tetraploidand other diploid Triticum species.
The inclusion of DArT clones from various genomesmeant the average PIC value of the data set (0.31) was
lower than in comparable studies. For example, for barley,sorghum and cassava the values obtained were 0.38, 0.41and 0.42, respectively [28,33,34]. However, the data pro-vided useful information for comparison of Triticumgenomes of different ploidy levels. In the genetic diversityassessment of 16 T. monococcum accessions, 20.6% (317out of 1536) of the DArT markers developed from the twoT. monococcum accessions were polymorphic. DArT mark-ers developed from genomes of other Triticum species alsodisplayed good polymorphism frequencies (10.68%,10.22% and 8.2% for markers developed from hexaploid,tetraploid and diploid species, respectively) in T. monococ-cum. In hexaploid wheat, 15.3% (788 out of 5137) ofDArT markers were found to be polymorphic when assess-ing the genetic diversity of 13 Australian cultivars [35].Similar studies in durum wheat and barley revealed only9.6% and 10.4% of polymorphic DArTs, respectively[28,36]. Thus, the group of 16 T. monococcum accessiongenotyped in this study appeared to be more geneticallydiverse than the bread and durum wheat collectionsassayed in those studies. Furthermore, most of the DArTmarkers whose genome locations have been determinedin previous studies were located on homoeologous chro-mosomes of T. monococcum. Thus, DArT markers fromrelated genomes were also useful in probing genetic diver-sity in T. monococcum. The custom-designed DArT arraydeveloped here can be used in studies focusing on com-parison of the T. monococcum genome with genomes ofother Triticum species.
Principal coordinate analysis of the 16 T. monococcumaccession revealed that the site of collection is only par-tially correlated with genetic diversity. Most accessionsused in this study have been genotyped with SSR markers
Table 6: Comparison of DArT markers hybridised to T. monococcum and hexaploid wheat genomes
Numbers Quality Call Rate PIC Scored in T. monococcum
Scored in hexaploid wheat
Score in T. monococcum
Score in hexaploid wheat
Polymorphic in both ploidy
102 80.5 ± 6.9 96.6 ± 4.1 0.38 ± 0.1 Yes Yes 0.51 ± 0.32 0.45 ± 0.33
Present in diploid, polymorphic in hexaploid
358 80.3 ± 7.4 97.9 ± 2.7 0.41 ± 0.11 No Yes 1.00 ± 0.00 0.44 ± 0.27
Absent in diploid, polymorphic in hexaploid
338 82.0 ± 7.0 97.9 ± 2.5 0.44 ± 0.08 No Yes 0.00 ± 0.00 0.67 ± 0.24
Present in hexaploid, polymorphic in diploid
42 78.3 ± 11.0 96.9 ± 5.7 0.27 ± 0.12 Yes No 0.41 ± 0.29 1.00 ± 0.00
Absent in hexaploid, polymorphic in diploid
196 82.7 ± 10.0 96.9 ± 5.7 0.26 ± 0.11 Yes No 0.57 ± 0.28 0.00 ± 0.00
Page 8 of 17(page number not for citation purposes)
BMC Genomics 2009, 10:458 http://www.biomedcentral.com/1471-2164/10/458
in a previous study, and a similar pattern had beenobserved [8]. Thus, DArT fingerprints are as useful forresolving the genetic relationships in T. monococcum asnon-DArT based markers. One of the accessions, MDR650(PI 355520) was found to be genetically distantly relatedto other T. monococcum accessions, which raised a ques-tion whether it is a true T. monococcum. However,MDR650 (PI 355520) possesses the three major traits ofthe domesticated einkorn wheat: larger and plumperseeds, a tough rachis preventing spikelets falling apart atmaturity, and relatively easy threshing. These traits areabsent in the wild species T. boeoticum. We have crossedMDR650 (PI 355520) with many other T. monococcumaccessions and discovered that the crossability could reach100% (data not shown). Furthermore, MDR650 (PI355520) did not cluster with hexaploid wheat and wascloser to the T. monococcum cluster. Thus, we still considerMDR650 (PI 355520) an accession of T. monococcum.
The relationships between the Am-genome of T. monococ-cum and those of hexaploid wheat T. aestivum and its sub-genome donor, T. urartu have been studied in different
context. For instance, chromosome pairing and recombi-nation were studied between homoeologous chromo-somes 1A and 1Am, 3A and 3Am as well as 5A and 5Am andwere shown to be collinear and differentiated at sub-struc-tural level [20,46]. Good micro-colinearity/colinearity atparticular genetic loci has also been reported [47,48].Other studies as well as the present one demonstrate thatmany A-genome molecular markers could also be used forgenetic studies in T. monococcum [24,25]. However, theirgenome-wide use was not previously reported. The use ofDArT markers allowed us to assess the relationships in anew perspective. We showed here that most of the DArTmarkers which are polymorphic in T. monococcum wereeither conserved or absent in hexaploid genomes, and viceversa, indicative of divergence of the Am-genome from theA-genome [25]. On the other hand, many DArT markersoriginated from B- and D-genomes of hexaploid wheatcould hybridise to the T. monococcum genomes and pro-vide the polymorphism information in T. monococcum.Thus, at the homoeologous genomes level, there is a com-plex relationship between T. monococcum and hexaploidwheat.
Principal coordinate analysis of nine T. monococcum accessions and 23 T. aestivum varieties based on 102 DArT markersFigure 3Principal coordinate analysis of nine T. monococcum accessions and 23 T. aestivum varieties based on 102 DArT markers. The diagram shows the position of each accession/variety in the space spanned by the first two coordinates of a rel-ative Jaccard similarity matrix.
RialtoPetrus
0.4
Rialto
China 4
CIMMYT 2
Gottingen 3MDR650
0.3
WuhanNing 7840
CIMMYT 1
Consort
AlsenMDR0010.1
0.2
2 (1
0.61
%)
Gottingen 2Bobwhite
Jagger MDR050
MDR040Consort
MDR037
MDR6570.0
co
ord
inat
e
MDR652China 8
Frelon MDR308-0.1
Pri
nci
pal
MDR652China 1China 7
China 3MDR002
China 6
Paragon
0 3
-0.2
China 2Sumai-3
China 5-0.3
-0.4
-0.2 0.2 0.6-0.4 -0.0 0.4
Principal coordinate 1 (27.93%)
Page 9 of 17(page number not for citation purposes)

BMC Genomics 2009, 10:458 http://www.biomedcentral.com/1471-2164/10/458
T. monococcum genetic linkage mapsA T. monococcum genetic map has been previously con-structed using MDR308 (DV92) as one of parental acces-sions by Dubcovsky et al (1996) [21]. This map contains335 markers, including RFLPs, isozymes, seed storage pro-teins, rRNA, and various morphological loci. The totallength of this map is 1071.6 cM, the average chromosomelength is 153.1 cM, and the average marker density is one
marker per 3.2 cM. More recently, Singh et al (2007) [24]used a T. boeoticum × T. monococcum RIL population toconstruct another genetic linkage map integrating 177 SSRand RFLP markers, and two morphological trait loci. Thetotal length of this map is 1262 cM, the average chromo-some length is 180.3 cM, and the average marker densityis one marker per 7.05 cM. In comparison, our currentgenetic map derived from linkage analysis of an F2 popu-
An integrated DArT and SSR genetic linkage map of T. monococcum. Figure 4An integrated DArT and SSR genetic linkage map of T. monococcum. The vertical bars represent the chromosomes of T. monococcum. The codes on the left are the DArT and SSR marker loci, with corresponding map locations in accumulative genetic distance (cM; Kosambi) on the right. The discrete segments of the vertical chromosomal bars are colour-coded accord-ing to the allele colour in the figure legends. He stands for alleles heterozygous for female (MDR308) and male (MDR002) alle-les, c for the female (MDR308) alleles in homozygous or heterozygous forms, d for male (MDR002) alleles in homozygous or heterozygous forms, and - for unknown alleles, respectively.
wPt-1685 0.00
469447 9 60
wPt-4350 0.00wPt-6053 0.00wPt-2147 0.10wPt-6245 13.20
470457 0.00
Xgwm530 7.80
469475 0.00
470617 8.10
469826469360
Xbarc180469427
0.001.905.505.90
469665 0.00 376730 0.00Xcfa2049 2.40wPt-1579 7.00
469650 7.10469447 9.60
Xbarc213 25.00
470239 28.50
wPt-0690 37.70
wPt-1601 14.40wPt-7524 26.10wPt-6259 26.50
470244 27.10469834 28.10
Xgwm296 30.50469571 35.60470024 36.00376319 36.00
Xwmc177 44.40wPt-0015 45.20wPt-6711 46 80
gwPt-2229 8.80
469283 21.20470334 23.20
Xwmc466 30.80469509 32.60470344 35.40469383 37.40469825 37 40
Xgwm397 16.40
wPt-0207 28.60wPt-4328 28.70
Xgwm260 40.00
Xcfa2234Xgwm415Xgwmd68Xwmc805Xwmc705wPt-3501
469779470381
wPt-3999wPt-1261Xwmc795Xgwm443
6.106.106.106.106.1014.5014.8017.1019.4021.8029.0031 90
Xtct4 23.10
wPt-3091 29.20wPt-8833 29.30wPt-3847 34.60wPt-8988 37.40
469675 8.70Xwmc283 12.20
469702 28.80Xbarc174 33.60wPt-3107 38.10Xwmc17 43.90
Xbarc108 50.40Xwmc596 50.40Xwmc603 51.30Xgwm959 52.50
376918 53.90wPt-4346 59 80wPt 0690 37.70
wPt-6009 41.70470184 41.80
wPt-4702 46.20469941 47.50470069 47.70376956 54.30
wPt-2584 60.60
B 80 10
wPt 6711 46.80469895 46.80469470 51.30469780 52.50
Xwmc32 56.00wPt-2120 58.10wPt-4101 60.20wPt-1920 60.90wPt-3081 62.00Xgwm122 63.00Xwmc296 66.10
469588 67.60470029 70 10
469825 37.40Xcfa2134 41.70Xwmc11 46.80
Xwmc861 46.90470097 49.20
wPt-7326 52.20Xbarc321 54.90
Xbarc57 56.80Xwmc844 57.30wPt-2379 58.20wPt-6204 61.50wPt-6891 61.60
Xgwm260 40.00375970 43.70
wPt-6643 45.80469701 46.20375894 48.30
wPt-1544 48.90wPt-5663 49.90Xwmc680 52.10
wPt-8897 65.90
Xgwm443
Xwmc845
wPt-1775469811469456
Xgwm639470219
X 404
31.90
38.40
45.3047.9048.1051.3052.40
63 50
Xcfd190 39.40
Xbarc171 45.50Xwmc753 46.10Xbarc146 47.20
470194 50.60wPt-5094 51.20Xwmc786 53.50
470661 60.70wPt-7063 61.30
470275 67 70
wPt 4346 59.80376685 60.50
Xwmc488 62.00Xbarc172 63.90wPt-1835 64.40
469845 64.60469609 65.00469522 65.10
wPt-3393 68.70wPt-3964 71.20wPt-2044 71.30rPt-4199 71.50Pt 4748 71 50Ba 80.10
Xgwmd33 83.80wPt-7371 84.60wPt-3477 84.60
470362 84.70wPt-0595 85.00
470301 85.10wPt-1782 85.30Xgwm136 85.70Xcfa2153 86.30
469810 88.60377173 89.50
470029 70.10Xgwm275 72.10
469275 74.20Xgwm249 74.70Xgwm448 75.60Xwmc420 79.40Xwmc779 80.60wPt-6393 81.70
469773 82.00wPt-2949 82.00wPt-8826 82.10wPt-2128 82.30
469535 70.50wPt-0030 71.00wPt-0919 71.00
470642 71.20wPt-7000 71.30
469720 71.30rPt-7002 80.30469972 83.60
Xbarc69 92.40Xcfa2193 93.90
Xwmc161 81.90
Xgwm118 92.30470258 95.20
Pt 6475 98 20
Xwmc404470096
469513wPt-2707wPt-6191wPt-4577
469631wPt-8920
469312469962
63.5066.10
75.3078.2078.3078.7079.0079.5082.1089.30
470275 67.70wPt-8331 67.80
470051 67.80wPt-5711 72.90
470004 85.30wPt-1185 85.40
469916 87.10469416 91.20
wPt-3191 94.40470486 103.40469511 105 00
wPt-4748 71.50Xwmc748 72.50
Xdupw254 74.70470283 77.90470490 78.60470432 81.10469418 81.80469827 81.90469433 82.10
Xwmc790 87.30470248 88.80
wPt-5924 91.70470651 89.60
wPt-2150 91.40470350 92.20
Xwmc336 100.10470514 104.70469865 107.40469684 111.30
wPt-7547 82.30376266 82.50
Xwmc644 83.40wPt-4934 84.90wPt-1602 85.00Xbarc83 98.20
wPt-3114 99.00tPt-8937 99.10
Xgwm135 99.30Xgwm312 114.40Xwmc407 116.70wPt-7015 125 40
wPt-9018 101.50
Xcfa2183 105.00
wPt-0418 110.20wPt-6460 110.60
470101 117.00469552 121.20469850 131.90469774 134.50
wPt-6408 135.40
wPt-6475 98.20
Xdupw4 111.80
469610 119.40469847 120.90
Xwmc497 0.00
469962rPt-0699
Xcfa2141470235469404376306
Xwmc110470404
wPt-2490469625469525470434469686
89.3093.1093.8096.40101.00101.90103.50105.10106.30112.40112.50112.70113 40
469511 105.00rPt-6189 108.90rPt-9324 109.10
wPt-6678 110.80wPt-7655 111.20wPt-2877 111.20wPt-1170 111.40wPt-0562 113.40
469974 113.60wPt-3468 113.90wPt-2582 121.40
469337 122.60
469968 91.90469198 92.00
wPt-7281 93.40470509 94.90
wPt-4665 100.20wPt-5656 103.20wPt-6369 103.50Xwmc525 107.70wPt-2018 109.50Xcfa2040 110.70
469569 113.90Xgwm344 122 10
Xgwm752 136.10Xbarc148 138.30
Xwmc278 143.00Xwmc469 143.00Xwmc611 143.00Xwmc716 143.00
wPt 7015 125.40469368 127.50
wPt-6802 127.90wPt-8587 131.20
wPt-7350 148.40
wPt 6408 135.40469162 136.00
wPt-8876 136.70469920 136.90
wPt-8203 137.20wPt-6509 139.50wPt-3165 139.70
469676 140.20469816 141.00469801 141.40
wPt-7340 146.60470049 146.60
wPt 0244 146 70
Xwmc497 0.00tPt-9948 2.60
wPt-2371 5.60wPt-5489 5.70
469296 5.80469989 5.80
wPt-3773 6.00wPt-3876 12.40
wPt-3135 19.50wPt-3648 19.50
469291 0 00
469686Xcfd39
wPt-3425469708
376589Hl
469591469658
wPt-8103470407
113.40116.00121.60121.80
134.80136.20138.80141.10142.60146.30
470188 123.90469387 124.00
wPt-8926 125.70376632 127.80
Xgwm617 130.20
Xgwm344 122.10470210 125.20469602 125.70
wPt-4319 125.70376424 125.80376449 125.80
wPt-3659 125.80wPt-7763 126.00wPt-1359 126.00wPt-6276 126.10wPt-1475 126.30wPt-9877 126.40
Xgwmd93 166.80Xgwm526 168.30
469358 169.70wPt-1480 172.50Xgwm311 174.60
469559 179.90469139 181.40
wPt-6662 182.20
wPt-0244 146.70 469291 0.00470345 1.80470387 4.00
470355wPt-7794wPt-1095
162.60163.40166.10
wPt-5377 127.70wPt-9245 128.20wPt-6797 129.20wPt-1533 129.30wPt-5069 129.40wPt-6320 129.70
wPt-0825 185.10wPt-5850 185.30Xgwm601 187.50wPt-3281 192.60
469462 199.60470583 202.70
MDR308Female
MDR002Male
He dc -
Page 10 of 17(page number not for citation purposes)
BMC Genomics 2009, 10:458 http://www.biomedcentral.com/1471-2164/10/458
lation from a cross between MDR308 and MDR002 inte-grates 274 DArT markers, 82 SSR markers and twomorphological trait loci. This map spans over 1062.7 cM,with six chromosomes represented by single linkagegroups and chromosome 4Am by three groups of linkedmarkers. The average chromosome length is 151.8 cM,and the average marker density in the genome is onemarker per 2.97 cM. Observed differences in lengths andmarker densities for the three T. monococcum linkage mapsmay well be related to differences in the mapping popula-tions, the types and error-rates of the genetic marker sys-tems used, and/or the algorithms and mapping functionsused to compute genetic distances. For example, Singh etal (2007) [24] used the Haldane's mapping function,whereas the Kosambi's mapping function was used inother cases.
The current genetic linkage is also very similar in lengthand in marker densities to the A-genome maps of hexa-ploid wheat constructed using the Kosambi's map func-tion. In one case, 369 SSR markers were mapped onto a944 cM A-genome with the marker density of one markerper 2.56 cM [44]. In another study, 464 SSR markers weremapped onto a 1231 cM A-genome with the marker den-sity of one marker per 2.65 cM [49]. Recently DArT mark-ers have also been developed and integrated withconventional markers i.e. SSRs, RFLPs and AFLPs in hexa-ploid wheat [35] and tetraploid wheat [36].
Genome organisation and segregation distortionThe Am-genome of T. monococcum is closely related to theAu-genome of T. urartu and to the A-genome of the hexa-ploid wheat [4-6]. This is reflected by the high transfera-bility of SSR markers from hexaploid wheat to T.monococcum and the overall good colinearity of SSRarrangement along the chromosomes [8,24]. Gaps are fre-quently observed in hexaploid wheat genetic linkagemaps making use of SSR, RFLP and AFLP markers [49-52].Similarly, Singh et al (2007) [24] observed four large gapson linkage maps of chromosomes 2Am, 4Am and 7Am in T.
monococcum. In contrast, in our current linkage map for T.monococcum there was only two gaps on chromosome4Am. This suggests that DArT markers can be used to fillthe gaps and help generate higher resolution genetic link-age maps.
Strong segregation distortion was observed during con-struction of our current genetic linkage map for T. mono-coccum. Over one third of the marker loci across the sevenchromosomes displayed allele frequencies skewed fromtheir Mendelian expectations. This was observed for bothDArT and SSR markers, with preferences for both parentalalleles. Segregation distortion has also been observed byDubcovsky et al (1996) [21] and Singh et al (2007) [24]during construction of einkorn wheat genetic linkagemaps, regardless of the type of populations used. In onestudy (Dubcovsky et al 1996) [21] 15% of the marker locidisplayed segregation distortion and were clustered onchromosomes 1Am and 7Am, while in other study (Singhet al 2007) [24] two major distorted regions were detectedon chromosome 2Am. Strong segregation distortion hasalso been noted during the construction of durum wheatand bread wheat linkage maps integrating SSR and DArTmarkers [36].
Utility of DArT markers and the genetic linkage map in T. monococcumThe two parental T. monococcum lines, MDR308 andMDR002, used for developing the F2 mapping populationhad a number of contrasting traits including awn colour,leaf pubescence, grain hardness, salt tolerance, as well asresistance to the fungus Mycosphaerella graminicola and tosoil-borne cereal mosaic viruses [8,9,53]. We demon-strated here that the constructed genetic linkage maphelped refine the chromosome regions spanning the Baand Hl trait loci. Also, this map was recently used to refinethe TmStb1 locus conferring resistance to M. graminicolaisolate IPO323 on chromosome 7Am, and to identify andmap new QTLs conferring salt tolerance (HCJ and KHK,unpublished).
Table 7: Features of a genetic linkage map for T. monococcum integrating DArT and SSR markers
1Am 2Am 3Am 4Am 5Am 6Am 7Am Total
Total markers 37 69 52 34 56 42 68 358DArT 25 50 41 27 42 35 54 274SSR 11 19 11 7 13 7 14 82Morphological trait locus 1 (Ba) 1(Hl) 2
Kolmogorov-Smirnov test 9.20 (0.011) 3.78 (0.151) 8.11 (0.017) 1.90 (0.386) 10.50 (0.005) 10.08 (0.006) 10.00 (0.007)
Length (cM) 143.02 202.69 146.69 144.4 166.06 130.19 129.67
Density (cM/marker) 3.87 2.94 2.82 4.24 3.01 3.1 1.96 2.97
Page 11 of 17(page number not for citation purposes)
BMC Genomics 2009, 10:458 http://www.biomedcentral.com/1471-2164/10/458
MDR308 (also known as DV92), one of the parental linesof the F2 mapping population used in this study, has pre-viously been used for developing a range of moleculartools including a genetic linkage map integrating RFLPs,AFLPs and seed storage proteins [54], a BAC library [55],and several populations of chemically- and radiation-induced mutants http://www.wgin.org.uk. The availabil-ity of DArT marker information for MDR308 (DV92) fur-ther increases the utility of this accession.
In the near future it should be possible to link variousavailable genetic linkage maps of T. monococcum therebycreating a frame work consensus map for wider applica-tions in molecular genetics and genomics studies.
ConclusionDArT is a rapid and efficient approach to develop manynew molecular markers for genetic studies in T. monococ-
cum. The constructed genetic linkage map will facilitatelocalisation and map-based cloning of genes of interest,comparative mapping as well as genome organisation andevolution studies between this ancient diploid species andother crops.
MethodsPlant materialThis study used 16 T. monococcum accessions and an F2population of 98 individuals derived from a crossbetween accessions MDR002 and MDR308 [8]. Thedetailed information about these accessions is also listedin Table 1. In addition, 23 hexaploid wheat varieties col-lected from UK, continental Europe, China and America,or developed at CIMMYT, Mexico were used for geneticdiversity compassion. The information about these hexa-ploid wheat varieties is provided in Additional file 2.
DArT procedureThe DNA was extracted from leaves of 2-week-old einkornwheat seedlings using the DNeasy Plant Mini Kit (QIA-GEN) according to manufacturer's instructions. A set of1536 new DArT clones were generated from a PstI/TaqIrepresentation of the MDR002 and MDR308 accessions asdescribed previously [28,36]. The new clones were printedtogether with 2304 polymorphism-enriched clones fromhexaploid wheat, 1536 from tetraploid wheat, and 1536from a group of 15 Iranian accessions of diploid T. boeoti-cum (see Additional file 1). The resulting composite arraywas then used to genotype the T. monococcum samplesusing the standard DArT protocol [28,36].
Microsatellite assayA total of 279 SSR markers mapped to the A-genome ofhexaploid wheat were tested for polymorphism betweenthe T. monococcum accessions MDR002 and MDR308.These SSRs originated from 5 groups: 57 BARC markersfrom the Beltsville Agricultural Research Centre, USA[56,57], 29 CFA and CFD markers from INRA Clermont-Ferrand, France [52,58,59], 24 DuPw markers fromDuPont company ([60] et al. 2002, DuPont, unpublished;Dreisigacker et al. 2005), 85 GDM and WMS markersfrom IPK Gatersleben, Germany [61,62], and 89 WMCmarkers from the Wheat Microsatellite Consortium [63].For each SSR primer pair, the 5'-end of the forward primerwas labelled with infra-red dye (IRD700 or IRD800, LI-COR Biosciences UK Ltd). The PCR were carried out usingthe PCR Master Mix (Promega) in a 10-μl reaction volumecontaining 1× PCR Master Mix buffer, 0.1 μM forward andreverse primers, and 20-30 ng plant DNA. Amplificationswere carried out in 96-well microtiter plates using a G-storm Thermal Cycler (GS4/GS4s, Gene Technologies,Essex, England). The programmes were 2 min at 94°C,followed by 30-35 cycles of 30 s at 94°C, 30 s annealingat 50-60°C (depending on the primer pairs), and 1 min at72°C, and a final extension of 5 min at 72°C. The final
Chromosome distribution (A) of DArT markers developed from genomes of different Triticum species and SSR markers across the seven chromosomes of T. monococcum and the percentage (%) contributions (B) of the individual marker categories to the overall Chi-square values (Person χ2 = 27.49 at 34 d. f.; p = 0.778)Figure 5Chromosome distribution (A) of DArT markers developed from genomes of different Triticum species and SSR markers across the seven chromosomes of T. monococcum and the percentage (%) contributions (B) of the individual marker categories to the overall Chi-square values (Person χ2 = 27.49 at 34 d. f.; p = 0.778). The asterisks indicate over- or under-representa-tions of the numbers of the particular DArT and SSR mark-ers on the chromosomes.
kers
20
T. monococcum DArTTetraploid DArTHexaploid DArTDiploid DArT
A
rT a
nd
SS
R m
ark
15
20 SSR
Nu
mb
ers
of
DA
r
10
1 2 3 4 5 6 70
5
15 1 2 3 4 5 6 7
squ
are
valu
es
12
15*
*
B
ibu
tio
ns
to C
hi-
s
9
** **
*
enta
ge
(%)
con
tr
3
6 *
T. monococcum chromosomes1 2 3 4 5 6 7
Per
c
0
Page 12 of 17(page number not for citation purposes)
BMC Genomics 2009, 10:458 http://www.biomedcentral.com/1471-2164/10/458
Page 13 of 17(page number not for citation purposes)
Table 8: The distribution of DArT markers originated from genomes of various Triticum species across the seven chromosomes of T. monococcum.
Marker Name Am map position Am Chromosome Original chromosome Source Clone ID
wPt-1685 0 1Am 1D A-Genome 375942wPt-7371 84.63 1Am 1B Durum wheat 379045wPt-3477 84.65 1Am 1B Bread wheat 119840wPt-0595 85.02 1Am 1A|1B Durum wheat 346277wPt-1782 85.26 1Am 1A|1B A-Genome 376064wPt-2150 91.4 1Am 1A|2B Bread wheat 119519wPt-6053 0.05 2Am 2B Bread wheat 120879wPt-1601 14.37 2Am 7A Durum wheat 381522wPt-7524 26.15 2Am 4A Bread wheat 116494wPt-1920 60.94 2Am 2B Durum wheat 408383wPt-3114 98.95 2Am 2A Bread wheat 115722tPt-8937 99.09 2Am 2A Durum wheat 348413wPt-7015 125.41 2Am 3B Bread wheat 116612wPt-6802 127.86 2Am 3B Bread wheat 119652wPt-7350 148.43 2Am 2B Bread wheat 116096wPt-1480 172.52 2Am 2A Bread wheat 116703wPt-6662 182.22 2Am 2A Bread wheat 120517wPt-3281 192.61 2Am 2A Bread wheat 115316wPt-7326 52.25 3Am 1A Durum wheat 408336wPt-2379 58.15 3Am 4D Bread wheat 116321wPt-6204 61.54 3Am 3A Bread wheat 120579wPt-6891 61.56 3Am 3A Bread wheat 120585wPt-6460 110.58 3Am 7A Bread wheat 120067wPt-8876 136.71 3Am 3A Bread wheat 121186wPt-6509 139.48 3Am 3D Durum wheat 345122wPt-3165 139.7 3Am 3D Bread wheat 116398wPt-7340 146.65 3Am 3A|3B Durum wheat 377884wPt-0244 146.69 3Am 3A|3B Durum wheat 305793wPt-6643 45.84 4Am 2B Durum wheat 373941wPt-8897 65.87 4Am 7A Bread wheat 116046wPt-2371 127.59 4Am 7A A-Genome 376548wPt-1261 21.8 5Am 5B|5D Bread wheat 120208wPt-2707 78.22 5Am 5B Bread wheat 120752wPt-4577 78.71 5Am 5B Bread wheat 116733wPt-8920 79.54 5Am 7B Bread wheat 116434wPt-3425 121.62 5Am 7A Durum wheat 380762wPt-3091 29.23 6Am 6A Bread wheat 116120wPt-8833 29.26 6Am 6A|6B Bread wheat 115618wPt-7063 61.3 6Am 6A Bread wheat 115260wPt-0562 113.39 6Am 6A Durum wheat 345110wPt-3468 113.93 6Am 6A Bread wheat 116359wPt-2582 121.36 6Am 6A A-Genome 376551wPt-3107 38.13 7Am 3B Bread wheat 116406wPt-3393 68.69 7Am 7A Bread wheat 119701wPt-3964 71.2 7Am 7A Durum wheat 305423wPt-2044 71.29 7Am 7A Durum wheat 305067wPt-4748 71.48 7Am 7A Bread wheat 115379rPt-4199 71.48 7Am 7A Durum wheat 347395wPt-7281 93.37 7Am 1A|7A Durum wheat 343649wPt-4319 125.75 7Am 7B|7D A-Genome 376425wPt-7763 125.99 7Am 7A|7D Bread wheat 116340wPt-1359 126.04 7Am 7B|7D A-Genome 376448wPt-9877 126.42 7Am 7B Durum wheat 346285wPt-1533 129.34 7Am 7B Bread wheat 117080wPt-5069 129.4 7Am 7B Bread wheat 116930wPt-6320 129.67 7Am 7B Bread wheat 116539
BMC Genomics 2009, 10:458 http://www.biomedcentral.com/1471-2164/10/458
Page 14 of 17(page number not for citation purposes)
The distribution of χ2 values for individual DArT and SSR loci as a function of the genetic linkage map along the chromosomes in T. monococcumFigure 6The distribution of χ2 values for individual DArT and SSR loci as a function of the genetic linkage map along the chromosomes in T. monococcum. The genetic loci with open symbols fit 1:2:1 or 1:3 ratios of allele segregation fre-quencies, whereas those with close symbols showed segregation distortion.
50100
120
140
160
230
2401Am 2Am
0
10
20
30
40
50
0
10
20
30
40
50
50 50
20
30
40
20
30
40
3Am 4Am
0
10
0
10
50 50
Chi
-sqa
ure
valu
es
5Am 6Am
20
30
40
20
30
40
C 5A 6A
0
10
0 20 40 60 80 100 120 140 160 180
0
10
40
50
Chromosome distance (cM)7Am
10
20
30
0 20 40 60 80 100 120 140 160 180
0
Chromosome distance (cM)
BMC Genomics 2009, 10:458 http://www.biomedcentral.com/1471-2164/10/458
PCR products were diluted to 20-40 times using forma-mide Li-Cor loading dye, denatured for 5 min at 85°C andstored on ice before 0.5-0.8 μ1 of the reaction mix wasloaded on Li-Cor 4300 DNA Analyser.
T. monococcum accession diversity analysis and comparison with hexaploid wheatA group of 16 T. monococcum accessions were genotypedusing the custom-built DArT array as described previously[36]. The polymorphic DArT markers were scored, andused for clustering analysis using principal coordinateplots. For genome comparison, genome representationsof nine T. monococcum accessions and 23 hexaploid wheatvarieties were hybridised to a newly built DArT array andscored the same way. The ploidy levels did influence thescoring as envisaged in the raw data of the hybridisationintensity. Therefore, only the DArT markers which werenot affected by this context-dependent scoring werescored. The nine T. monococcum accessions and 23 hexa-ploid wheat varieties were hybridised in duplicate.
Genetic mapping and integration of DArT and SSR markersT. monococcum accessions MDR308, MDR002 and 94 F2individuals derived from a cross between them were gen-otyped with the custom-built array as described previ-ously [36]. In total, 300 DArT markers, 90 SSR markers aswell as two morphological trait loci (Ba, black awn; Hl,hairy leaf) were used for genetic linkage map constructionusing JoinMap® 4.0 (Van Ooijen, J.W., 2006, JoinMap®
4.0, Software for the calculation of genetic linkage mapsin experimental populations. Kyazma B. V., Wageningen,The Netherlands). Because of the inherent dominantnature of DArT markers which separates the female andmale markers in the repulsion phase, the linkage maps formaternal DArT markers (scored as a, c) and for parentalDArT markers (scored as b, d) were initially constructedindependently with SSR markers. The two maps for indi-vidual chromosomal linkage groups were then mergedtogether using SSR markers as bridges. Assignment ofmarkers to linkage groups was achieved using logarithmof the odds (LOD) threshold values ranging from 3.0 to10.0. The Kosambi's map function was used to estimategenetic distances. In total, 358 markers including 274DArT markers, 82 SSR markers and 2 morphological traitlocus markers were integrated into nine linkage groups.Goodness of fit for all the loci to an expected 1:2:1 or 1:3segregation ratio was tested using chi-square (χ2) analysis.The graphical representation of the map was drawn usingGGT2.2 software [64].
Statistical analysisAll statistical analyses were carried out using GenStat (10th
edition, VSN International, UK). For principal coordinateanalysis Jaccard similarity matrices were generated using
the DArT markers. Two-dimensional scores were calcu-lated and used to generate scatter plot matrices of scores.For the Mantel test which looks for association betweenthe off-diagonal values of two similarity (or distance)matrices, the correlation of the matrices were evaluated.The DArT markers were subdivided into four different cat-egories depending on their genome origins and similaritymatrices calculated. The similarity coefficients from thesematrices were then compared pair by pair to form a newcorrelation matrix. The significance of each correlationwas assessed using a randomisation test (with 1000 ran-dom permutations). The p-values were calculated andwere always < 0.001 (where the null hypothesis is one ofzero association). For the Kolmogorov-Smirnov test, themap position data of the DArT and SSR markers on indi-vidual chromosomes were fed into GenStat and the p-val-ues were calculated. The Chi-square goodness-of-fit testwas carried out to examine the random distribution ofDArT markers of different origins across the genome, bycalculating the association between the numbers of themarkers of different origins the chromosomes.
Data depositionThe genetic marker and linkage map data, along withdetails and accession numbers for the deposition of rawdata, are freely available at the UK WGIN http://www.WGIN.org.uk and Monogram http://www.mono-gram.ac.uk/services.php as well as the GrainGene http://wheat.pw.usda.gov/GG2/index.shtml websites.
Competing interestsEmployees of DArT PL co-authoring this paper (AK, EHand PW) provide DArT array commercial genotyping serv-ices for a range of crops and may benefit financially fromthis work.
Authors' contributionsAll authors read and approved the final manuscript. KHK,HCJ and AK designed the study and coordinated theresearch activities. HCJ, KHK and KK drafted the manu-script. HCJ, CB, KK and SB developed SSR markers forTriticum monococcum. PW, EH and AK developed the DArTarray for T. monococcum, mapped DArT markers, andedited the manuscript. KHK raised the funds, initiated andsupervised the whole project.
Additional material
Additional file 1The 15 Iranian accessions of Triticum boeoticum used to generate the customised DArT array used in this study.Click here for file[http://www.biomedcentral.com/content/supplementary/1471-2164-10-458-S1.doc]
Page 15 of 17(page number not for citation purposes)
BMC Genomics 2009, 10:458 http://www.biomedcentral.com/1471-2164/10/458
AcknowledgementsThis research is part of the core project of the Wheat Genetic Improve-ment Network which is supported by a grant from the Department for Environment, Food and Rural Affairs (Defra, AR0709). The Li-Cor 4300 DNA analysers were purchased with funds received from a BBSRC - REI grant (BB/C5111056/1). The hexaploid wheat genotypes selected for anal-ysis were part of either the BBSRC-CASE studentship (BB/S/N/2002/846) awarded to KHK or the EU-FP6 Integrated Project BIOEXPLOIT (partner 007 KHK). We thank Dr. Sue Welham for her excellent statistical advice. We thank Daniel Jenk and Kim Oldham for their technical support in veri-fying SSR work. Rothamsted Research receives grant-aided support from the Biotechnology and Biological Sciences Research Council (BBSRC) of the UK.
References1. Heun M, Schäfer-Pregl R, Klawan D, Castagna R, Accerbi M, Borghi B,
Salamini F: Site of einkorn wheat domestication identified byDNA fingerprinting. Science 1997, 278(5341):1312-1314.
2. Zohary D, Hopf M: Domestication of plants in the Old World:The origin and spread of cultivated plants in West Asia,Europe, and the Nile Valley. 2nd edition. New York: Oxford Uni-versity Press; 1993; 1993.
3. Kilian B, Ozkan H, Walther A, Kohl J, Dagan T, Salamini F, Martin W:Molecular diversity at 18 loci in 321 wild and 92 domesticatelines reveal no reduction of nucleotide diversity during Triti-cum monococcum (Einkorn) domestication: implications forthe origin of agriculture. Mol Biol Evol 2007, 24(12):2657-2668.
4. Wicker T, Yahiaoui N, Guyot R, Schlagenhauf E, Liu Z-D, DubcovskyJ, Keller B: Rapid genome divergence at orthologous lowmolecular weight glutenin loci of the A and Am genomes ofwheat. Plant Cell 2003, 15(5):1186-1197.
5. Huang S, Sirikhachornkit A, Su X, Faris J, Gill B, Haselkorn R, GornickiP: Genes encoding plastid acetyl-CoA carboxylase and 3-phosphoglycerate kinase of the Triticum/Aegilops complexand the evolutionary history of polyploid wheat. Proc Natl AcadSci USA 2002, 99(12):8133-8138.
6. Dvorak J, Yang ZL, You FM, Luo MC: Deletion polymorphism inwheat chromosome regions with contrasting recombinationrates. Genetics 2004, 168(3):1665-1675.
7. James RA, Davenport RJ, Munns R: Physiological characteriza-tion of two genes for Na+ exclusion in durum wheat, Nax1and Nax2. Plant Physiol 2006, 142(4):1537-1547.
8. Jing HC, Kornyukhin D, Kanyuka K, Orford S, Zlatska A, MitrofanovaOP, Koebner R, Hammond-Kosack K: Identification of variationin adaptively important traits and genome-wide analysis oftrait-marker associations in Triticum monococcum. J Exp Bot2007, 58(13):3749-3764.
9. Jing HC, Lovell D, Gutteridge R, Jenk D, Kornyukhin D, MitrofanovaOP, Kema GH, Hammond-Kosack KE: Phenotypic and geneticanalysis of the Triticum monococcum-Mycosphaerella gramini-cola interaction. New Phytol 2008, 179(4):1121-1132.
10. Feuillet C, Travella S, Stein N, Albar L, Nublat A, Keller B: Map-based isolation of the leaf rust disease resistance gene Lr10from the hexaploid wheat (Triticum aestivum L.) genome.Proc Natl Acad Sci USA 2003, 100(25):15253-15258.
11. Stein N, Feuillet C, Wicker T, Schlagenhauf E, Keller B: Subgenomechromosome walking in wheat: a 450-kb physical contig inTriticum monococcum L. spans the Lr10 resistance locus inhexaploid wheat (Triticum aestivum L.). Proc Natl Acad Sci USA2000, 97(24):13436-13441.
12. Yan L, Loukoianov A, Tranquilli G, Helguera M, Fahima T, DubcovskyJ: Positional cloning of the wheat vernalization gene VRN1.Proc Natl Acad Sci USA 2003, 100(10):6263-6268.
13. Yan L, Helguera M, Kato K, Fukuyama S, Sherman J, Dubcovsky J:Allelic variation at the VRN-1 promoter region in polyploidwheat. Theor Appl Genet 2004, 109(8):1677-1686.
14. Faris JD, Fellers JP, Brooks SA, Gill BS: A bacterial artificial chro-mosome contig spanning the major domestication locus Q inwheat and identification of a candidate gene. Genetics 2003,164(1):311-321.
15. Simons KJ, Fellers JP, Trick HN, Zhang Z, Tai YS, Gill BS, Faris JD:Molecular characterization of the major wheat domestica-tion gene Q. Genetics 2006, 172(1):547-555.
16. Uauy C, Distelfeld A, Fahima T, Blechl A, Dubcovsky J: A NAC Generegulating senescence improves grain protein, zinc, and ironcontent in wheat. Science 2006, 314(5803):1298-1301.
17. Bullrich L, Appendino ML, Tranquilli G, Lewis S, Dubcovsky J: Map-ping of a thermo-sensitive earliness per se gene on Triticummonococcum chromosome 1A(m). Theor Appl Genet 2002,105(4):585-593.
18. Kuraparthy V, Sood S, Dhaliwal HS, Chhuneja P, Gill BS: Identifica-tion and mapping of a tiller inhibition gene (tin3) in wheat.Theor Appl Genet 2007, 114(2):285-294.
19. Castagna R, Maga G, Perenzin M, Heun M, Salamini F: RFLP-basedgenetic relationships of einkorn wheats. Theor Appl Genet 1994,88(6-7):818-823.
20. Dubcovsky J, Luo M-C, Dvorak J: Differentiation betweenhomoeologous chromosomes 1A of wheat and 1A-m of Triti-cum monococcum and its recognition by the wheat Ph1 locus.Proc Natl Acad Sci USA 1995, 92(14):6645-6649.
21. Dubcovsky J, Luo M-C, Zhong G-Y, Bransteitter R, Desai A, Kilian A,Kleinhofs A, Dvorak J: Genetic map of diploid wheat, Triticummonococcum L., and its comparison with maps of Hordeumvulgare L. Genetics 1996, 143(2):983-999.
22. Luo MC, Deal K, Yang ZL, Dvorak J: Comparative genetic mapsreveal extreme crossover localization in the Aegilopsspeltoides chromosomes. Theor Appl Genet 2005,111(6):1098-1106.
23. Faris JD, Zhang Z, Fellers JP, Gill BS: Micro-colinearity betweenrice, Brachypodium, and Triticum monococcum at the wheatdomestication locus Q. Funct Integr Genomics 2008, 8(2):149-164.
24. Singh K, Ghai M, Garg M, Chhuneja P, Kaur P, Schnurbusch T, KellerB, Dhaliwal HS: An integrated molecular linkage map of dip-loid wheat based on a Triticum boeoticum × T. monococcumRIL population. Theor Appl Genet 2007, 115(3):301-312.
25. Hammer K, Filatenko AA, Korzun V: Microsatellite markers - anew tool for distinguishing diploid wheat species. Genet ResourCrop Evol 2000, 47(5):497-505.
26. Podlich DW, Winkler CR, Cooper M: Mapping as you go: Aneffective approach for marker-assisted selection of complextraits. Crop Sci 2004, 44(5):1560-1571.
27. Jaccoud D, Peng K, Feinstein D, Kilian A: Diversity arrays: a solidstate technology for sequence information independent gen-otyping. Nucleic Acids Res 2001, 29(4):E25.
28. Wenzl P, Carling J, Kudrna D, Jaccoud D, Huttner E, Kleinhofs A, Kil-ian A: Diversity Arrays Technology (DArT) for whole-genome profiling of barley. Proc Natl Acad Sci USA 2004,101(26):9915-9920.
29. Hearnden PR, Eckermann PJ, McMichael GL, Hayden MJ, Eglinton JK,Chalmers KJ: A genetic map of 1,000 SSR and DArT markersin a wide barley cross. Theor Appl Genet 2007, 115(3):383-391.
30. Wenzl P, Li H, Carling J, Zhou M, Raman H, Paul E, Hearnden P, MaierC, Xia L, Caig V, et al.: A high-density consensus map of barleylinking DArT markers to SSR, RFLP and STS loci and agri-cultural traits. BMC Genomics 2006, 7:206.
31. Wenzl P, Raman H, Wang J, Zhou M, Huttner E, Kilian A: A DArTplatform for quantitative bulked segregant analysis. BMCGenomics 2007, 8:196.
32. Wittenberg AH, Lee T van der, Cayla C, Kilian A, Visser RG,Schouten HJ: Validation of the high-throughput marker tech-nology DArT using the model plant Arabidopsis thaliana. MolGenet Genomics 2005, 274(1):30-39.
33. Xia L, Peng K, Yang S, Wenzl P, de Vicente MC, Fregene M, Kilian A:DArT for high-throughput genotyping of Cassava (Manihotesculenta) and its wild relatives. Theor Appl Genet 2005,110(6):1092-1098.
Additional file 2Hexaploid wheat varieties used in comparative analysis using DArT mark-ers.Click here for file[http://www.biomedcentral.com/content/supplementary/1471-2164-10-458-S2.doc]
Page 16 of 17(page number not for citation purposes)
BMC Genomics 2009, 10:458 http://www.biomedcentral.com/1471-2164/10/458
Publish with BioMed Central and every scientist can read your work free of charge
"BioMed Central will be the most significant development for disseminating the results of biomedical research in our lifetime."
Sir Paul Nurse, Cancer Research UK
Your research papers will be:
available free of charge to the entire biomedical community
peer reviewed and published immediately upon acceptance
cited in PubMed and archived on PubMed Central
yours — you keep the copyright
Submit your manuscript here:http://www.biomedcentral.com/info/publishing_adv.asp
BioMedcentral
34. Mace ES, Xia L, Jordan DR, Halloran K, Parh DK, Huttner E, Wenzl P,Kilian A: DArT markers: diversity analyses and mapping inSorghum bicolor. BMC Genomics 2008, 9:26.
35. Akbari M, Wenzl P, Caig V, Carling J, Xia L, Yang S, Uszynski G, Moh-ler V, Lehmensiek A, Kuchel H, et al.: Diversity arrays technology(DArT) for high-throughput profiling of the hexaploid wheatgenome. Theor Appl Genet 2006, 113(8):1409-1420.
36. Peleg Z, Saranga Y, Suprunova T, Ronin Y, Roder MS, Kilian A, KorolAB, Fahima T: High-density genetic map of durum wheat ×wild emmer wheat based on SSR and DArT markers. TheorAppl Genet 2008, 117(1):103-115.
37. Semagn K, Bjornstad A, Skinnes H, Maroy AG, Tarkegne Y, WilliamM: Distribution of DArT, AFLP, and SSR markers in a geneticlinkage map of a doubled-haploid hexaploid wheat popula-tion. Genomes 2006, 49(5):545-555.
38. White J, Law JR, MacKay I, Chalmers KJ, Smith JS, Kilian A, Powell W:The genetic diversity of UK, US and Australian cultivars ofTriticum aestivum measured by DArT markers and consid-ered by genome. Theor Appl Genet 2008, 116(3):439-453.
39. James KE, Schneider H, Ansell SW, Evers M, Robba L, Uszynski G,Pedersen N, Newton AE, Russell SJ, Vogel JC, et al.: Diversity arraystechnology (DArT) for pan-genomic evolutionary studies ofnon-model organisms. PLoS ONE 2008, 3(2):e1682.
40. Cox TS, Harrell LG, Chen P, Gill BS: Reproductive behavior ofhexaploid-diploid wheat hybrids. Plant Breed 1991,107(2):105-118.
41. Jacobs AS, Pretorius JA, Kloppers FJ, Cox TS: Mechanisms associ-ated with wheat leaf rust resistance derived from Triticummonococcum. Phytopathology 1996, 86(6):588-595.
42. Korzun V, Röder M, Ganal M, Hammer K, Filatenko A: Geneticdiversity and evolution of the diploid wheats T. urartu, T. boe-oticum and T. monococcum revealed by microsatellite mark-ers. Schr Genet Ressour 1998, 8:244-247.
43. Mantel N: The detection of disease clustering and a general-ized regression approach. Cancer Res 1967, 27(2):209-220.
44. Somers DJ, Isaac P, Edwards K: A high-density microsatelliteconsensus map for bread wheat (Triticum aestivum L.). TheorAppl Genet 2004, 109(6):1105-1114.
45. Varshney RK, Langridge P, Graner A: Application of genomics tomolecular breeding of wheat and barley. Adv Genet 2007,58:121-155.
46. Luo MC, Yang ZL, Kota RS, Dvorak J: Recombination of chromo-somes 3A(m) and 5A(m) of Triticum monococcum with home-ologous chromosomes 3A and 5A of wheat: the distributionof recombination across chromosomes. Genetics 2000,154(3):1301-1308.
47. Chantret N, Cenci A, Sabot F, Anderson O, Dubcovsky J: Sequenc-ing of the Triticum monococcum hardness locus reveals goodmicrocolinearity with rice. Mol Genet Genomics 2004,271(4):377-386.
48. Chantret N, Salse J, Sabot F, Rahman S, Bellec A, Laubin B, Dubois I,Dossat C, Sourdille P, Joudrier P, et al.: Molecular basis of evolu-tionary events that shaped the hardness locus in diploid andpolyploid wheat species (Triticum and Aegilops). Plant Cell 2005,17(4):1033-1045.
49. Torada A, Koike M, Mochida K, Ogihara Y: SSR-based linkagemap with new markers using an intraspecific population ofcommon wheat. Theor Appl Genet 2006, 112(6):1042-1051.
50. Paillard S, Schnurbusch T, Winzeler M, Messmer M, Sourdille P,Abderhalden O, Keller B, Schachermayr G: An integrative geneticlinkage map of winter wheat (Triticum aestivum L.). TheorAppl Genet 2003, 107(7):1235-1242.
51. Quarrie SA, Steed A, Calestani C, Semikhodskii A, Lebreton C, Chi-noy C, Steele N, Pljevljakusic D, Waterman E, Weyen J, et al.: A high-density genetic map of hexaploid wheat (Triticum aestivumL.) from the cross Chinese Spring × SQ1 and its use to com-pare QTLs for grain yield across a range of environments.Theor Appl Genet 2005, 110(5):865-880.
52. Sourdille P, Cadalen T, Guyomarc'h H, Snape JW, Perretant MR,Charmet G, Boeuf C, Bernard S, Bernard M: An update of theCourtot × Chinese Spring intervarietal molecular markerlinkage map for the QTL detection of agronomic traits inwheat. Theor Appl Genet 2003, 106(3):530-538.
53. Kanyuka K, Lovell DJ, Mitrofanova OP, Hammond-Kosack K, AdamsMJ: A controlled environment test for resistance to Soil-borne cereal mosaic virus (SBCMV) and its use to determine
the mode of inheritance of resistance in wheat cv. Cadenzaand for screening Triticum monococcum genotypes forsources of SBCMV resistance. Plant Pathol 2004, 53(2):154-160.
54. Dubcovsky J, Luo MC, Zhong GY, Bransteitter R, Desai A, Kilian A,Kleinhofs A, Dvorak J: Genetic map of diploid wheat, Triticummonococcum L., and its comparison with maps of Hordeumvulgare L. Genetics 1996, 143(2):983-999.
55. Lijavetzky D, Muzzi G, Wicker T, Keller B, Wing R, Dubcovsky J:Construction and characterization of a bacterial artificialchromosome (BAC) library for the A genome of wheat.Genome 1999, 42(6):1176-1182.
56. Song QJ, Shi JR, Singh S, Fickus EW, Costa JM, Lewis J, Gill BS, WardR, Cregan PB: Development and mapping of microsatellite(SSR) markers in wheat. Theor Appl Genet 2005, 110(3):550-560.
57. Song QJ, Fickus EW, Cregan PB: Characterization of trinucle-otide SSR motifs in wheat. Theor Appl Genet 2002, 104(2-3):286-293.
58. Guyomarc'h H, Sourdille P, Charmet G, Edwards J, Bernard M: Char-acterisation of polymorphic microsatellite markers fromAegilops tauschii and transferability to the D-genome ofbread wheat. Theor Appl Genet 2002, 104(6-7):1164-1172.
59. Guyomarc'h H, Sourdille P, Edwards J, Bernard M: Studies of thetransferability of microsatellites derived from Triticumtauschii to hexaploid wheat and to diploid related speciesusing amplification, hybridization and sequence compari-sons. Theor Appl Genet 2002, 105(5):736-744.
60. Eujayl I, Sorrells ME, Baum M, Wolters P, Powell W: Isolation ofEST-derived microsatellite markers for genotyping the Aand B genomes of wheat. Theor Appl Genet 2002, 104(2-3):399-407.
61. Roder MS, Korzun V, Wendehake K, Plaschke J, Tixier MH, Leroy P,Ganal MW: A microsatellite map of wheat. Genetics 1998,149(4):2007-2023.
62. Pestsova E, Ganal MW, Roder MS: Isolation and mapping of mic-rosatellite markers specific for the D genome of breadwheat. Genome 2000, 43(4):689-697.
63. Gupta K, Balyan S, Edwards J, Isaac P, Korzun V, Roder M, Gautier MF,Joudrier P, Schlatter R, Dubcovsky J, et al.: Genetic mapping of 66new microsatellite (SSR) loci in bread wheat. Theor Appl Genet2002, 105(2-3):413-422.
64. van Berloo R: GGT 2.0: versatile software for visualization andanalysis of genetic data. J Hered 2008, 99(2):232-236.
Page 17 of 17(page number not for citation purposes)
![BMC Genomics BioMed Central1].pdf · BioMed Central Page 1 of 18 (page number not for citation purposes) BMC Genomics Research article Open Access Global patterns of sequence evolution](https://img.dokumen.tips/doc/110x75/5f4da8b84673135f021818e3/bmc-genomics-biomed-central-1pdf-biomed-central-page-1-of-18-page-number-not.jpg)