Embed Size (px)
Citation preview
BioMed CentralBMC Genomics
ss
Open AcceResearch articleSignal transduction-related responses to phytohormones and environmental challenges in sugarcaneFlávia R Rocha1, Flávia S Papini-Terzi1, Milton Y Nishiyama Jr1, Ricardo ZN Vêncio2, Renato Vicentini3, Rodrigo DC Duarte3, Vicente E de Rosa Jr3, Fabiano Vinagre4, Carla Barsalobres5, Ane H Medeiros5, Fabiana A Rodrigues7, Eugênio C Ulian6, Sônia M Zingaretti7, João A Galbiatti7, Raul S Almeida8, Antonio VO Figueira8, Adriana S Hemerly4, Marcio C Silva-Filho5, Marcelo Menossi3 and Gláucia M Souza*1Address: 1Departamento de Bioquímica, Instituto de Química, Universidade de São Paulo, São Paulo, SP, Brazil, 2BIOINFO-USP Núcleo de Pesquisas em Bioinformática, Universidade de São Paulo, São Paulo, SP, Brazil, 3Centro de Biologia Molecular e Engenharia Genética, Universidade Estadual de Campinas, Campinas, SP, Brazil, 4Instituto de Bioquímica Médica, Universidade Federal do Rio de Janeiro, UFRJ, Rio de Janeiro, RJ, Brazil, 5Departamento de Genética, Escola Superior de Agricultura Luiz de Queiroz, ESALQ, Universidade de São Paulo, Piracicaba, SP, Brazil, 6Centro de Tecnologia Canavieira, Piracicaba, São Paulo, SP, Brazil, 7Departamento de Tecnologia, Faculdade de Ciências Agrárias e Veterinárias de Jaboticabal, Universidade Estadual Paulista, Jaboticabal, SP, Brazil and 8Centro de Energia Nuclear na Agricultura (CENA), Universidade de São Paulo, Piracicaba, SP, Brazil
Email: Flávia R Rocha - [email protected]; Flávia S Papini-Terzi - [email protected]; Milton Y Nishiyama - [email protected]; Ricardo ZN Vêncio - [email protected]; Renato Vicentini - [email protected]; Rodrigo DC Duarte - [email protected]; Vicente E de Rosa - [email protected]; Fabiano Vinagre - [email protected]; Carla Barsalobres - [email protected]; Ane H Medeiros - [email protected]; Fabiana A Rodrigues - [email protected]; Eugênio C Ulian - [email protected]; Sônia M Zingaretti - [email protected]; João A Galbiatti - [email protected]; Raul S Almeida - [email protected]; Antonio VO Figueira - [email protected]; Adriana S Hemerly - [email protected]; Marcio C Silva-Filho - [email protected]; Marcelo Menossi - [email protected]; Gláucia M Souza* - [email protected]
* Corresponding author
AbstractBackground: Sugarcane is an increasingly economically and environmentally important C4 grass,used for the production of sugar and bioethanol, a low-carbon emission fuel. Sugarcane originatedfrom crosses of Saccharum species and is noted for its unique capacity to accumulate high amountsof sucrose in its stems. Environmental stresses limit enormously sugarcane productivity worldwide.To investigate transcriptome changes in response to environmental inputs that alter yield we usedcDNA microarrays to profile expression of 1,545 genes in plants submitted to drought, phosphatestarvation, herbivory and N2-fixing endophytic bacteria. We also investigated the response tophytohormones (abscisic acid and methyl jasmonate). The arrayed elements correspond mostly togenes involved in signal transduction, hormone biosynthesis, transcription factors, novel genes andgenes corresponding to unknown proteins.
Results: Adopting an outliers searching method 179 genes with strikingly different expressionlevels were identified as differentially expressed in at least one of the treatments analysed. Self
Published: 13 March 2007
BMC Genomics 2007, 8:71 doi:10.1186/1471-2164-8-71
Received: 18 August 2006Accepted: 13 March 2007
This article is available from: http://www.biomedcentral.com/1471-2164/8/71
© 2007 Rocha et al; licensee BioMed Central Ltd. This is an Open Access article distributed under the terms of the Creative Commons Attribution License (http://creativecommons.org/licenses/by/2.0), which permits unrestricted use, distribution, and reproduction in any medium, provided the original work is properly cited.
Page 1 of 22(page number not for citation purposes)
BMC Genomics 2007, 8:71 http://www.biomedcentral.com/1471-2164/8/71
Organizing Maps were used to cluster the expression profiles of 695 genes that showed a highlycorrelated expression pattern among replicates. The expression data for 22 genes was evaluatedfor 36 experimental data points by quantitative RT-PCR indicating a validation rate of 80.5% usingthree biological experimental replicates. The SUCAST Database was created that provides publicaccess to the data described in this work, linked to tissue expression profiling and the SUCASTgene category and sequence analysis. The SUCAST database also includes a categorization of thesugarcane kinome based on a phylogenetic grouping that included 182 undefined kinases.
Conclusion: An extensive study on the sugarcane transcriptome was performed. Sugarcane genesresponsive to phytohormones and to challenges sugarcane commonly deals with in the field wereidentified. Additionally, the protein kinases were annotated based on a phylogenetic approach. Theexperimental design and statistical analysis applied proved robust to unravel genes associated witha diverse array of conditions attributing novel functions to previously unknown or undefined genes.The data consolidated in the SUCAST database resource can guide further studies and be usefulfor the development of improved sugarcane varieties.
BackgroundSugarcane is an increasingly economically attractive crop,used for the production of approximately 60% of theworld's sugar and also of ethanol, a low-carbon emissionfuel. Sugarcane varieties with improved tolerance toadverse environmental conditions are highly desirable.Unfavorable environmental factors are the major culpritsof losses in agriculture and can reduce average productiv-ity by 65% to 87% depending on the crop [1]. Crops bet-ter fit to withstand biotic and abiotic stresses have beenselected by traditional genetic breeding programs but theslow pace in obtaining plants with the desirable traits lim-its the development of improved crop varieties. In this sce-nario, the use of molecular tools that enable gene-targetedmodifications to achieve a phenotype of interest is highlypromising.
Plants react to changes in the environment through anarray of cellular responses that are activated by stress stim-uli, leading to plant defense and/or adjustment to adverseconditions. Physiological changes elicited by external sig-nals can be modulated by transcriptional regulation lead-ing to the induction or repression of target genes. Manyhigh throughput studies have been conducted to definegene expression changes in plants submitted to stress [2-5]. Such studies showed that signal transduction geneexpression is altered in response to stress possibly leadingto changes in growth and development and adjustment toenvironmental conditions. Few studies have been con-ducted to unravel sugarcane's responses to biotic and abi-otic stresses or the role of phytohormones in theseprocesses. Examples of these are those that evaluatedchanges in the sugarcane transcriptome induced by coldand methyl jasmonate treatment [6,7]. The aim of thiswork was to profile sugarcane gene expression under con-ditions that affect crop yield: drought, phosphate starva-tion, herbivory and endophytic bacteria interaction.Drought is a condition of special interest, not only for sug-
arcane, but also for other crops, since increasing waterscarcity has been observed throughout the world. Plantirrigation currently accounts for approximately 65% ofglobal freshwater use indicating that the development ofplant varieties resistant to drought will be a necessity inthe near future [8,9]. Plant responses to drought are com-plex, partially dependent on ABA signaling and depend-ent on the intensity and duration of the stimulus. Themain responses include changes in ion fluxes, stomatalclosing, production of osmoprotectants and alteration inplant growth patterns [9].
A significant portion of the arable land in tropical areaspresents either limiting concentrations of essential nutri-ents or toxicity. Phosphorous (P), an essential macronu-trient, is one of the most limiting nutrients for plantgrowth because of its low solubility and high sorptioncapacity in soil [10]. Plant roots acquire P as inorganicphosphate (Pi), although the concentration of Pi in thesoil solution is often low (2 to 10 mM) [11]. The lowavailability of Pi in the acid soils of tropical and subtropi-cal regions is a major limiting factor for crop production[12]. P constitutes around 0.2% of plants dry weight [13]and plays important roles in several biological processes,such as nucleic acid and phospholipid biosynthesis,energy metabolism, signal transduction and enzymeactivity regulation.
Insect pests frequently challenge sugarcane productivity.The sugarcane borer Diatraea saccharalis is the major sug-arcane pest in Brazil causing plant death due to apical buddeath (dead heart) in plants of up to four months of ageand damage to lateral bud development, aerial rooting,weight loss and stalk breakage in older plants. The attackalso allows for infection by opportunistic fungi, whichresults in production loss for both the sugar and alcoholindustries [[14] and references herein].
Page 2 of 22(page number not for citation purposes)

BMC Genomics 2007, 8:71 http://www.biomedcentral.com/1471-2164/8/71
The sugarcane culture is highly benefited by the associa-tion with N2-fixing endophytic bacteria (Herbaspirillumseropedicae/Herbaspirillum rubrisubalbicans and Gluconaceto-bacter diazotrophicus). Unlike rhizobium/leguminosaesymbiosis, where bacteria are restricted to nodules, Her-baspirillum spp. and G. diazotrophicus are endophytic, andcolonize intercellular spaces and vascular tissues of mostplant organs without causing damage to the host [15,16].These bacteria promote plant growth possibly by nitrogenfixation and also by the production of plant hormones[17]. Despite the non-pathogenic aspects of this interac-tion, plants should limit bacterial growth inside their tis-sues, or the association can result in disease [18]. Little isknown about the signaling mechanisms that are involvedin the establishment of a beneficial association with theplant.
A study on the response of sugarcane plants to methyl jas-monate (MeJA) and abscisic acid (ABA) treatments isneeded since the role of these phytohormones in bioticand abiotic stress responses is well characterized andcould point us to the regulatory mechanisms behind thestress treatments of interest. Several evidences point to acomplex signaling network triggered by the action of ABA,including cross-talk with other hormone response path-ways [19]. Moreover, several genes that are induced byABA also have their expression induced by drought andcold stress [20]. Protein kinases [21] and transcription fac-tors [22] have been shown to mediate the signal transduc-tion network of MeJA action. All MeJA actions seem toneed a functional COI protein, involved in ubiquitin-mediated proteolysis [23]. cDNA arrays have been used toevaluate changes in gene expression in sugarcane leavestreated with MeJA [7]. Two transcriptional factors encod-ing a putative zinc finger protein, a heat shock factor pro-tein, protein kinases, proteins with a role in secondarymetabolism, protein synthesis, stress response and photo-synthesis were found to be differentially expressed.
The genes studied in this work were identified by theSUCEST (Sugarcane EST) Project. The SUCEST Project[24] sequenced over 238,000 ESTs, which were groupedinto over 43,000 SAS (Sugarcane Assembled Sequences)[25]. The SUCAST Project (Sugarcane Signal Transduc-tion) [26,27] used BLAST searches, Pfam and SMARTdomain analysis to identify conserved signal transductioncomponents such as receptors, adapters, G-proteins, smallGTPases, members of the two-component relay system,nucleotide cyclases, protein kinases, protein phos-phatases, elements of the ubiquitination machinery andtranscription factors. In addition, SAS that might beinvolved in processes triggered by stress and pathogens orplay a role in growth and development were also cata-logued. The combined analysis of the sugarcane EST databank, by means of an in depth annotation and gene archi-
tecture analysis, generated the SUCAST catalogue withover 3,500 members including around 100 SAS for hor-mone biosynthesis and around 600 SAS with no similari-ties to known proteins, which were selected due to ourinterest in associating function to new genes. These ele-ments represent 5% of the total SAS from the currentSUCEST dataset.
To define the expression pattern of these genes in the var-ious sugarcane tissues cDNA microarrays with 1,280 dis-tinct elements were constructed. A total of 217 genes werefound to be differentially expressed when leaf, inflores-cence, root, internode and lateral bud tissues were com-pared [27]. For this work, a new array was designed with1,228 elements in common with the array used in the pre-vious study [27] plus an additional 317 elements includ-ing 229 representatives of the sugarcane kinome. Overall,50% of the SAS catalogued in each SUCAST category arerepresented in the array that contains a total of 1,545genes.
In the context of plant signal transduction, the role of pro-tein kinases is remarkable. These proteins are responsiblefor the post-translational control of target proteins, actingas critical regulators of many signaling cascades. Moreo-ver, many plant protein kinases act as receptors (namedRLKs, from Receptor-Like Kinases) and participate inprocesses like disease resistance, growth, development,hormone perception and stress responses [28]. Many pro-tein kinases remain uncharacterized, especially those cor-responding to RLKs. Of 1,031 protein kinases previouslycatalogued by the SUCAST Project 39% could not beassigned to known categories based on BLAST searchesand were annotated as undefined kinases. This work alsoreports the categorization of sugarcane protein kinasesbased on neighbor-joining (NJ) trees constructed fromthe alignment of the predicted catalytic domain. The asso-ciation of an expression pattern to the categories gener-ated by the phylogenetic analysis is useful in guidingstudies on sugarcane kinases and other genes responsiveto environmental and hormonal stimuli.
ResultsGene Expression Changes in Response to Biotic and Abiotic StimuliTo identify genes regulated at the expression level bybiotic and abiotic factors sugarcane plants were exposedto a variety of conditions that affect yield negatively(drought, phosphate deficiency, herbivory) or positively(endophytic bacteria interaction). Since a role for ABAand jasmonates has been observed in the regulation ofplant stress responses in other plant systems [19,29-32],plants were also exposed to these phytohormones.
Page 3 of 22(page number not for citation purposes)
BMC Genomics 2007, 8:71 http://www.biomedcentral.com/1471-2164/8/71
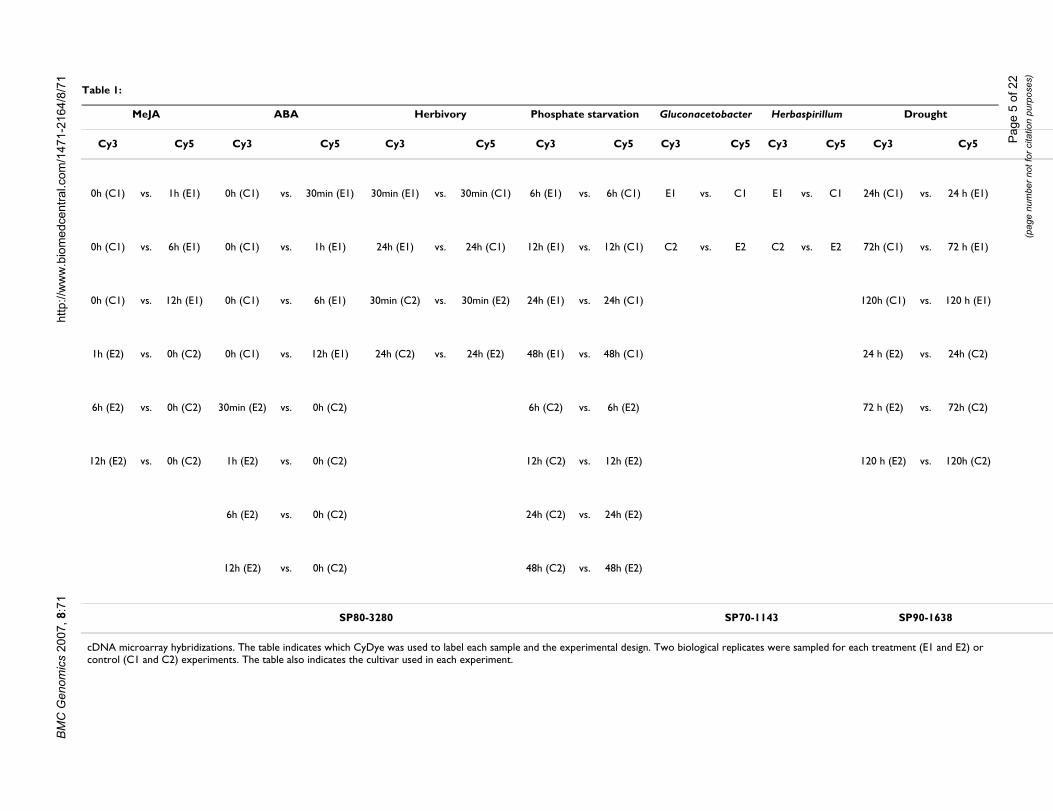
To obtain gene expression patterns and identify differen-tially expressed genes cDNA microarrays representing1,545 genes were co-hybridized to fluorescently labeledprobes generated from control and treated plants. Thegreat majority of the genes were selected from the SUCASTCatalogue [26,27]. Some correspond to sugarcane metab-olism genes indexed in the SUCAMET (Sugarcane Metab-olism) Catalogue. Both catalogues can be found at [33].The hybridizations were performed as shown in Table 1.Cultivar SP80-3280 was used for the ABA, MeJA, phos-phate deficiency and herbivory experiments. CultivarSP90-1638 was used for drought experiments and SP70-1143 for the endophytic bacteria interaction experiments.To define differential expression we used the outlierssearching method [34].
A total of 179 genes were identified as differentiallyexpressed in both biological replicates in at least one ofthe treatments. Of these, twenty-nine were found differen-tially expressed in two or more treatments. Most of these(18) were responsive both to drought and phytohor-mones in agreement with the known role of ABA andMeJA in drought responses as discussed in the next sec-tion.
Additional file 1: Table 1 lists the differential expression(induction or repression) observed for each SAS in eachtreatment as well as the corresponding SUCAST catego-ries. All additional files may be found at [35]. For refer-ence, the table also includes the tissue expression profilefor these genes in flowers, lateral buds, leaves, roots,immature and mature internodes (1st and 4th internodes,respectively) as published previously [27]. The log2 ratio(M) values for the valid elements represented in our arrayfor all experiments are shown in additional file 2: Table 2.
Drought elicited changes were most apparent in the lateexperimental data points (72 h and 120 h) as opposed tothe first data point (24 h): 88% of drought-responsivegenes were detected as differentially expressed exclusivelyafter 72 h and/or 120 h of water deprivation. Conversely,the majority (78%) of the genes regulated by phosphatedeficiency were detected as differentially expressed in theearly data point (6 h). For the phytohormone treatments,differential expression was found throughout the experi-mental time-course.
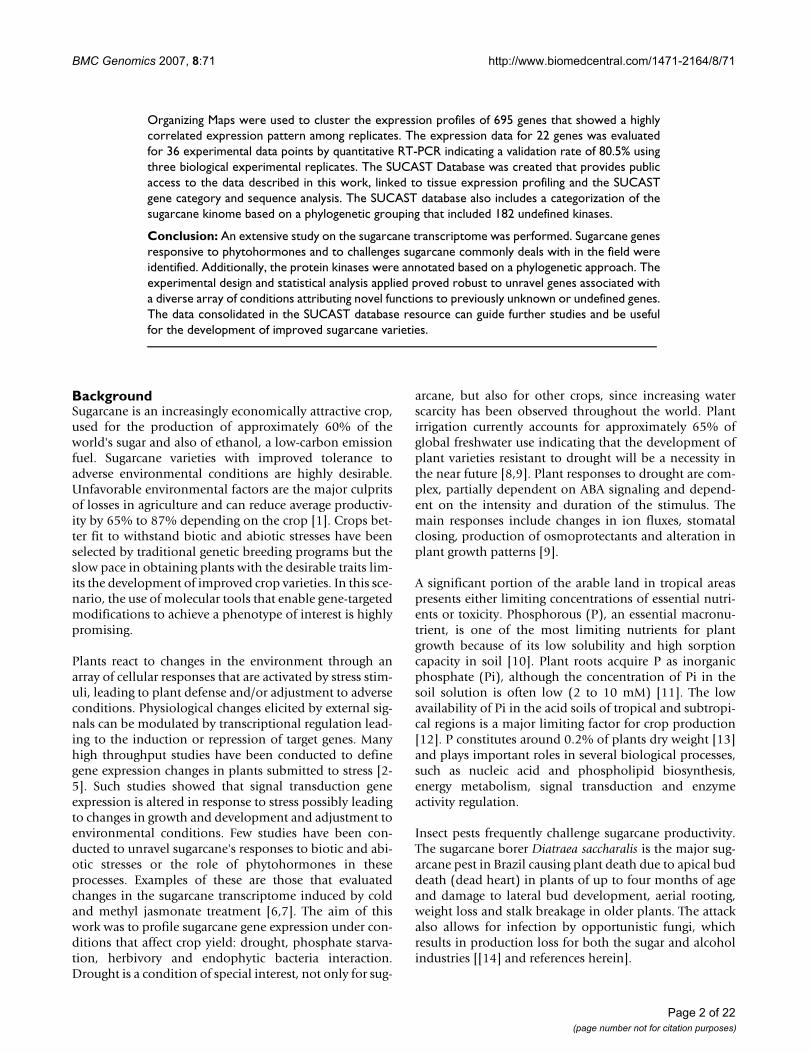
In addition to the analysis of differential expression usingthe outliers searching method, the SOM algorithm [36]was used to cluster the expression data for phytohormonetreatments, phosphate starvation and drought. Geneexpression profiles were compared between the two bio-logical replicates. Profiles with a correlation coefficient of0.7 or higher were identified for 158 genes in response toABA treatment, 68 in response to MeJA treatment, 146 for
phosphate deficiency and 485 for drought. The clustersobtained are partially shown in Figure 1 and additionalfiles 1 and 3. The components of the SOM groups areavailable as additional files (see additional file 4: Table 4,additional file 5: Table 5, additional file 6: Table 6 andadditional file 7: Table 7). Many of the genes included ina SOM group showing evident induction or repressionpatterns were not detected as being differentiallyexpressed according to the outliers searching method.While the outliers searching method is based on criteriathat take into account the intensity-dependent effect onthe ratio values and data reproducibility, the clusteringanalysis allows for the visualization of the expression pat-tern along the entire time course. For this reason, bothanalysis were taken into account when defining sugarcanegenes responsive to these treatments.
The Sugarcane KinomeAmong the differentially expressed genes defined by theoutliers search method and the SOM groups we found185 SAS belonging to the sugarcane kinome (additionalfile 3: Table 3). Since 39% of SUCAST protein kinasescould not be classified based on BLAST similarities anddomain analysis we used a phylogenetic approach basedon the analysis of Arabidopsis thaliana protein kinases [37]to annotate the sugarcane kinome.
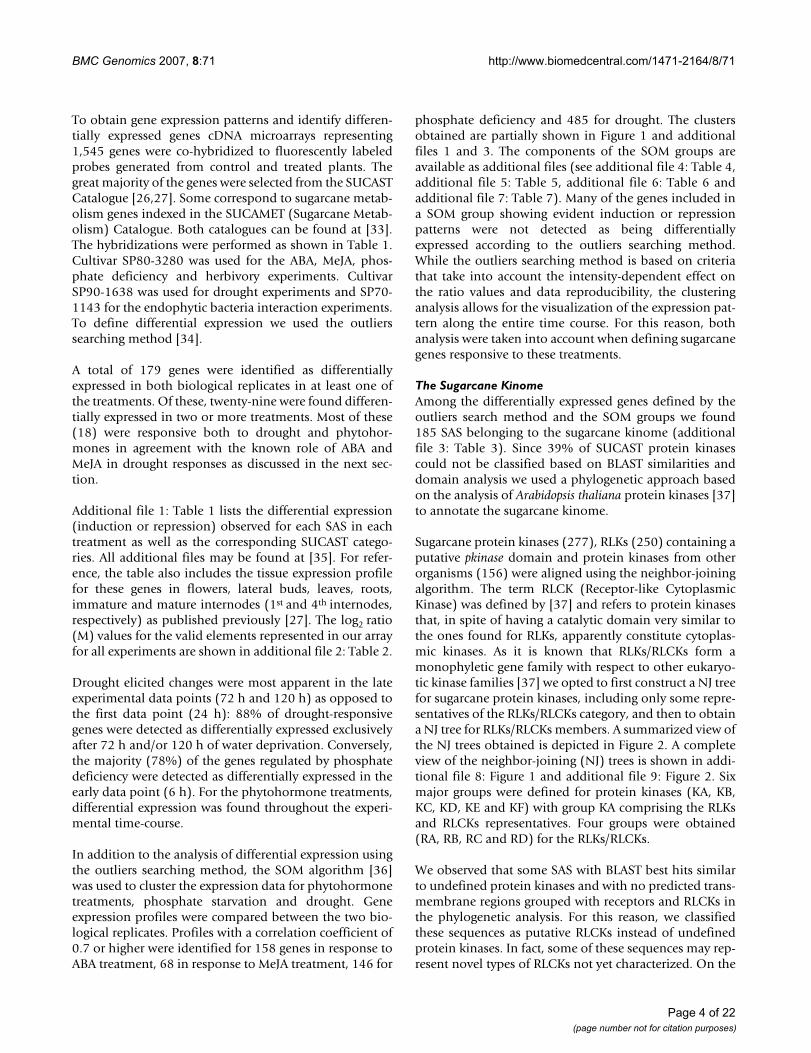
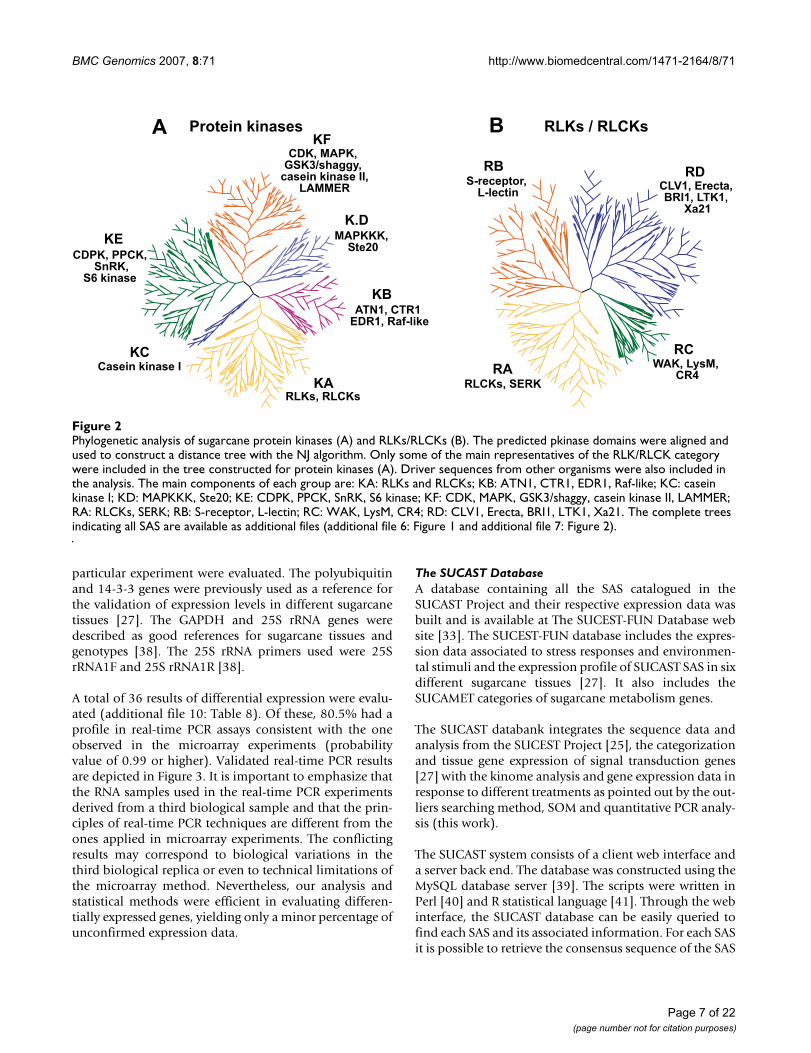
Sugarcane protein kinases (277), RLKs (250) containing aputative pkinase domain and protein kinases from otherorganisms (156) were aligned using the neighbor-joiningalgorithm. The term RLCK (Receptor-like CytoplasmicKinase) was defined by [37] and refers to protein kinasesthat, in spite of having a catalytic domain very similar tothe ones found for RLKs, apparently constitute cytoplas-mic kinases. As it is known that RLKs/RLCKs form amonophyletic gene family with respect to other eukaryo-tic kinase families [37] we opted to first construct a NJ treefor sugarcane protein kinases, including only some repre-sentatives of the RLKs/RLCKs category, and then to obtaina NJ tree for RLKs/RLCKs members. A summarized view ofthe NJ trees obtained is depicted in Figure 2. A completeview of the neighbor-joining (NJ) trees is shown in addi-tional file 8: Figure 1 and additional file 9: Figure 2. Sixmajor groups were defined for protein kinases (KA, KB,KC, KD, KE and KF) with group KA comprising the RLKsand RLCKs representatives. Four groups were obtained(RA, RB, RC and RD) for the RLKs/RLCKs.
We observed that some SAS with BLAST best hits similarto undefined protein kinases and with no predicted trans-membrane regions grouped with receptors and RLCKs inthe phylogenetic analysis. For this reason, we classifiedthese sequences as putative RLCKs instead of undefinedprotein kinases. In fact, some of these sequences may rep-resent novel types of RLCKs not yet characterized. On the
Page 4 of 22(page number not for citation purposes)
BM
C G
enom
ics
2007
, 8:7
1ht
tp://
ww
w.b
iom
edce
ntra
l.com
/147
1-21
64/8
/71
Page
5 o
f 22
(pag
e nu
mbe
r not
for c
itatio
n pu
rpos
es)
Table 1:
MeJA ABA Herbivory Phosphate starvation Gluconacetobacter Herbaspirillum Drought
Cy3 Cy5 Cy3 Cy5 Cy3 Cy5 Cy3 Cy5 Cy3 Cy5 Cy3 Cy5 Cy3 Cy5
0h (C1) vs. 1h (E1) 0h (C1) vs. 30min (E1) 30min (E1) vs. 30min (C1) 6h (E1) vs. 6h (C1) E1 vs. C1 E1 vs. C1 24h (C1) vs. 24 h (E1)
0h (C1) vs. 6h (E1) 0h (C1) vs. 1h (E1) 24h (E1) vs. 24h (C1) 12h (E1) vs. 12h (C1) C2 vs. E2 C2 vs. E2 72h (C1) vs. 72 h (E1)
0h (C1) vs. 12h (E1) 0h (C1) vs. 6h (E1) 30min (C2) vs. 30min (E2) 24h (E1) vs. 24h (C1) 120h (C1) vs. 120 h (E1)
1h (E2) vs. 0h (C2) 0h (C1) vs. 12h (E1) 24h (C2) vs. 24h (E2) 48h (E1) vs. 48h (C1) 24 h (E2) vs. 24h (C2)
6h (E2) vs. 0h (C2) 30min (E2) vs. 0h (C2) 6h (C2) vs. 6h (E2) 72 h (E2) vs. 72h (C2)
12h (E2) vs. 0h (C2) 1h (E2) vs. 0h (C2) 12h (C2) vs. 12h (E2) 120 h (E2) vs. 120h (C2)
6h (E2) vs. 0h (C2) 24h (C2) vs. 24h (E2)
12h (E2) vs. 0h (C2) 48h (C2) vs. 48h (E2)
SP80-3280 SP70-1143 SP90-1638
cDNA microarray hybridizations. The table indicates which CyDye was used to label each sample and the experimental design. Two biological replicates were sampled for each treatment (E1 and E2) or control (C1 and C2) experiments. The table also indicates the cultivar used in each experiment.

BMC Genomics 2007, 8:71 http://www.biomedcentral.com/1471-2164/8/71
other hand, some of them may also be receptor-likekinases with incomplete cDNAs, lacking the extracellulardomain and transmembrane region that would indicatethey are receptors.
All sugarcane protein kinases were classified in theSUCAST database with the prefix cane followed by itsannotation and a continuous numeration. Each unde-fined protein kinase or RLK received a new classification,based on the phylogenetic group and family to which itbelongs. All families constituted entirely by sugarcaneundefined protein kinases, RLKs or RLCKs, and supportedby a bootstrap value superior to 50% received a specificnomenclature, as well as the SAS included within thesefamilies (additional file 8: Figure 1 and additional file 9:Figure 2). With this criterion, it was possible to define 6families constituted entirely by undefined protein kinasesand 33 families constituted by undefined RLKs/RLCKs.
The phylogenetic analysis allowed for the classification of32 undefined protein kinases (additional file 8: Figure 1).Group KB contains 16 of them. Thirty-four undefinedRLCKs and 117 undefined RLKs were included within theRLKs/RLCKs tree (additional file 9: Figure 2). Group RAcontains most of the undefined RLCKs (76%) and groupRD, the majority of the undefined RLKs (57%).
Among the 1,031 sugarcane protein kinases catalogued,475 were represented in our array. Additional file 3: Table3 shows expression data for all sugarcane protein kinasesthat were found as differentially expressed based on theoutliers searching method (29) or SOM analysis (174).
Validation of microarray data by real-time PCRTwenty-two genes were selected to have their expressiondata validated by quantitative real-time PCR. The primersdesigned for these genes and the statistical analysis (prob-ability Pr(sample>reference) and Pr(sample < reference)for up- and down-regulated genes, respectively) of thedata are shown in additional file 10: Table 8. The expres-sion profile along the whole time-course was analysed byreal-time PCR for phytohormone treatment samples. Forother treatments, reactions were carried out only for theexperimental point(s) in which the gene was detected asbeing differentially expressed.
As reference genes for normalization we used a polyubiq-uitin gene for the ABA treatment and drought data, aGAPDH gene for the MeJA treatment and herbivory data,a 25S rRNA gene for endophytic inoculation and a 14-3-3gene for the phosphate starvation data. The different ref-erences were selected for their unaltered expression ineach of the treatments. Curves (log fluorescence × cycles)obtained at different experimental points and the respec-tive SAS expression profiles in the M × S space for each
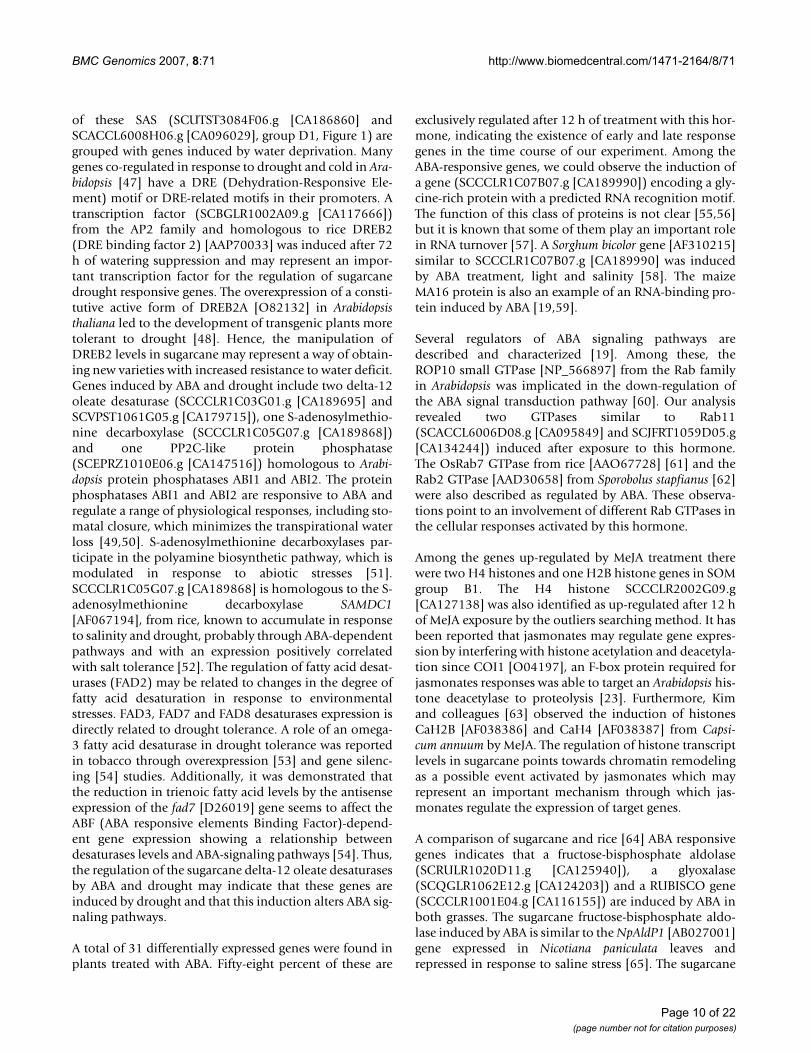
SOM analysis for (A) ABA and (B) MeJA treatments, (C) phosphate deficiency and (D) droughtFigure 1SOM analysis for (A) ABA and (B) MeJA treatments, (C) phosphate deficiency and (D) drought. Genes were selected based on a correlation coefficient of 0.7 or higher in the expression pattern obtained for the two biological replicates. The values of the median intensity ratios for each biological replicate were mean-centered and the average values were used as input for the SOM clustering. The geometry was cho-sen based on a PCA Analysis. The graphs present the average of the normalized log2 ratio (M) value between the replicates (y axis) plotted against the time course (x axis). The compo-nents of the SOM groups obtained are available in their total-ity as additional files (additional file 2: Table 4, additional file 3: Table 5, additional file 4: Table 6 and additional file 5: Table 7). The number in brackets indicates the number of SAS in each group.
������������
��������
��� �� �� � � ��� �� �� � �
�� �� � � �� �� � �
������������
��������
������������
��������
����
�� ��
�
�
����
�� ��
�� �
������������
��������
������������
��������
� ��
���� ���
���
����
����
� �
�� �
����
�� �
�� � � �� ��� �� � � �� ���
�����������������
�����������������
�����������������
��
� �
�
�� � � � �� �� � � � ��
��� ������������� ��
��� ������������� ��
��� ������������� ��
����
�� ��
�� �
����
�� �
����
����
����
����
� ��
�����
����
����
�� ��
����
�
���� ��� ���
����� ��� ���
������� ������������
���� �
Page 6 of 22(page number not for citation purposes)
BMC Genomics 2007, 8:71 http://www.biomedcentral.com/1471-2164/8/71
particular experiment were evaluated. The polyubiquitinand 14-3-3 genes were previously used as a reference forthe validation of expression levels in different sugarcanetissues [27]. The GAPDH and 25S rRNA genes weredescribed as good references for sugarcane tissues andgenotypes [38]. The 25S rRNA primers used were 25SrRNA1F and 25S rRNA1R [38].
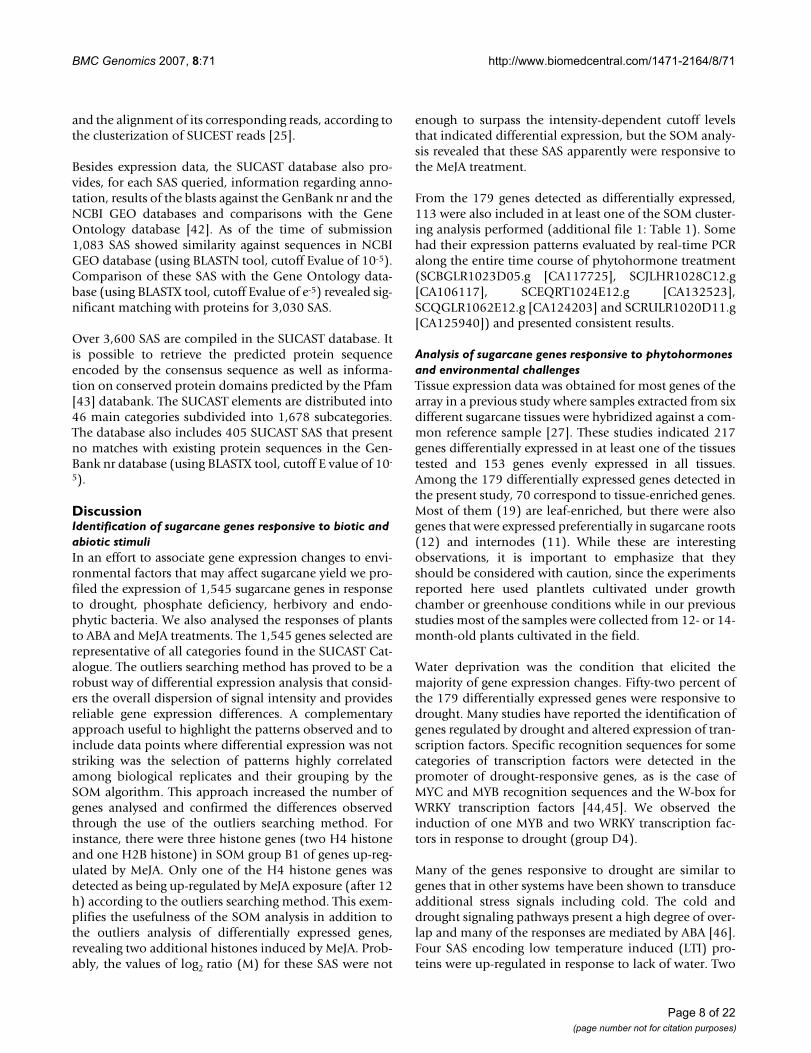
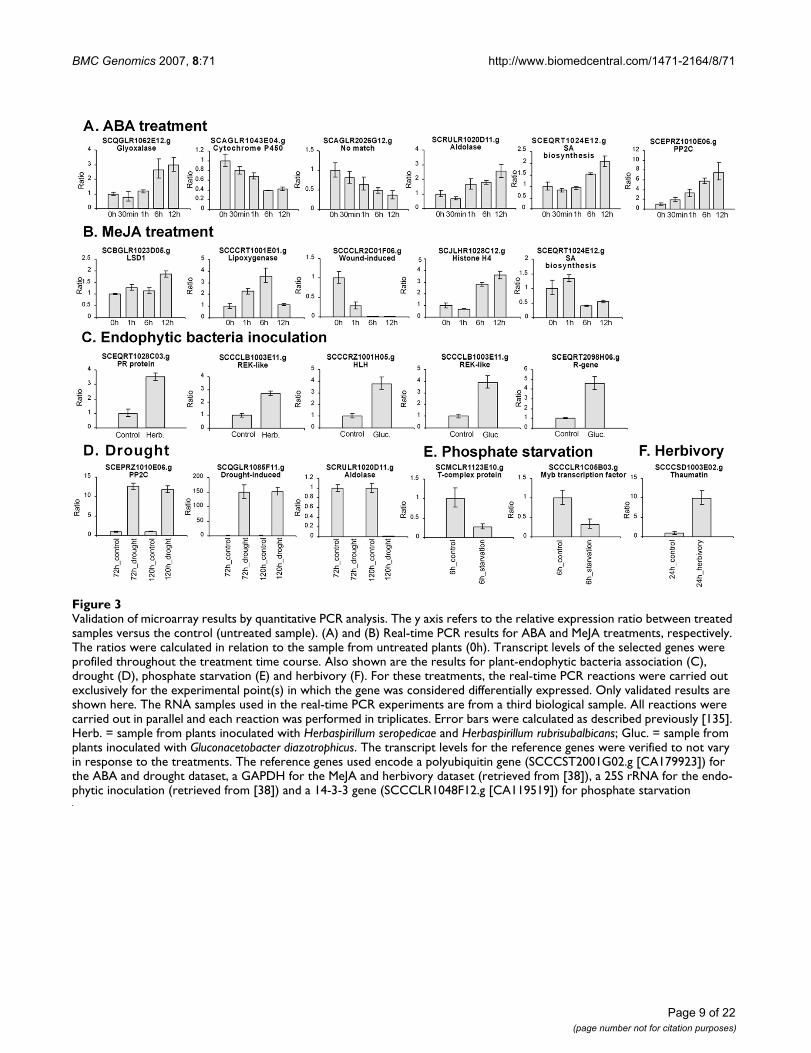
A total of 36 results of differential expression were evalu-ated (additional file 10: Table 8). Of these, 80.5% had aprofile in real-time PCR assays consistent with the oneobserved in the microarray experiments (probabilityvalue of 0.99 or higher). Validated real-time PCR resultsare depicted in Figure 3. It is important to emphasize thatthe RNA samples used in the real-time PCR experimentsderived from a third biological sample and that the prin-ciples of real-time PCR techniques are different from theones applied in microarray experiments. The conflictingresults may correspond to biological variations in thethird biological replica or even to technical limitations ofthe microarray method. Nevertheless, our analysis andstatistical methods were efficient in evaluating differen-tially expressed genes, yielding only a minor percentage ofunconfirmed expression data.
The SUCAST DatabaseA database containing all the SAS catalogued in theSUCAST Project and their respective expression data wasbuilt and is available at The SUCEST-FUN Database website [33]. The SUCEST-FUN database includes the expres-sion data associated to stress responses and environmen-tal stimuli and the expression profile of SUCAST SAS in sixdifferent sugarcane tissues [27]. It also includes theSUCAMET categories of sugarcane metabolism genes.
The SUCAST databank integrates the sequence data andanalysis from the SUCEST Project [25], the categorizationand tissue gene expression of signal transduction genes[27] with the kinome analysis and gene expression data inresponse to different treatments as pointed out by the out-liers searching method, SOM and quantitative PCR analy-sis (this work).
The SUCAST system consists of a client web interface anda server back end. The database was constructed using theMySQL database server [39]. The scripts were written inPerl [40] and R statistical language [41]. Through the webinterface, the SUCAST database can be easily queried tofind each SAS and its associated information. For each SASit is possible to retrieve the consensus sequence of the SAS
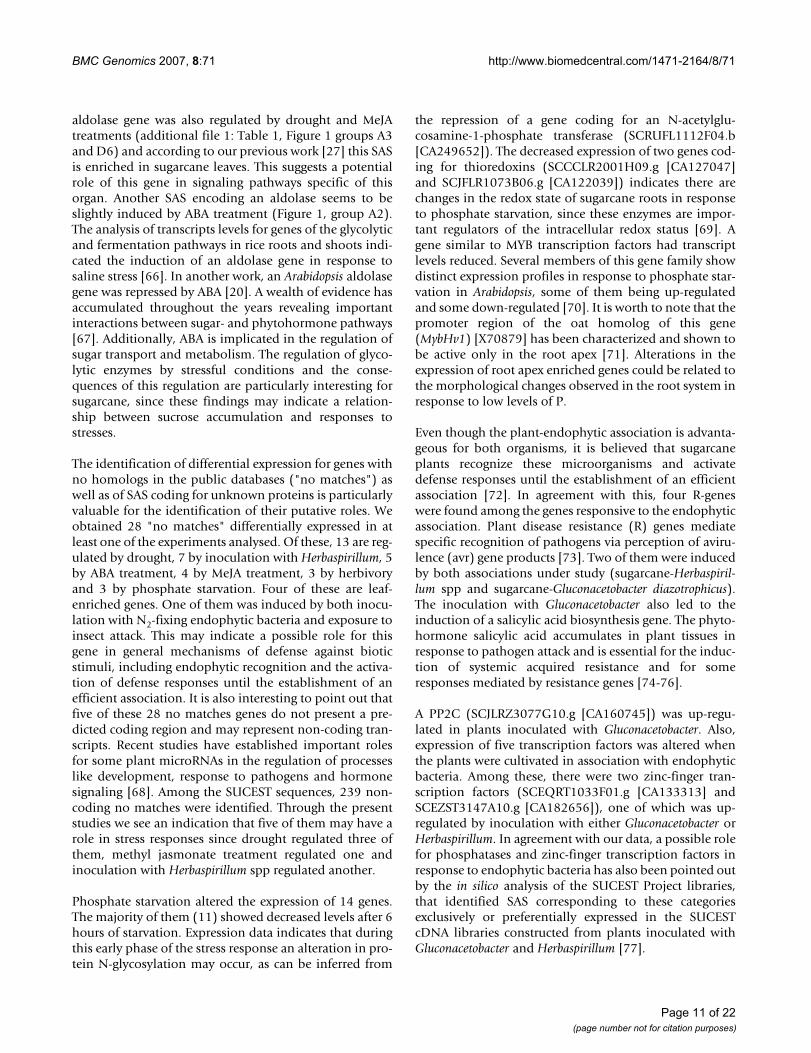
Phylogenetic analysis of sugarcane protein kinases (A) and RLKs/RLCKs (B)Figure 2Phylogenetic analysis of sugarcane protein kinases (A) and RLKs/RLCKs (B). The predicted pkinase domains were aligned and used to construct a distance tree with the NJ algorithm. Only some of the main representatives of the RLK/RLCK category were included in the tree constructed for protein kinases (A). Driver sequences from other organisms were also included in the analysis. The main components of each group are: KA: RLKs and RLCKs; KB: ATN1, CTR1, EDR1, Raf-like; KC: casein kinase I; KD: MAPKKK, Ste20; KE: CDPK, PPCK, SnRK, S6 kinase; KF: CDK, MAPK, GSK3/shaggy, casein kinase II, LAMMER; RA: RLCKs, SERK; RB: S-receptor, L-lectin; RC: WAK, LysM, CR4; RD: CLV1, Erecta, BRI1, LTK1, Xa21. The complete trees indicating all SAS are available as additional files (additional file 6: Figure 1 and additional file 7: Figure 2).
�!"
!#�
!�
!�
!
!$
��� ����%������
&'!�(�&'!�
�)*�(�)&��$�&�(�&��+,�%�
&�
&�
&
&�
&'!��-�&'!��
������%������.
���!!!(�/ ��0
�!(����!(1/!�-��� �(��������%������..(
�'���$&
��!(���!(�/�&!(
/�%�����
&'!�(�/$&!
/+����� ��(�'+,�� ��
2�!(�'���(�&�
'3�(�$��� �(�&.�(�')!�(
�4���
Page 7 of 22(page number not for citation purposes)
BMC Genomics 2007, 8:71 http://www.biomedcentral.com/1471-2164/8/71
and the alignment of its corresponding reads, according tothe clusterization of SUCEST reads [25].
Besides expression data, the SUCAST database also pro-vides, for each SAS queried, information regarding anno-tation, results of the blasts against the GenBank nr and theNCBI GEO databases and comparisons with the GeneOntology database [42]. As of the time of submission1,083 SAS showed similarity against sequences in NCBIGEO database (using BLASTN tool, cutoff Evalue of 10-5).Comparison of these SAS with the Gene Ontology data-base (using BLASTX tool, cutoff Evalue of e-5) revealed sig-nificant matching with proteins for 3,030 SAS.
Over 3,600 SAS are compiled in the SUCAST database. Itis possible to retrieve the predicted protein sequenceencoded by the consensus sequence as well as informa-tion on conserved protein domains predicted by the Pfam[43] databank. The SUCAST elements are distributed into46 main categories subdivided into 1,678 subcategories.The database also includes 405 SUCAST SAS that presentno matches with existing protein sequences in the Gen-Bank nr database (using BLASTX tool, cutoff E value of 10-
5).
DiscussionIdentification of sugarcane genes responsive to biotic and abiotic stimuliIn an effort to associate gene expression changes to envi-ronmental factors that may affect sugarcane yield we pro-filed the expression of 1,545 sugarcane genes in responseto drought, phosphate deficiency, herbivory and endo-phytic bacteria. We also analysed the responses of plantsto ABA and MeJA treatments. The 1,545 genes selected arerepresentative of all categories found in the SUCAST Cat-alogue. The outliers searching method has proved to be arobust way of differential expression analysis that consid-ers the overall dispersion of signal intensity and providesreliable gene expression differences. A complementaryapproach useful to highlight the patterns observed and toinclude data points where differential expression was notstriking was the selection of patterns highly correlatedamong biological replicates and their grouping by theSOM algorithm. This approach increased the number ofgenes analysed and confirmed the differences observedthrough the use of the outliers searching method. Forinstance, there were three histone genes (two H4 histoneand one H2B histone) in SOM group B1 of genes up-reg-ulated by MeJA. Only one of the H4 histone genes wasdetected as being up-regulated by MeJA exposure (after 12h) according to the outliers searching method. This exem-plifies the usefulness of the SOM analysis in addition tothe outliers analysis of differentially expressed genes,revealing two additional histones induced by MeJA. Prob-ably, the values of log2 ratio (M) for these SAS were not
enough to surpass the intensity-dependent cutoff levelsthat indicated differential expression, but the SOM analy-sis revealed that these SAS apparently were responsive tothe MeJA treatment.
From the 179 genes detected as differentially expressed,113 were also included in at least one of the SOM cluster-ing analysis performed (additional file 1: Table 1). Somehad their expression patterns evaluated by real-time PCRalong the entire time course of phytohormone treatment(SCBGLR1023D05.g [CA117725], SCJLHR1028C12.g[CA106117], SCEQRT1024E12.g [CA132523],SCQGLR1062E12.g [CA124203] and SCRULR1020D11.g[CA125940]) and presented consistent results.
Analysis of sugarcane genes responsive to phytohormones and environmental challengesTissue expression data was obtained for most genes of thearray in a previous study where samples extracted from sixdifferent sugarcane tissues were hybridized against a com-mon reference sample [27]. These studies indicated 217genes differentially expressed in at least one of the tissuestested and 153 genes evenly expressed in all tissues.Among the 179 differentially expressed genes detected inthe present study, 70 correspond to tissue-enriched genes.Most of them (19) are leaf-enriched, but there were alsogenes that were expressed preferentially in sugarcane roots(12) and internodes (11). While these are interestingobservations, it is important to emphasize that theyshould be considered with caution, since the experimentsreported here used plantlets cultivated under growthchamber or greenhouse conditions while in our previousstudies most of the samples were collected from 12- or 14-month-old plants cultivated in the field.
Water deprivation was the condition that elicited themajority of gene expression changes. Fifty-two percent ofthe 179 differentially expressed genes were responsive todrought. Many studies have reported the identification ofgenes regulated by drought and altered expression of tran-scription factors. Specific recognition sequences for somecategories of transcription factors were detected in thepromoter of drought-responsive genes, as is the case ofMYC and MYB recognition sequences and the W-box forWRKY transcription factors [44,45]. We observed theinduction of one MYB and two WRKY transcription fac-tors in response to drought (group D4).
Many of the genes responsive to drought are similar togenes that in other systems have been shown to transduceadditional stress signals including cold. The cold anddrought signaling pathways present a high degree of over-lap and many of the responses are mediated by ABA [46].Four SAS encoding low temperature induced (LTI) pro-teins were up-regulated in response to lack of water. Two
Page 8 of 22(page number not for citation purposes)
BMC Genomics 2007, 8:71 http://www.biomedcentral.com/1471-2164/8/71
Page 9 of 22(page number not for citation purposes)
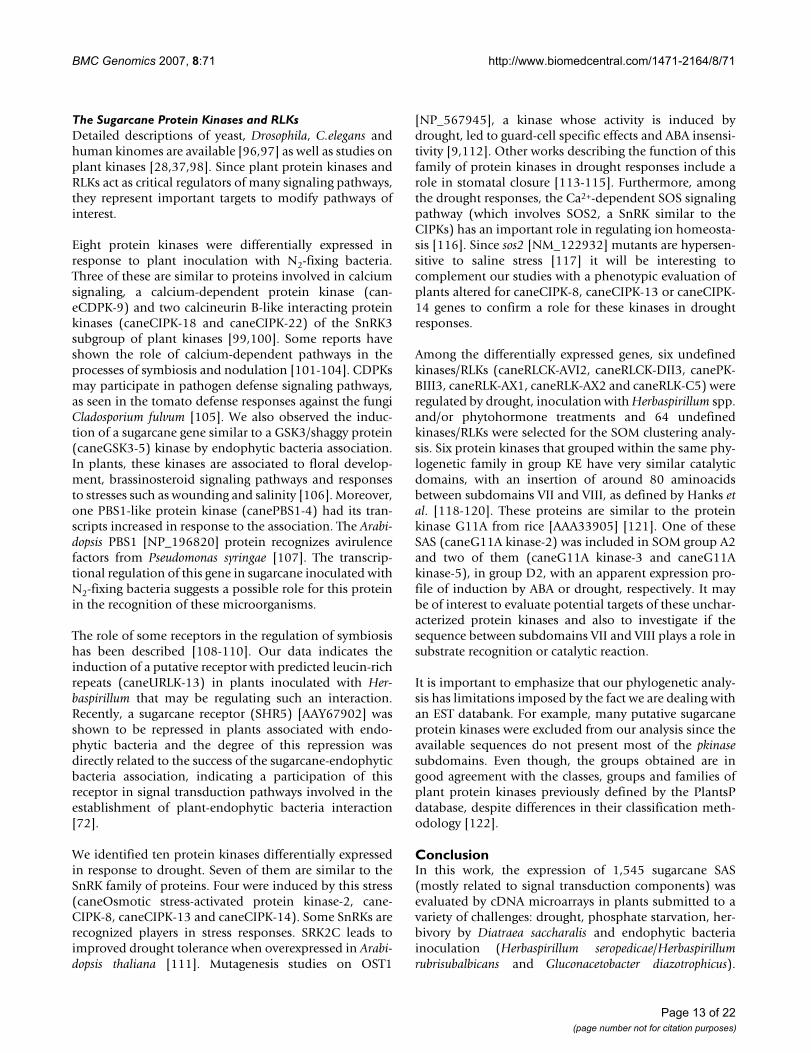
Validation of microarray results by quantitative PCR analysisFigure 3Validation of microarray results by quantitative PCR analysis. The y axis refers to the relative expression ratio between treated samples versus the control (untreated sample). (A) and (B) Real-time PCR results for ABA and MeJA treatments, respectively. The ratios were calculated in relation to the sample from untreated plants (0h). Transcript levels of the selected genes were profiled throughout the treatment time course. Also shown are the results for plant-endophytic bacteria association (C), drought (D), phosphate starvation (E) and herbivory (F). For these treatments, the real-time PCR reactions were carried out exclusively for the experimental point(s) in which the gene was considered differentially expressed. Only validated results are shown here. The RNA samples used in the real-time PCR experiments are from a third biological sample. All reactions were carried out in parallel and each reaction was performed in triplicates. Error bars were calculated as described previously [135]. Herb. = sample from plants inoculated with Herbaspirillum seropedicae and Herbaspirillum rubrisubalbicans; Gluc. = sample from plants inoculated with Gluconacetobacter diazotrophicus. The transcript levels for the reference genes were verified to not vary in response to the treatments. The reference genes used encode a polyubiquitin gene (SCCCST2001G02.g [CA179923]) for the ABA and drought dataset, a GAPDH for the MeJA and herbivory dataset (retrieved from [38]), a 25S rRNA for the endo-phytic inoculation (retrieved from [38]) and a 14-3-3 gene (SCCCLR1048F12.g [CA119519]) for phosphate starvation
BMC Genomics 2007, 8:71 http://www.biomedcentral.com/1471-2164/8/71
of these SAS (SCUTST3084F06.g [CA186860] andSCACCL6008H06.g [CA096029], group D1, Figure 1) aregrouped with genes induced by water deprivation. Manygenes co-regulated in response to drought and cold in Ara-bidopsis [47] have a DRE (Dehydration-Responsive Ele-ment) motif or DRE-related motifs in their promoters. Atranscription factor (SCBGLR1002A09.g [CA117666])from the AP2 family and homologous to rice DREB2(DRE binding factor 2) [AAP70033] was induced after 72h of watering suppression and may represent an impor-tant transcription factor for the regulation of sugarcanedrought responsive genes. The overexpression of a consti-tutive active form of DREB2A [O82132] in Arabidopsisthaliana led to the development of transgenic plants moretolerant to drought [48]. Hence, the manipulation ofDREB2 levels in sugarcane may represent a way of obtain-ing new varieties with increased resistance to water deficit.Genes induced by ABA and drought include two delta-12oleate desaturase (SCCCLR1C03G01.g [CA189695] andSCVPST1061G05.g [CA179715]), one S-adenosylmethio-nine decarboxylase (SCCCLR1C05G07.g [CA189868])and one PP2C-like protein phosphatase(SCEPRZ1010E06.g [CA147516]) homologous to Arabi-dopsis protein phosphatases ABI1 and ABI2. The proteinphosphatases ABI1 and ABI2 are responsive to ABA andregulate a range of physiological responses, including sto-matal closure, which minimizes the transpirational waterloss [49,50]. S-adenosylmethionine decarboxylases par-ticipate in the polyamine biosynthetic pathway, which ismodulated in response to abiotic stresses [51].SCCCLR1C05G07.g [CA189868] is homologous to the S-adenosylmethionine decarboxylase SAMDC1[AF067194], from rice, known to accumulate in responseto salinity and drought, probably through ABA-dependentpathways and with an expression positively correlatedwith salt tolerance [52]. The regulation of fatty acid desat-urases (FAD2) may be related to changes in the degree offatty acid desaturation in response to environmentalstresses. FAD3, FAD7 and FAD8 desaturases expression isdirectly related to drought tolerance. A role of an omega-3 fatty acid desaturase in drought tolerance was reportedin tobacco through overexpression [53] and gene silenc-ing [54] studies. Additionally, it was demonstrated thatthe reduction in trienoic fatty acid levels by the antisenseexpression of the fad7 [D26019] gene seems to affect theABF (ABA responsive elements Binding Factor)-depend-ent gene expression showing a relationship betweendesaturases levels and ABA-signaling pathways [54]. Thus,the regulation of the sugarcane delta-12 oleate desaturasesby ABA and drought may indicate that these genes areinduced by drought and that this induction alters ABA sig-naling pathways.
A total of 31 differentially expressed genes were found inplants treated with ABA. Fifty-eight percent of these are
exclusively regulated after 12 h of treatment with this hor-mone, indicating the existence of early and late responsegenes in the time course of our experiment. Among theABA-responsive genes, we could observe the induction ofa gene (SCCCLR1C07B07.g [CA189990]) encoding a gly-cine-rich protein with a predicted RNA recognition motif.The function of this class of proteins is not clear [55,56]but it is known that some of them play an important rolein RNA turnover [57]. A Sorghum bicolor gene [AF310215]similar to SCCCLR1C07B07.g [CA189990] was inducedby ABA treatment, light and salinity [58]. The maizeMA16 protein is also an example of an RNA-binding pro-tein induced by ABA [19,59].
Several regulators of ABA signaling pathways aredescribed and characterized [19]. Among these, theROP10 small GTPase [NP_566897] from the Rab familyin Arabidopsis was implicated in the down-regulation ofthe ABA signal transduction pathway [60]. Our analysisrevealed two GTPases similar to Rab11(SCACCL6006D08.g [CA095849] and SCJFRT1059D05.g[CA134244]) induced after exposure to this hormone.The OsRab7 GTPase from rice [AAO67728] [61] and theRab2 GTPase [AAD30658] from Sporobolus stapfianus [62]were also described as regulated by ABA. These observa-tions point to an involvement of different Rab GTPases inthe cellular responses activated by this hormone.
Among the genes up-regulated by MeJA treatment therewere two H4 histones and one H2B histone genes in SOMgroup B1. The H4 histone SCCCLR2002G09.g[CA127138] was also identified as up-regulated after 12 hof MeJA exposure by the outliers searching method. It hasbeen reported that jasmonates may regulate gene expres-sion by interfering with histone acetylation and deacetyla-tion since COI1 [O04197], an F-box protein required forjasmonates responses was able to target an Arabidopsis his-tone deacetylase to proteolysis [23]. Furthermore, Kimand colleagues [63] observed the induction of histonesCaH2B [AF038386] and CaH4 [AF038387] from Capsi-cum annuum by MeJA. The regulation of histone transcriptlevels in sugarcane points towards chromatin remodelingas a possible event activated by jasmonates which mayrepresent an important mechanism through which jas-monates regulate the expression of target genes.
A comparison of sugarcane and rice [64] ABA responsivegenes indicates that a fructose-bisphosphate aldolase(SCRULR1020D11.g [CA125940]), a glyoxalase(SCQGLR1062E12.g [CA124203]) and a RUBISCO gene(SCCCLR1001E04.g [CA116155]) are induced by ABA inboth grasses. The sugarcane fructose-bisphosphate aldo-lase induced by ABA is similar to the NpAldP1 [AB027001]gene expressed in Nicotiana paniculata leaves andrepressed in response to saline stress [65]. The sugarcane
Page 10 of 22(page number not for citation purposes)
BMC Genomics 2007, 8:71 http://www.biomedcentral.com/1471-2164/8/71
aldolase gene was also regulated by drought and MeJAtreatments (additional file 1: Table 1, Figure 1 groups A3and D6) and according to our previous work [27] this SASis enriched in sugarcane leaves. This suggests a potentialrole of this gene in signaling pathways specific of thisorgan. Another SAS encoding an aldolase seems to beslightly induced by ABA treatment (Figure 1, group A2).The analysis of transcripts levels for genes of the glycolyticand fermentation pathways in rice roots and shoots indi-cated the induction of an aldolase gene in response tosaline stress [66]. In another work, an Arabidopsis aldolasegene was repressed by ABA [20]. A wealth of evidence hasaccumulated throughout the years revealing importantinteractions between sugar- and phytohormone pathways[67]. Additionally, ABA is implicated in the regulation ofsugar transport and metabolism. The regulation of glyco-lytic enzymes by stressful conditions and the conse-quences of this regulation are particularly interesting forsugarcane, since these findings may indicate a relation-ship between sucrose accumulation and responses tostresses.
The identification of differential expression for genes withno homologs in the public databases ("no matches") aswell as of SAS coding for unknown proteins is particularlyvaluable for the identification of their putative roles. Weobtained 28 "no matches" differentially expressed in atleast one of the experiments analysed. Of these, 13 are reg-ulated by drought, 7 by inoculation with Herbaspirillum, 5by ABA treatment, 4 by MeJA treatment, 3 by herbivoryand 3 by phosphate starvation. Four of these are leaf-enriched genes. One of them was induced by both inocu-lation with N2-fixing endophytic bacteria and exposure toinsect attack. This may indicate a possible role for thisgene in general mechanisms of defense against bioticstimuli, including endophytic recognition and the activa-tion of defense responses until the establishment of anefficient association. It is also interesting to point out thatfive of these 28 no matches genes do not present a pre-dicted coding region and may represent non-coding tran-scripts. Recent studies have established important rolesfor some plant microRNAs in the regulation of processeslike development, response to pathogens and hormonesignaling [68]. Among the SUCEST sequences, 239 non-coding no matches were identified. Through the presentstudies we see an indication that five of them may have arole in stress responses since drought regulated three ofthem, methyl jasmonate treatment regulated one andinoculation with Herbaspirillum spp regulated another.
Phosphate starvation altered the expression of 14 genes.The majority of them (11) showed decreased levels after 6hours of starvation. Expression data indicates that duringthis early phase of the stress response an alteration in pro-tein N-glycosylation may occur, as can be inferred from
the repression of a gene coding for an N-acetylglu-cosamine-1-phosphate transferase (SCRUFL1112F04.b[CA249652]). The decreased expression of two genes cod-ing for thioredoxins (SCCCLR2001H09.g [CA127047]and SCJFLR1073B06.g [CA122039]) indicates there arechanges in the redox state of sugarcane roots in responseto phosphate starvation, since these enzymes are impor-tant regulators of the intracellular redox status [69]. Agene similar to MYB transcription factors had transcriptlevels reduced. Several members of this gene family showdistinct expression profiles in response to phosphate star-vation in Arabidopsis, some of them being up-regulatedand some down-regulated [70]. It is worth to note that thepromoter region of the oat homolog of this gene(MybHv1) [X70879] has been characterized and shown tobe active only in the root apex [71]. Alterations in theexpression of root apex enriched genes could be related tothe morphological changes observed in the root system inresponse to low levels of P.
Even though the plant-endophytic association is advanta-geous for both organisms, it is believed that sugarcaneplants recognize these microorganisms and activatedefense responses until the establishment of an efficientassociation [72]. In agreement with this, four R-geneswere found among the genes responsive to the endophyticassociation. Plant disease resistance (R) genes mediatespecific recognition of pathogens via perception of aviru-lence (avr) gene products [73]. Two of them were inducedby both associations under study (sugarcane-Herbaspiril-lum spp and sugarcane-Gluconacetobacter diazotrophicus).The inoculation with Gluconacetobacter also led to theinduction of a salicylic acid biosynthesis gene. The phyto-hormone salicylic acid accumulates in plant tissues inresponse to pathogen attack and is essential for the induc-tion of systemic acquired resistance and for someresponses mediated by resistance genes [74-76].
A PP2C (SCJLRZ3077G10.g [CA160745]) was up-regu-lated in plants inoculated with Gluconacetobacter. Also,expression of five transcription factors was altered whenthe plants were cultivated in association with endophyticbacteria. Among these, there were two zinc-finger tran-scription factors (SCEQRT1033F01.g [CA133313] andSCEZST3147A10.g [CA182656]), one of which was up-regulated by inoculation with either Gluconacetobacter orHerbaspirillum. In agreement with our data, a possible rolefor phosphatases and zinc-finger transcription factors inresponse to endophytic bacteria has also been pointed outby the in silico analysis of the SUCEST Project libraries,that identified SAS corresponding to these categoriesexclusively or preferentially expressed in the SUCESTcDNA libraries constructed from plants inoculated withGluconacetobacter and Herbaspirillum [77].
Page 11 of 22(page number not for citation purposes)

BMC Genomics 2007, 8:71 http://www.biomedcentral.com/1471-2164/8/71
Expression data for the herbivory experiment points to thestrong induction of a pathogenesis-related protein similarto a thaumatin after 24 h of the onset of this stress. This isnot surprising, since it is known that proteins from thiscategory are important for plant defense mechanisms andmay present antifungal action, endo-β1,3-glucanase activ-ity and trypsin or a-amylase inhibitory activity [78,79].Further characterization of this sugarcane thaumatin-likeprotein should be carried out in order to define its activityand the defense mechanism that this protein may conferagainst the sugarcane stalk borer.
Sugarcane-responsive genes related to hormone biosynthesis and signalingPhytohormone signaling pathways exhibit a wide degreeof cross-talk among their components creating a complexnetwork of overlapping signaling [80,81]. Interactionsamong phytohormone signaling pathways are highlycomplex and the features of these interactions are timeand space dependent. Although we are only beginning tooutline signaling cross-talks in sugarcane, the analysis ofthe expression profiles of the differentially expressedgenes obtained (additional file 1: Table 1) as well as thegroups obtained in the clustering analysis (Figure 1 andadditional files 4, 5, 6, 7) uncover some aspects of theseinteractions. Auxin signal transduction pathways appearto be activated in response to several of the treatmentsstudied. ABA treatment elicited an antagonistic responsebetween the ABA and auxin pathways. A gene(SCCCCL3002B05.b [CA093260]) coding for a proteinsimilar to the auxin responsive protein GH3 [82] wasfound repressed by ABA (group A4). Furthermore, a gene(SCCCLR2002F08.g [CA127125]) coding for a proteinwith a predicted auxin repressed domain found in dor-mancy-associated- and auxin-repressed proteins [83] wasup-regulated by this hormone (group A6). It has beenshown that ABA and auxin interact antagonistically to reg-ulate stomatal aperture [84] and the interaction betweenauxin and ABA signaling pathways has been demon-strated by the dual specificity of the ABI3 transcription fac-tor, which is able to bind sequences upstream of ABA andauxin responsive genes. In the presence of ABA, ABI3binds to the GH3 like promoter sequences and inhibitsthe auxin-mediated induction [85].
Auxins have been implicated in several aspects of thedrought response including proline accumulation [86],rhizogenesis [87] and indole 3-butyric acid increases [88].Our data also indicate auxin signaling in response todrought. We observed the induction of genes encodingauxin biosynthesis enzymes (nitrilases) after 72 h of waterdeprivation and the down-regulation of transcription fac-tors from the Aux/IAA category after 120 h of drought.These transcription factors work by inhibiting auxin sign-aling and are rapidly induced by auxin exposure [89,90].
However, Aux/IAA accumulation is subject to negativefeedback, since auxins target Aux/IAA for degradation bythe 26S proteasome [90]. Groups D1 and D2 contain twonitrilases and one auxin-binding protein (ABP). Addition-ally, one auxin response factor is induced by drought(group D4) and four AUX/IAA transcription factors aremodulated (groups D2, D3 and D6).
Phosphate starvation leads to alterations in root architec-ture, resulting in increased soil exploration and phosphateacquisition. In this process of morphological adaptation,auxins and other phytohormones play important roles inroot elongation and lateral root development [91]. López-Bucio and colleagues [92] showed that phosphate depri-vation increases auxin sensitivity in Arabidopsis, what mayexplain the increased number of lateral roots observedwhen the plant is under nutritional stress. In agreementwith this observation, the auxin-repressed protein foundin group A6 (SCCCLR2002F08.g [CA127125]) wasrepressed after 6 h of phosphate starvation. This same SASwas also down-regulated by MeJA treatment what mayindicate a possible synergism among MeJA and auxinpathways. Even though the majority of interactionsbetween MeJA and auxins are antagonistics, there is evi-dence that these hormones may act synergistically at thepost-transcriptional level [93]. It is hypothesized that,since COI1 and TIR1, components of SCF (SKP1,CDC53p, CUL1, F-box protein) complexes associated tojasmonate- and auxin-responses, respectively, are highlysimilar, these two signaling pathways may converge to thedegradation of common target regulatory proteins [93].
Phosphate starvation also causes a reduction in theexpression of a gene (SCEZLB1009A09.g [CA113117])similar to BLE1 from rice. Rice plants where the geneOsBle1 [AB072977] was knocked-out showed reducedgrowth rates [94]. The repression of the sugarcanehomolog of OsBle1 in the early phase of phosphate starva-tion could be an effort to restrain metabolism as occurs inArabidopsis in response to low levels of the nutrient [70].Another hormone signaling pathway that seems to bealtered in response to phosphate starvation is the ethyleneresponse pathway, since a gene for the EIL transcriptionfactor (SCBGFL4052C11.g [CA221542]) is down-regu-lated after 6 h of starvation. The rice homolog of this pro-tein, OsEIL1 [AAZ78349], acts as a positive regulator ofthe ethylene response and transgenic rice plants overex-pressing OsEIL1 exhibit short root, coiled primary root,slightly short shoot phenotype and elevated response toexogenous ethylene [95]. The down-regulation of thistranscription factor could be related to the changes in rootarchitecture that occur in response to phosphate starva-tion.
Page 12 of 22(page number not for citation purposes)
BMC Genomics 2007, 8:71 http://www.biomedcentral.com/1471-2164/8/71
The Sugarcane Protein Kinases and RLKsDetailed descriptions of yeast, Drosophila, C.elegans andhuman kinomes are available [96,97] as well as studies onplant kinases [28,37,98]. Since plant protein kinases andRLKs act as critical regulators of many signaling pathways,they represent important targets to modify pathways ofinterest.
Eight protein kinases were differentially expressed inresponse to plant inoculation with N2-fixing bacteria.Three of these are similar to proteins involved in calciumsignaling, a calcium-dependent protein kinase (can-eCDPK-9) and two calcineurin B-like interacting proteinkinases (caneCIPK-18 and caneCIPK-22) of the SnRK3subgroup of plant kinases [99,100]. Some reports haveshown the role of calcium-dependent pathways in theprocesses of symbiosis and nodulation [101-104]. CDPKsmay participate in pathogen defense signaling pathways,as seen in the tomato defense responses against the fungiCladosporium fulvum [105]. We also observed the induc-tion of a sugarcane gene similar to a GSK3/shaggy protein(caneGSK3-5) kinase by endophytic bacteria association.In plants, these kinases are associated to floral develop-ment, brassinosteroid signaling pathways and responsesto stresses such as wounding and salinity [106]. Moreover,one PBS1-like protein kinase (canePBS1-4) had its tran-scripts increased in response to the association. The Arabi-dopsis PBS1 [NP_196820] protein recognizes avirulencefactors from Pseudomonas syringae [107]. The transcrip-tional regulation of this gene in sugarcane inoculated withN2-fixing bacteria suggests a possible role for this proteinin the recognition of these microorganisms.
The role of some receptors in the regulation of symbiosishas been described [108-110]. Our data indicates theinduction of a putative receptor with predicted leucin-richrepeats (caneURLK-13) in plants inoculated with Her-baspirillum that may be regulating such an interaction.Recently, a sugarcane receptor (SHR5) [AAY67902] wasshown to be repressed in plants associated with endo-phytic bacteria and the degree of this repression wasdirectly related to the success of the sugarcane-endophyticbacteria association, indicating a participation of thisreceptor in signal transduction pathways involved in theestablishment of plant-endophytic bacteria interaction[72].
We identified ten protein kinases differentially expressedin response to drought. Seven of them are similar to theSnRK family of proteins. Four were induced by this stress(caneOsmotic stress-activated protein kinase-2, cane-CIPK-8, caneCIPK-13 and caneCIPK-14). Some SnRKs arerecognized players in stress responses. SRK2C leads toimproved drought tolerance when overexpressed in Arabi-dopsis thaliana [111]. Mutagenesis studies on OST1
[NP_567945], a kinase whose activity is induced bydrought, led to guard-cell specific effects and ABA insensi-tivity [9,112]. Other works describing the function of thisfamily of protein kinases in drought responses include arole in stomatal closure [113-115]. Furthermore, amongthe drought responses, the Ca2+-dependent SOS signalingpathway (which involves SOS2, a SnRK similar to theCIPKs) has an important role in regulating ion homeosta-sis [116]. Since sos2 [NM_122932] mutants are hypersen-sitive to saline stress [117] it will be interesting tocomplement our studies with a phenotypic evaluation ofplants altered for caneCIPK-8, caneCIPK-13 or caneCIPK-14 genes to confirm a role for these kinases in droughtresponses.
Among the differentially expressed genes, six undefinedkinases/RLKs (caneRLCK-AVI2, caneRLCK-DII3, canePK-BIII3, caneRLK-AX1, caneRLK-AX2 and caneRLK-C5) wereregulated by drought, inoculation with Herbaspirillum spp.and/or phytohormone treatments and 64 undefinedkinases/RLKs were selected for the SOM clustering analy-sis. Six protein kinases that grouped within the same phy-logenetic family in group KE have very similar catalyticdomains, with an insertion of around 80 aminoacidsbetween subdomains VII and VIII, as defined by Hanks etal. [118-120]. These proteins are similar to the proteinkinase G11A from rice [AAA33905] [121]. One of theseSAS (caneG11A kinase-2) was included in SOM group A2and two of them (caneG11A kinase-3 and caneG11Akinase-5), in group D2, with an apparent expression pro-file of induction by ABA or drought, respectively. It maybe of interest to evaluate potential targets of these unchar-acterized protein kinases and also to investigate if thesequence between subdomains VII and VIII plays a role insubstrate recognition or catalytic reaction.
It is important to emphasize that our phylogenetic analy-sis has limitations imposed by the fact we are dealing withan EST databank. For example, many putative sugarcaneprotein kinases were excluded from our analysis since theavailable sequences do not present most of the pkinasesubdomains. Even though, the groups obtained are ingood agreement with the classes, groups and families ofplant protein kinases previously defined by the PlantsPdatabase, despite differences in their classification meth-odology [122].
ConclusionIn this work, the expression of 1,545 sugarcane SAS(mostly related to signal transduction components) wasevaluated by cDNA microarrays in plants submitted to avariety of challenges: drought, phosphate starvation, her-bivory by Diatraea saccharalis and endophytic bacteriainoculation (Herbaspirillum seropedicae/Herbaspirillumrubrisubalbicans and Gluconacetobacter diazotrophicus).
Page 13 of 22(page number not for citation purposes)

BMC Genomics 2007, 8:71 http://www.biomedcentral.com/1471-2164/8/71
Additionally, plants were treated with the phytohormonesABA and MeJA, important players in the responses tobiotic and abiotic stresses.
To our knowledge, this is the first broad evaluation of sug-arcane gene expression in response to biotic, abiotic andhormone inputs. Since ABA and MeJA play main roles inplant responses to a plethora of stimuli the analysis ofgenes regulated by these hormones is helpful in decipher-ing sugarcane defense pathways activated in response tostresses. Many of the differentially expressed genes belongto protein families described in the literature as associatedto some of the processes studied, indicating that sugar-cane responses are similar to those of other well-knownplants, such as rice, maize and Arabidopsis. Additionally,functions were associated to genes poorly studied or novelgenes such as genes with no hits in the public databases,genes encoding unknown proteins and undefinedkinases/RLKs. The information generated by the proteinkinase categorization using a phylogenetic approach,associated to the expression data obtained from micro-array experiments, represents a useful tool in guiding thefuture characterization of these proteins.
Understanding the molecular mechanisms behind sugar-cane stress responses will be useful for the improvementof sugarcane yield by genetic manipulation. This knowl-edge, allied to the use of genetic engineering, will poten-tially enable the development of sugarcane varietiestolerant to adverse conditions, such as drought and nutri-tional deficiency. Furthermore, the genes may be exploredas molecular markers in traditional breeding programs orhave their promoters cloned to accomplish transgeneexpression activated solely by a specific stimulus. It isimportant to emphasize the limitations intrinsic to thenature of the data presented. First, changes in mRNA lev-els do not always correlate to protein levels. Second, in thefield, plants are exposed to a diversity of stressful condi-tions and the responses achieved by this combination ofstimuli probably are not the same as the ones triggered byeach individual stimulus. Nonetheless, the data generatedin controlled experiments certainly represent an impor-tant step in the exploration of specific responses. The dataalso points candidates for gene silencing or overexpres-sion experiments that may corroborate the hypothesisraised. With this in mind an expression panel is currentlybeing constructed for several additional sugarcane culti-vars tolerant or more susceptible to the stimuli that cer-tainly will be valuable in guiding the selection of targetgenes. It will be important to expand the present studiesto additional genotypes also if one wishes to compare theresponses elicited by the different stimuli. The dataobtained may reflect cultivar specific responses in the caseof drought and endophytic bacteria interaction, since dif-ferent cultivars were used in these experiments. The extent
of genotypic variation among commercial cultivars is cur-rently unknown. Evaluation of sugarcane responses inadditional genotypes is underway to further validate com-monly regulated pathways.
A databank was created that provides public access to thedata described in this work, associated to tissue expressionprofiling and the SUCAST gene categories. As the SUCASTProject is an ongoing effort that aims to identify sugarcanesignaling components and define their role in grasses, thedatabase is expected to be updated each time new expres-sion data from experiments with the SUCAST arrays areavailable. We expect the SUCAST database to become auseful tool for sugarcane transcriptome data mining andin guiding the selection of target genes to be modified insugarcane and other grasses.
MethodsPlant material and cultivationThe cultivar SP90-1638 (Internal Technical Report, CTC,2002), sensitive to drought, was used for the water depri-vation experiments. The cultivar SP80-3280 sensitive toherbivory by Diatraea saccharalis [123] was adopted forthe herbivory experiments. The same cultivar was used forphosphate deficiency and phytohormone treatmentexperiments. The cultivar SP70-1143 with high inputs ofnitrogen obtained from BNF and with efficient associa-tion with endophytic bacteria [124] was used for inocula-tion with Gluconacetobacter and Herbaspirillum.
Sugarcane plantlets obtained from one-eyed seed setswere used for methyljasmonate treatment, water stressand herbivory experiments. For methyljasmonate treat-ments, one-eyed seed sets were planted in 200 ml plasticcups containing a commercial planting mix (Plantmax,Eucatex) for 20 days under greenhouse conditions andsubsequently transferred to a growth chamber at 26°C ona 16 h/8 h light/dark cycle with a photon flux density of70 μE.m-2.s-1 to acclimate for 48 h. For the insect attackassays, one-eyed seed sets were planted in 200 ml plasticcups as described above and maintained in the green-house for 60 days when they were transferred to a growthchamber at 28°C on a 14 h/8 h light/dark cycle with aphoton flux density of 70 μE.m-2.s-1. Sugarcane one-eyedseed sets were cultivated on moist sand for 15 days priorto drought experiments. For ABA treatment, plantsderived from shoot apex of 2-month-old sugarcane plantswere axenically in vitro cultivated for approximately threemonths in a growth chamber at 26°C on a 16 h/8 h light/dark cycle with a photon flux density of 70 μE.m-2.s-1. Sug-arcane rooted plantlets obtained by sterile in vitro meris-tem culture and micropropagated according to themethod of Hendre et al. [125] were used for nutritionaldeficiency and inoculation with endophytic bacteriaexperiments.
Page 14 of 22(page number not for citation purposes)
BMC Genomics 2007, 8:71 http://www.biomedcentral.com/1471-2164/8/71
Plant treatmentsPlant treatments are described below. Three biologicalreplicates were performed for each of these treatments.Two of the replicates were used for microarray experi-ments and one for real-time PCR reactions.
MeJA treatmentPlantlets were sprayed with a 100 μmol.L-1 MeJA solution(Bedoukian Research Inc., Danbury, CT), whereas controlplantlets were treated with distilled water. Leaves were col-lected 0, 1, 6 and 12 h after exposure to MeJA and imme-diately frozen in liquid nitrogen. Six plantlets weresampled for each time point.
ABA treatmentABA (Sigma Chem. Co) was added to the culture mediumto a final concentration of a 100 μmol.L-1 whereas controlplants were treated with distilled water. Leaves were col-lected 0, 0.5, 1, 6 and 12 h after exposure to ABA andimmediately frozen in liquid nitrogen. Six plantlets weresampled for each time point.
Phosphate deficiencyRooted plantlets were greenhouse acclimatized by initialcultivation on 1/20th strength Hoagland and Arnon [126]nutrient solution. Nutrient solutions were replaced every7 days increasing nutrient concentration to 1/4 strength in3 weeks. Subsequently, plants were transferred to 2.8 Lpots filled with fresh 1/4 strength nutrient solution. Afterone week, half of the plants were transferred to fresh solu-tion containing 250 μM Pi, while the other half was trans-ferred to nutrient solution deprived of phosphate (Pi),with H2PO4 being replaced by H2SO4 [127]. Roots fromeach treatment (0 and 250 μM Pi) were harvested 6, 12, 24and 48 h after the onset of phosphate starvation andimmediately frozen in liquid nitrogen. For each timepoint, root samples of two plants were pooled.
Plant-N2-fixing endophytic bacteria associationPlantlets were inoculated as described [128] with 0.1 mlof a 106 107 cells/mL bacterial suspension. Controls wereinoculated with medium only. The endophytic diazo-trophic bacteria used were Gluconacetobacter diazotrophicus(PAL5 strain) or a mixture of Herbaspirillum seropedicae(HRC54 strain) and H. rubrisubalbicans (HCC103 strain).All plants were maintained at 30°C with a photon fluxdensity of 60 μE.m-2.s-1 for 12 h d-1. One day after theinoculation, plant tissues were examined for bacterial col-onization by the Most Probable Number (MPN) estima-tion [129] and plantlets were collected and immediatelyfrozen in liquid nitrogen. Five plantlets were pooled foreach treatment.
Herbivory by Diatraea saccharalisSugarcane stalk borer larvae were grown on an artificialdiet [130] and maintained at 25°C and 60 ± 10% relativehumidity with a 14 h/10 h light/dark cycle. Second instarlarvae were maintained under fasting conditions for 18 hprior to transfer. After transferring to plantlets, larvae wereobserved for a period of two hours to ensure completeboring into the sugarcane stalk. Control plantlets werekept unattacked. After 0.5 and 24 h of exposure to herbiv-ory, plantlets were cut at the stalk/root zone and immedi-ately frozen in liquid nitrogen. For each treatment, twoplantlets were used for each time point.
DroughtThe plants were transferred to pots containing moist sand,irrigated with Hoagland's solution [126] and maintainedunder greenhouse conditions. Regular watering was con-trolled using a Livingstone atmometer [131] and main-tained for 90 days, being suppressed after this period forthe experimental group. To control for water loss, soilsamples were collected and the humid weight of each soilsample was compared with its dried weight, in order toverify the hydric loss in experimental plants. Aerial partsof the plants were collected 24, 72 and 120 h after theonset of drought for the control and experimental groups.Samples were collected and immediately frozen in liquidnitrogen. For each treatment, aerial parts of six plants wereused for each time point.
RNA extractionFrozen tissues were grinded using a homogenizer. Tissuesamples of 2–2.5 g were weighted and grinded to a finepowder, in liquid nitrogen, using a pre-cooled mortar andpestle. The pulverized tissue was transferred to a 50 mltube and homogenized with 5 ml Trizol (Invitrogen) pergram of tissue according to the manufacturer's instruc-tions. RNA pellets were resuspended in 20 μl of warm die-thyl pyrocarbonate-treated water, vortexing gently forabout 15 min. RNA samples were quantified in a spectro-photometer and loaded on 1% agarose/formaldehydegels for quality inspection.
PCR amplification and array printingcDNA microarray experiments were conducted essentiallyas reported previously [27]. Sugarcane cDNA plasmidclones obtained from the SUCEST collection were re-arranged and amplified in 100 μl PCR reactions (40cycles, annealing at 51°C), directly from bacterial clonesin culture, using T7 and SP6 primers. PCR products werepurified by filtration using 96 well filter plates (MilliporeMultiscreen MAFBN0B50). Samples were visualized on1% agarose gels to inspect PCR-amplification quality andquantity. Purified PCR products (in 10 mM Tris-HCl solu-tion at pH 8.0) were mixed with an equal volume ofDMSO in 384 well V-bottom plates. Microarrays were
Page 15 of 22(page number not for citation purposes)
BMC Genomics 2007, 8:71 http://www.biomedcentral.com/1471-2164/8/71
constructed by arraying cDNA fragments on DMSO opti-mized metal-coated glass slides (type 7, GE Healthcare)using the Generation III Microarray Spotter (MolecularDynamics). Each cDNA fragment was spotted on theslides at least twice (i.e., technical replicates). Followingprinting, the slides were allowed to dry and the spottedDNA was bound to the slides by UV-cross linking (50 mJ).
Hybridization and selection of differentially expressed genesTen to fifteen micrograms of total RNA were reverse tran-scribed, labeled, and hybridized using the reagents pro-vided with the CyScribe Post-Labeling kit (GE Healthcare)according to the manufacturer's instructions. The prod-ucts of the labeling reactions were purified in MilliporeMultiscreen filtering plates to remove unincorporatedlabeled nucleotides. Microarrays were co-hybridized withthe fluorescently labeled probes. Hybridizations were per-formed overnight at 42°C in humid chambers. The slideswere then washed in 1× SSC and 0.2% SDS (10 min,55°C), twice in 0.1× SSC and 0.2% SDS (10 min, 55°C),and in 0.1 × SSC (1 min, RT). Slides were rinsed briefly infiltered milli-Q water and dried with a nitrogen stream.Each experimental step was carefully monitored to ensurehigh quality of the slides and extracted data. Slides werescanned using the Generation III Scanner (MolecularDynamics) adjusting the photomultiplier tube (PMT) to700 for both channels.
The microarray designed was composed of 1,830 genesselected from the SUCAST Catalogue. Hybridizationswere carried out as depicted in Table 1. Two biologicalreplicates were used for each microarray experiment. The1,830 unique genes represented yielded 1,545 good-qual-ity PCR fragments.
Images were processed and data collected using the Array-Vision (Imaging Research Inc.) software. Local medianbackground was subtracted from the MTM (median-basedtrimmed mean) density for each spot [27]. Data fromclones that generated poor-quality PCR fragments (noamplification or unspecific bands) or relative to saturated,low-intensity or poor-quality spots (visually inspected)were excluded.
The fluorescence ratios were visualized and normalized inthe MxS space, where M is the base 2 logarithm of theintensities ratio and S is the base 2 logarithm of the aver-age intensity of each spot. The M values were normalizedto account for systematic errors using the LOWESS fitting[132]. The raw and normalized data are publicly availableaccording to the MIAME guidelines at the GEO databaseunder the accession numbers GSE4966 to GSE4971. Dif-ferentially expressed genes were defined as the extremeoutliers in each experiment, using an intensity-dependent
strategy modified from the HT-self method [133] anddescribed in [34]. This method defines an intensity-dependent cutoff curve using the data from each hybridi-zation, detecting non-parametrically genes with the great-est log-ratio changes (outliers) regardless of the absolutevalue of the log-ratio measurement. We defined as differ-entially expressed a gene that has at least 60% of their rep-licate-points above or below the cutoff curve in the twohybridizations of the biological vs. controls samples, indi-cating a reproducible result between the biological repli-cates. The number of technical replicates ranges from 2 to16 since genes are spotted several times in the same array.The credibility level used to define outliers was 0.8.
Clustering of expression data using Self Organizing Maps (SOM)Biologically reproducible expression profiles were clus-tered with the Self Organizing Maps (SOM) method [36]using the Spotfire DecisionSite for Functional Genomicssoftware (Spotfire, Somerville, Massachusetts) withdefault advanced parameters. For each experimentalpoint, the median of the normalized M values among alltechnical replicates was calculated for each gene repre-sented in the SUCAST microarray. The median values of Min each biological replicate were mean-centered in orderto emphasize similarities in the deviations from the meanvalue by subtracting the average expression level of eachgene along the time-course from the experimental meas-urement obtained in each experimental point. We consid-ered an expression profile as biologically reproduciblewhen the correlation coefficient was ≥ 0.7 between themean-centered values from pair-wise biological replicatecomparisons. SAS with at least one invalid M value (satu-rated, low-intensity or poor quality signals) were excludedfrom this analysis. The mean-centered values were aver-aged between the biological replicates and a PrincipalComponent Analysis (PCA) was performed to estimatethe number of groups to be generated by the SOM algo-rithm [134]. The results obtained are shown in additionalfile 11: Table 9, which demonstrate that the establishmentof four to six groups for these data was enough to repre-sent the main sources of variability among the selectedpatterns. The 2 × 2 and 2 × 3 geometries were tested whengenerating the SOM results for each of these treatments.We concluded that the 2 × 2 geometry in the case of MeJAtreatment and a 2 × 3 geometry in the case of ABA treat-ment, phosphate starvation and drought resulted ingroups with little internal variation.
Validation of microarray results by real-time PCR (RT-PCR)Two to five micrograms of total RNA (from a third biolog-ical replicate for each treatment) were treated with DNase(Invitrogen) according to the manufacturer's instructionsand an aliquot of 7.5 μl of the treated RNA was reverse-
Page 16 of 22(page number not for citation purposes)
BMC Genomics 2007, 8:71 http://www.biomedcentral.com/1471-2164/8/71
transcribed using the SuperScript First-Strand SynthesisSystem for RT-PCR (Invitrogen). The 20 μl reverse tran-scription reactions contained the RNA template, 2 μl 10×RT buffer, 0.5 mM each dATP, dGTP, dCTP and dTTP, 50ng random hexamers, 0.25 μg oligo(dT), 5 mM MgCl2, 10mM DTT (dithiothreitol), 40 U RNase OUT and 50 USuperScript II Reverse Transcriptase. RNA, random hexam-ers, dNTPs, and oligo(dT) were mixed first, incubated at70°C for 5 min and placed on ice. The remaining compo-nents, except the SuperScript II Reverse Transcriptase, wereadded to the reaction, the mixture was heated to 25°C for10 min and then incubated at 42°C for 2 min. The Super-Script II Reverse Transcriptase was added to each tube andthe reaction was incubated at 42°C for 1.5 h, 72°C for 10min, and chilled on ice. An identical reaction without thereverse transcriptase was performed as a control (noamplification control, NAC) to confirm the absence ofgenomic DNA. The cDNA product was treated with 2 U ofRNaseH (Invitrogen) for 30 min at 37°C and for 10 minat 72°C. Real-time PCR reactions were performed usingSYBR Green PCR Master Mix (Applied Biosystems) in aGeneAmp 5700 Sequence Detection System (Applied Biosys-tems). Primers were designed using the Primer Express 2.0Software (Applied Biosystems). Real-time PCR reactionswere performed in triplicates and contained 2 μl of a 1:10dilution of the synthesized cDNA, primers to a final con-centration of 600 nM each, 12.5 μl of the SYBR Green PCRMaster Mix and PCR-grade water to a total volume of 25μl. In the case of reactions using primers for 25S rRNA, adilution of 1:1,000 of the synthesized cDNA was used.The parameters for the PCR reaction were 50°C for 2 min,95°C for 10 min, 40 cycles of 95°C for 15 s and 60°C for1 min. The specificity of the amplified products was eval-uated by the analysis of the dissociation curves generated.No template controls (NTC) and no amplification con-trols (NAC) were run in order to confirm the absence ofgenomic DNA or reagent contamination. The relativeexpression ratio (experimental/control) was determinedbased on the 2-ΔΔCt method [135]. To access the statisticalsignificance of expression ratios, we assumed a log-nor-mal model and calculated the probability Pr(sample>ref-erence) and Pr(sample < reference) for up- and down-regulated genes, respectively. The expression profile wasconsidered validated when P ≥ 0.99. The primers used areshown in additional file 10: Table 8.
Phylogenetic grouping of kinasesSugarcane sequences containing a putative pkinase (cata-lytic domain of protein kinases) domain, as defined bythe Pfam algorithm [43] were selected for the phyloge-netic analysis of RLKs and other protein kinases. Proteinkinase sequences from other organisms were retrieved intheir majority from the PlantsP database [122] and usedas drivers in the phylogenetic analysis. The sequenceswere aligned using ClustalW [136] with default parame-
ters. The pkinase alignment was manually adjusted to pre-serve the conserved subdomains defined by Hanks andcolleagues [118-120] for eukaryotic kinases using the Se-Al Sequence Alignment Editor [137]. The alignment wastrimmed to remove gaps in most of the sequences.Sequences spanning less than 50% of this partial align-ment were discarded. The alignment was analysed withPAUP [138] using the neighbor-joining (NJ) algorithmand distance as the criterion. Bootstrap analysis was con-ducted with 500 replicates using NJ/UPGMA and distanceas the criterion.
List of abbreviations usedABA: abscisic acid, BNF: Biological Nitrogen Fixation,CDPKs: Calcium-Dependent Protein Kinases, GAPDH:glyceraldehyde 3-phosphate dehydrogenase, MeJA:methyl jasmonate, NJ: neighbor-joining, PCA: PrincipalComponent Analysis, RLCKs: Receptor-Like CytoplasmicKinases, RLKs: Receptor-Like Kinases, SAS: SugarcaneAssembled Sequences, SOM: Self-Organizing Maps,SUCAST: The Sugarcane Signal Transduction Project,SUCAMET: Sugarcane Metabolism Project; SUCEST: TheSugarcane EST Project.
Authors' contributionsGMS as the General Coordinator of the SUCEST Project,conceived, advised and coordinated most aspects of thestudy. GMS and FRR wrote the manuscript. FRR and FSPTproduced the arrays, designed the experiments, performedthe hybridizations and analysed the data. FRR also per-formed the real-time PCR experiments and the SOM clus-tering analysis. MYN and RZNV worked on the datastatistical analysis and differential gene expression deter-mination. FRR, FSPT and GSM annotated and cataloguedthe genes. GSM conceived the SUCEST-FUN, SUCAST andSUCAMET Databases. RV constructed the SUCEST-FUNdatabase and MYN helped with computational issues. Thefollowing researchers were responsible for conductingplant experimentation as follows: phosphate starvation(RDCD, RSA, AVOF); sugarcane inoculation with endo-phytic bacteria (FV, ASH); herbivory attack (CB, AHM,MCSF); drought experiments (FAR, JAG, SMZ); phytohor-mone treatments (VER, MM). ECS was responsible forsugarcane cultivation at CTC, Piracicaba. All authors con-tributed, read, corrected and approved the final manu-script. The authors declare no conflict of interest in thiswork.
Page 17 of 22(page number not for citation purposes)

BMC Genomics 2007, 8:71 http://www.biomedcentral.com/1471-2164/8/71
Additional material
Additional file 1SUCAST SAS showing differential expression in response to the applied treatments. The table lists all SAS whose expression was enriched or decreased in both biological samples for each experimental point. The plus sign indicates that the SAS expression is up-regulated, the minus sign indi-cates that the gene expression is down-regulated. The asterisk indicates that the SAS identity was not confirmed by re-sequencing. The table also shows the expression profile of these genes in six sugarcane tissues (**revised from [27]). The last four columns indicate the SOM groups in which these SAS were included (numbered according to Figure 1). The expression data for sugarcane tissues were inferred from microarray hybridizations of tissue samples against a common reference constituted by an equimolar mixture of the tissues sampled [27]. FL = flowers, LB = lat-eral buds, LV = leaves, RT = roots, IN1 = first internodes, IN4 = fourth internodes, PD = phosphate deficiency, H = inoculation with Her-baspirillum spp., GD = inoculation with Gluconacetobacter diazo-trophicus.Click here for file[http://www.biomedcentral.com/content/supplementary/1471-2164-8-71-S1.xls]
Additional file 2Log2 ratios of microarray signals between the Cy3 and Cy5 channels. For each clone, the median intensity value of the technical replicates was used to calculate the ratio between the experimental samples and the reference sample. The numbers 1 and 2 denote the different biological samples used for each experiment. The asterisk indicates that the SAS identity was not confirmed by re-sequencing. Only valid values are shown, excluding data from saturated, low-intensity and low-quality spots. Data from clones for which PCR reactions produced low yields or multiple bands were also removed. The table contains 1,555 elements and not 1,545. This is due to the fact that some SAS are represented more than once in the Table. This occurs when the same SAS is represented in more than one position in the 384-well plates and some of these positions did not have their iden-tity validated by re-sequencing. In these cases, we opted to analyse these data separately.Click here for file[http://www.biomedcentral.com/content/supplementary/1471-2164-8-71-S2.xls]
Additional file 3SUCAST protein kinases showing differential expression in response to the applied conditions. For SAS included in the SOM clustering analysis, the group to which the SAS belongs is indicated. The plus sign indicates that the SAS expression is up-regulated, the minus sign indicates that the gene expression is down-regulated. The asterisk indicates that the SAS identity was not confirmed by re-sequencing. The last four columns indicate the SOM groups in which these SAS were included (numbered according to Figure 1). PD = phosphate deficiency, H = inoculation with Herbaspiril-lum spp., GD = inoculation with Gluconacetobacter diazotrophicus.Click here for file[http://www.biomedcentral.com/content/supplementary/1471-2164-8-71-S3.xls]
Additional file 4Components of the SOM groups generated for ABA treatment. The table indexes all genes that were included in the clustering analysis (correlation coefficient ≥ 0.7 between the expression profiles obtained for the two bio-logical replicates of a particular experiment) and their respective groups. The asterisk indicates that the SAS identity was not confirmed by re-sequencing.Click here for file[http://www.biomedcentral.com/content/supplementary/1471-2164-8-71-S4.xls]
Additional file 5Components of the SOM groups generated for MeJA treatment. The table indexes all genes that were included in the clustering analysis (correlation coefficient ≥ 0.7 between the expression profiles obtained for the two bio-logical replicates of a particular experiment) and their respective groups. The asterisk indicates that the SAS identity was not confirmed by re-sequencing.Click here for file[http://www.biomedcentral.com/content/supplementary/1471-2164-8-71-S5.xls]
Additional file 6Components of the SOM groups generated for phosphate deficiency treat-ment. The table indexes all genes that were included in the clustering analysis (correlation coefficient ≥ 0.7 between the expression profiles obtained for the two biological replicates of a particular experiment) and their respective groups. The asterisk indicates that the SAS identity was not confirmed by re-sequencing.Click here for file[http://www.biomedcentral.com/content/supplementary/1471-2164-8-71-S6.xls]
Additional file 7Components of the SOM groups generated for drought treatment. The table indexes all genes that were included in the clustering analysis (cor-relation coefficient ≥ 0.7 between the expression profiles obtained for the two biological replicates of a particular experiment) and their respective groups. The asterisk indicates that the SAS identity was not confirmed by re-sequencing. ** The two different results obtained for this SAS are related to different positions in the 384-well plates. In both positions the SAS identity was not validated by re-sequencing. Because of this, these positions were treated separately.Click here for file[http://www.biomedcentral.com/content/supplementary/1471-2164-8-71-S7.xls]
Additional file 8Neighbor-joining (NJ) tree of kinase domains from sugarcane protein kinases. Selected kinase domains were aligned to construct a distance tree with the NJ algorithm. Bootstrap values greater than 50% (500 repli-cates) are shown for nodes in the tree. The RLKs/RLCKs group is high-lighted in gray and only some representatives of this group are included. The undefined kinases are highlighted in red. Drivers are in italic. The SAS name in the figure is preceded by a prefix based on the BLAST simi-larity searches as indicated in the Annotation Box. The branch color indi-cates the presence of additional Pfam [43] domain besides the pkinase domain as indicated in the Domains Box.Click here for file[http://www.biomedcentral.com/content/supplementary/1471-2164-8-71-S8.eps]
Page 18 of 22(page number not for citation purposes)
BMC Genomics 2007, 8:71 http://www.biomedcentral.com/1471-2164/8/71
AcknowledgementsThis work was funded by FAPESP (Fundação de Amparo à Pesquisa do Estado de São Paulo), Centro de Tecnologia Canavieira and Central de Álcool Lucélia Ltda. We are indebted to Sarah D. B. Cavalcanti, Erica Ban-deira, Adriana Y. Matsukuma and Denise Yamamoto for technical assistance on microarray experiments performed in the laboratory of the Coopera-tion for Analysis of Gene Expression (CAGE) inter-departmental Project and Dr. Enrico Arrigoni for providing us with the D. saccharalis larvae.
FRR, FSPT, JMF, RSA were supported by FAPESP (Fundação de Amparo à Pesquisa do Estado de São Paulo) fellowships. RV was supported by a fel-lowship from the UNIEMP Institute. FV and ASH were supported by CNPq (Conselho Nacional de Desenvolvimento Científico e Tecnológico) fellow-ships. RDD was supported by CAPES (Coordenação de Aperfeiçoamento de Pessoal de Nível Superior). AVOF, MCSF and MM are recipients of research productivity fellowships from CNPq.
References1. Bray EA, Bailey-Serres J, Weretilnyk E: Responses to abiotic
stresses. In Biochemistry & Molecular Biology of Plants Edited by: Bucha-
nan B, Gruissem W, Jones R. Rockyville, Maryland: American Societyof Plant Physiologists; 2000:1158-1203.
2. Schenk PM, Kazan K, Wilson I, Anderson JP, Richmond T, SomervilleSC, Manners JM: Coordinated plant defense responses in Arabi-dopsis revealed by microarray analysis. Proc Natl Acad Sci USA2000, 97:11655-11660.
3. Kawasaki S, Borchert C, Deyholos M, Wang H, Brazille S, Kawai K,Galbraith D, Bohnert HJ: Gene expression profiles during the ini-tial phase of salt stress in rice. Plant Cell 2001, 13:889-905.
4. Oono Y, Seki M, Nanjo T, Narusaka M, Fujita M, Satoh R, Satou M,Sakurai T, Ishida J, Akiyama K, Iida K, Maruyama K, Satoh S, Yamaguchi-Shinozaki K, Shinozaki K: Monitoring expression profiles of Ara-bidopsis gene expression during rehydration process afterdehydration using ca 7,000 full-length cDNA microarray. PlantJ 2003, 34:868-887.
5. Oono Y, Seki M, Satou M, Iida K, Akiyama K, Sakurai T, Fujita M,Yamaguchi-Shinozaki K, Shinozaki K: Monitoring expression pro-files of Arabidopsis genes during cold acclimation and deaccli-mation using DNA microarrays. Funct Integr Genomics 2006,4:1-23.
6. Nogueira FT, De Rosa VE Jr, Menossi M, Ulian EC, Arruda P: RNAexpression profiles and data mining of sugarcane response tolow temperature. Plant Physiol 2003, 132:1811-1824.
7. De Rosa, Jr. VE, Nogueira FTS, Menossi M, Ulian EC, Arruda P: Iden-tification of methyl jasmonate-responsive genes in sugarcaneusing cDNA arrays. Braz J Plant Physiol 2005, 17:173-180.
8. Kates RW, Parris TM: Long-term trends and a sustainabilitytransition. Proc Natl Acad Sci USA 2003, 100:8062-8067.
9. Riera M, Valon C, Fenzi F, Giraudat J, Leung J: The genetics of adap-tive responses to drought stress: abscisic acid-dependent andabscisic acid-independent signalling components. PhysiologiaPlantarum 2005, 123:111-119.
10. Kochian LV: Molecular physiology of mineral nutrient acquisi-tion, transport and utilization. In Biochemistry and Molecular Biologyof Plants Edited by: Buchanan B, Gruissem W, Jones R. Rockyville, Mar-yland: American Society of Plant Physiologists; 2000:1204-1249.
11. Raghothama KG: Phosphate acquisition. Annu Rev Plant Physiol PlantMol Biol 1999, 50:665-693.
12. Raghothama KG: Phosphate transport and signaling. Curr OpinPlant Biol 2000, 3:182-187.
13. Schachtman DP, Reid RJ, Ayling SM: Phosphorus Uptake by Plants:From soil to Cell. Plant Physiol 1998, 116:447-453.
14. Braga DPV, Arrigoni EDB, Silva-Filho MC, Ulian EC: Expression ofthe Cry1Ab protein in genetically modified sugarcane for thecontrol of Diatraea saccharalis (Lepidoptera: Crambidae). Jour-nal of New Seeds 2003, 5:209-222.
15. James EK, Olivares FL: Infection and Colonization of Sugar Caneand Other Graminaceous Plants by Endophytic Diazotrophs.Critical Reviews in Plant Sciences 1998, 17:77-119.
16. Reinhold-Hurek B, Hurek T: Life in grasses: diazotrophic endo-phytes. Trends Microbiol 1998, 6:139-144.
17. Sevilla M, Burris RH, Gunapala N, Kennedy C: Comparison of ben-efit to Sugar Cane plant growth an 15N2 incorporation follow-ing inoculation of sterile plants with Acetobacterdiazotrophicus wild-type and Nif- mutant strains. Mol Plant-Microbe Interact 2001, 14:358-366.
18. Olivares FL, James EK, Baldani JI, Döbereiner J: Infection of mottledstripe disease-susceptible and resistant sugarcane varietiesby the endophytic diazotrophs Herbaspirillum. New phytol 1997,135:723-727.
19. Himmelbach A, Yang Y, Grill E: Relay and control of abscisic acidsignaling. Curr Opin Plant Biol 2003, 6:470-479.
20. Seki M, Ishida J, Narusaka M, Fujita M, Nanjo T, Umezawa T, KamiyaA, Nakajima M, Enju A, Sakurai T, Satou M, Akiyama K, Yamaguchi-Shi-nozaki K, Carninci P, Kawai J, Hayashizaki Y, Shinozaki K: Monitoringthe expression pattern of around 7,000 Arabidopsis genesunder ABA treatments using a full-length cDNA microarray.Funct Integr Genomics 2002, 2:282-291.
21. Petersen M, Brodersen P, Naested H, Andreasson E, Lindhart U,Johansen B, Nielsen HB, Lacy M, Austin MJ, Parker JE, Sharma SB, Kles-sig DF, Martienssen R, Mattsson O, Jensen AB, Mundy J: Arabidopsismap kinase 4 negatively regulates systemic acquired resist-ance. Cell 2000, 103:1111-1120.
22. van der Fits L, Memelink J: ORCA3, a jasmonate-responsive tran-scriptional regulator of plant primary and secondary metab-olism. Science 2000, 289:295-297.
23. Devoto A, Nieto-Rostro M, Xie D, Ellis C, Harmston R, Patrick E,Davis J, Sherratt L, Coleman M, Turner JG: COI1 links jasmonatesignalling and fertility to the SCF ubiquitin-ligase complex inArabidopsis. Plant J 2002, 32:457-466.
24. Sugar Cane EST Genome Project [http://sucest.lad.ic.unicamp.br]
Additional file 9Neighbor-joining (NJ) tree of kinase domains of sugarcane RLKs and RLCKs. Selected kinase domains from sugarcane RLKs and RLCKs and from other plants (drivers) were aligned to construct a distance tree with the NJ algorithm. Bootstrap values greater than 50% (500 replicates) are shown for nodes in the tree. Drivers are in italic. Undefined RLKs and RLCKs are highlighted in red. The SAS name in the figure is preceded by a prefix based on the BLAST similarity searches as indicated in the Anno-tation Box. The branch color indicates the presence of additional Pfam [43] and SMART [139] domains besides the pkinase domain as indicated in the Domains Box.Click here for file[http://www.biomedcentral.com/content/supplementary/1471-2164-8-71-S9.eps]
Additional file 10Sugarcane genes and primers selected for real-time PCR experiments. Primers were designed using the Primer Express 2.0 Software (Applied Biosystems) and BLAST searches against the SUCEST database were con-ducted to ensure the specificity of the selected primers. The column Exper-imental Datapoints lists the samples analysed. Primer sequences for endogenous references were retrieved from [27] and [38]. The P value is the probability Pr(sample>reference) and Pr(sample < reference) for up- and down-regulated genes, respectively. The expression profile was consid-ered validated when P ≥ 0.99.Click here for file[http://www.biomedcentral.com/content/supplementary/1471-2164-8-71-S10.xls]
Additional file 11PCA analysis for defining the number of groups in SOM. The difference between the magnitude of principal component eigenvalues for each treat-ment (columns) estimates how many groups are minimally necessary in each SOM grouping analysis. When the difference is near zero, there is no substantial information added by increasing the number of seed groups in SOM.Click here for file[http://www.biomedcentral.com/content/supplementary/1471-2164-8-71-S11.xls]
Page 19 of 22(page number not for citation purposes)
BMC Genomics 2007, 8:71 http://www.biomedcentral.com/1471-2164/8/71
25. Vettore AL, da Silva FR, Kemper EL, Souza GM, da Silva AM, Ferro MI,Henrique-Silva F, Giglioti EA, Lemos MV, Coutinho LL, Nóbrega MP,Carrer H, Franca SC, Bacci M Junior, Goldman MH, Gomes SL, NunesLR, Camargo LE, Siqueira WJ, Van Sluys MA, Thiemann OH, KuramaeEE, Santelli RV, Marino CL, Targon ML, Ferro JA, Silveira HC, MariniDC, Lemos EG, Monteiro-Vitorello CB, Tambor JH, Carraro DM,Roberto PG, Martins VG, Goldman GH, de Oliveira RC, Truffi D,Colombo CA, Rossi M, de Araújo PG, Sculaccio SA, Angella A, LimaMM, de Rosa VE Junior, Siviero F, Coscrato VE, Machado MA, GrivetL, Di Mauro SM, Nóbrega FG, Menck CF, Braga MD, Telles GP, CaraFA, Pedrosa G, Meidanis J, Arruda P: Analysis and functional anno-tation of an expressed sequence tag collection for tropicalcrop sugarcane. Genome Res 2003, 13:2725-2735.
26. Souza GM, Simoes ACQ, Oliveira KC, Garay HM, Fiorini LC, GomesFS, Nishiyama-Junior MY, da Silva AM: SUCAST: prospecting sig-nal transduction in sugarcane. Genet Mol Biol 2001, 24:25-34.
27. Papini-Terzi FS, Rocha FR, Vencio RZ, Oliveira KC, Felix J, de M, Vice-ntini R, Rocha C, de S, Simões AC, Ulian EC, di Mauro SM, da Silva AM,Pereira CA, Menossi M, Souza GM: Transcription profiling of sig-nal transduction-related genes in sugarcane tissues. DNA Res2005, 12:27-38.
28. Shiu SH, Bleecker AB: Plant receptor-like kinase gene family:diversity, function, and signaling. Sci STKE 2001,2001(113):RE22.
29. Berger S: Jasmonate-related mutants of Arabidopsis as toolsfor studying stress signaling. Planta 2002, 214:497-504.
30. Howe GA, Schilmiller AL: Oxylipin metabolism in response tostress. Curr Opin Plant Biol 2002, 5:230-236.
31. Devoto A, Turner JG: Regulation of jasmonate-mediated plantresponses in Arabidopsis. Ann Bot 2003, 92:329-337.
32. Verslues PE, Zhu JK: Before and beyond ABA: upstream sensingand internal signals that determine ABA accumulation andresponse under abiotic stress. Biochem Soc Trans 2005,33:375-379.
33. The SUCEST-FUN Project [http://sucest-fun.org]34. Koide T, Salem-Izaac SM, Gomes SL, Vencio RZN: SpotWhatR: a
user-friendly microarray data analysis system. Genet Mol Res2006, 5:93-107.
35. Additional Data Files [https://sucestfun.cbmeg.unicamp.br/pub/signal]
36. Tamayo P, Slonim D, Mesirov J, Zhu Q, Kitareewan S, Dmitrovsky E,Lander ES, Golub TR: Interpreting patterns of gene expressionwith self-organizing maps. Proc Natl Acad Sci USA 1999,96:2907-2912.
37. Shiu SH, Bleecker AB: Receptor-like kinases from Arabidopsisform a monophyletic gene family related to animal receptorkinases. Proc Natl Acad Sci USA 2001, 98:10763-10768.
38. Iskandar HM, Simpson RS, Casu RE, Bonnett GD, MacLean DJ, Man-ners JM: Comparison of Reference Genes for QuantitativeReal-Time Polymerase Chain Reaction Analysis of GeneExpression in Sugarcane. Plant Molecular Biology Reporter 2004,22:325-337.
39. MySQL AB [http://www.mysql.com]40. Perl.com [http://www.perl.com]41. The R Project for Statistical Computing [http://www.r-
project.org]42. Gene Ontology Consortium: The Gene Ontology (GO) project in
2006. Nucleic Acids Res 2006, 34:D322-326.43. Sonnhammer ELL, Eddy SR, Birney E, Bateman A, Durbin R: Pfam:
multiple sequence alignments and HMM-profiles of proteindomains. Nucleic Acids Res 1998, 26:320-322.
44. Abe H, Yamaguchi-Shinozaki K, Urao T, Iwasaki T, Hosokawa D, Shi-nozaki K: Role of Arabidopsis MYC and MYB homologs indrought- and abscisic acid-regulated gene expression. PlantCell 1997, 9:1859-1868.
45. Narusaka Y, Narusaka M, Seki M, Umezawa T, Ishida J, Nakajima M,Enju A, Shinozaki K: Crosstalk in the responses to abiotic andbiotic stresses in Arabidopsis : analysis of gene expression incytochrome P450 gene superfamily by cDNA microarray.Plant Mol Biol 2004, 55:327-342.
46. Chinnusamy V, Schumaker K, Zhu JK: Molecular genetic perspec-tives on cross-talk and specificity in abiotic stress signalling inplants. J Exp Bot 2004, 55:225-236.
47. Seki M, Narusaka M, Abe H, Kasuga M, Yamaguchi-Shinozaki K, Carn-inci P, Hayashizaki Y, Shinozaki K: Monitoring the expression pat-tern of 1,300 Arabidopsis genes under drought and coldstresses by using a full-length cDNA microarray. Plant Cell2001, 13:61-72.
48. Sakuma Y, Maruyama K, Osakabe Y, Qin F, Seki M, Shinozaki K,Yamaguchi-Shinozaki K: Functional analysis of an Arabidopsistranscription factor, DREB2A, involved in drought-respon-sive gene expression. Plant Cell 2006, 18:1292-1309.
49. Merlot S, Gosti F, Guerrier D, Vavasseur A, Giraudat J: The ABI1and ABI2 protein phosphatases 2C act in a negative feedbackregulatory loop of the abscisic acid signalling pathway. Plant J2001, 25:295-303.
50. Tahtiharju S, Palva T: Antisense inhibition of protein phos-phatase 2C accelerates cold acclimation in Arabidopsis thal-iana. Plant J 2001, 26:461-470.
51. Galston AW, Sawhney RK: Polyamines in plant physiology. PlantPhysiol 1990, 94:406-410.
52. Li ZY, Chen SY: Differential accumulation of the S-adenosylme-thionine decarboxylase transcript in rice seedlings inresponse to salt and drought stresses. Theor Appl Genet 2000,100:782-788.
53. Zhang M, Barg R, Yin M, Gueta-Dahan Y, Leikin-Frenkel A, Salts Y,Shabtai S, Ben-Hayyim G: Modulated fatty acid desaturation viaoverexpression of two distinct omega-3 desaturases differen-tially alters tolerance to various abiotic stresses in transgenictobacco cells and plants. Plant J 2005, 44:361-371.
54. Im YJ, Han O, Chung GC, Cho BH: Antisense expression of anArabidopsis omega-3 fatty acid desaturase gene reduces salt/drought tolerance in transgenic tobacco plants. Mol Cells 2002,13:264-271.
55. Sachetto-Martins G, Franco LO, de Oliveira DE: Plant glycine-richproteins: a family or just proteins with a common motif? Bio-chim Biophys Acta 2000, 1492:1-14.
56. Mousavi A, Hotta Y: Glycine-rich proteins: a class of novel pro-teins. Appl Biochem Biotechnol 2005, 120:169-174.
57. van Nocker S, Vierstra RD: Two cDNAs from Arabidopsis thal-iana encode putative RNA binding proteins containing gly-cine-rich domains. Plant Mol Biol 1993, 21:695-699.
58. Aneeta Sanan-Mishra N, Tuteja N, Kumar Sopory S: Salinity- andABA-induced up regulation and light-mediated modulation ofmRNA encoding glycine-rich RNA-binding protein from Sor-ghum bicolor. Biochem Biophys Res Commun 2002, 296:1063-1068.
59. Freire MA, Pages M: Functional characteristics of the maizeRNA-binding protein MA16. Plant Mol Biol 1995, 29:797-807.
60. Zheng ZL, Nafisi M, Tam A, Li H, Crowell DN, Chary SN, SchroederJI, Shen J, Yang Z: Plasma membrane-associated ROP10 smallGTPase is a specific negative regulator of abscisic acidresponses in Arabidopsis. Plant Cell 2002, 14:2787-2797.
61. Nahm MY, Kim SW, Yun D, Lee SY, Cho MJ, Bahk JD: Molecular andbiochemical analyses of OsRab7, a rice Rab7 homolog. PlantCell Physiol 2003, 44:1341-1349.
62. O'Mahony PJ, Oliver MJ: Characterization of a desiccation-responsive small GTP-binding protein (Rab2) from the desic-cation-tolerant grass Sporobolus stapfianus. Plant Mol Biol 1999,39:809-821.
63. Kim SA, Kwak HJ, Park MC, Kim SR: Induction of reproductiveorgan-preferential histone genes by wounding or methyl jas-monate. Mol Cells 1998, 8:669-677.
64. Lin F, Xu SL, Ni WM, Chu ZQ, Xu ZH, Xue HW: Identification ofABA-responsive genes in rice shoots via cDNA macroarray.Cell Res 2003, 13:59-68.
65. Yamada S, Komori T, Hashimoto A, Kuwata S, Imaseki H, Kubo T: Dif-ferential expression of plastidic aldolase genes in Nicotianaplants under salt stress. Plant Sci 2000, 154:61-69.
66. Minhas D, Grover A: Transcript level of genes encoding variousglycolytic and fermentation enzymes change in response toabiotic stresses. Plant Science 1999, 146:41-51.
67. Gibson SI: Sugar and phytohormone response pathways: navi-gating a signalling network. J Exp Bot 2004, 55:253-264.
68. Zhang B, Pan X, Cobb GP, Anderson TA: Plant microRNA: a smallregulatory molecule with big impact. Dev Biol 2006, 289:3-16.
69. Gelhaye E, Rouhier N, Jacquot JP: The thioredoxin H system ofhigher plants. Plant Physiol Biochem 2004, 42:265-271.
70. Wu P, Ma L, Hou X, Wang M, Wu Y, Liu F, Deng XW: PhosphateStarvation Triggers Distinct Alterations of Genome Expres-sion in Arabidopsis Roots and Leaves. Plant Physiol 2003,132:1260-1271.
71. Wissenbach M, Uberlacker B, Vogt F, Becker D, Salamini F, Rohde W:Myb genes from Hordeum vulgare: tissue-specific expressionof chimeric Myb promoter/Gus genes in transgenic tobacco.Plant J 1993, 4:411-422.
72. Vinagre F, Vargas C, Schwarcz K, Cavalcante J, Nogueira EM, BaldaniJI, Ferreira PC, Hemerly AS: SHR5: a novel plant receptor kinaseinvolved in plant-N2-fixing endophytic bacteria association. JExp Bot 2006, 57:559-569.
73. Ellis J, Dodds P, Pryor T: Structure, function and evolution ofplant disease resistance genes. Curr Opin Plant Biol 2000,3:278-284.
74. Gaffney T, Friedrich L, Vernooij B, Negrotto D, Nye G, Uknes S, WardE, Kessmann H, Ryals J: Requirement of salicylic acid for the
Page 20 of 22(page number not for citation purposes)
BMC Genomics 2007, 8:71 http://www.biomedcentral.com/1471-2164/8/71
induction of systemic acquired resistance. Science 1993,261:754-756.
75. Delaney TP, Uknes S, Vernooij B, Friedrich L, Weymann K, NegrottoD, Gaffney T, Gut-Rella M, Kessmann H, Ward E, Ryals J: A centralrole of salicylic acid in plant disease resistance. Science 1994,266:1247-1250.
76. Mur LAJ, Bi Y-M, Darby RM, Firek S, Draper J: Compromising earlysalicylic acid accumulation delays the hypersensitive responseand increases viral dispersion during lesion establishment inTMV-infected tobacco. Plant J 1997, 12:1113-1126.
77. Vargas C, de Pádua V, Nogueira EM, Vinagre F, Masuda HP, da Silva FR,Baldani JI, Ferreira PCG, Hemerly AS: Signaling pathways mediat-ing the association between sugarcane and endophytic diazo-trophic bacteria: a genomic approach. Symbiosis 2003,35:159-180.
78. Grenier J, Potvin C, Trudel J, Asselin A: Some thaumatin-like pro-teins hydrolyse polymeric beta-1,3-glucans. Plant J 1999,19:473-480.
79. Franco OL, Rigden DJ, Melo FR, Grossi-De-Sa MF: Plant alpha-amy-lase inhibitors and their interaction with insect alpha-amy-lases. Eur J Biochem 2002, 269:397-412.
80. Moller SG, Chua NH: Interactions and intersections of plant sig-naling pathways. J Mol Biol 1999, 293:219-234.
81. Gazzarrini S, McCourt P: Cross-talk in plant hormone signalling:what Arabidopsis mutants are telling us. Ann Bot 2003,91:605-612.
82. Hagen G, Kleinschmidt A, Guilfoyle T: Auxin-regulated geneexpression in intact soybean hypocotyl and excised hypocotylsections. Planta 1984, 162:147-153.
83. Stafstrom JP, Ripley BD, Devitt ML, Drake B: Dormancy-associatedgene expression in pea axillary buds. Cloning and expressionof PsDRM1 and PsDRM2. Planta 1998, 205:547-552.
84. Eckert M, Kaldenhoff R: Light-induced stomatal movement ofselected Arabidopsis thaliana mutants. J Exp Bot 2000,51:1435-1442.
85. Nag R, Maity MK, Dasgupta M: Dual DNA binding property ofABA insensitive 3 like factors targeted to promoters respon-sive to ABA and auxin. Plant Mol Biol 2005, 59:821-838.
86. Sadiqov ST, Akbulut M, Ehmedov V: Role of Ca2+ in drought stresssignaling in wheat seedlings. Biochemistry (Mosc) 2002,67:491-497.
87. Vartanian N, Marcotte L, Giraudat J: Drought Rhizogenesis in Ara-bidopsis thaliana (Differential Responses of HormonalMutants). Plant Physiol 1994, 104:761-767.
88. Ludwig-Müller J, Schubert B, Pieper K: Regulation of IBA syn-thetase from maize (Zea mays L.) by drought stress and ABA.J Exp Bot 1995, 46:423-432.
89. Abel S, Theologis A: Early genes and auxin action. Plant Physiol1996, 111:9-17.
90. Woodward AW, Bartel B: Auxin: regulation, action, and interac-tion. Ann Bot 2005, 95:707-735.
91. Hammond JP, Broadley MR, White PJ: Genetic responses to phos-phorus deficiency. Ann Bot 2004, 94:323-332.
92. Lopez-Bucio J, Hernandez-Abreu E, Sanchez-Calderon L, Nieto-JacoboMF, Simpson J, Herrera-Estrella L: Phosphate availability altersarchitecture and causes changes in hormone sensitivity in theArabidopsis root system. Plant Physiol 2002, 129:244-256.
93. Swarup R, Parry G, Graham N, Allen T, Bennett M: Auxin cross-talk:integration of signalling pathways to control plant develop-ment. Plant Mol Biol 2002, 49:411-426.
94. Yang G, Komatsu S: Molecular cloning and characterization of anovel brassinolide enhanced gene OsBLE1 in Oryza sativaseedlings. Plant Physiol Biochem 2004, 42:1-6.
95. Mao C, Wang S, Jia Q, Wu P: OsEIL1, a rice homolog of the Ara-bidopsis EIN3 regulates the ethylene response as a positivecomponent. Plant Mol Biol 2006, 61:141-152.
96. Manning G, Plowman GD, Hunter T, Sudarsanam S: Evolution ofprotein kinase signaling from yeast to man. Trends Biochem Sci2002, 27:514-520.
97. Manning G, Whyte DB, Martinez R, Hunter T, Sudarsanam S: Theprotein kinase complement of the human genome. Science2002, 298:1912-1934.
98. Shiu SH, Karlowski WM, Pan R, Tzeng YH, Mayer KF, Li WH: Com-parative analysis of the receptor-like kinase family in Arabi-dopsis and rice. Plant Cell 2004, 16:1220-1234.
99. Shi J, Kim KN, Ritz O, Albrecht V, Gupta R, Harter K, Luan S, Kudla J:Novel protein kinases associated with calcineurin B-like cal-cium sensors in Arabidopsis. Plant Cell 1999, 11:2393-2405.
100. Hrabak EM, Chan CW, Gribskov M, Harper JF, Choi JH, Halford N,Kudla J, Luan S, Nimmo HG, Sussman MR, Thomas M, Walker-Sim-mons K, Zhu JK, Harmon AC: The Arabidopsis CDPK-SnRKsuperfamily of protein kinases. Plant Physiol 2000, 132:666-680.
101. Weaver CD, Roberts DM: Determination of the site of phospho-rylation of nodulin 26 by the calcium-dependent proteinkinase from soybean nodules. Biochemistry 1992, 31:8954-8959.
102. Webb KJ, Skot L, Nicholson MN, Jorgensen B, Mizen S: Meso-rhizobium loti increases root-specific expression of a calcium-binding protein homologue identified by promoter tagging inLotus japonicus. Mol Plant Microbe Interact 2000, 13:606-616.
103. White PJ: A Nod and a wave: calcium signals during nodulation.Trends Plant Sci 2001, 6:141.
104. Levy J, Bres C, Geurts R, Chalhoub B, Kulikova O, Duc G, Journet EP,Ane JM, Lauber E, Bisseling T, Denarie J, Rosenberg C, Debelle F: Aputative Ca2+ and calmodulin-dependent protein kinaserequired for bacterial and fungal symbioses. Science 2004,303:1361-1364.
105. Romeis T, Piedras P, Jones JD: Resistance gene-dependent activa-tion of a calcium-dependent protein kinase in the plantdefense response. Plant Cell 2000, 12:803-816.
106. Jonak C, Hirt H: Glycogen synthase kinase 3/SHAGGY-likekinases in plants: an emerging family with novel functions.Trends Plant Sci 2002, 7:457-461.
107. Swiderski MR, Innes RW: The Arabidopsis PBS1 resistance geneencodes a member of a novel protein kinase subfamily. PlantJ 2001, 26:101-112.
108. Endre G, Kereszt A, Kevei Z, Mihacea S, Kalo P, Kiss GB: A receptorkinase gene regulating symbiotic nodule development. Nature2002, 417:962-966.
109. Madsen EB, Madsen LH, Radutoiu S, Olbryt M, Rakwalska M, Szczy-glowski K, Sato S, Kaneko T, Tabata S, Sandal N, Stougaard J: A recep-tor kinase gene of the LysM type is involved in legumeperception of rhizobial signals. Nature 2003, 425:637-640.
110. Capoen W, Goormachtig S, De Rycke R, Schroeyers K, Holsters M:SrSymRK, a plant receptor essential for symbiosome forma-tion. Proc Natl Acad Sci USA 2005, 102:10369-10374.
111. Umezawa T, Yoshida R, Maruyama K, Yamaguchi-Shinozaki K, Shino-zaki K: SRK2C, a SNF1-related protein kinase 2, improvesdrought tolerance by controlling stress-responsive geneexpression in Arabidopsis thaliana. Proc Natl Acad Sci USA 2004,101:17306-17311.
112. Mustilli AC, Merlot S, Vavasseur A, Fenzi F, Giraudat J: ArabidopsisOST1 protein kinase mediates the regulation of stomatalaperture by abscisic acid and acts upstream of reactive oxy-gen species production. Plant Cell 2002, 14:3089-3099.
113. Li JX, Assmann SM: An abscisic acid activated and calcium-inde-pendent protein kinase from guard cells of fava bean. Plant Cell1996, 8:2359-2368.
114. Li J, Wang XQ, Watson MB, Assmann SM: Regulation of abscisicacid-induced stomatal closure and anion channels by guardcell AAPK kinase. Science 2000, 287:300-303.
115. Yoshida R, Hobo T, Ichimura K, Mizoguchi T, Takahashi F, Aronso J,Ecker JR, Shinozaki K: ABA-activated SnRK2 protein kinase isrequired for dehydration stress signaling in Arabidopsis. PlantCell Physiol 2002, 43:1473-1483.
116. Xiong L, Schumaker KS, Zhu JK: Cell signaling during cold,drought, and salt stress. Plant Cell 2002:s165-s183.
117. Liu J, Ishitani M, Halfter U, Kim CS, Zhu JK: The Arabidopsis thalianaSOS2 gene encodes a protein kinase that is required for salttolerance. Proc Natl Acad Sci USA 2000, 97:3730-3734.
118. Hanks SK, Hunter T: Protein kinases 6. The eukaryotic proteinkinase superfamily: kinase (catalytic) domain strucuture andclassification. FASEB J 1995, 9:576-596.
119. Hanks SK, Quinn AM: Protein kinase catalytic domain sequencedatabase: identification of conserved features of primarystructure and classification of family members. Methods Enzy-mol 1991, 200:38-62.
120. Hanks SK, Quinn AM, Hunter T: The protein kinase family: con-served features and deduced phylogeny of the catalyticdomain. Science 1988, 241:42-52.
121. Lawton MA, Yamamoto RT, Hanks SK, Lamb CJ: Molecular cloningof plant transcripts encoding protein kinase homologs. ProcNatl Acad Sci USA 1989, 86:3140-3144.
122. Gribskov M, Fana F, Harper J, Hope DA, Harmon AC, Smith DS, TaxFE, Zhang G: PlantsP: a functional genomics database for plantphosphorylation. Nucleic Acids Res 2001, 29:111-113.
123. Barsalobres CF: Análise da expressão gênica induzida por Diat-raea saccharalis em cana-de-açúcar via macroarranjos decolônias bacterianas. In MD dissertation Escola Superior de Agricul-tura "Luiz de Queiroz", Universidade de São Paulo; 2004.
124. Urquiaga S, Cruz KHS, Boddey RM: Contribution of nitrogen fixa-tion to sugar cane: Nitrogen-15 and nitrogen-balance esti-mates. Soil Science Society of America Journal 1992, 56:105-114.
Page 21 of 22(page number not for citation purposes)
BMC Genomics 2007, 8:71 http://www.biomedcentral.com/1471-2164/8/71
Publish with BioMed Central and every scientist can read your work free of charge
"BioMed Central will be the most significant development for disseminating the results of biomedical research in our lifetime."
Sir Paul Nurse, Cancer Research UK
Your research papers will be:
available free of charge to the entire biomedical community
peer reviewed and published immediately upon acceptance
cited in PubMed and archived on PubMed Central
yours — you keep the copyright
Submit your manuscript here:http://www.biomedcentral.com/info/publishing_adv.asp
BioMedcentral
125. Hendre KR, Iyer RS, Kotwain M, Kluspe SS, Mascarenhas AF: Rapidmultiplication of sugarcane by tissue culture. Sugarcane 1983,1:5-8.
126. Hoagland DR, Arnon DI: The water culture method for growing plantswithout soil Berkely: California Agr. Expt. Sta. Cir; 1950:347.
127. Muchhal US, Pardo JM, Raghothama KG: Phosphate transportersfrom the higher plant Arabidopsis thaliana. Proc Natl Acad Sci1996, 93:10519-10523.
128. James EK, Reis VM, Olivares FL, Baldani JI, Dobereiner J: Infection ofsugar cane by the nitrogen-fixing bacterium Acetobacter dia-zotrophicus. Journal of Experimental Botany 1994, 45:757-766.
129. Reis VM, Olivares FL, Döbereiner J: Improved methodology forisolation of Acetobacter diazotrophicus and confirmation ofits endophythic habitat. World Journal of Microbiology and Biotechnol-ogy 1994, 10:101-104.
130. King EG, Hartley GG: Diatraea saccharalis. In Handbook of insectrearing Volume 2. Edited by: Singh P, Moore RF. Amsterdam: ElsevierScience; 1985:265-270.
131. Broner I, Law RAP: Evaluation of a modified atmometer forestimating reference ET. Irrigation Science 1991, 12:21-26.
132. Yang YH, Dudoit S, Luu P, Lin DM, Peng V, Ngai J, Speed TP: Normal-ization for cDNA microarray data: a robust compositemethod addressing single and multiple slide systematic varia-tion. Nucleic Acids Res 2002, 30:e15.
133. Vencio RZ, Koide T: HTself: Self-Self Based Statistical Test forLow Replication Microarray Studies. DNA Res 2005, 12:211-4.
134. Quackenbush J: Computational analysis of microarray data. NatRev Genet 2001, 2:418-427.
135. Livak KJ, Schmittgen TD: Analysis of relative gene expressiondata using real-time quantitative PCR and the 2-ΔΔCt method.Methods 2001, 25:402-408.
136. Thompson JD, Higgins DG, Gibson TG: CLUSTAL W: improvingthe sensitivity of progressive multiple sequence alignmentthrough sequence weighting, position-specific gap penaltiesand weight matrix choice. Nuclei Acids Research 1994,22:4673-4680.
137. Oxford Evolutionary Biology – Se-Al [http://evolve.zoo.ox.ac.uk/software/SeAl/main.html]
138. Swofford DL: PAUP*. Phylogenetic Analysis using Parsimony (* and othermethods, version 4.0 Sinauer Associates, Inc, Sunderland, Mass; 1999.
139. Schultz J, Milpetz F, Bork P, Ponting CP: SMART, a simple modulararchitecture research tool: Identification of signalingdomains. Proc Natl Acad Sci USA 1998, 95:5857-5864.
Page 22 of 22(page number not for citation purposes)


![BMC Genomics BioMed Central1].pdf · BioMed Central Page 1 of 18 (page number not for citation purposes) BMC Genomics Research article Open Access Global patterns of sequence evolution](https://img.dokumen.tips/doc/110x75/5f4da8b84673135f021818e3/bmc-genomics-biomed-central-1pdf-biomed-central-page-1-of-18-page-number-not.jpg)