UNIVERSITY OF PALERMO
Doctorate in Civil, Environmental, Materials Engineering
Department of Civil, Environmental, Aerospace, Materials Engineering
Scientific-Disciplinary Sector ICAR/04 – Roads, Railways and Airports
Asphalt mixtures improved with plastic additives:
mix design and case study in an airport
Ph.D.
Mauro Ranieri
SUPERVISOR COORDINATOR
Prof. Clara Celauro Prof. Mario Di Paola
XXIX CYCLE
ACADEMIC YEAR 2016-2017

“The principle of science, the definition, almost, is the following: The test
of all knowledge is experiment. Experiment is the sole judge of scientific
truth”.
(Richard Feynman, Lectures on Physics, 1963)
“L’università deve essere focolaio di attività scientifica, vero laboratorio
nel quale maestri e scolari collaborano ad indagare nuovi veri e a rive-
dere questioni già discusse. Così nello studente si educa lo spirito critico
e, quel che più importa dato lo scopo speciale che la nostra università
ha, lo spirito di ricerca”.
(Agostino Gemelli, 1919)
“If politics is the art of the possible, research is surely the art of the sol-
uble. Both are immensely practical-minded affairs”.
(Sir Peter B. Medawar, The Art of the Soluble, 1969)
To my family,
to my fiancée
and
to my grandfather Matteo, who from up there is my first fan in this important achievement!
Acknowledgements
When you complete a long journey you cannot think of having done it all
by yourself.
First I would like to express my sincere gratitude to everyone who in
these many academic years has contributed helping, advising or simply
being close to me.
Special thanks to my supervisor Prof. Clara Celauro for her assistance
and guidance throughout my research; to Prof. Joel R. M. Oliveira and
his team for their hospitality and helpfulness during my research period
at the Laboratory of Road Materials of the University of Guimarães (Por-
tugal); to Denis Gailor for helping with the English revision of the disser-
tation; to the Iterchimica S.r.l. and I.s.a.p. S.r.l. companies for the materi-
als supplied, needed for my research work and finally I want to thank
Antonino Lorello for his support with learning the basic procedures for
conducting various tests.

Abstract
Today the growing demand for performance and the need to protect the
ecosystem lead engineers to develop new manufacturing technologies
and to experiment the use of new materials. The criterion followed is to
promote more rational use of available resources and low environmental
impact techniques.
A method that can help improve the quality of pavements, avoiding deg-
radation, with benefit and savings regarding the need for maintenance, is
the addition of polymers in asphalt mixtures.
The fact is that the use of polymers makes it possible to increase the per-
formance of asphalt mixtures, decreasing production and laying costs,
and reducing the environmental impact. Not only that, but for sustainable
development it makes it possible to reduce consumption of valuable natu-
ral resources.
The aim of this study is the optimization of mixtures that do not neces-
sarily employ high-performance materials, but make use of locally avail-
able stone aggregate and bitumen, aiming to improve the traditional mix-
tures, as is made possible by addition of polymers.
For this purpose, the mixtures studied were subjected to various laborato-
ry tests, such as the Marshall test, the gyratory compactor test, water sen-
sitivity test, wheel-tracking test, four-point bending tests and triaxial cell
tests and field tests like the HWD test.
The test results showed the advantage of using polymers, and especially
waste, in the asphalt mixtures in technical, economic and environmental
terms, and thus justify their use in settings where the pavements are sub-
ject to high loads, which lead to gradual surface degradation.
KEYWORDS: Asphalt modification, Polymers, Plastics, Wet process,
Dry process, EME, Mixture performance, Airport pavement, Bakfaa.

Table of contents
Page
Acknowledgements………………………………………………... v
Abstract……………………………………………………………. vii
List of figures.................................................................................... xiii
List of tables..................................................................................... xix
Introduction………………………………………………………... 1
Chapter 1 Background and literature review……...…..................... 5
1.1 General……………………………………………... 5
1.2 Innovative asphalt mixtures………………………... 7
1.3 Asphalt mixtures with polymeric additives………... 8
1.3.1 Wet process…………………………………... 12
1.3.2 Dry process…………………………………... 18
1.4 EME………………………………………………... 19
1.4.1 In France……………………………………... 21

x Mauro Ranieri Asphalt mixtures improved with plastic additives: mix design and case study in an airport
1.4.2 In the other countries………………………… 24
Chapter 2 Case 1…………………………………………………... 27
2.1 General……………………………………………... 27
2.2 Materials…………………………………………… 27
2.2.1 Aggregates…………………………………… 28
2.2.2 Bitumens……………………………………... 29
2.2.3 Additives……………………………………... 32
2.3 Methods, results and discussion…………………… 33
2.3.1 Mix design…………………………………… 35
2.3.2 Water sensitivity……………………………... 42
2.3.3 Permanent deformation resistance…………… 45
2.3.4 Stiffness modulus…………………………….. 46
2.3.5 Fatigue cracking……………………………… 50
2.4 Conclusions………………………………………… 53
Chapter 3 Case 2…………………………………………………... 55
3.1 General……………………………………………... 55
3.2 Materials…………………………………………… 55
3.2.1 Aggregates…………………………………… 56
3.2.2 Bitumens……………………………………... 57
3.2.3 Additives……………………………………... 60
3.3 Methods, results and discussion…………………… 63

Table of contents xi
3.3.1 Mix design…………………………………… 64
3.3.2 Permanent deformation resistance…………… 73
3.3.3 Stiffness modulus…………………………….. 74
3.3.4 Fatigue cracking……………………………… 77
3.4 Conclusions…………………………………………. 79
Chapter 4 Case 3…………………………………………………... 81
4.1 General……………………………………………… 81
4.2 Materials……………………………………………. 81
4.2.1 Aggregates……………………………………. 82
4.2.2 Bitumens……………………………………… 84
4.2.3 Additives……………………………………… 84
4.3 Methods, results and discussion……………………. 85
4.3.1 Mix design……………………………………. 85
4.3.2 Stiffness modulus……………………………... 90
4.3.3 HWD test……………………………………... 93
4.3.3.1 BAKFAA……………………………... 97
4.4 Conclusions…………………………………………. 101
Conclusions………………………………………………………... 103
Appendix Photographs……...……………………………………... 105
References…………………………………………………………. 121
Standards…………………………………………………………... 135
List of figures
Figure Page
I.1 Thesis layout……………………………………………. 4
1.1 Effects of polymer modification in asphalt binder……... 16
1.2 Typical grading curves for EME……………………….. 22
2.1 Complex modulus and phase angle of the binders used... 31
2.2 Samples of HDPE (on the left) and EVA (on the right)
used in this study………………………………………..
32
2.3 DSC test results on HDPE……………………………… 33
2.4 DSC test results on EVA……………………………….. 33
2.5 Addition of the additive: in the mixing (DRY process,
on the left), into the bitumen (WET process, on the
right)……………………………………………………..
34
2.6 Marshall Stability for bitumen content…………………. 38
2.7 Deformation for bitumen content………………………. 39
2.8 Apparent specific gravity for bitumen content…………. 39
2.9 Voids Filled with Bitumen (VFB) for bitumen content… 40

xiv Mauro Ranieri Asphalt mixtures improved with plastic additives: mix design and case study in an airport
2.10 Voids in mineral aggregate (VMA) for bitumen content. 40
2.11 Porosity for bitumen content…………………………… 41
2.12 Maximum specific gravity for bitumen content………... 41
2.13 Water sensitivity tests results (ITSR; air void content)… 43
2.14 Average indirect tensile strength, ITSd, of dry speci-
mens……………………………………………………..
44
2.15 Evolution of the permanent deformation of the studied
mixtures in the WTT…………………………………….
46
2.16 Scheme of a 4 PB test device…………………………… 47
2.17 Loading scheme of the specimens in a 4 PB test……….. 47
2.18 Stiffness modulus and phase angle master curves of the
mixtures studied…………………………………………
49
2.19 Fatigue regression laws of the mixtures studied………... 52
3.1 Mix grading curve………………………………………. 57
3.2 Complex modulus and phase angle master curves of the
binders used......................................................................
59
3.3 Additives used in this study: a) SP, b) waste plastics, c)
PPS………………………………………………………
60
3.4 A differential scanning calorimeter…………………….. 62
3.5 Features of a DSC curve: a) endo up, b) exo up………... 62
3.6 DSC test results on SP………………………………….. 62
3.7 DSC test results on waste plastics………………………. 63
3.8 Marshall values at different bitumen contents………….. 65
List of figures xv
3.9 Shear diagram…………………………………………... 67
3.10 Shear ratio lines of the traditional mixture, of the mix-
ture with SP, of the mixture with PPS and of the con-
ventional mixture………………………………………..
70
3.11 Shear ratio lines of the mixture with waste plastics…….. 71
3.12 Trend of rut depth in the wheel-tracking test…………… 73
3.13 Master curves of the mixtures studied………………….. 76
3.14 Fatigue lines…………………………………………….. 78
4.1 Mix grading curve for the surface course………………. 83
4.2 Mix grading curve for the binder course……………….. 83
4.3 Mix grading curve for the base course………………….. 84
4.4 Marshall values at different bitumen contents for the
surface course…………………………………………...
87
4.5 Marshall values at different bitumen contents for the
binder course…………………………………………….
88
4.6 Marshall values at different bitumen contents for the
base course………………………………………………
89
4.7 Complex modulus master curve for the surface
course……………………………………………………
91
4.8 Complex modulus master curve for the binder
course……………………………………………………
92
4.9 Complex modulus master curve for the base
course……………………………………………………
92
4.10 Schematic of FWD/HWD load-geophone configuration.. 93

xvi Mauro Ranieri Asphalt mixtures improved with plastic additives: mix design and case study in an airport
4.11 Layout of Geophones…………………………………… 94
4.12 Dynatest testing equipment……………………………... 94
4.13 Scheme of the pavement in question…………………… 95
4.14 Test plan and sampling locations……………………….. 96
A.1 Sieving machine (Guimarães)…………………………... 105
A.2 Aggregate fraction size used (Guimarães)……………… 106
A.3 Filler (Guimarães)………………………………………. 106
A.4 Tests on bitumen: A) Penetration Test, B) Ring and Ball
Test, C) Resilience Test, D) DSR Test (Guimarães)……
107
A.5 Automatic impact Marshall compactor (Guimarães)…… 108
A.6 Marshall specimen height measuring device
(Guimarães)……………………………………………..
108
A.7 The Marshall Stability test (Guimarães)………………... 109
A.8 The ITS test on specimens subjected to the water sensi-
tivity test (Guimarães)…………………………………..
109
A.9 The stages of compaction by roller compactor
(Guimarães)……………………………………………..
110
A.10 The wheel tracker test (Guimarães)…………………….. 111
A.11 The four-point bending test device (Guimarães)……….. 111
A.12 Automatic impact Marshall compactor (Palermo)……… 112
A.13 Thermostatic water bath before the Marshall Stability
test (Palermo)……………………………………………
112
A.14 The Marshall Stability test (Palermo)…………………... 113
List of figures xvii
A.15 Hydrostatic balance (Palermo)………………………….. 114
A.16 Gyratory compactor (Palermo)…………………………. 114
A.17 The compaction of slabs for WTT by roller compactor
(Palermo)………………………………………………..
115
A.18 The stages of a wheel tracker test (Palermo)…………… 115
A.19 The roller compactor for slabs (Palermo)………………. 116
A.20 Slab after compaction (Palermo)……………………….. 116
A.21 Specimen subjected to the four-point bending test (Pa-
lermo)……………………………………………………
117
A.22 The four-point bending test device (Palermo)………….. 117
A.23 Screen CATS software during a 4PB test (Palermo)…… 118
A.24 Specimen subjected to the modulus test (Palermo)…….. 118
A.25 Modulus test by means of a triaxial cell (Palermo)…….. 119
A.26 Screen BAKFAA software (Palermo)………………….. 119

List of tables
Table Page
1.1 Generic classification of asphalt additives……………….. 8
1.2 Mix grading curve for EME 2 0/14………………………. 22
1.3 French Specifications for EME…………………………... 23
1.4 Italian grading curve for high modulus asphalt…………... 24
2.1 Physical and mechanical characteristics of the aggregates
used in this work………………………………………….
28
2.2 Aggregate grading curve and envelope limits for AC 14
Surf mixtures……………………………………………...
28
2.3 Characteristics of the conventional bitumens……………. 29
2.4 Characteristics of the polymer-modified binders………… 30
2.5 Marshall test results for the mixture with EVA (mechani-
cal characteristics)………………………………………...
35
2.6 Marshall test results for the mixture with EVA (physical
characteristics)…………………………………………….
36
2.7 Marshall test results for the mixture with HDPE (mechan-
ical characteristics)………………………………………..
36

xx Mauro Ranieri Asphalt mixtures improved with plastic additives: mix design and case study in an airport
2.8 Marshall test results for the mixture with HDPE (physical
characteristics)…………………………………………….
37
2.9 Marshall test results for the conventional mixture (me-
chanical characteristics)…………………………………..
37
2.10 Marshall test results for the conventional mixture (physi-
cal characteristics)………………………………………...
38
2.11 Fatigue indicators obtained from the regression laws of
the mixtures studied………………………………………
52
3.1 Composition of the aggregates’ available fractions……… 56
3.2 Physical and mechanical characteristics of the available
aggregates…………………………………………………
56
3.3 Characteristics of 50/70 pen grade bitumen……………… 58
3.4 Characteristics of 35/50 pen grade bitumen……………… 58
3.5 Marshall test results………………………………………. 65
3.6 Marshall test results in accordance with MIT Specifica-
tion………………………………………………………...
66
3.7 Values of workability and self-densification…………….. 69
3.8 Average values of the air voids of the specimens at 10,
100 e 190 gyrations……………………………………….
72
3.9 Air void values with variation in the number of gyrations. 73
3.10 Values of WTSair (wheel-tracking slope in air) of the mix-
tures studied………………………………………………
74
3.11 Values of complex modulus and phase angle of the mix-
tures studied………………………………………………
75
3.12 Fatigue line parameters of the mixtures studied…………. 78

List of tables xxi
4.1 Composition of the aggregates’ available fractions……… 82
4.2 Physical and mechanical characteristics of the available
aggregates…………………………………………………
82
4.3 Characteristics of 50/70 pen grade bitumen……………… 84
4.4 Marshall test results for the surface course………………. 86
4.5 Marshall test results for the binder course……………….. 86
4.6 Marshall test results for the base course…………………. 86
4.7 Marshall test results in accordance with MIT Specifica-
tion………………………………………………………...
86
4.8 Values of complex modulus and phase angle for the sur-
face and binder courses…………………………………...
90
4.9 Typical Modulus values for paving materials……………. 98
4.10 Typical Poisson’s ratio values for paving materials……... 98
4.11 Input values used for the pavement in question………….. 98
4.12 Measured deflections for the alignment 1………………... 99
4.13 Measured deflections for the alignment 2………………... 99
4.14 Modulus values…………………………………………... 101
Introduction
Today the growing demand for performance and the need to protect the
ecosystem lead engineers/designers to develop new manufacturing and
monitoring technologies, and to experiment the use of new materials, and
to improve analysis models as well as design methods of pavements and
mixtures. The criterion followed is to promote more rational use of avail-
able resources and low environmental impact techniques (Losa & Drin-
goli, 2007).
Therefore the demand for superior performance compared to that of tra-
ditional asphalt mixtures, the recovery and recycling of existing pave-
ments, the use of new materials combined with new production technolo-
gies have given rise to so-called special pavements. These have particular
characteristics regarding particle size fractions and high quality materials.
This category includes, for example, asphalt mixtures with additives,
high modulus asphalt mixtures, also called Enrobés à Module Élevé
(EME), split mastix asphalt (SMA), thin asphalt overlays, open graded
drainage and sound absorption asphalt mixtures, rubber-asphalt mixtures,
low-energy asphalt mixtures, also called warm mix asphalt (WMA), and
asphalt mixtures with reclaimed asphalt pavement (RAP).
The incorporation of waste materials and other industrial products as
construction materials is also discussed, as being one of the main solu-
tions used by practitioners to respond to society’s current sustainability
issues.
In particular, the introduction of plastic waste in asphalt binders and
mixtures is an excellent alternative to landfill disposal (Celauro et al.
2006), because asphalt modification by polymer incorporation can signif-
icantly improve the performance of road pavements (Bense, 1983;

2 Mauro Ranieri Asphalt mixtures improved with plastic additives: mix design and case study in an airport
Serfass et al., 2000; Rahi et al., 2015), if a rigorous and appropriate selec-
tion is made in terms of plastic waste and production conditions (Abreu
et al., 2015).
And so, for economic and technical reasons, what we are currently
witnessing is a phenomenon of expansion on the market of additives used
in the technology of asphalt mixtures. These products are used in order to
improve performance and reduce the costs for asphalt pavement produc-
tion and exploitation. In general, meeting all these goals with a single
product is difficult, because higher quality requires higher costs. The lat-
est researches in this area have resulted in products whose quality in-
creases performance at minimal cost (Iliescu & Pop, 2010).
Despite legislative initiatives aimed at reducing the use of polymers,
the polymer market shows a strong potential for development and diver-
sification. The reasons of this success are clear: low weight, workability,
versatility, hygiene, different selection options, recycling and recovery
(Giuffré & Di Francisca, 2001).
Although it has been known for some time that virgin polymers can
improve modified bitumen’s properties, nowadays there are some con-
cerns about replacing virgin materials with recycled polymers (Gonzalez
et al., 2002).
My research activity carried out during the Doctorate course must be
considered within this scenario.
The primary objective of this study was to assess technological feasi-
bility, in terms of mix design and production and application of the as-
phalt mixtures with polymeric additives. Therefore to achieve the main
aim of the study, the following tasks were performed:
• Task 1 was to survey published literature regarding implementation
and practice of the mixtures with additives. This extensive litera-
ture review includes national studies, as well as other available re-
ports and articles from European countries and the world as a
whole (literature review).
• Task 2 was to fabricate specimens and to perform various key la-
boratory tests in order to identify mixture properties and perfor-
mance characteristics (experimental design and materials selection,
laboratory testing program).
• Task 3 was to analyse the laboratory test results and to use the test
data for a comparison with field performance data (laboratory test
data analysis and comparison).

Introduction 3
Thesis layout is reported in Fig. I.1. This dissertation is composed of four
chapters. As a first step to achieving the project objectives, an extensive
literature review was conducted to present background information asso-
ciated with the benefits and approaches regarding the use of polymeric
additives in asphalt mixtures as well as using waste materials (Chapter
1). Chapter 1 is also an introductory chapter outlining the problem state-
ment.
The cases studied are presented in subsequent chapters. Case 1 regards
asphalt surface mixtures with improved performance using waste poly-
mers via dry and wet processes and the tests were performed at the Road
Materials Laboratory of the University of Guimarães (Portugal). This ex-
perimental study led to important conclusions from a comparison be-
tween two different processes (WET and DRY) used for production of
modified asphalt mixtures with waste polymers. Moreover the evaluation
of the effects of polymer types used is presented (Chapter 2).
Case 2 is an experimental study concerning the development and op-
timization (mix design) of special asphalt mixtures for binder and base
courses, also with additives specifically engineered. Specifically, the fo-
cus was on the optimization of the high modulus asphalt mixtures making
use of ordinary aggregate and bitumen (as locally available) instead of
the very hard bitumen typically prescribed, also aiming to improve the
traditional mixture as made possible by suitable polymers (Chapter 3).
Case 3 is an experimental study concerning plastic additives used in
the surface, binder and base courses of the access pavement to the new
apron of Palermo International Airport. The focus was on comparison be-
tween data obtained from laboratory tests and data obtained from field
tests made it possible using BAKFAA, a software program for back-
calculation analysis made available by the Federal Aviation Administra-
tion (FAA), in which deflection values obtained by Heavy Weight De-
flectometer (HWD) tests were used (Chapter 4).
Finally a list of conclusions as results of the research work as well as
recommendations for future work are presented.

4 Mauro Ranieri Asphalt mixtures improved with plastic additives: mix design and case study in an airport
Fig. I.1 Thesis layout
Begin Research
Research complete
Literature review
Case 1: WET or DRY process?
Case 2: Mix design of polymer-modified asphalt mixtures
Case 3: Case study at real scale

Chapter 1
Background and literature review
1.1 General The state of a road pavement is characterized by functional (adherence,
regularity, noise) and structural (bearing capacity) properties, which to-
gether combine in order to make vehicular traffic permanently possible in
terms of safety, comfort and economy. When one or more of these relat-
ed properties are lacking, not only is the road surface inadequate to allow
traffic circulation in compliance with the required standards (lack of ad-
herence = slippery road; irregular viable plan = unsafe and uncomfortable
driving) but there are also the conditions for the deterioration of the
pavement service life, these properties being related to each other: road
irregularities lead to a dynamic load increase, which affects the bearing
capacity over time; the structural failures cause unevenness, depressions,
potholes, and changes in cross-slope with reductions in driving safety.
For this reason, through an appropriate design of the road surface (or
careful planning of management in already existing pavements) the im-
plementation of high performance pavements was undertaken using ap-
propriate materials and thicknesses which could represent a durable and
reliable solution to increased vehicular traffic (Pasetto, 1998).
Increased heavy vehicle traffic, geometric and weight changes in load
transfer systems on the road pavement, together with the widespread ten-
dency to travel overloaded, have created problems in most existing road
pavements (Giuffré & Di Francisca, 2001).
Over the years the peculiar characteristics of flexible pavements have
remained unchanged; however, this did not exclude looking for progress
and introduction of new elements. Today the growing demand for per-
formance and the need to protect the ecosystem lead engineers/designers
to develop new manufacturing and monitoring technologies, and to ex-
6 Mauro Ranieri Asphalt mixtures improved with plastic additives: mix design and case study in an airport
periment the use of new materials, and to improve analysis models as
well as design methods of pavements and mixtures. The criterion fol-
lowed is to promote more rational use of available resources and low en-
vironmental impact techniques (Losa & Dringoli, 2007).
For economic and technical reasons, we are currently witnessing a
phenomenon of expansion on the market of additives used in the technol-
ogy of asphalt mixtures. These products are used in order to improve per-
formance and reduce the costs for asphalt pavement production and ex-
ploitation. In general, meeting all these goals with a single product is dif-
ficult, because higher quality requires higher costs. The latest researches
in this area have resulted in products whose quality increases perfor-
mance at minimal cost (Iliescu & Pop, 2010).
Several factors influence the performance of flexible courses, e.g., the
properties of the components (binder, aggregate and additive) and the
proportion of these components in the mix (Awwad & Shbeeb, 2007).
Bitumen is the only deformable element of a pavement and has a very
important role in pavement performance (Becker et al., 2001).
At high temperatures (40 to 60°C), asphalt exhibits viscoelastic behav-
iour. Pavements made of asphalt may show distress when exposed to
high temperatures. At elevated temperatures, permanent deformation
(rutting) occurs and leads to channels in the direction of travel. This is at-
tributed to the viscous flow of the asphalt matrix in paving mixtures,
which retains strains induced by traffic. Therefore, pavement perfor-
mance is strongly associated with the rheological properties of asphalt
cement. Increased traffic factors such as heavier loads, higher traffic vol-
ume, and higher tyre pressure demand higher performance pavements. A
high performance pavement requires asphalt cement that is less suscepti-
ble to high temperature rutting or low temperature cracking and has ex-
cellent adherence to stone aggregates (Chen et al., 2002).
Some improvements in asphalt properties have been gained by select-
ing the proper starting crude, or tailoring the refinery processes used to
make asphalt. Unfortunately, there are only a few crudes that can produce
very good asphalts, and only a limited number of actions that can be tak-
en to control the refining process to make improved asphalts (Becker et
al., 2001). The next step taken by the industry was to modify the asphalt.
Air blowing makes asphalt harder (Aflaki & Tabatabaee, 2009; Corte,
2001; Lee et al., 2007). Fluxing agents or diluent oils are sometimes used
to soften the asphalt. Another method that can significantly improve as-
phalt quality is the addition of polymers (Becker et al., 2001).
Chapter 1 7 Background and literature review
1.2 Innovative asphalt mixtures The demand for superior performance compared to those of traditional
asphalt mixtures, the recovery and recycling of existing pavements, the
use of new materials combined with new production technologies have
given rise to so-called special pavements. These have particular charac-
teristics regarding particle size fractions and high quality materials. This
category includes, for example, asphalt mixtures with additives, high
modulus asphalt mixtures, also called Enrobés à Module Élevé (EME),
split mastix asphalt (SMA), thin asphalt overlays, open graded drainage
and sound absorption asphalt mixtures, rubber-asphalt mixtures, low-
energy asphalt mixtures, also called warm mix asphalt (WMA), and as-
phalt mixtures with reclaimed asphalt pavement (RAP). The next sec-
tions will focus only on the first two asphalt mixtures.
The incorporation of waste materials and other industrial products as
construction materials is also discussed, as being one of the main solu-
tions used by practitioners to respond to society’s current sustainability
issues.
In the road sector, the most widely studied wastes are reclaimed as-
phalt material (Dinis-Almeida et al., 2016; Silva et al., 2012) and con-
struction and demolition waste (Bestgen et al., 2016; Gómez-Meijide et
al., 2016; Pasandín et al., 2015; Sangiorgi et al., 2015; Dondi et al.,
2014), but other wastes have also been investigated, e.g., plastic waste
(Lastra-González et al., 2016; García-Travé et al., 2016; Karmakar &
Roy, 2016; Modarres & Hamedi, 2014) or waste tyre rubber (Oliveira et
al., 2013; Wang et al., 2015; Xu et al., 2015; Rahman et al., 2010; Airey
et al., 2004; Rahman et al., 2004).
In particular, the introduction of plastic waste in asphalt binders and
mixtures is an excellent alternative to landfill disposal (Celauro et al.,
2006), because asphalt modification by polymer incorporation can signif-
icantly improve the performance of road pavements (Bense, 1983;
Serfass et al., 2000; Rahi et al., 2015).
Several field studies (Raad et al., 1997; Zubeck et al., 2002; Ponniah
& Kennepohl, 1995; Foster & Hein, 1999; Wegman et al., 1999; Von
Quintus & Killingsworth, 1998) have shown that the performance en-
hancement is not uniform and varies as a function of the site, design, ma-
terials and construction factors.
Table 1.1 is a generic classification system regarding additives in
HMA mixtures.
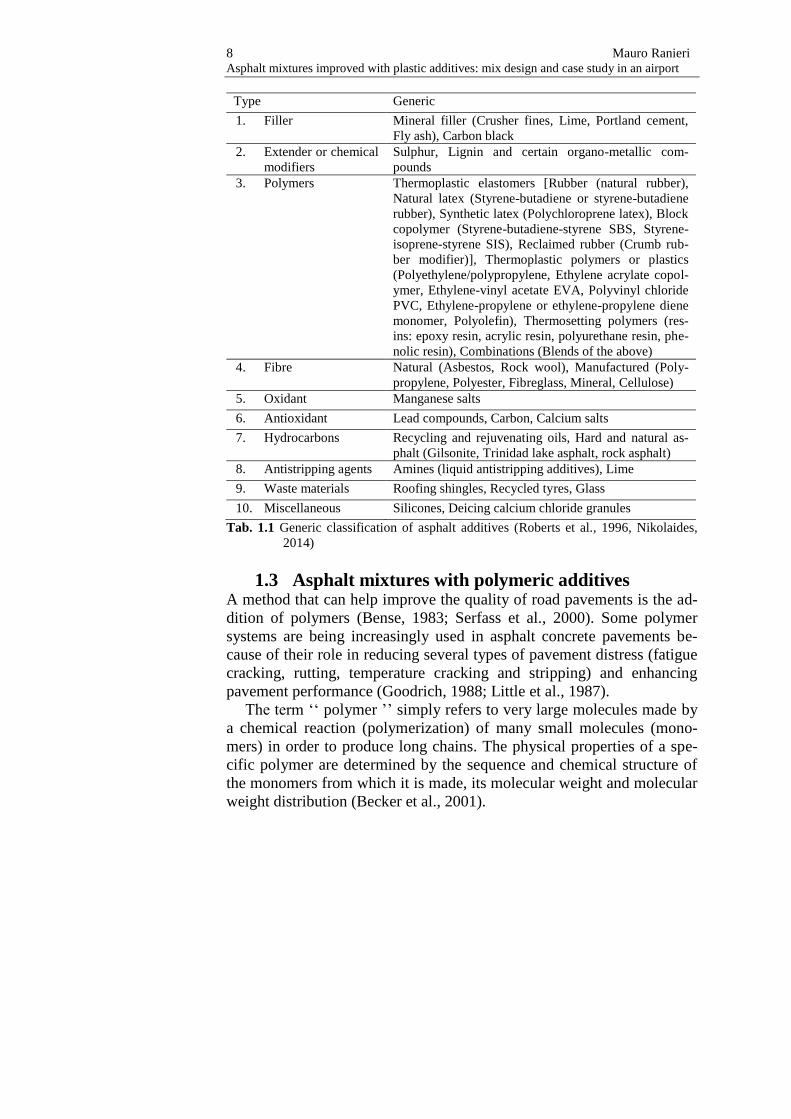
8 Mauro Ranieri Asphalt mixtures improved with plastic additives: mix design and case study in an airport
Type Generic
1. Filler Mineral filler (Crusher fines, Lime, Portland cement,
Fly ash), Carbon black
2. Extender or chemical
modifiers
Sulphur, Lignin and certain organo-metallic com-
pounds
3. Polymers Thermoplastic elastomers [Rubber (natural rubber),
Natural latex (Styrene-butadiene or styrene-butadiene
rubber), Synthetic latex (Polychloroprene latex), Block
copolymer (Styrene-butadiene-styrene SBS, Styrene-
isoprene-styrene SIS), Reclaimed rubber (Crumb rub-
ber modifier)], Thermoplastic polymers or plastics
(Polyethylene/polypropylene, Ethylene acrylate copol-
ymer, Ethylene-vinyl acetate EVA, Polyvinyl chloride
PVC, Ethylene-propylene or ethylene-propylene diene
monomer, Polyolefin), Thermosetting polymers (res-
ins: epoxy resin, acrylic resin, polyurethane resin, phe-
nolic resin), Combinations (Blends of the above)
4. Fibre Natural (Asbestos, Rock wool), Manufactured (Poly-
propylene, Polyester, Fibreglass, Mineral, Cellulose)
5. Oxidant Manganese salts
6. Antioxidant Lead compounds, Carbon, Calcium salts
7. Hydrocarbons Recycling and rejuvenating oils, Hard and natural as-
phalt (Gilsonite, Trinidad lake asphalt, rock asphalt)
8. Antistripping agents Amines (liquid antistripping additives), Lime
9. Waste materials Roofing shingles, Recycled tyres, Glass
10. Miscellaneous Silicones, Deicing calcium chloride granules
Tab. 1.1 Generic classification of asphalt additives (Roberts et al., 1996, Nikolaides,
2014)
1.3 Asphalt mixtures with polymeric additives A method that can help improve the quality of road pavements is the ad-
dition of polymers (Bense, 1983; Serfass et al., 2000). Some polymer
systems are being increasingly used in asphalt concrete pavements be-
cause of their role in reducing several types of pavement distress (fatigue
cracking, rutting, temperature cracking and stripping) and enhancing
pavement performance (Goodrich, 1988; Little et al., 1987).
The term ‘‘ polymer ’’ simply refers to very large molecules made by
a chemical reaction (polymerization) of many small molecules (mono-
mers) in order to produce long chains. The physical properties of a spe-
cific polymer are determined by the sequence and chemical structure of
the monomers from which it is made, its molecular weight and molecular
weight distribution (Becker et al., 2001).

Chapter 1 9 Background and literature review
Despite legislative initiatives aimed at reducing the use of polymers,
the polymer market shows a strong potential for development and diver-
sification. The reasons of this success are clear: low weight, workability,
versatility, hygiene, different selection options, recycling and recovery
(Giuffré & Di Francisca, 2001).
These qualities have led, first slowly and then starting from the 1930s,
with increasing intensity to the study of new polymers and the develop-
ment of polymer science, which still plays a central role today in pure
and applied scientific research by many universities and sector compa-
nies (Zhu et al., 2014).
Polymers can be classified in many ways, but most commonly they
are classified by their physical properties. They may also be classified
according to their chemical sources, but, depending on their physical
properties, they may be classified as thermoplastic and thermosetting ma-
terials. Thermoplastic materials can be formed into desired shapes under
heat and pressure and become solids on cooling. If they are subjected to
the same conditions of heat and pressure, they can be remoulded. Ther-
mosetting materials, once shaped, cannot be softened/remoulded by the
application of heat.
Some typical thermoplastic materials are polyethylene teryphthalate
(PET), polypropylene (PP), polyvinyl acetate (PVA), polyvinyl chloride
(PVC), polystyrene (PS), low density polyethylene (LDPE) and high
density polyethylene (HDPE). Thermosetting materials are bakelite,
epoxy, melamine, polyester, polyurethane, urea-formaldehyde and alkyd
(CPCB 2009).
The most commonly used asphalt mixtures modifiers are thermo-
plastic polymers. In the domain of thermoplastic polymers there are two
families that differ, mainly, by characteristics related to stiffness, elastici-
ty, deformability: elastomers and plastomers.
Elastomers require a supply of mechanical energy in order to be
mixed with the bitumen. For this reason, they are mixed with bitumen be-
fore the mixture is prepared. Modified bitumens with elastomer are usu-
ally obtained by strong mechanical mixing at a higher temperature than
the flow temperature of the polymer.
Plastomers do not require additional power for mixing, thus they can
be previously mixed with bitumen or they can be introduced directly into
the mixer. The solution of introducing the modifier directly into the mix-
er can be adopted if only plastomers are used. In the case of plastomers
with elastomer association, the bitumen will be previously modified.
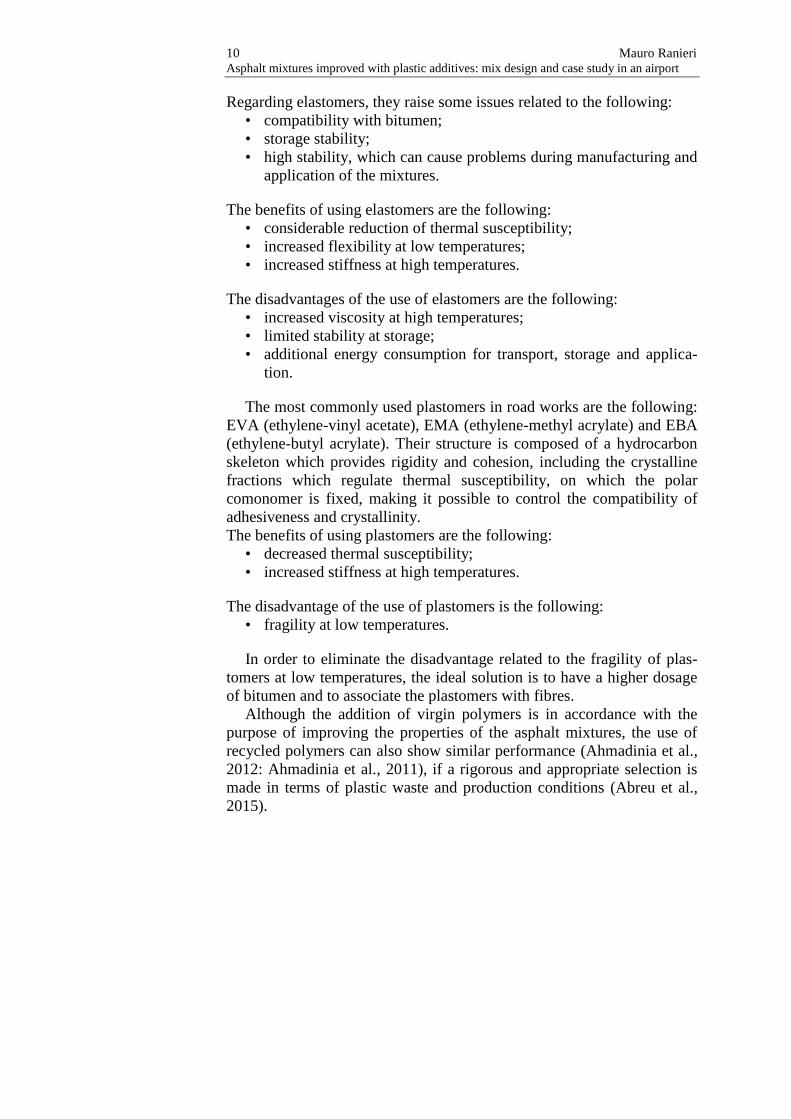
10 Mauro Ranieri Asphalt mixtures improved with plastic additives: mix design and case study in an airport
Regarding elastomers, they raise some issues related to the following:
• compatibility with bitumen;
• storage stability;
• high stability, which can cause problems during manufacturing and
application of the mixtures.
The benefits of using elastomers are the following:
• considerable reduction of thermal susceptibility;
• increased flexibility at low temperatures;
• increased stiffness at high temperatures.
The disadvantages of the use of elastomers are the following:
• increased viscosity at high temperatures;
• limited stability at storage;
• additional energy consumption for transport, storage and applica-
tion.
The most commonly used plastomers in road works are the following:
EVA (ethylene-vinyl acetate), EMA (ethylene-methyl acrylate) and EBA
(ethylene-butyl acrylate). Their structure is composed of a hydrocarbon
skeleton which provides rigidity and cohesion, including the crystalline
fractions which regulate thermal susceptibility, on which the polar
comonomer is fixed, making it possible to control the compatibility of
adhesiveness and crystallinity.
The benefits of using plastomers are the following:
• decreased thermal susceptibility;
• increased stiffness at high temperatures.
The disadvantage of the use of plastomers is the following:
• fragility at low temperatures.
In order to eliminate the disadvantage related to the fragility of plas-
tomers at low temperatures, the ideal solution is to have a higher dosage
of bitumen and to associate the plastomers with fibres.
Although the addition of virgin polymers is in accordance with the
purpose of improving the properties of the asphalt mixtures, the use of
recycled polymers can also show similar performance (Ahmadinia et al.,
2012: Ahmadinia et al., 2011), if a rigorous and appropriate selection is
made in terms of plastic waste and production conditions (Abreu et al.,
2015).

Chapter 1 11 Background and literature review
The use of waste thermosetting polymers (12 million tons of waste
polymers are presently dumped into landfills, every year, in Europe) can
be considered as a sustainable technology, given that an equivalent per-
formance can be assured (Silva et al., 2011; Bense, 1983; Maze et al.,
2000; Serfass, 2000). In fact, the aim of the introduction of waste poly-
mers in asphalt binders and mixtures is not to be an alternative to landfill,
but to improve the performance of mixtures (Celauro et al., 2006), if
these are properly designed.
Many studies have shown the use of polymers (Awwad & Shbeeb,
2007; Chen et al., 2002) and waste polymers (Gawande et al., 2012;
Kalantar et al. 2012; Celauro et al., 2001a; Celauro et al., 2001b; Ce-
lauro, 2005; Zoorob & Suparma, 2000; Sabina et al., 2009; Naskar et al.,
2010; Garcia-Morales et al., 2005) as additives for asphalt mixtures.
Polymers can be used in different ways: as an additive they may be
added directly during the mixing process or they can be mixed with bi-
tumen to improve the rheological properties or, in the case of high melt-
ing temperature plastics, as a substitute for particle size fractions.
Asphalt mixtures with plastics (virgin or waste) are called additivated
asphalt mixtures, to emphasize the fact that there are interactions between
additive and asphalt mixtures, unlike what occurs instead in modified bi-
tumens, in which both mechanical and chemical interactions between a
certain fraction of the bitumen (maltens) and the polymers occur (Giuffré
& Di Francisca, 2001).
There are two main processes to add polymers to asphalt mixtures,
namely by modifying the bitumen (WET process) or by adding the poly-
mers during the mixing phase (DRY process) (Pettinari et al., 2014).
However, the WET process needs specific equipment (for mixing and to
facilitate the reaction with bitumen at high temperatures), while this is
not required for the DRY process. Therefore, even though the DRY pro-
cess is easier to implement, the WET process has the advantage of con-
trolling the properties of the binder (Celauro et al., 2004), and that is the
reason why bitumen modification is the most widely used process.
The solution of modifying bitumen with polymers in order to obtain
polymer-modified bitumen was previously far more widespread because
of the potential for analysis of the properties of bitumen before use. Mod-
ifying bitumen in the mixture solution is newer and it is much easier be-
cause complications associated with transport and storage of modified bi-
tumen and also with the high energy consumption for its production are
eliminated. In this case, the modifier is in the form of granules, which are
12 Mauro Ranieri Asphalt mixtures improved with plastic additives: mix design and case study in an airport
inserted directly into the mixture, without changing the manufacturing
process very much (Iliescu & Pop, 2010).
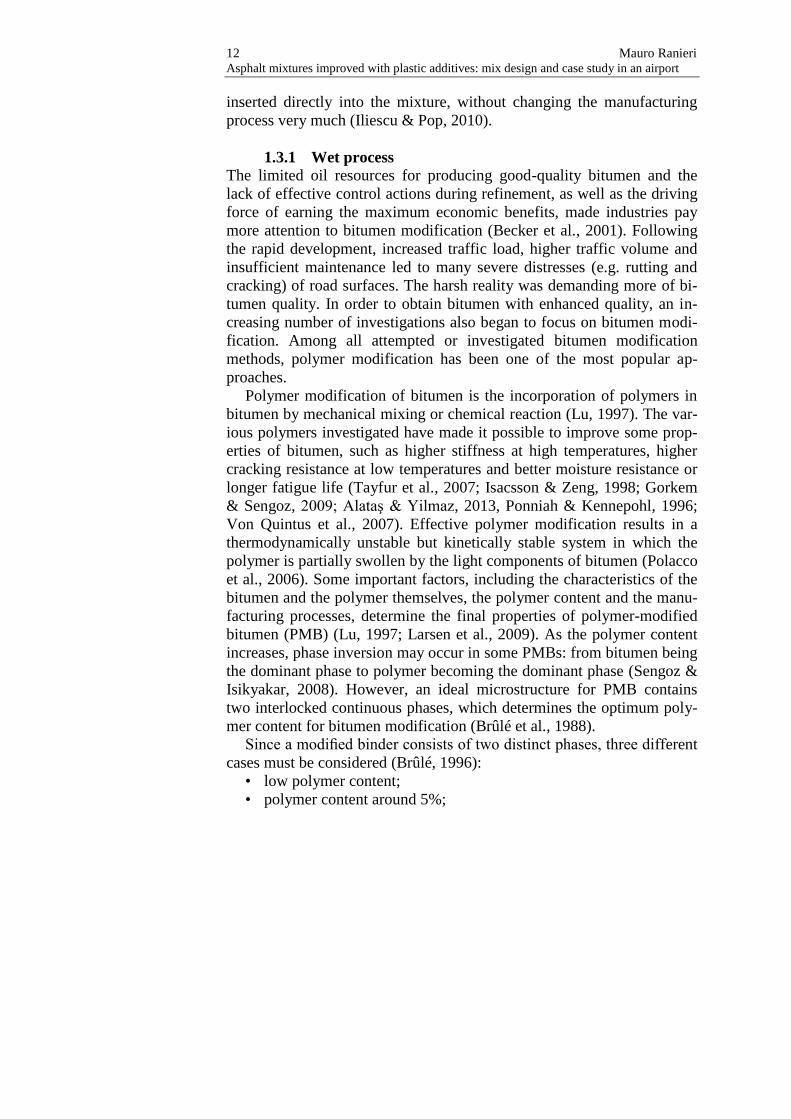
1.3.1 Wet process
The limited oil resources for producing good-quality bitumen and the
lack of effective control actions during refinement, as well as the driving
force of earning the maximum economic benefits, made industries pay
more attention to bitumen modification (Becker et al., 2001). Following
the rapid development, increased traffic load, higher traffic volume and
insufficient maintenance led to many severe distresses (e.g. rutting and
cracking) of road surfaces. The harsh reality was demanding more of bi-
tumen quality. In order to obtain bitumen with enhanced quality, an in-
creasing number of investigations also began to focus on bitumen modi-
fication. Among all attempted or investigated bitumen modification
methods, polymer modification has been one of the most popular ap-
proaches.
Polymer modification of bitumen is the incorporation of polymers in
bitumen by mechanical mixing or chemical reaction (Lu, 1997). The var-
ious polymers investigated have made it possible to improve some prop-
erties of bitumen, such as higher stiffness at high temperatures, higher
cracking resistance at low temperatures and better moisture resistance or
longer fatigue life (Tayfur et al., 2007; Isacsson & Zeng, 1998; Gorkem
& Sengoz, 2009; Alataş & Yilmaz, 2013, Ponniah & Kennepohl, 1996;
Von Quintus et al., 2007). Effective polymer modification results in a
thermodynamically unstable but kinetically stable system in which the
polymer is partially swollen by the light components of bitumen (Polacco
et al., 2006). Some important factors, including the characteristics of the
bitumen and the polymer themselves, the polymer content and the manu-
facturing processes, determine the final properties of polymer-modified
bitumen (PMB) (Lu, 1997; Larsen et al., 2009). As the polymer content
increases, phase inversion may occur in some PMBs: from bitumen being
the dominant phase to polymer becoming the dominant phase (Sengoz &
Isikyakar, 2008). However, an ideal microstructure for PMB contains
two interlocked continuous phases, which determines the optimum poly-
mer content for bitumen modification (Brûlé et al., 1988).
Since a modified binder consists of two distinct phases, three different
cases must be considered (Brûlé, 1996):
• low polymer content;
• polymer content around 5%;
Chapter 1 13 Background and literature review
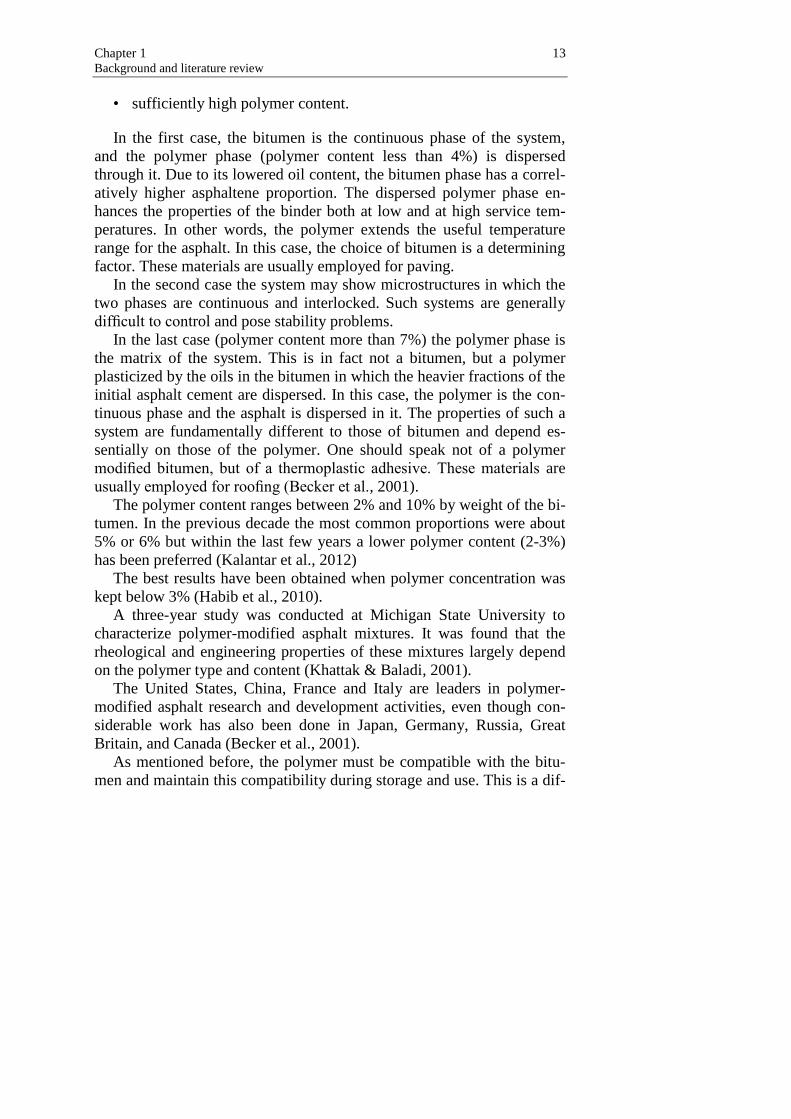
• sufficiently high polymer content.
In the first case, the bitumen is the continuous phase of the system,
and the polymer phase (polymer content less than 4%) is dispersed
through it. Due to its lowered oil content, the bitumen phase has a correl-
atively higher asphaltene proportion. The dispersed polymer phase en-
hances the properties of the binder both at low and at high service tem-
peratures. In other words, the polymer extends the useful temperature
range for the asphalt. In this case, the choice of bitumen is a determining
factor. These materials are usually employed for paving.
In the second case the system may show microstructures in which the
two phases are continuous and interlocked. Such systems are generally
difficult to control and pose stability problems.
In the last case (polymer content more than 7%) the polymer phase is
the matrix of the system. This is in fact not a bitumen, but a polymer
plasticized by the oils in the bitumen in which the heavier fractions of the
initial asphalt cement are dispersed. In this case, the polymer is the con-
tinuous phase and the asphalt is dispersed in it. The properties of such a
system are fundamentally different to those of bitumen and depend es-
sentially on those of the polymer. One should speak not of a polymer
modified bitumen, but of a thermoplastic adhesive. These materials are
usually employed for roofing (Becker et al., 2001).
The polymer content ranges between 2% and 10% by weight of the bi-
tumen. In the previous decade the most common proportions were about
5% or 6% but within the last few years a lower polymer content (2-3%)
has been preferred (Kalantar et al., 2012)
The best results have been obtained when polymer concentration was
kept below 3% (Habib et al., 2010).
A three-year study was conducted at Michigan State University to
characterize polymer-modified asphalt mixtures. It was found that the
rheological and engineering properties of these mixtures largely depend
on the polymer type and content (Khattak & Baladi, 2001).
The United States, China, France and Italy are leaders in polymer-
modified asphalt research and development activities, even though con-
siderable work has also been done in Japan, Germany, Russia, Great
Britain, and Canada (Becker et al., 2001).
As mentioned before, the polymer must be compatible with the bitu-
men and maintain this compatibility during storage and use. This is a dif-

14 Mauro Ranieri Asphalt mixtures improved with plastic additives: mix design and case study in an airport
ficult task, because of the big difference in molecular weight and struc-
ture, viscosity and density of constituents (Giavarini et al., 1996).
The general conclusion from the studies on the nature of the asphalt
says that to dissolve and expand the polymer asphalt should contain
enough oil fractions. It should also have a high content of condensed in-
gredients like aromatic hydrocarbons which mix especially well with po-
lar aromatic polymers (Zielinski et al., 1995).
Generally, a thermoplastic polymer-modified asphalt which results
from physical mixing of the constituents without chemical interactions
can consequently be a two-phase system. One phase is a swollen polymer
and another phase grouping the constituents of the asphalt not interven-
ing in the solvation.
Vonk and Bull have shown that elastomer of a thermoplastic rubber
copolymer can absorb almost all the bitumen components except the as-
phaltenes (Vonk & Bull, 1989). Therefore the asphaltene content of the
bitumen should not be too high; otherwise addition of a thermoplastic
rubber can result in asphaltene precipitation or gelation and will result in
phase separation so the blend becomes unworkable. On the other hand, if
the asphaltene content is low a single phase blend may be obtained.
The mixing process is influenced by a number of parameters:
• Nature of the polymer.
The proper mixing time to achieve a homogeneous blend of the bi-
tumen and polymer depends on the type, molecular weight and
chemical composition of polymer. A polymer with higher molecu-
lar weight needs a longer time to blend with bitumen and vice versa
(Morgan & Mulder, 1995).
• Physical form of the polymer.
A smaller particle size has a larger surface area per unit mass of
polymer. Thus, swelling of the polymer and penetration are easier
(Morgan & Mulder, 1995).
• Type of mixing equipment.
There are two main methods for mixing bitumen with polymer,
namely, high shear and low shear mixing. The low shear mixer is a
simple mixing tank with a paddle stirrer. It can be used to mix bi-
tumen with a powdered modifier. The mixing process is limited to
swelling and dissolving the bitumen with polymer. The temperature
is fixed during the mixing. The high-shear mixer reduces the poly-
mer particles size by mechanical and hydrodynamic shear. The
Chapter 1 15 Background and literature review
temperature will increase during the mixing in order to dissolve
polymer into the bitumen and make a homogeneous blend.
• Time-temperature profile during mixing.
The structure and properties of PMA are a function of the blending
conditions. It means the longer the mixing time is, the finer the mi-
crostructure will be and the higher the temperature is, the more rap-
idly this process will be done (Becker et al., 2001). The Shell report
(Lu & Isacsson, 1997) suggests that the mixing temperature should
not exceed 185°C. Otherwise the bitumen would burn. Moreover,
the mixing time should be adequate for homogeneous dispersion of
the waste plastic within the bitumen matrix.
• Compatibility and stability.
A polymer may be incompatible, slightly compatible or compatible
with bitumen. In the first case, the mixture is heterogeneous in that
the polymer affects the chemical equilibrium of the bitumen so that
the mixture does not have enough cohesion and ductility (Lesueur,
2009; Brûlé & Druon, 1975; Kraus, 1982; Bouldin et al., 1990).
Slightly compatible polymers can improve bitumen properties but
they require a high-shear mixer with a high temperature to mix
with bitumen homogeneously. Compatible polymers make it possi-
ble to obtain a physically stable blend. This kind of polymers may
or may not improve the physical properties of the bitumen. Com-
patibility between polymer and bitumen should be high enough to
avoid phase separation in the bitumen and to achieve a proper
pavement with good quality (Kalantar et al., 2012).
The main reasons to modify asphalts with polymers could be summarized
as follows (Lewandowski, 1994):
• to obtain softer blends at low service temperatures and reduce
cracking (Ali et al., 1994);
• to reach stiffer blends at high temperatures and reduce rutting (Ali
et al., 1994);
• to reduce viscosity at layout temperatures;
• to increase the stability and the strength of mixtures;
• to improve the abrasion resistance of blends;
• to improve fatigue resistance of blends;
• to improve oxidation and aging resistance;
• to reduce the structural thickness of pavements;
• to reduce the maintenance costs of pavements.

16 Mauro Ranieri Asphalt mixtures improved with plastic additives: mix design and case study in an airport
Figure 1.1 compares the stiffness of a conventional asphalt binder to
an ideal modified asphalt binder at different in-service temperatures. As
mentioned above, at high temperatures polymer modification increases
binder stiffness and elasticity, as a result of an increased storage modulus
and a decreased phase angle. Both increasing the storage modulus and
decreasing the phase angle improve rutting resistance of the pavement
(Bahia & Anderson, 1995). Instead, at low temperatures, polymer modi-
fication lowers the creep stiffness of the asphalt, which improves thermal
cracking resistance (Isacsson & Lu, 1999).
Fig. 1.1 Effects of polymer modification in asphalt binder (Epps, 1986)
Although there have been many experimental and field studies com-
paring the performance of polymer-modified asphalt (PMA) mixtures
and conventional hot-mix asphalt mixtures, there has not been a concert-
ed effort to quantify the benefits of using PMA mixtures or to develop
guidance on when the use of PMA mixtures is cost-effective. It would be
desirable to identify the site and design factors (e.g. traffic, climate,
thickness, etc.) for which the effect of using PMA can be maximized.
For this purpose an investigation was conducted in North America. It
was found that PMA mixtures significantly enhance not only the rutting
performance of flexible pavements, but also their fatigue and fracture
performance.

Chapter 1 17 Background and literature review
The life cycle of PMA mixtures has been found to be higher and this
improvement varies from 2 to more than 10 years, which represents a
20% to 100% increase in performance (Von Quintus et al., 2007).
Polymer-modified binders have been used with success at high stress
locations, such as intersections of busy streets, airports, heavy vehicle
stations and race tracks (King et al., 1999).
Although these polymers all improve bitumen properties to some ex-
tent, there are still some drawbacks limiting the future development of
bitumen polymer modification, such as high cost (the incorporation of
polymers into asphalt increases the price of the product between 60 and
100%, Becker et al., 2001), low compatibility between polymer and bi-
tumen, higher viscosity during the manufacturing process and application
of the mixtures, low ageing resistance and poor storage stability of poly-
mer modified bitumen (Zhu et al., 2014).
The poor storage stability of some PMBs usually results from poor
compatibility between polymer modifiers and bitumen, which is con-
trolled by polymers’ and bitumen’s different properties such as density,
molecular weight, polarity, solubility (Wang et al., 2010) and also the
chemical structure and reactivity of polymers (Chang et al., 2000).
At the same time, the addition of a polymer causes a significant in-
crease in the production costs and adds operative complications that are
mostly related to mixing and storage. With regard to the latter, the low
compatibility between asphalt and polymer can lead to phase separation
when the material is stored at a high temperature (160-200°C) in the ab-
sence of stirring. In such a case, a polymer-rich phase migrates to the
higher part of the storage tank, while an asphalt-rich phase segregates in-
to the lower part (Polacco et al., 2005).
Researchers have tried various solutions to remove the drawbacks of
currently used polymer modifiers, among which saturation, functionaliza-
tion (including application of reactive polymers) and using extra addi-
tives (sulphur, antioxidants and hydrophobic clay minerals). These solu-
tions do overcome some disadvantages of PMB, but most cause some
new problems (Zhu et al., 2014).
Although it has been known for some time that virgin polymers can
improve modified bitumen’s properties, nowadays there are some con-
cerns about replacing virgin materials with recycled polymers (Gonzalez
et al., 2002).
Since polymers are rather expensive, the amount of polymer used to
improve the road pavement must be small. Recycled polymers have been
18 Mauro Ranieri Asphalt mixtures improved with plastic additives: mix design and case study in an airport
found to show similar results in improving road performance as com-
pared to virgin polymers. From the economic and environmental point of
view using waste polymer as a modifier is beneficial because it can help
to improve the performance of pavement and quality of the roads and al-
so to solve the waste disposal problem (Gonzalez et al., 2002).
Using waste plastic bottles as a modifier in road surfaces can poten-
tially help reduce material wastage and improve the performance of road
surfaces at the same time (Huang et al., 2007; Sengoz & Topal, 2005;
Xue et al., 2009; Arabani et al., 2010; Huang et al., 2009).
In this connection, the modification of bitumen with plastic wastes can
improve the performance of asphalt mixtures in terms of rutting re-
sistance, high temperature stiffness and susceptibility to temperature var-
iations (Kim et al., 2013). Depending on the type of waste polymer used,
better fatigue cracking resistance has also been found (Costa et al., 2013).
The advantage of wet process is the following:
• it can be utilized for recycling of any type, size and shape of waste
material (plastics, rubber, etc.).
The disadvantages of wet process are the following:
• it is time-consuming and requires more energy for blending;
• a powerful mechanical device is required;
• additional cooling is required as improper addition of bitumen may
cause air pockets in roads;
• the maximum % of waste plastic that can be added around 8%
(Gawande et al., 2012).
1.3.2 Dry process
Many studies have instead investigated the dry process (Awwas &
Shbeeb, 2007; Giuffré & Di Francisca, 2001; Celauro, 2005; Celauro et
al., 2001a; Celauro et al., 2001b; Celauro et al., 2006).
Regarding the timing of adding plastics, there are three possibilities:
immediately after the aggregate and before the bitumen, or after the bi-
tumen and before the filler or after the filler. Adding plastics immediately
after the aggregate always makes it possible to obtain the best results. For
this reason the best production process provides the following sequence
of components in the mixing tank: stone aggregates, plastics, bitumen
and finally filler. In this way not only the mechanical performance im-
proves, but there is also a reduction of the risk of bitumen ageing, which
can occur if the plastic is added after the bitumen.

Chapter 1 19 Background and literature review
Asphalt mixtures with plastics, unlike the case of modified bitumens,
do not produce additional difficulties with regard to the workability and
compactibility. Cleaning of the mixing equipment and the tools with
which they are in contact does not pose particular problems, unlike in the
case of modified bitumens (Giuffrè et al., 2001).
The advantages of the dry process are the following:
• the plastic is coated over stones, improving the surface properties
of the aggregates;
• coating is easy and the required temperature is the same as road
laying temperature;
• the use of more than 15% of waste plastic is possible;
• flexible films of all types of plastics can be used;
• it doubles the binding property of aggregates;
• no new equipment is required;
• bitumen bonding is stronger than normal;
• the coated aggregates show increased strength;
• replacing up to 15% of bitumen, higher cost efficiency is possible;
• no degradation of roads even 5-6 years after construction;
• it can be carried out in all types of climatic conditions;
• no evolution of any toxic gases, as the maximum temperature is
180ºC.
The disadvantage of the dry process is the following:
• the process is only applicable to plastic waste material (Gawande et
al., 2012).
1.4 EME Enrobé à Module Élevé (EME) or High-Modulus Asphalt (HiMA) is a
French technology that was conceived in the 1980s with the purpose of
maximizing stiffness and fatigue resistance, whilst ensuring that rutting
and durability (particularly moisture resistance) requirements were still
being met. It was initially intended to be used on the most heavily traf-
ficked routes in France, as well as on airport pavements and container
terminals, but early successes quickly opened up new avenues for its ap-
plication. One of the fastest growing offsets of EME has been urban
roads, based on the ability to reduce overall layer thickness as a result of
the substantially higher stiffness of the material, while still being able to
maintain the same level of performance. This has translated into direct

20 Mauro Ranieri Asphalt mixtures improved with plastic additives: mix design and case study in an airport
savings in road construction material usage and construction costs (Distin
et al., 2008).
The superior structural properties of high modulus material justify
thickness reductions of 25 to 40% compared with conventional French
materials (Sanders & Nunn, 2005, Nunn & Smith, 1997).
The main characteristic of these mixtures is high stiffness, obtained by
using hard or very hard bitumens (low penetration grade binders in the
range 10 to 35), which necessitates the use of finer grading (Nunn &
Smith, 1997; Distin et al., 2008).
But since the use of such hard binders limits the workability of the
mixtures, their use is justified in the case of very high traffic or for spe-
cific applications such as in the airport environment (Pasetto, 1998), (for
the strengthening of taxiways and runways, Horak, 2008).
In essence, EME is hot-mix asphalt consisting of hard bitumen blend-
ed at high binder content with good quality, fully crushed aggregates in
order to produce a (relatively) fine-graded mix with low air void content.
EME is designed to combine good mechanical performance with durabil-
ity and impermeability when well compacted. It is designed in the labora-
tory to yield high elastic stiffness, high permanent deformation resistance
and high fatigue resistance, whilst also offering good moisture resistance
and good workability, which are the four key parameters for long-life
pavements (Distin et al., 2008). The designed material is considered to be
very stable and consequently very heavy pneumatic-tyre rollers, weigh-
ing up to 45 tonnes, are regarded as essential for compaction (Nunn &
Smith, 1997). The higher the modulus of elasticity, the higher the flexur-
al rigidity and the dynamic resistance are. Also, the higher the modulus
of elasticity the lower the thermal susceptibility and plastic deformation
are. To achieve the required performance, i.e. high stiffness, fatigue re-
sistance, high rutting resistance, resistance to brittle thermal cracking,
ageing resistance and workability, appropriate asphalt mix designs were
found which resulted in the first set of performance-based specifications
NF P 98-140 published by AFNOR in 1992. Among the key components
were the hard special bitumen grades, mostly 10/20 and 15/25 penetra-
tion, with characteristics that resulted in compromises between optimized
thermal susceptibility and ageing resistance (Des Croix & Planque,
2004).
As mentioned above, EME is suited for applications such as a re-
placement layer or overlay, or also as a thinner structural layer when used
in new construction. In particular:
Chapter 1 21 Background and literature review
• on heavily trafficked routes, particularly where traffic is slow and
channelized, such as on major bus routes;
• in specific pavements subjected to heavy loads such as dedicated
truck routes, loading bays and container terminals;
• in constrained (boxed-in) pavements, that is in areas where there
are geometric constraints;
• on new pavements as a base course layer;
• in rehabilitation, where between 80 and 120 mm is milled off and
replaced with EME, often surfaced with a very thin asphalt wearing
course;
• on runways and taxiways (Distin et al., 2008).
In summary, from the economic point of view several advantages may
arise from the use of EME, such as reduction of thickness from 3 to 7 cm,
reduction of milled pavement and use of locally available stone aggre-
gate.
Manufacturing and laying may be carried out at the same asphalt mixing
plant and with the equipment used for traditional asphalt mixture (Paset-
to, 1998).
1.4.1 In France
French mix design methodology consists of 5 basic steps (Distin et al.,
2008).
• Step 1: Selection and identification of mix components (choice
gradation and binder content). It is the crucial parameter for EME.
The French Standard provides two classes of EME (EME 1 and
EME 2), but EME 2 is the most widely used and it is obtained by
using higher bitumen content (4.5-5% for EME 1 against 5.5-6%
by weight of the aggregates for EME 2). The aggregate should be
fully crushed to have high strength (Los Angeles value lower than
25-30%) and the maximum aggregate size can be 10, 14 or 20 mm
(14 is the most widely used). The filler content is high (up to 10%).
Figure 1.2 shows typical grading curves for EME, while Table 1.2
reports mix grading curve for EME 2 and diameter between 0 and
14 mm. The binder must be hard grade bitumen with a Penetration
Index of around 0. The high level of bitumen plus filler and low air
void content make it possible to have a good permanent defor-
mation resistance (Brosseaud, 2012).

22 Mauro Ranieri Asphalt mixtures improved with plastic additives: mix design and case study in an airport
Fig. 1.2 Typical grading curves for EME (Distin et al., 2008)
Sieve (mm) Passing (%)
14 94-100
10 72-84
6.3 50-66
4 40-54
2 28-40
0.08 7-10
Tab. 1.2 Mix grading curve for EME 2 0/14 (Pasetto, 1998)
• Step 2 (Level 1 Design): Assessment of workability (compactibil-
ity) and assessment of susceptibility to moisture damage (water
sensitivity).
The first is done by means of gyratory testing (ensuring that the
mixing temperature is between 160 and 180°C and that the com-
paction temperature never drops below 145°C) and the second one
by means of the Duriez test. If tests do not meet the requirements, it
is necessary to go back to step 1 and change something about the
components.
• Step 3 (Level 2 Design): Assessment of resistance to permanent de-
formation (rutting).
The assessment of resistance to permanent deformation is carried
out by means of a wheel-tracking test on slabs manufactured by
Chapter 1 23 Background and literature review
rolling-wheel compaction. The mix is subjected to 30000 unidirec-
tional loads (frequency: 1 Hz, load: 5 KN, pressure: 0.6 MPa) at a
test temperature of 60°C.
• Step 4 (Level 3 Design): Assessment of the elastic stiffness.
The asphalt mix stiffness is determined by either a complex modu-
lus test (sinusoidal loading on a trapezoidal or parallelepiped spec-
imen) or a uniaxial tensile test (on a cylindrical or parallelepiped
specimen). With preset frequency, time and loading values the test
is started, and in it short-term deformations are induced in the sam-
ple. The modulus (stress-strain ratio) is computed for each basic
test. Using time-temperature transposition, an elastic stiffness mas-
ter curve is then developed.
• Step 5 (Level 4 Design): Determination of fatigue life.
The tests are conducted at a temperature of 10°C using a loading
frequency of 25 Hz.
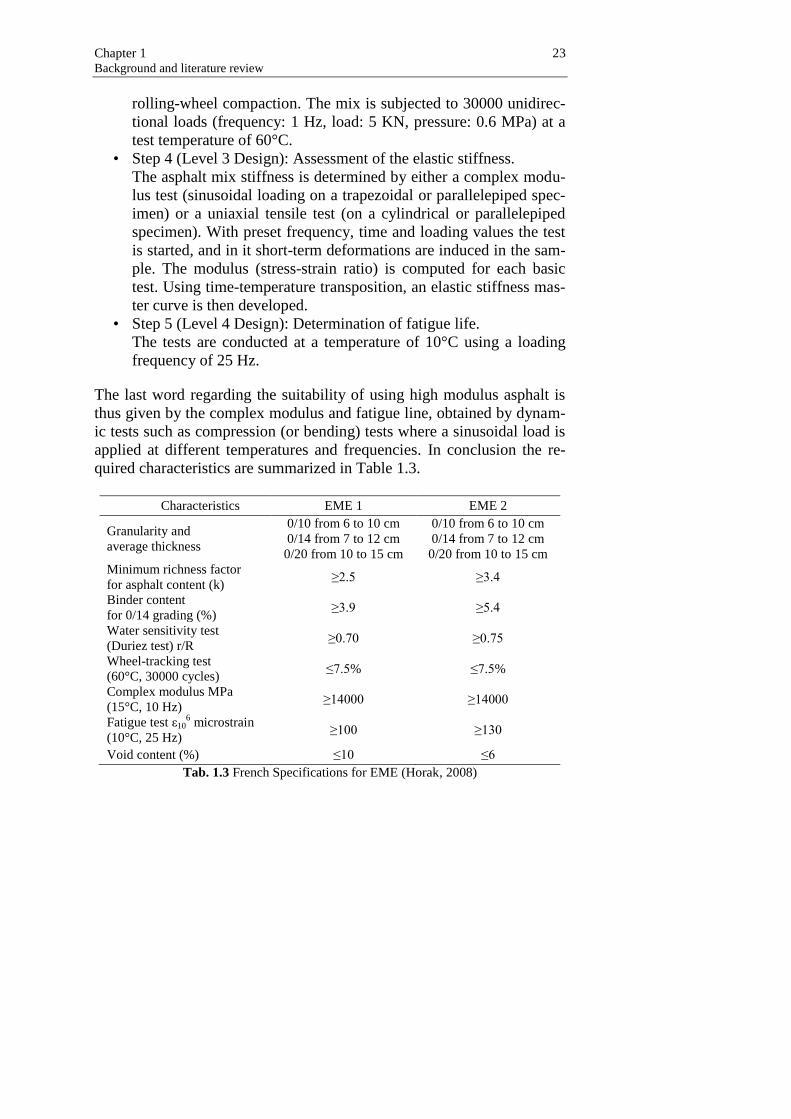
The last word regarding the suitability of using high modulus asphalt is
thus given by the complex modulus and fatigue line, obtained by dynam-
ic tests such as compression (or bending) tests where a sinusoidal load is
applied at different temperatures and frequencies. In conclusion the re-
quired characteristics are summarized in Table 1.3.
Characteristics EME 1 EME 2
Granularity and
average thickness
0/10 from 6 to 10 cm
0/14 from 7 to 12 cm
0/20 from 10 to 15 cm
0/10 from 6 to 10 cm
0/14 from 7 to 12 cm
0/20 from 10 to 15 cm
Minimum richness factor
for asphalt content (k) ≥2.5 ≥3.4
Binder content
for 0/14 grading (%) ≥3.9 ≥5.4
Water sensitivity test
(Duriez test) r/R ≥0.70 ≥0.75
Wheel-tracking test
(60°C, 30000 cycles) ≤7.5% ≤7.5%
Complex modulus MPa
(15°C, 10 Hz) ≥14000 ≥14000
Fatigue test ε106 microstrain
(10°C, 25 Hz) ≥100 ≥130
Void content (%) ≤10 ≤6
Tab. 1.3 French Specifications for EME (Horak, 2008)

24 Mauro Ranieri Asphalt mixtures improved with plastic additives: mix design and case study in an airport
EME not only offers thinner layers, but also offers sustainable life
long pavements (Horak, 2008).
1.4.2 In the other countries
According to a research project developed in 2007 by the CRR (Centre
de Recherches Routieres in Belgium), which takes as its primary refer-
ence the French standard NF P 98-140, these mixtures were considered
as a possible solution to contrast rutting in Belgium, due to increased
heavy traffic. The primary objective of this study was to assess the tech-
nological feasibility, in terms of mix design, production and application
of these mixtures very well-known abroad, especially in France, the
country of origin, and still little used in Belgium. In other words, the aim
was to provide the necessary knowledge in the study of the mix design of
EME and the correct requirements to be included in the specifications by
verifying that it was possible to produce this mixture with the materials
commonly used in Belgium (De Backer et al., 2007).
There is doubtless similar interest in application of these mixtures in
Italy (Moramarco, 2012; Pasetto, 1998), where there is not only heavy
traffic, but also and above all a Mediterranean climate, which is more pe-
nalizing than the French and Belgian continental climate. Indeed, the use
of EME would be particularly advantageous in warm climates (Espers-
son, 2004).
Table 1.4 gives an example of Italian grading curve for high modulus
asphalt.
Sieve (mm) Passing (%)
12.7 100
9.52 76-100
6.35 60-77
4.76 52-66
2 35-46
0.42 15-22
0.177 9-14
0.075 6-9
Tab. 1.4 Italian grading curve for high modulus asphalt (Pasetto, 1998)
Although for several years these mixtures have been used in many ap-
plications such as highways, urban roads and airport runways (Parracini

Chapter 1 25 Background and literature review
et al., 2013), Italian standards does not yet cover the high modulus as-
phalt (Pasetto, 1998).
These mixtures are also of particular interest in other countries such as
Australia (Petho & Denneman, 2013a; Petho & Denneman, 2013b; Petho
et al., 2014; Guyot, 2013, Department of Transport and main roads, 2015,
Le Bouteiller, 2016), United Kingdom (Nunn & Smith, 1994; Nunn &
Smith, 1997; Sanders & Nunn, 2005), South Africa (Sabita, 2010;
Nkgapele et al., 2012; Distin et al., 2008;), Spain (Pasetto, 1998), Poland,
Morocco and Mauritius (Le Bouteiller, 2016).

Chapter 2
Case 1
2.1 General Case 1 regards asphalt surface mixtures with improved performance us-
ing waste polymers via dry and wet processes and the tests were per-
formed at the Road Materials Laboratory of the University of Guimarães
(Portugal).
The results obtained indicated that polymer-modified mixtures
showed similar or improved performance when compared to that of a
conventional control mixture produced with harder virgin grade bitumen,
not always available, or available at higher costs, in several countries.
Thus, modifying asphalt mixtures with these plastic wastes can be an
economic and ecological alternative for paving works. Moreover, the
mixtures produced via the dry process showed increased water sensitivity
and stiffness modulus properties. This holds out new possibilities for use
of polymer-modified mixtures, especially in developing countries, since
it widens the possibility of using locally available bitumens, of variable
quality, for producing mixtures with higher performance. This can be
achieved at real scale with no major extra costs because the dry process
does not require modification of typical asphalt plants.
2.2 Materials The mixture used in this study, an “ AC 14 SURF ”, is a conventional
mixture commonly used in surface courses in which the maximum ag-
gregate size (Dmax) is 14 mm. The materials used to produce polymer-
modified asphalt mixtures with HDPE (High Density Polyethylene) and
EVA (Ethylene-Vinyl Acetate), as well as the conventional control mix-
ture, namely the aggregates, the bitumen and the additives, are presented

28 Mauro Ranieri Asphalt mixtures improved with plastic additives: mix design and case study in an airport
below. The methods used for mixture production and material testing are
presented later.
2.2.1 Aggregates
The mineral aggregates used in the mixtures came from crushed granitic
rocks (supplied by the Bezerras quarry at Guimarães, Portugal), while the
filler was limestone (supplied by Omya, S.A. at Soure, Portugal).
The mixtures were obtained from the combination of different aggre-
gate fraction sizes (6/14, 4/6 and 0/4) with the addition of mineral filler.
For each fraction, the physical and mechanical characteristics are given
in Table 2.1. Sieving operations were carried out in the laboratory in or-
der to obtain the 10/14 fraction from the 6/14 fraction and the 2/4 and
0.5/2 fractions from the 0/4 fraction, respectively. In order to highlight
the effect of polymer modification as well as that of the addition process,
the mix grading curve was kept constant for the different mixtures stud-
ied; it is given in Table 2.2, together with the lower and upper limits typ-
ically required in the technical specifications for road works in Portugal
(EP 2014).
Characteristic Fraction
0/4
Fraction
4/6
Fraction
6/14 Filler Unit Standard
Density 2.66 2.65 2.66 2.7 Mg/m3 EN 1097-6
Contents of fines f16 f4 f1.5 EN 933-1
Flattening Index FI20 FI15 EN 933-3
Sand Equivalent (SE) ≥50 % EN 933-8
Methylene Blue (MB) ≤5 % EN 933-9
Los Angeles abrasion LA30 LA30 LA30 EN 1097-2
Tab. 2.1 Physical and mechanical characteristics of the aggregates used in this work
Sieve Limit
filler 0.5/2 2/4 0/4 4/6 6/14 10/14 Total Lower Upper
#20 100 100 100.0 100.0 100.0 100.0 100.0 100.0 100.0 100.0
#14 90 100 100.0 100.0 100.0 100.0 100.0 91.0 86.6 96.0
#10 67 77 100.0 100.0 100.0 100.0 100.0 43.0 0.0 73.0
#4 40 52 100.0 100.0 67.9 90.8 11.7 6.0 0.0 46.7
#2 25 40 100.0 99.3 1.0 68.9 3.8 4.0 0.0 31.9
#0.5 11 19 100.0 0.0 0.1 36.5 2.6 3.0 0.0 16.8
#0.125 6 10 100.0 0.0 0.0 15.3 1.8 2.0 0.0 8.8
#0.063 5 8 96.0 0.0 0.0 9.8 1.1 1.0 0.0 6.3
Material Used 2.5% 3.0% 8.0% 36.0% 11.0% 29.0% 10.5% 100.0%
Tab. 2.2 Aggregate grading curve and envelope limits for AC 14 Surf mixtures
Chapter 2 29 Case 1
2.2.2 Bitumens
The base bitumen used in this study for polymer-modified mixtures was a
70/100 pen grade bitumen provided by Cepsa. The conventional mixture,
assumed as the control mixture, was produced with a 35/50 pen grade bi-
tumen, from the same supplier as the 70/100 bitumen. The characteristics
of the two bitumens are detailed in Table 2.3.
The production of modified binders with the WET process was per-
formed via modification of 70/100 pen grade bitumen by adding 5% of
HDPE or EVA, by mass of binder, i.e. by replacing 5% of the total mass
of binder with HDPE or EVA polymer. Later, the same proportions were
used for the mixtures produced via the DRY process, in order to have the
same amounts of bitumen and polymer in both methods. The polymer
content was selected in the typical range, which usually produces a sig-
nificant effect on the mechanical and rheological properties of the binder
(Giuliani et al., 2009). Binder modification was performed in the labora-
tory, with a high-shear mixer at 7400 rpm at a constant temperature (T =
160°C). The characteristics of the resulting polymer-modified binders are
given in Table 2.4.
Characteristics Unit Bitumen
Standard 70/100 35/50
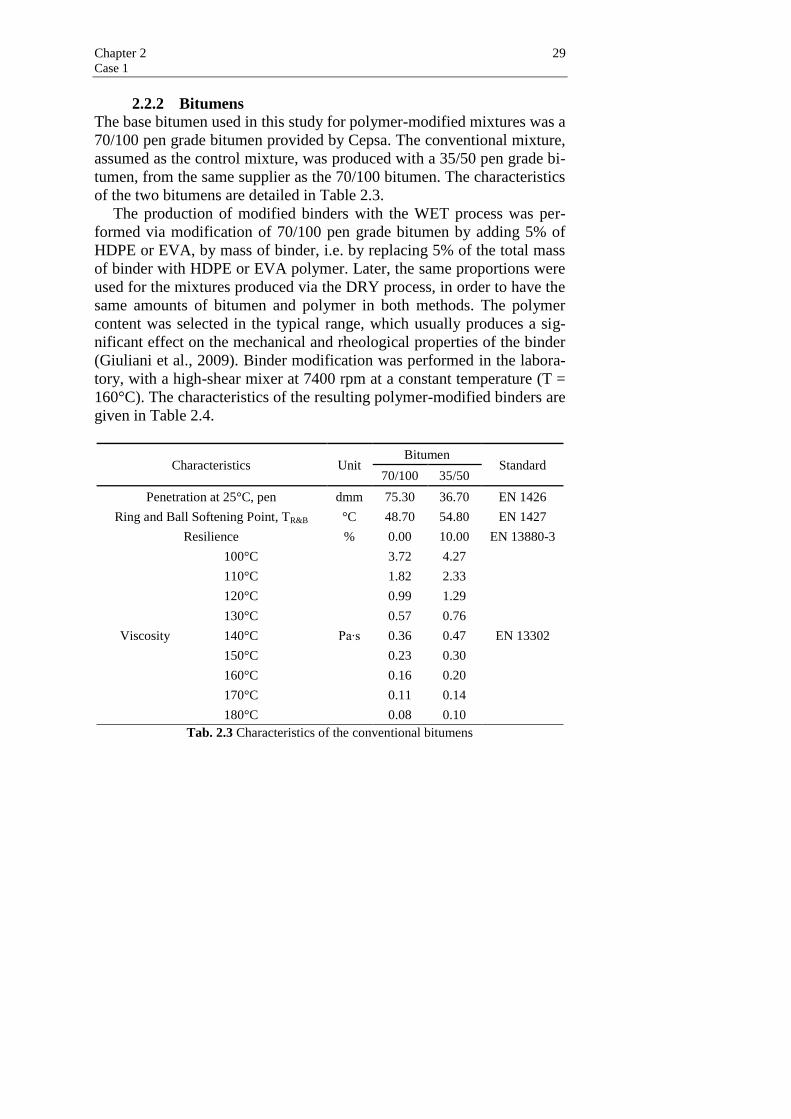
Penetration at 25°C, pen dmm 75.30 36.70 EN 1426
Ring and Ball Softening Point, TR&B °C 48.70 54.80 EN 1427
Resilience % 0.00 10.00 EN 13880-3
Viscosity
100°C
Pa∙s
3.72 4.27
EN 13302
110°C 1.82 2.33
120°C 0.99 1.29
130°C 0.57 0.76
140°C 0.36 0.47
150°C 0.23 0.30
160°C 0.16 0.20
170°C 0.11 0.14
180°C 0.08 0.10
Tab. 2.3 Characteristics of the conventional bitumens

30 Mauro Ranieri Asphalt mixtures improved with plastic additives: mix design and case study in an airport
Characteristics Unit Bitumen
Standard 70/100+HDPE 70/100+EVA
Penetration at 25°C, pen dmm 31.80 37.10 EN 1426
Ring and Ball
Softening Point, TR&B °C 67.90 61.10 EN 1427
Resilience % 11.00 26.00 EN 13880-3
Viscosity
100°C
Pa∙s
52.11 14.24
EN 13302
110°C 17.54 7.16
120°C 5.34 3.71
130°C 2.04 2.10
140°C 1.23 1.22
150°C 0.85 0.76
160°C 0.65 0.50
170°C 0.45 0.34
180°C 0.32 0.24
Tab. 2.4 Characteristics of the polymer-modified binders
A dynamic mechanical analysis of the several binders was conducted
with a dynamic shear rheometer (DSR), making it possible to obtain the
rheological properties in terms of complex modulus │G*│ and phase an-
gle δ for a reference temperature of 60 ºC, as shown in Figure 2.1. These
were obtained by frequency sweep tests, carried out in strain-controlled
mode over a wide range of temperatures, according to the EN 14770
standard. The tests were carried out using parallel plate geometry, by ap-
plying strain amplitudes carefully checked to be within the LVE response
of the material. The testing temperature ranged from 30°C to 80°C, while
the testing frequency ranged from 0.01 to 100 Hz.
The isotherms obtained were used for determination of the Master
Curves. These curves were obtained by applying the time-temperature
superposition principle. In this connection, the shift in the frequency
sweep tested at multiple temperatures by applying a multiplier (shift fac-
tor) to the frequency (or time) at which the measurement is taken made it
possible to combine the individual isotherms of stiffness in order to form
a single smooth curve of frequency or time versus stiffness (the master
curve). The shift factor αT was calculated and optimized according to the
Arrhenius equation (Rowe & Sharrock, 2010; Celauro et al., 2010). In
this way, by horizontal translation of the shift of isotherms relating to the

Chapter 2 31 Case 1
test temperatures it was possible to construct the master curve at a refer-
ence temperature of 60°C for each binder.
Fig. 2.1 Complex modulus and phase angle of the binders used
The modification of the 70/100 pen grade bitumen with 5% EVA or
HDPE increased the stiffness moduli and reduced the phase angles in a
wide range of frequencies. Based on the results given in Fig. 2.1, the pol-
ymer-modified binders became stiffer and more elastic compared not on-
ly to the unmodified 70/100 pen grade bitumen, but also to the 35/50 pen
grade bitumen. This result confirms the advantages of polymer modifica-
tion, as previously mentioned, which will later be assessed when study-
ing the effect of polymer introduction in asphalt mixtures.
1E-01
1E+00
1E+01
1E+02
1E+03
1E+04
1E+05
1E+06
1E+07
0.0001 0.01 1 100 10000 1000000
│G*│
(P
a)
35/50
70/100
70/100 + EVA
70/100 + HDPE
TR = 60°C
10
20
30
40
50
60
70
80
90
100
0.0001 0.01 1 100 10000 1000000
δ (
deg
)
αT x f (Hz)
35/50
70/100
70/100 + EVA
70/100 + HDPE
TR = 60°C
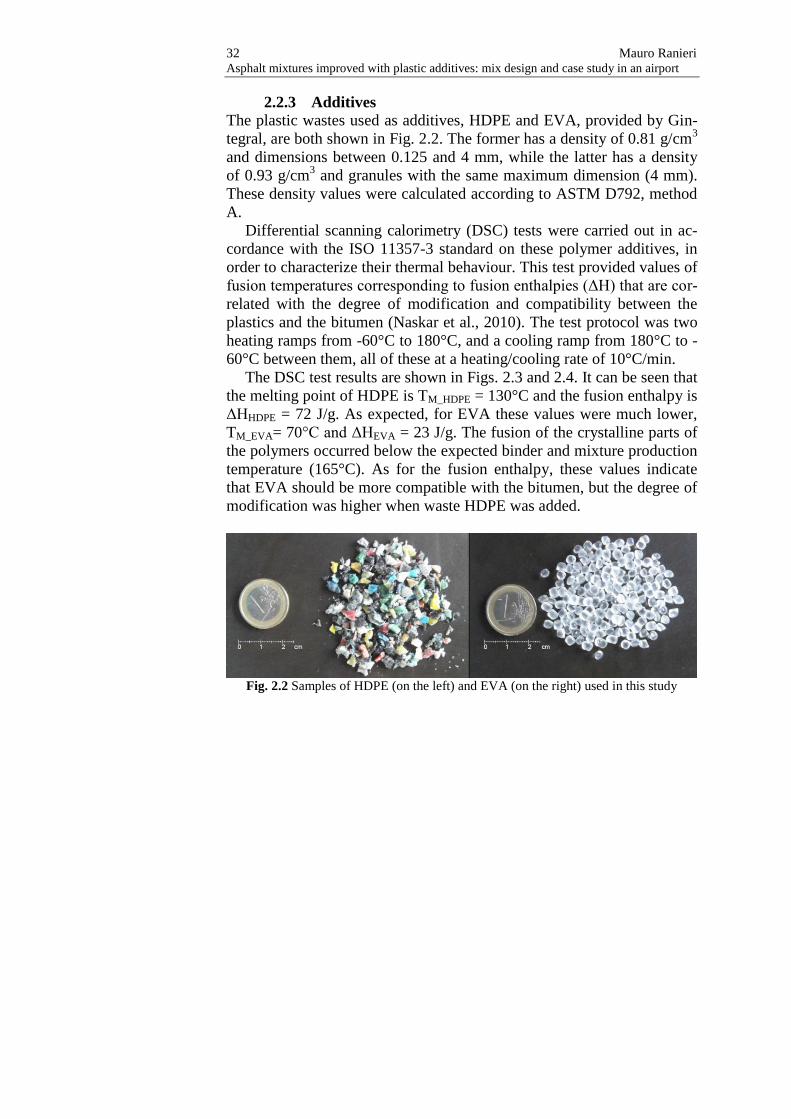
32 Mauro Ranieri Asphalt mixtures improved with plastic additives: mix design and case study in an airport
2.2.3 Additives
The plastic wastes used as additives, HDPE and EVA, provided by Gin-
tegral, are both shown in Fig. 2.2. The former has a density of 0.81 g/cm3
and dimensions between 0.125 and 4 mm, while the latter has a density
of 0.93 g/cm3 and granules with the same maximum dimension (4 mm).
These density values were calculated according to ASTM D792, method
A.
Differential scanning calorimetry (DSC) tests were carried out in ac-
cordance with the ISO 11357-3 standard on these polymer additives, in
order to characterize their thermal behaviour. This test provided values of
fusion temperatures corresponding to fusion enthalpies (ΔH) that are cor-
related with the degree of modification and compatibility between the
plastics and the bitumen (Naskar et al., 2010). The test protocol was two
heating ramps from -60°C to 180°C, and a cooling ramp from 180°C to -
60°C between them, all of these at a heating/cooling rate of 10°C/min.
The DSC test results are shown in Figs. 2.3 and 2.4. It can be seen that
the melting point of HDPE is TM_HDPE = 130°C and the fusion enthalpy is
ΔHHDPE = 72 J/g. As expected, for EVA these values were much lower,
TM_EVA= 70°C and ΔHEVA = 23 J/g. The fusion of the crystalline parts of
the polymers occurred below the expected binder and mixture production
temperature (165°C). As for the fusion enthalpy, these values indicate
that EVA should be more compatible with the bitumen, but the degree of
modification was higher when waste HDPE was added.
Fig. 2.2 Samples of HDPE (on the left) and EVA (on the right) used in this study

Chapter 2 33 Case 1
Fig. 2.3 DSC test results on HDPE
Fig. 2.4 DSC test results on EVA
2.3 Methods, results and discussion Volumetric (mix design) and mechanical (water sensitivity, permanent
deformation, stiffness modulus and fatigue cracking resistance) charac-
terization of mix asphalt is essential and necessary in order to evaluate
the performance of a road pavement. Thus, as mentioned above, the me-
chanical performance of a typical surface course mixture, modified with
two different plastic wastes, both via the wet and dry processes, was
evaluated in this study and compared to that of a conventional control
mixture. Specifically, the five mixtures were named as follows:
-25
-20
-15
-10
-5
0
5
10
15
20
-100 -50 0 50 100 150 200
Hea
t fl
ow
(m
W)
Temperature (°C)
1st heating cooling 2nd heating
-4
-3
-2
-1
0
1
2
3
4
-100 -50 0 50 100 150 200
Hea
t fl
ow
(m
W)
Temperature (°C)
1st heating cooling 2nd heating

34 Mauro Ranieri Asphalt mixtures improved with plastic additives: mix design and case study in an airport
• HDPEw (70/100+HDPE);
• HDPEd (70/100+HDPE);
• EVAw (70/100+EVA);
• EVAd (70/100+EVA);
• CONV (35/50).
In order to reduce any possible risk of instability of the polymer-
bitumen blends, the asphalt mixtures produced with the WET process
were manufactured immediately after binder production, with the tradi-
tional hot-mixing process. For the mixture produced with the DRY pro-
cess, the polymer additive was directly added to the aggregate during the
mixing process (see Figure 2.5). In accordance with the EN 12697-35
standard, the target mixing temperature for the control mixture with
35/50 pen grade bitumen was set equal to T = 165°C. For mixtures with
modified binders, it was necessary to select a different temperature that
would result in a similar viscosity. Thus, based on the results given in
Tables 2.3 and 2.4 a temperature higher than 180°C would be necessary,
but a mixing temperature of 180°C was selected in order to avoid any
premature ageing of the base binder (70/110 pen). All these issues were
taken into account in order to assure similar production/compaction con-
ditions for the different mixtures.
Fig. 2.5 Addition of the additive: in the mixing (DRY process, on the left), into the bi-
tumen (WET process, on the right)
The formulation test was the Marshall test with 3 different bitumen
contents and CE equal to 75 (Compaction Effort is the number of blows
per face during the production of specimens).
The following tests were carried out on optimized mixtures:
• water sensitivity test;

Chapter 2 35 Case 1
• rutting resistance test with wheel tracker machine (Wheel Tracking
Test - WTT);
• dynamic test for complex stiffness modulus determination (Four
Point Bending configuration - 4PB);
• dynamic test for fatigue resistance determination (Four Point Bend-
ing configuration- 4PB).
2.3.1 Mix design
A formulation test was carried out only on the mixtures produced with
the WET process in order to choose a suitable bitumen content for the
grading curve adopted (mix design).
The mix design was performed by the Marshall Method, according to
the EN 12697-34 standard and using three bitumen contents (b’1 = 4.5%,
b’2 = 5%, b’3 = 5.5%, by mass of aggregates). Three specimens were
used for each bitumen content. The results are reported in Tables 2.5-
2.10 and Figures 2.6-2.12.
Specimen
Bitumen
content
b’
(%)
Marshall
Stability
(KN)
Marshall
Stability
correct
SM
(KN)
Deformation
D
(mm)
Shear De-
formation
Dt
(mm)
Marshall
Ratio
R
(KN/mm)
451 EVA
4.50
13.58 14.41 4.10 2.76 3.52
452 EVA 12.09 12.80 3.90 2.89 3.28
453 EVA 13.65 14.44 3.82 2.54 3.78
Average 4.50 13.11 13.89 3.94 2.73 3.53
501 EVA
5.00
14.41 15.74 3.93 2.74 4.00
502 EVA 14.55 15.89 4.57 3.03 3.48
503 EVA 13.99 14.81 4.05 2.95 3.65
Average 5.00 14.32 15.48 4.18 2.91 3.71
551 EVA
5.50
12.18 13.23 4.58 3.11 2.89
552 EVA 12.93 13.65 4.25 2.74 3.21
553 EVA 12.44 13.72 4.86 3.28 2.82
Average 5.50 12.52 13.53 4.56 3.04 2.97
Tab. 2.5 Marshall test results for the mixture with EVA (mechanical characteristics)

36 Mauro Ranieri Asphalt mixtures improved with plastic additives: mix design and case study in an airport
Specimen
Bitumen
content
b’
(%)
Apparent
specific
gravity
γ
(g/cm3)
Maximum
specific
gravity
BMT
(g/cm3)
Porosity
n
(%)
Vb
(%)
Vge
(%)
VMA
(%)
VFB
(%)
451 EVA
4.50
2.40
4.3 9.7 86.0 14.0 69.1
452 EVA 2.39
4.8 9.6 85.6 14.4 66.9
453 EVA 2.39
4.5 9.7 85.9 14.1 68.5
Average 4.50 2.39 2.51 4.5 9.7 85.8 14.2 68.1
501 EVA
5.00
2.41
3.1 10.8 86.1 13.9 77.9
502 EVA 2.41
2.9 10.8 86.3 13.7 78.8
503 EVA 2.41
2.9 10.8 86.3 13.7 78.7
Average 5.00 2.41 2.49 3.0 10.8 86.2 13.8 78.5
551 EVA
5.50
2.42
2.0 11.9 86.2 13.8 85.9
552 EVA 2.42
1.9 11.9 86.2 13.8 86.3
553 EVA 2.42
2.0 11.9 86.1 13.9 85.6
Average 5.50 2.42 2.47 1.9 11.9 86.2 13.8 85.9
Tab. 2.6 Marshall test results for the mixture with EVA (physical characteristics)
Specimen
Bitumen
content
b’
(%)
Marshall
Stability
(KN)
Marshall
Stability
correct
SM
(KN)
Deformation
D
(mm)
Shear De-
formation
Dt
(mm)
Marshall
Ratio
R
(KN/mm)
451 HDPE
4.50
13.22 13.36 4.34 3.10 3.07
452 HDPE 14.80 15.50 3.89 2.45 3.98
453 HDPE 13.30 14.15 3.25 1.85 4.36
Average 4.50 13.77 14.34 3.83 2.47 3.81
501 HDPE
5.00
14.27 15.26 4.36 2.79 3.50
502 HDPE 14.17 14.62 3.99 2.54 3.66
503 HDPE 14.40 14.93 4.07 2.78 3.67
Average 5.00 14.28 14.93 4.14 2.70 3.61
551 HDPE
5.50
15.36 16.30 4.41 2.91 3.69
552 HDPE 14.78 15.24 4.37 2.66 3.48
553 HDPE 14.71 16.06 4.22 2.70 3.80
Average 5.50 14.95 15.87 4.34 2.76 3.66
Tab. 2.7 Marshall test results for the mixture with HDPE (mechanical characteristics)

Chapter 2 37 Case 1
Specimen
Bitumen
content
b’
(%)
Apparent
specific
gravity
γ
(g/cm3)
Maximum
specific
gravity
BMT
(g/cm3)
Porosity
n
(%)
Vb
(%)
Vge
(%)
VMA
(%)
VFB
(%)
451 HDPE
4.50
2.39
4.3 9.7 86.0 14.0 69.5
452 HDPE 2.38
4.3 9.7 86.0 14.0 69.1
453 HDPE 2.38
4.3 9.7 86.0 14.0 69.2
Average 4.50 2.38 2.49 4.3 9.7 86.0 14.0 69.3
501 HDPE
5.00
2.39
3.9 10.7 85.4 14.6 73.3
502 HDPE 2.39
4.1 10.7 85.2 14.8 72.2
503 HDPE 2.40
3.7 10.7 85.6 14.4 74.1
Average 5.00 2.39 2.49 3.9 10.7 85.4 14.6 73.2
551 HDPE
5.50
2.40
2.1 11.8 86.0 14.0 84.7
552 HDPE 2.40
2.2 11.8 86.0 14.0 84.6
553 HDPE 2.40
2.1 11.9 86.1 13.9 85.0
Average 5.50 2.40 2.45 2.1 11.9 86.0 14.0 84.8
Tab. 2.8 Marshall test results for the mixture with HDPE (physical characteristics)
Specimen
Bitumen
content
b’
(%)
Marshall
Stability
(KN)
Marshall
Stability
correct
SM
(KN)
Deformation
D
(mm)
Shear De-
formation
Dt
(mm)
Marshall
Ratio
R
(KN/mm)
451 CONV
4.50
16.70 17.86 3.53 2.43 5.07
452 CONV 16.25 16.93 4.10 2.88 4.13
453 CONV 16.48 16.87 3.97 2.83 4.25
Average 4.50 16.48 17.22 3.86 2.71 4.48
501 CONV
5.00
16.07 16.62 3.70 2.35 4.49
502 CONV 16.76 16.98 4.10 2.78 4.14
503 CONV 16.66 17.27 3.94 2.74 4.39
Average 5.00 16.50 16.96 3.91 2.62 4.34
551 CONV
5.50
13.98 15.02 4.05 2.48 3.71
552 CONV 14.99 15.78 4.26 3.12 3.71
553 CONV 16.83 17.91 4.21 2.68 4.26
Average 5.50 15.26 16.24 4.17 2.76 3.89
Tab. 2.9 Marshall test results for the conventional mixture (mechanical characteristics)
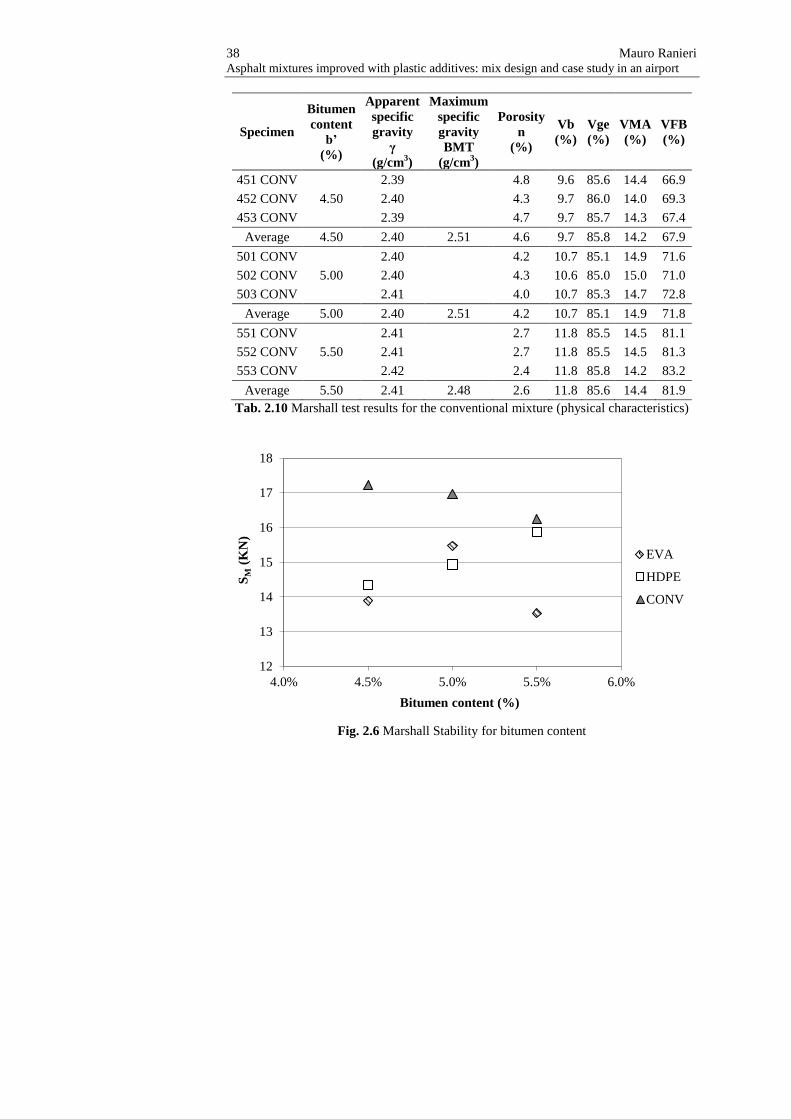
38 Mauro Ranieri Asphalt mixtures improved with plastic additives: mix design and case study in an airport
Specimen
Bitumen
content
b’
(%)
Apparent
specific
gravity
γ
(g/cm3)
Maximum
specific
gravity
BMT
(g/cm3)
Porosity
n
(%)
Vb
(%)
Vge
(%)
VMA
(%)
VFB
(%)
451 CONV
4.50
2.39
4.8 9.6 85.6 14.4 66.9
452 CONV 2.40
4.3 9.7 86.0 14.0 69.3
453 CONV 2.39
4.7 9.7 85.7 14.3 67.4
Average 4.50 2.40 2.51 4.6 9.7 85.8 14.2 67.9
501 CONV
5.00
2.40
4.2 10.7 85.1 14.9 71.6
502 CONV 2.40
4.3 10.6 85.0 15.0 71.0
503 CONV 2.41
4.0 10.7 85.3 14.7 72.8
Average 5.00 2.40 2.51 4.2 10.7 85.1 14.9 71.8
551 CONV
5.50
2.41
2.7 11.8 85.5 14.5 81.1
552 CONV 2.41
2.7 11.8 85.5 14.5 81.3
553 CONV 2.42
2.4 11.8 85.8 14.2 83.2
Average 5.50 2.41 2.48 2.6 11.8 85.6 14.4 81.9
Tab. 2.10 Marshall test results for the conventional mixture (physical characteristics)
Fig. 2.6 Marshall Stability for bitumen content
12
13
14
15
16
17
18
4.0% 4.5% 5.0% 5.5% 6.0%
SM
(K
N)
Bitumen content (%)
EVA
HDPE
CONV
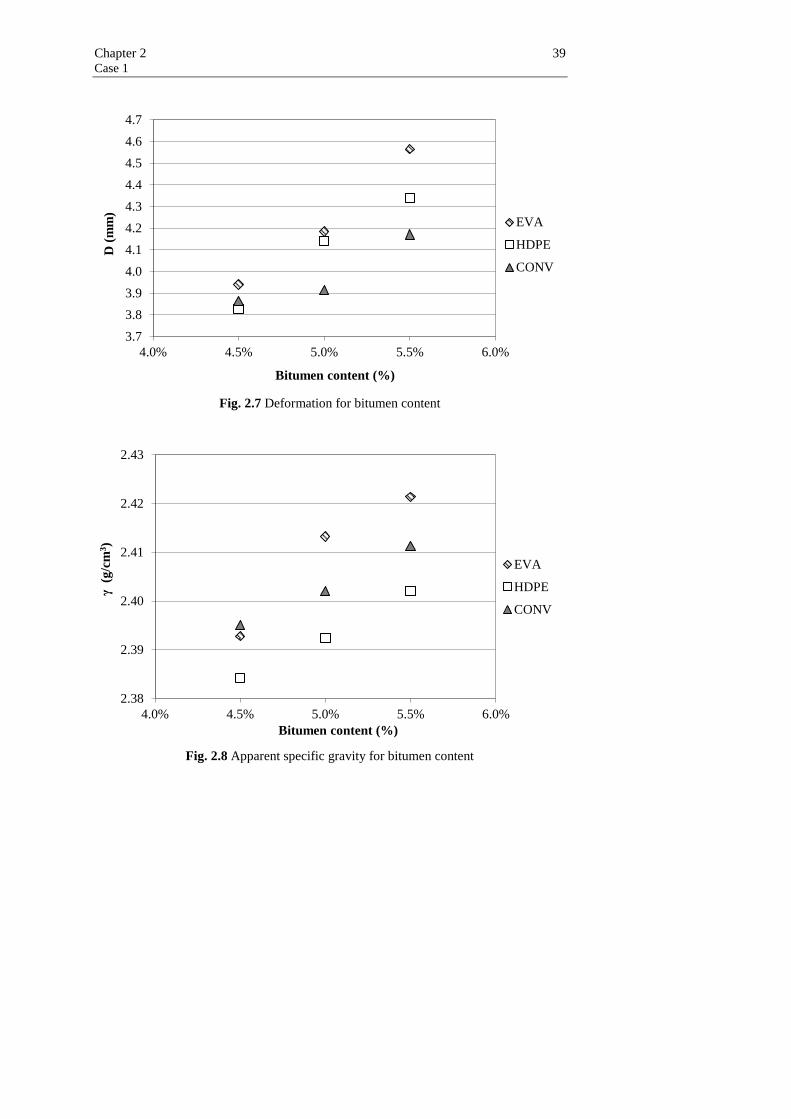
Chapter 2 39 Case 1
Fig. 2.7 Deformation for bitumen content
Fig. 2.8 Apparent specific gravity for bitumen content
3.7
3.8
3.9
4.0
4.1
4.2
4.3
4.4
4.5
4.6
4.7
4.0% 4.5% 5.0% 5.5% 6.0%
D (
mm
)
Bitumen content (%)
EVA
HDPE
CONV
2.38
2.39
2.40
2.41
2.42
2.43
4.0% 4.5% 5.0% 5.5% 6.0%
γ
(g/c
m3)
Bitumen content (%)
EVA
HDPE
CONV
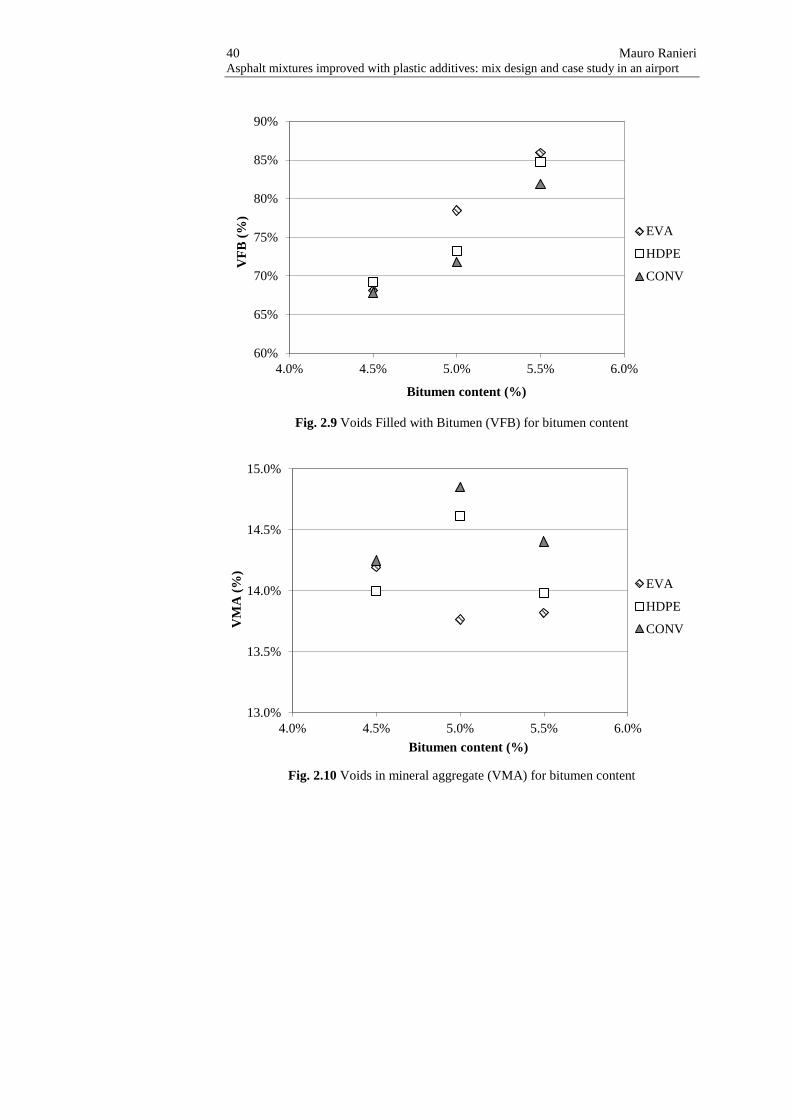
40 Mauro Ranieri Asphalt mixtures improved with plastic additives: mix design and case study in an airport
Fig. 2.9 Voids Filled with Bitumen (VFB) for bitumen content
Fig. 2.10 Voids in mineral aggregate (VMA) for bitumen content
60%
65%
70%
75%
80%
85%
90%
4.0% 4.5% 5.0% 5.5% 6.0%
VF
B (
%)
Bitumen content (%)
EVA
HDPE
CONV
13.0%
13.5%
14.0%
14.5%
15.0%
4.0% 4.5% 5.0% 5.5% 6.0%
VM
A (
%)
Bitumen content (%)
EVA
HDPE
CONV
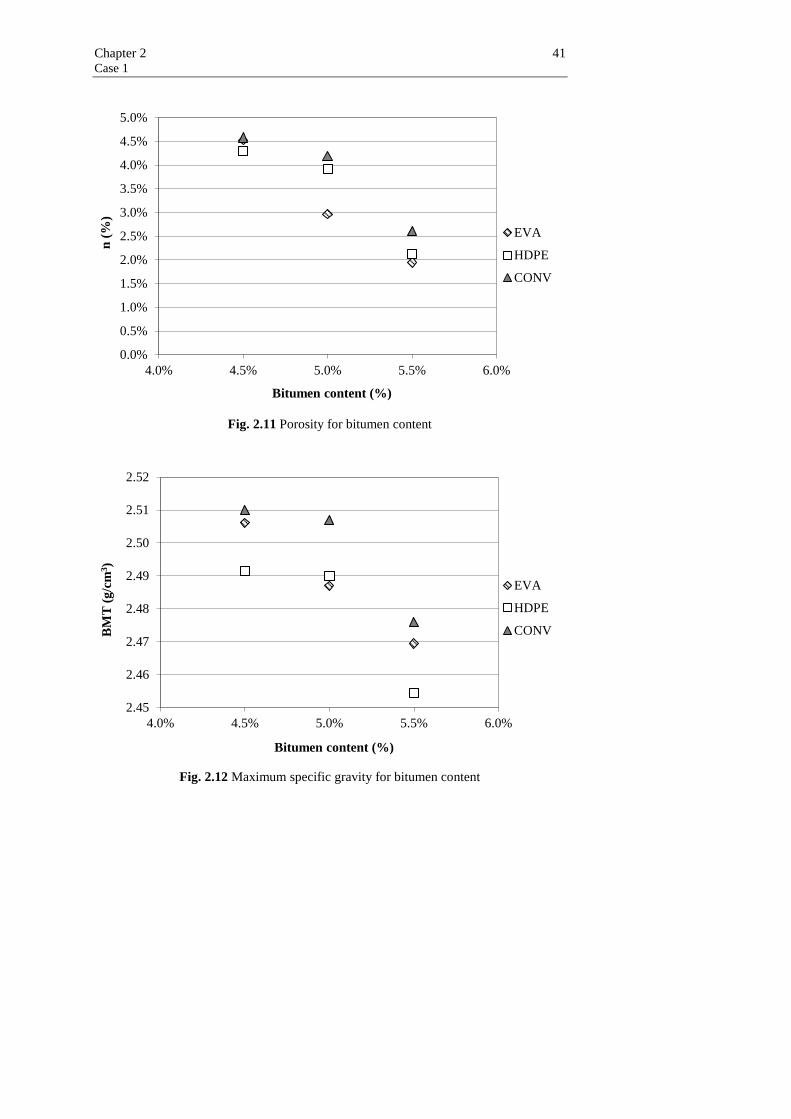
Chapter 2 41 Case 1
Fig. 2.11 Porosity for bitumen content
Fig. 2.12 Maximum specific gravity for bitumen content
0.0%
0.5%
1.0%
1.5%
2.0%
2.5%
3.0%
3.5%
4.0%
4.5%
5.0%
4.0% 4.5% 5.0% 5.5% 6.0%
n (
%)
Bitumen content (%)
EVA
HDPE
CONV
2.45
2.46
2.47
2.48
2.49
2.50
2.51
2.52
4.0% 4.5% 5.0% 5.5% 6.0%
BM
T (
g/c
m3)
Bitumen content (%)
EVA
HDPE
CONV

42 Mauro Ranieri Asphalt mixtures improved with plastic additives: mix design and case study in an airport
For these mixtures the requirements are as follows (EP, 2014):
• Marshall Stability SM = 7.5÷15 KN;
• deformation D = 2÷4 mm;
• Marshall Ratio R > 3 KN/mm;
• voids in mineral aggregate VMA > 14%;
• porosity n = 3÷5%.
Based on the results, a bitumen content of 5% was suitable for production
of optimized mixtures, that is 5% binder content (4.75% bitumen and
0.25% polymer) and 95% aggregate content, by mass of total mixture,
were obtained for the optimized mixture produced with the WET process.
In order to avoid adding more variables into the study, the same binder
content was used for the mixture produced with the DRY process.
2.3.2 Water sensitivity
The mixtures studied were tested for water sensitivity according to the
EN 12697-12 standard. This test comprised assessment of the indirect
tensile strength (ITS), carried out according to EN 12697-23, of two
identical groups of three specimens conditioned in different environ-
ments (dry and wet with the application of vacuum). In that period, one
group was kept dry and the other was immersed in water, in order to de-
termine the influence of water on the weakening of the bond between ag-
gregates and binder and, consequently, on the strength of the mixture.
The test procedure also included evaluation of the indirect tensile
strength ratio (ITSR) between the average results for both groups of spec-
imens, in order to assess the water sensitivity of the mixture, as reported
in Equation (2.1).
ITSR = (ITSw
ITSd) × 100 (2.1)
where “ ITSw ” is the average ITS of the wet group of specimens while “
ITSd ” is the average ITS of the dry group of specimens. The higher the
ITSR, the lower the loss of mechanical resistance due to water action,
which is typically selected as the acceptance criterion for control of the
construction (Praticò, 2007).
This property was evaluated by subjecting specimens produced with a
Marshall impact compactor to indirect tensile tests. The average results

Chapter 2 43 Case 1
obtained from each group of three wet and dry specimens are reported in
Figure 2.13.
Fig. 2.13 Water sensitivity tests results (ITSR; air void content)
Regarding the effect of water on mechanical performance, the ITSR
values were generally close to 75%, which means that these mixtures can
be considered to have low water sensitivity. These good results were ob-
tained for all mixtures and thus the mixtures with polymers offered per-
formance that is comparable to that of the control mixture, produced with
a harder bitumen. Further, given the repeatability of the test results, their
dispersion is such that the performance can be considered almost homo-
geneous.
It is also possible to observe that all mixtures presented similar volu-
metric properties in terms of air void content. The exception was the
HDPEw mixture, which presented a slightly higher air void content as a
result of the higher viscosity of the modified binder used in that mixture.
Moreover, regarding the effect of the production process, the mixtures
produced with the DRY process offered better water sensitivity results
compared to the mixtures produced with the WET process (the mixture
produced with the WET process containing HDPE presented the lowest
ITSR value, 65%, probably due to the abovementioned higher viscosity
of this polymer-modified binder in association with the higher fusion en-
thalpy of HDPE). With regards to the effect of the polymer additives, in
0
2
4
6
50
55
60
65
70
75
80
HDPEd EVAd HDPEw EVAw CONV
Air
vo
id c
on
ten
t (%
)
ITS
R (
%)
ITSR (%) Air voids (%)

44 Mauro Ranieri Asphalt mixtures improved with plastic additives: mix design and case study in an airport
general mixtures with EVA proved to have better performance compared
to that of mixtures with HDPE.
In order to detail the reliability of the estimation procedure for these
results, Figure 2.14 also shows the error bars, based on the mean µ and
standard deviation σ of indirect tensile strength values of dry specimens,
associated with a 95% confidence level.
First, it was noticed that, for all the mixtures studied, the ITSd values
were much higher than the typical minimum range values (700-1350
KPa) required for surface courses (MIT, 2002). It was also observed that
in all cases, the polymer-modified mixtures presented lower ITS values
than the conventional mixture. This reduction, on average 33%, may be
explained by the use of a much softer base bitumen in the polymer-
modified binders. The higher dispersion phase in the colloidal system of
this softer bitumen may not be sufficiently balanced by the introduction
of polymers in the binder molecular structure, at least regarding its be-
haviour at the temperature used in this test (15°C), even though the per-
formance at higher temperatures is clearly satisfactory.
Fig. 2.14 Average indirect tensile strength, ITSd, of dry specimens
2337 2522
2428 2484
3606
2079 2064 2091 2198
3223
500
1000
1500
2000
2500
3000
3500
4000
HDPEd EVAd HDPEw EVAw CONV
ITS
d (
KP
a)
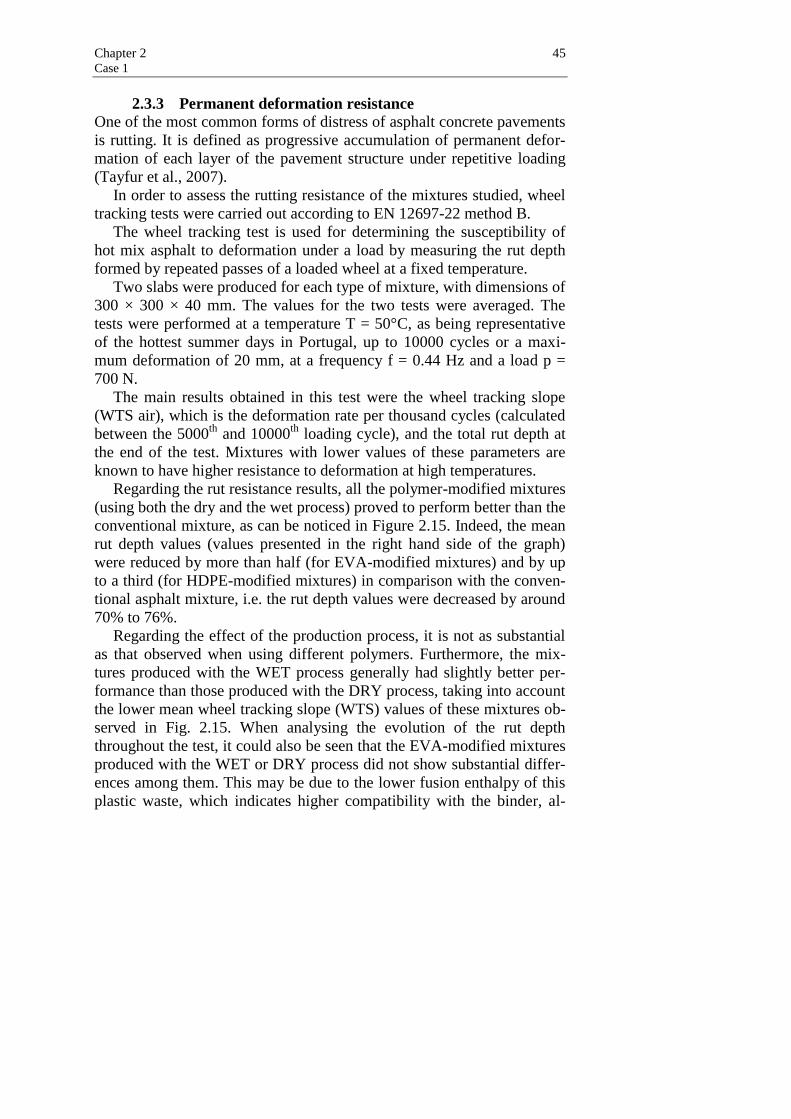
Chapter 2 45 Case 1
2.3.3 Permanent deformation resistance
One of the most common forms of distress of asphalt concrete pavements
is rutting. It is defined as progressive accumulation of permanent defor-
mation of each layer of the pavement structure under repetitive loading
(Tayfur et al., 2007).
In order to assess the rutting resistance of the mixtures studied, wheel
tracking tests were carried out according to EN 12697-22 method B.
The wheel tracking test is used for determining the susceptibility of
hot mix asphalt to deformation under a load by measuring the rut depth
formed by repeated passes of a loaded wheel at a fixed temperature.
Two slabs were produced for each type of mixture, with dimensions of
300 × 300 × 40 mm. The values for the two tests were averaged. The
tests were performed at a temperature T = 50°C, as being representative
of the hottest summer days in Portugal, up to 10000 cycles or a maxi-
mum deformation of 20 mm, at a frequency f = 0.44 Hz and a load p =
700 N.
The main results obtained in this test were the wheel tracking slope
(WTS air), which is the deformation rate per thousand cycles (calculated
between the 5000th
and 10000th
loading cycle), and the total rut depth at
the end of the test. Mixtures with lower values of these parameters are
known to have higher resistance to deformation at high temperatures.
Regarding the rut resistance results, all the polymer-modified mixtures
(using both the dry and the wet process) proved to perform better than the
conventional mixture, as can be noticed in Figure 2.15. Indeed, the mean
rut depth values (values presented in the right hand side of the graph)
were reduced by more than half (for EVA-modified mixtures) and by up
to a third (for HDPE-modified mixtures) in comparison with the conven-
tional asphalt mixture, i.e. the rut depth values were decreased by around
70% to 76%.
Regarding the effect of the production process, it is not as substantial
as that observed when using different polymers. Furthermore, the mix-
tures produced with the WET process generally had slightly better per-
formance than those produced with the DRY process, taking into account
the lower mean wheel tracking slope (WTS) values of these mixtures ob-
served in Fig. 2.15. When analysing the evolution of the rut depth
throughout the test, it could also be seen that the EVA-modified mixtures
produced with the WET or DRY process did not show substantial differ-
ences among them. This may be due to the lower fusion enthalpy of this
plastic waste, which indicates higher compatibility with the binder, al-

46 Mauro Ranieri Asphalt mixtures improved with plastic additives: mix design and case study in an airport
lowing an adequate interaction between the polymer and the binder even
if this is carried out in shorter periods (as in the DRY mixing process).
Finally, regarding the polymers, the mixtures with HDPE were more
resistant to permanent deformation than those with EVA, which is con-
firmed by both the reduced mean rut depth and the WTS values. This re-
sult is due to the higher stability of the HDPE-modified binder at high
temperatures, as previously observed in the softening point test results
(the HDPE-modified binder showed a TR&B of 67.9 C against the 61.1 C
value of the EVA-modified binder).
Fig. 2.15 Evolution of the permanent deformation of the studied mixtures in the WTT
2.3.4 Stiffness modulus
The stiffness modulus and fatigue cracking resistance of the mixtures
studied were obtained by dynamic tests on prismatic beams taken from
slabs produced by a roller compactor. Among the different possible test-
ing protocols available to assess these properties (Dondi et al., 2013), the
tests were carried out using a four-point bending (4PB) test device im-
posing sinusoidal loading with a constant strain amplitude (strain-
controlled method, see Figure 2.16).
A prismatic beam rests on two smooth bilateral supports that allow the
rotation and translation of the specimen in the direction of the axis. The
load is applied at two points equidistant from the centre with the same in-
tensity (see Figure 2.17). During the test, the beam is held in place by
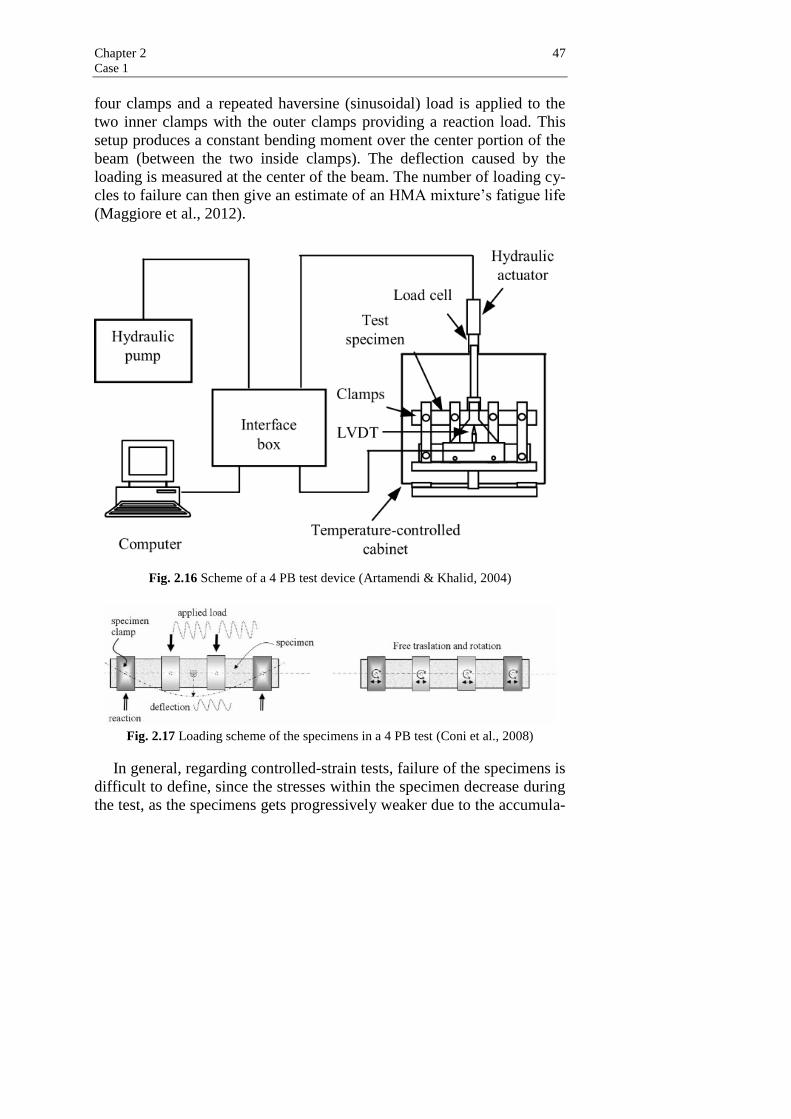
Chapter 2 47 Case 1
four clamps and a repeated haversine (sinusoidal) load is applied to the
two inner clamps with the outer clamps providing a reaction load. This
setup produces a constant bending moment over the center portion of the
beam (between the two inside clamps). The deflection caused by the
loading is measured at the center of the beam. The number of loading cy-
cles to failure can then give an estimate of an HMA mixture’s fatigue life
(Maggiore et al., 2012).
Fig. 2.16 Scheme of a 4 PB test device (Artamendi & Khalid, 2004)
Fig. 2.17 Loading scheme of the specimens in a 4 PB test (Coni et al., 2008)
In general, regarding controlled-strain tests, failure of the specimens is
difficult to define, since the stresses within the specimen decrease during
the test, as the specimens gets progressively weaker due to the accumula-
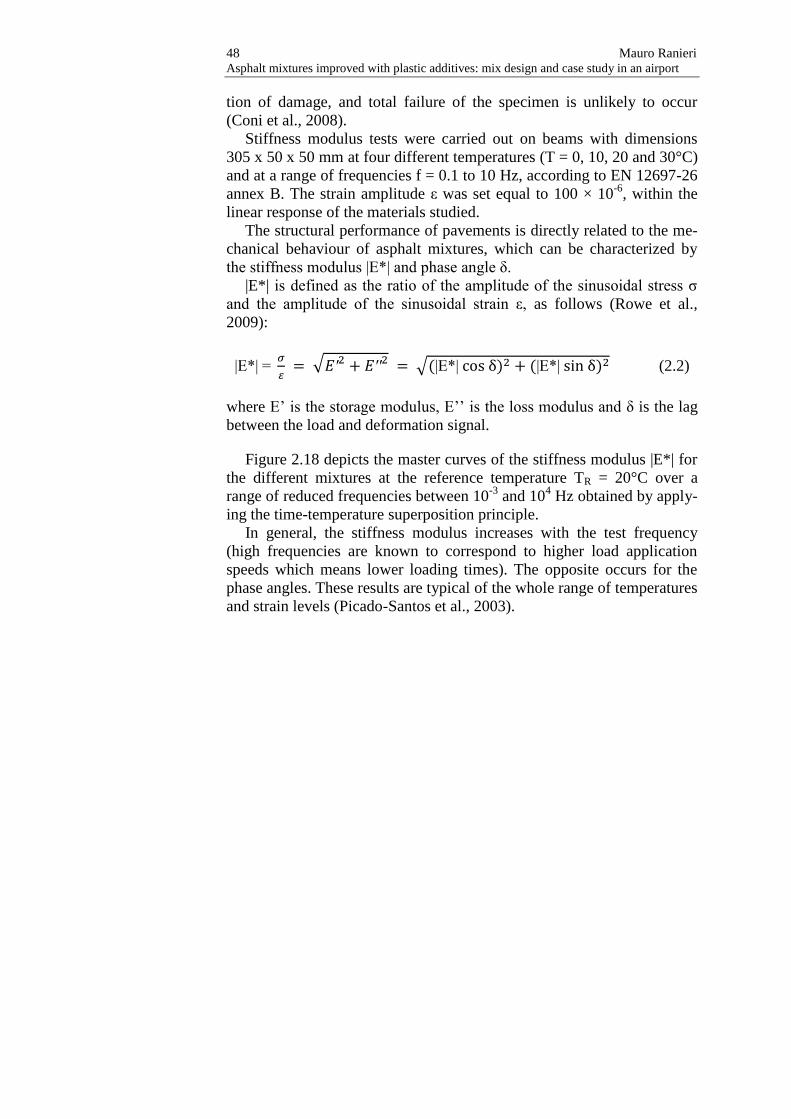
48 Mauro Ranieri Asphalt mixtures improved with plastic additives: mix design and case study in an airport
tion of damage, and total failure of the specimen is unlikely to occur
(Coni et al., 2008).
Stiffness modulus tests were carried out on beams with dimensions
305 x 50 x 50 mm at four different temperatures (T = 0, 10, 20 and 30°C)
and at a range of frequencies f = 0.1 to 10 Hz, according to EN 12697-26
annex B. The strain amplitude ε was set equal to 100 × 10-6
, within the
linear response of the materials studied.
The structural performance of pavements is directly related to the me-
chanical behaviour of asphalt mixtures, which can be characterized by
the stiffness modulus |E*| and phase angle δ.
|E*| is defined as the ratio of the amplitude of the sinusoidal stress σ
and the amplitude of the sinusoidal strain ε, as follows (Rowe et al.,
2009):
|E*| = 𝜎
𝜀 = √𝐸′2 + 𝐸′′2 = √(|E*| cos δ)2 + (|E*| sin δ)2 (2.2)
where E’ is the storage modulus, E’’ is the loss modulus and δ is the lag
between the load and deformation signal.
Figure 2.18 depicts the master curves of the stiffness modulus |E*| for
the different mixtures at the reference temperature TR = 20°C over a
range of reduced frequencies between 10-3
and 104 Hz obtained by apply-
ing the time-temperature superposition principle.
In general, the stiffness modulus increases with the test frequency
(high frequencies are known to correspond to higher load application
speeds which means lower loading times). The opposite occurs for the
phase angles. These results are typical of the whole range of temperatures
and strain levels (Picado-Santos et al., 2003).

Chapter 2 49 Case 1
Fig. 2.18 Stiffness modulus and phase angle master curves of the mixtures studied
Regarding the effect of introducing different polymer/plastic wastes
on the stiffness modulus of the asphalt mixtures, it can be seen that the
values were similar for the different mixtures studied.
1E+02
1E+03
1E+04
0.001 0.01 0.1 1 10 100 1000 10000
|E
*| (M
Pa
)
EVAd
EVAw
HDPEd
HDPEw
CONV
TR = 20°C
0
10
20
30
40
50
0.001 0.01 0.1 1 10 100 1000 10000
Ph
ase
An
gle
(d
eg)
αT x f (Hz)
EVAd
EVAw
HDPEd
HDPEw
CONV
TR = 20°C
50 Mauro Ranieri Asphalt mixtures improved with plastic additives: mix design and case study in an airport
Comparing the results for the polymer-modified mixtures with those
for the conventional mixture, it can be observed that they had higher
stiffness modulus values at low frequencies (or high temperatures) and
lower stiffness modulus values at high frequencies (or low temperatures).
A similar crossing trend can be observed from the master curves of the
phase angle, even though higher stiffness values correspond to lower
phase angle values. Thus, the influence of the addition of polymers can
be clearly observed in both graphs presented in Fig. 2.18. At high tem-
peratures (low frequencies) the stiffness is higher and the elastic compo-
nent is larger in the modified mixtures due to the presence of a stabler
molecular structure provided by the polymer. Moreover, at lower temper-
atures the lower stiffness values of the modified mixtures are provided by
the behaviour of the softer base bitumen used, as previously explained,
which can result in mixtures with higher flexibility.
In particular, the stiffness modulus values of the mixtures produced
with the DRY process are similar to or slightly higher than those of the
mixtures produced with the WET process. The success of the DRY pro-
cess, already observed during the water sensitivity tests, can be associat-
ed with the use of a very soft base bitumen, which is more capable of
creating effective interactions with both the aggregates and the polymers
when this method is used. Regarding the influence of the polymers, both
presented similar master curves, even though the master curves of the
EVA-modified mixtures showed slightly higher stiffness values, as a
consequence of a better interaction of this polymer with bitumen due to
its lower fusion temperature.
2.3.5 Fatigue cracking
Fatigue is an important failure mode of pavement structures. Consequent-
ly, a correct description of this phenomenon is of great importance. Bi-
tuminous materials in roads are subjected to short-term loading each time
a vehicle passes. If sufficiently high, the loading results in a loss of ri-
gidity of the material and can lead to failure by accumulation in the long
term. During fatigue cracking, two phases of the degradation process are
usually considered: initiation and propagation phases. The first phase
corresponds to degradation resulting from damage that is uniformly
spread in the material. Hence, this phase is manifested by the initiation
and propagation of a “ micro-crack ” network (in a diffuse way), which
results in a decrease in the macroscopic rigidity (modulus). In the second
Chapter 2 51 Case 1
phase, from the coalescence of micro-cracks, a “ macro-crack ” appears
which propagates within the material. (Di Benedetto et al., 2004).
Fatigue tests were carried out at T = 20°C at a constant frequency f =
10 Hz, according to EN 12697-24, annex D. The fatigue cracking re-
sistance of the different mixtures was determined by subjecting the spec-
imens to loading procedures analogous to those of the stiffness modulus
tests (strain controlled method), but using higher strain levels (not neces-
sarily within the linear response of the materials studied). In fact, differ-
ent strain levels were applied in order to obtain the fatigue life equation
of the mixtures studied.
The fatigue test results for the mixtures studied made it possible to
obtain the regression lines (Wöhler curves, given by Equation (2.3)),
which relate the strain level applied in the test (ε) with the number of
loading cycles (N). These are based on a classical approach, which as-
sumes that damage to the specimen accumulates during testing until fail-
ure occurs. This is considered to happen when asphalt mixtures stiffness
reduction is 50% of its initial value (Picado-Santos et al., 2009). These
fatigue regression laws are presented in Figure 2.19.
𝜀 = 𝑎 × 𝑁−𝑏 (2.3)
where:
• ε is the strain level applied during the test;
• a is a constant depending on the physical and mechanical
characteristics of the material, test temperature and frequency;
• b is the slope of the fatigue lines;
• N is the number of loading cycles.
Based on these fatigue laws it is possible to obtain some fatigue indica-
tors for the mixtures studied, as summarized in Table 2.11. The determi-
nation coefficient R2 is important for assessing the statistical quality of
the laws obtained. This indicator showed significantly high values for
most of the mixtures studied, although the mixture modified with EVA
using the DRY process showed a slightly lower R2. This could be associ-
ated with a slightly increased difficulty in obtaining totally homogeneous
distribution of the polymer within the mixture in the DRY process.
The parameter ε6 is the admissible strain level at N = 106 loading cy-
cles, being one of the main indicators used to characterize the fatigue re-
sistance of asphalt mixtures in European standards.
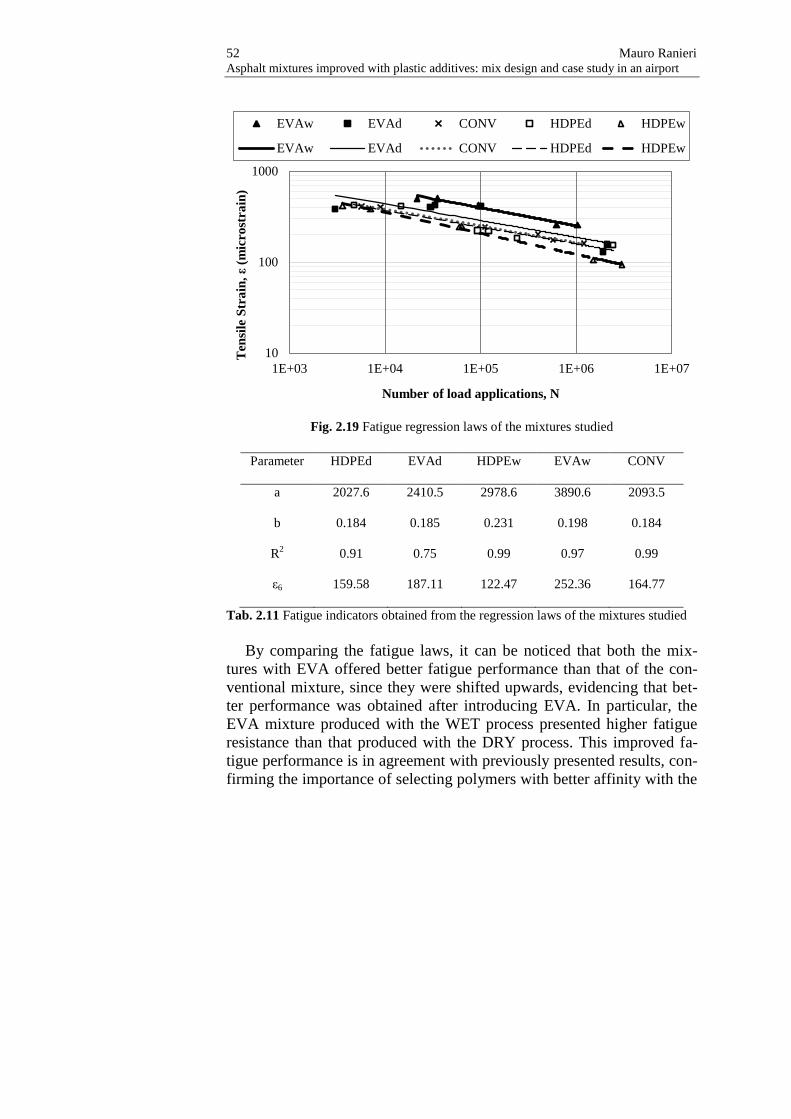
52 Mauro Ranieri Asphalt mixtures improved with plastic additives: mix design and case study in an airport
Fig. 2.19 Fatigue regression laws of the mixtures studied
Parameter HDPEd EVAd HDPEw EVAw CONV
a 2027.6 2410.5 2978.6 3890.6 2093.5
b 0.184 0.185 0.231 0.198 0.184
R2 0.91 0.75 0.99 0.97 0.99
ε6 159.58 187.11 122.47 252.36 164.77
Tab. 2.11 Fatigue indicators obtained from the regression laws of the mixtures studied
By comparing the fatigue laws, it can be noticed that both the mix-
tures with EVA offered better fatigue performance than that of the con-
ventional mixture, since they were shifted upwards, evidencing that bet-
ter performance was obtained after introducing EVA. In particular, the
EVA mixture produced with the WET process presented higher fatigue
resistance than that produced with the DRY process. This improved fa-
tigue performance is in agreement with previously presented results, con-
firming the importance of selecting polymers with better affinity with the
10
100
1000
1E+03 1E+04 1E+05 1E+06 1E+07
Ten
sile
Str
ain
, ε
(mic
rost
rain
)
Number of load applications, N
EVAw EVAd CONV HDPEd HDPEw
EVAw EVAd CONV HDPEd HDPEw

Chapter 2 53 Case 1
bitumen and highlighting the advantage of using waste EVA polymers in
asphalt mixture modification.
On the other hand, the mixtures with HDPE did not show the same
improved fatigue cracking performance. Indeed, although the mixture
produced with the DRY process offered similar performance to that of
the conventional mixture, the HDPE mixture produced with the WET
process was the mixture with the worst fatigue performance of all those
evaluated experimentally in this study. It must be noted that when using
the DRY process, the interaction between the base binder and HDPE can
be lower than that obtained when using the WET process, resulting in a
more flexible binder, which can explain the better fatigue performance.
In any case, all admissible strain values ε6 (>130 μstrain) can be con-
sidered satisfactory for road paving applications, showing that both pol-
ymers and both incorporation processes are viable solutions.
2.4 Conclusions This experimental study led to important conclusions from a comparison
between two different processes (WET and DRY) used for production of
modified asphalt mixtures with waste polymers.
When comparing the performance of polymer-modified asphalt mix-
tures with a conventional mixture, it was concluded that the ones with
polymers are able to offer similar or better performance in terms of water
sensitivity. Also regarding the stiffness modulus, the addition of poly-
mers generally results in beneficial behaviour since it slightly increases
stiffness at high temperatures and reduces stiffness at low temperatures.
This is also valid for rutting resistance (the rut depth values were re-
duced by more than half for EVA-modified mixtures and by up to a third
for HDPE-modified mixtures); in terms of fatigue resistance, mixtures
produced with HDPE had similar or slightly worse performance than the
conventional mixture, while mixtures with EVA showed significant im-
provement.
When comparing the effect of the DRY vs. WET mixing processes on
mixture performance, on the one hand it was concluded that all mixtures
were volumetrically equivalent and showed similar performance regard-
ing both stiffness modulus and water sensitivity, except the HDPEw mix-
ture, which showed poorer water sensitivity (probably because this mix-
ture presented a slightly higher air void content, as a consequence of the
higher viscosity of the modified binder); on the other hand, the WET
process seemed to have a slightly better effect on the mixtures’ rutting
54 Mauro Ranieri Asphalt mixtures improved with plastic additives: mix design and case study in an airport
resistance and on the fatigue cracking resistance of the EVA-modified
mixture. The soft-base bitumen selected for production of all polymer-
modified mixtures may have been a key factor to obtain very good per-
formance in those solutions, since it allowed a better interaction with
polymers and aggregates, in both the WET and in the DRY processes.
This study presents a series of innovative approaches and results when
studying asphalt mixture modification. In particular, waste polymers
were successfully used instead of virgin polymers; the DRY process of
incorporation showed interesting performance, in comparison to the tra-
ditional WET process, mainly due to the use of a soft-base bitumen; the
importance of selecting appropriate polymers was highlighted, since
EVA generally presented better performance, due to its better interaction
with bitumen; however, waste HDPE can be an interesting alternative
when rutting resistance is the main performance concern or when its
higher availability may dominate the decision criteria.
As a final remark, it can be mentioned that the WET process requires
modification of the binder with specific equipment for blending bitumen
and polymers at high temperatures, while no modification is needed for
the DRY process. Therefore, the DRY process can become a good alter-
native to the usual binder polymer modification, since it can be easier and
cheaper to implement, and results in mixtures with similar performance
to those produced with the WET process. This could be particularly im-
portant for developing countries, since it widens the possibility of using
locally available bitumens (of variable quality) and asphalt plants for
producing mixtures with higher performance.
Chapter 3
Case 2
3.1 General Case 2 is an experimental study concerning the development and optimi-
zation (mix design) of special asphalt mixtures for binder and base cours-
es, also with additives specifically engineered.
The focus was on the optimization of the mixtures making use of or-
dinary aggregate and bitumen (as locally available) instead of the very
hard bitumen typically prescribed, also aiming to improve the traditional
mixture as made possible by suitable polymers.
For this purpose, the mixtures were subjected not only to conventional
tests for mix design purposes, such as the Marshall test and the gyratory
compactor test, but advanced tests for performance evaluation such as
rutting resistance and fatigue resistance were investigated via small-scale
testing with a wheel-tracking machine and four-point bending tests re-
spectively. The dynamic modulus was also evaluated by triaxial cell tests
at the University of Palermo’s Road Materials Laboratory.
The test results allowed important conclusions about the use of addi-
tives for these mixtures. In particular, mixtures with additives had better
performance than ones without additives regarding permanent defor-
mation resistance and more or less the same performance in terms of
stiffness modulus. Moreover, the presence of additives allows the use of
less hard bitumens (more easily available in Italy) than those typically
used for these special formulations.
3.2 Materials The special asphalt mixtures that are the object of this study are known in
the technical literature as EME (enrobés à module élevé), that is, as al-

56 Mauro Ranieri Asphalt mixtures improved with plastic additives: mix design and case study in an airport
ready mentioned in the first chapter, high-modulus asphalt mixtures, with
good performance both in terms of stability and durability.
The materials used to produce these mixtures will now be presented.
3.2.1 Aggregates
For the production of these mixtures it appeared appropriate to refer to
aggregates with a diameter between 0 and 16 mm, a suitable range for
binder and base courses. The aggregates used in the mixtures were
crushed limestone from a quarry, whose composition and physical and
mechanical properties are given respectively in Table 3.1 and Table 3.2.
Sieve (mm)
Passing (%)
Fractions
a2 (20/25) a3 (10/15) a4 (6/10) a5 (0/6) filler
32 100 100 100 100 100
24 100 100 100 100 100
20 94.73 100 100 100 100
12 18.33 99.96 100 100 100
8 0.77 85.67 99.91 99.70 100
4 0.51 38.3 72.62 97.78 100
2 0.49 15.66 41.54 70.60 100
0.4 0.44 6.62 16.84 26.09 99.31
0.18 0.41 5.28 11.21 17.19 93.78
0.075 0.33 4.01 6.42 10.57 74.25
Tab. 3.1 Composition of the aggregates’ available fractions
Characteristics Fractions
a2 a3 a4 a5 filler
Bulk specific weight, g/cm3
(EN 1097-7) 2.85
Apparent specific weight, g/cm3
(EN 1097-6) 2.82 2.83 2.84 2.85
Los Angeles abrasion, % (EN 1097-2)
22.10 20.19 20.64 20.12
Sand equivalent, % (EN 933-8)
91.38 90.41
Void ratio (CNR 65)
0.80 0.79 0.71 0.73
Absorption coefficient (EN 1097-6)
0.64 0.51
Tab. 3.2 Physical and mechanical characteristics of the available aggregates

Chapter 3 57 Case 2
The typical dense graded high-modulus asphalt was obtained for the
composition of the fractions provided by implantation and by appropriate
sub-fractions (see Figure 3.1).
Fig. 3.1 Mix grading curve
The mixture of aggregates was then subjected to the pycnometer method
for determination of the real specific weight and the value was 2.842
g/cm3, according to the EN 1097-3:1999 standard.
3.2.2 Bitumens
The bitumens used in this research were neat bitumen 50/70 (more easily
available in contexts such as in Italy) and near bitumen 35/50; their char-
acteristics are reported in Tables 3.3-3.4.
A dynamic mechanical analysis of these binders was conducted with a
dynamic shear rheometer (DSR), making it possible to obtain the rheo-
logical properties in terms of complex modulus │G*│ and phase angle δ
for a reference temperature of 30°C, as shown in Figure 3.2. These were
obtained by frequency sweep tests, carried out in strain-controlled mode
over a wide range of temperatures, according to the EN 14770 standard.
The tests were carried out using parallel plate geometry, by applying
strain amplitudes carefully checked to be within the LVE response of the
0
10
20
30
40
50
60
70
80
90
100
0.01 0.1 1 10 100
Pa
ssin
g (
%)
Sieve size (mm)
Mix grading curve Upper limit Lower limit

58 Mauro Ranieri Asphalt mixtures improved with plastic additives: mix design and case study in an airport
material. The testing temperature ranged from -10°C to 80°C, while the
testing frequency ranged from 0.1 to 10 Hz.
Characteristic Unit Value Standard
Specific weight at 25°C g/cm3 1.033 EN 3838
Penetration at 25°C dmm 68 EN 1426 Ring and Ball Softening Point °C 50.5 EN 1427
Penetration Index -0.21 EN 12591 Fraass Temperature °C -12 EN 12593
Ductility at 25°C cm > 100 ASTM D113
Viscosity at 60 °C Pa∙s 255.5 EN 13302 Viscosity at 100 °C Pa∙s 3.917 EN 13302
Viscosity at 135 °C Pa∙s 0.435 EN 13302 Viscosity at 150 °C Pa∙s 0.222 EN 13302 Mixing temperature
(η = 0.17 Pa∙s) °C 155 EN 13302
Compaction temperature (η = 0.28 Pa∙s)
°C 145 EN 13302
After RTFOT:
Change in mass % 0.19 EN 12607-1
Penetration at 25°C dmm 44 EN 1426 Ring and Ball Softening Point °C 64.5 EN 1427
Viscosity at 60 °C Pa∙s 668 EN 13302
Tab. 3.3 Characteristics of 50/70 pen grade bitumen
Characteristic Unit Value Standard
Specific weight at 25°C g/cm3 1.033 EN 3838
Penetration at 25°C dmm 35 EN 1426 Ring and Ball Softening Point °C 56 EN 1427
Viscosity at 60 °C Pa∙s 224 EN 13302
Viscosity at 100 °C Pa∙s 9.88 EN 13302 Viscosity at 130 °C Pa∙s 1.11 EN 13302
Viscosity at 160 °C Pa∙s 0.24 EN 13302 Viscosity at 180 °C Pa∙s 0.11 EN 13302 Mixing temperature
(η = 0.17 Pa∙s) °C 161 EN 13302
Compaction temperature (η = 0.28 Pa∙s)
°C 150 EN 13302
After RTFOT:
Change in mass % 0.062 EN 12607-1
Penetration at 25°C dmm 25 EN 1426 Ring and Ball Softening Point °C 61 EN 1427
Viscosity at 60 °C Pa∙s 417 EN 13302
Tab. 3.4 Characteristics of 35/50 pen grade bitumen
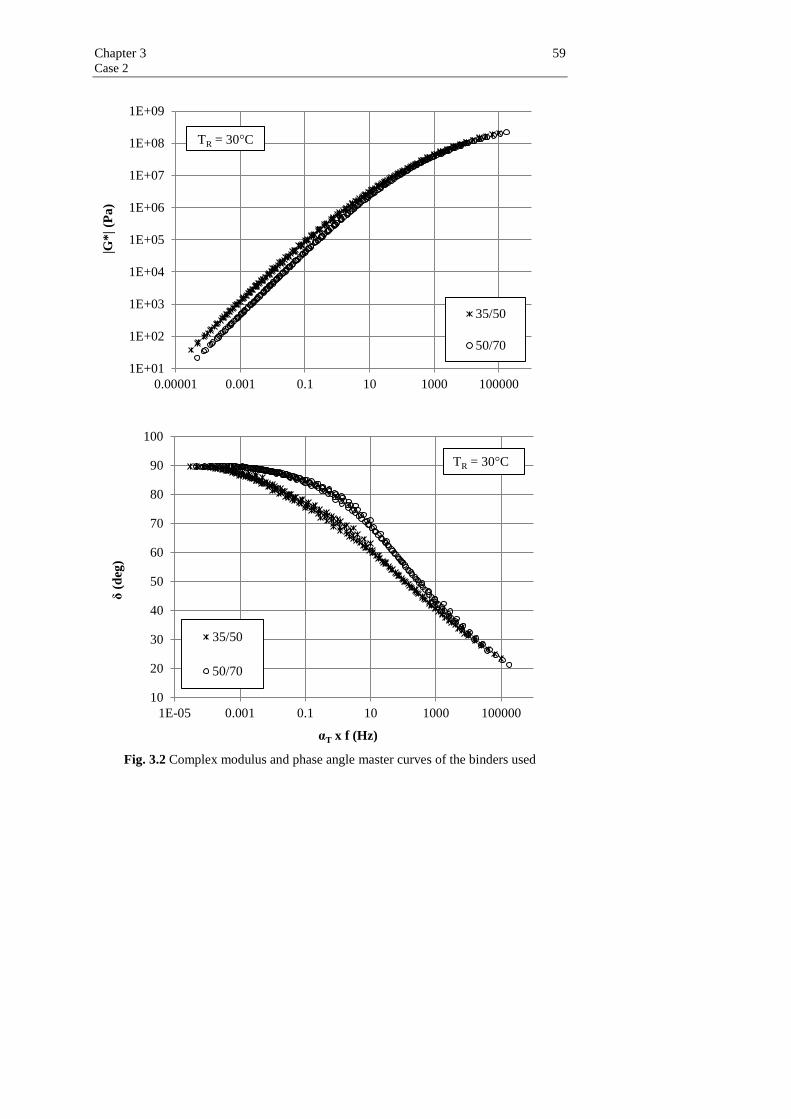
Chapter 3 59 Case 2
Fig. 3.2 Complex modulus and phase angle master curves of the binders used
1E+01
1E+02
1E+03
1E+04
1E+05
1E+06
1E+07
1E+08
1E+09
0.00001 0.001 0.1 10 1000 100000
|G
*| (P
a)
35/50
50/70
TR = 30°C
10
20
30
40
50
60
70
80
90
100
1E-05 0.001 0.1 10 1000 100000
δ (
deg
)
αT x f (Hz)
35/50
50/70
TR = 30°C

60 Mauro Ranieri Asphalt mixtures improved with plastic additives: mix design and case study in an airport
Based on the results given in Fig. 3.2, 35/50 pen grade bitumen is
stiffer and more elastic when compared to 50/70 pen grade bitumen. This
result confirms the advantages of using low penetration grade binders, as
previously mentioned, for high-modulus asphalt mixtures.
3.2.3 Additives
The additives used were a particular polymeric compound of selected
polymers named SuperPlast (SP), a polyfunctional polymeric system
named PPS, both provided by Iterchimica s.r.l., and waste plastics, as
shown in Figure 3.3.
a) b) c)
Fig. 3.3 Additives used in this study: a) SP, b) waste plastics, c) PPS
SP is a compound of low-density polyethylene (LDPE) and ethylene-
vinyl acetate (EVA) as well as others polymers with low molecular
weight and medium melting point, that presents in semi-soft and flexible
granules. It was not designed for modification of bitumen, but rather to
improve the mechanical performance and durability of asphalt mixtures.
Tentatively, a dosage of 4-8% on weight of bitumen is recommended
(Iterchimica S.r.l, 2015). The physical properties provided by the manu-
facturer are:
• aspect: granules;
• colour: shades of grey;
• dimensions: 2÷4 mm;
• softening point: 160 °C;
• melting point: 180 °C;
• melt index: 1÷5;
• specific weight: 0.934 g/ cm3.

Chapter 3 61 Case 2
Waste plastics come from the recycling of tarps for greenhouses. The
specific weight value is 0.94 g/cm3.
PPS is a compound of cellulosic and glass fibers and plastomeric pol-
ymers, as well as SP. It was designed to give more resistance and durabil-
ity to the road pavement. In fact it is able to act simultaneously on several
properties, causing a physical and chemical modification in bituminous
mixtures, acting in particular on the characteristics of the bitumen (pene-
tration, softening point, viscosity) and creating a micro-structural rein-
forcement of the bitumen film. A dosage of 0.2-0.6% on weight of ag-
gregates is recommended (Venturini et al., 2015).
The physical properties provided by the manufacturer are:
• colour: from pale grey to dark brown;
• average diameter: 4÷6 mm;
• fixed residue at 500°C: 20÷30%;
• residual moisture: ≤ 10%;
• apparent density: 0.45÷0.60 g/cm³.
A differential scanning calorimetry (DSC) test was carried out on SP
and waste plastics in accordance with the ISO 11357-3 standard, which
makes it possible to characterize thermal behaviour because it provides
the thermal transitions of a polymer, that is temperature and enthalpy
values corresponding to glass transition (Tg), melting point (Tm) and
crystallization (Tc) through heating from -60°C to 180°C, cooling from
180°C to -60°C and again heating (see Figures 3.4-3.5).
Melting is an endothermic transition because it is necessary to add en-
ergy to the polymer to make it melt, while crystallization is an exother-
mic transition because the polymer gives off heat when it crystallizes and
thus a DSC curve is like the one in Figure 3.5 a (endo up), but in some
instruments it is possible to find a plot like the one shown in Figure 3.5 b
(exo up). The test results are shown in Figures 3.6-3.7.

62 Mauro Ranieri Asphalt mixtures improved with plastic additives: mix design and case study in an airport
Fig. 3.4 A differential scanning calorimeter
a) b)
Fig. 3.5 Features of a DSC curve: a) endo up, b) exo up
Fig. 3.6 DSC test results on SP
0
10
20
30
40
50
60
70
0 50 100 150 200 250
Hea
t fl
ow
(m
W)
Temperature (°C)
1° heating cooling 2° heating

Chapter 3 63 Case 2
Fig. 3.7 DSC test results on waste plastics
As can be seen in Fig. 3.6, there are three peaks: the first is more or
less at 106°C and it is usually for low-density polyethylene, the second
one at 120°C is for the high-density polyethylene, while the last peak at
160°C is for polypropylene. Since the area under the curve is proportion-
al to the mass and the two areas at 120°C and 160°C are quite low, the
quantity of polypropylene and high-density polyethylene (HDPE) is min-
imal. The other peaks are not important because they refer to crystalliza-
tion of polymers at low temperatures (Ashraf, 2014, METTLER TOLE-
DO, 2013).
This test confirms that SP is a low-density polyethylene with a small
quantity of high-density polyethylene and polypropylene, while based on
Fig. 3.7 can be said that waste plastics are a mix of high density polyeth-
ylene and polypropylene.
These additives have low affinity with the bitumen and therefore, for
practical needs, it is much more advantageous to add additives in the as-
phalt mixture: the additive is added to the hot aggregates, before mixing
with the bitumen. In view of this, the optimal process to make a mixture
is the succession of the following components: aggregates, additives, bi-
tumen and filler (Celauro et al., 2001a; Celauro et al., 2004).
3.3 Methods, results and discussion The experimental study was developed on the following mixtures:
• EME SP.0 (50/70);
-6
-5
-4
-3
-2
-1
0
1
2
3
4
0 50 100 150 200 250
Hea
t fl
ow
(m
W)
Temperature (°C)
1° heating cooling 2° heating

64 Mauro Ranieri Asphalt mixtures improved with plastic additives: mix design and case study in an airport
• EME SP (50/70+SP);
• EME P (50/70+waste plastics);
• EME PPS (50/70+PPS);
• EME CONV(35/50).
The mix design was achieved by carrying out the following:
1. Marshall test with 4 percentages of bitumen and CE equal to 75
blows per face, according to the EN 12697-34 standard;
2. compactibility test with a gyratory compactor (D = 150 mm), in ac-
cordance with the EN 12697-31 standard.
Finally, tests on optimized mixtures were performed in order to assess
the following properties:
• rutting resistance, according to the EN 12697-22 standard, method
B;
• complex stiffness modulus, according to the EN 12697-26 stand-
ard, annexes B and D;
• fatigue resistance, according to the EN 12697-24 standard, annex
D.
3.3.1 Mix design
The first step in the formulation of these mixtures was applying the Mar-
shall Method, according to the EN 12697-34 standard, only to the tradi-
tional mixture (without additives) produced with 50/70 pen grade bitu-
men, in order to assess the physical and mechanical characteristics typi-
cally considered in the Italian Specifications.
Four percentages of bitumen were selected (b’1 = 4.8%, b’2 = 5.2%,
b’3 = 5.5%, b’4 = 5.9%, by weight of the aggregates) and four specimens
for each percentage were produced, for a valid repetition. The volumetric
properties (v, air voids, and VFB, voids filled with bitumen) were deter-
mined according to the requirements of the EN 12697-8 standard.
The calculation of the maximum specific weight (γt) of the mixture
was performed according to the “C” (mathematical) process specified by
the EN 12697-5 standard, while the calculation of the apparent specific
weight (γapp) was performed according to the EN 12697-6 standard.
The Marshall test results are reported in Table 3.5 and Figure 3.8,
where S is the Marshall Stability, F is the Marshall Flow, which is the
corresponding displacement, and R the Marshall Ratio S/F.

Chapter 3 65 Case 2
b (%) v (%) S (KN) F (mm) R (KN/mm) VFB (%) γapp (g/cm3)
4.8 6.03 12.24 4.27 2.87 69.22 2.46
5.2 2.88 13.39 4.07 3.29 82.90 2.52
5.5 2.52 14.67 4.40 3.33 86.05 2.52
5.9 1.82 13.30 5.33 2.49 89.75 2.53
Tab. 3.5 Marshall test results
Fig. 3.8 Marshall values at different bitumen contents
3.00
3.50
4.00
4.50
5.00
5.50
6.00
8
9
10
11
12
13
14
15
16
4.5 5.0 5.5 6.0
F (
mm
)
S (
KN
)
S F
1
2
3
4
5
6
7
2.00
2.20
2.40
2.60
2.80
3.00
3.20
3.40
3.60
3.80
4.00
4.5 5.0 5.5 6.0
v (
%)
R=
S/F
(K
N/m
m)
Bitumen content (%)
R v

66 Mauro Ranieri Asphalt mixtures improved with plastic additives: mix design and case study in an airport
As can be seen from the graphs above, regarding the Italian specifica-
tions, such as the example in Table 3.6 (MIT, 2002), the requirements are
respected for bitumen contents between 4.8 and 5.1%.
Required results Unit Course
Binder Base
Marshall Stability, S KN 10 8
Marshall Ratio, R KN/mm 3÷4.5 > 2.5
Marshall voids, v % 4÷6 4÷7
Tab. 3.6 Marshall test results in accordance with MIT Specification
After some information obtained from the Marshall method the sec-
ond step in the mix design of these mixtures was to consider some com-
pactibility characteristics also considered by the Superpave method in-
troduced in 1992 by the Strategic Highway Research Program SHRP
(Cominsky et al., 1994).
The mixtures were therefore subjected to gyratory compaction, ac-
cording to the EN 12697-31 standard, using a superpave gyratory com-
pactor.
This compactor is designed to compact prepared HMA specimens at a
constant consolidation pressure, a constant angle of gyrations and a fixed
speed of gyration. Moreover, it is equipped with a shear measurement
system, which records the shear stress in terms of a unitless Gyratory
Shear Ratio once per gyration. This is a measure of the internal stabil-
ity of the mixture during the compaction, given by Equation (3.1).
= (S
P) (3.1)
where S is the shear stress given by Equation 3.2 and P is the ram pres-
sure given by Equation (3.3).
S = (F x d
V) (3.2)
where F is a vertical force applied in order to achieve the gyration angle
α during compaction, d is the lever arm distance and V is the specimen
volume.
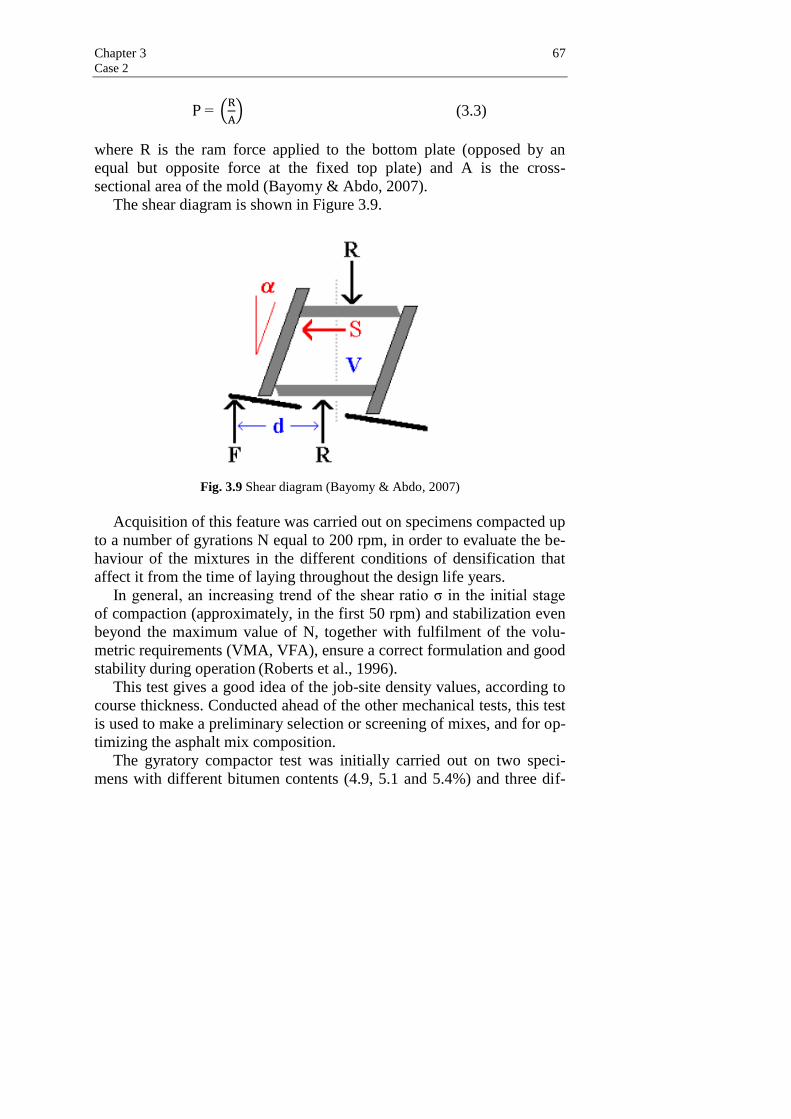
Chapter 3 67 Case 2
P = (R
A) (3.3)
where R is the ram force applied to the bottom plate (opposed by an
equal but opposite force at the fixed top plate) and A is the cross-
sectional area of the mold (Bayomy & Abdo, 2007).
The shear diagram is shown in Figure 3.9.
Fig. 3.9 Shear diagram (Bayomy & Abdo, 2007)
Acquisition of this feature was carried out on specimens compacted up
to a number of gyrations N equal to 200 rpm, in order to evaluate the be-
haviour of the mixtures in the different conditions of densification that
affect it from the time of laying throughout the design life years.
In general, an increasing trend of the shear ratio σ in the initial stage
of compaction (approximately, in the first 50 rpm) and stabilization even
beyond the maximum value of N, together with fulfilment of the volu-
metric requirements (VMA, VFA), ensure a correct formulation and good
stability during operation (Roberts et al., 1996).
This test gives a good idea of the job-site density values, according to
course thickness. Conducted ahead of the other mechanical tests, this test
is used to make a preliminary selection or screening of mixes, and for op-
timizing the asphalt mix composition.
The gyratory compactor test was initially carried out on two speci-
mens with different bitumen contents (4.9, 5.1 and 5.4%) and three dif-
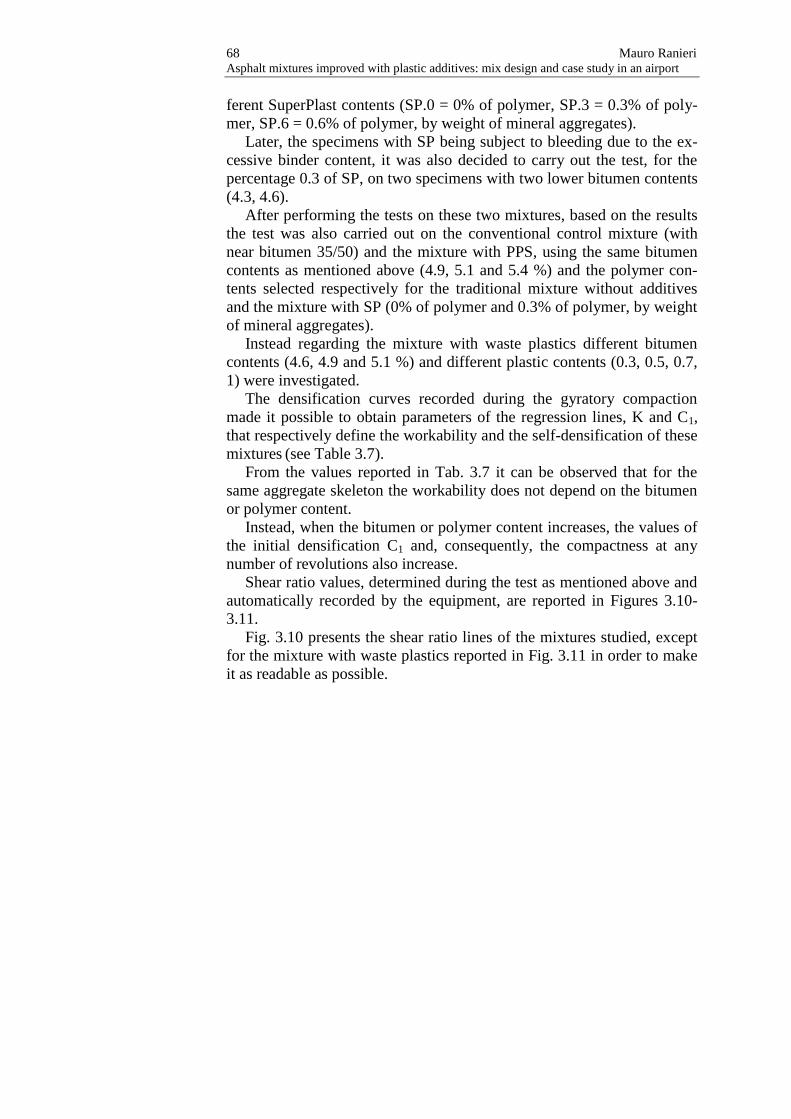
68 Mauro Ranieri Asphalt mixtures improved with plastic additives: mix design and case study in an airport
ferent SuperPlast contents (SP.0 = 0% of polymer, SP.3 = 0.3% of poly-
mer, SP.6 = 0.6% of polymer, by weight of mineral aggregates).
Later, the specimens with SP being subject to bleeding due to the ex-
cessive binder content, it was also decided to carry out the test, for the
percentage 0.3 of SP, on two specimens with two lower bitumen contents
(4.3, 4.6).
After performing the tests on these two mixtures, based on the results
the test was also carried out on the conventional control mixture (with
near bitumen 35/50) and the mixture with PPS, using the same bitumen
contents as mentioned above (4.9, 5.1 and 5.4 %) and the polymer con-
tents selected respectively for the traditional mixture without additives
and the mixture with SP (0% of polymer and 0.3% of polymer, by weight
of mineral aggregates).
Instead regarding the mixture with waste plastics different bitumen
contents (4.6, 4.9 and 5.1 %) and different plastic contents (0.3, 0.5, 0.7,
1) were investigated.
The densification curves recorded during the gyratory compaction
made it possible to obtain parameters of the regression lines, K and C1,
that respectively define the workability and the self-densification of these
mixtures (see Table 3.7).
From the values reported in Tab. 3.7 it can be observed that for the
same aggregate skeleton the workability does not depend on the bitumen
or polymer content.
Instead, when the bitumen or polymer content increases, the values of
the initial densification C1 and, consequently, the compactness at any
number of revolutions also increase.
Shear ratio values, determined during the test as mentioned above and
automatically recorded by the equipment, are reported in Figures 3.10-
3.11.
Fig. 3.10 presents the shear ratio lines of the mixtures studied, except
for the mixture with waste plastics reported in Fig. 3.11 in order to make
it as readable as possible.

Chapter 3 69 Case 2
Mixture b p % Gmm =C1 + k * log (N)
% % C1 K R2
EME 4.3/SP.3 4.3 0.3 0.8009 0.0757 0.9980
EME 4.6/SP.3 4.6 0.3 0.8072 0.0739 0.9984
EME 4.9/SP.0 4.9 0.0 0.7972 0.0753 0.9989
EME 4.9/SP.3 4.9 0.3 0.8141 0.0788 0.9952
EME 4.9/SP.6 4.9 0.6 0.8278 0.0748 0.9900
EME 5.1/SP.0 5.1 0.0 0.8190 0.0710 0.9988
EME 5.1/SP.3 5.1 0.3 0.8168 0.0786 0.9940
EME 5.1/SP.6 5.1 0.6 0.8274 0.0755 0.9880
EME 5.4/SP.0 5.4 0.0 0.8141 0.0788 0.9952
EME 5.4/SP.3 5.4 0.3 0.8345 0.0741 0.9837
EME 5.4/SP.6 5.4 0.6 0.8366 0.0742 0.9702
EME 4.6/P.3 4.6 0.3 0.8232 0.0743 0.9896
EME 4.6/P.5 4.6 0.5 0.8154 0.0751 0.9913
EME 4.6/P.7 4.6 0.7 0.8108 0.0769 0.9929
EME 4.6/P1 4.6 1.0 0.8463 0.0660 0.9627
EME 4.9/P.5 4.9 0.5 0.8253 0.0744 0.9897
EME 4.9/P.7 4.9 0.7 0.8257 0.0731 0.9865
EME 4.9/P1 4.9 1.0 0.8540 0.0638 0.9518
EME 5.1/P1 5.1 1.0 0.8589 0.0617 0.9439
EME 4.9/CONV 4.9 0.0 0.7989 0.0789 0.9969
EME 5.1/CONV 5.1 0.0 0.8278 0.0763 0.9889
EME 5.4/CONV 5.4 0.0 0.8224 0.0805 0.9756
EME 4.9/PPS.3 4.9 0.3 0.8125 0.0797 0.9920
EME 5.1/PPS.3 5.1 0.3 0.8145 0.0798 0.9939
EME 5.4/PPS.3 5.4 0.3 0.8251 0.0787 0.9859
Tab. 3.7 Values of workability and self-densification

70 Mauro Ranieri Asphalt mixtures improved with plastic additives: mix design and case study in an airport
Fig. 3.10 Shear ratio lines of the traditional mixture, of the mixture with SP, of the mix-
ture with PPS and of the conventional mixture
0.30
0.35
0.40
0.45
0.50
0.55
0.60
0.65
0.70
0.75
0.80
0.85
0.90
0.95
1.00
1.05
1.10
1.15
1.20
1.25
0 50 100 150 200
Sh
ear
rati
o, σ
Number of gyrations, N
EME 4.9/SP.0
EME 4.9/CONV
EME 4.3/SP.3
EME 5.1/SP.0
EME 4.9/PPS.3
EME 4.6/SP.3
EME 5.1/PPS.3
EME 4.9/SP.3
EME 5.1/CONV
EME 5.1/SP.3
EME 5.4/SP.0
EME 5.4/PPS.3
EME 4.9/SP.6
EME 5.1/SP.6
EME 5.4/CONV
EME 5.4/SP.3
EME 5.4/SP.6
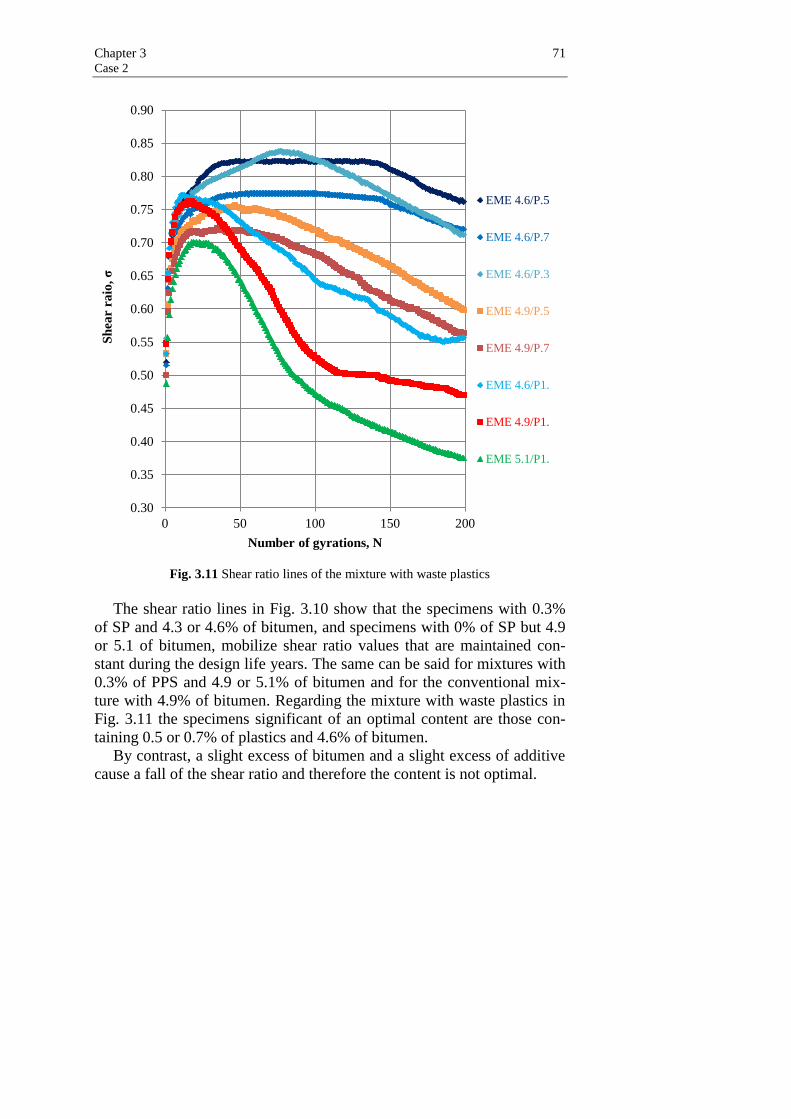
Chapter 3 71 Case 2
Fig. 3.11 Shear ratio lines of the mixture with waste plastics
The shear ratio lines in Fig. 3.10 show that the specimens with 0.3%
of SP and 4.3 or 4.6% of bitumen, and specimens with 0% of SP but 4.9
or 5.1 of bitumen, mobilize shear ratio values that are maintained con-
stant during the design life years. The same can be said for mixtures with
0.3% of PPS and 4.9 or 5.1% of bitumen and for the conventional mix-
ture with 4.9% of bitumen. Regarding the mixture with waste plastics in
Fig. 3.11 the specimens significant of an optimal content are those con-
taining 0.5 or 0.7% of plastics and 4.6% of bitumen.
By contrast, a slight excess of bitumen and a slight excess of additive
cause a fall of the shear ratio and therefore the content is not optimal.
0.30
0.35
0.40
0.45
0.50
0.55
0.60
0.65
0.70
0.75
0.80
0.85
0.90
0 50 100 150 200
Sh
ear
raio
, σ
Number of gyrations, N
EME 4.6/P.5
EME 4.6/P.7
EME 4.6/P.3
EME 4.9/P.5
EME 4.9/P.7
EME 4.6/P1.
EME 4.9/P1.
EME 5.1/P1.

72 Mauro Ranieri Asphalt mixtures improved with plastic additives: mix design and case study in an airport
Regarding voids, Table 3.8 shows the average values of specimens
prepared with the gyratory compactor that, considering for example the
requirements on the air voids at 10, 100 and 190 rpm, reported in Table
3.9 (Anas S.p.A, 2009), confirm the results seen in Figures 3.10-3.11.
Mixture b p Number of gyrations
% % 10 100 190
EME 4.3/SP.3 4.3 0.3 12.6 4.7 2.8
EME 4.6/SP.3 4.6 0.3 12.1 4.4 2.6
EME 4.9/SP.0 4.9 0.0 13.0 5.1 3.2
EME 4.9/SP.3 4.9 0.3 11.1 2.7 1.0
EME 4.9/SP.6 4.9 0.6 10.2 2.0 0.7
EME 5.1/SP.0 5.1 0.0 11.2 3.8 2.0
EME 5.1/SP.3 5.1 0.3 10.8 2.4 0.8
EME 5.1/SP.6 5.1 0.6 10.2 1.9 0.6
EME 5.4/SP.0 5.4 0.0 9.9 1.7 0.4
EME 5.4/SP.3 5.4 0.3 9.6 1.4 0.3
EME 5.4/SP.6 5.4 0.6 9.5 1.0 0.3
EME 4.6/P.3 4.6 0.3 10.7 2.6 1.2
EME 4.6/P.5 4.6 0.5 11.3 3.3 1.8
EME 4.6/P.7 4.6 0.7 11.6 3.3 1.8
EME 4.6/P1 4.6 1.0 9.3 1.9 1.1
EME 4.9/P.5 4.9 0.5 10.4 2.4 1.0
EME 4.9/P.7 4.9 0.7 10.5 2.6 1.3
EME 4.9/P1 4.9 1.0 8.8 1.6 0.8
EME 5.1/P1 5.1 1.0 8.5 1.6 0.8
EME 4.9/CONV 4.9 0.0 12.5 4.2 2.4
EME 5.1/CONV 5.1 0.0 10.0 1.8 0.4
EME 5.4/CONV 5.4 0.0 10.4 1.2 0.2
EME 4.9/PPS.3 4.9 0.3 11.1 2.6 0.9
EME 5.1/PPS.3 5.1 0.3 11.0 2.4 0.7
EME 5.4/PPS.3 5.4 0.3 10.0 1.5 0.1
Tab. 3.8 Average values of the air voids of the specimens at 10, 100 e 190 gyrations
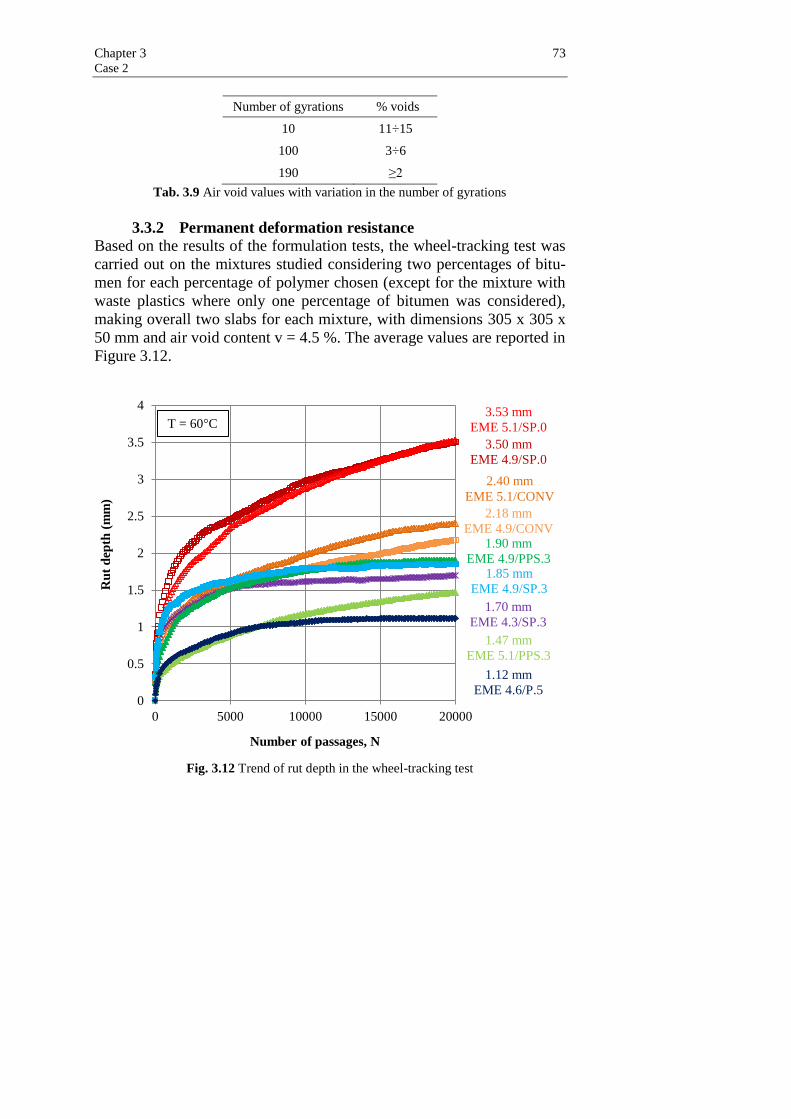
Chapter 3 73 Case 2
Number of gyrations % voids
10 11÷15
100 3÷6
190 ≥2
Tab. 3.9 Air void values with variation in the number of gyrations
3.3.2 Permanent deformation resistance
Based on the results of the formulation tests, the wheel-tracking test was
carried out on the mixtures studied considering two percentages of bitu-
men for each percentage of polymer chosen (except for the mixture with
waste plastics where only one percentage of bitumen was considered),
making overall two slabs for each mixture, with dimensions 305 x 305 x
50 mm and air void content v = 4.5 %. The average values are reported in
Figure 3.12.
Fig. 3.12 Trend of rut depth in the wheel-tracking test
0
0.5
1
1.5
2
2.5
3
3.5
4
0 5000 10000 15000 20000
Ru
t d
epth
(m
m)
Number of passages, N
T = 60°C 3.53 mm
EME 5.1/SP.0
3.50 mm
EME 4.9/SP.0
2.40 mm
EME 5.1/CONV
2.18 mm
EME 4.9/CONV 1.90 mm
EME 4.9/PPS.3 1.85 mm
EME 4.9/SP.3
1.70 mm
EME 4.3/SP.3
1.47 mm
EME 5.1/PPS.3
1.12 mm
EME 4.6/P.5
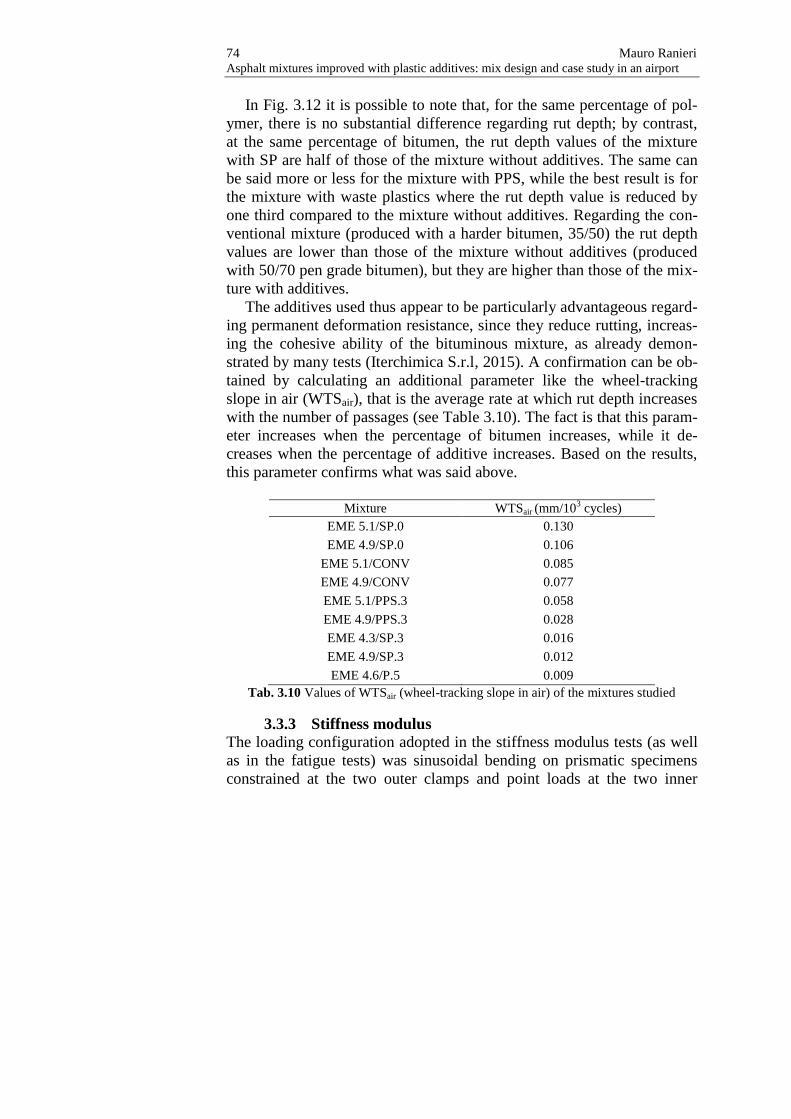
74 Mauro Ranieri Asphalt mixtures improved with plastic additives: mix design and case study in an airport
In Fig. 3.12 it is possible to note that, for the same percentage of pol-
ymer, there is no substantial difference regarding rut depth; by contrast,
at the same percentage of bitumen, the rut depth values of the mixture
with SP are half of those of the mixture without additives. The same can
be said more or less for the mixture with PPS, while the best result is for
the mixture with waste plastics where the rut depth value is reduced by
one third compared to the mixture without additives. Regarding the con-
ventional mixture (produced with a harder bitumen, 35/50) the rut depth
values are lower than those of the mixture without additives (produced
with 50/70 pen grade bitumen), but they are higher than those of the mix-
ture with additives.
The additives used thus appear to be particularly advantageous regard-
ing permanent deformation resistance, since they reduce rutting, increas-
ing the cohesive ability of the bituminous mixture, as already demon-
strated by many tests (Iterchimica S.r.l, 2015). A confirmation can be ob-
tained by calculating an additional parameter like the wheel-tracking
slope in air (WTSair), that is the average rate at which rut depth increases
with the number of passages (see Table 3.10). The fact is that this param-
eter increases when the percentage of bitumen increases, while it de-
creases when the percentage of additive increases. Based on the results,
this parameter confirms what was said above.
Mixture WTSair (mm/10
3 cycles)
EME 5.1/SP.0 0.130
EME 4.9/SP.0 0.106
EME 5.1/CONV 0.085
EME 4.9/CONV 0.077
EME 5.1/PPS.3 0.058
EME 4.9/PPS.3 0.028
EME 4.3/SP.3 0.016
EME 4.9/SP.3 0.012
EME 4.6/P.5 0.009
Tab. 3.10 Values of WTSair (wheel-tracking slope in air) of the mixtures studied
3.3.3 Stiffness modulus
The loading configuration adopted in the stiffness modulus tests (as well
as in the fatigue tests) was sinusoidal bending on prismatic specimens
constrained at the two outer clamps and point loads at the two inner

Chapter 3 75 Case 2
clamps (four-point bending beam test). The deformation was kept con-
stant during the test (controlled strain).
The stiffness modulus test was carried out, according to EN 12697-26
annex B, on beams with dimensions 400 x 50 x 45 mm, before each fa-
tigue test with the sole difference that the test did not finish when the
beams broke or when the value was half its initial value (at 100th
cycle),
but was only carried out up to 150 cycles. The deformation was 25 µε,
the temperature was 20°C and the frequencies were 1, 10, 30 Hz and
again 1 Hz in order to check that the specimen has not been damaged
during the loading. The complex modulus test and the fatigue test were
carried out on optimized mixtures, that is the ones with the best results
after formulation tests and wheel-tracking test, using a four-point bend-
ing apparatus and the GCTS CATS software.
The stiffness modulus test parameters are reported in Table 3.11 and
show what it was reasonable to expect: for each mixture the stiffness
modulus values are highest at high frequencies, and thus lowest at low
frequencies, while it is the opposite in the case of the phase angle values;
besides, the mixture with waste plastics has the highest stiffness modulus
values at the same temperature and frequency conditions as the other
mixtures. The conventional mixture produced with the 35/50 pen grade
bitumen confirms higher values than the mixture with 50/70 pen grade
bitumen, due to the presence of harder bitumen.
Mixture
│E*│(MPa) (Deg)
Frequency (Hz) Frequency (Hz)
1 10 30 1 10 30
EME 4.9/SP.0 3692 7282 8756 36 24 23
EME 4.3/SP.3 4168 7528 9188 30 20 18
EME 5.1/PPS.3 4240 7874 9704 31 22 19
EME 4.9/CONV 5451 9378 11138 28 19 17
EME 4.6/P.5 6793 10682 12277 23 15 15
Tab. 3.11 Values of complex modulus and phase angle of the mixtures studied
Finally, the dynamic modulus was also evaluated by means of a triaxi-
al cell. This test consists of applying a sinusoidal axial compression
stress on a specimen of asphalt concrete at a given temperature and load-

76 Mauro Ranieri Asphalt mixtures improved with plastic additives: mix design and case study in an airport
ing frequency. The resulting recoverable axial strain response of the
specimen is measured and used to calculate dynamic modulus. The load-
ing configuration adopted for characterizing the stiffness of the bitumi-
nous mixture (dynamic modulus) was direct compression on cylindrical
specimens. The tension was kept constant during the test (controlled
stress), which was carried out according to the EN 12697-26 standard,
annex D.
The tests were conducted at 10, 20, 30 and 40°C, at a confining pres-
sure of 0 KPa and six frequencies per temperature (20, 10, 5, 1, 0.5 and
0.1 Hz) on cylinders with dimensions 100 x 150 mm obtained after com-
paction with a gyratory compactor. The stress levels applied were chosen
in such a way that the strain response was kept within 50-150 µε. Four
replicates were tested for each mixture and the results were averaged.
The isotherms obtained were used for determination of the Master
Curves. The values of the shift factor were calculated and optimized ac-
cording to the formula of Arrhenius (Celauro et al, 2010). In this way, by
horizontal translation of the shift of isotherms relating to the test tem-
peratures it was possible to construct the master curve at a reference tem-
perature of 20°C for each bituminous mixture. Figure 3.13 shows the
master curves for the mixtures studied with 5% voids.
Fig. 3.13 Master curves of the mixtures studied
1E+02
1E+03
1E+04
0.0001 0.01 1 100
|E
*| (M
Pa
)
αT x f (Hz)
EME 4.9/CONV
EME 4.6/P.5
EME 4.3/SP.3
EME 4.9/SP.0
EME 5.1/PPS.3
T = 20°C
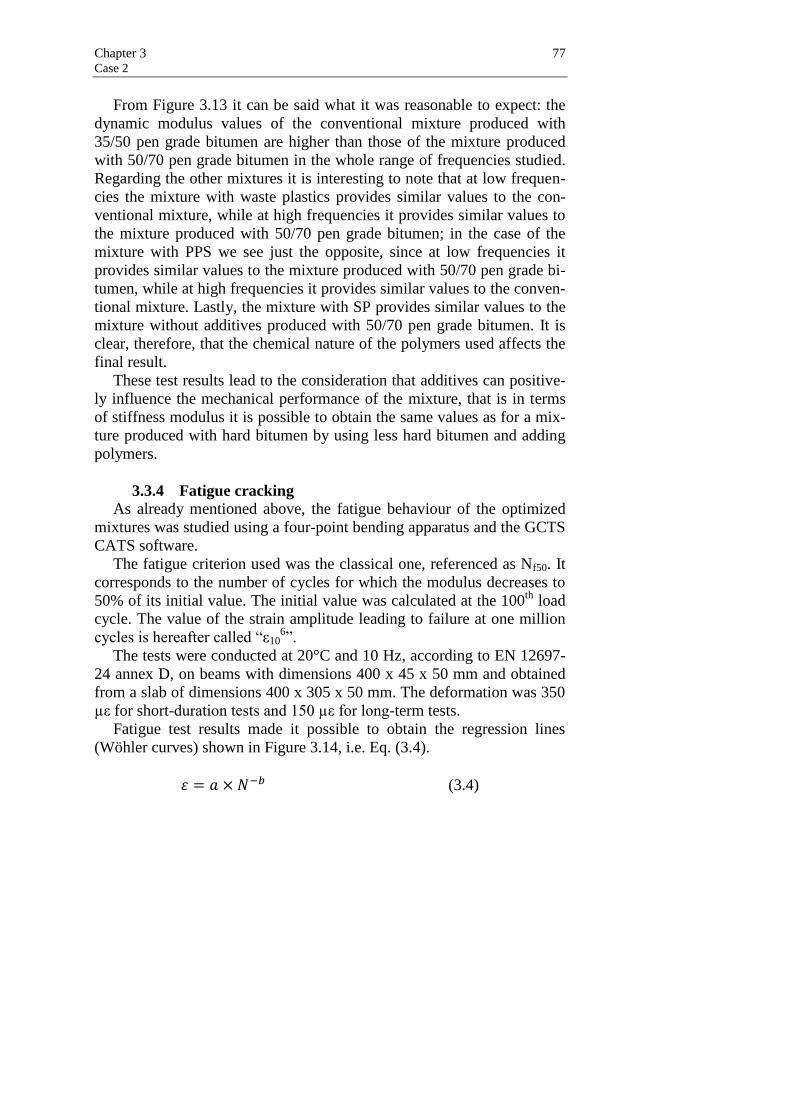
Chapter 3 77 Case 2
From Figure 3.13 it can be said what it was reasonable to expect: the
dynamic modulus values of the conventional mixture produced with
35/50 pen grade bitumen are higher than those of the mixture produced
with 50/70 pen grade bitumen in the whole range of frequencies studied.
Regarding the other mixtures it is interesting to note that at low frequen-
cies the mixture with waste plastics provides similar values to the con-
ventional mixture, while at high frequencies it provides similar values to
the mixture produced with 50/70 pen grade bitumen; in the case of the
mixture with PPS we see just the opposite, since at low frequencies it
provides similar values to the mixture produced with 50/70 pen grade bi-
tumen, while at high frequencies it provides similar values to the conven-
tional mixture. Lastly, the mixture with SP provides similar values to the
mixture without additives produced with 50/70 pen grade bitumen. It is
clear, therefore, that the chemical nature of the polymers used affects the
final result.
These test results lead to the consideration that additives can positive-
ly influence the mechanical performance of the mixture, that is in terms
of stiffness modulus it is possible to obtain the same values as for a mix-
ture produced with hard bitumen by using less hard bitumen and adding
polymers.
3.3.4 Fatigue cracking
As already mentioned above, the fatigue behaviour of the optimized
mixtures was studied using a four-point bending apparatus and the GCTS
CATS software.
The fatigue criterion used was the classical one, referenced as Nf50. It
corresponds to the number of cycles for which the modulus decreases to
50% of its initial value. The initial value was calculated at the 100th
load
cycle. The value of the strain amplitude leading to failure at one million
cycles is hereafter called “ε106”.
The tests were conducted at 20°C and 10 Hz, according to EN 12697-
24 annex D, on beams with dimensions 400 x 45 x 50 mm and obtained
from a slab of dimensions 400 x 305 x 50 mm. The deformation was 350
µε for short-duration tests and 150 µε for long-term tests.
Fatigue test results made it possible to obtain the regression lines
(Wöhler curves) shown in Figure 3.14, i.e. Eq. (3.4).
𝜀 = 𝑎 × 𝑁−𝑏 (3.4)

78 Mauro Ranieri Asphalt mixtures improved with plastic additives: mix design and case study in an airport
Fig. 3.14 Fatigue lines
For each fatigue line the following parameters were calculated in or-
der to make a judgment on performance:
• “a” is a constant and it depends on the physical and mechanical
characteristics of the material, test temperature and frequency;
• slope of the fatigue lines (b);
• coefficient of determination (R2);
• admissible strain level at N = 106 loading applications (ε10
6) in or-
der to characterize fatigue resistance.
Table 3.12 summarizes these parameters for the mixtures studied.
Mixture A B R2 ε10
6
EME 4.3/SP.3 4532 -0.240 0.9797 164.5
EME 4.9/SP.0 6328 -0.262 0.9828 169.5
EME 4.6/P.5 3115 -0.206 0.9660 180.9
EME 5.1/PPS.3 5651 -0.236 0.9773 216.8
EME 4.9/CONV 6582 -0.223 0.7385 302.2
Tab. 3.12 Fatigue line parameters of the mixtures studied
100
1000
1E+04 1E+05 1E+06 1E+07
Str
ain
(µε)
Number of cycles, N
EME 4.6/P.5
EME 4.9/SP.0
EME 4.3/SP.3
EME 4.9/CONV
EME 5.1/PPS.3

Chapter 3 79 Case 2
The fatigue lines have high values of the regression coefficients R2
(see Tab. 3.12) and this means that the results are only slightly dispersed
and very reproducible.
By comparing the fatigue lines, it can be noticed that the mixtures
with additives offer fatigue performance that is similar to (as in the case
of the mixture with SP) or better than (as in the case of the mixtures with
PPS or waste plastics) that of the mixture without additives, produced
with 50/70 pen grade bitumen. Nevertheless, such mixtures do not reach
the high performance levels of the conventional mixtures in terms of fa-
tigue resistance.
In any case, all admissible strain values ε6 (>130 μstrain) can be con-
sidered satisfactory for road paving applications, showing that the addi-
tion of polymers is a viable solution.
3.4 Conclusions Limited to the materials studied, the laboratory tests can be considered
adequate to indicate the possibility of using the additives in order to im-
prove mechanical performances of bituminous mixtures produced with
component of average quality.
The optimized mixtures show good stability values and compaction
and the positive influence that the additives studied have on these mix-
tures regarding permanent deformation resistance (at the same bitumen
content, mixtures with additives are more resistant than mixtures without
additives, produced with 50/70 or 35/50 pen grade bitumen).
Moreover, the presence of the additives allows optimization of mix-
tures with lower binder contents and also makes it possible to obtain
higher stiffness modulus values than traditional mixtures without addi-
tives as well as the values of the high modulus asphalt mixtures, repre-
sented by the conventional mixture. Regarding fatigue resistance it can
be said that mixtures with additives do not offer the same high perfor-
mance as the conventional mixture; however, their presence leads to sim-
ilar or better results than those offered by a mixture without additives
produced with 50/70 pen grade bitumen.
A possible future development is a thorough statistical study consider-
ing several kinds of bitumen and locally available aggregate sources, as
locally available in order to highlight performance sensitivity to aggre-
gate-bitumen combinations, as well as considering many other types of

80 Mauro Ranieri Asphalt mixtures improved with plastic additives: mix design and case study in an airport
polymer, particularly wastes, since they can definitely be an economic
and ecological alternative for paving works.

Chapter 4
Case 3
4.1 General Case 3 is an experimental study concerning plastic additives used in the
surface, binder and base courses of the access pavement to the new apron
of Palermo International Airport.
The focus was on comparison between data obtained from laboratory
tests and data obtained from field tests.
For this purpose, the stiffness modulus was evaluated through triaxial
cell tests at the University of Palermo’s Road Materials Laboratory and it
was compared to the stiffness modulus values obtained using BAKFAA,
a software program made available by the Federal Aviation Administra-
tion (FAA), in which deflection values obtained by Heavy Weight De-
flectometer (HWD) tests were used.
The test results confirm the high modulus values obtained using addi-
tives in asphalt mixtures and thus justify their use in settings such as air-
ports, where the pavements are subject to high loads, which lead to grad-
ual surface degradation.
4.2 Materials The asphalt mixtures that are the object of this case study are mixtures
with plastic additives used in the surface, binder and base courses of the
access pavement to new apron of Palermo Airport, not yet open to air
traffic.
The materials used to produce these mixtures will now be presented.

82 Mauro Ranieri Asphalt mixtures improved with plastic additives: mix design and case study in an airport
4.2.1 Aggregates
The stone aggregates used in the mixtures came from crushed limestone
(supplied by I.s.a.p. S.r.l.), whose composition and physical and mechan-
ical properties are given respectively in Table 4.1 and Table 4.2.
Sieve (mm)
Passing (%)
Fractions
25/30 20/25 10/15 5/10 0/6 filler
31.5 100 100 100 100 100 100
25 91.25 100 100 100 100 100
20 6.34 94.85 100 100 100 100
12.5 0.33 17.20 98.85 100 100 100
8 0.22 0.74 85.15 99.70 100 100
4 0.16 0.66 35.91 26.30 90.30 100
2 0.13 0.54 14.89 5.80 58.30 100
0.425 0.11 0.50 7.32 2.50 23.70 99.00
0.18 0.09 0.50 4.83 2.20 15.90 92.47
0.075 0.07 0.41 3.44 1.70 10.60 74.12
Tab. 4.1 Composition of the aggregates’ available fractions
Characteristics Fractions
25/30 20/25 10/15 5/10 0/6 filler
Bulk specific weight, g/cm3
(EN 1097-7) 2.85
Apparent specific weight, g/cm3
(EN 1097-6) 2.81 2.81 2.83 2.83 2.84
Los Angeles abrasion, % (EN 1097-2)
21.76 21.94 20.07 20.38 20.02
Sand equivalent, % (EN 933-8)
90.60 89.79
Void ratio (CNR 65)
0.86 0.78 0.80 0.73 0.70
Absorption coefficient (EN 1097-6)
0.51 0.48 0.48
Tab. 4.2 Physical and mechanical characteristics of the available aggregates
The mix grading curves were obtained for the composition of the frac-
tions provided by implantation as shown in Figures 4.1-4.3.

Chapter 4 83 Case 3
Fig. 4.1 Mix grading curve for the surface course
Fig. 4.2 Mix grading curve for the binder course
0
10
20
30
40
50
60
70
80
90
100
0.01 0.1 1 10 100
Pa
ssin
g (
%)
Sieve size (mm)
Mix grading curve Upper limit Lower limit
0
10
20
30
40
50
60
70
80
90
100
0.01 0.1 1 10 100
Pa
ssin
g (
%)
Sieve size (mm)
Mix grading curve Upper limit Lower limit

84 Mauro Ranieri Asphalt mixtures improved with plastic additives: mix design and case study in an airport
Fig. 4.3 Mix grading curve for the base course
4.2.2 Bitumens
The bitumen used in this research was neat bitumen 50/70; its character-
istics are reported in Table 4.3.
Characteristic Unit Value Standard
Specific weight at 25°C g/cm3 1.033 EN 3838
Penetration at 25°C dmm 68 EN 1426
Ring and Ball Softening Point °C 50.5 EN 1427 Penetration Index -0.21 EN 12591
Fraas Temperature °C -12 EN 12593 Ductility at 25°C cm > 100 ASTM D113
Viscosity at 60 °C Pa∙s 270 EN 13302
Viscosity at 160 °C Pa∙s 0.11 EN 13302 After RTFOT:
Change in mass % 0.19 EN 12607-1 Penetration at 25°C dmm 44 EN 1426
Ring and Ball Softening Point °C 54 EN 1427
Viscosity at 60 °C Pa∙s 668 EN 13302
Tab. 4.3 Characteristics of 50/70 pen grade bitumen
4.2.3 Additives
The additive used (SP) was already mentioned in Chapter 3; its properties
are listed in section 3.2.3.
0
10
20
30
40
50
60
70
80
90
100
0.01 0.1 1 10 100
Pa
ssin
g (
%)
Sieve size (mm)
Mix grading curve Upper limit Lower limit

Chapter 4 85 Case 3
4.3 Methods, results and discussion The experimental study was developed on the following mixtures:
• SURF 0/20 (50/70+SP);
• BINDER 0/20 (50/70+SP);
• BASE 0/25 (50/70+SP).
The mix design was achieved by carrying out the Marshall test with 3
percentages of bitumen and CE equal to 75 blows per face, according to
the EN 12697-34 standard. This test was carried out by Iterchimica S.r.l.
These mixtures were used in the surface, binder and base courses of
the access pavement to the new apron of Palermo Airport.
Laboratory tests on optimized mixtures were performed in order to as-
sess the stiffness modulus, according to the EN 12697-26 standard, an-
nexes B and D.
Finally, a Heavy Weight Deflectometer (HWD) Test conducted with
the Dynatest device of the University of Messina at Palermo Airport
made it possible to obtain the deflection values from the pavement. These
values were then entered into the software program BAKFAA for a back-
calculation analysis in order to compare the laboratory results with the
field data.
4.3.1 Mix design
The mix design was performed with the Marshall Method, according
to the EN 12697-34 standard, using three bitumen contents and one SP
content for different courses (b’1 = 4.8%, b’2 = 5.6%, b’3 = 6.5%, by
mass of aggregates, and SP = 8%, by mass of bitumen, for the surface
course; b’1 = 4.5%, b’2 = 5.0%, b’3 = 5.5%, by mass of aggregates, and
SP = 5.5%, by mass of bitumen, for the binder course; b’1 = 4.0%, b’2 =
4.5%, b’3 = 5.0%, by mass of aggregates, and SP = 5.5%, by mass of bi-
tumen, for the base course). The mixing temperature was 175°C, while
the minimum compaction temperature was 135°C (except for the surface
course, which was 150°C).
The air void content was determined according to the EN 12697-8
standard, while the calculation of the apparent specific weight (γapp) was
performed according to the EN 12697-6 standard. The results are report-
ed in Tables 4.4-4.6, where S is the Marshall Stability, F is the Marshall
Flow, which is the corresponding displacement, and R the Marshall Ratio
S/F.

86 Mauro Ranieri Asphalt mixtures improved with plastic additives: mix design and case study in an airport
Considering the requirements in the Italian Specifications regarding
the physical and mechanical characteristics, such as for example the ones
in Table 4.7 (MIT, 2002), Marshall test results are also reported in Fig-
ures 4.4-4.6.
b (%) S (KN) F (mm) R (KN/mm) v (%) γapp (g/cm3)
4.8 11.5 4.0 2.9 4.20 2.499
5.6 12.0 2.9 4.1 3.60 2.514
6.5 11.1 3.0 3.7 3.50 2.518
Tab. 4.4 Marshall test results for the surface course
b (%) S (KN) F (mm) R (KN/mm) v (%) γapp (g/cm3)
4.5 10.5 3.1 3.4 6.14 2.452
5.0 10.8 3.3 3.3 5.45 2.472
5.5 10.0 3.3 3.0 5.06 2.479
Tab. 4.5 Marshall test results for the binder course
b (%) S (KN) F (mm) R (KN/mm) v (%) γapp (g/cm3)
4.0 11.0 3.5 3.1 4.95 2.489
4.5 10.7 3.4 3.2 4.76 2.496
5.0 9.4 3.6 2.6 3.30 2.499
Tab. 4.6 Marshall test results for the base course
Required results Unit Course
Surface Binder Base
Marshall Stability, S KN > 11 > 10 > 8
Marshall Ratio, R KN/mm 3÷4.5 3÷4.5 > 2.5
Marshall voids, v % 3÷6 4÷6 4÷7
Tab. 4.7 Marshall test results in accordance with MIT Specification
For the surface course, the specimens significant of an optimal content
are those containing 8% (by mass of bitumen) of SP and 5.6% (by mass
of aggregates) of bitumen; for the binder course, the ones containing
5.5% (by mass of bitumen) of SP and 4.9% (by mass of aggregates) of
bitumen, and finally, for the base course, the ones containing 5.5% (by
mass of bitumen) of SP and 4.1% (by mass of aggregates) of bitumen.
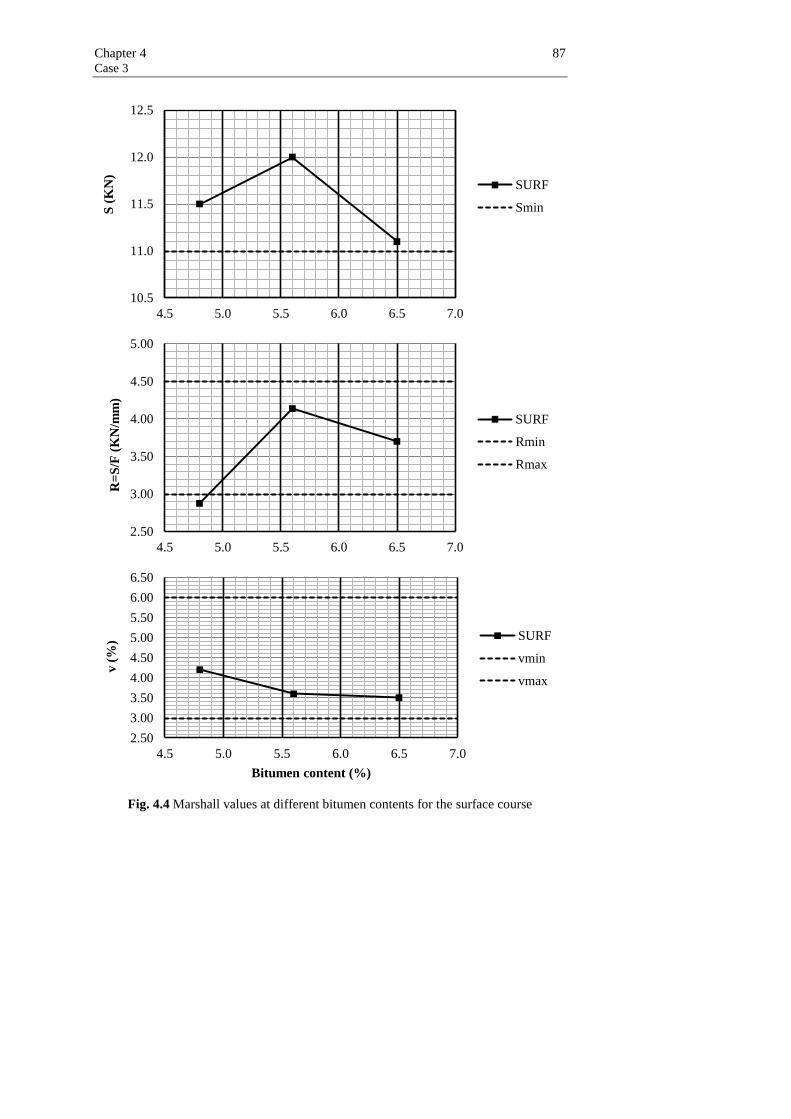
Chapter 4 87 Case 3
Fig. 4.4 Marshall values at different bitumen contents for the surface course
10.5
11.0
11.5
12.0
12.5
4.5 5.0 5.5 6.0 6.5 7.0
S (
KN
)
SURF
Smin
2.50
3.00
3.50
4.00
4.50
5.00
4.5 5.0 5.5 6.0 6.5 7.0
R=
S/F
(K
N/m
m)
SURF
Rmin
Rmax
2.50
3.00
3.50
4.00
4.50
5.00
5.50
6.00
6.50
4.5 5.0 5.5 6.0 6.5 7.0
v (
%)
Bitumen content (%)
SURF
vmin
vmax
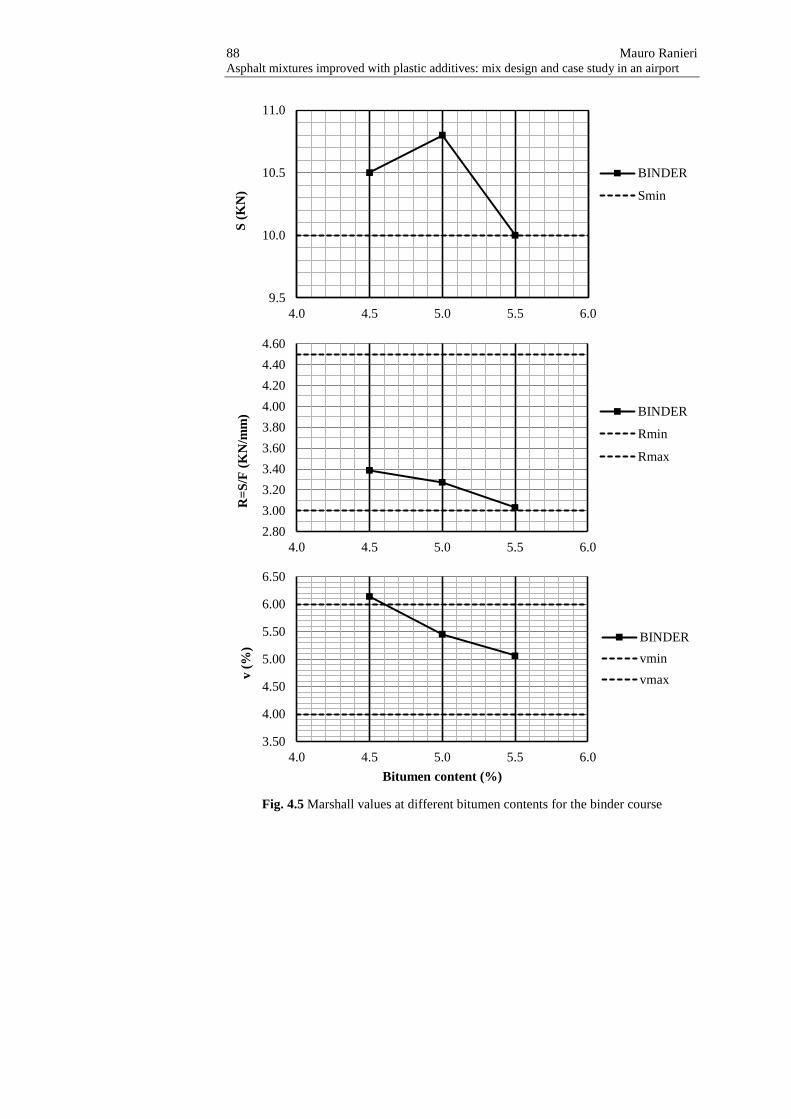
88 Mauro Ranieri Asphalt mixtures improved with plastic additives: mix design and case study in an airport
Fig. 4.5 Marshall values at different bitumen contents for the binder course
9.5
10.0
10.5
11.0
4.0 4.5 5.0 5.5 6.0
S (
KN
)
BINDER
Smin
2.80
3.00
3.20
3.40
3.60
3.80
4.00
4.20
4.40
4.60
4.0 4.5 5.0 5.5 6.0
R=
S/F
(K
N/m
m) BINDER
Rmin
Rmax
3.50
4.00
4.50
5.00
5.50
6.00
6.50
4.0 4.5 5.0 5.5 6.0
v (
%)
Bitumen content (%)
BINDER
vmin
vmax

Chapter 4 89 Case 3
Fig. 4.6 Marshall values at different bitumen contents for the base course
7.5
8.0
8.5
9.0
9.5
10.0
10.5
11.0
11.5
3.5 4.0 4.5 5.0 5.5
S (
KN
)
BASE
Smin
2.00
2.50
3.00
3.50
4.00
4.50
5.00
3.5 4.0 4.5 5.0 5.5
R=
S/F
(K
N/m
m)
BASE
Rmin
3.00
3.50
4.00
4.50
5.00
5.50
6.00
6.50
7.00
7.50
3.5 4.0 4.5 5.0 5.5
v (
%)
Bitumen content (%)
BASE
vmin
vmax

90 Mauro Ranieri Asphalt mixtures improved with plastic additives: mix design and case study in an airport
4.3.2 Stiffness modulus
The stiffness modulus test was carried out on optimized mixtures, ac-
cording to EN 12697-26 annex B (four-point bending test on prismatic
beams), on beams with dimensions 400 x 50 x 45 mm for the surface
course and 400 x 50 x 50 mm for the binder course.
The deformation was 25 µε, the temperature was 20°C and the fre-
quencies were 1, 10, 30 Hz and again 1 Hz in order to check that the
specimen has not been damaged during the loading.
This test was carried out only for the surface and binder courses, be-
cause in the base course the maximum diameter size (Dmax) of the mix
grading was inconsistent with the testing equipment. The stiffness modu-
lus test parameters are reported in Table 4.8.
Mixture
│E*│(MPa) (Deg)
Frequency (Hz) Frequency (Hz)
1 10 30 1 10 30
SURF 5193 8256 9461 23 16 16
BINDER 7037 11250 11903 21 13 13
Tab. 4.8 Values of complex modulus and phase angle for the surface and binder courses
The results show what it was reasonable to expect: for each mixture
the stiffness modulus values are highest at high frequencies, and thus
lowest at low frequencies, while it is the opposite in the case of the phase
angle values; besides, the mixture for the binder course has the higher
stiffness modulus values than those of the mixture for the surface course
at the same temperature and frequency conditions.
In this connection, the highest modulus values are required in the low-
er layers, while for the surface courses the highest values are required re-
garding functional properties.
High values obtained for these mixtures confirm what was said previ-
ously regarding the advantage of using polymeric additives in asphalt
mixtures.
Finally, the stiffness modulus was also evaluated by means of a triaxi-
al cell, whose loading configuration was described in the previous chap-
ter.

Chapter 4 91 Case 3
The tests were carried out according to the EN 12697-26 standard, an-
nex D, and conducted at 10, 20, 30 and 40°C, at a confining pressure of 0
KPa and six frequencies per temperature (20, 10, 5, 1, 0.5 and 0.1 Hz) on
cylinders with dimensions 100 x 150 mm obtained after compaction with
a gyratory compactor.
The stress levels applied were chosen in such a way that the strain re-
sponse was kept within 50-150 µε. Four replicates were tested for each
mixture and the results were averaged.
The isotherms obtained were used for determination of the Master
Curves, at a reference temperature of 30°C for each bituminous mixture.
Figures 4.7-4.9 show the master curves for the mixtures studied with
4.5% voids.
Fig. 4.7 Complex modulus master curve for the surface course
1E+02
1E+03
1E+04
0.0001 0.01 1 100
|E
*| (M
pa
)
αT x f (Hz)
SURF
10°C
20°C
30°C
40°C
T = 30°C

92 Mauro Ranieri Asphalt mixtures improved with plastic additives: mix design and case study in an airport
Fig. 4.8 Complex modulus master curve for the binder course
Fig. 4.9 Complex modulus master curve for the base course
Master curves show stiffness modulus values in line with the results of
the other mixture with additives, seen in the previous chapter.
1E+02
1E+03
1E+04
0.0001 0.01 1 100
|E
*| (M
pa
)
αT x f (Hz)
BINDER
10°C
20°C
30°C
40°C
T = 30°C
1E+02
1E+03
1E+04
0.0001 0.01 1 100
|E
*| (M
pa
)
αT x f (Hz)
BASE
10°C
20°C
30°C
40°C
T = 30°C

Chapter 4 93 Case 3
4.3.3 HWD test
The field test used was a Heavy Weight Deflectometer (HWD) test. This
test was used to obtain the deflection data from the existing pavement,
that is the one of access to the new apron of Palermo International Air-
port.
The purpose of the HWD test was to analyze the deflection basin to
determine the overall structural strength and back-calculating elastic
modulus of each layer. A HWD is a falling weight deflectometer (FWD)
that uses higher loads, used primarily for testing airports pavements.
In an FWD/HWD test, an impulse load is applied to the pavement sur-
face by dropping a weight onto a circular metal plate and the resulting
pavement surface deflections are measured directly beneath the plate and
at several radial offsets (Amadore et al., 2014). The deflection of a
pavement represents an overall “system response” of the pavement layers
to an applied load. A conventional Asphalt Concrete (AC) pavement is
typically made up of three layers: a surface layer paved with AC mix, a
base or/and subbase layer made up of crushed stone, and a subgrade layer
made up of natural soil. When a wheel load is applied on an AC pave-
ment, the pavement layers deflect almost vertically to form a basin.
The deflected shape of the basin, as shown in Figure 4.10, is predomi-
nantly a function of the thickness of the pavement layers, the moduli of
the individual layers, and the magnitude of the load.
Fig. 4.10 Schematic of FWD/HWD load-geophone configuration (Gopalakrishnan &
Thompson, 2004)

94 Mauro Ranieri Asphalt mixtures improved with plastic additives: mix design and case study in an airport
In Figure 4.11 there is an example with nine geophones aligned,
which make it possible to obtain the deflection value recorded directly
under the loading plate.
Fig. 4.11 Layout of Geophones (Chou et al., 2007)
Regarding load impact systems there are two different types: single-
mass and double-mass. In a single-mass system (the system of testing
equipment used) a weight is dropped onto a single buffer connected to a
load plate, which rests on the surface being tested. The load force is
transferred through the plate, and the plate creates a deflection that simu-
lates a wheel load. The HWD test tries to replicate the force history and
deflection magnitudes of a moving aircraft tyre (Gopalakrishnan &
Thompson, 2004).
The HWD test was performed at Palermo International Airport in col-
laboration with the University of Messina using Dynatest testing equip-
ment in their possession, as shown in Figure 4.12.
Fig. 4.12 Dynatest testing equipment

Chapter 4 95 Case 3
To understand the present structural condition of the pavement in
question (a scheme is shown in Figure 4.13), an HWD test was conduct-
ed that evaluates the pavement structural strength. The maximum load
was around 240 KN.
Fig. 4.13 Scheme of the pavement in question
The pavement in question is a semi-rigid pavement, that is an inter-
mediate between a flexible pavement and a rigid pavement, where there
are the surface, binder and base courses in polymer-modified asphalt
(PMA, asphalt mixture with SP), a cement treated subbase, a cement sta-
bilized soil and the bedrock formed by calcarenite stones.
The test plan and sampling locations are shown in Figure 4.14. Three
drops for every station (at every alignment there were four stations 30 m
apart) were carried out on both alignments, as highlighted in the red box.
Data acquisition was followed by the process of calculating the elastic
moduli of individual layers in a multilayer system based on surface de-
flections. This process is known as “back-calculation”.
Back-calculation is one of the most common methods used to analyze
the deflection basin, which is collected from HWD. First initial moduli
are assumed, then surface deflections are calculated, and finally the mod-
uli are adjusted in an iterative fashion to converge on the measured de-
flections (Amadore et al., 2014).
As there are no closed-form solutions to accomplish this task, a math-
ematical model of the pavement system (called a forward model) is con-
structed and used to compute theoretical surface deflections with as-
sumed initial layer moduli values at the appropriate HWD loads. Through
a series of iterations, the layer moduli are changed, and the calculated de-
Surface (PMA) Binder (PMA)
Base (PMA)
Cement-treated
subbase
Stabilized soil
Bedrock

96 Mauro Ranieri Asphalt mixtures improved with plastic additives: mix design and case study in an airport
flections are then compared to the measured deflections until a match is
obtained within the tolerance limit (Gopalakrishnan & Thompson, 2004).
Fig. 4.14 Test plan and sampling locations
This process is computationally intensive although quick on modern
computers. There are quite a few well-known back-calculation programs

Chapter 4 97 Case 3
available from which a suitable software for the case study was selected.
In this study the back-calculation program used was BAKFAA.
Then laboratory tests were conducted for each bituminous material
layer in order to acquire the material properties for verifying the back-
calculation results.
4.3.3.1 BAKFAA
BAKFAA is a software program made available by the Federal Avia-
tion Administration (FAA). It performs back-calculation of pavement
layer modulus values using the FAA layered elastic analysis program
called LEAF and a downhill multidimensional simplex minimization
method. The function minimized is the sum of the squares of the differ-
ences between vertical pavement surface deflections measured with a
FWD/HWD and vertical pavement surface deflections computed with the
layered elastic program.
As reported in the guide, BAKFAA requires a minimum number of
inputs to adequately characterize the material properties of each layer in a
pavement structure and its response to loading:
• layer number (from 1 up to a maximum of 10 layers);
• Young’s Modulus of Elasticity, that is a constant ratio of stress and
strain, such as the values supplied by the FAA in Advisory Circular
AC 150/5370-11B in Table 4.9;
• Poisson’s ratio, that is the ratio of transverse to longitudinal strains
of a loaded specimen (from 0 to 0.5), such as the values supplied
by the FAA in Advisory Circular AC 150/5370-11B in Table 4.10;
• interface parameter, which represents the bond between two pave-
ment layers (from 0 = no bond to 1 = 100% bonding);
• thickness of each pavement layer;
• layer changeable (yes/no), which represents whether the associated
layer will allow the modulus seed value to be computed during the
back-calculation process or not.

98 Mauro Ranieri Asphalt mixtures improved with plastic additives: mix design and case study in an airport
Material Modulus values (MPa)
Asphalt Concrete 500÷14000
Portland Cement Concrete 7000÷60000
Lean-concrete Base 7000÷20000
Asphalt-treated Base 700÷10000
Cement-treated Base 1400÷14000
Granular Base 70÷350
Granular Subbase or Soil 30÷200
Stabilized Soil 70÷1400
Cohesive Soil 20÷170
Tab. 4.9 Typical Modulus values for paving materials
Material Poisson’s ratio values
Asphalt Concrete or Asphalt-treated Base 0.25÷0.40
Portland Cement Concrete 0.10÷0.20
Lean-concrete Base or Cement-treated Base 0.15÷0.25
Granular Base, Subbase, or Soil 0.20÷0.40
Stabilized Soil 0.15÷0.30
Cohesive Soil 0.30÷0.45
Tab. 4.10 Typical Poisson’s ratio values for paving materials
The input values used were the ones reported in Table 4.11.
Layer
Young’s
modulus
(MPa)
Poisson’s
ratio
Thickness
(mm)
Interface
parameter
Layer
changeable
Surface, Binder
and base Course 500 0.35 300 1 yes
Subbase 5000 0.20 200 1 yes
Stabilized Soil 350 0.20 600 1 yes
Bedrock 100 0.25 0 0 yes
Tab. 4.11 Input values used for the pavement in question
Then it is necessary to insert the sensor (geophone) offset, which is
measured from the point of loading, and measured deflections (Di) during
HWD testing (the values are reported in Tables 4.12-4.13) and these val-

Chapter 4 99 Case 3
ues are static within the BAKFAA software. It is possible to insert only 7
deflection values, and therefore they were chosen considering offsets
(distances from the axis of loading) of 0, 200, 300, 450, 600, 1200, 1500
mm (excluding offsets of 900 e 1800 mm). With each iteration of the
back-calculation cycle, the Young’s Modulus of each changeable layer is
adjusted in order to compute a new set of calculated deflections. Then a
value of root mean square (RMS) of the differences between measured
and calculated deflections is compared with a process tolerance value.
Then each text box representing a calculated deflection value at a specific
sensor location is updated. The calculation process terminates when the
RMS value is less than or equal to a pre-determined tolerance value.
Station Drop D1 D2 D3 D4 D5 D6 D7 D8 D9
1 1 297.90 40.60 19.90 14.20 11.30 9.00 6.20 4.00 2.10
1 2 334.70 61.00 30.20 21.80 18.70 13.10 9.50 6.30 3.90
1 3 675.90 135.60 70.10 51.60 44.20 31.10 21.10 14.50 10.20
2 4 159.90 30.40 16.90 10.20 8.20 5.90 4.30 2.50 0.30
2 5 230.20 49.50 26.20 17.60 13.60 9.80 7.30 4.20 1.60
2 6 513.60 122.60 65.30 44.30 34.90 23.90 16.60 10.10 7.10
3 7 158.40 45.60 33.80 28.00 24.80 19.00 15.00 11.40 9.10
3 8 226.00 71.90 53.60 44.10 38.80 29.60 23.00 17.20 12.60
3 9 501.00 177.90 135.40 113.10 100.00 76.40 58.30 43.20 33.50
4 10 152.40 48.70 35.50 29.00 25.90 20.20 17.00 16.20 16.70
4 11 230.30 78.60 57.40 45.90 41.00 33.00 26.50 22.00 18.90
4 12 526.80 188.30 139.10 112.40 98.40 78.60 61.50 49.50 41.10
Tab. 4.12 Measured deflections for the alignment 1
Station Drop D1 D2 D3 D4 D5 D6 D7 D8 D9
1 1 253.40 48.00 27.40 20.90 19.70 14.10 9.30 7.00 6.80
1 2 347.10 73.90 44.10 32.90 29.10 22.10 15.70 10.40 5.20
1 3 818.80 179.80 111.80 83.40 73.20 54.00 37.30 25.60 15.20
2 4 188.80 60.30 41.70 30.50 26.00 18.50 14.00 8.80 6.80
2 5 273.00 96.30 66.30 48.60 40.60 29.80 21.80 14.40 9.80
2 6 631.90 249.40 178.80 132.50 110.60 79.10 56.80 38.40 26.30
3 7 189.60 62.30 44.90 34.60 30.40 23.90 20.30 14.00 10.00
3 8 276.40 98.90 71.40 54.90 47.90 38.10 31.30 23.30 18.60
3 9 646.70 258.50 192.00 145.30 123.30 96.00 76.20 57.90 46.50
4 10 166.80 55.40 43.20 35.00 31.50 23.60 19.20 14.00 12.00
4 11 241.50 88.80 67.50 56.50 50.00 39.40 30.90 23.60 20.70
4 12 534.80 218.30 167.60 138.70 120.90 94.20 72.30 54.40 45.10
Tab. 4.13 Measured deflections for the alignment 2
100 Mauro Ranieri Asphalt mixtures improved with plastic additives: mix design and case study in an airport
After calculating the deflections, it is necessary to select load and run
LEAF (Layered Elastic Analysis Program in Forward Mode). The pur-
pose of this is to compute the pavement response for various aircraft
landing gear geometries. To compute the stresses, strains and deflections
at any point in a pavement structure resulting from the application of a
surface load BAKFAA uses a layered elastic mechanistic model.
Layered elastic models assume that each pavement structural layer is
homogeneous, isotropic, and linearly elastic. In other words, it is the
same everywhere and will rebound to its original form once the load is
removed. It works based on the Boussinesq mathematical model and,
thus, requires some basic assumptions, which are the following:
• the pavement layers extend infinitely in the horizontal direction;
• the bottom layer (usually the subgrade) extends infinitely down-
ward;
• the materials are not stressed beyond their elastic ranges.
In the list of predefined landing gear geometries there is also the Boeing
737-800, which is the critical airplane for Palermo International Airport,
according to the Report dated back to 2009 (Laboratorio Centrale Ponti e
Strade, 2009), being the one which requires the greatest pavement thick-
ness.
The leaf output is a text document containing four parts:
• pavement layered structure table;
• aircraft gear data table;
• tire data table with loads;
• calculation results by evaluation points in terms of stress, strain and
displacement.
The modulus values results are reported in Table 4.14.

Chapter 4 101 Case 3
Station/Drop Layer Alignment 1 Alignment 2
Station 1, Drop 3
E1 829.8 731.7
E2 5484.9 2540.5
E3 3968.1 1739.2
E4 2866.0 2347.0
Station 2, Drop 6
E1 841.2 1152.2
E2 10664.8 11240.6
E3 6098.8 446.0
E4 2021.7 1268.9
Station 3, Drop 9
E1 1424.3 1129.8
E2 8684.2 10133.5
E3 2508.8 657.9
E4 644.4 700.3
Station 4, Drop 12
E1 1344.1 1380.3
E2 5168.7 69421.2
E3 3104.3 141.1
E4 616.4 8051.5
Average Values
E1 1199.4 1004.5
E2 6445.9 7971.5
E3 3193.7 947.7
E4 1375.6 1438.7
Tab. 4.14 Modulus values
The asphalt temperature on the day of the HWD tests was 30°C. For this
temperature it is possible to say that the modulus values for asphalt mix-
ture courses (represented by E1 in Tab. 4.14) are in line with the values
obtained with laboratory tests, that is the average modulus values ob-
tained by back-calculation are within the range of modulus values ob-
tained with modulus tests and represented by the master curves in Figures
4.7-4.9.
4.4 Conclusions This study has shown an application of mixtures with polymeric addi-
tives in the surface, binder and base courses of the access pavement to
the new apron of Palermo International Airport, not yet open to air traf-
fic.

102 Mauro Ranieri Asphalt mixtures improved with plastic additives: mix design and case study in an airport
Both field test and laboratory test results have confirmed the high modu-
lus values obtained using additives in the asphalt mixtures and thus justi-
fy their use in settings such as airports, where the pavements are subject
to high loads, which leads to gradual surface degradation, as well as to
geometric boundaries, due to the complex and rigorous international
standards that rule the civil aviation and the airport area.

Conclusions
This experimental study has led to important conclusions regarding the
use of polymeric additives in asphalt mixtures.
The research activity carried out at the Road Materials Laboratory of
the University of Guimarães made it possible to compare two different
processes (WET and DRY) used for production of modified asphalt mix-
tures with polymers. Based on the results it was chosen the dry process in
order to continue the study regarding polymer-modified mixtures, by car-
rying out further research on various polymers, included the waste ones,
at the Road Materials Laboratory of the University of Palermo. Finally
the research activity was completed with a case study at real scale.
In particular, in the research activity carried out at the Road Materials
Laboratory of the University of Guimarães the results obtained indicated
that polymer-modified mixtures showed similar or improved perfor-
mance when compared to that of a conventional control mixture pro-
duced with harder virgin grade bitumen, not always available, or availa-
ble at higher costs, in several countries. Thus, modifying asphalt mixtures
with these plastic wastes can be an economic and ecological alternative
for paving works. Moreover, the mixtures produced via the dry process
showed increased water sensitivity and stiffness modulus properties.
The mixtures optimized in the research activity carried out at the Road
Materials Laboratory of the University of Palermo showed good stability
values and compaction and the positive influence that the additives stud-
ied have on these mixtures regarding permanent deformation resistance.
Moreover, the presence of the additives allowed optimization of mixtures
with lower binder contents and also made it possible to obtain higher
stiffness modulus values than for traditional mixtures without additives
as well as the values of the high modulus asphalt mixtures.
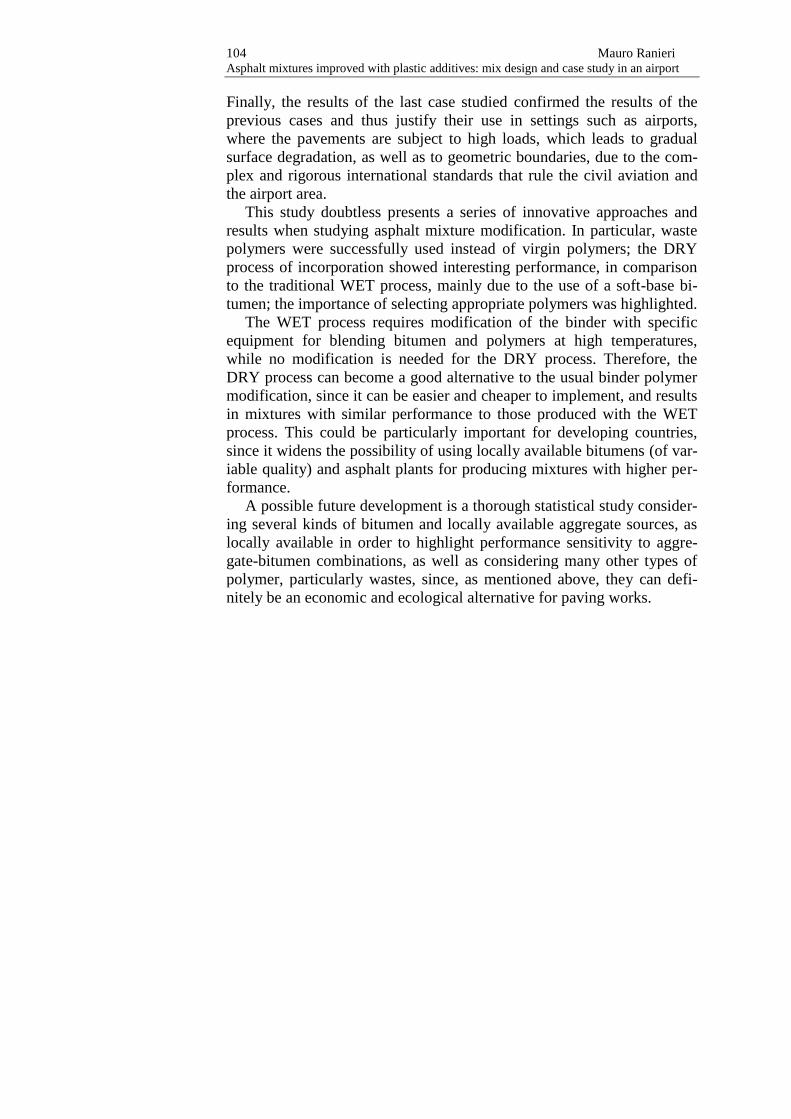
104 Mauro Ranieri Asphalt mixtures improved with plastic additives: mix design and case study in an airport
Finally, the results of the last case studied confirmed the results of the
previous cases and thus justify their use in settings such as airports,
where the pavements are subject to high loads, which leads to gradual
surface degradation, as well as to geometric boundaries, due to the com-
plex and rigorous international standards that rule the civil aviation and
the airport area.
This study doubtless presents a series of innovative approaches and
results when studying asphalt mixture modification. In particular, waste
polymers were successfully used instead of virgin polymers; the DRY
process of incorporation showed interesting performance, in comparison
to the traditional WET process, mainly due to the use of a soft-base bi-
tumen; the importance of selecting appropriate polymers was highlighted.
The WET process requires modification of the binder with specific
equipment for blending bitumen and polymers at high temperatures,
while no modification is needed for the DRY process. Therefore, the
DRY process can become a good alternative to the usual binder polymer
modification, since it can be easier and cheaper to implement, and results
in mixtures with similar performance to those produced with the WET
process. This could be particularly important for developing countries,
since it widens the possibility of using locally available bitumens (of var-
iable quality) and asphalt plants for producing mixtures with higher per-
formance.
A possible future development is a thorough statistical study consider-
ing several kinds of bitumen and locally available aggregate sources, as
locally available in order to highlight performance sensitivity to aggre-
gate-bitumen combinations, as well as considering many other types of
polymer, particularly wastes, since, as mentioned above, they can defi-
nitely be an economic and ecological alternative for paving works.
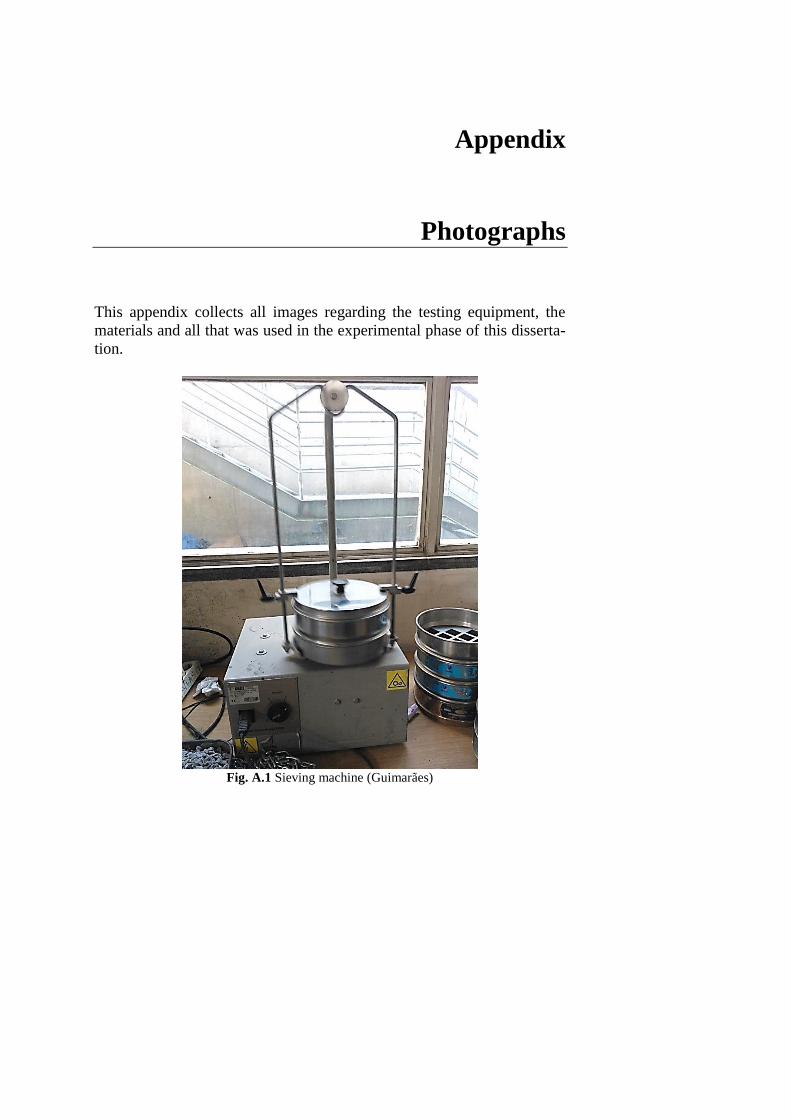
Appendix
Photographs
This appendix collects all images regarding the testing equipment, the
materials and all that was used in the experimental phase of this disserta-
tion.
Fig. A.1 Sieving machine (Guimarães)

106 Mauro Ranieri Asphalt mixtures improved with plastic additives: mix design and case study in an airport
Fig. A.2 Aggregate fraction size used (Guimarães)
Fig. A.3 Filler (Guimarães)
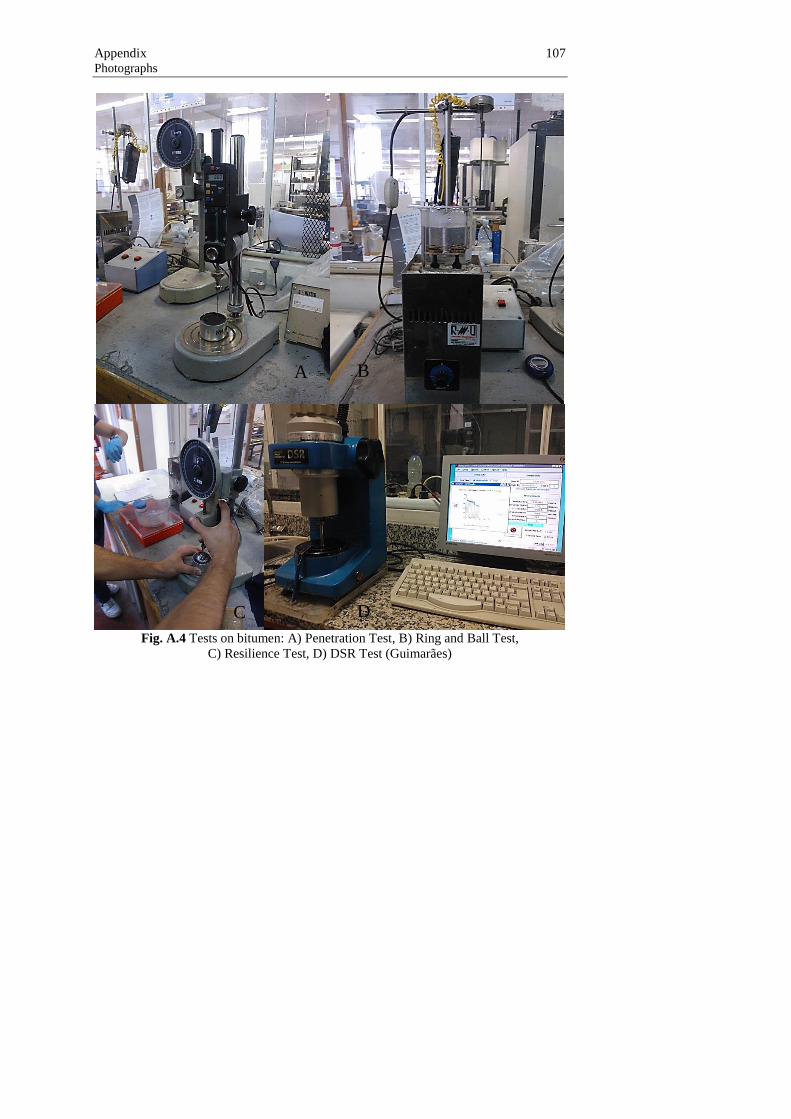
Appendix 107 Photographs
Fig. A.4 Tests on bitumen: A) Penetration Test, B) Ring and Ball Test,
C) Resilience Test, D) DSR Test (Guimarães)
A B
C D

108 Mauro Ranieri Asphalt mixtures improved with plastic additives: mix design and case study in an airport
Fig. A.5 Automatic impact Marshall compactor (Guimarães)
Fig. A.6 Marshall specimen height measuring device (Guimarães)

Appendix 109 Photographs
Fig. A.7 The Marshall Stability test (Guimarães)
Fig. A.8 The ITS test on specimens subjected to the water sensitivity test (Guimarães)

110 Mauro Ranieri Asphalt mixtures improved with plastic additives: mix design and case study in an airport
Fig. A.9 The stages of compaction by roller compactor (Guimarães)

Appendix 111 Photographs
Fig. A.10 The wheel tracker test (Guimarães)
Fig. A.11 The four-point bending test device (Guimarães)

112 Mauro Ranieri Asphalt mixtures improved with plastic additives: mix design and case study in an airport
Fig. A.12 Automatic impact Marshall compactor (Palermo)
Fig. A.13 Thermostatic water bath before the Marshall Stability test (Palermo)

Appendix 113 Photographs
Fig. A.14 The Marshall Stability test (Palermo)

114 Mauro Ranieri Asphalt mixtures improved with plastic additives: mix design and case study in an airport
Fig. A.15 Hydrostatic balance (Palermo)
Fig. A.16 Gyratory compactor (Palermo)

Appendix 115 Photographs
Fig. A.17 The compaction of slabs for WTT by roller compactor (Palermo)
Fig. A.18 The stages of a wheel tracker test (Palermo)
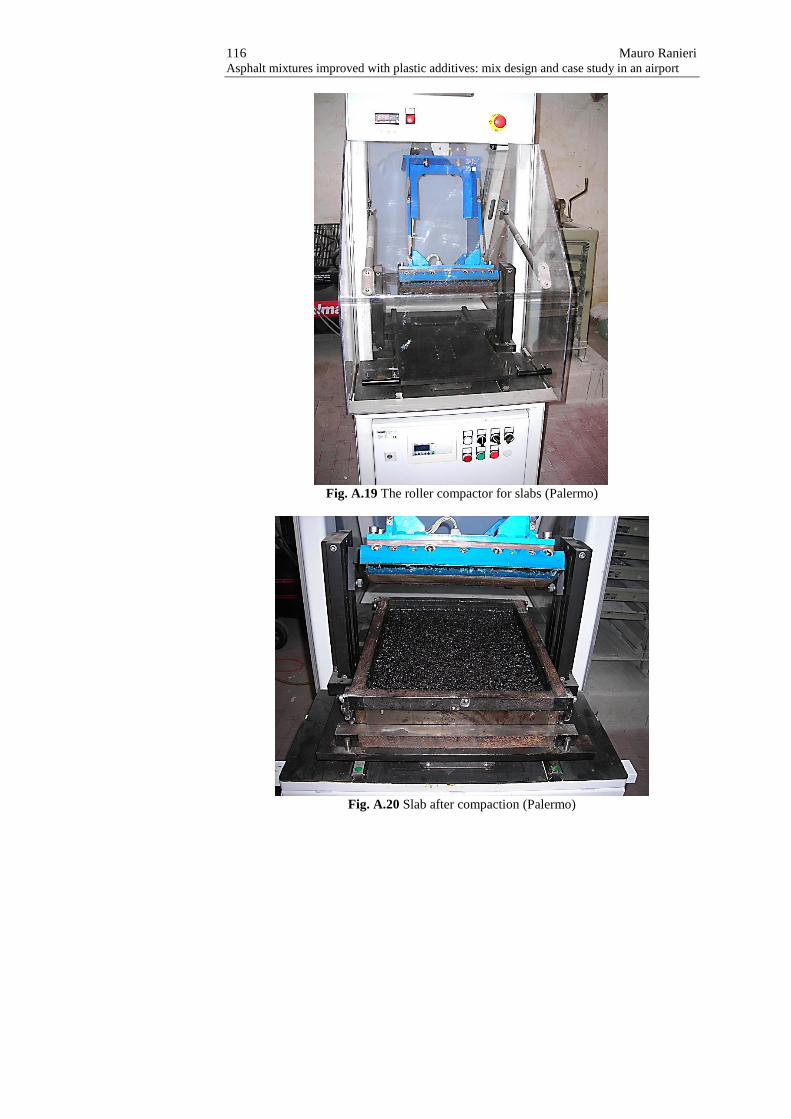
116 Mauro Ranieri Asphalt mixtures improved with plastic additives: mix design and case study in an airport
Fig. A.19 The roller compactor for slabs (Palermo)
Fig. A.20 Slab after compaction (Palermo)

Appendix 117 Photographs
Fig. A.21 Specimen subjected to the four-point bending test (Palermo)
Fig. A.22 The four-point bending test device (Palermo)

118 Mauro Ranieri Asphalt mixtures improved with plastic additives: mix design and case study in an airport
Fig. A.23 Screen CATS software during a 4PB test (Palermo)
Fig. A.24 Specimen subjected to the modulus test (Palermo)

Appendix 119 Photographs
Fig. A.25 Modulus test by means of a triaxial cell (Palermo)
Fig. A.26 Screen BAKFAA software (Palermo)

References
Abreu, L.P.F. et al., 2015. Recycled asphalt mixtures produced with high
percentage of different waste materials. Construction & Building Materi-
als 84:230-238.
Aflaki, S. & Tabatabaee, N., 2009. Proposals for modification of Iranian
bitumen to meet the climatic requirements of Iran. Construction & Build-
ing Materials 2(1):1-10.
Ahmadinia, E. et al., 2011. Using waste plastic bottles as additive for
stone mastic asphalt. Materials & Design 32:4844-4849.
Ahmadinia, E. et al., 2012. Performance evaluation of utilization of waste
Polyethylene Terephthalate (PET) in stone mastic asphalt. Construction
& Building Materials 36:984-989.
Airey, G.D. et al., 2004. Mechanical properties of crumb rubber modi-
fied asphalt mixture. Proceedings of the 3rd
Eurasphalt and Eurobitume
Congress. Vienna, May 12-14.
Alataş, T. & Yilmaz, M., 2013. Effects of different polymers on mechan-
ical properties of bituminous binders and hot mixtures. Construction &
Building Materials 42:161-167.
Ali, N. et al., 1994. A mechanistic evaluation of modified asphalt paving
mixtures. Canadian Journal of Civil Engineering 2:954–965.
122 Mauro Ranieri Asphalt mixtures improved with plastic additives: mix design and case study in an airport
Amadore, A. et al., 2014. Classification of measures from deflection tests
by means of fuzzy clustering techniques. Construction & Building Mate-
rials 53:173-181.
Anas S.p.A, 2009. Capitolato Speciale d’Appalto per lavori stradali.
Norme tecniche, Italy.
Arabani, M. et al., 2010. The effect of waste tire thread mesh on the dy-
namic behaviour of asphalt mixtures. Construction & Building Materials
24:1060-1068.
Artamendi, I. & Khalid, H., 2004. Different approaches to depict fatigue
of bituminous materials. Proceedings of 15th
European Conference of
Fracture (ECF 15), Stockholm (Sweden).
Ashraf, A., 2014. Thermal analysis of polymers (LDPE, HDPE) by dif-
ferential scanning calorimetry technique. Qatar University, December.
Awwad, M.T. & Shbeeb, L., 2007. The use of polyethylene in hot asphalt
mixtures. American Journal of Applied Sciences (6)4(1546-9239):390-
396.
Bahia, H.U. & Anderson D.A., 1995. The SHRP binder rheological pa-
rameters: why are they required and how do they compare to convention-
al properties. Transportation Research Board 1488:32-39.
Bayomy, f. & Abdo, A.A., 2007. Performance evaluation of Idaho HMA
mixes using gyratory stability. Final Report. National Institute for Ad-
vanced Transportation Technology. University of Idaho, May 1.
Becker, Y. et al., 2001. Polymer modified asphalt. Vision Tecnologica
9(1):39-50.
Bense, P., 1983. Enrobés armés par déchets de matières plastiques. Bulle-
tin des Laboratoires des Ponts et Chaussées (128)8(0458-5860):99-106.
Bestgen, J. et al., 2016. Mechanical and environmental suitability of re-
cycled concrete aggregate as a highway base material. Journal of Materi-
als in Civil Engineering (0401-6067).
References 123
Bouldin, M.G. et al., 1990. Rheology and microstructure of poly-
mer/asphalt blends. Rubber Chemistry & Technology 64:577-600.
Brosseaud, Y., 2012. Les enrobés à module elevé: bilan de l’experience
de française et transfert de technologie. Institut Français des Sciences et
Technologies des Transports de l’Aménagement et des Réseaux
(IFSTTAR).
Brûlé, B. & Druon, M., 1975. La microscopie de fluorescence appliquée
à l’observation de bitumes thermo plastiques. Bulletin des Laboratoires
des Ponts et Chaussées 79:11-14.
Brûlé, B. et al., 1988. Paving asphalt polymer blends: relationship be-
tween composition, structure and properties. Asphalt Paving Technology.
Journal of the Association of Asphalt Paving Technologists:41-64.
Brûlé, B., 1996. Polymer modified asphalt cement used in the road con-
struction industry: basic principles. Transportation Research Board. 75th
Annual Meeting. Washington, January 7-11.
Celauro, B. et al., 2001a. Indagine sperimentale su conglomerati bitumi-
nosi per strati di usura additivati con plastiche da scarti. Strade & Auto-
strade 6.
Celauro, B. et al., 2001b. Scarti di polietilene nella composizione di mi-
scele bituminose per microtappeti a caldo. 11th
National Conference
S.I.I.V. Verona, November 28-30.
Celauro, B. et al., 2004. Effect of the construction process on the perfor-
mances of asphalt paving mixes with crumb rubber from scrap tyres.
Proceedings of the 3rd
Eurasphalt and Eurobitume Congress. Vienna,
May 12-14.
Celauro, B. et al., 2006. Proprietà strutturali di conglomerati bituminosi
migliorati con plastiche post-uso. 16th
National Conference SIIV. Centro
Editoriale e Librario:351-365.
Celauro, B., 2005. Conglomerati bituminosi migliorati con materie poli-
meriche di scarto. Impiego dei materiali alternativi nelle infrastrutture
stradali. National Conference. Cagliari, May 2.
124 Mauro Ranieri Asphalt mixtures improved with plastic additives: mix design and case study in an airport
Celauro, C. et al., 2010. Production of innovative, recycled and high-
performance asphalt for road pavements. Resources, Conservation &
Recycling 54(6):337-347.
Central Pollution Control Board (CPCB), 2009. Assessment of plastic
waste and its management at airport and railway station in Delhi. CPCB
Report. December.
Chang, H.L. et al., 2000. Electron spin resonance study of bituminous
substances and asphaltenes. Chapter 9 in Asphaltenes and Asphalts 2.
Developments in Petroleum Science 40:229-280.
Chen, J.S. et al., 2002. Evaluation and optimization of the engineering
properties of polymer-modified asphalt. Practical Failure Analysis. ASM
International 2(3):75-83.
Chou, C.-P. et al., 2007. Methodology of applying heavy weight deflec-
tometer for calculation of runway pavement classification number.
Transportation Research Record. Journal of the Transportation Research
Board 1990 (1):57-64.
Cominsky, R.J. et al., 1994. The Superpave mix design manual for new
construction and overlays. Report SHRP-A-407. Strategic Highway Re-
search Program-National Research Council, Washington, DC.
Coni, M. et al., 2008. FE evaluation of 4-point bending test for fatigue
cracking. Chapter 5 in Pavement cracking. Mechanisms, Modeling, De-
tection, Testing and Case Histories. Al-Qadi, Scarpas & Loizos (Eds.).
CRC Press:271-282. Proceedings of the 6th
RILEM International Confer-
ence on cracking in pavements. Chicago (USA), June 16-18.
Corte, J.F., 2001. Development and uses of hard grade asphalt and of
high modulus asphalt mixes in France. Transportation Research Circular
503:12-30.
Costa, L. et al., 2013. Incorporation of Waste Plastic in Asphalt Binders
to Improve their Performance in the Pavement. International Journal of
Pavement Research & Technology 6(4):457-464.

References 125
De Backer, C. et al., 2007. Enrobés à module élevé (EME): de la concep-
tion à la mise en oeuvre. Compte rendu de recherche (CRR) 43.
Department of Transport and main roads, 2015. High modulus asphalt
(EME2) pavement design. Technical note 142. State of Queensland,
March.
Des Croix, P. & Planque, L., 2004. Experience with optimised hard
grade bitumens in high modulus asphalt mixes. 3rd
Eurasphalt & Eurobi-
tume Congress Vienna, Book I:158-172.
Di Benedetto, H. et al., 2004. Fatigue of bituminous mixtures. RILEM
TC 182-PEB. Performance testing and evaluation of bituminous materi-
als. Materials & Structures 37(267):202-216.
Dinis-Almeida, M. et al., 2016. Performance of warm mix recycled as-
phalt containing up to 100% RAP. Construction & Building Materials
112:1-6.
Distin, T. et al., 2008. High Modulus Asphalt: assessment of viability
based on outcomes of overseas fact finding mission. Southern African Bi-
tumen Association (Sabita) Report.
Dondi, G. et al., 2013. Traditional and dissipated energy approaches to
compare the 2PB and 4PB flexural methodologies on a warm Mix
asphalt. Construction & Building Materials 47:833-839.
Dondi, G. et al., 2014. Performance evaluation of Construction and
Demolition and other waste materials. Sustainability, Eco-efficiency, and
Conservation in Transportation Infrastructure Asset Management. CRC
Press:223-234, London.
EP, 2014. Pavimentação: Caracteristicas dos materiais. Caderno de en-
cargos tipo obra. Estradas de Portugal S. A. Almada (Portugal), Septem-
ber.
Epps, J.A., 1986. Asphalt pavement modifiers. Civil Engineering Maga-
zine, April.

126 Mauro Ranieri Asphalt mixtures improved with plastic additives: mix design and case study in an airport
Espersson, M., 2014. Effect in the high modulus asphalt concrete with
the temperature. Construction & Building Materials 71:638-643.
Foster, K.S. & Hein, D.K., 1999. Stylink polymer modified asphalt ce-
ment. Pavement performance evaluation. John Emery Geotechnical En-
gineering Limited Research Report 199053. McAsphalt Industries Limi-
ted, Ontario, Canada.
Garcia-Morales, M. et al., 2005. Effect of waste polymer addition on the
rheology of modified bitumen. Fuel 85(11):936-943.
García-Travé, G. et al., 2016. Use of reclaimed geomembranes for modi-
fication of mechanical performance of bituminous binders. Journal of
Materials in Civil Engineering (0401-6021).
Gawande, A. et al., 2012. An overview on waste plastic utilization in as-
phalting of roads. Journal of Engineering Research & Studies 3(2):1-5.
Giavarini, C. et al., 1996. Production of stable polypropylene-modified
bitumens. Fuel 75(6):681-686.
Giuffré, O. & Di Francisca, A., 2001. Un sistema produttivo per lo smal-
timento delle plastiche da scarti: l’impiego nei conglomerati bituminosi.
Strade & Autostrade, September-October.
Giuliani, F. et al., 2009. Effects of polymer modification on the fuel
resistance of asphalt binders. Fuel 88(9):1539-1546.
Gómez-Meijide, B. et al., 2016. Recycled construction and demolition
waste in cold asphalt mixtures: evolutionary properties. Journal of
Cleaner Production 112(1):588-598.
Gonzalez, O. et al., 2002. Rheological techniques as a tool to analyze
polymer–bitumen interactions: bitumen modified with polyethylene and
polyethylene-based blends. Energy Fuel 16:1256-1263.
Goodrich, J.L., 1988. Asphalt and polymer modified asphalt properties
related to the performance of asphalt concrete mixes. Association of As-
phalt Paving Technologists Proc. 57:116-175.

References 127
Gopalakrishnan, K. & Thompson, M.R., 2004. Backcalculation of airport
flexible pavement non-linear moduli using artificial neural networks. In:
Proc. 17th
International FLAIRS Conference, Miami Beach, Florida.
Gorkem, C. & Sengoz, B., 2009. Predicting stripping and moisture in-
duced damage of asphalt concrete prepared with polymer modified bitu-
men and hydrated lime. Construction & Building Materials 23(6):2227-
2236.
Guyot, X., 2013. Use of high modulus asphalt. EME: case studies in the
Indian Ocean area. Colas International Division. Indian Ocean.
Habib, N.Z. et al., 2010. Rheological properties of polyethylene and pol-
ypropylene modified bitumen. International Journal of Civil, Environ-
mental, Structural, Construction & Architectural Engineering 4(12):381-
385.
Horak, E., 2008. Structural analysis of HiMA pavements. Railway Pro-
tection Force (RPF), November.
Huang, B. et al., 2009. Laboratory evaluation of incorporating waste ce-
ramic materials into Portland cement and asphaltic concrete. Construc-
tion & Building Materials 23:3451-3456.
Huang, Y. et al., 2007. A review of the use of recycled solid waste mate-
rials in asphalt pavements. Resources, Conservation & Recycling
52(1):58-73.
Iliescu, M. & Pop, M., 2010. Performance of modified asphalt mixtures
obtained using plastomers added in station. Acta Technica Napocensis:
Civil Engineering & Architecture 53(1221-5848):115-123.
Isacsson, U. & Lu, X., 1999. Characterization of bitumens modified with
SEBS, EVA and EBA polymer. Journal of Materials Science 34:3737-
3745.
Isacsson, U. & Zeng, H., 1998. Low-temperature cracking of polymer-
modified asphalt. Materials & Structures 31(1):58-63.

128 Mauro Ranieri Asphalt mixtures improved with plastic additives: mix design and case study in an airport
Iterchimica S.r.l., 2015. SuperPlast. Conglomerati bituminosi ad elevate
prestazioni. Libretto Tecnico. Iterchimica S.r.l., Bergamo.
Kalantar, Z.N. et al., 2012. A review of using waste and virgin polymer
in pavement. Construction & Building Materials 33:55-62.
Karmakar, S. & Roy, T., 2016. Effect of waste plastic and waste tires ash
on mechanical behavior of bitumen. Journal of Materials in Civil Engi-
neering (0401-6006).
Khattak, M.J. & Baladi, G. Y., 2001. Fatigue and permanent deformation
models for polymer-modified asphalt mixtures. Transportation Research
Record 1767(0361-1981):135-145.
Kim, S. et al., 2013. Evaluation of rut resistance of polymer-modified as-
phalt concretes. Advanced Materials Research:282-288.
King, G. et al., 1999. Additives in asphalt. Journal of the Association of
Asphalt Paving Technologists 68:32-69.
Kraus, G., 1982. Modification of asphalt by block polymers of butadiene
and styrene. Rubber Chemistry & Technology 55:1389-1402.
Laboratorio Centrale Ponti e Strade, 2009. Aeroporto di Palermo “Fal-
cone e Borsellino”. Analisi HWD Heavy Weight Deflectometer. NTS Eu-
rope Srl-Roma.
Larsen, D.O. et al., 2009. Micro-structural and rheological characteristics
of SBS-asphalt blends during their manufacturing. Construction & Build-
ing Materials 23(8):2769-2774.
Lastra-González, P. et al., 2016. Comparative analysis of the perfor-
mance of asphalt concretes modified by dry way with polymeric waste.
Construction & Building Materials 112:1133-1140.
Le Bouteiller, E., 2016. High modulus asphalt: the French experience.
International seminar Asphalt Pavements. Opatija (Croatia), April 6-7.

References 129
Lee, H.J. et al., 2007. Performance evaluation of high modulus asphalt
mixtures for long life asphalt pavements. Construction & Building Mate-
rials 21:1079-1087.
Lesueur, D., 2009. The colloidal structure of bitumen: consequences on
the rheology and on the mechanisms of bitumen modification. Advances
in Colloid & Interface Science 145:42-82.
Lewandowski, L.H., 1994. Polymer Modification of Paving Asphalt
Binders. Rubber Chemistry & Technology 67(3):447-480.
Little, D.N., 1987. Investigation of asphalt additives. Report A/RD-
87/001. FHWA, U. S. Department of Transportation.
Losa, M. & Dringoli, M., 2007. Stato dell’arte rapporto 1.0: predisposi-
zione delle linee guida per la progettazione ed il controllo delle pavimen-
tazioni stradali per la viabilità ordinaria. University of Pisa.
Lu, X. & Isacsson, U., 1997. Rheological characterization of styrene-
butadiene-styrene copolymer modified bitumens. Construction & Build-
ing Materials 11(1):23-32.
Lu, X., 1997. On polymer modified road bitumens. Doctoral dissertation.
KTH Royal Institute of Technology, Stockholm.
Maggiore, C. et al., 2012. Fatigue resistance: is it possible having a
unique response? 3rd
Four Point Bending Beam Conference. CRC
Press:239-249. Davis, California (USA), September 17-18.
Maze, M.M. et al., 2000. Recyclage des déchets de polyéthylène.
Méthodes rapides de caractérisation performantielle. Revue Générale des
Routes et des Aerodromes 764:72-75.
METTLER TOLEDO, 2013. Thermal analysis of polymers. Selected ap-
plications. METTLER TOLEDO, Greifensee (Switzerland).
MIT, 2002. Studio a carattere pre-normativo delle Norme tecniche di
Tipo Prestazionale per Capitolati Speciali d’Appalto. Ministero delle
Infrastrutture e dei Trasporti-Ispettorato per la Circolazione e la
Sicurezza Stradale, Italy.

130 Mauro Ranieri Asphalt mixtures improved with plastic additives: mix design and case study in an airport
Modarres, A. & Hamedi, H., 2014. Effect of waste plastic bottles on the
stiffness and fatigue properties of modified asphalt mixes. Materials &
Design 61:8-15.
Moramarco, M., 2012. La progettazione delle pavimentazioni perpetue.
Rassegna del bitume 72:31-44.
Morgan, P. & Mulder, A., 1995. The shell bitumen industrial handbook.
Shell Bitumen. Chertsey (Surrey, UK).
Naskar, M. et al., 2010. Effect of waste plastic as modifier on thermal
stability and degradation kinetics of bitumen/waste plastics blend. Ther-
mochim Acta 509:128-134.
Nikolaides, A., 2014. Highway Engineering: Pavements, Materials and
Control of Quality. CRC Press. November 24th
.
Nkgapele, M. et al., 2012. Construction of a high modulus asphalt (Hi-
MA) trial section Ethekwini: South Africa’s first practical experience
with design, manufacturing and paving of HiMA. 31st Southern African
Transport Conference. Pretoria (South Africa), July 9-12.
Nunn, M.E. & Smith, T.M., 1994. Evaluation of enrobés à module élevé
(EME): a French high modulus roadbase material. Project Report PR66.
TRL Limited.
Nunn, M.E. & Smith, T.M., 1997. Road trials of high modulus base
(HMB). TRL Report TRL231. TRL Limited.
Oliveira, J.R.M. et al., 2013. Use of a warm mix asphalt additive to re-
duce the production temperatures and to improve the performance of as-
phalt rubber mixtures. Journal of Cleaner Production 41:15-22.
Parracini, G. et al., 2013. Riabilitazione della pista 17L/35R
dell’aeroporto di Milano Malpensa. Strade & Autostrade 6.
Pasandín, A.R. et al., 2015. Influence of ageing on the properties of bi-
tumen from asphalt mixtures with recycled concrete aggregates. Journal
of Cleaner Production 101:165-173.

References 131
Pasetto, M., 1998. Contributo dei bitumi ad alto modulo complesso al
miglioramento delle caratteristiche di portanza delle pavimentazioni stra-
dali. Rassegna del bitume 30:35-43.
Petho, L. & Denneman, E., 2013a. High modulus asphalt mix (EME) for
heavy duty applications and preliminary laboratory test results in Aus-
tralia, 15th
AAPA International Flexible Pavements Conference. Bris-
bane (Australia), September 22-25.
Petho, L. & Denneman, E., 2013b. EME Technology Transfer to Austral-
ia: An Explorative Study. Austroads Ltd. Sydney (Australia), October.
Petho, L. et al., 2014. High Modulus High Fatigue Resistance Asphalt
(EME2) Technology Transfer. Austroads Ltd. Sydney (Australia), No-
vember.
Pettinari, M. et al., 2014. The effect Cryogenic Crumb Rubber in cold re-
cycled mixes for road pavements. Construction & Building Materials
63:249-256.
Picado-Santos, L. et al., 2003. Stiffness modulus and phase angle predic-
tion models for high modulus asphalt concrete. International Journal of
Pavements 2(3):37-49. University of Mississippi.
Picado-Santos, L. et al., 2009. Assessment of stiffness and fatigue tests in
Portugal. 2nd
Workshop on Four Point Bending. Pais (ed.), University of
Minho. Guimarães (Portugal), September 24-25th
.
Polacco, G. et al., 2005. Asphalt modification with different polyeth-
ylene-based polymers. European Polymer Journal 41:2831-2844.
Polacco, G. et al., 2006. Relation between polymer architecture and non-
linear viscoelastic behavior of modified asphalts. Colloid & Interface
Science 11(4):230-245.
Ponniah, J. & Kennepohl, G., 1996. Polymer-modified asphalt pavements
in Ontario: performance and cost-effectiveness. Transportation Research
Record. Journal of the Transportation Research Board 1545:151-160.

132 Mauro Ranieri Asphalt mixtures improved with plastic additives: mix design and case study in an airport
Praticò, F.G., 2007. Quality and timeliness in highway construction
contracts: a new acceptance model based on both mechanical and surface
performance of flexible pavements. Construction Management &
Economics 25(3):305-313.
Raad, L., 1997. Low temperature cracking of modified AC mixes in Alas-
ka. Final executive summary. Report SPR-95-14, INE/TRC 97.05. Alas-
ka Department of Transportation and Public Facilities, FHWA.
Rahi, M. et al., 2015. Rutting characteristics of styrene eth-
ylene/propylene-styrene polymer modified asphalt. Journal of Materials
in Civil Engineering 27(4).
Rahman, M. et al., 2004. Laboratory investigation to assess moisture
sensitivity of dry process CRM asphalt mixtures. International Confer-
ence on Sustainable Waste Management. Kingston University, UK. Sep-
tember 14-15.
Rahman, M. et al., 2010. Moisture susceptibility of high and low com-
paction dry process crumb rubber-modified asphalt mixtures. Transporta-
tion Research Record. Journal of the Transportation Research Board
2180(2):121-129.
Roberts, F.L. et al., 1996. Hot mix asphalt materials, mixture design, and
construction. 2nd
ed. National Asphalt Pavement Association (NAPA)
Research and Education Foundation, Lanham (Maryland).
Rowe et al., 2009. Evaluation of aspects of E* test using hot-mix asphalt
specimens with varying void contents. Transportation Research Record
Journal 2127:164-172.
Rowe, G. & Sharrock, M., 2011. Alternate shift factor relationship for
describing the temperature dependency of the visco-elastic behaviour of
asphalt materials. Transportation Research Record. Journal of the Trans-
portation Research Board 2207:125-135.
Sabina et al., 2009. Performance evaluation of waste plastic/polymer
modified bituminous concrete mixes. Journal of Scientific & Industrial
Research 68:975-979.

References 133
Sabita, 2010. Transferring HiMA technology to SA. Sabita Asphalt News
24(2):25.
Sanders, P.J. & Nunn, M.E., 2005. The application of enrobé à module
élevé in flexible pavements. TRL Report TRL636. TRL Limited.
Sangiorgi; C. et al., 2015. Construction and demolition waste recycling:
an application for road construction. International Journal of Pavement
Engineering 16:530-537.
Sengoz, B. & Isikyakar, G., 2008. Analysis of styrene-butadiene-styrene
polymer modified bitumen using fluorescent microscopy and conven-
tional test methods. Journal of Hazardous Materials 150(2):424-432.
Sengoz, B. & Topal, A., 2005. Use of asphalt roofing shingle waste in
HMA. Construction & Building Materials 19:337-346.
Serfass, J.P. et al., 2000. Enrobés bitumineux modifiés au polyethylene.
Revue Générale des Routes et des Aerodromes 787: 47-57.
Silva, H.M.R.D. et al., 2011. Waste polymers recycling in high perfor-
mance asphalt mixtures. Wastes: solutions, treatments and opportunities.
1st International Conference, University of Minho. Guimarães (Portugal),
September 12-14th
.
Silva, H.M.R.D. et al., 2012. Are totally recycled hot mix asphalts a sus-
tainable alternative for road paving? Resources, Conservation & Recy-
cling 60:38-48.
Tayfur, S. et al., 2007. Investigation of rutting performance of asphalt
mixtures containing polymer modifiers. Construction & Building Mate-
rials 21(2):328-337.
Venturini, L. et al., 2015. Polyfunctional additives for PMA. New recy-
cling and high performance technologies. Libretto Tecnico. Iterchimica
S.r.l., Bergamo.
Von Quintus, H.L. & Killingsworth, B., 1998. Analyses relating to
pavement material characterizations and their effects on pavement per-
formance. FHWA-RD-95-085.

134 Mauro Ranieri Asphalt mixtures improved with plastic additives: mix design and case study in an airport
Von Quintus, H.L. et al., 2007. Quantification of effect of polymer modi-
fied asphalt on flexible pavement performance. Transportation Research
Record. Journal of the Transportation Research Board 2001:141-154.
Vonk, W.C. & Bull, A.L., 1989. Phase phenomena and concentration ef-
fect in blends of bitumen and cariflex. Proceedings of the 7th
International
Roofing Congress. Munich, May 30-June 1.
Wang, S. et al., 2015. Asphalt modified by thermoplastic elastomer based
on recycled rubber. Construction & Building Materials 93 678-684.
Wang, T. et al., 2010. The compatibility of SBS-modified asphalt. Petro-
leum Science & Technology 28(7):764-772.
Wegman, D. et al., 1999. Collaborative evaluations of low temperature
superpave performance graded asphalt binders. Transportation Research
Board 1661:75-82.
Xu, M. et al., 2015. Novel method to prepare activated crumb rubber
used for synthesis of activated crumb rubber modified asphalt. Journal of
Materials in Civil Engineering 27(5).
Xue, Y. et al., 2009. Utilization of municipal solid waste incineration ash
in stone mastic asphalt mixture: pavement performance and environmen-
tal impact. Construction & Building Materials 23:989-996.
Zhu, J. et al., 2014. Polymer modification of bitumen: advances and chal-
lenges. European Polymer Journal 54:18-38.
Zielinski, J. et al., 1995. An effect of polymers on thermal stability of bi-
tumens. Journal of Thermal Analysis & Calorimetry 43:271-277.
Zoorob, S.E. & Suparma, L.B., 2000. Laboratory design and investiga-
tion of the properties of continuously graded asphaltic concrete contain-
ing recycled plastic aggregate replacement (plastiphalt). Cement & Con-
crete Composites 22:233-242.
Zubeck, H. et al., 2002. Performance of polymer modified asphalt aggre-
gate mixtures in Alaska. Journal of Cold Regions Engineering 16(4):170-
190.

Standards
AC 150/5370-11B:2001. Use of nondestructive testing in the evaluation
of airport pavements. Federal Aviation Administration (FAA).
ASTM D113:2007. Standard test method for ductility of bituminous ma-
terials. American Society for Testing and Materials (ASTM) Internation-
al.
ASTM D792:2013. Standard test methods for density and specific gravi-
ty (relative density) of plastics by displacement. American Society for
Testing and Materials (ASTM) International.
CNR B.U. n.65/1978. Determinazione della porosità dei granuli - Per-
centuale dei vuoti di aggregate - Indice dei vuoti di aggregati. Consiglio
Nazionale delle Ricerche (CNR).
EN 933-1:2012. Tests for geometrical properties of aggregates - Part 1:
Determination of particle size distribution - Sieving method. European
Committee for Standardization (CEN).
EN 933-3:2012. Tests for geometrical properties of aggregates - Part 3:
Determination of particle shape - Flakiness index. European Committee
for Standardization (CEN).
EN 933-8:1997. Tests for geometrical properties of aggregates. Assess-
ment of fines. Sand equivalent test. European Committee for Standardiza-
tion (CEN).
136 Mauro Ranieri Asphalt mixtures improved with plastic additives: mix design and case study in an airport
EN 933-9:2013. Tests for geometrical properties of aggregates - Part 9:
Assessment of fines - Methylene blue test. European Committee for
Standardization (CEN).
EN 1097-2:2010. Tests for mechanical and physical properties of aggre-
gates - Part 2: Methods for the determination of resistance to fragmenta-
tion. European Committee for Standardization (CEN).
EN 1097-3:1999. Tests for mechanical and physical properties of aggre-
gates - Part 3: Determination of loose bulk density and voids. European
Committee for Standardization (CEN).
EN 1097-6:2013. Tests for mechanical and physical properties of aggre-
gates - Part 6: Determination of particle density and water absorption.
European Committee for Standardization (CEN).
EN 1097-7:2008. Tests for mechanical and physical properties of aggre-
gates - Part 7: Determination of the particle density of filler - Pyknome-
ter method. European Committee for Standardization (CEN).
EN 1426:2015. Methods of tests for petroleum and its products. Bitumen
and bituminous binders - Determination of needle penetration. European
Committee for Standardization (CEN).
EN 1427:2015. Methods of tests for petroleum and its products. Bitumen
and bituminous binders - Determination of the softening point - Ring and
ball method. European Committee for Standardization (CEN).
EN ISO 3838:2005. Crude petroleum and liquid or solid petroleum
products - Determination of density or relative density - Capillary -
Stoppered pycnometer and graduated bicapillary pycnometer methods.
European Committee for Standardization (CEN).
EN 12591:2009. Methods of tests for petroleum and its products. Bitu-
men and bituminous binders - Specifications for paving grade bitumens.
European Committee for Standardization (CEN).
EN 12593:2015. Methods of tests for petroleum and its products. Bitu-
men and bituminous binders - Determination of the Fraass breaking
point. European Committee for Standardization (CEN).
Standards 137
EN 12607-1:2015. Methods of tests for petroleum and its products. Bitu-
men and bituminous binders - Determination of resistance to hardening
under influence of heat and air - Part 1: RTFOT method. European
Committee for Standardization (CEN).
EN 12697-5:2010. Bituminous mixtures - Test methods for hot mix as-
phalt - Part 5: Determination of the maximum density. European Com-
mittee for Standardization (CEN).
EN 12697-6:2012. Bituminous mixtures - Test methods for hot mix as-
phalt - Part 6: Determination of bulk density of bituminous specimens.
European Committee for Standardization (CEN).
EN 12697-8:2003. Bituminous mixtures - Test methods for hot mix as-
phalt - Determination of void characteristics of bituminous specimens.
European Committee for Standardization (CEN).
EN 12697-12:2008. Bituminous mixtures - Test methods for hot mix as-
phalt - Part 12: Determination of the water sensitivity of bituminous
specimens. European Committee for Standardization (CEN).
EN 12697-22:2007. Bituminous mixtures - Test methods for hot mix as-
phalt. Part 22: Wheel tracking. European Committee for Standardization
(CEN).
EN 12697-23:2006. Bituminous mixtures - Test methods for hot mix as-
phalt - Part 23: Determination of the indirect tensile strength of bitumi-
nous specimens. European Committee for Standardization (CEN).
EN 12697-24:2012. Bituminous mixtures - Test methods for hot mix as-
phalt - Part 24: Resistance to fatigue. European Committee for Standard-
ization (CEN).
EN 12697-26:2012. Bituminous mixtures - Test methods for hot mix as-
phalt - Part 26: Stiffness. European Committee for Standardization
(CEN).
EN 12697-31:2007. Bituminous mixtures - Test methods for hot mix as-
phalt. Specimen preparation by gyratory compactor. European Commit-
tee for Standardization (CEN).

138 Mauro Ranieri Asphalt mixtures improved with plastic additives: mix design and case study in an airport
EN 12697-34:2012. Bituminous mixtures - Test methods for hot mix as-
phalt - Part 4: Marshall test. European Committee for Standardization
(CEN).
EN 12697-35:2016. Bituminous mixtures - Test methods - Part 35: La-
boratory mixing. European Committee for Standardization (CEN).
EN 13302:2010. Methods of tests for petroleum and its products. Bitu-
men and bituminous binders. Determination of dynamic viscosity of bi-
tuminous binder using a rotating spindle apparatus. European Commit-
tee for Standardization (CEN).
EN 13880-3:2003. Test method for the determination of penetration and
recovery (resilience). European Committee for Standardization (CEN).
EN 14770:2012. Bitumen and bituminous binders - Determination of
complex shear modulus and phase angle - Dynamic Shear Rheometer
(DSR). European Committee for Standardization (CEN).
ISO 11357-3:2011. Plastics - Differential scanning calorimetry (DSC)
Determination of temperature and enthalpy of melting and crystalliza-
tion. International Organization for Standardization (ISO).
NF P 98-140:1999. Enrobés Hydrocarbonés. Couches d’assise: enrobés
à module élevé. Association Français de Normalisation (AFNOR).
Recommended