Alan F. Hamlet,Phil Mote, Martyn Clark,
Dennis P. Lettenmaier
Center for Science in the Earth System Climate Impacts Group
and Department of Civil and Environmental EngineeringUniversity of Washington
October, 2005
Effects of Climate Change on Snowpack, Runoff, Soil Moisture and Evaporation in the Western U.S. from
1916-2003

Background

DJF Temp (°C) NDJFM Precip (mm)
PNW
CA CRB
GB
Winter Climate of the Western U.S.

Trends in Temperature and Precipitation
Natural Climate Influence Human Climate Influence
All Climate Influences
Natural AND human influences explain the observations of global warming best.

Rel. Trend %/yr Trend (°C/yr) Trend (°C/yr)
Precipitation Tmax Tmin
DJF
Avg
Tem
pera
ture
DJF
Avg
Tem
pera
ture
Rel. Trend %/yr Trend (°C/yr) Trend (°C/yr)
1916-2003
1947-2003
Trends in Winter (Oct-Mar) Precipitation and Temperature

Rel. Trend %/yr Trend (°C/yr) Trend (°C/yr)
Precipitation Tmax Tmin
DJF
Avg
Tem
pera
ture
DJF
Avg
Tem
pera
ture
Rel. Trend %/yr Trend (°C/yr) Trend (°C/yr)
1916-2003
1947-2003
Trends in Summer (Apr-Sept) Precipitation and Temperature
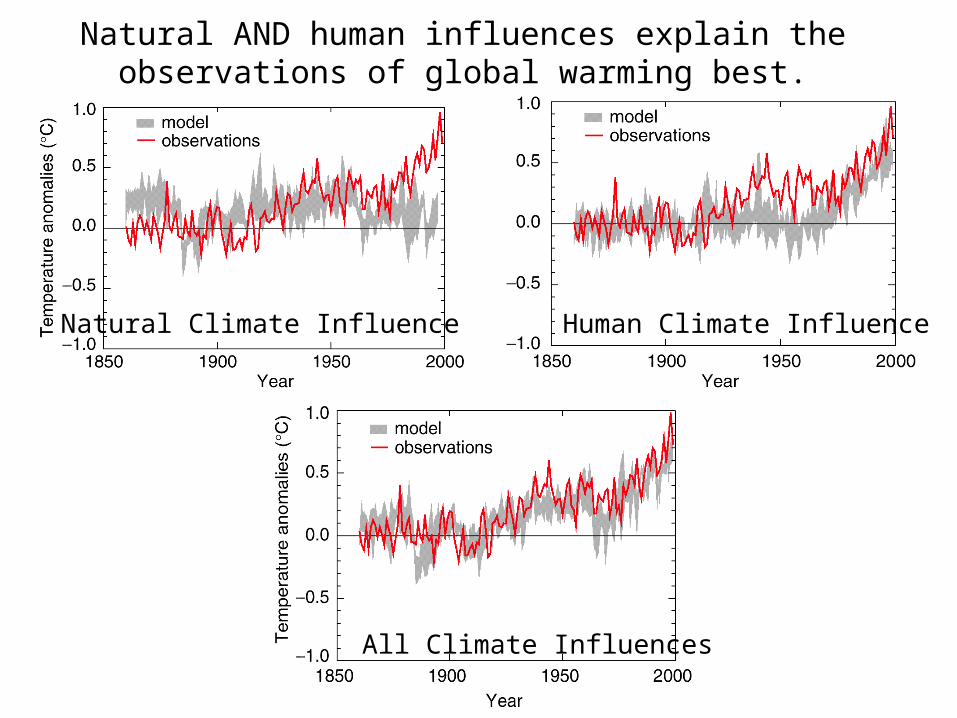
In temperature sensitive areas of the West, we should be able to see the effects of observed global warming in the historic snow and streamflow records.
Using models we should be able to more fully analyze these changes, as well as other hydrologic effects which are not typically measured (evaporation and soil moisture).

Snow Model
Schematic of VIC Hydrologic Model and Energy Balance Snow Model
PNW
CACRB
GB

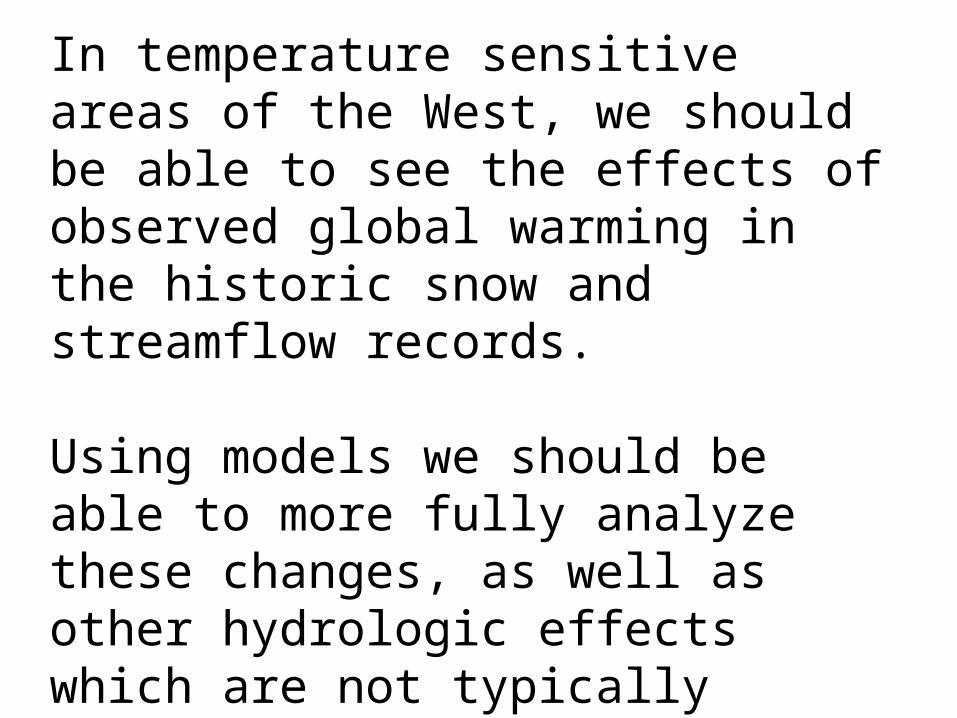
Trends in April 1 Snowpack
Mote P.W.,Hamlet A.F., Clark M.P., Lettenmaier D.P., 2005, Declining mountain snowpack in western North America, BAMS (in press)
Trends in April 1 SWE 1950-1997

Trend %/yr
DJF
avg
T (
C)
Trend %/yr
Overall Trends in April 1 SWE from 1947-2003

Trend %/yr
DJF
avg
T (
C)
Trend %/yr
Temperature Related Trends in April 1 SWE from 1947-2003
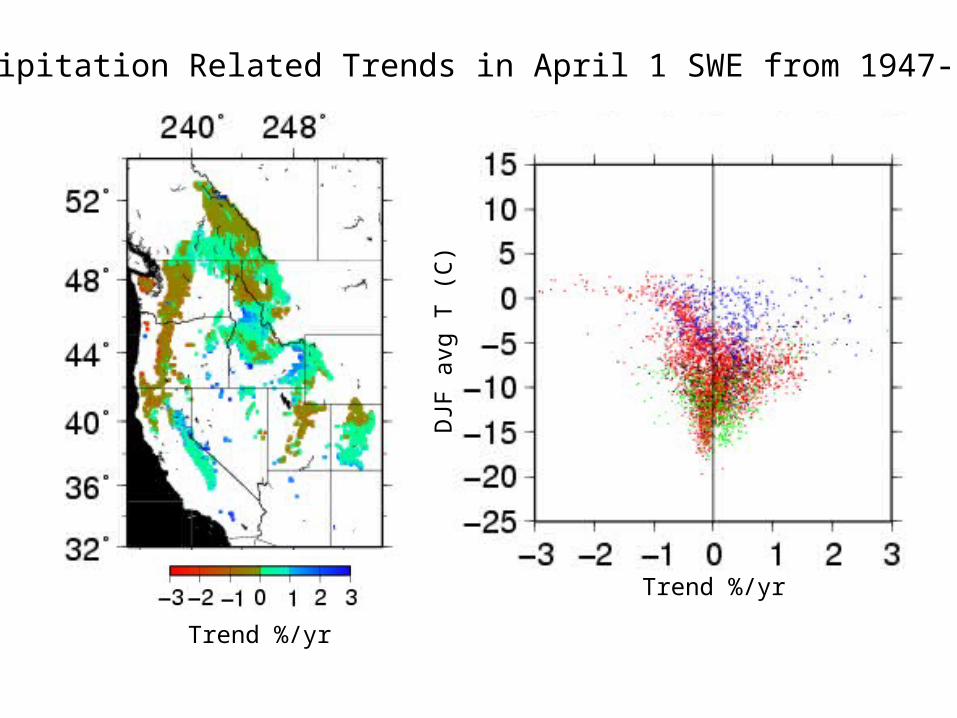
Trend %/yr
DJF
avg
T (
C)
Trend %/yr
Precipitation Related Trends in April 1 SWE from 1947-2003
y = -0.5851x + 295.29
0
100
200
300
400
500
600
19
16
19
21
19
26
19
31
19
36
19
41
19
46
19
51
19
56
19
61
19
66
19
71
19
76
19
81
19
86
19
91
19
96
20
01
1-Apr
Linear (1-Apr)
y = -0.7553x + 301.86
0
50
100
150
200
250
300
350
400
450
500
19
16
19
21
19
26
19
31
19
36
19
41
19
46
19
51
19
56
19
61
19
66
19
71
19
76
19
81
19
86
19
91
19
96
20
01
1-Apr
Linear (1-Apr)
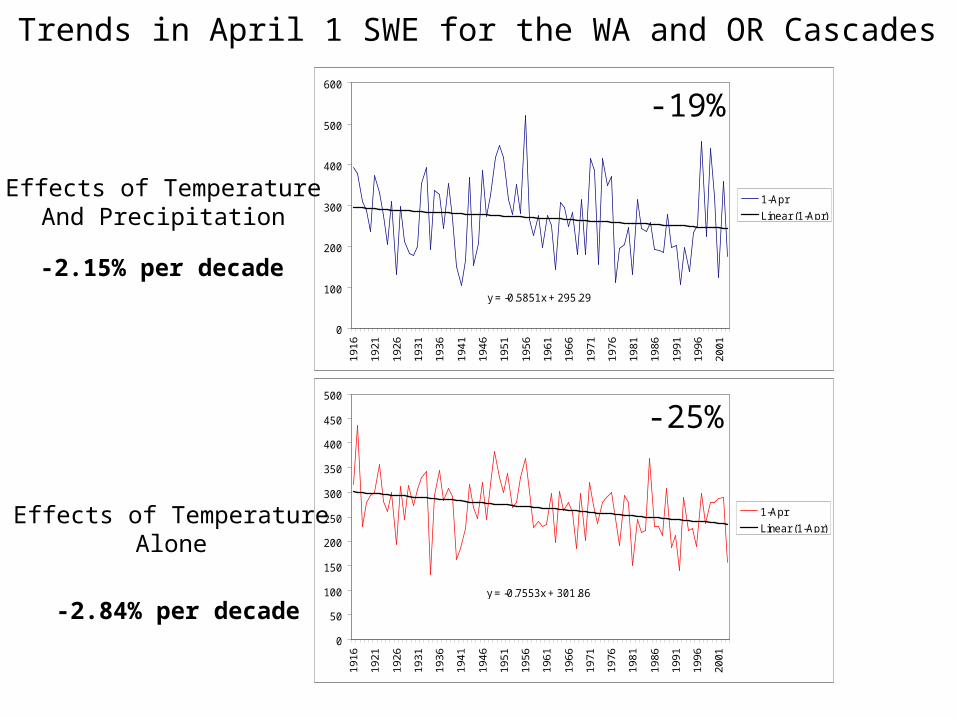
Effects of TemperatureAnd Precipitation
Effects of TemperatureAlone
-19%
-25%
Trends in April 1 SWE for the WA and OR Cascades
-2.84% per decade
-2.15% per decade

y = -1.739x + 313.96
0
100
200
300
400
500
600
19
50
19
53
19
56
19
59
19
62
19
65
19
68
19
71
19
74
19
77
19
80
19
83
19
86
19
89
19
92
19
95
19
98
20
01
1-Apr
Linear (1-Apr)
y = -1.1264x + 288.63
0
50
100
150
200
250
300
350
400
19
50
19
53
19
56
19
59
19
62
19
65
19
68
19
71
19
74
19
77
19
80
19
83
19
86
19
89
19
92
19
95
19
98
20
01
1-Apr
Linear (1-Apr)
Effects of TemperatureAnd Precipitation
Effects of TemperatureAlone
Trends in April 1 SWE for the WA and OR Cascades
-35%
-23%
-4.25% per decade
-6.48% per decade

Cedar River: -30.7%
y = -0.0020x + 4.3416
0
0.1
0.2
0.3
0.4
0.5
0.6
0.7
1945 1955 1965 1975 1985 1995 2005
May
-Sep
t fr
acti
on
of
ann
ual
flo
w
May-Sept frac
Linear (May-Septfrac)
SFTolt River: -15.7%
y = -0.0010x + 2.2890
0
0.1
0.2
0.3
0.4
0.5
0.6
1945 1955 1965 1975 1985 1995 2005
May
-Sep
t fr
acti
on
of
ann
ual
flo
w
May-Sept frac
Linear (May-Septfrac)
Obs. Summer Water Availability is Declining
55 years
Figures courtesy of Matt Wiley and Richard Palmer at CEE, UW

b) Max Accumulation c) 90 % Melta) 10 % Accumulation
Change in Date
Change in Date
Change in Date
Change in Date
DJF
Tem
p (C
)
Change in Date
DJF
Tem
p (C
)
Change in Date
DJF
Tem
p (C
)
TrendsinSWE1916-1997

Trends in Runoff Timing
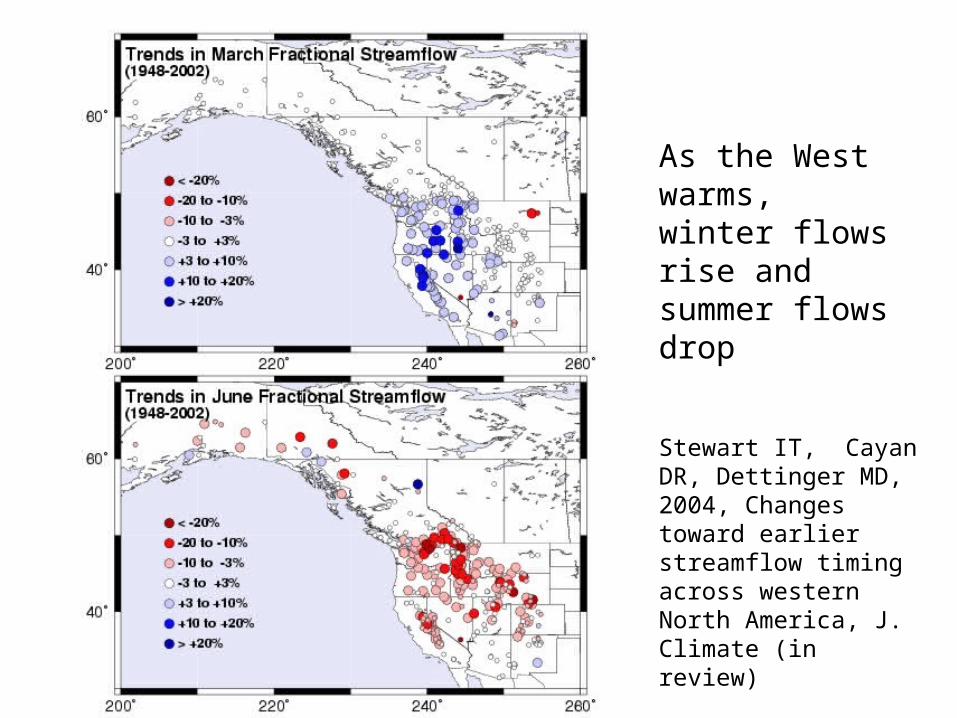
As the West warms,winter flows rise and summer flows drop
Stewart IT, Cayan DR, Dettinger MD, 2004, Changes toward earlier streamflow timing across western North America, J. Climate (in review)

March June
Relative Trend (% per year)
Trends in simulated fraction of annual runoff in each month from 1947-2003 (cells > 50 mm of SWE on April 1)

Trend %/yrD
JF T
emp
(°C
)Trend %/yr
DJF
Tem
p (°
C)
Trends in March Runoff Trends in June Runoff

Trends in Soil Moisture
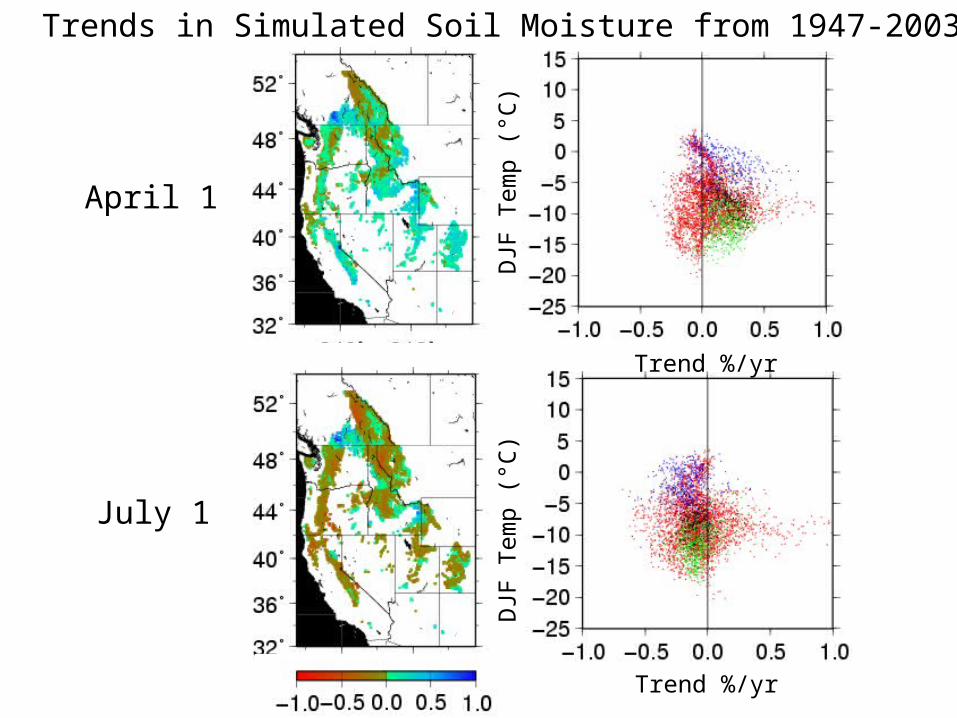
April 1
July 1
Trends in Simulated Soil Moisture from 1947-2003
Trend %/yr
DJF
Tem
p (°
C)
DJF
Tem
p (°
C)
Trend %/yr

Trend %/yrD
JF T
emp
(°C
)Trend %/yr
DJF
Tem
p (°
C)
Trends in April 1 SM Trends in July 1 SM

Trends in the “Runoff Ratio”(runoff/precipitation)

Trend Oct-Mar PCP
Trend Apr-Sep PCP
Tre
nd R
unof
f R
atio
Tre
nd R
unof
f R
atio
Trend %/yr
DJF
Tem
p (°
C)
Conclusions•Large-scale changes in the seasonal dynamics of snow accumulation and melt have occurred in the West as a result of increasing temperatures.
•Hydrologic changes include earlier and reduced peak snowpack, more runoff in March, less runoff in June, and corresponding increases in simulated spring soil moisture and decreases in late summer and fall soil moisture.
•Because these effects are shown to be predominantly due to temperature changes, we expect that they will both continue and increase in intensity as global warming progresses in the 21st century.
•Trends in the runoff ratio are primarily linked to winter precipitation trends, which are not necessarily related to global warming

Trends in Potential Evaporation

Average July PotET over the Southern Plain Region in the Snake River Basin Current Climate vs. MPI2040 scenario(Effects of temperature increases alone)
Current Climate MPI2040+ 4 C
PotET (mm/day)

Trends in July Avg PotET over the Southern Plain Region from 1915-2002
y = -0.0061x + 7.3589
5
5.5
6
6.5
7
7.5
8
8.5
1915
1920
1925
1930
1935
1940
1945
1950
1955
1960
1965
1970
1975
1980
1985
1990
1995
2000
Ref
eren
ce C
rop
Po
tET
(m
m/d
ay)
jul
Linear (jul)

Will Global Warming be “Warm and Wet” or “Warm and Dry”?
Answer: Probably BOTH!
150000
200000
250000
300000
350000
400000
45000019
00
1910
1920
1930
1940
1950
1960
1970
1980
1990
2000
Ap
r-S
ept F
low
(cfs
)

Implications for Water Planning

•Water resources managers and planners should expect systematically decreasing natural flows in summer in river basins with substantial winter snow accumulation.
•Hydrologic changes due to global warming are likely to exacerbate future stresses on water systems due to increasing population, and may intensify existing conflicts between water supply and other objectives such as instream flow for fish.
•There is little evidence in the historic record for systematic changes in winter precipitation associated with global warming in the West. Water managers should be prepared to cope with extended periods of both “warm and wet” and “warm and dry” conditions at different times in the future.
•Effects to potential evaporation (irrigation demand) remain unclear and appear to be strongly affected by uncertain changes in cloudiness and humidity in addition to temperature.
•Straight-forward methods to include these kinds of hydrologic changes in water planning studies are readily available.

Selected References:
Hidalgo HG, Cayan DR, Dettinger MD, 2005: Sources of variability of evapotranspiration in California, J. of 6 (1): 3-19
Hamlet A.F., Lettenmaier D.P., 2005, Production of temporally consistent gridded precipitation and temperature fields for the continental U.S., J. of Hydrometeorology, 6(3), 330-336
Hamlet A.F., Mote P.W, Clark M.P., Lettenmaier D.P., 2005, Effects of temperature and precipitation variability on snowpack trends in the western U.S., J. of Climate (in press)
Hamlet A.F., Mote P.W., Clark M.P., Lettenmaier D.P., 2005: 20th Century Trends in Runoff, Evapotranspiration, and Soil Moisture in the Western U.S. , J. of Climate (in review)
Mote P.W., Hamlet A.F., Clark M.P., Lettenmaier D.P., 2005, Declining mountain snowpack in western North America, BAMS, 86 (1), 39-49
Stewart IT, Cayan DR, Dettinger MD, 2005: Changes toward earlier streamflow timing across western North America, J. Climate, 18 (8): 1136-1155
Recommended