A WASTE MINIMIZATION PROGRAM
UTILIZING STATISTICAL PROCESS CONTROL CONCEPTS
F. C. Gilmore and M. F. Healy
Mobay Corporation
New Martinsville, West Virginia
ABSTRACT
Mobay Corporation operates a large production facility a t New Martinsville,
W e s t Virginia. The plant has a complete wastewater treatment system which
utilizes activated sludge biological treatment followed by activated carbon
adsorption. For several years, gas chromatography has been used to monitor
specific organic compounds in the wastewater treatment process, in addition
to the standard analytical parameters, such as Total Organic Carbon, Biologi-
cal Oxygen Demand, and Chemical Oxygen Demand, commonly used with such
processes. In order to reduce the levels of organics fed to the treatment
plant, a program was instituted in 1983 in which the concepts of statistical
process control were applied to the reporting of these analytical data. This
focused the attention of the production units on their waste streams, as-
sisted with justification of process modifications, and documented the
improvements achieved. Over a five-year period, specific organics were
reduced by 80 percent, and levels of priority pollutants in the plant efflu-
ent were reduced to generally non-detectable levels.
\
BACKGROUND
Mobay Corporation operates a large production facility a t New Martinsville,
W e s t Virginia. The plant produces primarily polyurethane chemicals and
intermediates. The plant also produces iron oxide pigments and concentrated
hydrochloric and nitric acids. The plant has a complete wastewater treatment
system which utilizes activated sludge biological treatment followed by acti-
vated carbon adsorption. A simplified flow diagram of the wastewater system
is presented in Figure 1. The biological system consists of two activated
sludge units operated in parallel, with sludge recycle from a common sec-
ondary clarifier. The activated carbon system consists of two or three tow-
ers operated upflow.
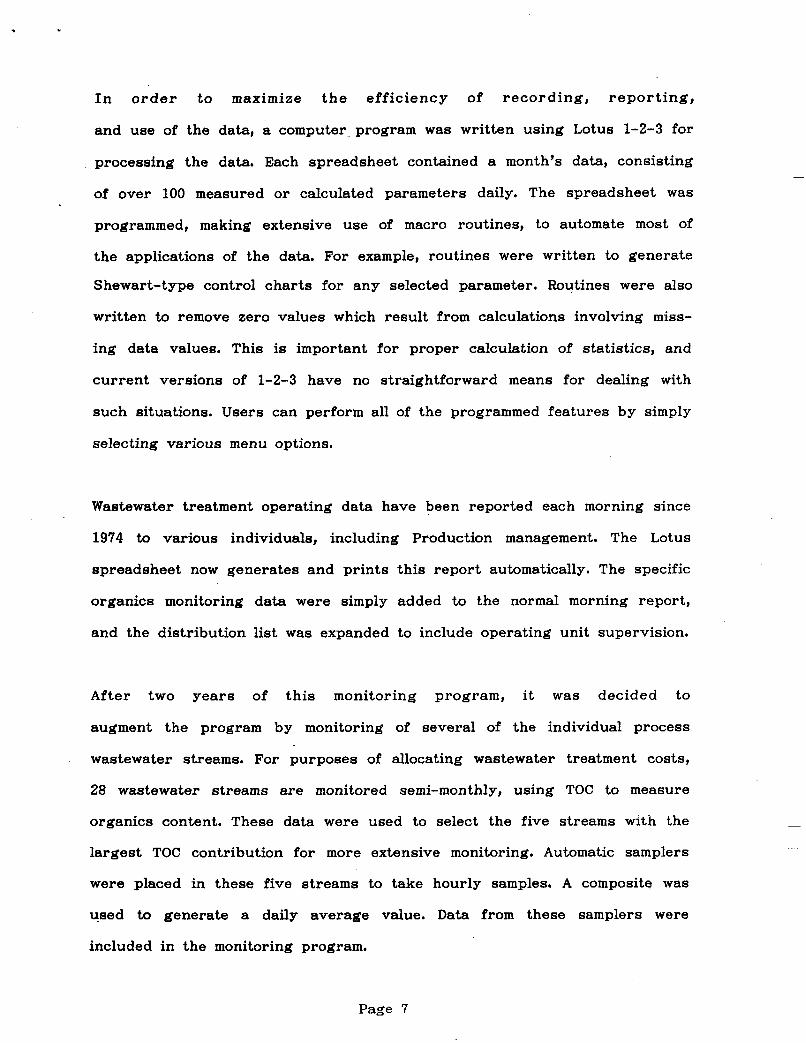
For several years, gas chromatographic (GC) analyses of the primary streams
a t the wastewater treatment unit have been used to supplement the standard
analytical parameters, such as Total Organic Carbon (TOC), Biological Oxygen
Demand (BOD), and Chemical Oxygen Demand (COD), The GC method used for
these analyses quantifies nine different organics, including isomers. Of
course, numerous other compounds are present, but these nine compounds
.serve to monitor most of the plant processes. The primary sources of each
of these compounds is indicated in Figure 2.
The organic compounds fed to the treatment plant have varying degrees of
treatability by the wastewater treatment system. Some compounds, such a s
aniline, are removed readily by the biological system. Others, such as dini-
trotoluene, are not readily removed biologically, and may even be toxic to
the biota. Some constituents, such as high-molecular-weight polyether
polyols, are not degraded biologically to any significant degree. Most organic
compounds passing from the biological system are adsorbed to some degree
Page 2
by the activated carbon system, polar organics being adsorbed less than
non-polar organics. It can be shown that the concentration of constituents
in the effluent wastewater is directly proportional to the feed concentra-
tions, all other things being equal, so reducing the amounts of compounds in
' the feed to the treatment system has a direct effect on the quality of the
effluent, Reducing the levels of toxic compounds in the feed improves the
efficiency of removal of all degradable constituents.
It was recognized that regulatory requirements for priority pollutants in
wastewater effluents were becoming more stringent. In order to improve the
efficiency of the treatment system as well as to improve the overall effluent
quality, a program was implemented in 1982 to improve the degree to which
the analytical monitoring data were reported to the production units. It was
recognized that it was more efficient to remove constituents in the produc-
tion units, where the compounds are more concentrated, where removal pro-
cesses can be tailored to the specific compounds, and where the compounds
can be recovered for recycle.
DISCUSSION
The stream selected for primary reporting was the feed stream to the bio-
logical units (Biox Feed). This stream had been monitored for specific organ-
ics since 1978 in order to better control the biological system. A t the t ime
this program was begun, this was the first wastewater stream whose flow
was' continuously measured. This point also follows equalization, which
reduces variation in the composition. Since only one feed sample per day is
analyzed, the leveling effect of the preceding tanks is desirable, improving
the representativeness of the sample. The disadvantage is that the sample
actually represents an event which occurred at the production unit almost
Page 3
two days previously. Each sample is a composite of 3 samples taken at
8-hour intervals. The daily flow variation is less than 10 percent, so flow
proportioning is not necessary.
The gas chromatographic method used for this program was developed pri-
marily for this application. The method had to suffice for the whole range of
concentrations. Preference was given to the range of concentrations in the
feed samples. The sample is adjusted to p H 8 and extracted with chloroform,
using a concentration factor of 50 to 1. A 2.5-meter column packed with
OV-3 methyl-silicone is used, with a flame ionization detector. Bromobenzene
is used as an internal standard. The normal quantitation limits are around
0.1 ppm. In the first few years that this method was used, these sensitivi-
ties sufficed even for the effluent samples. In the past couple of years,
effluent concentrations usually have been below detection limits with this
method. Most of the time, the secondary clarifier effluent concentrations are
at or below these quantitation limits. In order to get reliable quantitation of
the effluent samples, more sophisticated procedures, such as the EPA 600
series GC methods are required. These methods are too time-consuming and
manpower-intensive for our daily monitoring.
The compounds quantified by this method are listed in Table 1 along with
the normal range of concentrations found in the Biox Feed sample.
For reporting purposes, the MNT isomers are totaled and reported simply a s
MNT. Similarly, the DNT is reported as the total of the isomers. Thus, nine
component values are normally reported.
Page 4
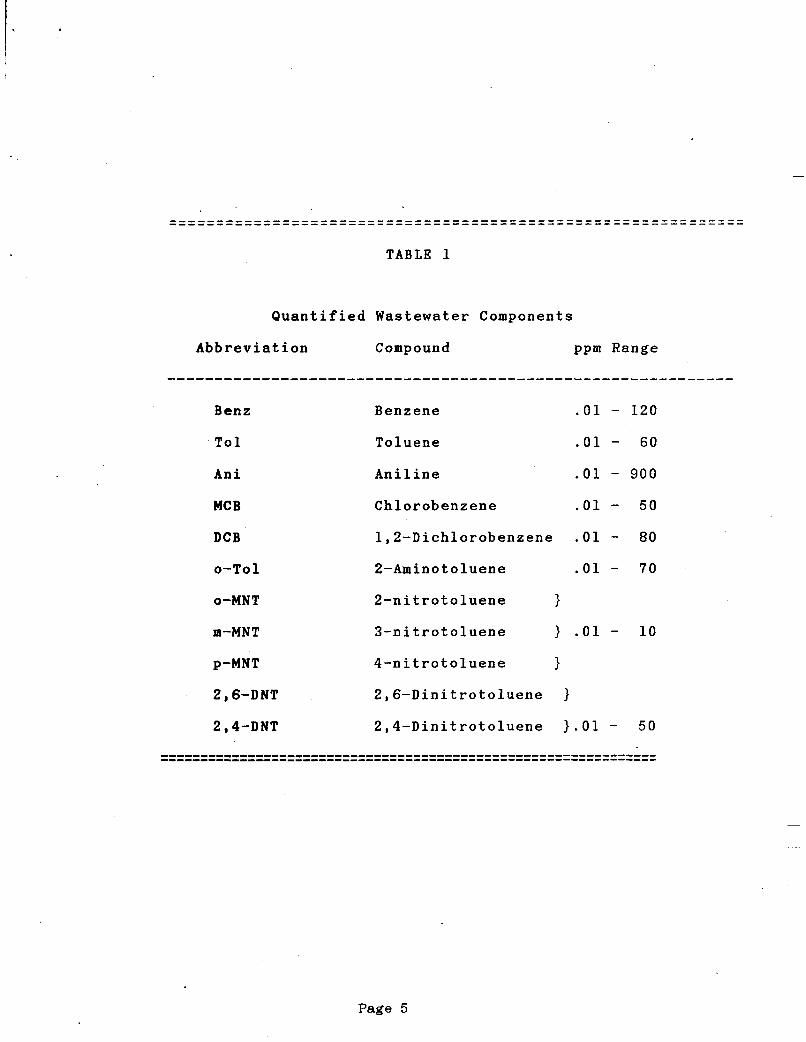
TABLE 1
Quantified Wastewater Components
Abbreviation Compound ppm Range
............................................................
Benz Benzene .01 - 120
To1 Toluene .01 - 60
Ani Aniline .01 - 900
MCB Chlorobenzene .01 - 50
Page 5
The other analytical methods are standard procedures normally used for
wastewater analyses. These are all described in Standards Methods for the
Examination of Water and Wastewater , 16th Edition, 1985. The primary par-
ameters of interest to this study are Biological Oxygen Demand (BOD) and
Total Organic Carbon (TOC).
The analytical efforts were backed up by a modest QA/QC program. This was
not only to insure consistency in the results but also to insure that the
inevitable questions raised by the production units being monitored could be
answered positively - "Yes! The numbers are real!" Once the production
units realized that they could rely on the analytical results, they found
they could generally correlate them with their operations.
The primary QA/QC procedures consisted of calibration of instruments
at least daily, along with analysis of standards and spiked samples on a
regular basis and careful recording of all analytical data. The data were also
monitored for consistency and reasonableness, and unusual results were
investigated immediately.
The suspected primary source of errors were the flow measurements. W e
found that, in spite of our best efforts, it was extremely difficult to insure
accuracy of the process flow meters at all t imes. While we recognized that
our quantity results could contain significant error at any given t ime, we
reasoned that the errors should average out over t ime, so we just made
every reasonable effort to minimize any known sources of error in flow
measurements.
Page 6
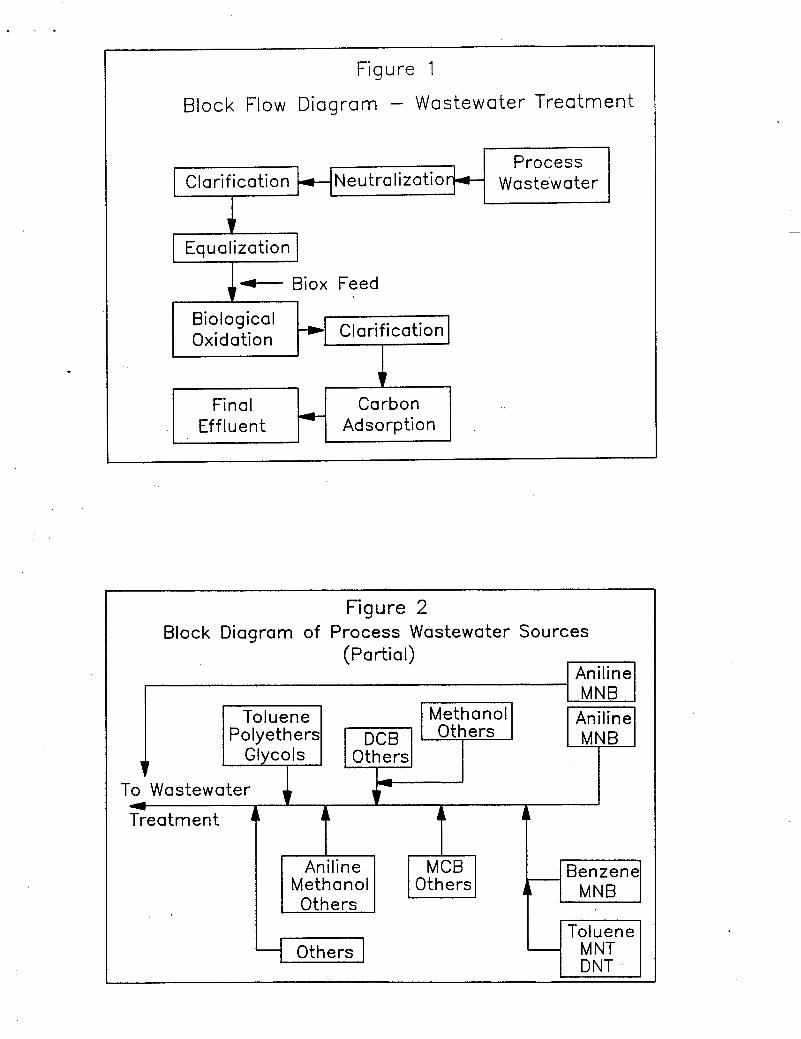
Figure 1
Block Flow Diagram - Wastewater Trea tment
MNB
Po lyeth ers Others
Wastewater
A+ Biox Feed 1 I
Biological 1 Oxidation CI arif ica tion
Carbon Adsorption
Final 1 Effluent
To Wastewater 7 Treat men t I
T T Aniline
Methanol
Others I To1 uene
I - I

L
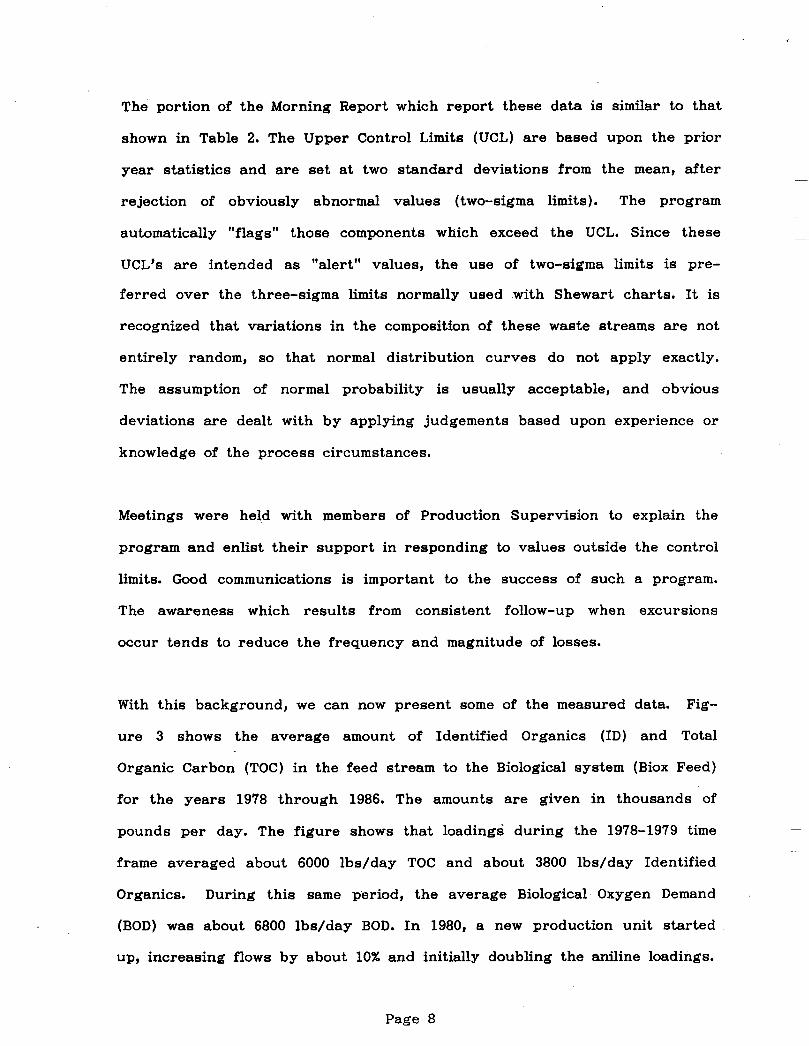
I n o r d e r to maximize t h e efficiency of recording, repor t ing ,
and use of the data, a computer" program was written using Lotus 1-2-3 for
processing the data. Each spreadsheet contained a month's data, consisting
of over 100 measured or calculated parameters daily. The spreadsheet was
programmed, making extensive use of macro routines, to automate most of
the applications of the data. For example, routines were written to generate
Shewart-type control charts for any selected parameter. Routines were also
written to remove zero values which result from calculations involving miss-
ing data values. This is important for proper calculation of statistics, and
current versions of 1-2-3 have no straightforward means for dealing with
such situations. U s e r s can perform all of the programmed features by simply
selecting various menu options.
Wastewater treatment operating data have been reported each morning since
1974 to various individuals, including Production management. The Lotus
spreadsheet now generates and prints this report automatically. The specific
organics monitoring data were simply added to the normal morning report,
and the distribution list was expanded to include operating unit supervision.
A f t e r two years of this monitoring program, it w a s decided to
augment the program by monitoring of several of the individual process
wastewater streams. For purposes of allocating wastewater treatment costs,
28 wastewater streams are monitored semi-monthly, using TOC to measure
organics content. These data were used to select the five streams with the
largest TOC contribution for more extensive monitoring. Automatic samplers
were placed in these five streams to take hourly samples. A composite was
used to generate a daily average value. D a t a from these samplers were
included in the monitoring program.
Page 7
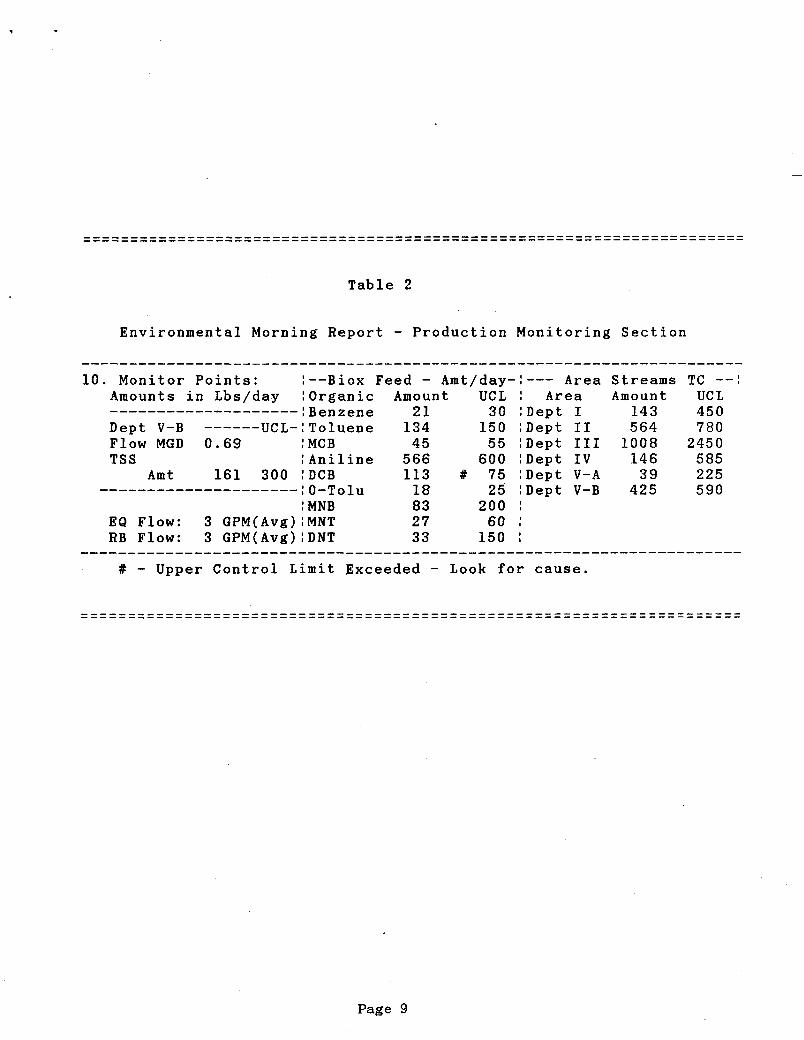
The portion of the Morning Report which report these data is similar to that
shown in Table 2. The Upper Control Limits (UCL) are based upon the prior
year statistics and are set at two standard deviations from the mean, after
rejection of obviously abnormal values (two-sigma l imits) . The program
automatically "flags" those components which exceed the UCL. Since these
UCL's are intended as "alert" values, the use of two-sigma l imi ts is pre-
ferred over the three-sigma l imi ts normally used with Shewart charts. It is
recognized that variations in the composition of these waste streams are not
entirely random, so that normal distribution curves do not apply exactly.
The assumption of normal probability is usually acceptable, and obvious
deviations are dealt with by applying judgements based upon experience or
knowledge of the process circumstances.
Meetings were held with members of Production Supervision to explain the
program and enlist their support in responding to values outside the control
limits. Good communications is important to the success of such a program.
The awareness which results from consistent follow-up when excursions
occur tends to reduce the frequency and magnitude of losses.
With this background, we can now present some of the measured data. Fig-
ure 3 shows the average amount of Identified Organics (ID) and Total
Organic Carbon (TOC) in the feed stream to the Biological system (Biox Feed)
for the years 1978 through 1986. The amounts are given in thousands of
pounds per day. The figure shows that loadings during the 1978-1979 t i m e
frame averaged about 6000 lbs/day TOC and about 3800 lbs/day Identified
Organics. During this s a m e period, the average Biological Oxygen Demand
(BOD) was about 6800 lbs/day BOD. In 1980, a new production unit started
up, increasing flows by about 10% and initially doubling the aniline loadings.
Page 8
.
Table 2
Environmental Morning Report - Production Monitoring Section
10. Monitor Points: I--Biox Feed - Amt/day-I--- Area Streams Amounts in Lbs/day !Organic Amount UCL : Area Amount
21 30 :Dept I 143 Dept V-B ------ UCL-:Toluene 134 150 IDept I1 564 Flow MGD 0.69 : MCB 45 55 :Dept I11 1008 TSS :Aniline 566 600 :Dept IV 146
Am t 161 300 :DCB 113 # 75 :Dept V-A 39 ,~~~~~~~~~~~~~~~~~~~~~ 0-Tolu 18 25 :Dept V-B 425
- _ _ _ _ _ _ _ _ _ _ _ _ _ _ _ _ _ _ _ I I Benzene
: MNB 83 200 : EQ Flow: 3 GPM(Avg):MNT 27 60 : RB Flow: 3 GPM(Avg):DNT 33 150 : ................................................................
# - Upper Control Limit Exceeded - Look for cause.
TC - - : uc L 450 780
2450 585 225 590
Page 9
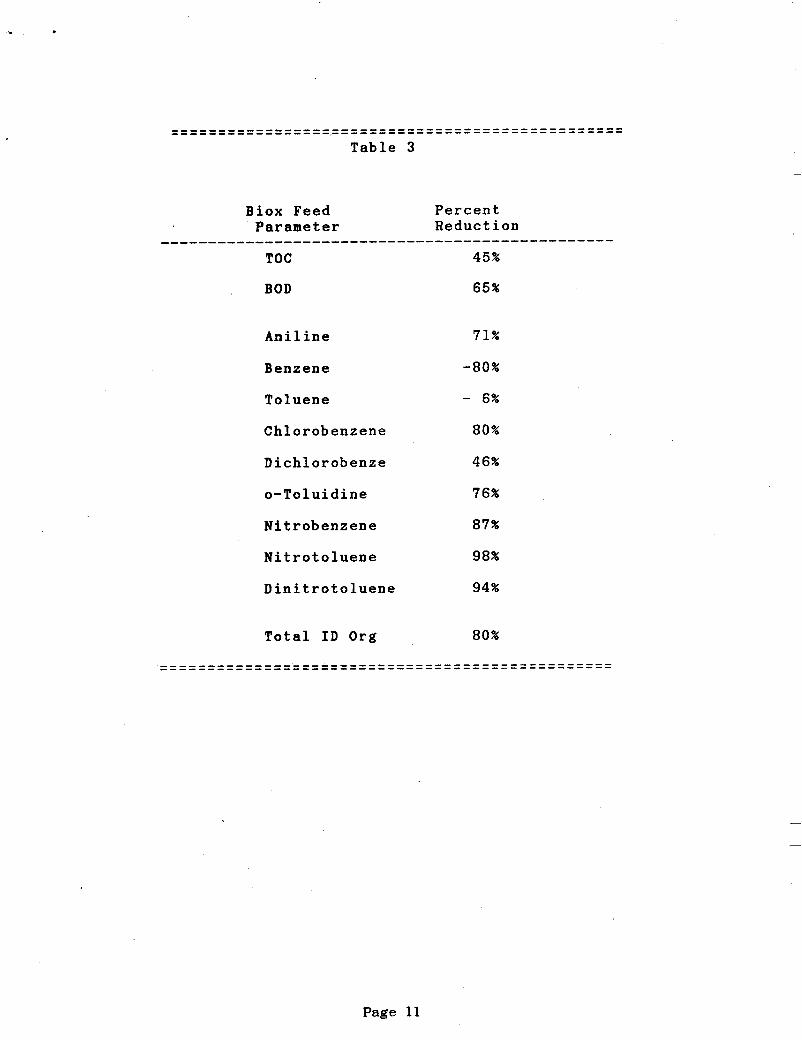
The special SPC-based reporting program was initiated in the fourth quarter
of 1982. Percentage reduction data are presented in Table 3, using 1981 a s
the baseline year. In 1981, the amount of aniline in the plant effluent was
around 100 Ibs/day; in 1986 it was down to almost 1 Ib/day. Today, aniline
is usually not detectable in the plant effluent.
Figure 4 shows the TOC in the Biox feed, Secondary Effluent and Final Plant
Effluent for the years 1980-1986. Figure 5 shows the amounts of Identified
Organics in the Biox feed and in the two effluent streams. Figure 6 shows
the BOD values for these three streams. These figures show that the quality
of the effluent streams are directly affected by the quantity of organics in
the feed. The improved quality of all three streams is readily apparent.
Figure 7 shows the relative amounts of nitrobenzene (MNB), nitrotoluene
(MNT) and dinitrotoluene (DNT) in the Biox feed from 1978 through 1986. As
a result of the emphasis this program provided, the production unit respon-
sible for these components was able to make process improvements which
accomplished the reductions indicated. This involved installation of an
extraction column and the piping necessary to return these pollutants to the
production process. Yields were only slightly improved, but the effect on
the plant effluent quality was dramatic. DNT is known to be toxic to biologi-
cal systems, so reduction in the quantity of this component in the process
wastewater improves the overall efficiency of the activated sludge system.
In addition to the obvious environmental improvements, there are potentially
significant cost savings. The eighty percent reduction in Total Identified
Organics 'shown in Table 3 represents over $250,000 per year savings, if
these materials are valued at roughly 25 cents per pound.
Page 10
Aniline
Benzene
Toluene
Chlorobenzene
Dichlorobenze
o-Toluidine
Nitrobenzene
Nitrotoluene
Dinitrotoluene
71%
-80%
- 6%
80%
46%
76%
87%
98%
94%
Total ID Org 80%
Page 11
Such savings generally are more than sufficient to offset the installa-
tion costs of equipment necessary to improve control of the generating pro-
cess or to recover potential wastes a t the production unit and return them
to the process. In some instances, it may take 5 years or more to recover
the equipment installation costs, but this is offset by the environmental
improvements which result.
The graphs presented also indicate that the improvements noted did not
occur immediately. It has taken several years for the program to produce
dramatic results. The improvements, however, are definite. Figure 8 shows
the first set of UCL values established in 1982 compared with the most
recent values, based on 1986 data. Except for toluene and DCB, all the UCL’s
decreased significantly. DCB has usually been well-controlled, so a change is
not necessarily expected. The higher toluene value is probably the result of
additional processes which use this material.
CONCLUSION
We have shown the waste reductions achieved by a wastewater monitoring pro-
g r a m based upon statistical process control concepts, conducted at an indus-
trial production facility. By daily monitoring amounts of specific organic
compounds in the process wastewater and reporting the results against stat-
istically-derived control l imi t s , the production units were able to take
note of unusual discharges and make correlations with their process condi-
tions. It was possible to justify the installation of equipment and imple-
mentation of various improved control measures which resulted in significant
reductions in amounts of pollutants discharged.
Page 12
Recommended