CPA Report
A profile of residents in Bupa care homes: results from the 2012 Bupa census
November 2012 Centre for Policy on Ageing

The Centre for Policy on Ageing, established in 1947 by the Nuffield Foundation, has a long and distinguished record as an independent charity promoting the interests of older people through research, policy analysis and the dissemination of information. The Centre aims to raise awareness of issues around ageing, influence the development of policies to enable older people to live their lives as they choose, and to support good practice. CPA’s overarching focus since its inception has been on empowering older people to shape their own lives and the services they receive. The fundamental touchstone of its approach is to discover and advocate what older people themselves want and need.
Centre for Policy on Ageing 28 Great Tower Street London EC3R 5AT Tel: 0207 553 6500 Fax: 0207 553 6501 Email: [email protected] Web: www.cpa.org.uk

Summary profile
Women still form the overwhelming majority (68%) of Bupa care home residents but the proportion is declining with the majority of residents aged under 65 being male.
The great majority of Bupa care home residents are older people with residents aged 65 and over making up 93% of the care home population in the UK, 95% in New Zealand, 96% in Australia and 97% in Spain. Male residents are younger on average than female residents and, in the UK, 3 years younger on average than they were in the 2009 census.
Average (median) ‘length of stay to date’ data for 2012 has shown no change or an increase for all countries when compared with 2009. This may indicate a reversal or slowing of earlier trends towards shorter lengths of stay.
Over 90% of Bupa care home residents are either ‘Frail Elderly’ or receiving ‘Dementia care’ and over 90% are receiving ‘Long Term Care’. In the UK, while ‘Long Term Care’ residents have stayed for 22 months to date, on average, short stay residents stay for less than 3 months.
Type of care varies considerably with the age of the resident. ‘Frail Elderly’ make up 70% of residents age 95 and over while ‘Dementia Care’ peaks for the 75‐84 age group.
Fifty eight percent of Bupa care home residents have a mental or neurological disorder but the overall prevalence declines with age from nearly 70% of under 65s to a little over 40% of residents aged 95 and over.
The proportion of residents with dementia continues to rise with, overall 48% of residents either categorised as receiving ‘Dementia Care’ or with dementia as a reason for admittance. This peaks at 65% for Scotland.
Recorded depression has held steady or fallen for residents of all ages and is below community levels, especially for the older age groups.
The prevalence of stroke continues to decline but, at 16% for the UK, is more than three times that in Spain.
Diabetes is relatively more common in the UK than in other countries when compared with rates of other non‐neurological conditions and has a higher prevalence among younger residents. This may herald a greater challenge in the management of this condition in UK care homes in the future.
Levels of urinary only incontinence are lower in the UK than in other countries and continue to decline, perhaps providing a marker of good management. Levels of dual incontinence are however more than 10 percentage points higher in the UK than for other countries.
Eighty seven percent of Bupa care home residents in the UK have ‘high support needs’ but this proportion has fallen slightly since 2009 in the UK and all other countries.
Twenty eight percent of Bupa care home residents exhibit challenging behaviour. This percentage has risen, since 2009, for all countries and for most key triggers. Challenging behaviour is most prevalent in Australia, New Zealand and Scotland.
3

Introduction
Bupa has carried out a census of the population of its care homes in the UK, New Zealand, Australia and Spain in 2009 and 2012. A similar census of Bupa UK homes was carried out in 2003 and of Bupa and non‐Bupa UK care homes in 2006. The Centre for Policy on Ageing has been asked by Bupa, for the 2012 census, to update its analysis of the profile of Bupa care home residents from the 2009 census published in Lievesley, Crosby, Bowman and Midwinter, The Changing Role of Care Homes, 2011. This report will complement separate analyses carried out by Abies, focusing on the wellbeing of residents using data on HowRU and HowRwe scores gathered for the first time in the 2012 census.
Comparability with the Bupa 2009 Census
The Bupa Census data collection for 2012 was carried out in a different way from that for the 2009 census. In 2012, to facilitate the collection and processing of data, staff were asked to make marks in optically readable boxes on the census questionnaire. This meant recording age group rather than age and the year and month of admission for recent years only, rather than the actual date of admission. In 2009 data had been collected on the age of the resident, the date of admission and the date on which the census was taken. The 2012 Census was carried out mainly in June 2012 but with some over‐run unto July. The date on which the data was actually collected was not recorded. In 2012 the classification into ‘residential’ or ‘nursing’ care was not recorded but a wealth of additional information on the wellbeing of residents and the views of residents and visitors, including HowRU and HowRwe scores was collected.
For the UK, individual homes codes allow regional and other analysis. Bupa care homes in the UK vary tremendously in size from a number with fewer than 20 respondents to one care home with nearly 200. (Figure 1)
Figure 1
4

Gender
Although the vast majority of Bupa care home residents continue to be female, since 2009 this proportion has fallen in every country (Table 1)
Table 1
Country Percentage Female
2009 2012
Australia 67.3% 65.9% New Zealand 66.5% 64.9% Spain 75.4% 73.8% UK 71.7% 68.0%
Because of their shorter life expectancy, male residents are more predominant in the younger age groups than in the older age groups (Table 2‐Table 5), forming a majority of the under 65s in Australia and New Zealand. There has, however, been no obvious shift in the overall age profile of residents that might explain the fall in the proportion that are female. (Figure 2) The most likely reason is improved survival of men in the 75‐84 and 85‐94 age groups each of which have, for all four countries, a higher proportion of men in 2012 than in 2009.
Table 2
Australia Resident Age Group
All Ages Under 65 65-74 75-84 85-94 95 and over
Gender Female 43.4% 48.0% 62.7% 70.6% 81.4% 65.9%
Male 56.6% 52.0% 37.3% 29.4% 18.6% 34.1%
Total 100.0% 100.0% 100.0% 100.0% 100.0% 100.0%
n=3,366
Table 3
New Zealand Resident Age Group
All Ages Under 65 65-74 75-84 85-94 95 and over
Gender Female 48.6% 49.1% 58.1% 73.8% 80.6% 64.9%
Male 51.4% 50.9% 41.9% 26.2% 19.4% 35.1%
Total 100.0% 100.0% 100.0% 100.0% 100.0% 100.0%
n=2,815 Table 4
Spain Resident Age Group
All Ages Under 65 65-74 75-84 85-94 95 and over
Gender Female 52.2% 54.9% 70.5% 77.8% 86.3% 73.8%
Male 47.8% 45.1% 29.5% 22.2% 13.7% 26.2%
Total 100.0% 100.0% 100.0% 100.0% 100.0% 100.0%
n=4,067
5
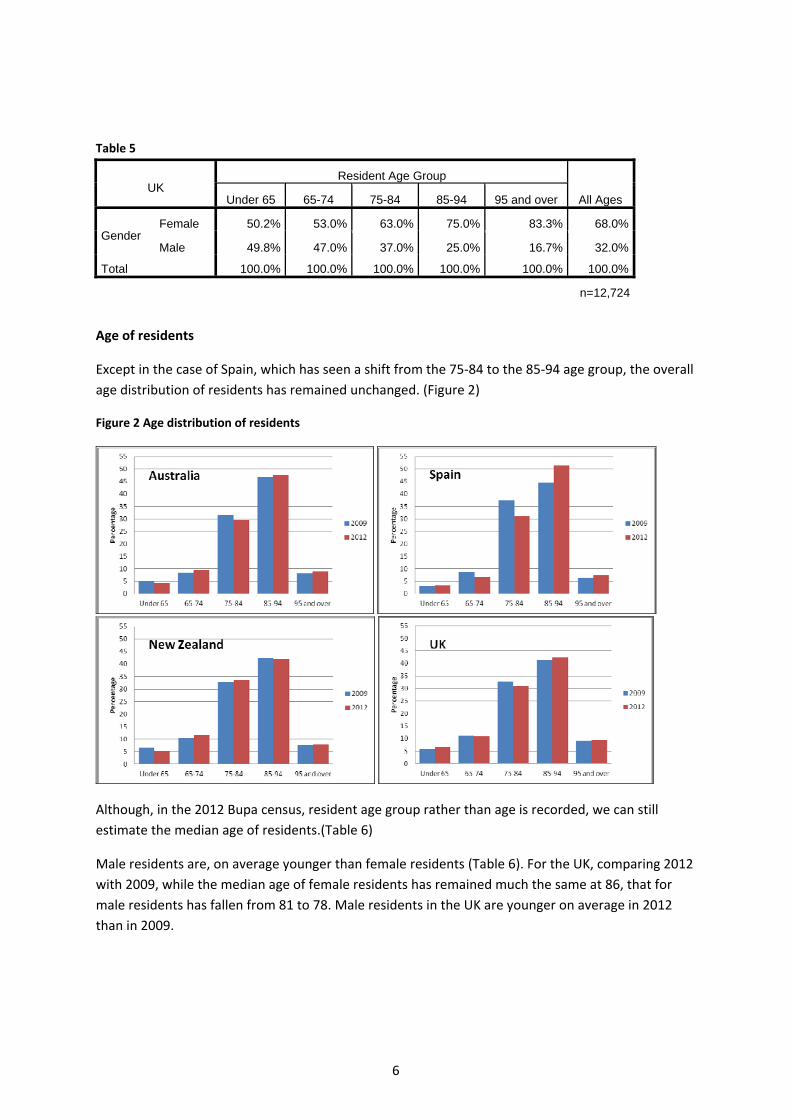
Table 5
UK Resident Age Group
All Ages Under 65 65-74 75-84 85-94 95 and over
Gender Female 50.2% 53.0% 63.0% 75.0% 83.3% 68.0%
Male 49.8% 47.0% 37.0% 25.0% 16.7% 32.0%
Total 100.0% 100.0% 100.0% 100.0% 100.0% 100.0%
n=12,724
Age of residents
Except in the case of Spain, which has seen a shift from the 75‐84 to the 85‐94 age group, the overall age distribution of residents has remained unchanged. (Figure 2)
Figure 2 Age distribution of residents
Although, in the 2012 Bupa census, resident age group rather than age is recorded, we can still estimate the median age of residents.(Table 6)
Male residents are, on average younger than female residents (Table 6). For the UK, comparing 2012 with 2009, while the median age of female residents has remained much the same at 86, that for male residents has fallen from 81 to 78. Male residents in the UK are younger on average in 2012 than in 2009.
6

Table 6 Estimated median age of Bupa residents ‐ 2012
Australia New Zealand Spain UK
Female 86.2 85.8 86.2 85.9
Male 79.4 78.2 79.6 78.3
The great majority of Bupa care home residents continue to be older people. In 2012 residents aged
65 and over made up 93% of the care home population in the UK, 95% in New Zealand, 96% in
Australia and 97% in Spain. (Table 7 ‐Table 10)
Table 7
Australia Resident Age Group
Total Under 65 65-74 75-84 85-94 95 and over
Gender Female 2.8% 6.9% 28.1% 51.0% 11.2% 100.0%
Male 7.1% 14.6% 32.3% 41.2% 5.0% 100.0%
Total 4.2% 9.5% 29.5% 47.6% 9.1% 100.0%
n=3,366
Table 8
New Zealand Resident Age Group
Total Under 65 65-74 75-84 85-94 95 and over
Gender Female 3.9% 8.8% 30.0% 47.7% 9.6% 100.0%
Male 7.6% 16.9% 40.0% 31.3% 4.3% 100.0%
Total 5.2% 11.7% 33.5% 42.0% 7.7% 100.0%
n=2,815 Table 9
Spain Resident Age Group
Total Under 65 65-74 75-84 85-94 95 and over
Gender Female 2.4% 5.0% 29.6% 54.1% 8.8% 100.0%
Male 6.2% 11.5% 34.9% 43.5% 3.9% 100.0%
Total 3.4% 6.7% 31.0% 51.3% 7.5% 100.0%
n=4,067 Table 10
UK Resident Age Group
Total Under 65 65-74 75-84 85-94 95 and over
Gender Female 4.9% 8.5% 28.6% 46.7% 11.3% 100.0%
Male 10.3% 16.0% 35.7% 33.1% 4.8% 100.0%
Total 6.6% 10.9% 30.9% 42.3% 9.3% 100.0%
n=12,724
7

Length of stay
The Bupa census gathers information on length of stay of the resident. This ‘length of stay to date’
information does not measure the total length of stay of care home residents because, on the one
hand, residents at the time of the census have not yet completed their stay, therefore ‘length of
stay to date’ provides an underestimate of the total length of stay. On the other hand, a short stay
resident is less likely to be included in the census than a long stay resident. There might have been 3
short stay residents during the period of a single long stay resident, only one of whom would have
been included in the census. In this respect ‘length of stay to date’ provides an overestimate of
actual lengths of stay.
Figure 3
*This graph does not show the 2.5% of residents who stay for longer than 10 years 5 months.
As in previous years, the census reveals a large number of residents who have stayed for a short
period with the number of residents declining consistently as the length of stay increases. (Figure 3)
8
Other data collected by Bupa, on length of stay for residents who have died for the period 2001‐
2009, has shown a decline in total length of stay both for residents with dementia and those
considered ‘frail elderly’.1 The Bupa 2012 Census, on the other hand has shown no change or an
increase in the median ‘length of stay to date’ since 2009. This may indicate a reversal of earlier
trends. (Table 11)
Table 11
Country Median length of stay to date (months)
2009* 2012
Australia 21 22 New Zealand 19 19 Spain 23 24 UK 19 20
*Rounded to the nearest month
Residents in Spain and Scotland have the longest stays and those in New Zealand and Midlands &
Wales have the shortest stays on average. (Figure 4)
Figure 4
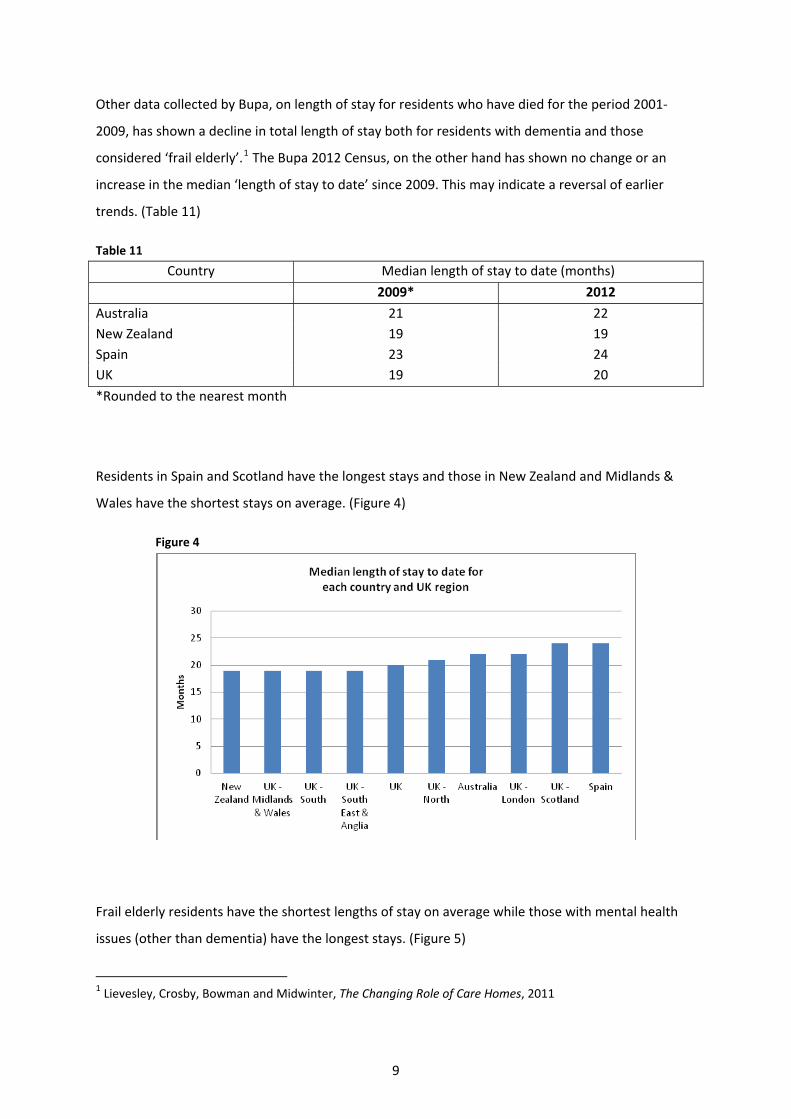
Frail elderly residents have the shortest lengths of stay on average while those with mental health
issues (other than dementia) have the longest stays. (Figure 5)
1 Lievesley, Crosby, Bowman and Midwinter, The Changing Role of Care Homes, 2011
9
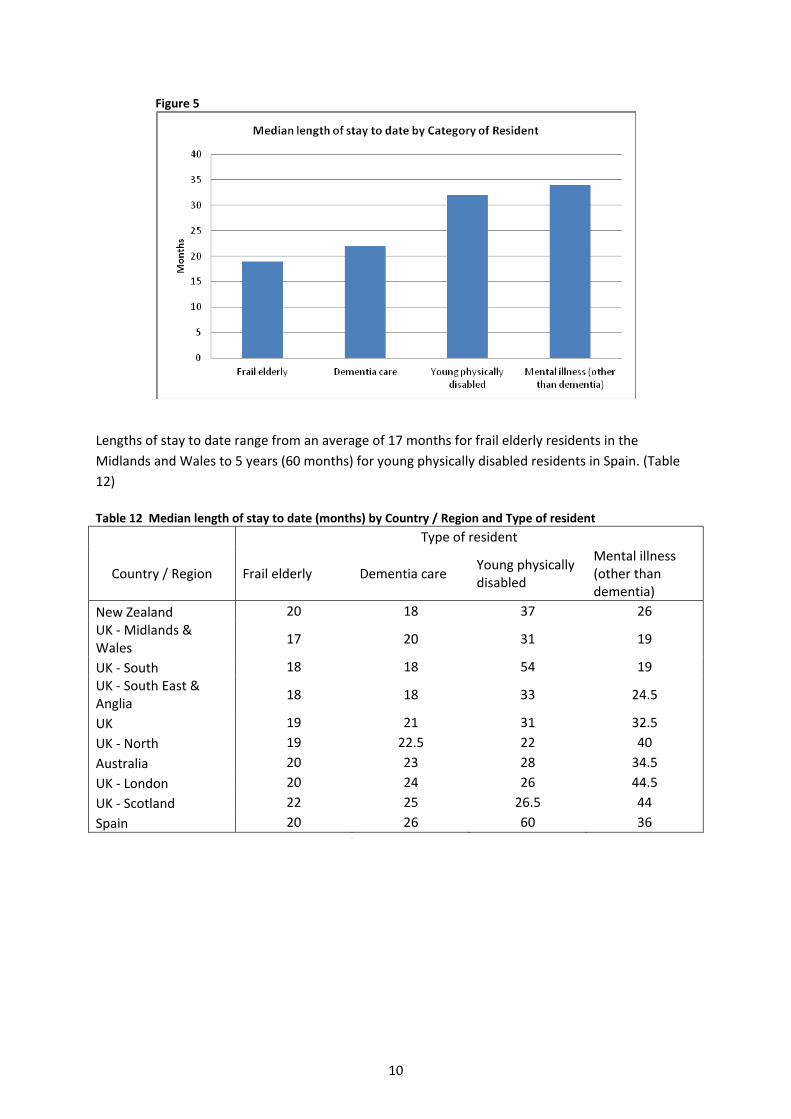
Figure 5
Lengths of stay to date range from an average of 17 months for frail elderly residents in the Midlands and Wales to 5 years (60 months) for young physically disabled residents in Spain. (Table 12)
Table 12 Median length of stay to date (months) by Country / Region and Type of resident
Type of resident
Country / Region Frail elderly Dementia care Young physically disabled
Mental illness (other than dementia)
New Zealand 20 18 37 26 UK ‐ Midlands & Wales
17 20 31 19
UK ‐ South 18 18 54 19 UK ‐ South East & Anglia
18 18 33 24.5
UK 19 21 31 32.5
UK ‐ North 19 22.5 22 40
Australia 20 23 28 34.5
UK ‐ London 20 24 26 44.5
UK ‐ Scotland 22 25 26.5 44
Spain 20 26 60 36
10
Type of care
The categorisation of residents in the 2012 census differs from that used in 2009. In 2012, in addition to the broad categorisation into Dementia care, Frail Elderly, Mental illness (other than dementia) and Young physically disabled, residents were categorised by ‘Nature of admission’ for example Long term care or Respite care and a ‘Reason for admission’ for example Stroke, Dementia or Frailty (unspecified). There may have been multiple reasons for admission. Information was also gathered on mobility, continence, visual and hearing impairment, confusion and whether the resident exhibited challenging behaviour.
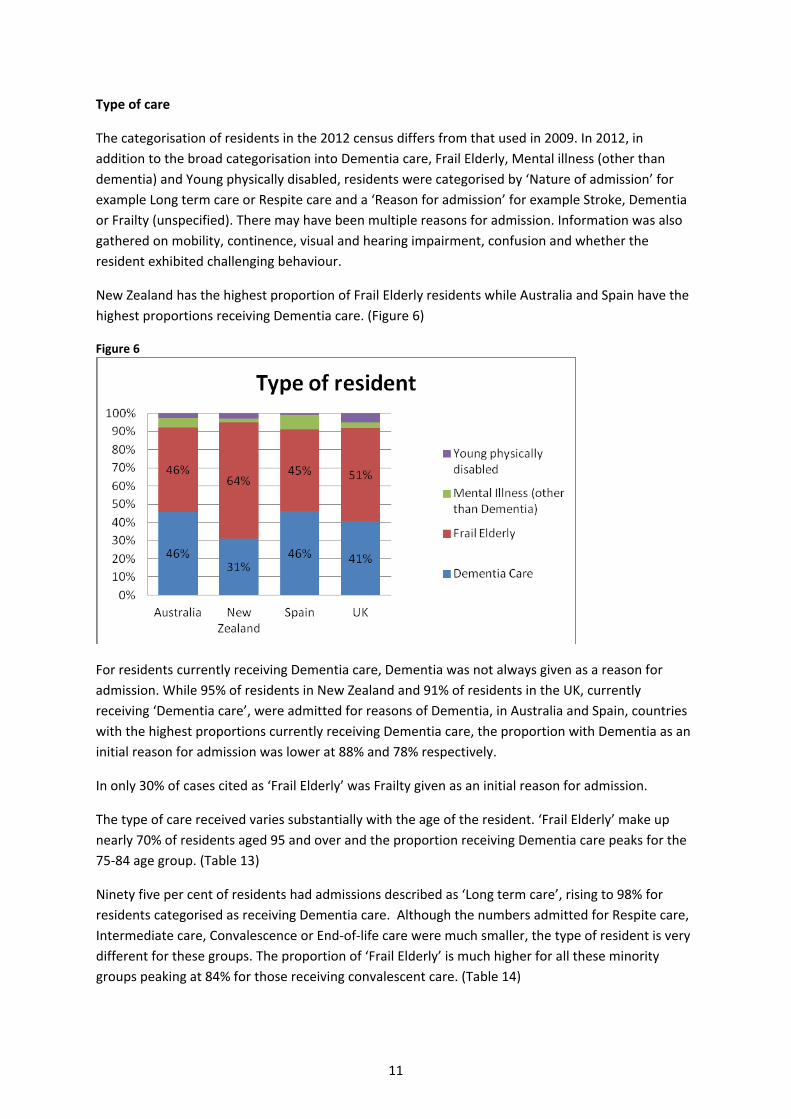
New Zealand has the highest proportion of Frail Elderly residents while Australia and Spain have the highest proportions receiving Dementia care. (Figure 6)
Figure 6
For residents currently receiving Dementia care, Dementia was not always given as a reason for admission. While 95% of residents in New Zealand and 91% of residents in the UK, currently receiving ‘Dementia care’, were admitted for reasons of Dementia, in Australia and Spain, countries with the highest proportions currently receiving Dementia care, the proportion with Dementia as an initial reason for admission was lower at 88% and 78% respectively.
In only 30% of cases cited as ‘Frail Elderly’ was Frailty given as an initial reason for admission.
The type of care received varies substantially with the age of the resident. ‘Frail Elderly’ make up nearly 70% of residents aged 95 and over and the proportion receiving Dementia care peaks for the 75‐84 age group. (Table 13)
Ninety five per cent of residents had admissions described as ‘Long term care’, rising to 98% for residents categorised as receiving Dementia care. Although the numbers admitted for Respite care, Intermediate care, Convalescence or End‐of‐life care were much smaller, the type of resident is very different for these groups. The proportion of ‘Frail Elderly’ is much higher for all these minority groups peaking at 84% for those receiving convalescent care. (Table 14)
11

Table 13 Bupa census 2012, Type of resident by Age group, All countries.
Age group
All AgesUnder 65 65-74 75-84 85-94 95+
Category of
Resident
Dementia Care 17.7% 40.5% 47.2% 41.9% 30.2% 41.1%
Frail Elderly 13.2% 42.0% 47.9% 56.2% 69.3% 51.1%
Mental Illness (other
than Dementia) 17.5% 12.0% 4.3% 1.7% 0.5% 4.3%
Young physically
disabled 51.7% 5.5% 0.6% 0.1% - 3.6%
Total 100.0% 100.0% 100.0% 100.0% 100.0% 100.0%
Table 14 Type of resident by nature of admission
Nature of admission
All Convalescent or
Rehabilitation End of Life Care Intermediate or Subacute Care Long Term Care Respite/Holiday
Relief admission
Category of
Resident
Dementia Care 7.0% 21.0% 13.0% 42.4% 25.2% 41.1%
Frail Elderly 83.9% 65.7% 74.1% 49.8% 67.0% 51.0%
Mental Illness
(other than
Dementia)
6.6% 3.7% 11.4% 4.3% 2.4% 4.3%
Young physically
disabled 2.5% 9.6% 1.6% 3.5% 5.4% 3.6%
Total 100.0% 100.0% 100.0% 100.0% 100.0% 100.0%
Earlier Bupa census and non‐census data has shown the proportion of residents receiving Dementia care to be on the increase 2. In 2009 the proportion of UK residents categorised as receiving Dementia care was 35% while in 2012 this has risen to 41%. The ways of categorising residents in these two censuses were not the same so these figures are not strictly comparable but they do, never‐the‐less, probably indicate a continuance of that trend.
Neurological and mental disorders
Fifty eight percent of Bupa care home residents have some sort of mental or neurological disorder including dementia. This ranges from 49% in Spain, through 57% in the UK, to 65% in Australia and New Zealand. (Table 15) The figures reported for 2009 are not comparable and may have over‐estimated this effect. Both the 2009 and 2012 censuses report a consistent decline in the prevalence of at least one neurological and mental disorder (including dementia) with the age of the resident. (Figure 7)
2 Lievesley, Crosby, Bowman and Midwinter, The Changing Role of Care Homes, 2011
12

Figure 7
Table 15 Proportion of residents with a neurological or mental disorder (including dementia)
Australia New Zealand Spain UK All countries
64.8% 65.1% 49.1% 56.9% 57.7%
The most commonly occurring disorders are Dementia, Stroke, Depression, Epilepsy and Parkinson’s disease. Patterns of the relative occurrence of these conditions by age for the UK are similar to those observed in 2009 except that the prevalence of stroke has risen among the under 65s while declining in the other age groups and the level of depression has fallen for all age groups over 65. The prevalence of Epilepsy has fallen for all age groups.
Figure 8
13
Dementia
The proportion of Bupa care home residents with dementia is increasing. In the 2003 Bupa census in the UK it stood at 36% rising to 38% in 2006 and just under 44% in 2009. In the 2012 census in the UK the proportion of residents admitted for reasons of dementia stands at just under 46% while accounting for the majority of residents in the 75‐84 age group.
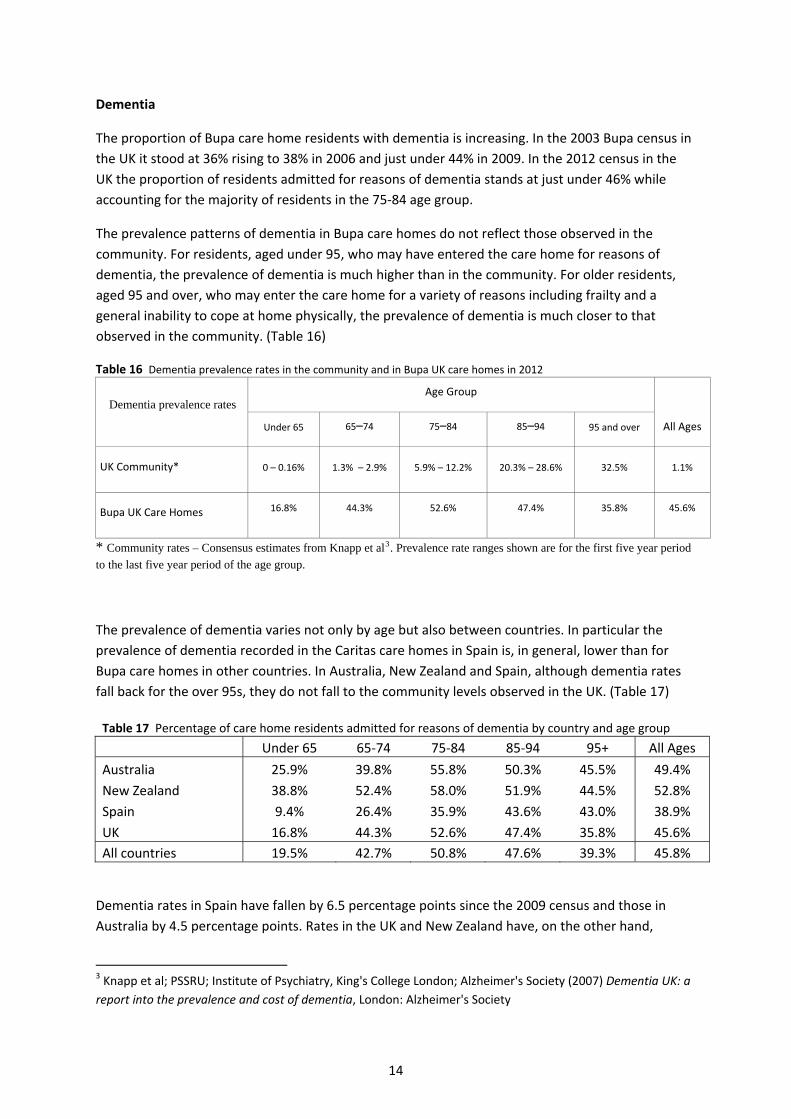
The prevalence patterns of dementia in Bupa care homes do not reflect those observed in the community. For residents, aged under 95, who may have entered the care home for reasons of dementia, the prevalence of dementia is much higher than in the community. For older residents, aged 95 and over, who may enter the care home for a variety of reasons including frailty and a general inability to cope at home physically, the prevalence of dementia is much closer to that observed in the community. (Table 16)
Table 16 Dementia prevalence rates in the community and in Bupa UK care homes in 2012
Dementia prevalence rates Age Group
All Ages Under 65 65–74 75–84 85–94 95 and over
UK Community* 0 – 0.16% 1.3% – 2.9% 5.9% – 12.2% 20.3% – 28.6% 32.5% 1.1%
Bupa UK Care Homes 16.8% 44.3% 52.6% 47.4% 35.8% 45.6%
* Community rates – Consensus estimates from Knapp et al3. Prevalence rate ranges shown are for the first five year period to the last five year period of the age group.
The prevalence of dementia varies not only by age but also between countries. In particular the prevalence of dementia recorded in the Caritas care homes in Spain is, in general, lower than for Bupa care homes in other countries. In Australia, New Zealand and Spain, although dementia rates fall back for the over 95s, they do not fall to the community levels observed in the UK. (Table 17)
Table 17 Percentage of care home residents admitted for reasons of dementia by country and age group
Under 65 65‐74 75‐84 85‐94 95+ All Ages
Australia 25.9% 39.8% 55.8% 50.3% 45.5% 49.4%
New Zealand 38.8% 52.4% 58.0% 51.9% 44.5% 52.8% Spain 9.4% 26.4% 35.9% 43.6% 43.0% 38.9%
UK 16.8% 44.3% 52.6% 47.4% 35.8% 45.6% All countries 19.5% 42.7% 50.8% 47.6% 39.3% 45.8%
Dementia rates in Spain have fallen by 6.5 percentage points since the 2009 census and those in Australia by 4.5 percentage points. Rates in the UK and New Zealand have, on the other hand,
3 Knapp et al; PSSRU; Institute of Psychiatry, King's College London; Alzheimer's Society (2007) Dementia UK: a report into the prevalence and cost of dementia, London: Alzheimer's Society
14
increased by 2 percentage points and 3 percentage points respectively. The higher rates of dementia observed in Australia and New Zealand result, at least in part, from higher rates of diagnosis resulting from the more extensive and mandatory clinical assessments carried out on entry into care.
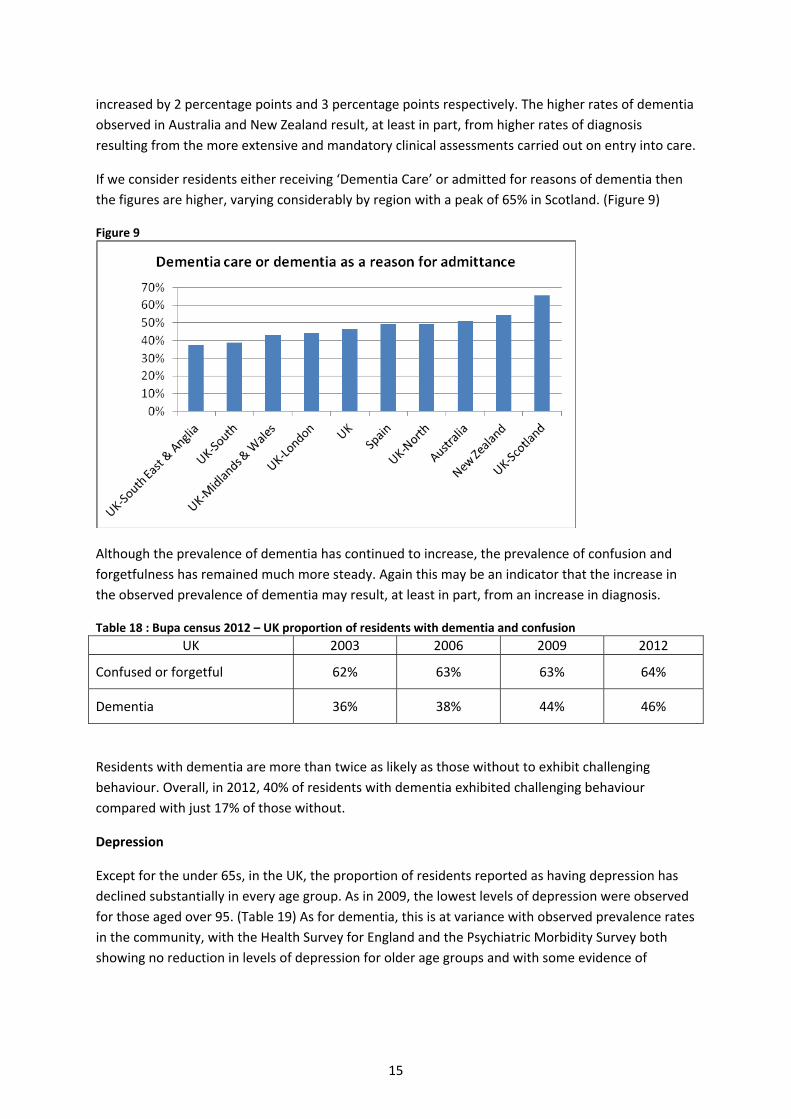
If we consider residents either receiving ‘Dementia Care’ or admitted for reasons of dementia then the figures are higher, varying considerably by region with a peak of 65% in Scotland. (Figure 9)
Figure 9
Although the prevalence of dementia has continued to increase, the prevalence of confusion and forgetfulness has remained much more steady. Again this may be an indicator that the increase in the observed prevalence of dementia may result, at least in part, from an increase in diagnosis.
Table 18 : Bupa census 2012 – UK proportion of residents with dementia and confusion UK 2003 2006 2009 2012
Confused or forgetful 62% 63% 63% 64%
Dementia 36% 38% 44% 46%
Residents with dementia are more than twice as likely as those without to exhibit challenging behaviour. Overall, in 2012, 40% of residents with dementia exhibited challenging behaviour compared with just 17% of those without.
Depression
Except for the under 65s, in the UK, the proportion of residents reported as having depression has declined substantially in every age group. As in 2009, the lowest levels of depression were observed for those aged over 95. (Table 19) As for dementia, this is at variance with observed prevalence rates in the community, with the Health Survey for England and the Psychiatric Morbidity Survey both showing no reduction in levels of depression for older age groups and with some evidence of
15

depression in care homes being under‐diagnosed.4 These results are however in line with other studies of the prevalence of depression in long term care facilities which set the median prevalence of depression at 10% and the median prevalence of depressive symptoms at 29%.5
Table 19 Proportion of Bupa UK care home residents with Depression
UK Percentage with Depression
Age
Under 65 65–74 75–84 85–94 95 and over
2009 10.4% 12.1% 11.6% 11.1% 8.0%
2012 10.9% 9.8% 8.7% 7.4% 5.8%
Stroke
Stroke continues to be the second most common neurological/mental condition in Bupa care homes after dementia but the proportion of care home residents in the UK recorded with stroke as a reason for admittance in 2012 is well down on the proportion recorded with stroke in earlier censuses. (Figure 10)
Figure 10
All countries have recorded substantially lower levels of stroke than in the 2009 census. This may be a real reduction but may also result from changes in the census instrument, the formulation of the question and the way the data has been recorded.
4 Mann A H et al, (1984), Psychiatric illness in residential homes for the elderly, Age and Ageing (13) pp 157‐ 265 5 Seitz D et al, (2010), Prevalence of psychiatric disorders among older adults in long‐term care homes, International
Psychogeriatrics (22), Nov 2010 pp 1025‐1039
16

The 2009 census recorded a substantially lower level of stroke in Spain than in Australia, New Zealand and the UK. This pattern has been repeated in 2012 with the prevalence of stroke in care homes in Spain being less than one quarter of that in care homes in New Zealand. (Table 20)
Table 20 Proportion of Bupa care home residents with stroke
Under 65 65‐74 75‐84 85‐94 95+ All Ages
Australia 17.0% 17.9% 12.3% 11.1% 10.4% 12.3%New Zealand 22.4% 21.5% 19.7% 18.7% 11.9% 19.1%
Spain 7.2% 8.1% 5.6% 4.1% 1.0% 4.7%UK 20.4% 18.8% 17.2% 14.3% 12.1% 15.9%All countries 18.8% 17.8% 14.8% 12.2% 10.1% 13.8%
Non‐neurological or mental conditions
The recording of non‐neurological conditions has changed substantially in the 2012 census. As well as being recorded as reasons for admission, rather than extant conditions the number of conditions recorded has been reduced. Arthritis which, in 2009 affected 18% of residents in the UK and just under 25% of residents in Australia is no longer recorded nor is osteoporosis which affected 9% of UK and 19% of Australian residents. For those conditions that were recorded in both years , the 2012 prevalence figures are much lower, often not much more than half the 2009 figure, indicating that the recorded rates are probably not comparable across years.
Table 21 Bupa Census 2012 – Proportion of residents with various non‐neurological conditions UK Australia New Zealand Spain All
countries
Heart disease 9.4% 21.1% 26.7% 2.0% 11.9%
Lung/Chest illness 4.2% 6.5% 8.6% 1.2% 4.5%
Sight 5.7% 12.2% 6.4% 1.1% 5.9%
Hearing 2.7% 7.8% 3.6% 0.1% 3.1%
Diabetes 9.7% 13.8% 11.6% 1.0% 9.0%
Cancer 5.3% 6.5% 5.1% 1.1% 4.7%
The recorded prevalence of all non‐neurological conditions at admission is often substantially higher in Australia and New Zealand, most probably because of the comprehensive pre‐admission clinical assessments carried out in those countries. Although comparisons between countries and between years are ruled out it is still possible to compare the relative prevalence of diseases and note that, in the UK, as in 2009, diabetes is much more common relative to, for example, heart disease than in the other countries.(Table 21)
17

Figure 11
The prevalence of each condition also varies considerably with age. In the UK, although heart disease increases consistently with age and we see a spike in sight and hearing problems for residents aged 95 and over, the prevalence of diabetes actually declines with age. These counter‐intuitive findings for this, currently incurable, condition match similar findings in the 2009 census and probably reflect the increasing levels of obesity and diabetes among younger people in the community. This may herald a greater challenge in the management of this condition in care homes in the future. (Figure 11)
Continence
Table 22 Country All
countries Australia New Zealand Spain UK
Continence
Continent 26.9% 39.3% 28.7% 28.6% 29.7%
Urinary Incontinence 26.3% 20.3% 38.2% 13.3% 20.5%
Faecal Incontinence 1.6% 1.3% 0.6% 1.7% 1.4%
Dual Incontinence 45.2% 39.2% 32.5% 56.4% 48.3%
Total 100.0% 100.0% 100.0% 100.0% 100.0%
Twenty seven to twenty nine percent of Bupa residents are fully continent in all countries except New Zealand where full continence levels reach 39%. Urinary incontinence alone is least in the UK which experiences much higher levels of dual incontinence. (Table 22)
In the UK, the level of full continence varies little after the age of 65 although levels of urinary incontinence increase consistently with age. (Table 23) Reported levels of dual incontinence have increased for all ages when compared with 2009 but the increase is particularly noticeable for residents aged 75 and over.
18
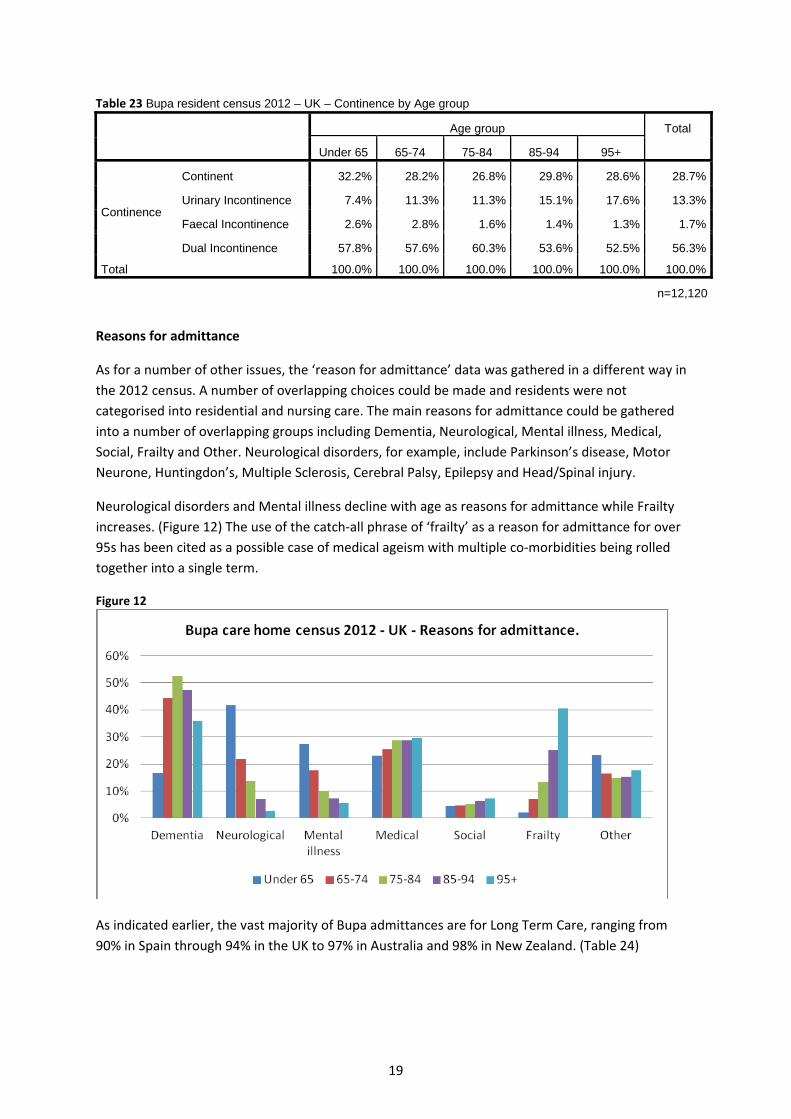
Table 23 Bupa resident census 2012 – UK – Continence by Age group
Age group Total
Under 65 65-74 75-84 85-94 95+
Continence
Continent 32.2% 28.2% 26.8% 29.8% 28.6% 28.7%
Urinary Incontinence 7.4% 11.3% 11.3% 15.1% 17.6% 13.3%
Faecal Incontinence 2.6% 2.8% 1.6% 1.4% 1.3% 1.7%
Dual Incontinence 57.8% 57.6% 60.3% 53.6% 52.5% 56.3%
Total 100.0% 100.0% 100.0% 100.0% 100.0% 100.0%
n=12,120
Reasons for admittance
As for a number of other issues, the ‘reason for admittance’ data was gathered in a different way in the 2012 census. A number of overlapping choices could be made and residents were not categorised into residential and nursing care. The main reasons for admittance could be gathered into a number of overlapping groups including Dementia, Neurological, Mental illness, Medical, Social, Frailty and Other. Neurological disorders, for example, include Parkinson’s disease, Motor Neurone, Huntingdon’s, Multiple Sclerosis, Cerebral Palsy, Epilepsy and Head/Spinal injury.
Neurological disorders and Mental illness decline with age as reasons for admittance while Frailty increases. (Figure 12) The use of the catch‐all phrase of ‘frailty’ as a reason for admittance for over 95s has been cited as a possible case of medical ageism with multiple co‐morbidities being rolled together into a single term.
Figure 12
As indicated earlier, the vast majority of Bupa admittances are for Long Term Care, ranging from 90% in Spain through 94% in the UK to 97% in Australia and 98% in New Zealand. (Table 24)
19

Table 24
Nature of admission Country All
countries Australia New Zealand Spain UK
Convalescent or Rehabilitation 0.2% 0.1% 4.3% 0.6% 1.1%
End of Life Care 1.4% 0.7% 0.5% 1.8% 1.3%
Intermediate or Subacute Care 0.1% 0.1% 3.1% 0.6% 0.9%
Long Term Care 96.7% 98.0% 90.5% 94.3% 94.4%
Respite/Holiday Relief admission 1.6% 1.1% 1.7% 2.7% 2.2%
Total 100.0% 100.0% 100.0% 100.0% 100.0%
In the UK, while a Long Term Care resident may have had an average (median) stay to date of 22 months, an End‐of‐life care resident will have stayed for just 3.5 months on average, a Convalescent or Rehabilitation resident for 2 months, an Intermediate or Subacute Care resident for 1 month and a Respite /Holiday Relief admission for less than one month.
Impairment and residents with high support needs
Over three quarters of Bupa care home residents in the UK either require assistance or are fully dependent on others for their mobility. Except for the under 65s, the proportion fully mobile declines with age and 46% overall are fully dependent. (Figure 13)
Figure 13
Severe and moderate visual and hearing impairments become more prevalent with advancing age for all residents, as, in general, do levels of confusion. Challenging behaviour, on the other hand,
20

declines with age. (Figure 13) The overall level of challenging behaviour in the UK has risen from a little over 17% of residents in 2009 to just under 24% in 2012.
If we define ‘High Support Needs’ as having one or more of dementia, confusion, challenging behaviour, dual incontinence, severe hearing or visual impairment or total dependence in mobility then 87% of Bupa residents in the UK have high support needs. The figures are higher in Australia but lower in New Zealand and Spain. (Figure 14) Except in Spain, high support needs do not increase with the age of the resident. The 2012 census reports a reduction in high support needs compared with 2009.(Figure 15)
Figure 14
Figure 15
Quality of care – urinary incontinence and challenging behaviour
It has been suggested that improvements in urinary incontinence and challenging behaviour are indicators of better care home management and improved quality of care.
21

The level of urinary incontinence in Bupa UK care homes continues to improve, falling from 15% in 2009 to 13% in 2012. (Table 25)
Table 25 Bupa census UK – proportion of residents with urinary incontinence or challenging behaviour
2003 2006 2009 2012
Urinary incontinence 20% 17% 15% 13%
Challenging behaviour 19% 18% 17% 24%
Improvements in the level of challenging behaviour, reported in earlier censuses, have however shown a severe reversal in the current census.
Exhibiting challenging behaviour is very much associated with other characteristics of a resident and its overall prevalence may be affected by changes in the resident profile. It is more common among younger, fully mobile male residents. Evidence from the 2012 census affirms that the strongest single factor is having Huntingtons disease, where 55% of residents show challenging behaviour, or a psychotic illness (Schizophrenia=44%, Bi‐polar disorder=41%).
Table 26: Bupa census UKProportion of residents exhibiting challenging behaviour, for various characteristics or conditions.
Condition 2009 2012 Condition 2009 2012 Condition 2009 2012
Huntingtons disease
49.2% 55.1% Learning difficulties
31.9% 30.4% Aged 65–74 25.7% 32.0%
Depressed or agitated / Depressed*
37.4% 29.8% Neurological trauma
30.2% 31.6% Mobility: fully mobile
24.5% 32.7%
Schizophrenia 37.1% 44.3% Aged under 65 26.7% 30.6% Gender: Male 24.2% 29.1%
Bi‐polar disorder
34.5% 41.3% Dementia 26.6% 36.7% Dual incontinence
21.9% 29.0%
*May not be a comparable group
Table 27 Proportion of Bupa residents exhibiting challenging behaviour by Country and UK region.
Region
London 21.4%
Midlands & Wales 20.4%
North 25.6%
Scotland 30.5%
South 19.4%
South East & Anglia 23.9%
All regions (UK) 23.9%
Country
Australia 55.3%
New Zealand 35.9%
Spain 10.3%
UK 23.9%
All Countries 27.6%
Almost all of the key triggers except depression have shown a marked increase in the prevalence of challenging behaviour between 2009 and 2012. (Table 26) The unusually high level of challenging
22

23
behaviour for residents with both dementia and multiple sclerosis, noted in the 2009 census, has not however been repeated.
Within the UK, challenging behaviour is most prevalent in Scotland and least prevalent in the South of England which may reflect economic and cultural differences. (Table 27)
Overall, levels of challenging behaviour are highest in Australia, with rates more than double those in the UK which itself has rates more than twice those in Spain. (Table 27)
Conclusion and recommendations
The 2012 Bupa census has revealed an increase in the proportion of males in the care home population who are younger on average than in 2009. It has also flagged up that the past decline in length of stay may be slowing or at an end.
The rise in the proportion of residents with dementia continues, as does the existence of the counter‐intuitive phenomenon that residents aged 95 and over are often healthier than those in the 65‐94 age group.
The rise in the rate of reported challenging behaviour, in all countries and for almost all key triggers, is a cause for concern but it is not known whether this results from a change in resident behaviour or a change in the tolerance levels of staff.
The 2012 Bupa census was carried out in a different way from earlier censuses with the collection of a wealth of additional information on resident comfort, wellbeing, capability and independence which are the subject of a companion report by Abies. For comparability with earlier censuses and to avoid confusion, in future data should perhaps be gathered on current conditions rather than historical reasons for admission and questions on the common conditions of arthritis and osteoporosis reinstated.
Recommended