UNF Digital Commons
UNF Graduate Theses and Dissertations Student Scholarship
1995
A Descriptive Study of Organizational Culture andClimate in Selected Elementary and SecondaryParochial SchoolsMaureen C. ThiecUniversity of North Florida
This Doctoral Dissertation is brought to you for free and open access by theStudent Scholarship at UNF Digital Commons. It has been accepted forinclusion in UNF Graduate Theses and Dissertations by an authorizedadministrator of UNF Digital Commons. For more information, pleasecontact Digital Projects.© 1995 All Rights Reserved
Suggested CitationThiec, Maureen C., "A Descriptive Study of Organizational Culture and Climate in Selected Elementary and Secondary ParochialSchools" (1995). UNF Graduate Theses and Dissertations. 120.https://digitalcommons.unf.edu/etd/120
A DESCRIPTIVE STUDY OF ORGANIZATIONAL CULTURE AND CLIMATE
IN SELECTED ELEMENTARY AND SECONDARY PAROCHIAL SCHOOLS
by
Maureen C. Thiec
A dissertation submitted to the Doctoral Faculty of the
College of Education and Human Services in partial fulfillment
of the requirements for the degree of
Doctor of Education
UNIVERSITY OF NORTH FLORIDA
COLLEGE OF EDUCATION AND HUMAN SERVICES
Summer 1995
The dissertation of Maureen Thiec S.S.# is approved:
Accepted ::Department: . J
Accepted for the College/School:
Accepted for the University:
(date)
Y/;.-/q)-~,
~idss-rb?~ W~ ;
Signature Deleted
Signature Deleted
Signature Deleted
Signature Deleted
Signature Deleted
Signature Deleted
Signature Deleted
Table of Contents
List of Tables ........................................... v
Abstract ............................................... viii
Chapter One: Introduction and Background ................ 1 Statement of Purpose ....................... 6 Significance of the Research ............... 6 Research Questions ......................... 7 Limitations of the Study ................... 8
Chapter Two: Review of the Literature ................... 11 The Historical Development of Catholic Schools. . . . . . . . . . . . . . . . . . . . . . . . . . . . . . . . . . .. 12 Effective Schools .......................... 21 Culture .................................... 28 The Catholic Dimension of Culture .......... 30 C 1 ima te. . . . . . . . . . . . . . . . . . . . . . . . . . . . . . . . . . .. 35 Summary .................................... 39
Chapter Three: Research Design and Methodology ........... 41 Research Questions ....................... 41 Population and Sample.................... 43 Instruments. . . . . . . . . . . . . . . . . . . . . . . . . . . . .. 44
Cultural Value Analysis Tool (CVAT) .... 45 Pilot Study of the CVAT ................ 48 Organization Climate Description Questionnaire(OCDQ) .................... 51
OCDQ-RS .............................. 51 OCDQ-RE. . . . . . . . . . . . . . . . . . . . . . . . . . . . .. 53
Procedure. . . . . . . . . . . . . . . . . . . . . . . . . . . . . .. 54 Data Analysis....... . . . . . . . . . . . . . . . . . . .. 58 Summary. . . . . . . . . . . . . . . . . . . . . . . . . . . . . . . .. 64
Chapter Four: Analysis of Results....................... 65 Cultural Values ........................... 68
Secondary Schools - CVAT Themes ......... 68 Secondary Schools - CVAT Dimensions ..... 73 Secondary Schools - CVAT-
Analysis of Variance .................. 75 Summary of Secondary CVAT Results ....... 78 Elementary Schools - CVAT Themes ........ 79 Elementary Schools - CVAT Dimensions .... 83 Elementary Schools - CVAT - Analysis of
Variance .............................. 85 Summary of Elementary CVAT Results ...... 87 Twenty Parochial Schools - CVAT Themes .. 88 Twenty Parochial Schools - CVAT
Dimens ions. . . . . . . . . . . . . . . . . . . . . . . . . . .. 91 Summary of Parochial Schools
CVAT Results.......................... 93 iii
School Climate............................ 94 Secondary Schools - OCDQ-RS ............. 95 Elementary Schools - OCDQ-RE ............ I01 Summary Description of the OCDQ ......... 105
Comparison of Secondary and Elementary Parochial Schools ....................... 107 Cultural Values ......................... 107 Organizational Climate .................. 115
Summary ................................... 121
Chapter Five: Conclusions ............................... 124 Cultural Values ........................... 125
Secondary Schools ..... ' .................. 125 Elementary Schools ...................... 126 All Parochial Schools ................... 127
School Climate ............................ 130 Secondary Parochial Schools ............. l30 Elementary Parochial Schools ............ 131
Comparison of Secondary and Elementary Parochial Schools ....................... 135 Comparison on Cultural Values ........... 135 Comparison on School Climate ............ 138
Limi tations of the Study .................. 142 Implications for Practice ................. 145 Implications for Further Research ......... 147
Appendices Appendix 1 - Cultural Values Analysis Tool ............ 149 Appendix 2 - CVAT Reliability Coefficients and Means
for the Aggregate Value Profile .......... 153 Appendix 3 - OCDQ-RE .................................. 154 Appendix 4 - OCDQ-RS .................................. 157 Appendix 5 - Reliability Scores for the Organizational
Climate Description Questionnaire ........ 159 Appendix 6 - Letter of Request ........................ 160 Appendix 7 - Letter Once Permission Had Been Granted .. 162 Appendix 8 - Cover Letter for CVAT and OCDQ ........... 163 Appendix 9 - Letter If No Initial Response ............ 164 Appendix 10- Individual School Profile ................ 165
High School 21HF ......................... 166 Elementary School 231SF .................. 171
References .............................................. 176
iv
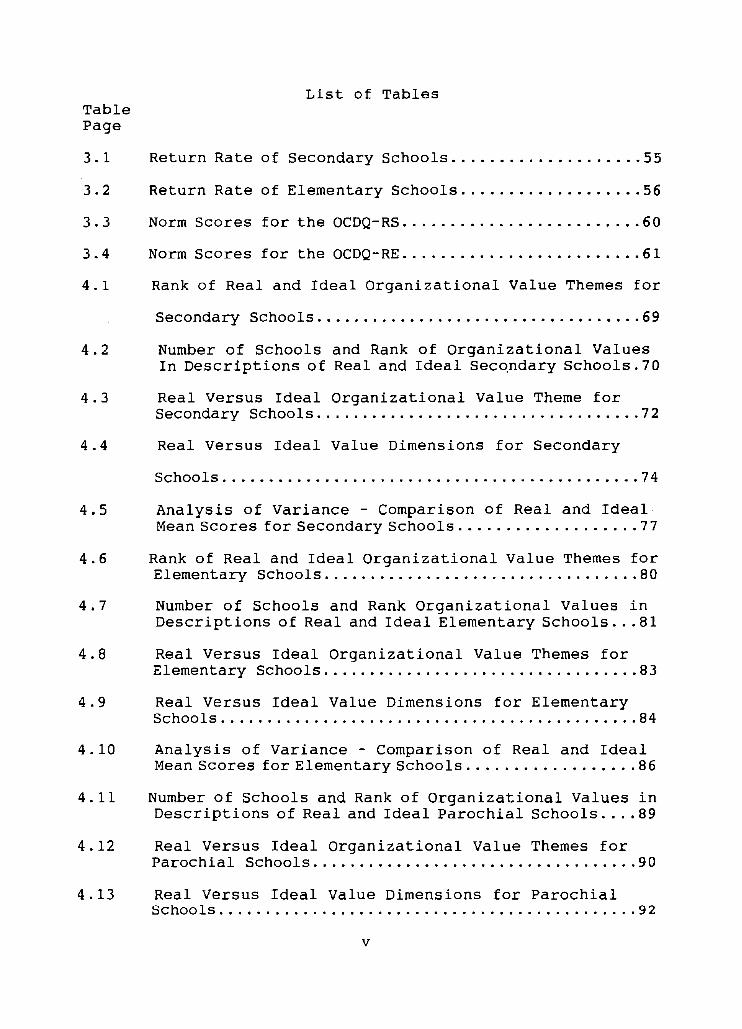
Table Page
List of Tables
3.1 Return Rate of Secondary Schools .................... 55
3.2 Return Rate of Elementary Schools ................... 56
3.3 Norm Scores for the OCDQ-RS ......................... 60
3.4 Norm Scores for the OCDQ-RE ......................... 61
4.1 Rank of Real and Ideal Organizational Value Themes for
Secondary School s ................................... 69
4.2 Number of Schools and Rank of Organizational Values In Descriptions of Real and Ideal Secqndary Schools.70
4.3 Real Versus Ideal Organizational Value Theme for Secondary Schools ................................... 72
4.4 Real Versus Ideal Value Dimensions for Secondary
4.5
4.6
4.7
4.8
4.9
4.10
4.11
4.12
4.13
Schools ............................................. 74
Analysis of Variance - Comparison of Real and Ideal Mean Scores for Secondary Schools ................... 77
Rank of Real and Ideal Organizational Value Themes for Elementary Schools .................................. 80
Number of Schools and Rank Organizational Values in Descriptions of Real and Ideal Elementary Schools ... 81
Real Versus Ideal Organizational Value Themes for Elementary Schools .................................. 83
Real Versus Ideal Value Dimensions for Elementary Schools ............................................. 84
Analysis of Variance - Comparison of Real and Ideal Mean Scores for Elementary Schools .................. 86
Number of Schools and Rank of Organizational Values in Descriptions of Real and Ideal Parochial Schools .... 89
Real Versus Ideal Organizational Value Themes for Parochial Schools ................................... 90
Real Versus Ideal Value Dimensions for Parochial Schools ............................................. 92
v
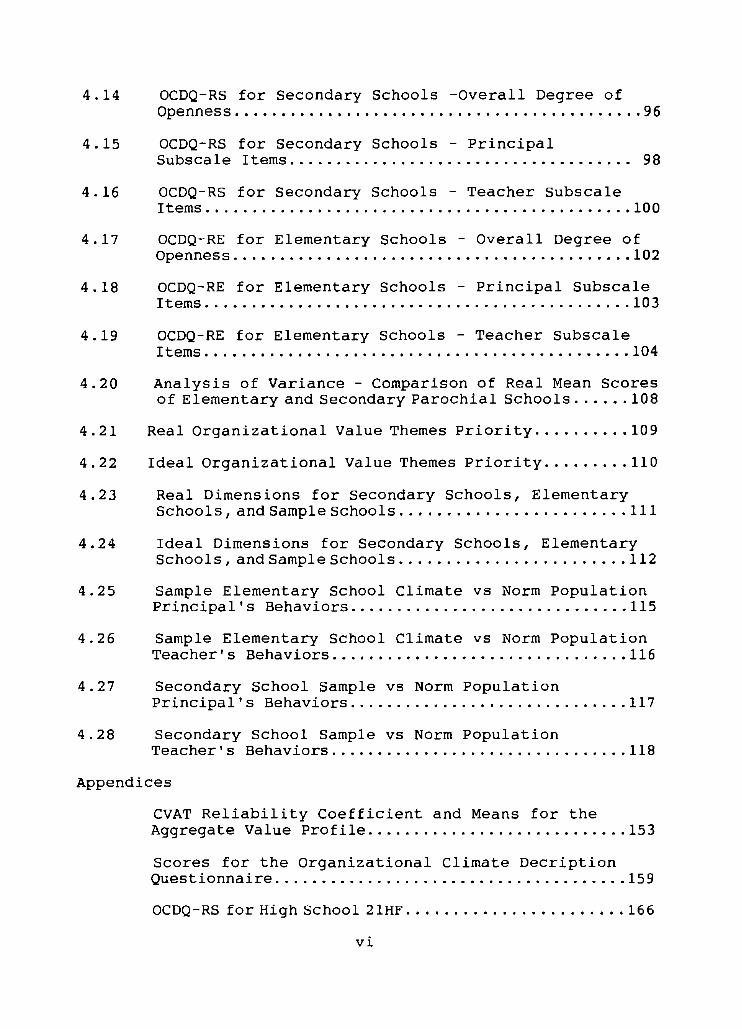
4.14 OCDQ-RS for Secondary Schools -Overall Degree of Openness ............................................ 96
4.15 OCDQ-RS for Secondary Schools - Principal Subscale Items..................................... 98
4.16 OCDQ-RS for Secondary Schools - Teacher Subscale I terns .............................................. 100
4.17 OCDQ-RE for Elementary Schools - Overall Degree of Openness ........................................... 102
4.18 OCDQ-RE for Elementary Schools - Principal Subscale I terns .............................................. 103
4.19 OCDQ-RE for Elementary Schools - Teacher Subscale Items .............................................. 104
4.20 Analysis of Variance - Comparison of Real Mean Scores of Elementary and Secondary Parochial Schools ...... 108
4.21 Real Organizational Value Themes Priority .......... 109
4.22 Ideal Organizational Value Themes Priority ......... 110
4.23 Real Dimensions for Secondary Schools, Elementary Schools, and Sample Schools ........................ 111
4.24 Ideal Dimensions for Secondary Schools, Elementary Schools, and Sample Schools ........................ 112
4.25 Sample Elementary School Climate vs Norm Population Principal's Behaviors .............................. 115
4.26 Sample Elementary School Climate vs Norm Population Teacher's Behaviors ................................ 116
4.27 Secondary School Sample vs Norm Population Principal's Behaviors .............................. 117
4.28 Secondary School Sample vs Norm Population Teacher's Behaviors ................................ 118
Appendices
CVAT Reliability Coefficient and Means for the Aggregate Value Profile ............................ 153
Scores for the Organizational Climate Decription Questionnaire ...................................... 159
OCDQ-RS for High School 21HF ....................... 166
vi
CVAT for High School 21HF .......................... 168
Grouped Profile for High School 21HF ............... 170
OCDQ-Re for Elementary School 2 31SF ................ 171
CVAT for Elementary School 2 31SF ................... 173
Grouped Profile For Elementary School 231SF ........ 175
vii
Abstract
The purpose of this study was to collect and interpret
base-line data concerning the organizational culture and
climate of selected elementary and secondary schools. The
sample consisted of 20 parochial schools, 10 elementary and
10 secondary, in the mideast section of the United states.
The study focused on three specific questions: 1) What
are the cultural values of parochial schools, 2) What is the
organizational climate of parochial schools, and 3) Do the
cultural values and climate characteristics of parochial
elementary schools differ from those of parochial secondary
schools? Nelson's (1990) Cultural Value Analysis Tool
(CVAT) was used to gather organizational culture data. Hoy,
Tarter and Kottkamp's revised Organization Climate
Description Questionnaire (OCDQ) was used to gather
organizational climate data.
Analysis of data on the 419 responses included the
following: 1) One-way analysis of variance (ANOVA) on real
and ideal means of the sixteen cultural dimensions across
the elementary and secondary schools individually, 2) One-
way analysis of variance (ANOVA) on the real means of the
sixteen dimensions comparing the elementary and secondary
schools, and 3) confidence intervals on the principal and
teacher behavior's of the OCDQ as compared to the norm group
of Hoy, Tarter, and Kottkamp.
Significant differences between ideal and real means
viii

were found on dimensions of effort, status, and flexibility
for the elementary schools (p < .05). Significant
differences between the ideal and real means were found on
dimensions of effort, time, quality, empathy, dominance,
status, political, abstract, planning/organization, and
flexibility (p < .05) for the secondary schools. The one-
way analysis of variance conducted on the descriptive mean
scores of the 16 dimensions of the CVAT showed no
statistical difference between elementary and secondary
level schools.
Confidence intervals indicated that parochial
elementary principals are more supportive, less restrictive,
and as directive as the principals in the norm group.
Parochial elementary teachers were more collegial, less
disengaged, and as intimate in their behaviors as the
teachers in the norm group.
Confidence intervals formed from the mean scores on the
OCDQ-RS indicated that parochial secondary principals were
more supportive and as directive as the principals in the
norm group. Parochial secondary teachers were more engaged,
less frustrated, and more intimate in their behaviors as
compared to the teachers in the norm group. All parochial
schools had an open climate to varying degrees ranging from
below average openness to very high openness.
The 20 parochial schools valued the cul~ural dimensions
of quality, empathy, leader, and planning/organization.
ix
Parochial schools valued the cultural theme of relations as
the top priority, followed by the themes of work, thought,
and control .
x
Chapter 1 Introduction and Background
The Catholic school has been a part of the educational
structure of the United States since the time of
colonization. The Catholic schools, as all religiously-
based schools, blend a religious community with an academic
community. Are the organizational culture and climate
characteristics of the elementary and secondary Catholic
schools unique? What indeed makes any Catholic school
different from its public school and parochial school
counterparts?
The first national comparison of public schools and
private schools was initiated by James S. Coleman, the
University of Chicago sociologist, whose analysis of the
High School and Beyond data first indicated the existence of
a private-public gap in the level of achievement of students
(Coleman, Hoffer & Kilgore, 1981). The principal finding
indicated that students learn more in private schools than
in public schools. Two other important findings were that
private schools provide a safer, more disciplined, and more
ordered environment than public schools and that public
schools are more internally segregated than their private
counterparts.
The Coleman report launched the beginning of research
to determine why and how some schools or types of schools
worked "better" than other schools. In his article in the
Wall Street Journal, Putka (1991) stated that public school
defenders argued that Catholic schools were not better, but
that their students and parents were more cooperative and
supportive of the school. These defenders of public school
also asserted that Catholic school families are of a high
socio-economic status and care more about education because
they pay for it directly through tuition.
Coleman's study initiated the research that compared
public schools with private schools, especially Catholic
schools, which dominate the private school market in numbers
of schools and students in attendance. The second major
study, the National Education Longitudinal Study of 1988
(NELS: 88), was designed to provide longitudinal data about
critical transitions experienced by young people as they
progressed from elementary, middle or junior high schools to
high school and beyond. According to NELS: 88, the
environments of the Catholic elementary schools in that
study exhibited the same characteristics of the functional
communities that contributed to the effectiveness of
Catholic high schools in High School and Beyond (Hafner,
Ingels, Schneider & Stevenson, 1990).
Three major studies characterized the research on
Catholic schools during the 60s and 70s: the extensive study
of Catholic Schools by the University of Notre Dame,
Catholic Schools in Action (Neuwein, 1966), and the two
studies by Greeley and his colleagues, The Education of
Catholic Americans (Greeley & Rossi, 1966) and Catholic
2
Schools in a Declining Church (Greeley, McCready & McCourt,
1976).
The Notre Dame study, though criticized as descriptive
rather than evaluative, collected data from approximately
92% of the Catholic elementary schools and 84% of the
Catholic secondary schools in the United States. These data
revealed important trends in enrollment, finance and
achievement. The schools were portrayed as being
successful.
The Education of Catholic Americans focused more on
whether Catholic schools had a divisive effect on American
society by fostering a ghetto mentality among their
graduates than on Catholic education itself. Greeley and
Rossi found no support for the assertion of divisiveness.
The study did show an economic edge to graduates of a
Catholic school as a result of the support of the functional
community, that is, the family as part of the Catholic
church community with the child at the center (Convey,
1992). This same support of the functional community was
offered as a reason by Coleman (1985) for the academic
superiority of Catholic schools.
Catholic Schools in a Declining Church was a
replication of the former study. This study addressed
questions concerning the effectiveness of Catholic schools
and attitudes toward Catholic schools. The study's
principal conclusion was that Catholic schools were
3
perceived to be more important to parents of Catholic school
students than they were a decade before. Catholic school
parents reported the prospects for a better education as the
most important reason for sending their children to Catholic
schools.
Coleman revisited his original study of public and
Catholic schools in the 1990 publication of Equality and
Achievement in Education, adding new testing and new data.
The evidence from these data is that Catholic schools
maintain stronger academic demands and disciplinary
standards resulting in greater achievement. Once again, the
analysis found Catholic high schools to be more effective
than public high schools.
Catholic schools are a step apart in the educational
milieu. In the Notre Dame study (Neuwein, 1966) and the
studies conducted by the sociologist and priest Father
Andrew M. Greeley, the main observation noted was that there
continues to be something "different" about the environment
of the Catholic school. Chubb and Moe (1990) believed that
school organization is primarily a cause of student
achievement and not the result of it. School organization
then, with a focus on the organizational culture and climate
of selected elementary and secondary parochial schools, is
indeed fitting subject for research.
The Catholic school system does not exist in isolation
but is connected to a belief structure with an historical-
4
religious perspective that has existed for two thousand
years. Cooper (1988) acknowledged that one cannot define a
professional culture without postulating a belief system or
ideology. Coleman and Hoffer (1987) stated that Catholic
schools are based on an orientation that sees the school not
directly as an agent of the family but rather as an agent of
the religious community of which the family is a part. The
school is an institution of this community, the family is a
part of the community, and the child attends the school as a
part of the functional community (Coleman, 1987). Coleman,
as part of the Chicago studies of 1989, again reinforced the
premise of the functional community. This functional
community provides the "social capital" which Coleman
defines as the social support on which a child could draw in
time of need. The people resources would be attentive to
the child and assist in the solution of problems. The
Catholic school, Coleman noted, provides the "social
capital" supporting the youths within them. Community is
at the heart of Christian education, not simply as a concept
to be taught but as a reality to be lived (Raftery, 1985).
This descriptive study of the organizational culture
and climate in ten selected elementary and ten secondary
parochial schools provides a knowledge base regarding the
unique culture and climate inherent in Catholic schools.
The faculty and administration of each school in the study
provided description of the culture of their school within
5
the confines of the instruments used to collect data.
Naturally, each answered according to personal understanding
based on individual perception and diversity, for, as
Restine (1993) stated, if we envision making schools more
meaningful and more successful for those who live and work
in them, then we should attend to how human diversity
influences the culture of schools.
Statement of Purpose
The purpose of this study was to collect and interpret
base-line data concerning the organizational culture and
climate of selected elementary and secondary parochial
schools.
Significance of the Research
Comparative studies indicated significant differences
between parochial and public schools. Among these
differences, the culture and climate of the parochial
schools were frequently cited as being of significance.
These studies have led many to believe that parochial
schools exhibit more of the organizational characteristics
that have become recently known as "restructured schools" or
"effective schools." In addition, substantial work supports
the relationship between school culture and climate and
school success. However, at this time no significant study
has described and defined the organizational culture and
climate characteristics of parochial schools. The goal of
this study was to establish a knowledge base for
6
understanding the organizational culture and climate
characteristics that contribute to the uniqueness of
parochial schools.
Research Questions
The general research question addressed by this study
is "What are the organizational cultural and climate
characteristics of elementary and secondary parochial
schools?"
Specifically, the study focused on the following
questions:
1. What are cultural values of parochial schools?
1.1 How do parochial schools value the work
related concepts of effort, time, finishing a
job, and work quality?
1.2 How do parochial schools value the human
relations concepts of affect, empathy,
sociability, and loyalty?
1.3 How do parochial schools value the leadership
concepts of dominance, status, political
action and leadership style?
1.4 How do parochial schools value the learning
concepts of abstract thinking,
planning/organizing, exposition and
flexibility?
2. What is the organizational climate of parochial
schools?
7
2.1 What are the engaging behavior characteristics
of parochial schools?
2.2 What are the disengaging behavior
characteristics of parochial schools?
2.3 To what degree do parochial schools exhibit
the characteristics of an open school climate?
2.4 To what degree do parochial schools exhibit
the characteristics of a closed school
climate?
3. Do the cultural values and climate characteristics
of parochial elementary schools differ from those
of parochial secondary schools?
Limitations of the Study
All elementary and secondary Catholic schools in the
mideast section of the United States comprised the
population of interest in this study. Pennsylvania, New
York, Maryland, New Jersey, Delaware and the District of
Columbia compose the states of the mideast section of the
United States as defined by the National Catholic
Educational Association. The researcher had greater access
to information in this region due to her geographic location
and service as a secondary principal in the Diocese of
Harrisburg, in south central Pennsylvania. The total school
population in the mideast section of the United States
numbers 2,018 Catholic elementary schools and 356 Catholic
secondary schools. The 1992 census of Catholic schools
8
provided this information (Brigham, 1992).
The design of the study limited the population of the
mideast section to an accessible population. This
accessible population included those Catholic elementary and
secondary schools served by four congregations of women
religious educators. The four congregations include the
Sisters of Christian Charity; the Sisters, Servants of the
Immaculate Heart of Mary; the Sisters of St. Joseph; and the
Sisters of Mercy of the Americas. A representative of each
congregation provided a list to the researcher of the
schools served by that particular group in the mideast
section of the United States. The information included the
name of the current principal and the name of the school
with its address.
The study collected data from ten Catholic elementary
schools and ten Catholic secondary schools randomly selected
from the accessible population. These twenty schools became
the sample for the study.
Any generalizations of the study remain specific to the
accessible population in the mideast section of the United
States. Generalizations may not be made to the other
geographic areas which include New England, Great Lakes,
Plains, Southeast and West/Far West. Additional studies
should be undertaken in each of the identified regions for a
comparative study before any broad generalizations can be
made regarding Catholic elementary and secondary schools.
9
This chapter discussed the research needed to provide
baseline data as to the organizational culture and climate
characteristics of Catholic elementary and secondary
schools. Chapter 2 includes a discussion on the three
bodies of literature used in preparing the dissertation.
The first body of literature traces the history and
development of Catholic schools in the United States. The
second body of literature concentrates on the effective
schools research and the leadership role of the principal.
The third body of literature focuses on organizational
climate and culture, including definitions and comparisons
of the two terms.
Chapter 3 will describe the research design and
methodology applied in the development of the dissertation.
This chapter will describe the instruments utilized in the
data collection. Also included in this chapter will be the
description of the population and accessible sample for the
study.
The next two chapters, 4 and 5, will present the data,
analyze the data, and provide the results and conclusions of
the study. Chapter 5 will also present limitations and
recommendations for future studies.
10
Chapter 2
Review of the Literature
Several bodies of literature were reviewed in preparing
this dissertation. A descriptive study of the
organizational culture and climate of parochial schools
demanded that we have a clear understanding of the history
and development of Catholic schools. Review of the
literature established that prior researchers used the term
"effective schools" to refer to Catholic schools (Chubb &
Moe, 1990; Coleman, 1990; Coleman, Hoff~r & Kilgore, 1981;
Greeley, McCready & McCourt, 1976; Holmes, 1987). Thus
research concerning effective schools generally was relevant
to this study.
Review of the effective schools research focused
particularly on the leadership role of the principal.
Previous studies found that the role of the principal as a
leader was critical in creating school conditions that are
identified in effective schools-- setting high standards and
goals, planning and coordinating with staff, having an
orientation toward improvement and change, frequent
monitoring of staff and student performance, and involving
parents and the community (Brookover, et al., 1979; Coleman,
Hoffer & Kilgore, 1981; Grant, 1988; Leithwood, Begley and
Cousins, 1990; Sizer, 1985).
11
The third body of literature reviewed defined and
contrasted organizational culture and climate. The review
of this third body of literature affirmed the need for a
common definition of these terms as well as a contrast of
the terms. The literature review of the organizational
culture and climate revealed a myriad of definitions for
both terms. At times, the terms themselves blurred as they
were used interchangeably throughout different sources.
The Historical Development of Catholic Schools
The Roman Catholic Church operates the largest system
of non-public schools. During the eighteenth, nineteenth,
and twentieth centuries, enrollment in Catholic schools
steadily increased as a consequence of the open hatred and
prejudice in the Protestant-dominated public schools
(Cooper, 1988; McCoy, 1961). Catholic parents wanted
schooling which would keep their spiritual tradition alive
in the hearts of their children (Shuster, 1967). The school
reformers of the time promised not only improved
intellectual education but improved morals as well (Kaestle,
1991). The burgeoning number of Catholic immigrants to the
United States, particularly Irish and German, dramatically
increased the numbers of Catholic schools (Cooper, 1988;
Koob, 1966; Shaw & Hurley, 1969).
During the time of colonization, local public schools
were established for two main reasons: to teach reading to
enable Bible study, and to teach ciphering to prepare the
12
young citizenry with the elements necessary to run a
household or a business. The first schools reflected the
predominantly Protestant beliefs of the time. Reading
lessons used the King James version of the Bible as the
acceptable text. Protestant hymns and verses were also
recited and sung (Buetow, 1970; Fichter, 1958; Greeley &
Rossi, 1966; Koob, 1966; McCluskey, 1964; Neuwien, 1966;
Ravitch, 1983).
The Catholic educational system grew very slowly in the
early colonial days. Between 1640 and 1820, the whole area
that now encompasses the continental United States
accommodated a relatively few number of Roman Catholics.
The Spanish Franciscans in Florida and Mexico founded the
first Catholic schools around 1600. Within the thirteen
original colonies, 1640 marked the date of the establishment
of the first Catholic school in Maryland (McCoy, 1961;
Neuwien, 1966).
The Catholic school system met with resistance in
Maryland. Even though the Calvert family was Catholic, its
influence did not prohibit the passing of an anti-Catholic
education law in Maryland in 1704. This law, "An Act to
Prevent the Growth of Popery," threatened with deportation
any Catholic who should keep school, board students, or
instruct children in Catholicism (McCluskey, 1964; Neuwien,
1966).
In the colony of· Pennsylvania, William Penn and the
13
Quakers proved to be more tolerant of religious differences
and permitted the establishment of Catholic schools (Buetow,
1970). The first parochial Catholic school in Pennsylvania,
St. Mary's School in Philadelphia, was established in 1767.
The Ursuline Sisters, who arrived from France in 1727,
established the first Catholic school for girls in New
Orleans shortly upon arrival, but Louisiana was not part of
the United States at that time (McCoy, 1961).
Mother Elizabeth Ann Seton and her newly-established
American congregation of women religious, the Sisters of
Charity, opened the first tuition-free parish school for
boys and girls in 1810 at St. Joseph's Parish in Emmitsburg,
Maryland. This school more fully represents the prototype
of today's parochial school. Catholic education in America
found an active supporter in John Carroll, first Catholic
bishop of Baltimore. Bishop Carroll was instrumental in
establishing Georgetown University, the first Catholic
college, in 1789, and St. Mary's Seminary in Baltimore in
1791 (McCoy, 1961). While St. Mary's trained young men to
be priests, the aim of Georgetown University was to produce
an educated Catholic laity.
The first half of the nineteenth century set the stage
for the Catholic educational system as we know it today.
Catholic religious leaders determined that if their youth
were to receive a Catholic education, which was previously
thought to be possible within the framework of public
14
education, it would have to be in schools established by the
Catholic Church without support of public funds.
Bishop John Hughes of New York City waged a bitter
controversy as a vigorous proponent of public support for
the eight Catholic schools of his diocese. However, he lost
the battle for using public funds to support religious
schools. Bishop Hughes himself established thirty-eight new
schools in his diocese modeling his devotion to parish
schools.
Four councils of Baltimore, formal meetings of Catholic
bishops, reflected the changing attitudes of the hierarchy
of the Catholic Church and resulted in the present parochial
school system. The First Provincial Council of Baltimore
(1829) merely stated that it was "absolutely necessary that
schools should be established in which the young may be
taught the principals [sic] of faith and morality, while
being instructed in letters" (McCoy, 1961, p. 30). At this
time the establishment of parish schools was not specified.
By 1840 two hundred Catholic schools operated in the United
States (Neuwien, 1966; Shuster, 1967).
By 1852, the First Plenary Council of Baltimore urged
all the bishops to establish schools within all the parishes
in their respective dioceses. The Council required that the
schools be supported with revenues from each particular
parish. The'Second Plenary Council of Baltimore (1866)
considered Catholic schools as the only remaining answer in
15
view of the dangers in Catholic children attending public
schools (McCoy, 1961).
The Third Plenary Council, held in Baltimore in 1884,
mandated that every parish church have a parish school
within two years of its origin. These nineteenth-century
bishops viewed the teaching of religion in school as a
necessary part of a complete and humane education (McCarren,
1969). Omitting this religious dimension would make
schooling inadequate to human needs. The Third Plenary
Council bound Catholic parents to send their children to a
Catholic school (Shuster, 1967). Since schools operated
tuition free, parents willingly enrolled their children.
Parents also believed that a school that claims to be
Catholic exists because of the conviction that education
enlightened by wisdom of Christian revelation can be better,
fuller, richer, more humane, and thus more Christian than
any other kind of education (Greeley, 1969).
In 1925, Catholic education faced one of its greatest
challenges. The state of Oregon passed a law requiring all
students to be educated in public schools. In the
subsequent Pierce vs Society of Sisters (1925), the court
ruling firmly recognized that parochial schools furnish
secular as well as religious education and that parents have
a right to school choice in the education of their children.
Enrollment in the Catholic school system peaked in 1965
when Catholic schools enrolled 5.66 million students, 85% of
16
the students who were attending private schools. Catholic
schools accounted for 14% of the nation's total school
population. The students were enrolled in 10,633 Catholic
elementary schools and 2,502 Catholic secondary schools. In
1965, the Catholic schools across the United States
constituted a five billion dollar capital investment with an
operating cost of eight hundred fifty million annually
(Buetow, 1970; Greeley & Rossi, 1966; McCluskey, 1964).
Following a twenty-year decline in enrollment, Catholic
schools in 1985 educated 58% of the students enrolled in
private schools. This percentage of total private school
enrollment has been stable since 1985. The reasons for the
decline include a) the relocation of the Catholic community
from the cities to the suburbs; b) the general decline in
the birth rate; and c) the loss of the teaching priests,
sisters, and brothers with resultant increase in tuition
(Buetow, 1970; Cooper, 1988).
Catholic Schools in America (1992) highlighted the
current enrollment trends in the decade of the nineties. In
1992 Catholic school enrollment in elementary and/or
secondary schools increased in 35 states. In 1991-92,
Catholic schools totaled 8,508; of these, 7,239 were
elementary schools and 1,269 were secondary schools. In
this same year the total number of Catholic school students
equaled 2,550,863. The mideast region of the United States,
which includes Delaware, District of Columbia, Maryland, New
17
Jersey, New York, and Pennsylvania, educates 28% of the
Catholic school population. New York and Pennsylvania are
the top two states in Catholic school enrollment, with
schools educating over a half-million students.
During the 1992-93 school year, enrollment in Catholic
elementary schools increased by more than 19,000 students
over the enrollment for the 1991-92 school year. In that
year, 47 states reported increases in enrollment in Catholic
elementary schools. In the past decade, pre-school
enrollment in Catholic schools has increased by almost 300
percent. The number of children entering a Catholic school
at the kindergarten level now surpasses the number of
students graduating from the eighth grade. The increase in
the upper grade enrollment is significant and reflects the
attention that Catholic schools have been giving to their
middle-level programs.
Minority enrollment in Catholic schools has increased
from 11% in 1970 to 23% in 1989. Of that 23%, 10% are
Hispanic Americans, 9% are African Americans, 4% are Asian
Americans. While 97% of the Hispanic students are Catholic,
about two-thirds of the black students in Catholic schools
are non-Catholics. The percentage of non-Catholic students
in Catholic schools has grown slowly in recent years and
stood at 12.5% in 1990 (Guerra, 1991).
Catholics spend over five billion dollars a year
supporting Catholic elementary and secondary schools. The
18
average elementary school tuition in 1989 was $925, and it
covered 63% of the average per pupil cost of $1,476. Parish
support and other fundraising revenues contribute to the
balance of per pupil costs (Guerra, 1991).
The Catholic community's expenditure of five billion
dollars in tuitions and contributions generates even larger
savings for the civic community. Since Catholic schools
operate on average at less than half the per pupil costs of
public education, which was estimated by the U.S. Department
of Education at $4,719 in 1989, Catholic schools represent a
savings to u.S. taxpayers of more than 10 billion dollars.
This savings has increased in the five years since these
figures were available.
Catholic schools have unique qualities. The fact that
religion is taught and God is mentioned in all the academic
areas is indeed one uniqueness. The devotion of the members
of religious congregations working as educators at nominal
salaries and lay persons working at below-average salaries
have contributed to the low cost of Catholic education over
the years. Religious congregations include men and women
who have devoted themselves to the service of God by
professing religious vows. Lay persons are men and women
who are not affiliated with a religious congregation but
who, in this case, teach in Catholic schools.
In the last twenty-five years, the teaching staff has
moved from predominantly religious to predominantly lay. In
19
1965 the members of religious congregations constituted
about 63% of the teaching staff of Catholic schools. Lay
teachers now represent about 85% of the faculties, sisters
12%, and priests and brothers 3%. An increasing number of
lay persons comprise the leadership position of principal.
One third of the Catholic elementary and secondary schools
in the United States have now employed lay principals
(Guerra, 1991).
The second Coleman study (Coleman, Hoffer and Kilgore,
1981) made three major claims. The first claim, which is
the most publicized, provided the springboard for the
research to be undertaken: private and Catholic schools are
more successful than are public schools serving students of
the same social background. Most Catholic schools accept
all applicants. A relatively small number of Catholic high
schools are somewhat selective and report rigorous academic
criteria for admissions and waiting lists, but the average
Catholic high school accepted 98% of all applicants in the
fall of 1989, and about one-third report a fully open
admissions policy, accepting all applicants. The retention
rates remain extremely high for all students, including
minority and low-income students, whose dropout rates in
Catholic schools are one-fourth of what they are in public
schools (Guerra, 1991).
The second claim stated that private and Catholic
schools are most likely to use effective school ideas (high
20
academic climate, high expectations, academic atmosphere,
frequent monitoring of achievement, and clear expectations
of teachers). Finally, the third claim suggested that
private and Catholic schools not only achieve better
outcomes but also produce less variance in the achievement
variables.
In the 1990 publication of Equality and Achievement in
Education, Coleman reinforced his original findings. The
study of Chubb and Moe (1990) substantiated Coleman's
conclusion that private and Catholic schools are more
successful than are the public schools serving students of
the same background. Focusing on the second point, that
private and Catholic schools are most likely to use
effective school ideas, confirmed the need to understand the
effective schools research.
Effective Schools
The "effective schools" literature describes the
organization, climate, and culture of elementary schools
more frequently and secondary schools less often. In this
research, certain characteristics have been identified as
common denominators of effective schools. Six overall
themes permeate the research of effective schools focusing
on these areas: 1) leadership of the principal; 2)
professional work environment; 3) positive learning
environments; 4) school climate or atmosphere; 5) community
involvement; and, 6) continuous school improvement
21

(Brookover et al., 1979; Coyle & Witcher, 1992; Deal &
Peterson, 1990; Elmore, 1987; Grant, 1988; Gutmann, 1989;
Levine, 1986; Lightfoot, 1983; Louis & Miles, 1990;
Sergiovanni, 1987; Sykes & Elmore, 1989; Thomson, 1989;
Townsend-Butterworth, 1992; Webber & Skau, 1992; Wilson &
Corcoran, 1988).
The leadership of the principal is tantamount to an
effective school. Effective principals are strong leaders
articulating high but realistic goals for both students and
staff (Lane, 1992; Mulkeen, Marcus & Finkel, 1986; Townsend-
Butterworth, 1992). Instructional leadership is a quality
of an effective principal and is manifested in the active
solution of instructional problems and the involvement in
classroom observations (DeRoche, 1987). The effective
principal takes initiative in identifying and articulating
goals and priorities for the school and cares more about
academic progress of students than about collegial relations
with teachers and staff members (McCurdy, 1983). Yet, the
principal is able to balance strong leadership with autonomy
for the faculty as a "human engineer," emphasizing human
relations, interpersonal competence, and instrumental
motivational techniques (Sergiovanni, 1987).
The leadership role of the principal differs greatly
between elementary and secondary schools. On the secondary
level, to an extent, school size determines the number of
administrative staff. The subject area expertise
22
delineation as identified by departments necessitates a
hierarchical arrangement (Purkey & Smith, 1985). Secondary
schools often include department chairs of the various
subject areas as well as one or more assistant principals
whose job descriptions focus on curriculum, discipline, or
student activities. Depending on the size of the elementary
school, the principal may hold the only administrative
position. Elementary schools have little
departmentalization by subject areas. Some schools have
lead teachers but the overall ambiance is one of shared
purpose with a greater emphasis on basic skills without the
clear departmental structure as in the secondary schools
(Firestone & Herriott, 1982).
Classroom management may be influenced by the principal
at the elementary level but not so at the secondary level.
The principal at the secondary level may find it difficult
to create consensus on instructional goals. Members within
a department seek advice on classroom management from a
department chair as the first level of administration rather
than the principal. The size of the faculty at the
secondary school limits the influence of the principal to
guide the faculty to goal consensus. Firestone and Herriott
(1982) stated that it is more useful to think of the
professional staff of an elementary school as similar to a
work group and the professional staff of a secondary school
as members of a complex organization. Strong administrative
23

leadership does contribute to secondary education and
effective schools based on research (Rutter, Maugham,
Mortimore, Ouston & Smith, 1979).
A secondary principal cannot rely on the same style or
direct leadership as at the elementary level. The direct
leadership is limited by the larger staff and student
population, the multilevel organizational structure, and the
specialized subject area knowledge of teachers. The
secondary principal must rely on indirect, facilitative
leadership while providing direct intervention in selected
situations (Purkey & Smith, 1985).
The research of Sergiovanni (1984) presented the best
illustration of strong administrative leadership. He
identified five dimensions of this multidimensional role
which included technical management activities, provision of
interpersonal support and encouragement of staff,
instructional intervention, modeling important goals and
behaviors and signaling to others what is important
(symbolic leadership), and developing an appropriate and
unique school culture. Effective principals set high
professional and school standards for achievement of these
goals then actively work towards the development of
widespread agreement concerning such standards (Leithwood,
Begley & Cousins, 1990).
Research on effective schools has promoted the view
that schools can be organized and can create professional
24
work environments to improve instruction. Principals have a
key role to play in the creation of the professional work
environments (Firestone & Wilson, 1985). Principals who
have a vision and communicate this vision based on their own
personal values provide a foundation for the schools to
improve instruction (Chance & Grady, 1990). Schlecty (1990)
stated that strong leaders build work cultures that outlive
them.
The second theme of the effective schools literature
focused on professional work environments. In such
settings, the physical facilities themselves are neat,
clean, safe, and attractive (Rutter, et aI, 1979).
Moreover, teachers are respected, listened to, and provided
the discretion and autonomy needed by professionals (Wilson
& Corcoran, 1988).
A positive learning environment, as the third general
theme, is evidenced in an effective school where teachers
provide direct instruction in the basic skills, high order
thinking skills, and follow a core curriculum, with the
expectation that all children in their classroom can master
the content (DeRoche, 1987). Teachers are flexible, use
various teaching methods and materials, monitor student
progress, and inform parents of progress. These teachers
will protect the loss of instructional time (DeRoche, 1987;
Murphy, 1993). The curriculum is well-planned, diverse,
challenging and age-appropriate (Townsend-Butterworth,
25
1992).
The fourth theme, which centers on the school climate
or atmosphere, portrays a school climate which is orderly,
well disciplined but with a sense of excitement and joy
(McCurdy, 1983; Townsend-Butterworth, 1992). Strong values
support a safe and secure environment that is conducive to
learning and is free of disciplinary problems or vandalism
(Deal & Peterson, 1990). A discipline code exists which
enumerates the rules and regulations regarding behavior and
delineates students' rights and responsibilities.
Enforcement of this code is fair and consistent. All
members of the school have been well informed of the code
(De Roche, 1987; Taylor & Valentine, 1985; Wilson &
Corcoran, 1988). The school itself is a pleasant place with
an attractive, bright, clean, physical appearance. Schools
that are labeled effective or successful produce a climate
or "ethos" conducive to teaching and learning (Grant, 1988;
Purkey & Smith, 1985; Rutter, et aI, 1979).
The fifth identified general theme is community
involvement. According to this theme, the school's mission
and goals are articulated to the parents and the general
community (Seyfarth, 1991) and the school informs the
parents and the larger community of the services which are
offered (DeRoche, 1987). The school and parents communicate
openly and honestly, and the school encourages initiation of
such communication by parents or the larger community.
26

Parents are encouraged to become involved in the programs of
the school and in the direct teaching/learning process, for
the school is recognized as sharing with parents a
partnership in education of the children. School governance
involves parents as a participating voice (Murphy, 1993).
Continuous school improvement is the sixth and last
theme of effective schools. Teachers in effective schools
are committed to the view that they can continue to learn
about teaching and can tap their colleagues as potential
resource persons who can help them grow professionally
(Seyfarth, 1991). The instructional program strives to
reach high performance standards as indicated by such
measurable statistics as test scores, student attendance
records, and the drop-out rate (DeRoche, 1987). The
knowledge base provides new ideas and methods for continued
school improvement. Students and staff understand the
important beliefs of the school and the high expectations
for success. Improved academic quality develops and matures
based on a supportive tradition (Ubben & Hughes, 1987).
Schools, both elementary and secondary, are the modern
workplaces of education. Purkey and Smith (1985) stated
that successful schools are characterized by a culture that
is task-oriented but also supportive of initiative,
creativity and diversity. Cultures will vary based on the
composition of the staff and the student body and also the
environment in which the school exists. Each school will
27
then have a unique climate or personality. A school's
culture and the classroom climate are the direct result of
attitudes, behaviors, and interactions among teachers,
administrators, parents, students, and staff (DeRoche,
1987). The beginning point of any school improvement is an
analysis of the present school culture (Purkey & Smith,
1985). Description of the organizational culture and
climate of selected elementary and secondary parochial
schools is the subject of this research.
Culture
An academically effective school is distinguished by
its culture. Purkey and Smith in 1982 stated that culture
is "a structure, process, and climate of values and norms
that channel staff and students in the direction of
successful teaching and learning" (p.68).
The focus on organizational culture gained prominence
with the publication of In Search of Excellence (1982) by
Peters and Waterman. Culture has been described as either
internal, external or both. The internal definitions focus
on the intangible "feel," or symbols and meanings which are
elusive to an intellectual grasp of culture. Deal and
Peterson (1990) determined that the intangible "feel" of a
school or organization is the culture which is reflected in
the values, beliefs and traditions of the community. The
relations among the teachers, parents, students and
principal are part of this culture. Saphier and King (1985)
28
stated that "the culture of the school is the foundation for
school improvement" (p. 67). Corbett, Firestone and Rossman
(1987) posited that culture is the way things are. Culture
also includes the way people should act and the personality
of the members of the school environment. Culture is
understood as a system of taken for granted; ordinary
meanings and symbols that have been transferred, learned and
shared by the group. This sharing could be deliberate or
non-deliberate (Erickson, 1984). Blendinger and Jones
(1989) defined culture as the understandings that are shared
by people about what is valued in an organization.
The external definitions posit that culture is
observable. Bates (1987) in comparing corporate and school
culture reflects the anthropological basis of meaning,
customs, material objects, rituals and ceremonies that are
carried and communicated to members of the group. This
external level or definition is the visible artifact level
as described by Schein (1985) which can be seen in such
physical structures as buildings, technology, and the
written materials. The external level would also include
customs and rituals.
When describing culture as both internal and external,
Bolman and Deal (1991) posited that the action of culture is
both product and process, that is, what is observable and
the more subtle, hidden roadmap to the final outcome.
Schein (1983) enlarged his definition to include external
29
adaptations-- meanings, symbols, rituals and ceremonies--
that became functional through process; that is, the
external adaptations developed by the members in learning to
cope within the organization have worked well enough now to
be considered valid for this organization. At this point,
the culture is internalized and taught to new members as the
correct way to perceive, think, and feel in this group or
organization. Schein argued that organizational culture is
the key to organizational excellence.
Where do cultures originate? Cooper (1988) informed us
that cultures are not made; they are born and grow. The
culture is inherent in the institution. A professional
culture is not built solely out of an environment and tasks.
It is also a product of the background of the many
individuals that are part of the setting. That background
draws from the very professionalism and the communal
experiences of the profession. Wirt and Kirst (1989) and
Fuller and Izu (1986) stated that the extent to which
members of the profession share certain values and beliefs
is central to the strength and unity of the organization's
future.
The Catholic Dimension of Culture
Culture within the Catholic system is based on specific
values. Based on the research of Coleman, Hoffer, and
Kilgore (1981), Holmes (1987) argued convincingly that the
greater effectiveness of Catholic schools in the United
30
States stems from their participation within a value
community. This community lives, plays and prays together
within a set of commonly held beliefs. Catholic schools not
only have value consistency, as do other private schools,
but they are also grounded in a functional community
(Convey, 1986). This functional community provides common
norms and values, and it facilitates social relations among
its members. Catholic schools have the ability to more
easily develop a common, agreed-upon mission. The school's
actions are developed in a cultural perspective that focuses
on the social values and behavioral norms rooted in Catholic
tradition (Lane, 1992).
Several authors have described beliefs of the Catholic
school system (Guerra, Donahue, & Benson, 1990; McDermott,
1986). Among these beliefs are the following:
1. Catholic schools are a privileged place to help
children develop a sense of their human dignity,
freedom and hopefulness. The Catholic school is an
integral part of the church's mission to proclaim
the Gospel, build faith communities, celebrate
through worship, and serve others.
2. The aim of Catholic schools is to help students to
take on the mind and heart of Jesus Christ
according to the traditions of the Roman Catholic
Church.
31

3. The commitment to academic excellence, which
fosters the intellectual development of faculty and
students, is an integral part of the mission of the
Catholic school.
4. The spiritual formation of the entire school
community is an essential dimension of the Catholic
school's mission.
5. The Catholic school is a unique faith-centered
community which integrates thinking and believing
in ways that encourage intellectual growth, nurture
faith, and inspire action.
6. The Catholic school creates a supportive and
challenging climate which affirms the dignity of
all persons within the school community.
7. Teachers in Catholic schools should acquire solid
professional formation in Catholic doctrine and
should be conscious of their vocation to help form
human beings according to the model "To Teach As
Jesus Did."
8. An administrator in a Catholic school is one who
serves as manager, academic leader, creator of the
school's environment, and religious leader.
Administrators are to integrate faith and culture
and to promote the spiritual life of the students.
An educational institution, whether public or private,
performs two ipseparable functions (Fichter, 1958; Greeley,
32
1969; Koob, 1966). The first function is to transmit to the
younger generations the culture with all its existing
patterns, institutions, and values. The second function,
simultaneously, is to supervise the socialization process
whereby the child actually receives the culture. The child
then adapts himself/herself to or is adapted to the socio-
cultural system in which he/she lives. Greeley continued
that a school that claims to be Catholic exists because of
the conviction that education enlightened by the wisdom of
Christian revelation can be better, fuller, richer, more
humane, and thus more Christian than any other kind of
education.
The internal cultural system has been highlighted in
the preceding information. Observable aspects of the
external cultural system within a Catholic school are
evident in artifacts such as the crucifix, statues,
religious paintings and posters that reflect the message of
Sacred Scripture. Other observable parts of the external
culture include the use of prayer to begin the day, to begin
classes, and to close the day.
Not only faculty but the parents and students as well
share the vision and purpose of the Catholic school. Bryk
and Holland (1984b) found in their field observations that
there was a shared set of values among students, parents and
faculty about the purposes and vision of the Catholic
school. Catholic schools are value-oriented, grounded in a
33
set of beliefs about the worth of each individual, and
committed to a world view that proclaims a meaning to life
which encompasses more than self interest (Bryk & Holland,
1984a; Greeley, 1969; Guerra, Donahue, & Benson, 1990;
McNamee, 1986). The definition of effectiveness itself in
the Roman Catholic school system includes specific religious
beliefs and values (Davis, 1987).
Catholic schools are able to assemble a reasonably
complementary and competent staff on the local level. The
principal, in cooperation with the parish priest on the
elementary level, determines all personnel decisions. On
the high school level, a personnel committee of the school
board might serve to provide input and insight to the
principal during the interview and subsequent hiring
process. Purkey and Smith (1985) stated that disgruntled
or mismatched staff could hinder, if not sabotage, the
development of a productive culture. Louis (1993) noted
that an environment that reinforces personal values
increases teacher commitment and effort. Louis called this
union of personal value and environment "value congruence."
Rokeach (1968) defined this same principle as belief
congruence, asserting that we tend to value people in
proportion to the degree to which they exhibit beliefs or
systems of belief congruent with our own. In 1973, Rokeach
stated that the possible variations within a given culture
are reduced as a result of socialization by similar
34
religious upbringing, i.e., Catholic faith. Sergiovanni
(1990) added that the key to successful schooling is
building a covenant comprised of purposes and beliefs that
bond people together around common themes, signals of what
is of value. Within a Catholic school system, a common
religion bonds teachers of the Catholic faith. Within this
system the participants in the school agree on the hidden
dimension of curriculum as well as the overt curriculum.
The culture in itself has become "sacred" (Maxwell & Thomas,
1991) .
Climate
At times, definitions of climate and culture are
blurred. Hoy, Tarter and Kottkamp (1991) made the following
useful distinction: "culture consists of shared assumptions
and ideologies, while climate is defined by shared
perceptions of behavior" (p. 7). Coyle and Witcher (1992)
held that those educators who wish to promote an effective
school program will want to study the climate of the school.
Sweeney (1991) stated that climate can be measured to
provide baseline information that can be used to target
areas for growth. He further stated that both climate and
culture are linked to organizational behavior because they
join attitudes and belief to motivation and work- related
behavior. Climate differs from culture in the fact that
climate addresses the way people in the organization feel
about the organization, including such areas as trust,
35
honesty, opportunity for participation, morale, respect,
cohesiveness, caring, and renewal (Reavis, 1990).
Organizational climate is a general term that refers to
teachers' perceptions of their work environment (Hoy,
Tarter, & Kottkamp, 1991). The primary characteristics of
the ideal work environment for teachers include the
following: 1) shared goals and high expectations of success
to create strong communal identity; 2) respectful and
dignified treatment as professionals by supervisors and by
parents and students; 3) active participation by teachers in
the decision-making process which affects their work; 4)
regular opportunities for interaction and sharing that
promote a community of faculty members; 5) recognition and
rewards for their effort and achievement; 6) opportunities
for professional growth; and 7) decent physical working
conditions (Wilson & Corcoran, 1988).
The characteristic that an ideal work environment has
shared goals and high expectations is not surprising. In
Search of Excellence (1982) by Peters and Waterman pOinted
to the fact that successful institutions have definite value
systems and members who are committed to these values.
Duignan (1986) noted that an effective school must have a
fundamental belief system, or set of values, that has a
definite purpose or goal--in this case, high expectations of
success. To create a strong communal identity, climate must
reflect not only the values of teachers but also the values
36

that parents and educators share (Johnston, 1987; Vatterott,
1994). Maxwell and Thomas (1991) expressed the view that
these value systems, held in high regard by the specific
groups of educators and parents, will influence the norms
and standards which in turn influence patterns of behavior
and ultimately the work environment.
The second characteristic of respect and dignified
treatment as professionals has as its roots the building of
self-esteem: that is, the extent to which teachers feel that
they and the school are valued by students, parents, and
administrators (Sweeney, 1992). A teacher's sense of self-
worth is highly related to successful teaching (Adams &
Bailey, 1989). A principal is directly responsible for the
enhancement of a teacher's self-worth. Parents will support
any school and teacher when they sincerely believe that
teachers and administrators love, support, and care about
the individual development of their child (Wilmore, 1992).
A concordant relationship among the students, teachers,
parents, and administrators leads to a positive school
climate (Witcher, 1993).
Active participation by teachers in the decision-making
process can be called by a variety of terms: empowerment,
autonomy-delegation, and decision participation. Delegating
responsibility and authority to teachers and allowing them
discretion in determining how to do their work creates a
positive work environment (McCurdy, 1983). All those within
37

an organization must feel needed and believe that their
opinions and ideas are valued (Stevens, 1990). Empowerment
of teachers has become the term which incorporates positive
affirmation, professional validation, and self-actualization
as one (Simpson, 1990).
The third characteristic leads into the fourth
characteristic, an ideal work environment. If teachers are
involved in the decision-making process then they are
afforded regular opportunities for interaction and sharing.
As noted by Simpson (1990) in his research, teachers in
successful or effective schools valued and participated in
norms of collegiality. Collegiality is the extent to which
teachers work together and with their administrators, share
and assist each other, and receive help and support from
their administrators (Sweeney, 1992). Teamwork and
collaboration are important factors in a positive school
environment (Akin, 1993). Person-to-person contact creates
a healthy psychological climate where human beings are cared
for and nurtured constructively by one another (Schultz,
Glass, & Kamholtz, 1987).
Praise and recognition constitute positive
reinforcement for teachers. In effective schools, a
principal provides appropriate praise and recognition to
faculty and shows appreciation for special efforts and
contributions (McCurdy, 1983). Adams and Bailey (1989)
stated that the building of self-efficacy involves using
38
positive reinforcement and increasing the number of
celebrations for good performance.
District-supported and district-financed opportunities
for professional growth encourage continued education in
current trends and research for faculty members. Teachers
who have opportunities to attend professional meetings and
workshops should also have the opportunity to report and
discuss their observations and new found knowledge with
colleagues (Stevens, 1990). This sharing provides for
professional interaction as well.
Ideal working environments must have decent physical
working conditions. The welfare of faculty members and
students must come first, with a building and facility that
is safe and secure.
Summary
The research begun by Coleman, Hoffer, and Kilgore
(1981) to examine public and private schools alerted the
populace that there is a difference in schools. The
effective schools research has identified characteristics
which, when present, produce students who achieve at a
higher level. One of the characteristics that has been
examined in the effective schools research is the leadership
of the prinCipal. This study will focus on randomly
selected schools in which the principal has been in that
position for two years or longer. The school and the
principal will thus have had time for the adjustment period.
39
The research has identified the school atmosphere or
climate as a characteristic of effective schools. Culture,
defined as the shared assumptions and ideologies, and
climate, defined as shared perceptions of behavior, comprise
the school atmosphere. Culture and climate have been
defined and contrasted. Organizational culture and climate
are the two components of a school that are the focus of \
this study. Catholic schools have been chosen to provide a
baseline description of the organizational culture and
climate. Coleman (1990) and Greeley's (1989) research
concluded that Catholic schools exhibited the
characteristics of effective schools. The school atmosphere
of culture and climate should then be examined. Chapter 3
will describe the population, accessible population, and
sample in the study. The Cultural Value Analysis Tool
(CVAT) and the Organizational Climate Description
Questionnaire were used to obtain the data for analysis.
40
Chapter 3
Research Design and Methodology
Chapter 3 has two objectives. The first objective is
to describe the research design and methodology used in this
study. The second objective is to describe the validated
instruments used to collect data on organizational culture
and climate. This quantitative study was designed to
compile baseline data of the organizational culture and
climate of selected secondary and elementary parochial
schools. Two data collection instruments were selected for
the study. To collect data pertaining to the organizational
culture of the educational institution, Nelson's Cultural
Values Analysis Tool (CVAT) was used. The second set of
data pertaining to organizational climate was collected
using the Organizational Climate Description Questionnaire
(OCDQ) as revised by Hoy, Tarter and Kottkamp based on the
original design by Halpin and Croft. The OCDQ has two
specific instru~ents. The OCDQ-RE was designed to collect
data at the elementary school level. The OCDQ-RS was
designed to collect data at the secondary school level.
Research Questions
This study was a quantitative analysis of the
organizational culture and climate of selected elementary
and secondary parochial schools. The study focused on
the following questions:
41

1. What are the cultural values of parochial schools?
1.1 How do parochial schools value the work related
concepts of effort, time, finishing a job, and
work quality?
1.2 How do parochial schools value the human
relations concepts of affect, empathy,
sociability, and loyalty?
1.3 How do parochial schools value the leadership
concepts of dominance, status, political
action and leadership?
1.4 How do parochial schools value the learning
concepts of abstract thinking,
planning/organizing, exposition and
flexibility?
2. What is the organizational climate of parochial
schools?
2.1 What are the engaging behavior characteristics
of parochial schools?
2.2 What are the disengaging behavior
characteristics of parochial schools?
2.3 To what degree do parochial schools exhibit
the characteristics of an open school climate?
2.4 To what degree do parochial schools exhibit
the characteristics of a closed school
climate?
42
3. Do the cultural values and climate characteristics
of elementary parochial schools differ from those
of secondary parochial schools?
Population and Sample
The population was comprised of all elementary and
secondary Catholic parochial schools in the mideast section
of the United States which included the following states or
districts: Pennsylvania, New York, Maryland, New Jersey,
Delaware, and the District of Columbia. The total number of
Catholic elementary schools in this population from the 1992
census was 2,018. The total number of Catholic high schools
in this population from the 1992 census was 356. This
section of the United States was chosen for two reasons.
The first reason was that the percentage of Catholic schools
in this region was 27.9%, which is the highest percentage of
all the regions. The additional regions included New
England, Great Lakes, Plains, Southeast and West/Far West.
Secondly, the researcher had greater access to information
in this region due to the geographic location and her
service as a secondary principal in the Diocese of
Harrisburg, in south central Pennsylvania. Considering only
the mideast region of the United States was a limitation of
the study.
The accessible population was limited to two hundred
forty (240) parochial elementary schools and forty-seven
(47) parochial secondary schools. The list was comprised
43
from the names, addresses and contact persons of these
schools as requested by the researcher from four members of
the congregations of women religious currently serving at
the same high school with the researcher. The information
included the Catholic elementary and secondary schools
served by these four religious congregations in the mideast
area of the United States, namely, the Sisters of Christian
Charity; the Sisters, Servants of the Immaculate Heart of
Mary; the Sisters of St. Joseph; and the Sisters of Mercy of
the Americas.
The sample was comprised of ten elementary schools and
ten alternate schools that were selected randomly from the
list of two hundred forty Catholic elementary schools from
the accessible population. The sample of secondary schools
was comprised of ten secondary schools and ten alternate
schools that were selected randomly from the list of forty-
seven Catholic high schools from the accessible population.
Instruments
The research instruments selected for this study are
questionnaires. Using a paper and pencil instrument for
this study was considered to be both practical and realistic
for the following reasons. First, any broad study of
organizational culture and climate must employ closed ended,
quantitative data given that resources are finite. Second,
because of the geographic distribution of the respondents
44
and the length of time necessary for the respondents to
complete and mail the questionnaires, this method was the
most cost effective way of securing data.
Cultural Values Analysis Tool (CVAT)
Reed Nelson designed the Cultural Value Analysis Tool
(CVAT) that was used as the instrument in the study to
gather the data and analyze the organizational culture of
parochial elementary schools and parochial secondary
schools. The CVAT had been used to study the organizational
culture of business organizations and church organizations.
This was the first time this instrument was used in a school
organization as a data collection tool.
According to Nelson, the universal functions that are
common to all human systems are Work (also called task,)
Relations, Control (frequently associated with power and
politics) and Thought (cognition). These four functions
were the basis of the Aggregate Value Profile.
Each general theme (Work, Relations, Control, and
Thought) has four subthemes which are usually contradictory
but occasionally complementary. For the general theme of
Work, the four subdimensions are as follows: 1) Effort; 2)
Time orientation or speed; 3) Closure or priority given to
finishing tasks: and, 4) Quality. Time pressures and work
deadlines lower quality whereas effort supports all three.
The Relations quadrant has four subdimensions as
follows: 1) Affect; 2) Empathy; 3) Sociability; and 4)
45
Loyalty. These subdimensions related to voluntary
connections with other people, but each had a different
emphasis. Affect brings one close to others, but
principally to take nurturance. Empathy brings closeness
but to give nurturance. Sociability focuses on closeness
and interaction with groups of people rather than
individuals. Loyalty emphasizes durable or long lasting
closeness to people or groups. These subdimensions are not
inherently contradictory but neither are they necessarily
reinforcing. People with strong affective needs are not
necessarily empathetic, loyal, or sociable. Sociability
does not presume Empathy or Loyalty. Loyalty does not
presume Empathy although it does not preclude it.
The four subdimensions of Control represent different
influence strategies: 1) Dominance; 2) Status; 3) Politics;
and, 4) Leadership. Dominance involves imposing one's will
openly without contrivance. Status favors one's will by
creating or highlighting symbolic inequalities between
individuals. Politics, through manipulation and
contrivance, imposes one's will. Leadership secures control
through charisma. The Leadership subdimension is
universally accepted if not revered in organizations.
The four subdimensions appear under Cognition: 1)
Abstraction; 2) Planning-Organization; 3) Exposition; and,
4) Flexibility. While Abstraction deals with generalities,
Planning-organization tends to focus on details. Exposition
46
deals with communication, especially with transmission of
ideas, not their creation. Flexibility is an important
attribute of information processing and adaptive
capabilities of people and organizations.
The instrument was structured so that respondents rank
order items in sets of four. Ranking enabled the respondent
to confront each of the sixteen dimensions using 80 items
grouped in sets of 20 statements. Each of the sixteen
subdimensions appeared five times, was ranked from one to
four and generated a scale that can range from 5 to 20.
Scores on the entire instrument, for one respondent, summed
to exactly 200, that is, twenty sets of statements with each
set having a value of ten points.
On the response form for the CVAT, two columns appear
to the right of these groups of statements. In the first
column, for each set or group of statements, respondents
were asked to rank the statement that best described their
organizational culture with a four (4), the next best
statement with a three (3), then two (2), then one (1).
These were considered the "descriptive" responses or how the
organization is perceived by the respondent. Respondents
were given instructions not to use the same rank number for
two or 'more statements in anyone given set. In the second
column, individual perceptions of the ideal organizational
culture or how the organization should be were measured
using the same set of instructions. These were considered
47
as "normative" responses. (A copy of the complete
questionnaire can be found in Appendix 1.)
Information about reliability of the Value Profile was
obtained from Suresh Gopalan in his dissertation (1991). A
student of Nelson's, Gopalan had access to the data to
determine reliability.
The reliability was determined using two trials with
10,000 repetitions producing nearly identical error variance
distributions, as did mathematical enumeration of all
possible combinations of rankings from one to four for the
16 scales. The observed within scale variance (i.e.,
between item variance) for each of the 16 items was divided
by the modal expected variance of the 16 items. The ratio
was subtracted from 1, and the square root of the result was
found to obtain the reliability coefficients shown in the
second column in the table to be found in Appendix 2. The
coefficients, which range from .642 to .926, are quite
acceptable for exploratory research. The mean scores and
standard deviations for the 16 subdimensions are also
included in the table.
Pilot Study of the CVAT
The first pilot study of the CVAT: Aggregate Value
Profile was administered in the spring of 1992 to the
faculty and staff of Resurrection Parish School in
Jacksonville, Florida. Of the twenty-six surveys
distributed, only 10 were returned. Resurrection Parish
48
School is an elementary school comprised of all grades
beginning with a three-year-old pre kindergarten program
through Grade 8. Each class is basically self-contained
with resource teachers available in the following areas:
art, music, physical education, computer literacy and
library. The enrollment for the school at the time of the
study was 260 students.
The second pilot study of the CVAT: Aggregate Value
Profile was administered in the winter of 1993 to faculty
and staff of Delone Catholic High School in McSherrystown,
PA. The school is a secondary school with Grades 9-12. It
is the only Catholic high school within a twenty-mile
radius. Over seventy percent of the students continue their
education by attending either a four-year college or a two-
year community college or trade school. The curriculum
offers classes in business education, home economics and
child care, and industrial art classes in graphic arts and
woodshop. The school has had four administrators in the
last five years. The survey instrument was distributed to
forty-eight faculty and staff members. There were twenty-
five responses returned. Two of the responses had to be
disregarded because of incorrect ranking.
The researcher compared the two pilot studies. Several
observations were made concerning the cultural values of • each school. In the real mean scores, the elementary school
valued quality, empathy, and effort. For the secondary
49
schools, the real mean scores illustrated that political,
status, and dominance were valued as the priority. In the
ideal mean scores, the elementary school ranked quality,
effort, and planning/organization as the top three
dimensions valued. In the ideal mean scores at the
secondary level, the respondents valued, in order, quality,
leader and planning/organization. In the ideal situation,
the elementary and secondary valued two of the same three
dimensions whereas in the real situation, the dimensions
valued were totally different.
The ranking of the themes differed in both the real and
ideal. In the real, the elementary school ranked the themes
in the following order of priority: work, relations,
thought, and control. The secondary school ranked the
themes in this order: control, work, thought, and relations.
For the elementary school, the priority of rank of the
themes in the ideal situation was relations, work, thought,
and control. For the secondary school, the priority of rank
of the themes in the ideal mean was work, thought,
relations, and control. The only point of agreement between
the two schools existed in the ideal situation which ranked
the control theme as the least desired.
50
Organizational Climate Description Questionnaire (OCDQ)
The second set of data was collected using the
Organizational Climate Description Questionnaire. One form
of the questionnaire was developed for the elementary school
(Appendix 3) and one for the secondary school (Appendix 4).
The revised OCDQ, delineated for use in elementary
schools as OCDQ-RE and as OCDQ-RS for use in secondary
schools, was based on the original validated instrument by
Halpin and Croft in 1962. The development of the initial
instrument was prompted by four factors (Hoy, Tarter, &
Kottkamp, 1991): 1) schools differ markedly in their
"feel," 2) morale does not adequately capture this
difference in feel among schools, 3) talented principals
who take jobs in schools where improvement is necessary
often are immobilized by a recalcitrant faculty, and 4) the
notion of the "personality" of a school is intriguing in
itself.
OCDQ-RS.
The OCDQ instrument designed for use in secondary
schools utilized the research base that posited the
differences in elementary schools and secondary schools.
The development of the OCDQ for secondary schools went
through several phases: 1) generating new items, 2)
conducting a pilot study to reduce items and refine
subtests, 3) conducting a second study to test stability of
the factor structure, and 4) testing the reliability and
51
validity of the new instrument (Hoy, Tarter, & Kottkamp,
1991) .
The validation study of the OCDQ-RS was part of a
larger study undertaken by the Rutgers Research Group on
Organizational Behavior, in which nearly 5,000 teachers
participated. The OCDQ-RS was one of four questionnaires
distributed. Data were collected in faculty meetings and
usable responses were obtained for 90% of the respondents.
School mean scores were calculated for each of the 34
items, and the item-correlation matrix for the 78 schools
was factor analyzed. A five-factor solution with a varimax
rotation was performed. The results strongly supported the
factor structure revealed in the pilot study. The
reliability scores for the subtests remained high (Appendix
5) •
The OCDQ-RS is a 34-item climate instrument with five
dimensions describing the behavior of secondary teachers and
principals. It measures two aspects of principal
leadership--supportive and directive behavior. Three
dimensions of teacher behavior are described--engaged,
frustrated, and intimate. Each school can be described by
mapping its profile along the five dimensions.
The OCDQ-RS is a questionnaire on which educators are
asked to describe the extent to which specific behavior
patterns occur in the school. The responses vary along a
four point scale defined by the categories "rarely occurs,"
52
"sometimes occurs," "often occurs," and "very frequently
occurs."
OCDQ-RE.
The OCDQ-RE is a 42-item questionnaire. Teachers
describe their school behavior. They respond along a four-
point scale defined by the categories "rarely occurs,"
"sometimes occurs," "often occurs," and "very frequently
occurs."
The development of the new OCDQ-RE followed the same
phases as the OCDQ-RS. The 42 item questionnaire was tested
with a 70 school sample of elementary schools in New Jersey.
In total, 1071 educators responded to the OCDQ-RE.
School means were calculated for each item in the OCDQ-
RE, and the item-correlation matrix factor was analyzed.
The reliability scores for the subtests for the new data
remained high (Appendix 5).
In conclusion, all of the scales of the OCDQ-RE have
high reliability coefficients, much higher than those in the
original OCDQ. The unit of analysis in all phases of the
investigation was appropriately the school, not the
individual (Hoy, Tartar & Kottkamp, 1991).
Data collected using each of these data analysis tools
provided for a descriptive analysis of each school's
organization culture and climate. Emphasis was placed on
the identification of significant patterns and trends that
serve to describe the unique cultural and climate
53
characteristics of parochial schools. Although direct
comparisons between specific schools were not made, sample
schools were compared to the norm group for the OCDQ-RE.
Procedure
The random selection of schools utilized Table 33 of
Fisher and Yates, Statistical Tables for Biological,
Agricultural and Medical Research. The selection included
twenty Catholic elementary schools and twenty Catholic high
schools. The researcher sent a letter (Appendix 6) during
the month of September to the principal of the first ten
schools on each list to request permission to conduct the
study. The principals were sent a copy of the CVAT and the
OCDQ to examine. The principals also received a postcard on
which they were asked the number of questionnaires that were
needed to survey faculty members and administrators. The
postcard requested the verification of the number of years
the principal had served in that official capacity in that
school. The researcher removed from the study any school
whose principal had not served for at least two years at the
school. At the high school level, three of the initial ten
schools which were contacted could not participate for this
reason. In the next contact of schools, two more principals
had not served at least two years. Two principals wrote
letters of regret indicating that they would not participate
in the study. Two high schools returned surveys with a
54
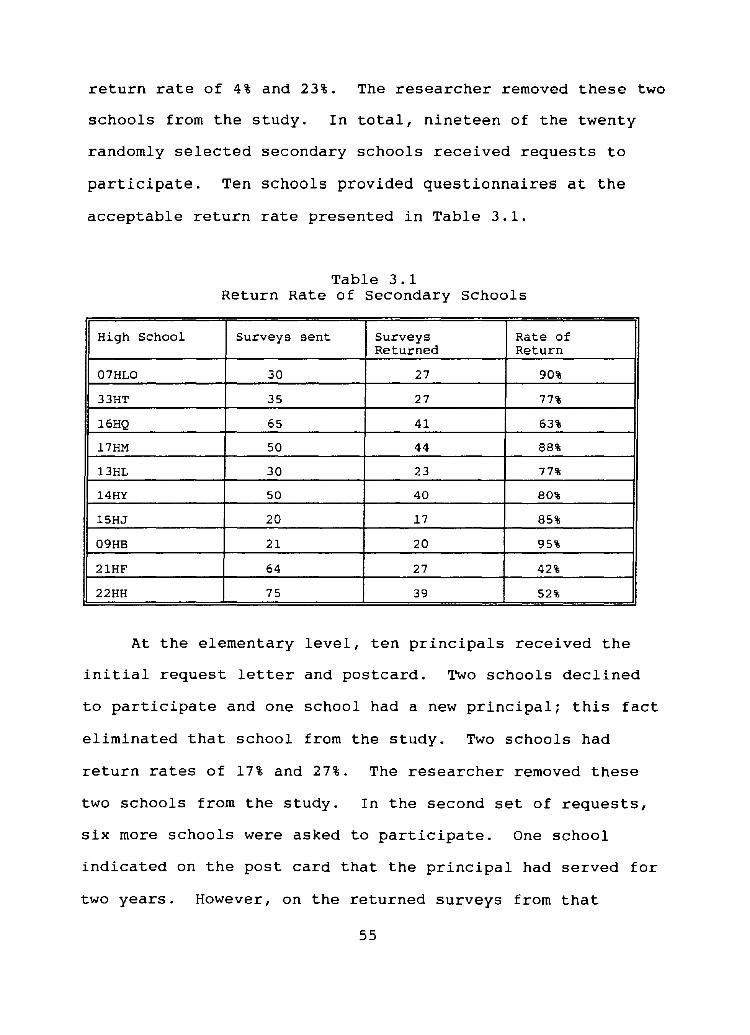
return rate of 4% and 23%. The researcher removed these two
schools from the study. In total, nineteen of the twenty
randomly selected secondary schools received requests to
participate. Ten schools provided questionnaires at the
acceptable return rate presented in Table 3.1.
Table 3.1 Return Rate of Secondary Schools
High School Surveys sent Surveys Rate of Returned Return
07HLO 30 27 90%
33HT 35 27 77%
16HQ 65 41 63%
17HM 50 44 88%
13HL 30 23 77%
14HY 50 40 80%
15HJ 20 17 85%
09H8 21 20 95%
21HF 64 27 42%
22HH 75 39 52%
At the elementary level, ten principals received the
initial request letter and postcard. Two schools declined
to participate and one school had a new principal; this fact
eliminated that school from the study. Two schools had
return rates of 17% and 27%. The researcher removed these
two schools from the study. In the second set of requests,
six more schools were asked to participate. One school
indicated on the post card that the principal had served for
two years. However, on the returned surveys from that
55
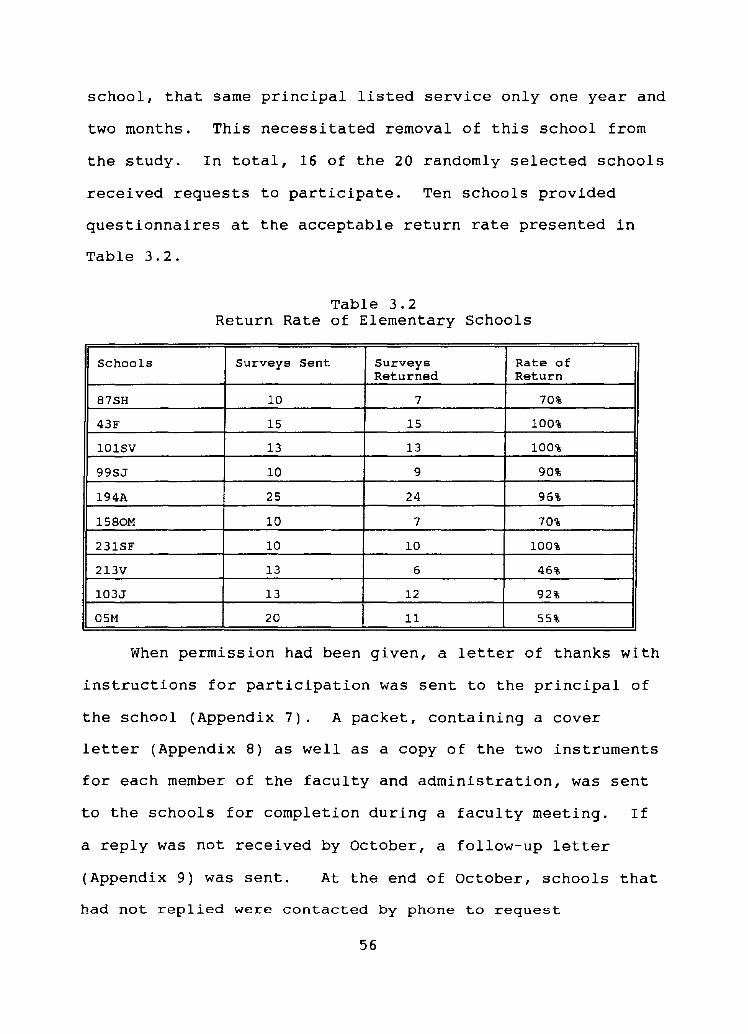
school, that same principal listed service only one year and
two months. This necessitated removal of this school from
the study. In total, 16 of the 20 randomly selected schools
received requests to participate. Ten schools provided
questionnaires at the acceptable return rate presented in
Table 3.2.
Table 3.2 Return Rate of Elementary Schools
Schools Surveys Sent Surveys Rate of Returned Return
87SH 10 7 70%
43F 15 15 100%
101SV 13 13 100%
99SJ 10 9 90%
194A 25 24 96%
1580M 10 7 70%
231SF 10 10 100%
213V 13 6 46%
103J 13 12 92%
05M 20 11 55%
When permission had been given, a letter of thanks with
instructions for participation was sent to the principal of
the school (Appendix 7). A packet, containing a cover
letter (Appendix 8) as well as a copy of the two instruments
for each member of the faculty and administration, was sent
to the schools for completion during a faculty meeting. If
a reply was not received by October, a follow-up letter
(Appendix 9) was sent. At the end of October, schools that
had not replied were contacted by phone to request
56
permission to conduct the survey. An acceptable rate of
return on a professional survey is eighty percent. The
researcher was sure that with the cooperation of the
principal at each school, the return rate of 80% or higher
would be achieved. A school remained in the study if the
return rate was 40% or above. Principals who had
incorporated the completion of the survey forms within a
faculty meeting or who had personally requested members of
the faculty to participate achieved a higher rate of return.
Principals who requested participation on a volunteer basis
returned survey forms that did not meet the acceptable rate
of return. If the participating schools did not have an
acceptable return rate, additional schools were contacted to
request participation in the study. Questionnaires filled
out incorrectly were removed from the study.
The questionnaires were color-coded for the elementary
schools and the secondary schools. The elementary schools
received the instructions, the CVAT, and the OCDQ-RE on pink
or salmon-colored paper. The secondary schools received the
instructions, the CVAT, and the OCDQ-RS on yellow paper.
The researcher could very easily separate the responses
according to elementary or secondary schools with this
system.
The study included appropriate measures to ensure
confidentiality for the participating schools. Results were
available to all participating schools. Each school was
57
given a code number for identification. Reports were made
to each participating school using the code numbers of the
other schools in the study. The cumulative results from the
study found in Chapter 4 were sent to every school. The
individual school's narrative, tables, and chart were sent
only to the school profiled. The measure of dimension was
the school. Individuals were not identified.
Data Analysis
The results from the questionnaires were analyzed using
the appropriate software designed for each instrument or the
standardized scores computed by Hoy, Tarter and Kottkamp
based on the average scores and standard deviations from
their research of schools in New Jersey. The research
questions which address the cultural values of parochial
schools were examined by using the CVAT.
The CVAT has software designed and available to analyze
the results. The CVAT software generated the mean and
standard deviation for each of the sixteen subdimensions.
The four dimensions were only measured through the
subdimensionsi therefore sixteen means and standard
deviations were generated for both the "descriptive" and
"normative" category. Nelson, who designed the software,
stated that in order to explore variation in values/culture
within the organization, the CVAT software contains a copy
of the CONCOR grouping algorithm based on the work by
58
Breiger, Boorman and Arabie in 1975. Variation in culture
could thus be determined in parochial elementary schools and
parochial secondary schools. A one-way analysis of variance
was conducted on the means of each of the sixteen cultural
dimensions to ascertain the cultural dimensions that were
significantly different at the .05 level between the
elementary and secondary schools. This comparison was
conducted to answer the third research question as it
pertains to the difference in cultural values of elementary
parochial schools and secondary parochial schools.
The general research questions focusing on the
organizational climate of parochial schools used the
standardized scores as developed by Hoy, Tarter and
Kottkamp. On the OCDQ, an ave~age school score for each
item was computed. There were six subtest scores that
represented the climate profile of the elementary school.
The climate dimensions of the OCDQ-RE are as follows:
supportive behavior, directive behavior, restrictive
behavior, collegial behavior, intimate behavior, and
disengaged behavior. These dimensions formed the basis for
determining the climate of an elementary school. The
climate was open, closed, engaged or disengaged. The
climate dimensions of the OCDQ-RS were as follows:
supportive behavior, directive behavior, engaged behavior,
frustrated behavior, and intimate behavior. These
dimensions identified the climate of a secondary school as
59
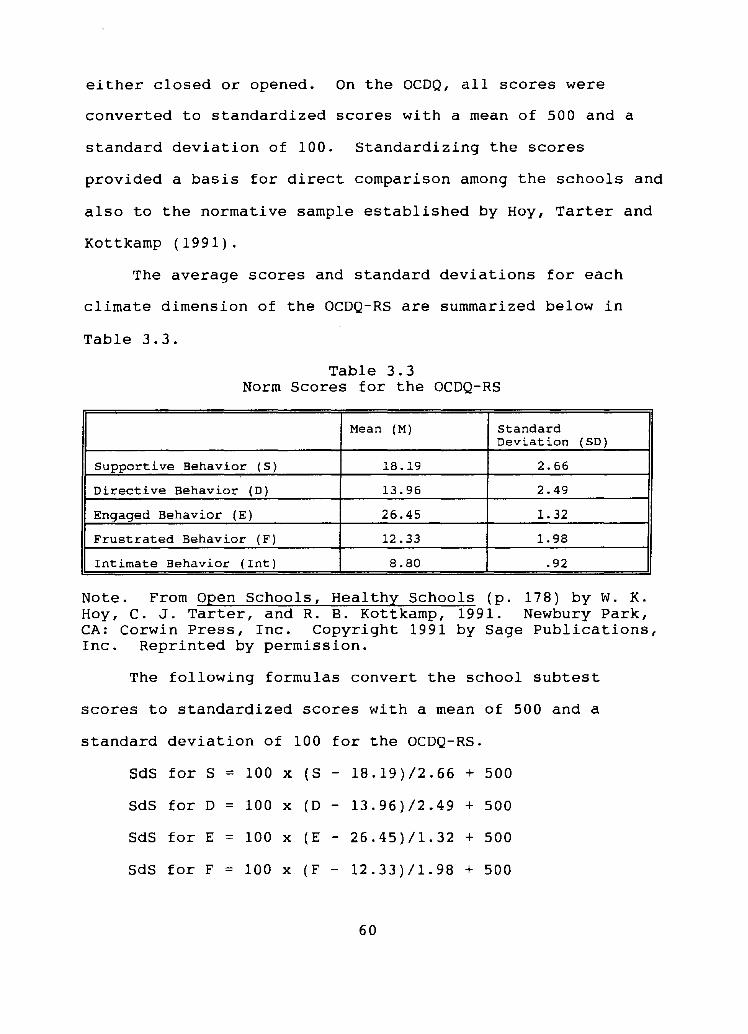
either closed or opened. On the OCDQ, all scores were
converted to standardized scores with a mean of 500 and a
standard deviation of 100. Standardizing the scores
provided a basis for direct comparison among the schools and
also to the normative sample established by Hoy, Tarter and
Kottkamp (1991).
The average scores and standard deviations for each
climate dimension of the OCDQ-RS are summarized below in
Table 3.3.
Table 3.3 Norm Scores for the OCDQ-RS
Mean (M) Standard Deviation (SO)
Supportive Behavior (S) 18.19 2.66
Directive Behavior (0 ) 13.96 2.49
Engaged Behavior (E) 26.45 1.32
Frustrated Behavior (F) 12.33 1.98
Intimate Behavior (Int) 8.80 .92
Note. From Open Schools, Healthy Schools (p. 178) by W. K. Hoy, C. J. Tarter, and R. B. Kottkamp, 1991. Newbury Park, CA: Corwin Press, Inc. Copyright 1991 by Sage Publications, Inc. Reprinted by permission.
The following formulas convert the school subtest
scores to standardized scores with a mean of 500 and a
standard deviation of 100 for the OCDQ-RS.
SdS for S = 100 x (S - 18.19)/2.66 + 500
SdS for D = 100 x (D - 13.96)/2.49 + 500
SdS for E 100 x (E - 26.45)/1.32 + 500
SdS for F 100 x (F 12.33)/1.98 + 500
60
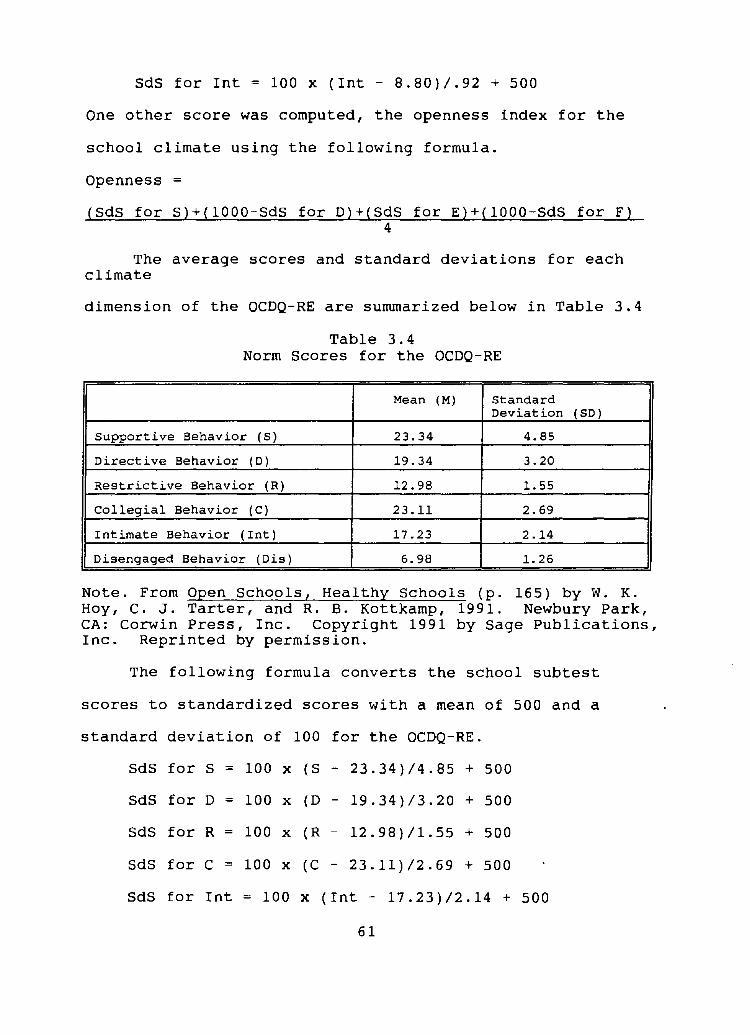
SdS for Int = 100 x (Int - 8.80)/.92 + 500
One other score was computed, the openness index for the
school climate using the following formula.
Openness
(SdS for S)+(1000-SdS for D)+(SdS for E)+(1000-SdS for F) 4
The average scores and standard deviations for each climate
dimension of the OCDQ-RE are summarized below in Table 3.4
Table 3.4 Norm Scores for the OCDQ-RE
Mean (M) Standard Deviation (SO)
Supportive Behavior (5 ) 23.34 4.85
Directive Behavior (0 ) 19.34 3.20
Restrictive Behavior (R) 12.98 1. 55
Collegial Behavior (C) 23.11 2.69
Intimate Behavior (Int) 17.23 2.14
Disengaged Behavior (Dis) 6.98 1.26
Note. From Open Schools, Healthy Schools (p. 165) by W. K. Hoy, C. J. Tarter, and R. B. Kottkamp, 1991. Newbury Park, CA: Corwin Press, Inc. Copyright 1991 by Sage Publications, Inc. Reprinted by permission.
The following formula converts the school subtest
scores to standardized scores with a mean of 500 and a
standard deviation of 100 for the OCDQ-RE.
SdS for S
SdS for D
SdS for R
SdS for C
100 x (S
100 x (D
100 x (R
100 x (C
23.34)/4.85 + 500
19.34)/3.20 + 500
12.98)/1.55 + 500
23.11)/2.69 + 500
SdS for Int = 100 x (Int - 17.23)/2.14 + 500
61
SdS for Dis = 100 x (Dis - 6.98)/1.26 + 500
Two other scores are computed, the principal openness
and the teacher openness using the following formulas.
Principal Openness = (SdS for S)+(1000-SdS for D)+(1000-SdS for R)
3
Teacher Openness
(SdS for C)+(SdS for Int)+(1000-SdS for Dis) 3
School scores were compared to the normative data
provided in the New Jersey sample (Hoy, Tarter, & Kottkamp,
1991). The range of these scores is presented below.
If the score is 200, it is lower that 99% of the
schools.
If the score is 300, it is lower than 97% of the
schools.
If the score is 400, it is lower than 84% of the
schools.
If the score is 500, it is average.
If the score is 600, it is higher than 84% of the
schools.
If the score is 700, it is higher than 97% of the
schools.
If the score is 800, it is higher than 99% of the
schools.
The openness index is interpreted in the same way as the
subtest scores.
62
The OCDQ-RE and OCDQ-RS scores were examined by using
the confidence interval at the 95% level of confidence.
Each of the subtest scores of the sample population was
compared to the normative population by using the means.
The sample means were calculated from each of the ten
elementary schools and each of the ten secondary schools.
The confidence level was calculated for each of the sample
means of the eleven behaviors and identified on the two
instruments. Three principals' behaviors are examined on
the OCDQ-RE and three teachers' behaviors are also examined.
On the OCDQ-RS, two principals' behaviors are examined and
three teachers' behaviors are examined. The confidence
intervals were compared to the means established by Hoy,
Tarter, and Kottkamp as reported in Tables 3.3 and 3.4. The
researcher rejected or accepted the null hypothesis based on
these calculations. The null hypothesis was stated for each
of the eleven behaviors that Mu was equal to the mean score
of the norm group for that behavior.
The third research question was examined in two ways.
Use of the CVAT instrument at both the secondary and
elementary level allowed the comparison of the mean scores
of the sixteen dimensions. A statistical comparison of the
cultural values of elementary and secondary schools was
conducted by use of a one-way analysis of variance to
identify those dimensions that were significantly different
at the .05 level. The climate characteristics were examined
63
descriptively. No statistical comparisons could be made as
the OCDQ-RE and the OCDQ-RS do not match in length nor
totally in items.
Summary
Chapter 3 described the research design and methodology
used in this study. The validated instruments of the CVAT
and OCDQ have been detailed. Twenty schools from the
accessible sample returned the completed questionnaires for
analysis. Chapter 4 focuses on the baseline data. The data
analysis provides the answers for the three basic research
questions and the eight subquestions that are the basis of
the study. This study provides the baseline data to
describe the organizational culture and climate in the
selected elementary and secondary parochial schools.
64
Chapter 4
Analysis of Results
Chapter 4 reports the results of the data collected to
conduct an analysis of the culture and climate of the
participating schools. Two questionnaires were selected as
data collection tools: the Cultural Value Analysis Tool
(CVAT) and the Organizational Climate Description
Questionnaire for elementary schools (OCDQ-RE) and for
secondary schools (OCDQ-RS).
In this chapter the researcher will examine the four
themes and sixteen dimensions of the CVAT to determine the
cultural values of the 20 parochial schools in the sample.
The data analysis will continue with the examination of the
climate characteristics as indicated by the responses on the
OCDQ. In each examination, data from secondary parochial
schools and elementary parochial schools will be presented
separately before the data from all 20 are presented. The
presentation will include tables as well as descriptive
material. The final presentation will compare the
differences and similarities of the cultural values and
climate characteristics of secondary parochial schools and
elementary parochial schools.
The software package designed for use with the CVAT was
developed by the survey's author, Reed Nelson. The program
is designed to compute the means and standard deviations for
both the real and ideal responses and to present a
65
comparison of the real and ideal means in the form of a
circular line graph. The "real" means indicate respondents'
perception of how the school is. The "ideal" means provide
perceptions about how each respondent would like the
respective school to be.
The researcher presented an individual school profile
to each of the participating schools. A sample of the
information that was provided is found in Appendix 10. CVAT
data for each school are presented in table and narrative
form. A circular line graph comparing the real and ideal
means for each school is found as part of the school
profile. The OCDQ scores were also presented as the mean
scores and standard scores for each subtest.
To include standard scores which was the proper
interpretation of the OCDQ scores, all scores needed to be
converted to standardized scores with a mean of 500 and a
standard deviation of 100. The scales for comparison were
developed from the current data base on secondary schools
drawn from the large, diverse sample of schools in New
Jersey. Hoy, Tarter, and Kottkamp (1991) established the
average scores and standard deviations for each climate
dimension.
The 24 tables presented in Chapter 4 summarize
information from the secondary and elementary parochial
schools and then compare the cultural value and
organizational climate similarities and differences. The
66
purpose of the study was to answer each of the following
research questions:
1. What are the cultural values of parochial schools?
1.1 How do parochial schools value the work-
related concepts of effort, time, finishing a
job, and work quality?
1.2 How do parochial schools value the human
relations concepts of affect, empathy,
sociability, and loyalty?
1.3 How do parochial schools value the leadership
concepts of dominance, status, political
action, and leadership style?
1.4 How do parochial schools value the learning
concepts of abstract thinking,
planning/organizing, exposition, and
flexibility?
2. What is the organizational climate of parochial
schools?
2.1 What are the engaging behavior characteristics
of parochial schools?
2.2 What are the disengaging behavior
characteristics of parochial schools?
2.3 To what degree do parochial schools exhibit
the characteristics of an open school
climate?
2.4 To what degree do parochial schools exhibit
67
the characteristics of a closed school
climate?
3. Do the cultural values and climate characteristics
of parochial elementary schools differ from those
of parochial secondary schools?
Data collected from the 20 sample parochial schools
provided information to answer the research questions. Each
question is examined at the secondary level and the
elementary level. Finally, each question is examined
combining the information of the 20 parochial schools.
Cultural Values
The first research question examined the cultural
values of parochial schools. The Cultural Value Analysis
Tool provided two measures for each school. The real mean
described how the members of the school perceived their
culture as existing. The second measure, the ideal mean,
described how the members of the school perceived the
culture to be in an ideal situation. The cultural values
will be examined first, analyzing the secondary schools as a
unit. The next step in the process will be to examine the
elementary schools as a unit. The final analysis will
describe the 20 schools in the sample that represent the
parochial schools in this study.
Secondary Schools - CVAT Themes
The priority of themes provided the information to
68
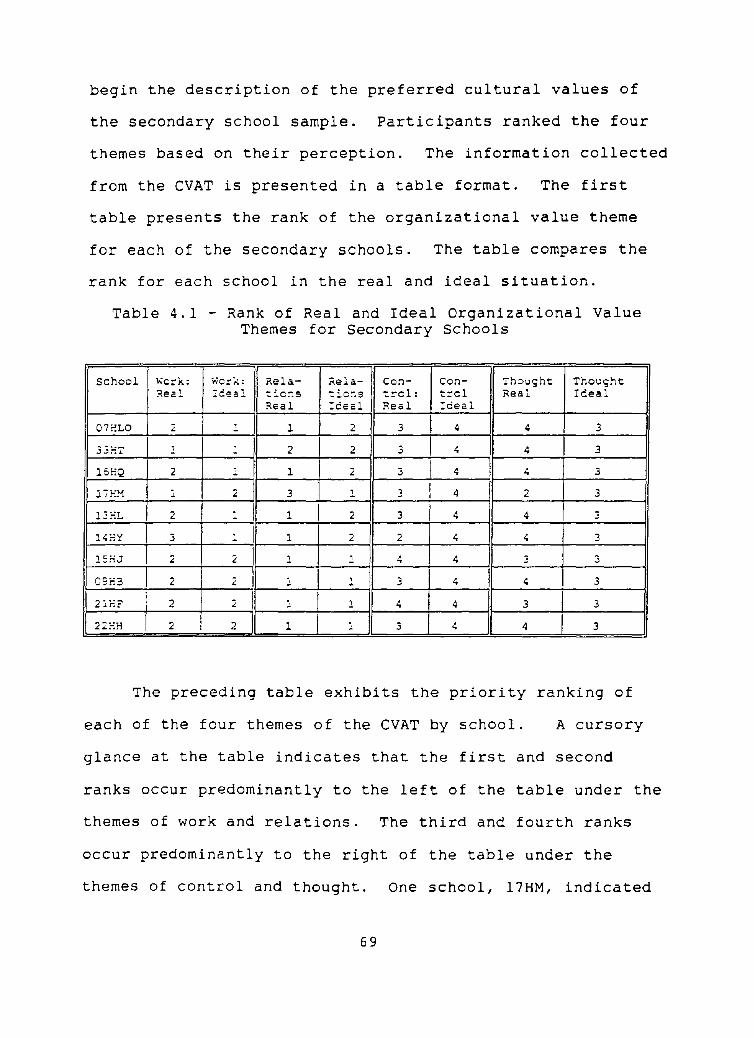
begin the description of the preferred cultural values of
the secondary school sample. Participants ranked the four
themes based on their perception. The information collected
from the CVAT is presented in a table format. The first
table presents the rank of the organizational value theme
for each of the secondary schools. The table compares the
rank for each school in the real and ideal situation.
Table 4.1 - Rank of Real and Ideal Organizational Value Themes for Secondary Schools
School ~c=k: wc=k: Rela- ;ela- Cc~- Ccn- Thought Thoucht Real Ieea: ~ic~s ~ic;.s ~rol: trcl Real Iceai
Real :eeal Real Ideal
07~LO 2 , I 1 2 3 I 4 4 3 -33HT , - 2 I 2 3 4 4 3
15HQ 2 , I 1 2 3 4 4 3 -liEM I 2 3 1 3 I 4 2 3
13HL 2 - I 1 I 2 3 4 4 3
14EY I 3 - I 1 2 2 4 4 3
15HJ 2 2 I 1 - 4 4 3 3
CSH3 2 2 1 1 3 4 4 3
2IEF 2 2 I 1 1 4 4 3 I 3
22EH 2 2 1 1 3 4 4 3
The preceding table exhibits the priority ranking of
each of the four themes of the CVAT by school. A cursory
glance at the table indicates that the first and second
ranks occur predominantly to the left of the table under the
themes of work and relations. The third and fourth ranks
occur predominantly to the right of the table under the
themes of control and thought. One school, 17HM, indicated
69
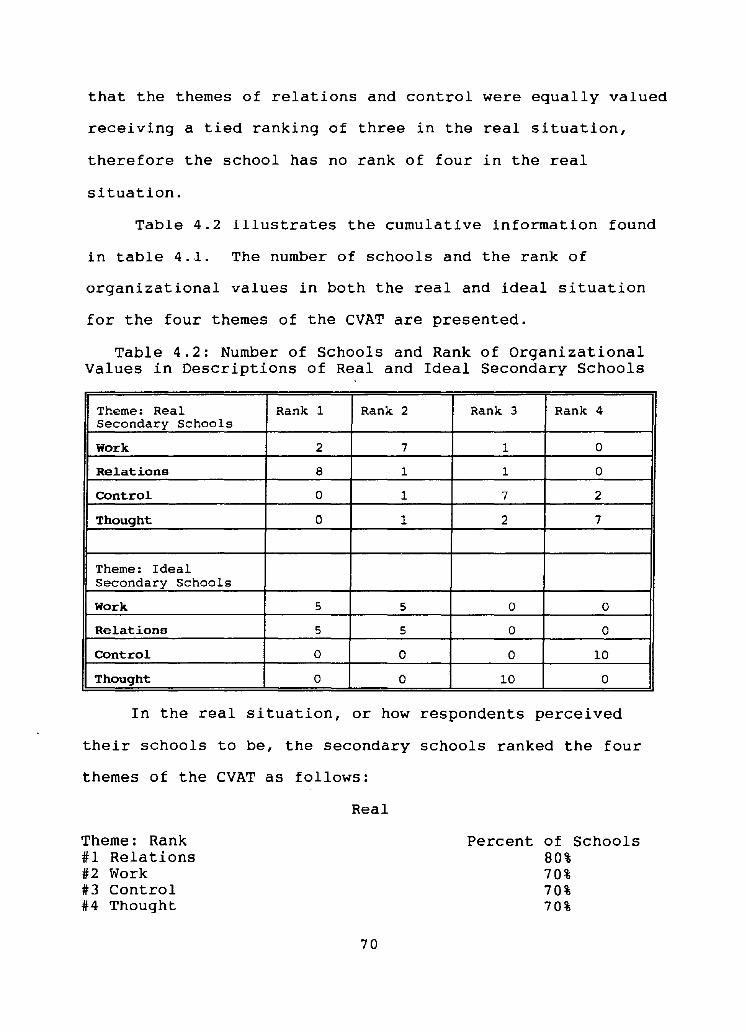
that the themes of relations and control were equally valued
receiving a tied ranking of three in the real situation,
therefore the school has no rank of four in the real
situation.
Table 4.2 illustrates the cumulative information found
in table 4.1. The number of schools and the rank of
organizational values in both the real and ideal situation
for the four themes of the CVAT are presented.
Table 4.2: Number of Schools and Rank of Organizational Values in Descriptions of Real and Ideal Secondary Schools
Theme: Real Rank 1 Rank 2 Rank 3 Rank 4 Secondary Schools
Work 2 7 1 0
Relations 8 1 1 0
Control 0 1 7 2
Thought 0 1 2 7
Theme: Ideal Secondary Schools
Work 5 5 0 0
Relations 5 5 0 0
Control 0 0 0 10
Thought 0 0 10 0
In the real situation, or how respondents perceived
their schools to be, the secondary schools ranked the four
themes of the CVAT as follows:
Theme: Rank #1 Relations #2 Work #3 Control #4 Thought
Real
70
Percent of Schools 80% 70% 70% 70%
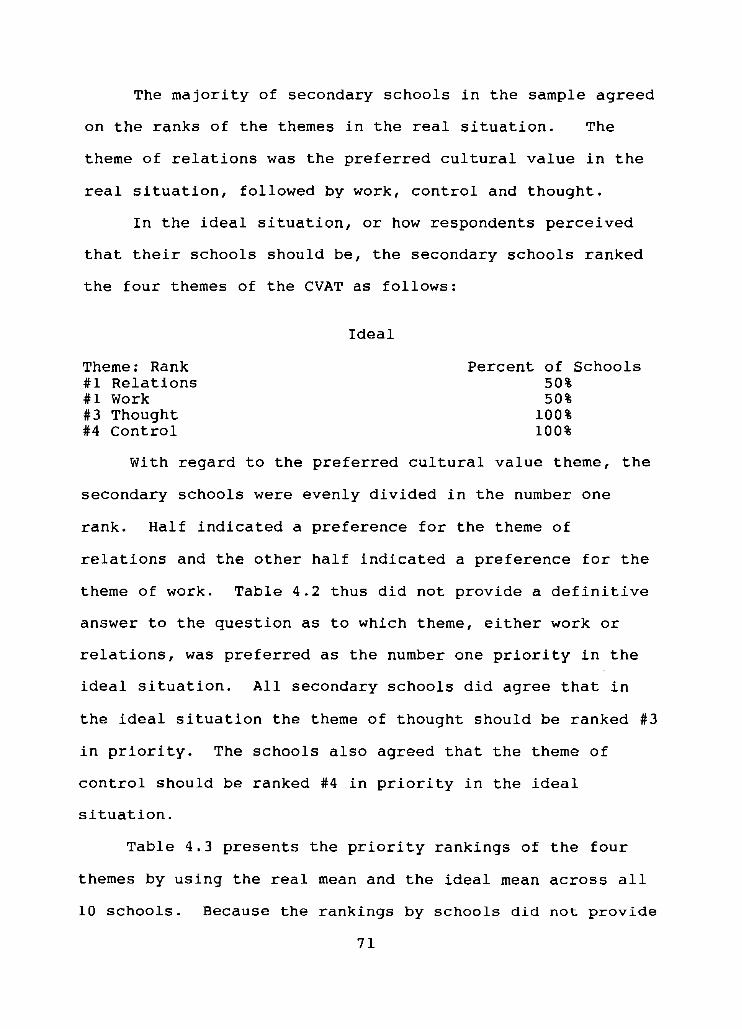
The majority of secondary schools in the sample agreed
on the ranks of the themes in the real situation. The
theme of relations was the preferred cultural value in the
real situation, followed by work, control and thought.
In the ideal situation, or how respondents perceived
that their schools should be, the secondary schools ranked
the four themes of the CVAT as follows:
Theme: Rank #1 Relations #1 Work #3 Thought #4 Control
Ideal
Percent of Schools 50% 50%
100% 100%
With regard to the preferred cultural value theme, the
secondary schools were evenly divided in the number one
rank. Half indicated a preference for the theme of
relations and the other half indicated a preference for the
theme of work. Table 4.2 thus did not provide a definitive
answer to the question as to which theme, either work or
relations, was preferred as the number one priority in the
ideal situation. All secondary schools did agree that in
the ideal situation the theme of thought should be ranked #3
in priority. The schools also agreed that the theme of
control should be ranked #4 in priority in the ideal
situation.
Table 4.3 presents the priority rankings of the four
themes by using the real mean and the ideal mean across all
10 schools. Because the rankings by schools did not provide
71
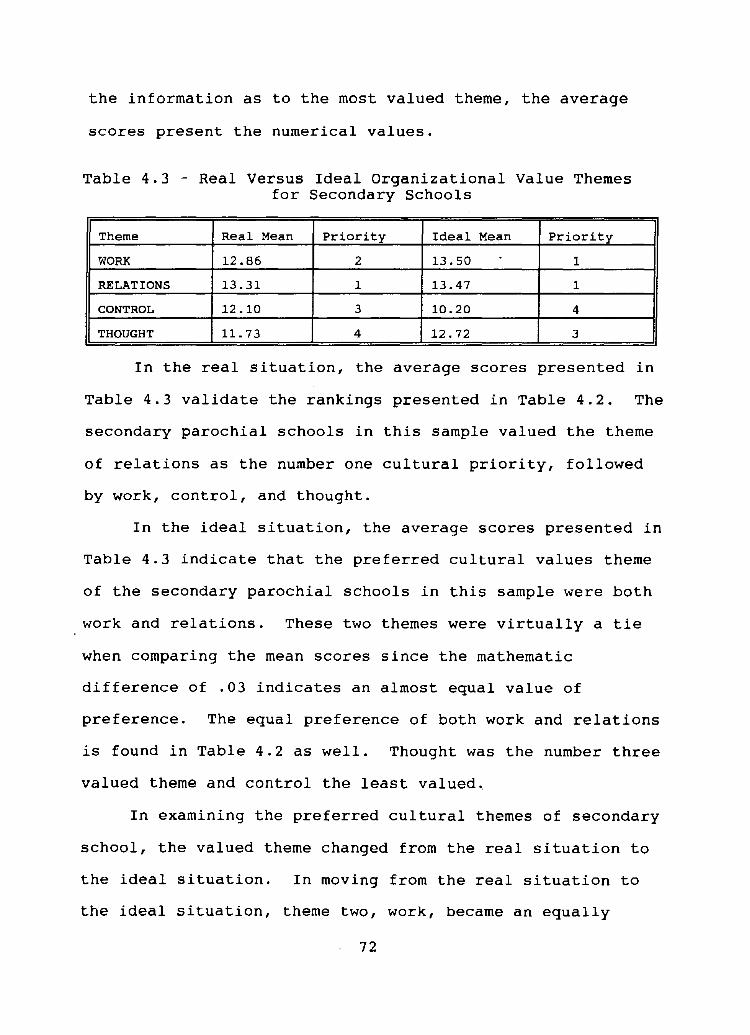
the information as to the most valued theme, the average
scores present the numerical values.
Table 4.3 - Real Versus Ideal Organizational Value Themes for Secondary Schools
Theme Real Mean Priority Ideal Mean Priority
WORK 12.86 2 13.50 - 1
RELATIONS 13.31 1 13.47 1
CONTROL 12.10 3 10.20 4
THOUGHT 11.73 4 12.72 3
In the real situation, the average scores presented in
Table 4.3 validate the rankings presented in Table 4.2. The
secondary parochial schools in this sample valued the theme
of relations as the number one cultural priority, followed
by work, control, and thought.
In the ideal Situation, the average scores presented in
Table 4.3 indicate that the preferred cultural values theme
of the secondary parochial schools in this sample were both
work and relations. These two themes were virtually a tie
when comparing the mean scores since the mathematic
difference of .03 indicates an almost equal value of
preference. The equal preference of both work and relations
is found in Table 4.2 as well. Thought was the number three
valued theme and control the least valued~
In examining the preferred cultural themes of secondary
school, the valued theme changed from the real situation to
the ideal situation. In moving from the real situation to
the ideal Situation, theme two, work, became an equally
72
valued theme with theme one, relations. The order of
preference for themes three and four was reversed in the
ideal condition.
Secondary Schools - CVAT Dimensions
Within each of the four themes, four dimensions
represent each of the themes for a total of sixteen
dimensions. The information presented in Table 4.4 displays
each dimension, the real mean and the ideal mean for the
secondary schools.
73
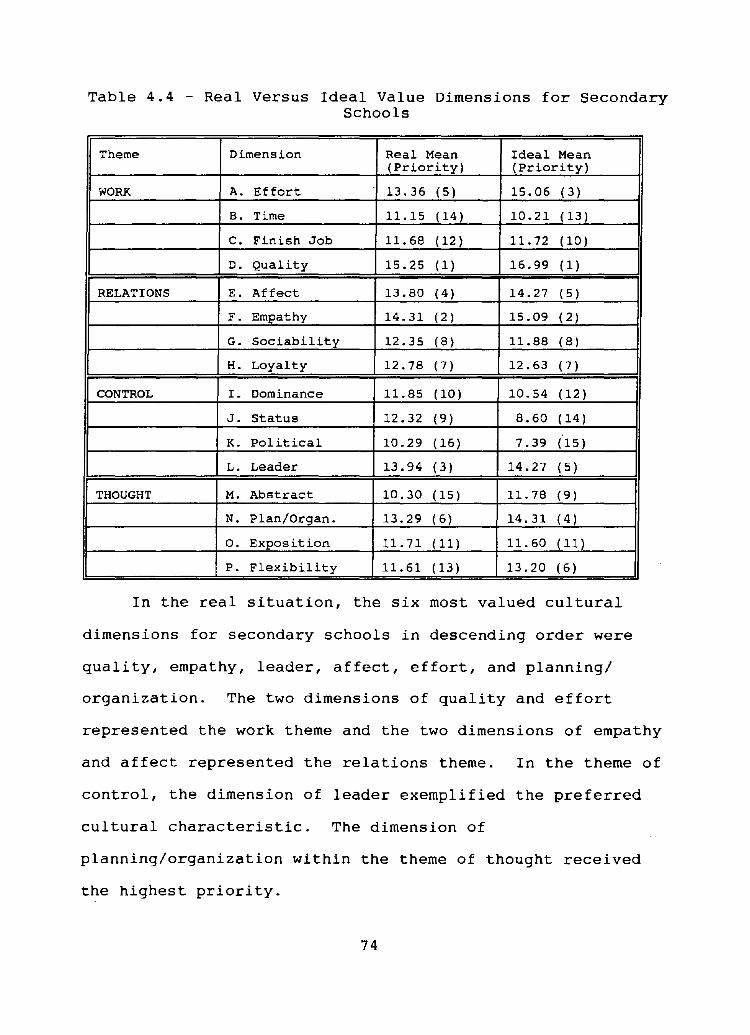
Table 4.4 - Real Versus Ideal Value Dimensions for Secondary Schools
Theme Dimension Real Mean Ideal Mean (Priority) (Priority)
WORK A. Effort 13.36 ( 5 ) 15.06 (3 )
B. Time 11.15 (14) 10.21 (13)
C. Finish Job 11. 68 (12) 11. 72 (10)
D. Quality 15.25 (1) 16.99 ( 1)
RELATIONS E. Affect 13.80 (4 ) 14.27 (5 )
F. Empathy 14.31 (2 ) 15.09 (2 )
G. Sociability 12.35 (8 ) 11.88 (8 )
H. Loyalty 12.78 (7) 12.63 ( 7 )
CONTROL I. Dominance 11.85 (10) 10.54 (12)
J. Status 12.32 (9 ) 8.60 (14)
K. Political 10.29 (16) 7.39 (15)
L. Leader 13.94 (3 ) 14.27 ( 5)
THOUGHT M. Abstract 10.30 (15) 11. 78 (9 )
N. Plan/Organ. 13.29 (6 ) 14.31 (4 )
o. Exposition 11. 71 ( 11) 11. 60 ( 11)
P. Flexibility 11. 61 (13) 13.20 (6 )
In the real situation, the six most valued cultural
dimensions for secondary schools in descending order were
quality, empathy, leader, affect, effort, and planning/
organization. The two dimensions of quality and effort
represented the work theme and the two dimensions of empathy
and affect represented the relations theme. In the theme of
control, the dimension of leader exemplified the preferred
cultural characteristic. The dimension of
planning/organization within the theme of thought received
the highest priority.
74
In the ideal situation, the six most valued cultural
dimensions for secondary schools in descending order were
quality, empathy, effort, planning/organization, and affect
and leader tied for fifth. In the ideal situation the same
six cultural dimensions remained the most highly valued.
The two most highly preferred cultural values signified by
the dimensions quality and empathy retained the same
priority of one and two. The dimension of flexibility
exhibited the greatest change in priority from the real
situation to the ideal situation moving from the rank of
thirteen to the rank of six.
The respondents in this sample valued the same six
cultural dimensions in the real situation and the ideal
situation. As noted, these six cultural dimensions did not
retain the same order of priority within the six most highly
valued.
One important fact to note is the similarity of ranking
within the theme of relations in the real mean and the ideal
mean in the table. Three of the four dimensions have the
same ranking: empathy, sociability, and loyalty. This theme
exhibited the most stablity within the dimensions.
Secondary Schools - CVAT - Analysis of Variance
To determine the cultural values most preferred by the
respondents of the secondary schools in the sample, data
were compiled two ways. First, the number of schools that
ranked each theme in each position was counted. Second, the
75
average of the scores for all schools on each theme was used
to determine the priority given to each theme across all
schools. Since the CVAT questionnaire requested information
on both the real situation and the ideal situation, a one-
way analysis of variance was conducted to compare the real
mean and the ideal mean of the 16 cultural dimensions in the
secondary schools. The test was conducted to check whether
the real means differed from the ideal means. The ANOVA was
conducted at the .05 level of confidence for each of the
sixteen cultural dimensions. Table 4.5 presents the F-ratio
and probability when comparing the real mean scores and the
ideal mean scores of each of the sixteen cultural dimensions
at the secondary school level.
76
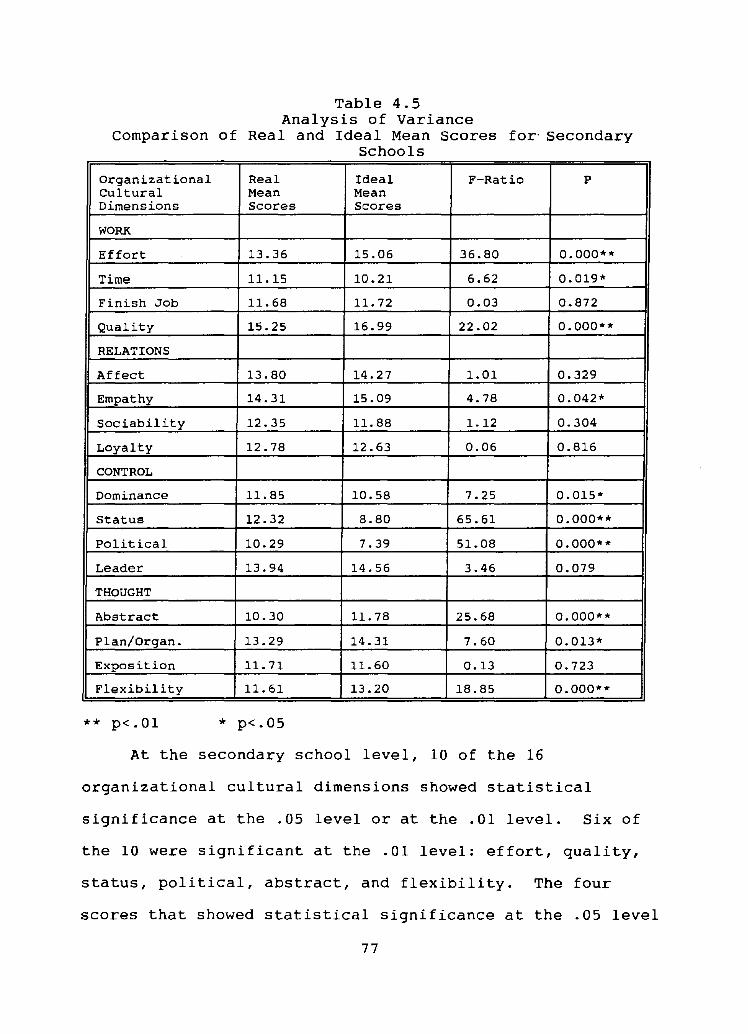
Table 4.5 Analysis of Variance
Comparison of Real and Ideal Mean Scores for- Secondary Schools
Organizational Real Ideal F-Ratio P Cultural Mean Mean Dimensions Scores Scores
WORK
Effort 13.36 15.06 36.80 0.000**
Time 11.15 10.21 6.62 0.019*
Finish Job 11. 68 11. 72 0.03 0.872
Quality 15.25 16.99 22.02 0.000**
RELATIONS
Affect 13.80 14.27 1.01 0.329
Empathy 14.31 15.09 4.78 0.042*
Sociability 12.35 11. 88 1.12 0.304
Loyalty 12.78 12.63 0.06 0.816
CONTROL
Dominance 11.85 10.58 7.25 0.015*
Status 12.32 8.80 65.61 0.000**
Political 10.29 7.39 51.08 0.000**
Leader 13.94 14.56 3.46 0.079
THOUGHT
Abstract 10.30 11. 78 25.68 0.000**
Plan/Organ. 13.29 14.31 7.60 0.013*
Exposition 11. 71 11.60 0.13 0.723
Flexibility 11. 61 13.20 18.85 0.000**
** p<.01 * p<.Os
At the secondary school level, 10 of the 16
organizational cultural dimensions showed statistical
significance at the .05 level or at the .01 level. Six of
the 10 were significant at the .01 level: effort, quality,
status, political, abstract, and flexibility. The four
scores that showed statistical significance at the .05 level
77
were time, empathy, dominance, and planning/organization.
Three dimensions in three themes showed statistical
significance. Only one dimension, empathy, reflected the
statistical significance in the relations theme. The
respondents in the secondary schools valued different
dimensions in the ideal situation than in the real
situation.
Secondary parochial schools, then, based on the
information provided by the AN OVA , were about where they
would like to be in terms of the relations theme. The
other three themes do not indicate the same perception.
Summary of Secondary CVAT Results
In summary, when the researcher considered the
secondary parochial schools in the sample, the respondents
indicated that in the real situation--or how the schools
are--the most valued cultural theme was relations. With
regard to the ideal situation-- or how the school should be-
-the respondents indicated that the most valued cultural
theme was a tie between both work and relations.
Secondary parochial schools valued the work-related
dimension of quality as the number one priority in both the
real and ideal situations. Secondary parochial schools
valued the dimension of empathy as the second priority in
both the real and ideal situations. Secondary parochial
schools valued the dimension of leader and the dimension of
planning/organization in the themes of control and thought,
78
in the real and ideal situations respectively, with a slight
shift in priority of these two dimensions.
The responses to dimensions related to relations were
stable for the real and ideal conditions. In 10 of 16
dimensions, respondents said that they would like to see
changes in the culture of these parochial secondary schools.
Three dimensions within each of the remaining three themes
would be changed.
Elementary Schools - CVAT Themes
What are the cultural values of parochial elementary
schools? The series of four tables which follow reflect the
information provided by the 10 elementary schools in the
sample. The same format as was used to present the
information on the secondary parochial schools is employed.
The rank of the cultural themes by each individual
elementary school will be examined first. These ranks will
then be compiled and exhibited in the second table
presented. The average scores of the combined real means of
each school and the average scores of the combined ideal
means of each school will be presented to verify the
priority of the cultural themes. The last table will
present the 16 cultural dimensions.
Table 4.6 presents each school's rank of the cultural
themes in both the real and ideal situations.
79
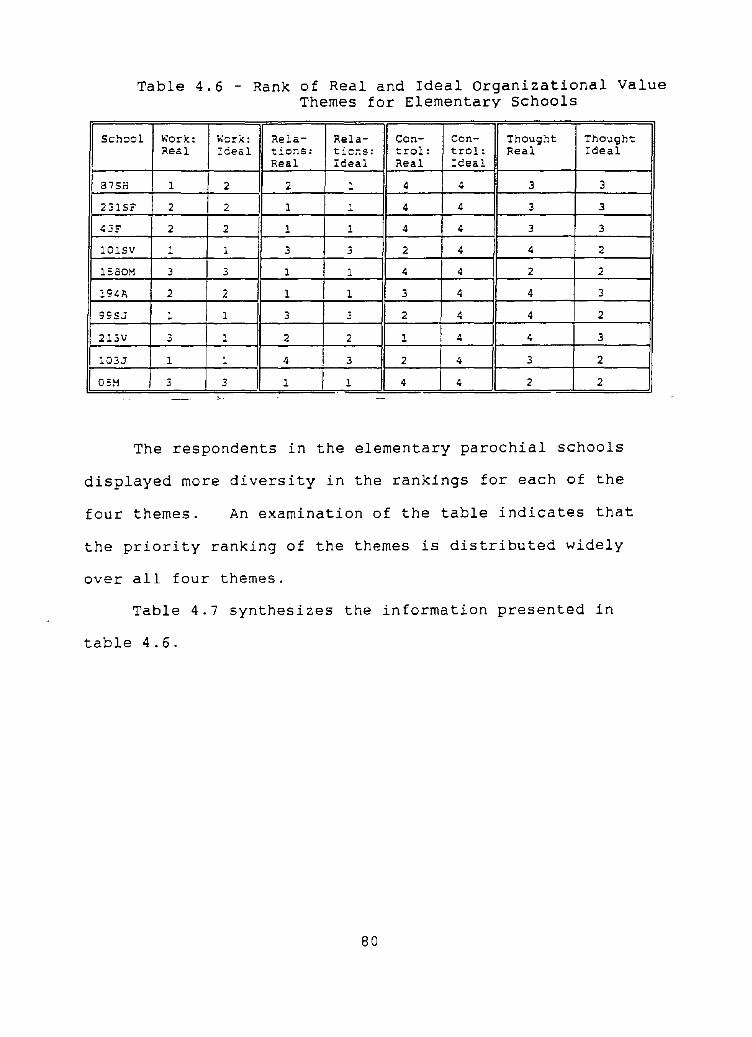
Table 4.6 - Rank of Real and Ideal Organizational Value Themes for Elementary Schools
School Work: ... ork: Rela- Rela- Con- Con- Thought Thought Real Ideal tions: tio~s : trol: trol: Real Ideal
Real Ideal Real Ideal
87SH 1 2 2 :. 4 4 3 3
231SF 2 2 1 1 4 4 3 3
~~ .. 2 2 1 1 4 4 3 3
101SV 1 1 3 3 2 4 4 2
15801'1 3 3 1 1 4 4 2 2
194A 2 2 1 1 3 4 4 3
99SJ 1 1 3 "' 2 4 4 I 2
213V 3 :. 2 2 1 4 4 3
:'03J 1 1 4 I 3 2 4 3 2
051'1 3 3 I 1 I 1 4 4 2 2 - , --
The respondents in the elementary parochial schools
displayed more diversity in the rankings for each of the
four themes. An examination of the table indicates that
the priority ranking of the themes is distributed widely
over all four themes.
Table 4.7 synthesizes the information presented in
table 4.6.
80
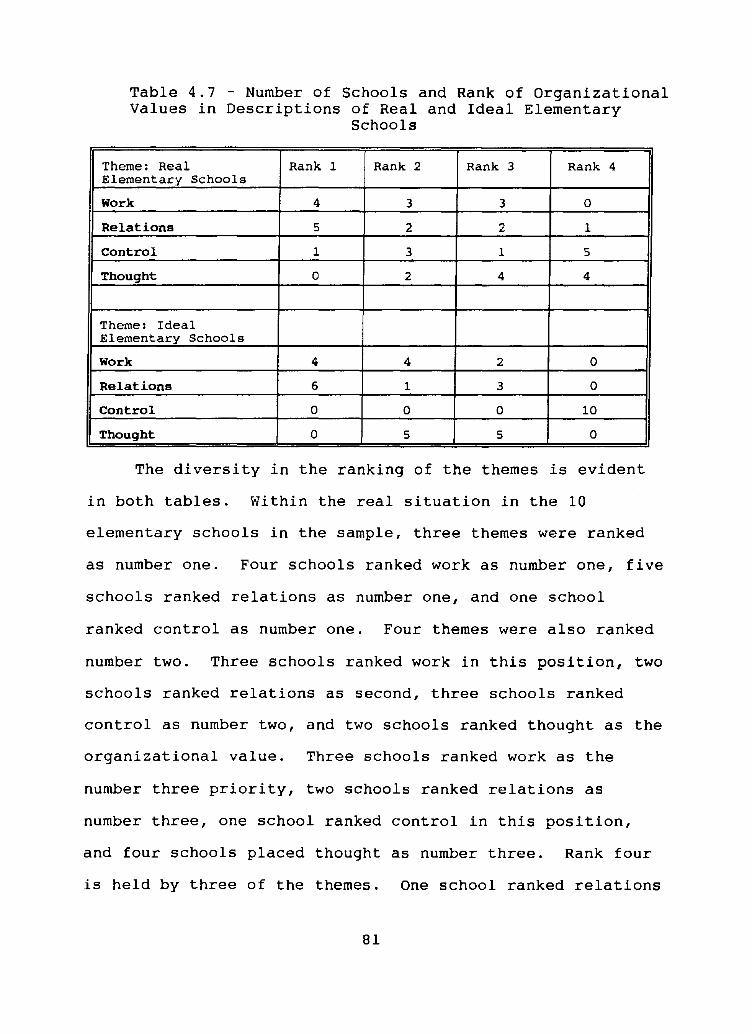
Table 4.7 - Number of Schools and Rank of Organizational Values in Descriptions of Real and Ideal Elementary
Schools
Theme: Real Rank 1 Rank 2 Rank 3 Rank 4 Elementary Schools
Work 4 3 3 0
Relations 5 2 2 1
Control 1 3 1 5
Thought 0 2 4 4
Theme: Ideal Elementary Schools
Work 4 4 2 0
Relations 6 1 3 0
Control 0 0 0 10
Thought 0 5 5 0
The diversity in the ranking of the themes is evident
in both tables. Within the real situation in the 10
elementary schools in the sample, three themes were ranked
as number one. Four schools ranked work as number one, five
schools ranked relations as number one, and one school
ranked control as number one. Four themes were also ranked
number two. Three schools ranked work in this position, two
schools ranked relations as second, three schools ranked
control as number two, and two schools ranked thought as the
organizational value. Three schools ranked work as the
number three priority, two schools ranked relations as
number three, one school ranked control in this position,
and four schools placed thought as number three. Rank four
is held by three of the themes. One school ranked relations
81
as number four, five schools ranked control in the fourth
place, and four 'schools ranked thought as the last
organizational value preferred in the school.
In the ideal condition, less diversification emerged.
Four schools ranked work as the number one theme whereas six
schools ranked relations as the top priority. In rank two,
four schools ranked work in this position, one school placed
relations as the number two rank, and five schools ranked
thought as number two. Three themes were ranked in the
number three position. Two schools ranked work as number
three, three schools ranked relations in this position, and
five schools placed thought as the third rank. All
respondents agreed that in the ideal situation, the theme of
control was the fourth or last desired organizational value
in the school.
The preferred cultural theme of the elementary schools
remained unclear from the ranks by school. The real mean of
all 10 elementary schools presented a more definitive answer
as to the ranking in the real situation. The ideal means of
all 10 elementary schools were also calculated to obtain the
priority ranking by cultural theme. Table 4.8 examines the
priority of each of the themes based on the calculated
means.
82
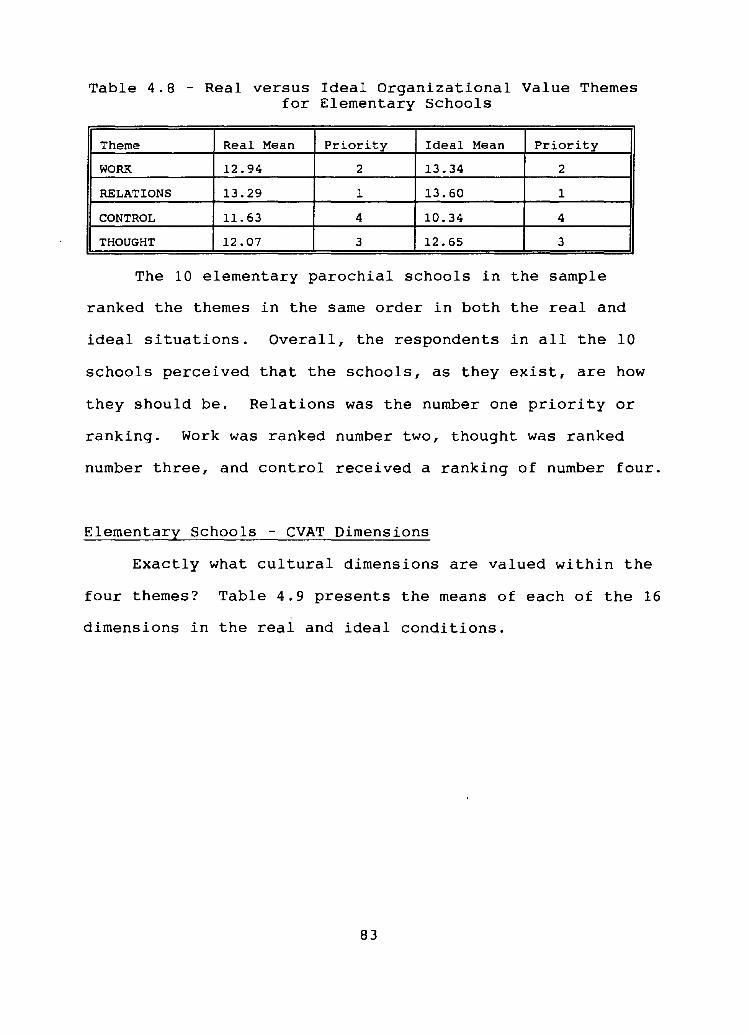
Table 4.8 - Real versus Ideal Organizational Value Themes for Elementary Schools
Theme Real Mean Priority Ideal Mean Priority
WORK 12.94 2 13.34 2
RELATIONS 13.29 1 13.60 1
CONTROL 11.63 4 10.34 4
THOUGHT 12.07 3 12.65 3
The 10 elementary parochial schools in the sample
ranked the themes in the same order in both the real and
ideal situations. Overall, the respondents in all the 10
schools perceived that the schools, as they exist, are how
they should be. Relations was the number one priority or
ranking. Work was ranked number two, thought was ranked
number three, and control received a ranking of number four.
Elementary Schools - CVAT Dimensions
Exactly what cultural dimensions are valued within the
four themes? Table 4.9 presents the means of each of the 16
dimensions in the real and ideal conditions.
83
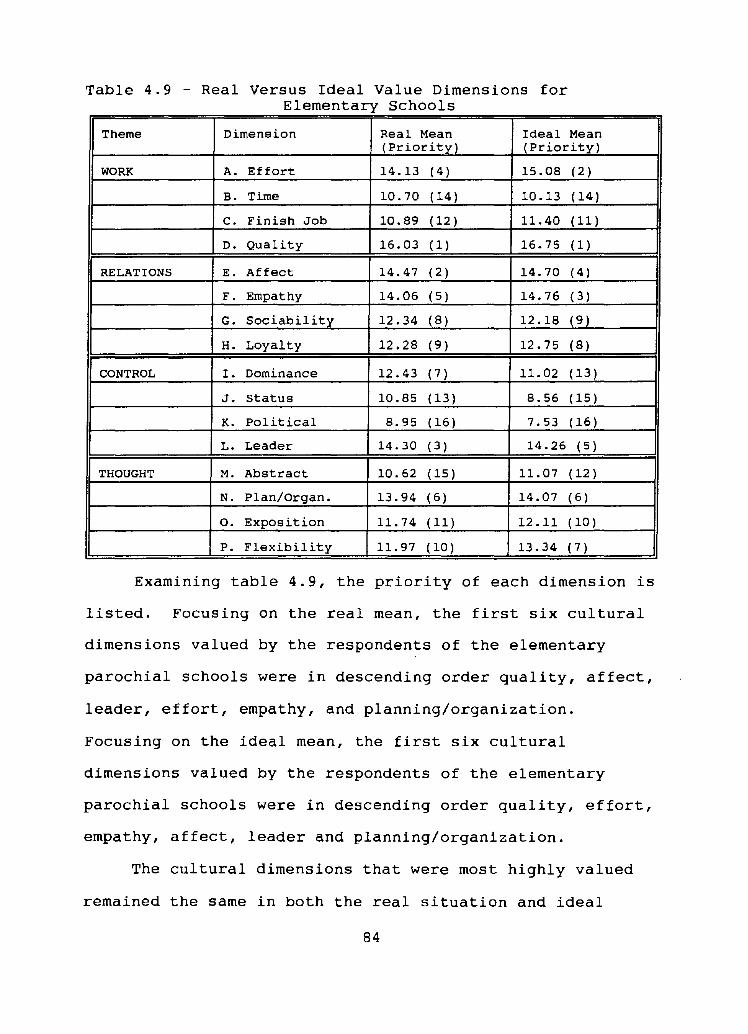
Table 4.9 - Real Versus Ideal Value Dimensions for Elementary Schools
Theme Dimension Real Mean Ideal Mean (Priority) (Priority)
WORK A. Effort 14.13 (4 ) 15.08 (2 )
B. Time 10.70 (14) 10.13 (14)
c. Finish Job 10.89 (12) 11.40 (11 )
D. Quality 16.03 (1 ) 16.75 ( 1)
RELATIONS E. Affect 14.47 (2 ) 14.70 (4)
F. Empathy 14.06 (5 ) 14.76 (3 )
G. Sociability 12.34 (8) 12.18 (9 )
H. Loyalty 12.28 (9 ) 12.75 (8)
CONTROL I. Dominance 12.43 (7) 11.02 (13 )
J. Status 10.85 (13) 8.56 (15)
K. Political 8.95 (16) 7.53 (16)
L. Leader 14.30 (3) 14.26 (5 )
THOUGHT M. Abstract 10.62 (15) 11.07 (12)
N. Plan/Organ. 13.94 (6 ) 14.07 (6 )
o. Exposition 11. 74 ( 11) 12.11 (10)
P. Flexibility 11.97 (10) 13.34 (7)
Examining table 4.9, the priority of each dimension is
listed. Focusing on the real mean, the first six cultural
dimensions valued by the respondents of the elementary
parochial schools were in descending order quality, affect,
leader, effort, empathy, and planning/organization.
Focusing on the ideal mean, the first six cultural
dimensions valued by the respondents of the elementary
parochial schools were in descending order quality, effort,
empathy, affect, leader and planning/organization.
The cultural dimensions that were most highly valued
remained the same in both the real situation and ideal
84
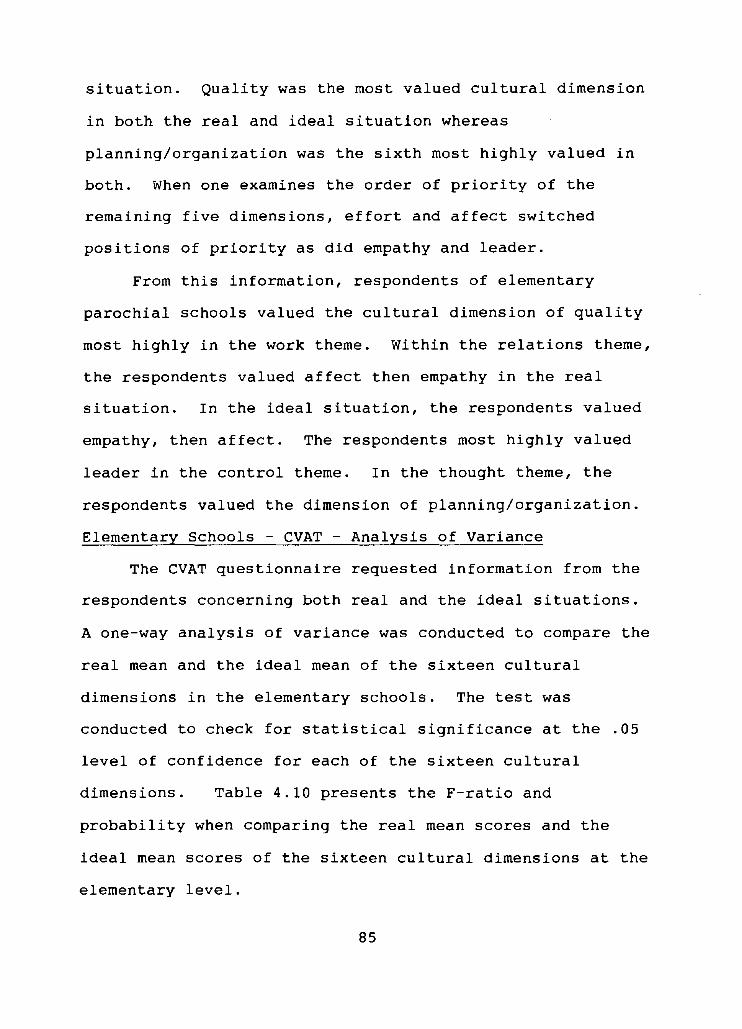
situation. Quality was the most valued cultural dimension
in both the real and ideal situation whereas
planning/organization was the sixth most highly valued in
both. When one examines the order of priority of the
remaining five dimensions, effort and affect switched
positions of priority as did empathy and leader.
From this information, respondents of elementary
parochial schools valued the cultural dimension of quality
most highly in the work theme. Within the relations theme,
the respondents valued affect then empathy in the real
situation. In the ideal situation, the respondents valued
empathy, then affect. The respondents most highly valued
leader in the control theme. In the thought theme, the
respondents valued the dimension of planning/organization.
Elementary Schools - CVAT - Analysis of Variance
The CVAT questionnaire requested information from the
respondents concerning both real and the ideal situations.
A one-way analysis of variance was conducted to compare the
real mean and the ideal mean of the sixteen cultural
dimensions in the elementary schools. The test was
conducted to check for statistical significance at the .05
level of confidence for each of the sixteen cultural
dimensions. Table 4.10 presents the F-ratio and
probability when comparing the real mean scores and the
ideal mean scores of the sixteen cultural dimensions at the
elementary level.
85
Table 4.10 Analysis of Variance
Comparison of Real and Ideal Mean Scores for Elementary Schools
Organizational Real Ideal F-Ratio P Cultural Mean Mean Dimensions Scores Scores
WORK
Effort 14.13 15.08 6.15 0.023*
Time 10.70 10.13 1.34 0.261
Finish Job 10.89 11.40 1.44 0.246
Quality 16.03 16.75 2.04 0.170
RELATIONS
Affect 14.47 14.70 0.13 0.725
Empathy 14.28 15.09 1.34 0.262
Sociability 12.34 12.18 0.07 0.793
Loyalty 12.38 12.75 0.30 0.591
CONTROL
Dominance 12.43 11.02 2.47 0.133
Status 10.85 8.56 5.96 0.025*
Political 8.95 7.53 3.02 0.100
Leader 14.30 14.26 0.01 0.938
THOUGHT
Abstract 10.62 11.07 0.98 0.335
Plan/Organ. 13.94 14.07 0.09 0.774
Exposition 11. 74 12.11 0.54 0.472
Flexibility 11. 97 13.34 6.22 0.023*
*p< .05
In the elementary schools, three organizational
cultural dimensions were statistically significant at the
.05 level. In the work theme, a significant change was
desired in the dimension of effort. The dimension of status
in the control theme was statistically significant,
86
indicating that the respondents would change the emphasis in
the ideal situation from what does exist in the real
situation. The dimension of flexibility in the thought
theme was also statistically significant. The elementary
schools would place more value on flexibility in the ideal.
Summary of Elementary CVAT Results
In summary, the individual elementary schools Showed
greater diversity in the ranking of the themes when compiled
individually. When considered as an entity, the elementary
parochial school respondents indicated that in the real
situation--or how the schools are--the most valued cultural
theme was relations, followed by work, thought, and control.
In the ideal situation--or how the school should be--the
respondents indicated that the most valued cultural theme
continued to be relations, followed by work, thought, and
control. For the elementary schools, the respondents
indicated the exact same order of valued cultural themes in
both real and ideal situations.
Respondents in elementary parochial schools valued
the work- related dimension of quality as the number one
priority in both the real situation and the ideal situation.
They valued the dimension of affect as the second priority
in the real situation but valued the dimension of effort in
the ideal situation.
Examination of the most valued dimension in each theme
in the real situation indicated that quality was most valued
87
in the work theme. In the relations theme, affect was most
valued. Within the control theme, leader was valued.
Planning/organization represented the dimension most valued
in the thought theme. Variation within the themes for the
most valued dimension did not change for the ideal situation
in the themes of work, control or thought. In the relations
theme, empathy was the dimension most valued in the ideal
situation.
The analysis of variance reflected three dimensions
that were significant at the .05 level: effort, status, and
flexibility. The theme of relations exhibited no
significant difference in any of the four dimensions when
conducting the analysis of variance.
Twenty Parochial Schools - CVAT Themes
To answer the question "What are the cultural values of
parochial schools?" the secondary school information and the
elementary school information was combined to include the 20
schools in the sample. Table 4.11 displays the number of
schools and rank of organizational values in the themes of
the real and ideal.
88
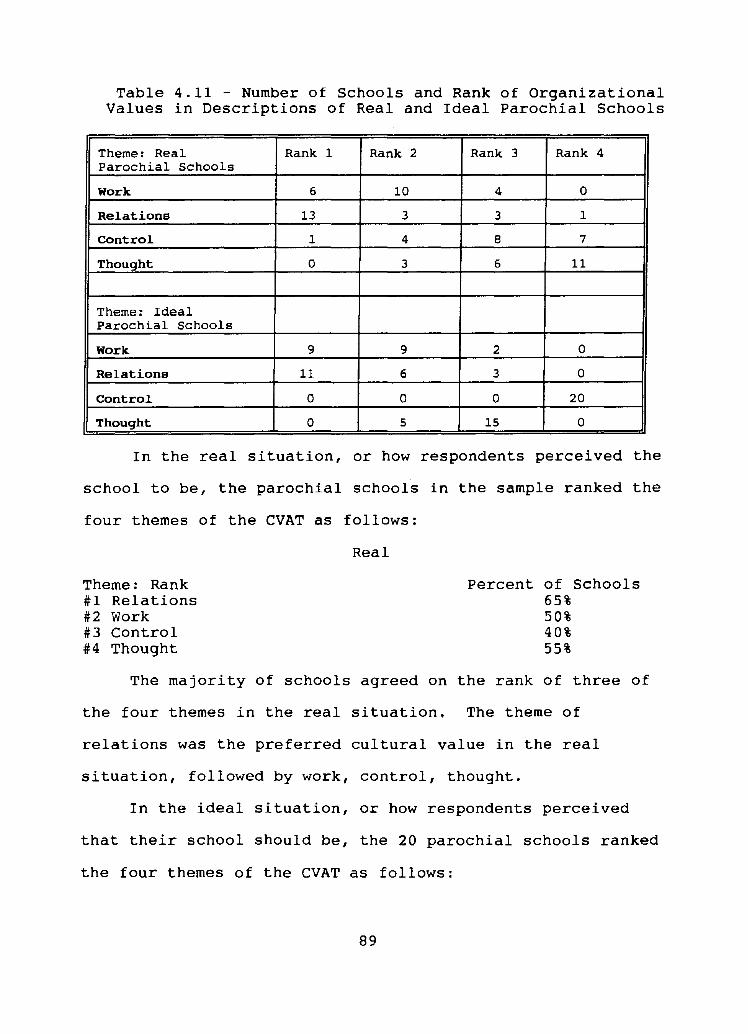
Table 4.11 - Number of Schools and Rank of Organizational Values in Descriptions of Real and Ideal Parochial Schools
Theme: Real Rank 1 Rank 2 Rank 3 Rank 4 Parochial Schools
Work 6 10 4 0
Relations 13 3 3 1
Control 1 4 8 7
Thought 0 3 6 11
Theme: Ideal Parochial Schools
Work 9 9 2 0
Relations 11 6 3 0
Control 0 0 0 20
Thought 0 5 15 0
In the real situation, or how respondents perceived the
school to be, the parochial schools in the sample ranked the
four themes of the CVAT as follows:
Theme: Rank #1 Relations #2 Work #3 Control #4 Thought
Real
Percent of Schools 65% 50% 40% 55%
The majority of schools agreed on the rank of three of
the four themes in the real situation. The theme of
relations was the preferred cultural value in the real
situation, followed by work, control, thought.
In the ideal situation, or how respondents perceived
that their school should be, the 20 parochial schools ranked
the four themes of the CVAT as follows:
89
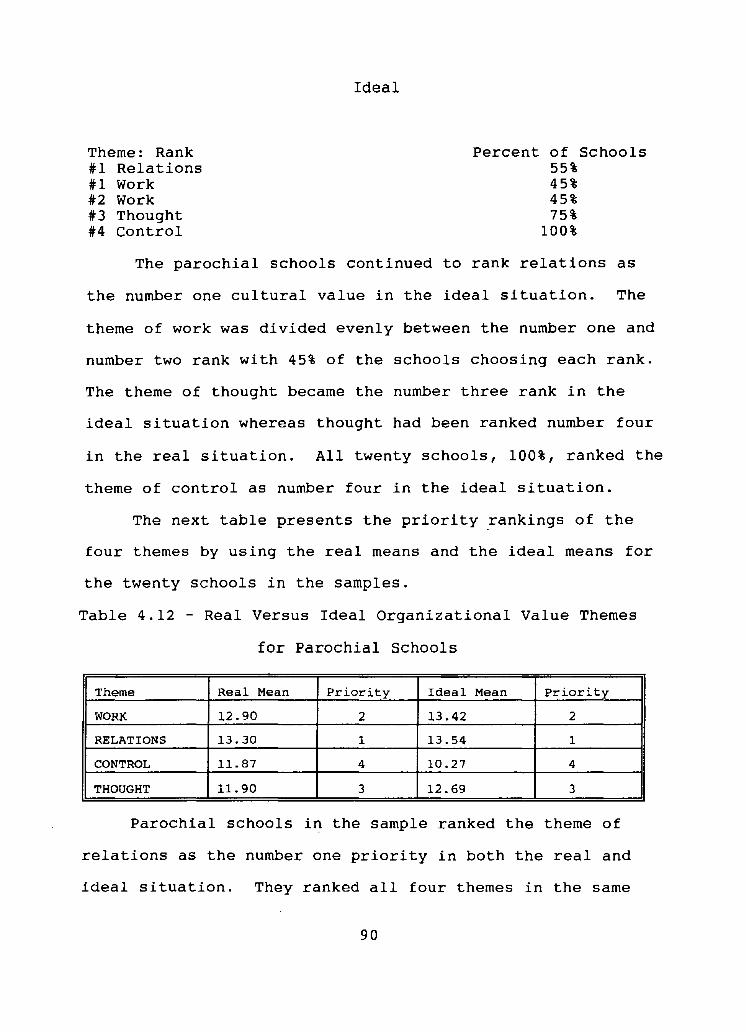
Theme: Rank #1 Relations #1 Work #2 Work #3 Thought #4 Control
Ideal
Percent of Schools 55% 45% 45% 75%
100%
The parochial schools continued to rank relations as
the number one cultural value in the ideal situation. The
theme of work was divided evenly between the number one and
number two rank with 45% of the schools choosing each rank.
The theme of thought became the number three rank in the
ideal situation whereas thought had been ranked number four
in the real situation. All twenty schools, 100%, ranked the
theme of control as number four in the ideal situation.
The next table presents the priority _rankings of the
four themes by using the real means and the ideal means for
the twenty schools in the samples.
Table 4.12 - Real Versus Ideal Organizational Value Themes
for Parochial Schools
Theme Real Mean Priority Ideal Mean Priority
WORK 12.90 2 13.42 2
RELATIONS 13.30 1 13.54 1
CONTROL 11.87 4 10.27 4
THOUGHT 11.90 3 12.69 3
Parochial schools in the sample ranked the theme of
relations as the number one priority in both the real and
ideal situation. They ranked all four themes in the same
90
order in both the real and ideal situation. The rankings of
the secondary schools found in Table 4.3 only agree in three
of the eight rankings, that is, the theme of relations as
number one, and the theme of work as number two, in the real
situation. In the ideal situation, relations and work are
equally valued as the number one priority.
Twenty Parochial Schools - CVAT Dimensions
Within each of the four themes, four dimensions
represent each theme for a total of 16 dimensions. The
information presented in Table 4.13 displays each dimension,
the real mean, and the ideal mean for the 20 parochial
schools.
91
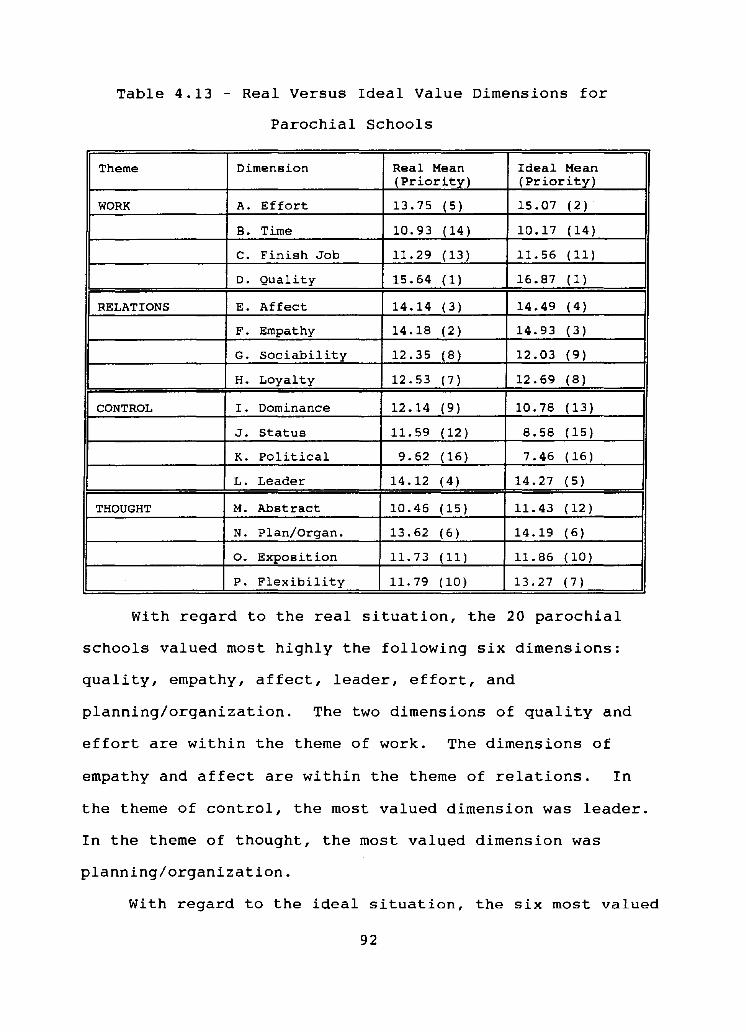
Table 4.13 - Real Versus Ideal Value Dimensions for
Parochial Schools
Theme Dimension Real Mean Ideal Mean (Priority) (Priority)
WORK A. Effort 13.75 ( 5 ) 15.07 (2)
B. Time 10.93 (14) 10.17 (14)
C. Finish Job 11.29 (13 ) 11. 56 (11 )
D. Quality 15.64 (1 ) 16.87 ( 1)
RELATIONS E. Affect 14.14 (3 ) 14.49 (4 )
F. Empathy 14.18 (2) 14.93 (3 )
G. Sociability 12.35 (8 ) 12.03 (9)
H. Loyalty 12.53 (7) 12.69 (8)
CONTROL I. Dominance 12.14 (9 ) 10.78 (13 )
J. Status 11.59 (12) 8.58 (15)
K. Political 9.62 (16) 7.46 (16)
L. Leader 14.12 (4 ) 14.27 (5 )
THOUGHT M. Abstract 10.46 (15) 11.43 (12)
N. Plan/Organ. 13.62 (6) 14.19 (6 )
o. Exposition 11. 73 ( 11) 11.86 (10)
P. Flexibility 11. 79 (10) 13.27 (7 )
With regard to the real situation, the 20 parochial
schools valued most highly the following six dimensions:
quality, empathy, affect, leader, effort, and
planning/organization. The two dimensions of quality and
effort are within the theme of work. The dimensions of
empathy and affect are within the theme of relations. In
the theme of control, the most valued dimension was leader.
In the theme of thought, the most valued dimension was
planning/organization.
With regard to the ideal situation, the six most valued
92
cultural dimensions for the 20 parochial schools included
quality, effort, empathy, affect, leader, and
planning/organization. Again, the two dimensions of
quality and effort are within the theme of work. The
dimensions of empathy and affect are within the theme of
relations. The most valued dimension in the theme of
control was leader. The most valued dimension in the theme
of thought was planning/organization.
In the real and ideal situations the same six
dimensions were most valued by the respondents of the CVAT.
The most valued dimension--quality--and the sixth-valued
dimension--planning/organization--maintained the same
priority in both the real and ideal situation. The
dimensions of effort, empathy, affect, and leader, though
still valued in both situations, were valued in a different
priority.
Summary of Parochial Schools CVAT Results
In response to the first research question, "What are
the cultural values of parochial schools?," the respondents
indicated that the theme of relations was most valued in
both the real and ideal situation. The priority of order
for the value of the themes remained the same in both the
real and ideal situation. The respondents chose relations,
work, thought and control as the priority order of value.
When examining the sub-heading, which focused on how
parochial schools value the work dimensions, the respondents
93
indicated that quality and effort were highly valued. The
finish job and time themes were ranked in the lower quarter
of priority.
The second sub-heading asked how parochial schools
value the human relations dimensions. Empathy and affect
emerged as the most highly valued dimensions in this theme.
Loyalty and sociability remained in the upper half of valued
characteristics.
The third sub-heading questioned how parochial schools
value with regard to the control dimensions. The
respondents valued the dimension of leader. The other
three dimensions in the theme of control--dominance, status,
and political--were ranked in the lower half, with status
and political ranked in the lower quarter.
In the last sub-heading, which examined the learning or
thought dimensions, the respondents valued
planning/organization most highly. They prioritized
exposition and flexibility in the third quarter. Abstract
was least highly valued in the thought theme.
School Climate
The second research question examined the
organizational climate of parochial schools, with the
Organization Climate Description Questionnaire serving as
the data collection tool. In this section, the secondary
schools will be examined first. The next step in the
process will be to examine the elementary parochial schools
94
as a unit. The final analysis will describe the 20 schools
in the sample that represent the parochial schools in this
study.
Secondary Schools - OCDQ-RS
The respondents in the secondary parochial schools
were asked to describe how often specific behavior patterns
occurred in their respective schools. These 34 respondents
to the questionnaire provided the data base to examine the
climate of the secondary schools. Hoy, Tarter, and Kottkamp
(1991) state that, on the secondary level, the
organizational climate of a school can be open or closed.
An open school would be indicated by a standard score of
500. Any schools one standard deviation greater with a
score of 600 represents a highly open climate. Table 4.14
summarizes the standard scores and climate description for
the 10 secondary schools in the study.
95
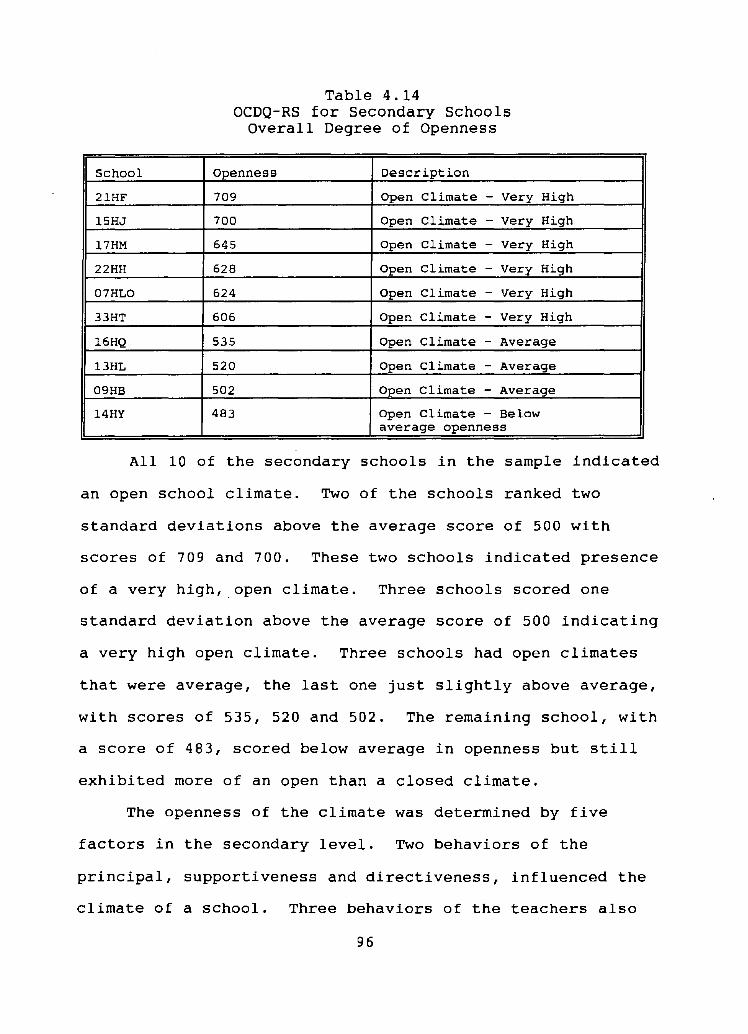
School
2lHF
l5HJ
l7HM
22HH
07HLO
33HT
16HQ
13HL
09HB
14HY
Table 4.14 OCDQ-RS for Secondary Schools
Overall Degree of Openness
Openness Description
709 Open Climate - Very High
700 Open Climate - Very High
645 Open Climate - Very High
628 Open Climate - Very High
624 Open Climate - Very High
606 Open Climate - Very High
535 Open Climate - Average
520 Open Climate - Average
502 Open Climate - Average
483 Open Climate - Below average openness
All 10 of the secondary schools in the sample indicated
an open school climate. Two of the schools ranked two
standard deviations above the average score of 500 with
scores of 709 and 700. These two schools indicated presence
of a very high,open climate. Three schools scored one
standard deviation above the average score of 500 indicating
a very high open climate. Three schools had open climates
that were average, the last one just slightly above average,
with scores of 535, 520 and 502. The remaining school, with
a score of 483, scored below average in openness but still
exhibited more of an open than a closed climate.
The openness of the climate was determined by five
factors in the secondary level. Two behaviors of the
principal, supportiveness and directiveness, influenced the
climate of a school. Three behaviors of the teachers also
96
influenced the climate of the school. Teacher behaviors
included engagement, frustration, and intimacy. Hoy,
Tarter, and Kottkamp (1991) stated that supportive principal
behavior is characterized by motivational techniques that
include constructive criticism and modeling by example.
According to them, such a principal is also helpful and
genuinely concerned with the professional and personal well
being of the faculty members. The principal promotes both
the social needs and the task achievement of the faculty.
Engaged teacher behavior was noted by high faculty
morale, with teachers who enjoyed working with one another
and who were supportive of their colleagues. Such teachers
were committed to the success of their students. Attributes
of this commitment include friendliness, trust, and optimism
that students can and will achieve.
According to Hoy, Tarter, and Kottkamp (1991),
interference from both administration and colleagues
frustrates teachers and interrupts the teaching/learning
process. Routine duties, administrative paperwork, and
assigned non-teaching duties are negative factors. Teachers
may grate on one another's nerves by interrupting one
another and serving as irritants. These behaviors were
included under the heading of frustrated teacher behaviors.
Intimate teacher behaviors are visible in the strong
social relationships of the faculty. Teachers know each
other well, socialize together, and in some cases are close
97
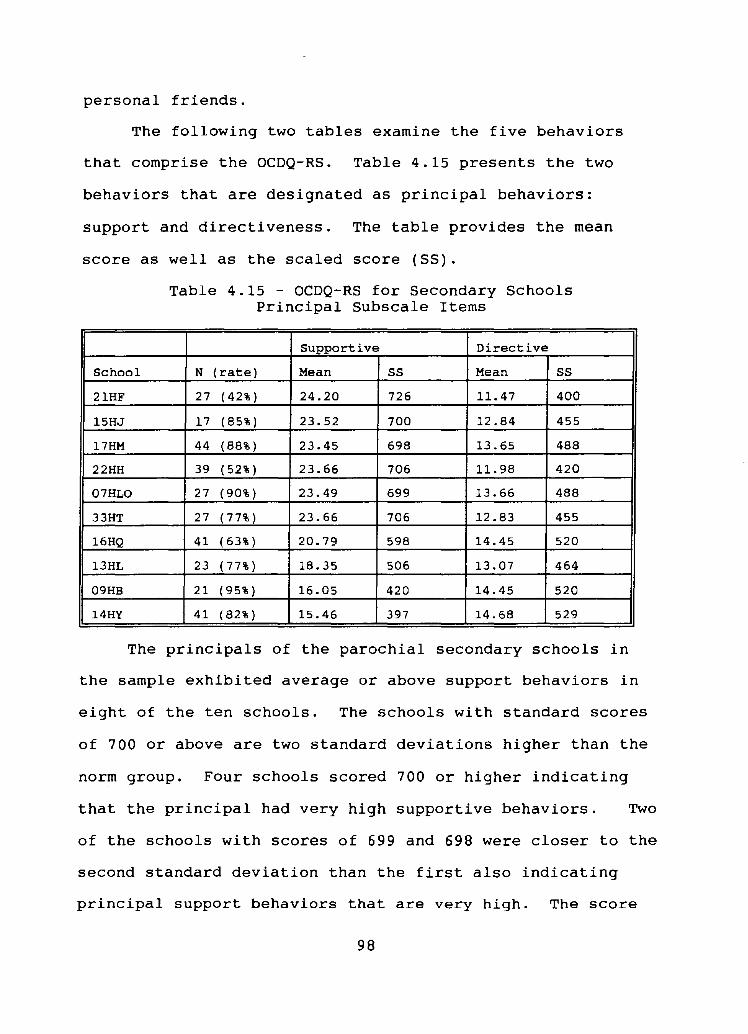
personal friends.
The following two tables examine the five behaviors
that comprise the OCDQ-RS. Table 4.15 presents the two
behaviors that are designated as principal behaviors:
support and directiveness. The table provides the mean
score as well as the scaled score (SS).
School
21HF
15HJ
17HM
22HH
07HLO
33HT
16HQ
13HL
09HB
14HY
Table 4.15 - OCDQ-RS for Secondary Schools Principal Subscale Items
Supportive Directive
N (rate) Mean SS Mean SS
27 (42%) 24.20 726 11.47 400
17 (85%) 23.52 700 12.84 455
44 (88%) 23.45 698 13.65 488
39 (52%) 23.66 706 11.98 420
27 (90%) 23.49 699 13.66 488
27 (77%) 23.66 706 12.83 455
41 (63%) 20.79 598 14.45 520
23 (77%) 18.35 506 13.07 464
21 (95%) 16.05 420 14.45 520
41 (82%) 15.46 397 14.68 529
The principals of the parochial secondary schools in
the sample exhibited average or above support behaviors in
eight of the ten schools. The schools with standard scores
of 700 or above are two standard deviations higher than the
norm group. Four schools scored 700 or higher indicating
that the principal had very high supportive behaviors. Two
of the schools with scores of 699 and 698 were closer to the
second standard deviation than the first also indicating
principal support behaviors that are very high. The score
98
of 598 was almost one standard deviation from the standard
score indicating high principal support behaviors. One
school with at score of 506 had average support behavior of
the principal. The remaining two schools exhibited
supportive behaviors of the principal that were below
average.
The directive behaviors of the principals in the
secondary schools were average or a little below average in
directiveness. The scores did not exhibit the range that
was exhibited in the support behavior. The one score of 400
was one standard deviation below the average. The remaining
scores ranged from 420 to 529, clustering around the average
score of 500.
From the results of the OCDQ-RS, principals exhibited
the engaging behavior of support to a high degree. The
principals in the secondary schools demonstrated the
disengaging behavior of directiveness to an average degree.
Table 4.16 presents the three behaviors of the faculty
that provide the basis for determining the climate of the
school. These behaviors include engagement, frustration,
and intimacy. The table provides the mean score and the
standard score for each behavior for each school.
99
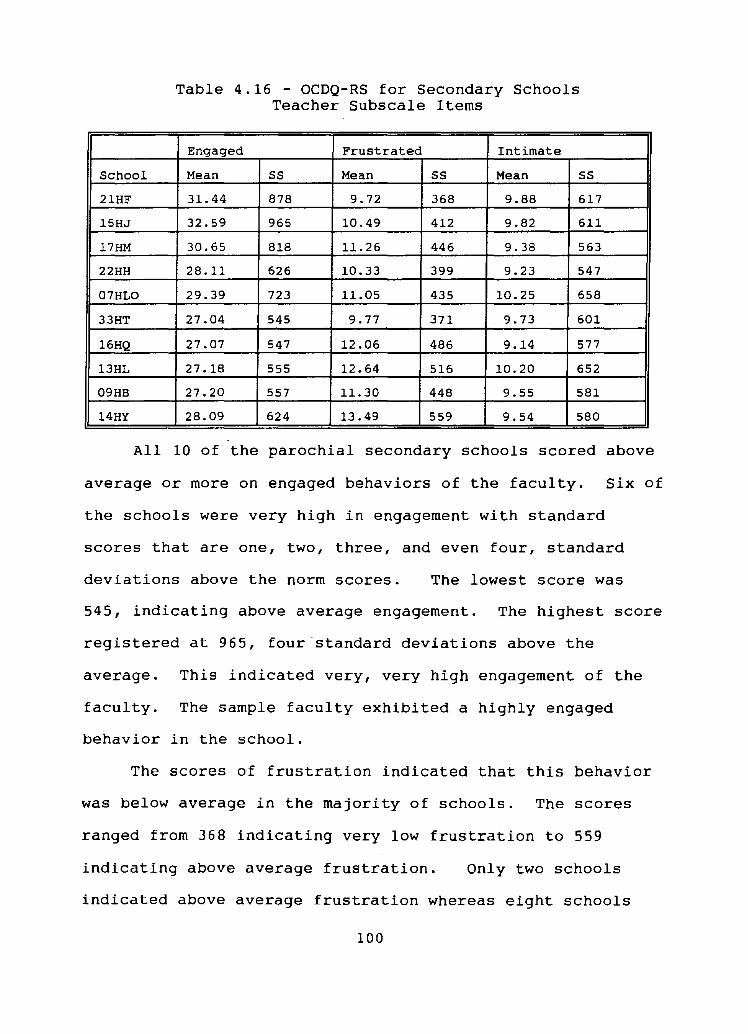
Table 4.16 - OCDQ-RS for Secondary Schools Teacher Subscale Items
Engaged Frustrated Intimate
School Mean SS Mean SS Mean SS
21HF 31.44 878 9.72 368 9.88 617
15HJ 32.59 965 10.49 412 9.82 611
17HM 30.65 818 11.26 446 9.38 563
22HH 28.11 626 10.33 399 9.23 547
07HLO 29.39 723 11.05 435 10.25 658
33HT 27.04 545 9.77 371 9.73 601
16HQ 27.07 547 12.06 486 9.14 577
13HL 27.18 555 12.64 516 10.20 652
09HB 27.20 557 11.30 448 9.55 581
14HY 28.09 624 13.49 559 9.54 580
All 10 of the parochial secondary schools scored above
average or more on engaged behaviors of the faculty. Six of
the schools were very high in engagement with standard
scores that are one, two, three, and even four, standard
deviations above the norm scores. The lowest score was
545, indicating above average engagement. The highest score
registered at 965, four standard deviations above the
average. This indicated very, very high engagement of the
faculty. The sample faculty exhibited a highly engaged
behavior in the school.
The scores of frustration indicated that this behavior
was below average in the majority of schools. The scores
ranged from 368 indicating very low frustration to 559
indicating above average frustration. Only two schools
indicated above average frustration whereas eight schools
100
indicated below average frustration. Overall, the
respondents in the secondary schools were below average in
the behavior of frustration.
The scores of intimacy ranged from a low of 547 to a
high of 658. The lowest score indicated above average
intimacy. The highest score indicated very high intimacy in
the school. All 10 schools were at least above average in
the behavior of intimacy.
Elementary Schools - OCDQ-RE
The ODCQ-RE is a 42-item questionnaire that measures
the basic dimensions of the elementary school climate. On
this instrument, six behaviors contributed to the climate of
the school. Three principal behaviors are examined:
support, directiveness, and restrictiveness. Three teacher
behaviors are examined to determine the teacher openness in
the climate of the school collegiality, intimacy, and
disengagement. Table 4.17 presents the principal openness,
the teacher openness and the total openness of the climate
of the school.
101
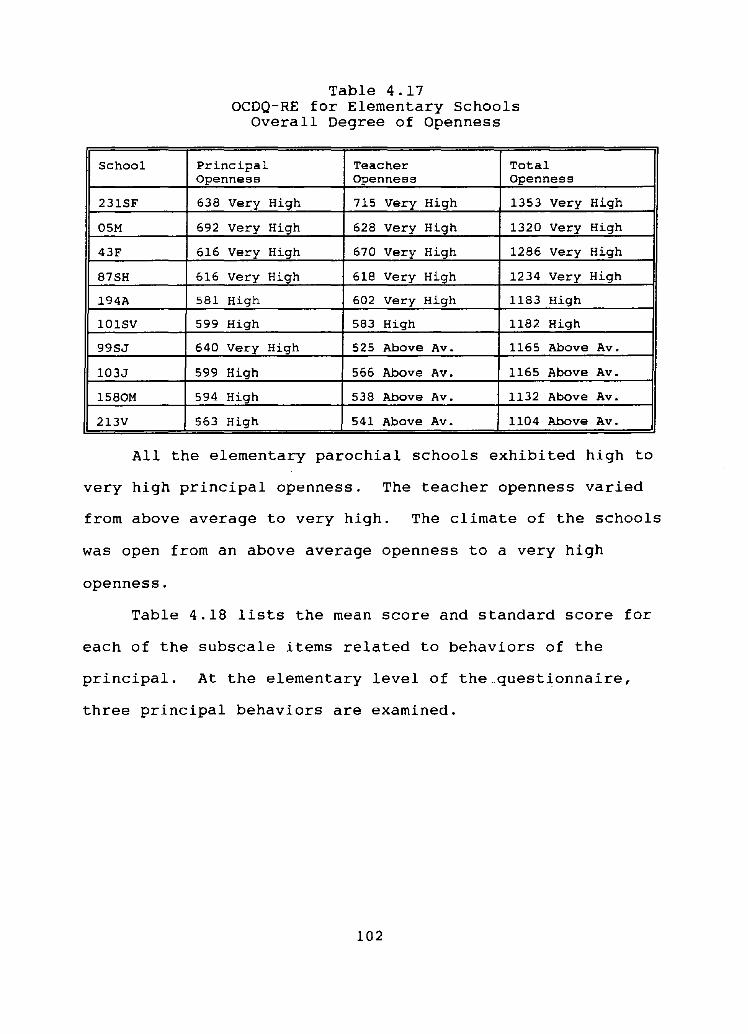
School
231SF
05M
43F
87SH
194A
101SV
99SJ
103J
1580M
213V
Table 4.17 OCDQ-RE for Elementary Schools
Overall Degree of Openness
Principal Teacher Total Openness Openness Openness
638 Very High 715 Very High 1353 Very
692 Very High 628 Very High 1320 Very
616 Very High 670 Very High 1286 Very
616 Very High 618 Very High 1234 Very
581 High 602 Very High 1183 High
599 High 583 High 1182 High
640 Very High 525 Above Av. 1165 Above
599 High 566 Above Av. 1165 Above
594 High 538 Above Av. 1132 Above
563 High 541 Above Av. 1104 Above
High
High
High
High
Av.
Av.
Av.
Av.
All the elementary parochial schools exhibited high to
very high principal openness. The teacher openness varied
from above average to very high. The climate of the schools
was open from an above average openness to a very high
openness.
Table 4.18 lists the mean score and standard score for
each of the subscale items related to behaviors of the
principal. At the elementary level of the_questionnaire,
three principal behaviors are examined.
102
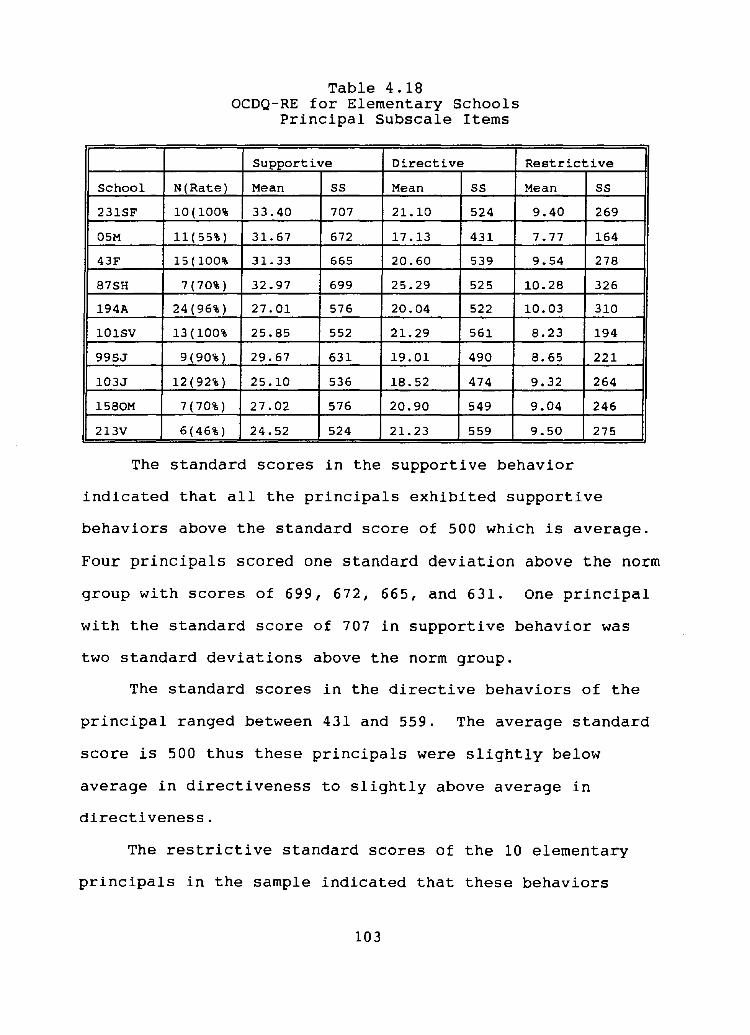
Table 4.18 OCDQ-RE for Elementary Schools
Principal Subsca1e Items
Supportive Directive Restrictive
School N(Rate) Mean SS Mean SS Mean SS
23lSF 10(100% 33.40 707 21.10 524 9.40 269
05M 11(55%) 31. 67 672 17.13 431 7.77 164
43F 15(100% 31.33 665 20.60 539 9.54 278
87SH 7 (70%) 32.97 699 25.29 525 10.28 326
194A 24(96%) 27.01 576 20.04 522 10.03 310
101SV 13(100% 25.85 552 21.29 561 8.23 194
99SJ 9(90%) 29.67 631 19.01 490 8.65 221
103J 12(92%) 25.10 536 18.52 474 9.32 264
1580M 7 (70%) 27.02 576 20.90 549 9.04 246
213V 6(46%) 24.52 524 21.23 559 9.50 275
The standard scores in the supportive behavior
indicated that all the principals exhibited supportive
behaviors above the standard score of 500 which is average.
Four principals scored one standard deviation above the norm
group with scores of 699, 672, 665, and 631. One principal
with the standard score of 707 in supportive behavior was
two standard deviations above the norm group.
The standard scores in the directive behaviors of the
principal ranged between 431 and 559. The average standard
score is 500 thus these principals were slightly below
average in directiveness to slightly above average in
directiveness.
The restrictive standard scores of the 10 elementary
principals in the sample indicated that these behaviors
103
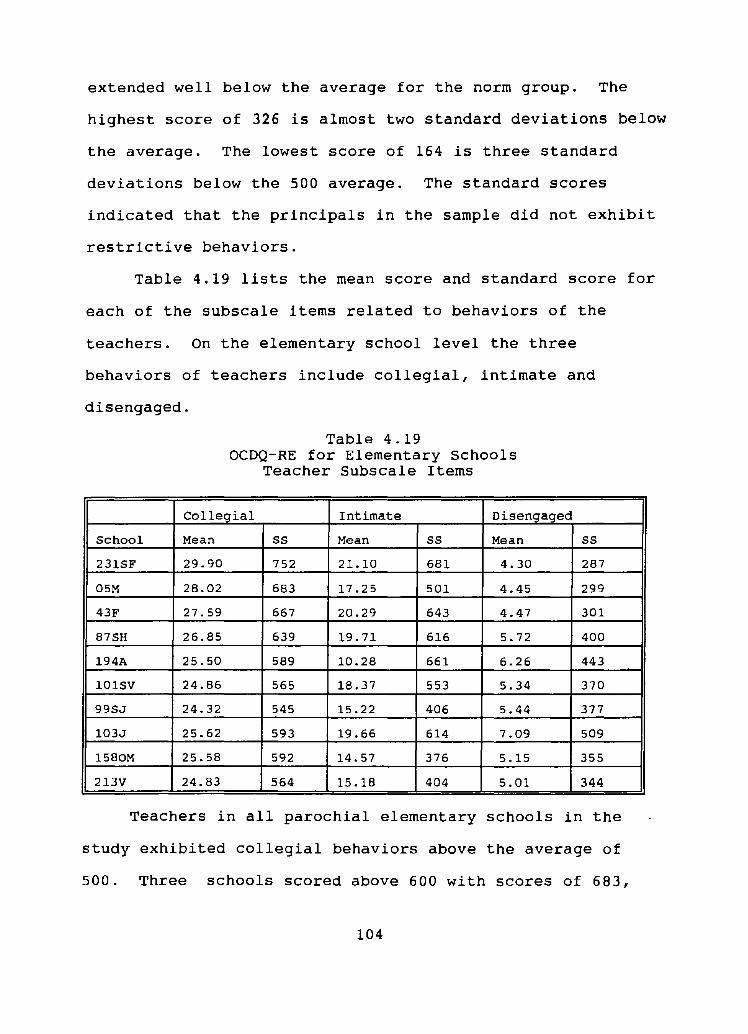
extended well below the average for the norm group. The
highest score of 326 is almost two standard deviations below
the average. The lowest score of 164 is three standard
deviations below the 500 average. The standard scores
indicated that the principals in the sample did not exhibit
restrictive behaviors.
Table 4.19 lists the mean score and standard score for
each of the subscale items related to behaviors of the
teachers. On the elementary school level the three
behaviors of teachers include collegial, intimate and
disengaged.
Table 4.19 OCDQ-RE for Elementary Schools
Teacher Subscale Items
Collegial Intimate Disengaged
School Mean SS Mean SS Mean
231SF 29.90 752 21.10 681 4.30
05M 28.02 683 17.25 501 4.45
43F 27.59 667 20.29 643 4.47
87SH 26.85 639 19.71 616 5.72
194A 25.50 589 10.28 661 6.26
101SV 24.86 565 18.37 553 5.34
99SJ 24.32 545 15.22 406 5.44
103J 25.62 593 19.66 614 7.09
1580M 25.58 592 14.57 376 5.15
213V 24.83 564 15.18 404 5.01
SS
287
299
301
400
443
370
377
509
355
344
Teachers in all parochial elementary schools in the
study exhibited collegial behaviors above the average of
500. Three schools scored above 600 with scores of 683,
104
667, and 639 with is one standard deviation above the
average of 500 of the norm group. The faculty of one school
had a score of 752 which is two standard deviations above
the average.
The behavior of intimacy showed a far greater range
from a low score of 376 to a high score of 681. Three
schools showed non-engagement in intimacy by the members of
the faculty with the scores of 376, 404, and 406.
With regard to the behavior of disengagement, only one
school exhibited this behavior to an average degree with a
score of 509. The other nine schools did not show evidence
of disengagement, with scores well below the 500 average.
The teachers in these nine schools were therefore engaged in
the activities of the students and the school.
Summary Description of the OCDQ
Thi~ section began by examining the results of the
Organizational Description Questionnaire to determine the
climate of parochial schools. The respondents in secondary
parochial schools indicated that the principals exhibited
the engaging behavior characteristic of supportiveness to a
high degree.
The respondents in elementary parochial schools also
indicated that the principals exhibited the engaging
behavior characteristic of supportiveness to a high degree.
At the elementary level, the principals exhibited very low
restrictiveness, an engaging behavior characteristic.
105
Examination of teacher behaviors at the secondary level
indicated that faculty members were highly engaged and also
intimate. Respondents denoted that these engaging behaviors
were present to a high degree. At the elementary level, the
respondents indicated that engaged teacher behaviors
included collegiality to a high degree and intimacy to an
average degree. Teachers did not exhibit characteristics of
disengagement thus the teachers showed the positive climate
characteristic of engagement.
The respondents indicated that the secondary principals
exhibited the disengaging behavior characteristic of
directiveness as much as that of the norm group. At the
elementary level, the respondents indicated this same
information concerning the principal behavior.
Elementary parochial schools and secondary parochial
schools in the sample indicate an open school climate to a
high degree. At the secondary level, 60% of the schools
have an open climate that was very high compared to the norm
group. Of the remaining 40% of the schools, 30% had an
average open climate, while only 10% or one school exhibited
a below average openness in the climate.
At the elementary parochial school level, 40% of the
schools exhibited an very high open climate. Twenty percent
of the schools displayed a high open climate. The remaining
40% of the schools exhibited an above average open climate.
The 20 schools in the sample did not indicate
106
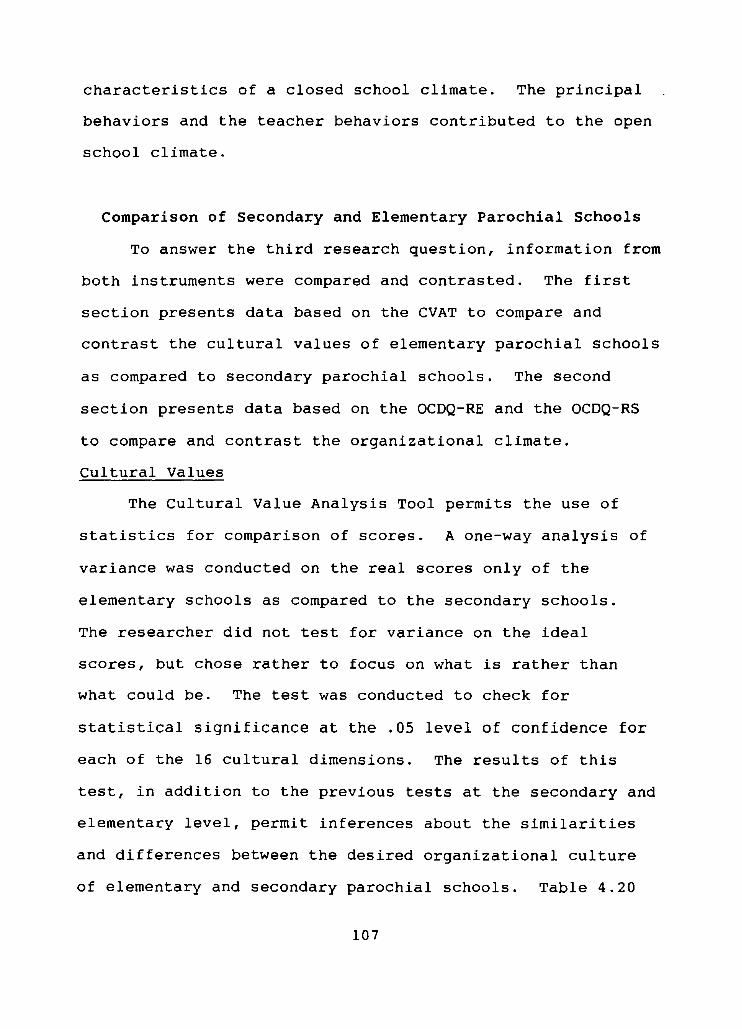
characteristics of a closed school climate. The principal
behaviors and the teacher behaviors contributed to the open
school climate.
Comparison of Secondary and Elementary Parochial Schools
~o answer the third research question, information from
both instruments were compared and contrasted. The first
section presents data based on the CVAT to compare and
contrast the cultural values of elementary parochial schools
as compared to secondary parochial schools. The second
section presents data based on the OCDQ-RE and the OCDQ-RS
to compare and contrast the organizational climate.
Cultural Values
The Cultural Value Analysis Tool permits the use of
statistics for comparison of scores. A one-way analysis of
variance was conducted on the real scores only of the
elementary schools as compared to the secondary schools.
The researcher did not test for variance on the ideal
scores, but chose rather to focus on what is rather than
what could be. The test was conducted to check for
statistical significance at the .05 level of confidence for
each of the 16 cultural dimensions. The results of this
test, in addition to the previous tests at the secondary and
elementary level, permit inferences about the similarities
and differences between the desired organizational culture
of elementary and secondary parochial schools. Table 4.20
107
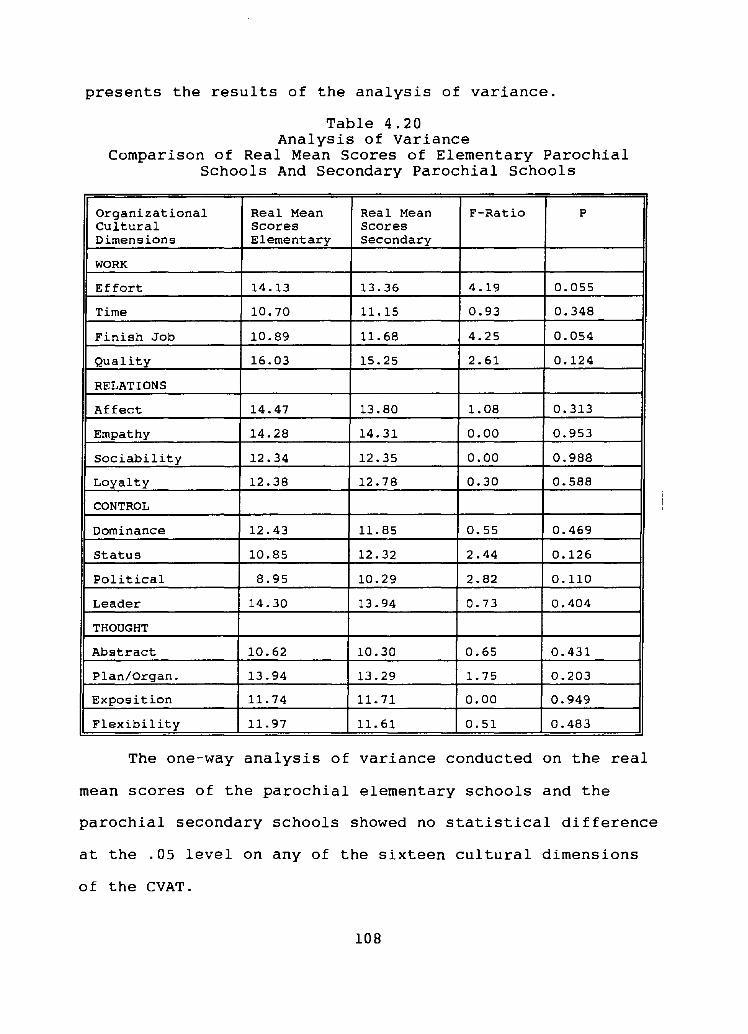
presents the results of the analysis of variance.
Table 4.20 Analysis of Variance
Comparison of Real Mean Scores of Elementary Parochial Schools And Secondary Parochial Schools
Organizational Real Mean Real Mean F-Ratio P Cultural Scores Scores Dimensions Elementary Secondary
WORK
Effort 14.13 13.36 4.19 0.055
Time 10.70 11.15 0.93 0.348
Finish Job 10.89 11.68 4.25 0.054
Quality 16.03 15.25 2.61 0.124
RELATIONS
Affect 14.47 13.80 1.08 0.3l3
Empathy 14.28 14.31 0.00 0.953
Sociability 12.34 12.35 0.00 0.988
Loyalty 12.38 12.78 0.30 0.588
CONTROL
Dominance 12.43 11. 85 0.55 0.469
Status 10.85 12.32 2.44 0.126
Political 8.95 10.29 2.82 0.1l0
Leader 14.30 13.94 0.73 0.404
THOUGHT
Abstract 10.62 10.30 0.65 0.431
Plan/Organ. 13.94 13.29 1. 75 0.203
Exposition 11. 74 11. 71 0.00 0.949
Flexibility 11.97 11.61 0.51 0.483
The one-way analysis of variance conducted on the real
mean scores of the parochial elementary schools and the
parochial secondary schools showed no statistical difference
at the .05 level on any of the sixteen cultural dimensions
of the CVAT.
108
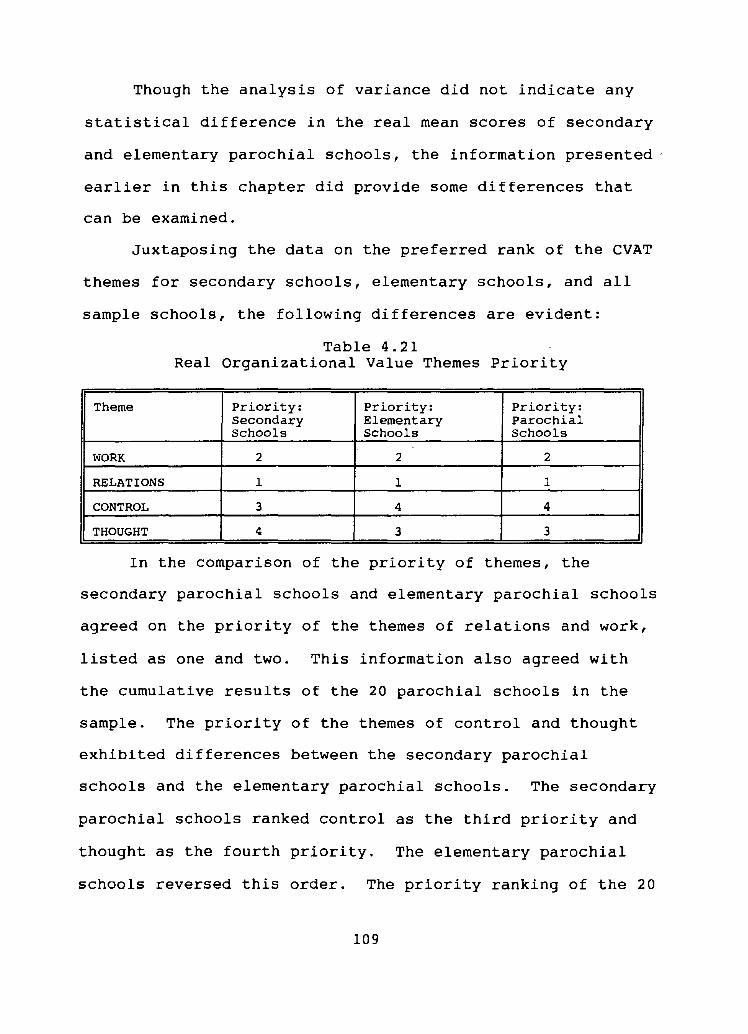
Though the analysis of variance did not indicate any
statistical difference in the real mean scores of secondary
and elementary parochial schools, the information presented
earlier in this chapter did provide some differences that
can be examined.
Juxtaposing the data on the preferred rank of the CVAT
themes for secondary schools, elementary schools, and all
sample schools, the following differences are evident:
Table 4.21 Real Organizational Value Themes Priority
Theme priority: Priority: Priority: secondary Elementary Parochial Schools Schools Schools
WORK 2 2 2
RELATIONS 1 1 1
CONTROL 3 4 4
THOUGHT 4 3 3
In the comparison of the priority of themes, the
secondary parochial schools and elementary parochial schools
agreed on the priority of the themes of relations and work,
listed as one and two. This information also agreed with
the cumulative results of the 20 parochial schools in the
sample. The priority of the themes of control and thought
exhibited differences between the secondary parochial
schools and the elementary parochial schools. The secondary
parochial schools ranked control as the third priority and
thought as the fourth priority. The elementary parochial
schools reversed this order. The priority ranking of the 20
109
parochial schools in the sample agreed with the order
indicated by the elementary schools.
In the ideal situation, a comparison of the secondary
parochial schools, the elementary parochial schools, and all
20 schools in the sample indicated some similarities in
ranking but also some differences.
Table 4.22 Ideal Organizational Value Themes Priority
Theme priority: Priority: Priority: Secondary Elementary Parochial Schools Schools Schools
WORK 1 2 2
RELATIONS 1 1 1
CONTROL 4 4 4
THOUGHT 3 3 3
The difference between secondary parochial schools and
elementary parochial schools existed in the ranking of the
number one theme. The secondary schools in the ideal
situation believed that work and relations are equally
valued as the number one priority. In the elementary
schools and also in the total 20 schools in the sample, the
top priority in themes was relations. The rankings of
thought as number three and control as number four remained
constant at the secondary, elementary and total parochial
schools levels.
To examine the dimensions preferred by the secondary
schools, the elementary schools, and all 20 schools in the
sample, the first six priority dimensions will be presented.
110
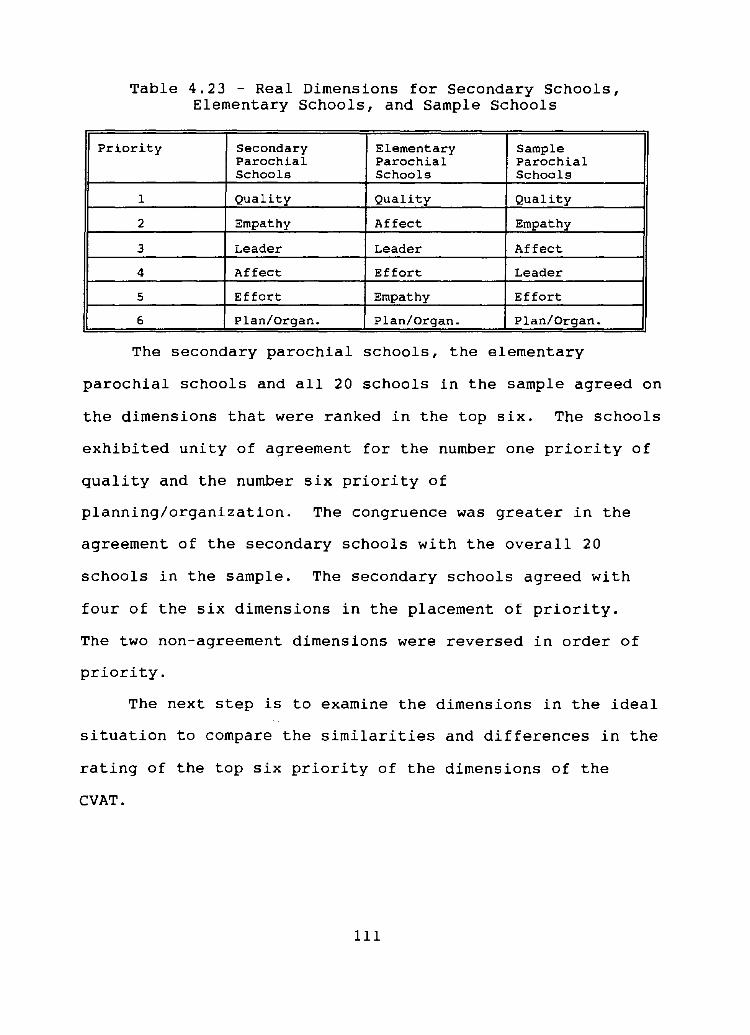
Table 4.23 - Real Dimensions for Secondary Schools, Elementary Schools, and Sample Schools
Priority Secondary Elementary Sample Parochial Parochial Parochial Schools Schools Schools
1 Quality Quality Quality
2 Empathy Affect Empathy
3 Leader Leader Affect
4 Affect Effort Leader
5 Effort Empathy Effort
6 Plan/Organ. Plan/Organ. Plan/Organ.
The secondary parochial schools, the elementary
parochial sChools and all 20 schools in the sample agreed on
the dimensions that were ranked in the top six. The schools
exhibited unity of agreement for the number one priority of
quality and the number six priority of
planning/organization. The congruence was greater in the
agreement of the secondary schools with the overall 20
schools in the sample. The secondary schools agreed with
four of the six dimensions in the placement of priority.
The two non-agreement dimensions were reversed in order of
priority.
The next step is to examine the dimensions in the ideal
situation to compare the similarities and differences in the
rating of the top six priority of the dimensions of the
CVAT.
III
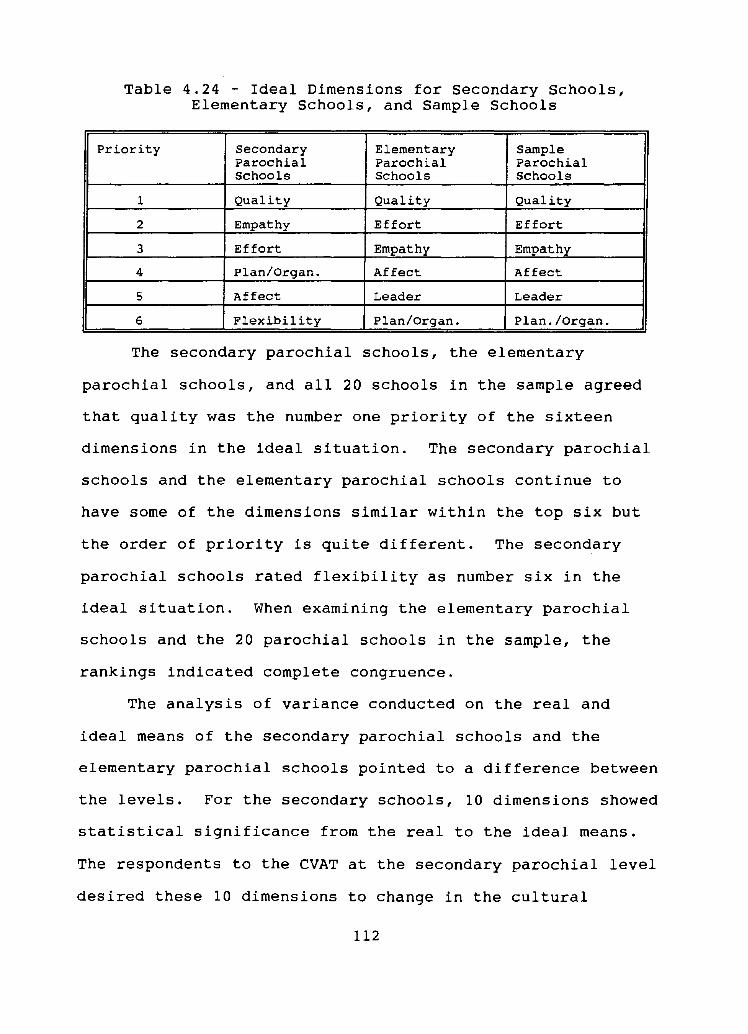
Table 4.24 - Ideal Dimensions for Secondary Schools, Elementary Schools, and Sample Schools
Priority Secondary Elementary Sample Parochial Parochial Parochial Schools Schools Schools
1 Quality Quality Quality
2 Empathy Effort Effort
3 Effort Empathy Empathy
4 Plan/Organ. Affect Affect
5 Affect Leader Leader
6 Flexibility Plan/Organ. Plan./Organ.
The secondary parochial schools, the elementary
parochial schools, and all 20 schools in the sample agreed
that quality was the number one priority of the sixteen
dimensions in the ideal situation. The secondary parochial
schools and the elementary parochial schools continue to
have some of the dimensions similar within the top six but
the order of priority is quite different. The secondary
parochial schools rated flexibility as number six in the
ideal situation. When examining the elementary parochial
schools and the 20 parochial schools in the sample, the
rankings indicated complete congruence.
The analysis of variance conducted on the real and
ideal means of the secondary parochial schools and the
elementary parochial schools pointed to a difference between
the levels. For the secondary schools, 10 dimensions showed
statistical significance from the real to the ideal means.
The respondents to the CVAT at the secondary parochial level
desired these 10 dimensions to change in the cultural
112
characteristics exhibited by the faculty and administration.
The choice of the six most highly valued dimensions in the
real and ideal situation also varied at the secondary level.
In comparison, the analysis of variance conducted on
the elementary parochial schools showed statistical
significance on only three dimensions from the real mean to
the ideal mean. The perceptions of the faculty and
administration of the elementary parochial schools indicate
more congruence in the real situation to the ideal
situation. This congruence was also noted in the fact that
the theme priorities remained the same in the real and ideal
situations. The third factor in the congruency was that the
six dimensions receiving the priority ranking remained the
same in the real and ideal situation even though the
position of the ranking did change. The perception of the
respondents in the elementary parochial schools was that the
real situation reflected closely the ideal situation.
In summary, one-way analysis of variance showed no
statistical difference between elementary and secondary
schools in the real mean scores on the sixteen cultural
dimensions. When examining the desired priorities of the
secondary schools and the elementary schools in the real
situation, secondary schools differed in the priority of
control and thought. In the ideal situation, the secondary
parochial schools again displayed a difference with the tied
ranking of work and relations. The elementary parochial
113
schools reflected total agreement with the 20 schools in the
sample.
Organizational Climate
The third research question also asks whether the
climate characteristics of elementary parochial schools
differ from those of secondary parochial schools. The OCDQ-
RS and the OCDQ-RE are different in the number of statements
and the statements themselves. A statistical comparison
cannot be made. Instead, the parochial elementary and
secondary schools in the sample were compared to the norm
grouping of schools in the research conducted by Hoy,
Tarter, and Kottkamp (1991). For each behavior or subtest
of the Organizational Climate Description Questionnaire, the
researchers--Hoy, Tarter, and Kottkamp--provided a norm mean
score. A confidence interval was calculated for each of the
climate characteristics of elementary and secondary schools.
Confidence intervals at the 95% level were calculated. The
null hypothesis is that Mu is equal to the normative score
for each of the climate dimensions.
Table 4.25 reports the sample mean scores for the
principal's behaviors of the OCDQ-RE for the elementary
schools.
114
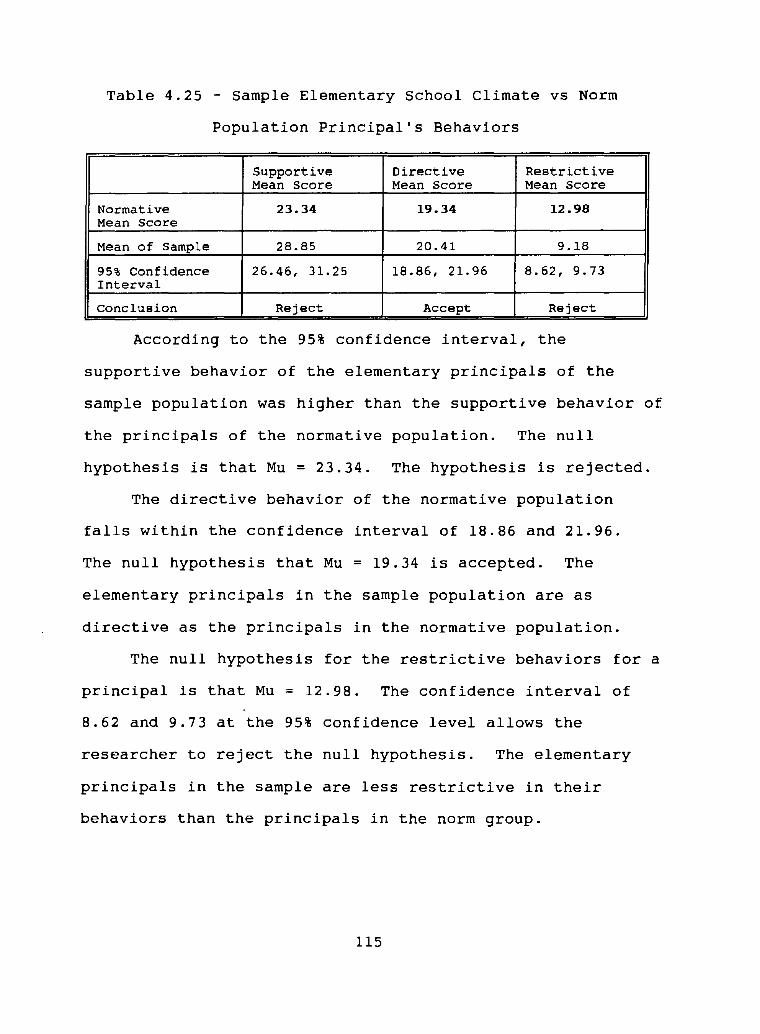
Table 4.25 - Sample Elementary School Climate vs Norm
Population Principal's Behaviors
Supportive Directive Restrictive Mean Score Mean Score Mean Score
Normative 23.34 19.34 12.98 Mean Score
Mean of Sample 28.85 20.41 9.18
95% Confidence 26.46, 31.25 18.86, 21.96 8.62, 9.73 Interval
Conclusion Reject Accept Reject
According to the 95% confidence interval, the
supportive behavior of the elementary principals of the
sample population was higher than the supportive behavior of
the principals of the normative population. The null
hypothesis is that Mu = 23.34. The hypothesis is rejected.
The directive behavior of the normative population
falls within the confidence interval of 18.86 and 21.96.
The null hypothesis that Mu = 19.34 is accepted. The
elementary principals in the sample population are as
directive as the principals in the normative population.
The null hypothesis for the restrictive behaviors for a
principal is that Mu = 12.98. The confidence interval of
8.62 and 9.73 at the 95% confidence level allows the
researcher to reject the null hypothesis. The elementary
principals in the sample are less restrictive in their
behaviors than the principals in the norm group.
115
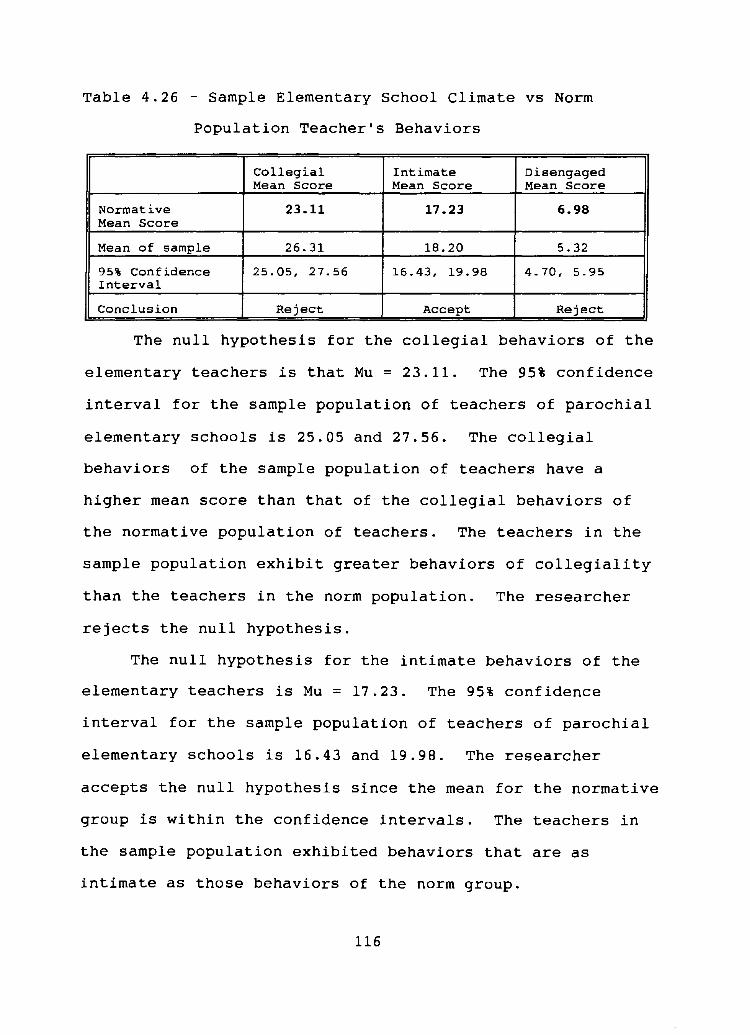
Table 4.26 - Sample Elementary School Climate vs Norm
Population Teacher's Behaviors
Collegial Intimate Disengaged Mean Score Mean Score Mean Score
Normative 23.11 17.23 6.98 Mean Score
Mean of sample 26.31 18.20 5.32
95% Confidence 25.05, 27.56 16.43, 19.98 4.70, 5.95 Interval
Conclusion Reject Accept Reject
The null hypothesis for the collegial behaviors of the
elementary teachers is that Mu = 23.11. The 95% confidence
interval for the sample population of teachers of parochial
elementary schools is 25.05 and 27.56. The collegial
behaviors of the sample population of teachers have a
higher mean score than that of the collegial behaviors of
the normative population of teachers. The teachers in the
sample population exhibit greater behaviors of collegiality
than the teachers in the norm population. The researcher
rejects the null hypothesis.
The null hypothesis for the intimate behaviors of the
elementary teachers is Mu = 17.23. The 95% confidence
interval for the sample population of teachers of parochial
elementary schools is 16.43 and 19.98. The researcher
accepts the null hypothesis since the mean for the normative
group is within the confidence intervals. The teachers in
the sample population exhibited behaviors that are as
intimate as those behaviors of the norm group.
116
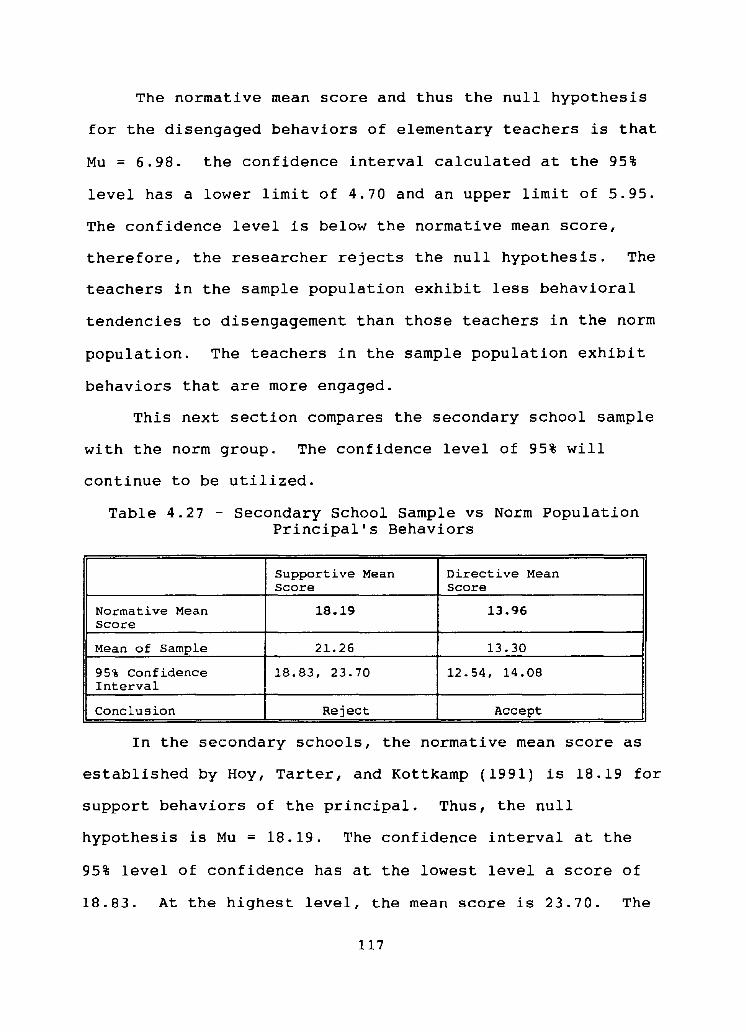
The normative mean score and thus the null hypothesis
for the disengaged behaviors of elementary teachers is that
Mu = 6.98. the confidence interval calculated at the 95%
level has a lower limit of 4.70 and an upper limit of 5.95.
The confidence level is below the normative mean score,
therefore, the researcher rejects the null hypothesis. The
teachers in the sample population exhibit less behavioral
tendencies to disengagement than those teachers in the norm
population. The teachers in the sample population exhibit
behaviors that are more engaged.
This next section compares the secondary school sample
with the norm group. The confidence level of 95% will
continue to be utilized.
Table 4.27 - Secondary School Sample vs Norm Population Principal's Behaviors
Supportive Mean Directive Mean Score Score
Normative Mean 18.19 13.96 Score
Mean of Sample 21.26 13.30
95% Confidence 18.83, 23.70 12.54, 14.08 Interval
Conclusion Reject Accept
In the secondary schools, the normative mean score as
established by Hoy, Tarter, and Kottkamp (1991) is 18.19 for
support behaviors of the principal. Thus, the null
hypothesis is Mu = 18.19. The confidence interval at the
95% level of confidence has at the lowest level a score of
18.83. At the highest level, the mean score is 23.70. The
117
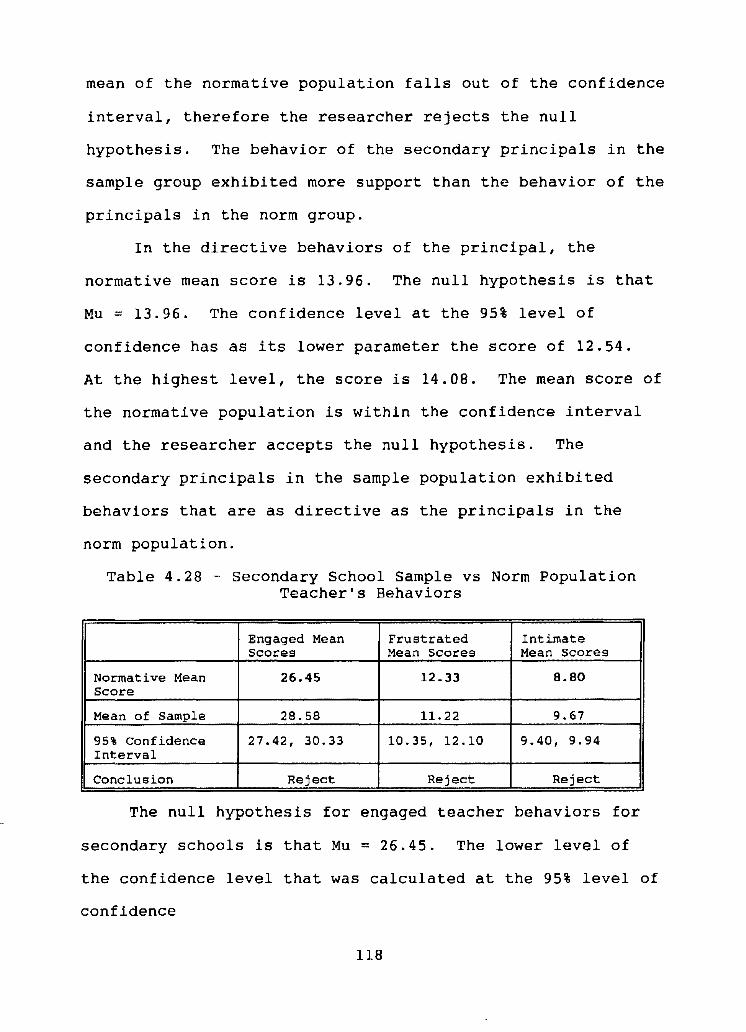
mean of the normative population falls out of the confidence
interval, therefore the researcher rejects the null
hypothesis. The behavior of the secondary principals in the
sample group exhibited more support than the behavior of the
principals in the norm group.
In the directive behaviors of the principal, the
normative mean score is 13.96. The null hypothesis is that
Mu = 13.96. The confidence level at the 95% level of
confidence has as its lower parameter the score of 12.54.
At the highest level, the score is 14.08. The mean score of
the normative population is within the confidence interval
and the researcher accepts the null hypothesis. The
secondary principals in the sample population exhibited
behaviors that are as directive as the principals in the
norm population.
Table 4.28 - secondary School Sample vs Norm Population Teacher's Behaviors
Engaged Mean Frustrated Intimate Scores Mean Scores Mean Scores
Normative Mean 26.45 12.33 8.80 Score
Mean of Sample 28.58 11.22 9.67
95% Confidence 27.42, 30.33 10.35, 12.10 9.40, 9.94 Interval
Conclusion Reject Reject Reject
The null hypothesis for engaged teacher behaviors for
secondary schools is that Mu = 26.45. The lower level of
the confidence level that was calculated at the 95% level of
confidence
118
is 27.42. The mean of the normative population is below the
lower limit of the confidence level formed from the sample
value. The researcher rejects the null hypothesis that
there is no difference in the mean scores of the normative
population and the sample population. The teachers in the
sample population presented more engaged behaviors than the
teachers in the norm population.
On the OCDQ-RS for secondary teachers the normative
scores for frustrated behaviors is 12.33, therefore, the
null hypothesis is that Mu = 12.33. The confidence interval
at the 95% level has as its upper parameter the score of
12.10. The sample population had a mean score that is lower
than the normative population. The null hypothesis is
rejected. The behavior of the teachers in the sample
population were less frustrated than the behavior of the
teachers in the normative population.
The null hypothesis for intimate behaviors is that Mu
8.80. The confidence interval was calculated at the 95%
level of confidence with the lowest parameter as 9.40 and
the highest parameter at 9.94. The normative mean score is
lower than the lowest parameter of the confidence level of
the sample population. The researcher rejects the null
hypothesis. The teachers in the sample population exhibited
behaviors that were more intimate than the behaviors of the
teachers in the normative group.
In summary, the confidence intervals conducted on the
119
behaviors identified on the Organizational Climate
Description questionnaire for both principals and teachers
presented notable information. At the elementary level, the
researcher rejected four of the six null hypothesis based on
the normative mean score. The principals at the elementary
parochial schools exhibited behaviors that were more
supportive but less restrictive than those principals in the
normative population. The sample principals showed
behaviors that were as directive as those principals in the
norm group.
The teachers at the elementary parochial schools
exhibited behaviors that were more collegial and just as
intimate as the teachers in the norm group. The teachers at
the elementary parochial school did not exhibit the negative
characteristic of disengagement.
The confidence intervals conducted at the secondary
level yielded similar information. The researcher rejected
four of the five null hypothesis presented in the confidence
intervals. The principals in a secondary parochial school
exhibited behaviors that were more supportive than
principals in the normative population. The researcher did
accept the null hypothesis indicating that the directive
behaviors of the principal in a secondary parochial schools
were as directive as those behaviors of the principals in
the norm group.
The confidence intervals conducted at the secondary
120
level for teacher behaviors permitted the researcher to
reject all three of the null hypotheses. Teacher behaviors
of the sample population exhibited characteristics of more
engagement, more intimacy, and less frustration than those
teacher behaviors of the normative population.
In total, the researcher rejected eight out of the
eleven hypotheses based on the confidence intervals
comparing the behaviors of those principals and teachers in
a parochial school to the normative group. The climate in
parochial schools is different from the climate in the norm
population. At the elementary parochial level, the research
rejected four of the six null hypothesis presented in the
confidence intervals thus substantiating the statement that
the climate in parochial elementary schools is different
from the climate in the norm schools. The same statement
can be made concerning the secondary parochial schools since
four out of five null hypothesis were rejected.
Consequently, both elementary and secondary parochial
schools differ substantially in the climate from the norming
groups.
Summary
Chapter 4 has provided data to answer the three
research questions. The Cultural Value Analysis Tool (CVAT)
provided the information concerning the culture of each
school. The cultural characteristics of parochial
elementary schools and parochial secondary schools have been
121
determined for this sample population. The OCDQ for both
the elementary school and the secondary school described the
climate of each school. The use of the confidence
intervals on each of the principals' behaviors and the
teachers' behaviors allowed the researcher to accept or
reject the null hypothesis.
The analysis of variance indicated that there existed
statistical difference in the elementary school on three
cultural dimensions when comparing the real mean scores and
the ideal mean scores. On the secondary level, the real
mean scores and ideal mean scores showed statistically
significant difference on 10 cultural dimensions when
conducting a one-way analysis of variance.
Comparing the real mean scores of parochial elementary
schools and parochial secondary schools with an analysis of
variance on the CVAT, the researcher concluded that there
were no significant differences in the cultural dimensions
of the schools. The comparison of priority painted the
picture of similarities in some respects but also
differences as themes and dimensions were ranked.
Chapter 5 will summarize the data and results that have
been presented in Chapter 4. The statistical tests have
yielded significant differences on the CVAT that will be
examined. The use of the instruments as a data collection
tool will also be examined. The confidence intervals that
were calculated on the OCDQ permitted the researcher to
122
reject the null hypothesis on eight of the eleven climate
characteristics. Chapter 5 will provide possible reasons
within the structure of the parochial school system that
would explain these results.
123
Chapter 5 Conclusions
This study has identified cultural characteristics that
are valued in secondary and elementary parochial schools.
The study has also identified the climate of the schools and
the behaviors of the principal and the faculty as perceived
by the respondents. Father Andrew Greeley (1989) stated,
"1 had begun to assume, in the late nineteen seventies, that
the primary effectiveness of Catholic schooling was based on
cultural and social structural factors." The object of this
study was to take a step in identifying the cultural
factors.
A quantitative analysis of the organizational culture
and climate of selected elementary and secondary parochial
schools, the study focused on three main questions. The
first question sought to identify the cultural values of
parochial schools. The respondents completed the Cultural
Value Analysis Tool to provide data to determine the
cultural values.
The second question considered the organizational
climate of parochial schools. The respondents completed the
Organizational Description Climate Questionnaire designed
specifically for elementary schools or secondary schools.
The perceptions of the respondents provided data to assess
the climate of the parochial schools.
The third question focused on the similarities and
differences of the secondary parochial schools and the
124
elementary parochial schools in cultural characteristics and
in climate characteristics. The researcher chose the
statistical method of analysis of variance to check for
statistical significance on the CVAT between the secondary
schools and the elementary schools. A statistical analysis
could not be conducted on the OCDQ because the
questionnaires at the two levels were different. Comparing
the mean scores of the sample schools to the mean scores of
the normative group by use of confidence intervals presented
a profile of the climate characteristics.
Cultural Values
Secondary Schools
Secondary parochial school respondents expressed a
preference for the theme of relations in the real situation
but equally preferred the themes of work and relations in
the ideal situation. Individual secondary parochial schools
exhibited more agreement in the ranking of the four themes
of the CVAT. The secondary parochial schools in toto
expressed a desired change in cultural themes from the real
situation to the ideal situation in all four of the themes
as indicated by the change in priority of the themes.
Secondary parochial school respondents also expressed a
greater preference for the cultural dimensions of quality,
empathy, leader, affect, effort, and planning/organization
with lower importance given to dominance, time, status, and
politics. Quality and effort are two dimensions within the
125
work theme. Empathy and affect are two dimensions within
the relations theme. The remaining two themes had one
dimension valued in each theme, leader in the control theme
and planning/organization in the thought theme.
The respondents indicated that cultural changes were
desired in the schools as evidenced by the 10 dimensions
that are statistically significant in the analysis of
variance. The most stable theme from the real situation to
the ideal situation was relations. Only one significant
difference was found in the dimensions in that theme,
empathy. The respondents indicated that a change was
desired in the remaining three themes, with statistically
significant differences between real and ideal for three
dimensions within each theme.
Elementary Schools
The elementary schools emerged as more consistent in
the real and ideal situations. The ranking of the themes
remained the same in both the real and. ideal situations with
relations as number one, work as number two, thought as
number three, and control as number four.
In examining the cultural dimensions of the elementary
parochial schools, the preferred cultural characteristics of
quality, affect, leader, effort, empathy, and
planning/organization, remained the same in both the real
and ideal situation. The order of priority changed within
the two conditions but the preferred cultural dimensions
126
remained the same. Time, status and politics remained as
the least preferred characteristics.
The analysis of variance indicated that three
dimensions showed statistical significance comparing the
real situation to the ideal situation. Effort, status, and
flexibility were the three dimensions that exhibited
statistical significance. The respondents in the elementary
school would place more value on effort and flexibility in
the ideal situation and less value on status. Elementary
schools overall indicated less change desired in the ideal
situation from the real situation.
All Parochial Schools
In answering the first research question, the parochial
schools in this sample valued the cultural characteristic of
quality in the work theme. The preferred characteristic in
the relations theme was empathy. The parochial schools
valued the cultural characteristic of leader in the control
theme and indicated that planning/organization was valued in
the thought theme.
When ranking the cultural themes of the CVAT, the
respondents placed priority in this order: relations, work,
thought, and control. This same preferred order existed in
both the real and ideal situation.
All 20 parochial schools valued these four dimensions
as the most preferred cultural characteristics in the real
situation: quality, empathy, affect, and leader. In the
127
ideal situation, three of the four dimensions remained the
same as in the real situation. One new dimension emerged as
a valued characteristic: effort. In the ideal situation,
the valued dimensions, in order, were quality, effort,
empathy, and affect. If one examines the bottom quarter of
the rankings or those dimensions that are least valued in
the culture of parochial schools in the real situation, the
rank from number 13 to number 16 was as follows: finish job,
time, abstract, and political. In the bottom quarter in the
ideal situation, the least valued cultural dimensions
included the following: dominance, time, status, and
political.
In Appendix 10, a sample of an individual school
profile for a secondary and elementary parochial school
contains a grouped profile, a circular line graph comparing
the real or descriptive scores with the ideal or normative
scores. At the elementary level, one will notice that, in
this sample school, there is little difference between the
two profiles as is the case in the majority of parochial
elementary schools in the study. On the secondary level,
the circular line graph of the sample school showed greater
discrepancy between the real and ideal situation. The
distance between the lines on the line graph depicting the
real and ideal situation was greater, indicating greater
disparity in how the school is versus how the school should
be. The secondary circular line graphs for all ten schools
128
indicated similar disparity of the lines.
From the sample in this study, it is now known that the
most valued cultural characteristic was quality. Quality
has become synonymous with excellence. The third of the
eight beliefs held by the Catholic school system as
presented earlier is the commitment to academic excellence
as a mission (Guerra, Donahue, & Benson, 1990; McDermott,
1986). Wilson and Corcoran (1988) believe _that public
education has become a professionalized, bureaucratized,
governmental enterprise attempting to deliver education as a
service. In developing academic excellence as a mission
rather than a service, the characteristic of quality would
be valued.
The effective schools research presented continuous
school improvement as one of the six main themes. The
instructional program strives to reach hig-h performance
standards. If a school faculty values the quality of its
work, then the faculty naturally strives to reach these high
performance standards.
The second most valued cultural characteristic was
empathy, which brings one close to people in order to
provide nurturance. In Chapter 2, Catholic schools were
described as grounded in a set of beliefs about the worth of
each individual and committed to a world view that proclaims
a meaning to life which encompasses more than self interest.
This description supports the choice of empathy as a valued
129
characteristic. Rokeach (1968) presented this valuing as
belief congruence, asserting that one tends to value people
in proportion to the degree to which they exhibit beliefs
congruent with one's own. The finding that the relations
theme was the most valued cultural theme of parochial
schools seems fitting.
School Climate
Secondary Parochial Schools
The second research question focused on the
organizational climate of parochial schoqls. The climate
characteristics of the schools were determined by the
Organizational Climate Description Questionnaire. The
secondary school used the RS form of the questionnaire.
The RS form identified two principal behaviors and three
teacher behaviors which formed the basis in determining the
climate of the school. The numerical scores of the five
behaviors were combined to calculate the openness score for
the climate of the school. All of the secondary schools had
open climates. Nine of the ten schools scored 500, the
average, or more. The openness score of 483 for one school
was below average but did not indicate a closed climate.
Two of the openness scores were 700 or above, two standard
deviations from the average as established by Hoy, Tarter,
and Kottkamp (1991). These two schools had openness scores
higher than 97% of the schools in the norming group. Four
of the schools scored 600 or better in openness, one
130
standard deviation above the average. These four schools
had scores higher than 84% of the schools. The remaining
three schools scored in the low 500 range, indicating
average openness.
Openness scores in the secondary schools were
calculated from the scores of the principals' behaviors for
support and directiveness. The respondents in secondary
parochial schools indicated that,in their perception, the
principals exhibited the engaging behavior characteristic of
supportiveness to a high degree. According to the
respondents, the principals exhibited the disengaging
behavior of directiveness to an average degree with the
scores clustering around 500.
In the secondary schools, openness scores were also
calculated from the scores of the teachers' behaviors of
engagement, frustration, and intimacy. The faculty, as
perceived by the respondents, demonstrated high engagement
in the schools. In the majority of the secondary schools,
80%, the faculty behavior of frustration scored below
average and therefore, was not a disengaging behavior of the
school. The perception of the respondents indicated that
all of the secondary schools exhibited above average
intimacy, an engaging climate characteristic.
Elementary Parochial Schools
The climate characteristics of the elementary parochial
schools were determined by using the RE form of the
131
Organizational Climate Description Questionnaire. All 10
elementary schools had above average or higher scores for
openness of the principal, openness of the teachers, and
openness of the school. The scores were determined by
calculating the standardized score and comparing it to the
norm group. This comparison revealed that all the
elementary principals scored above the average score of 500
for openness. The highest score for openness was 638, one
standard deviation above the norm. The principal openness
scores ranged from the high of 638 to the low of 563.
Teacher openness in the elementary schools reflected a
far greater range of scores than in the secondary schools.
The highest score for teacher openness was 715, two standard
deviations above the norm or higher than scores in 97% of
schools. Four of the schools scored 600 or higher on
teacher openness, receiving scores one standard deviation or
more higher than scores in the norming groups. The
remaining five schools had teacher openness scores in the
500s, ranging from the low of 525 to the high of 583. All
teacher openness scores indicated above average to very high
openness.
The summation of these two scores produced the total
openness of the school. All of the elementary schools in
the sample exhibited open climates in the schools. The
scores range from very high, 1353, to above average 1104.
The perceived principal behaviors and teacher behaviors
132
determined the openness climate of each school. At the
elementary level, the behaviors of support, directiveness,
and restrictiveness comprised the measure for principal
openness. The standardized scores with regard to supportive
behavior indicated that all the principals exhibited above
average support, ranging from 524 to 707. The perception of
the respondents indicated that the directive behaviors of
the principals clustered around the average score of 500,
with a range of 431 to 559. The respondents perceived the
restrictive behaviors of the principals to be well below the
norm of 500, with the highest score for this behavior only
reaching 326. Therefore, the respondents perceived that the
principals at the elementary parochial level exhibited the
engaging climate characteristic of support to a high degree.
The principals also exhibited the disengaging behavior of
directiveness to an average degree, whereas the principals
did not exhibit the restrictive behavior.
The teacher behaviors of collegiality, intimacy, and
disengagement comprised the openness climate score for
teacher openness. The perception of the respondents
indicated that teachers in all 10 of the parochial
elementary schools exhibited collegial behaviors above the
average of 500. The perception of intimacy indicated a
wider range of scores from 376 to 681. The majority of the
schools exhibited average to high levels of intimacy. Three
schools indicated non-engagement in intimacy.
133
The elementary parochial schools did not exhibit the
disengaging climate characteristic of disengagement. Ninety
percent of the schools showed little evidence of
disengagement, with scores well below the average.
The participants in this study indicated that their
perception of the climate of their respective schools showed
that the principals at both the secondary and elementary
level exhibit supportiveness to a high degree. The
directiveness of the principals in both the secondary and
elementary schools compared to the average level of
directiveness of the standardized score based on the norm
group. Principals at the elementary level exhibited low
restrictiveness, thus contributing to an open climate.
A study of perceived teacher behaviors at the secondary
level indicated that faculty members were highly engaged and
also intimate. At the elementary level, engaged teacher
behaviors included collegiality to a high degree and
intimacy to an average degree. The respondents did not
perceive teachers to exhibit the disengaging characteristic
of frustration at the secondary level or the disengaging
characteristic of disengagement at the elementary level.
Nineteen of the 20 schools indicated open climates to
an average or more degree. The parochial schools in ·the
sample reflected open climates. Sweeney (1991) stated that
climate can be measured to provide baseline information that
can be used to target areas for growth. Although the
134
majority of the schools exhibited open climates to a varying
degree, the different principal and teacher behaviors have
indicated some target areas for growth. At both the
secondary and elementary level the disengaging behavior
characteristic of directiveness was evident in the parochial
scnools. Respondents may wish to consider whether parochial
schools should consider this a target area for growth.
In summary, Catholic parochial schools are different
than the public schools that are identified as the norm
group. Malone (1989) believed that what makes a Catholic
school distinctive is its attempt to generate a community
climate in the school that is permeated by the Gospel spirit
of freedom and love. All parochial schools exhibited open
climates.
Comparison of Elementary and Secondary Parochial Schools
Comparison on Cultural Values
The one-way analysis of variance conducted on the real
mean scores of the parochial elementary schools and the
parochial secondary schools showed no statistical difference
at the .05 level on any of the 16 cultural dimensions of the
CVAT. Statistically then, the mean scores did not show any
significant difference. The respondents indicated a
similarity in the choice of the most desired cultural
dimensions in the real situation. The secondary parochial
schools and the elementary parochial schools selected
quality, empathy, leader, affect, effort, and
135
planning/organization as the most desired cultural
dimensions. The order of preference was not the same but
the dimensions were the same.
Other comparisons, which included the rank of theme by
school, indicated some differences between the secondary and
elementary schools. Individually, the secondary schools
exhibited greater agreement in the ranking of the themes in
both the real and ideal situation. The elementary schools
exhibited greater diversity in the real situation when
ranking the four themes.
The findings showed several similarities between
elementary and secondary schools in the priorities given to
the themes. Both secondary schools and elementary schools
chose relations as the most desired theme. Both selected
work as the number two theme.
Both the elementary and secondary parochial schools
agreed that, in the ideal situation, the theme of control
was the least desired cultural characteristic. The
elementary and secondary parochial schools also agreed on
the third ranking for the theme of thought. The schools
indicated a difference in preference for the themes of work
and relations in the ideal situation. Elementary parochial
schools most highly valued the cultural characteristics in
the relations theme, whereas secondary schools most highly
valued the cultural characteristics in both the work theme
and the relations theme equally.
136
The analysis of variance was not conducted on the ideal
means comparing the elementary parochial schools and the
secondary parochial schools. In the ideal situation, the
secondary schools and the elementary schools agree on five
of the top six cultural dimensions. Quality, empathy,
effort, affect, and planning/organization were the most
valued cultural characteristics on which they both agreed.
The respondents in the secondary schools selected
flexibility as a valued characteristic while respondents in
the elementary schools selected leader.
The results of the analysis of variance conducted,
using the real mean score as compa~~d to the ideal mean
score on each of the two parochial school levels, indicated
some differences. The analysis of variance at the secondary
level indicated a statistical significance in 10 of the 16
cultural dimensions. However analysis of variance at the
elementary level indicated a statistical significance in
only three of the 16 cultural dimensions. This finding
indicated that elementary schools were more congruent in the
cultural values in the real situation and the ideal
situation.
The elementary and secondary parochial schools agreed
that the dimension of quality was the most preferred
cultural characteristic. The schools also agreed that
political was the least preferred cultural characteristic.
At present, no cultural yardstick exists in the
137
parochial school setting. The fact that the 20 parochial
schools in the sample indicated that the theme of relations
was the number one priority was not surprising. As stated
in Chapter 2, Cooper (1988) informed us that cultures are
not made; they are born and grow. Culture is also a product
of the many individuals that are a part of the setting. The
extent to which members of the profession share certain
values and beliefs is central to the strength and unity of
the organization (Fuller & Izu, 1986; Wirt & Kirst, 1989).
The parochial school teachers share in common the basic
tenets of the Catholic faith and the values thereof. The
Catholic school is an integral part of the church's mission
to build faith communities (Guerra, Donahue, & Benson,
1990). These faith communities facilitate relations. It
can be seen, then, how relations-- reflecting the dimensions
or values of empathy, affect, sociability, and loyalty--
became the number one priority of the sample schools.
Comparison on School Climate
Organizational climate is a general term that refers to
teachers' perceptions of their work environment (Hoy,
Tarter, & Kottkamp, 1991). The teachers' perceptions from
the sample schools in the study formed the basis for
comparing the information to the norm group of scores from
Hoy, Tarter and Kottkamp's initial study. To develop this
comparison, the researcher chose the statistical test of
confidence intervals.
138
By using the confidence interval and rejecting the null
hypothesis, the researcher has determined that the
perception of teachers was that principals in a parochial
school, both at the elementary and secondary level, were
more supportive than the principals who comprised the norm
group. A belief of the Catholic schools is that the
administrator is one who serves as manager, academic leader,
creator of the school's environment, and religious leader.
The administrator is the cheerleader for the faculty,
encouraging and leading by example. Both administrators and
faculty choose to teach in a parochial school system. The
rewards are not measured in money but found in the climate
and culture of the school itself.
The perception of the respondents indicated that the
behaviors of principals in a parochial, both at the
elementary and secondary level, were as directive as those
within the normative sample. Administrators in this system
are well aware of the accountability to the entire
community, including students, parents, and the greater
church community. This sense of accountability moves an
administrator to check lesson plans, visit classrooms, and
oversee the general curriculum. On five of the
questionnaires, the respondents indicated by a written
comment that the above activities were done in a good way or
were very helpful to that teacher.
The perceptions of the respondents indicated that
139
thatanother exclusively elementary principal behavior, that
of restrictive behavior, existed to a lesser degree in the
sample parochial schools than in the norm group of schools.
The null hypothesis of the confidence interval was rejected
for this behavior. A belief in the Catholic school system
is that teachers in this system are not just professionals
but rather profess a vocation to help form human beings
according to the model "To Teach As Jesus Did" (1973). The
climate of the school does not have to be restrictive, for
the faculty is free to perform its mission of education.
The perception of the respondents as they looked at
their own behaviors provided a comparison with the norm
group by use of the confidence intervals. The faculty in
parochial elementary schools in this sample were more
collegial than the normative group. Faculties within a
Catholic school are bonded together in the larger community
of faith and church. Faculty members do not just work
together but can gather together in shared faith, to
celebrate liturgy on Sunday. Their involvement with one
another goes beyond the walls of the school.
Based on the confidence interval, teachers' perceptions
of themselves indicated that the faculty of parochial
elementary schools was as intimate as the faculty of the
normative group. The null hypothesis was accepted. The
characteristic of disengaged was exhibited to a lesser
degree in the parochial elementary school than in the
140
normative group. The value systems, held in high regard by
the groups of educators and parents, influence the norms and
standards which in turn influence patterns of behavior and
ultimately the work environment (Maxwell & Thomas, 1991).
Accordingly, the value system inherent within the Catholic
faith does influence the work environment as evidenced by
the rejection of the null hypothesis for disengagement.
The OCDQ-RS for secondary schools examined three
teacher climate characteristics. The respondents'
perception of their own behaviors indicated that they were
more engaged, more intimate, and less frustrated than the
faculty of the normative group. The researcher rejected the
null hypothesis for all three of these climate
characteristics. Faculty members in the Catholic school
system have not only chosen the profession of teaching but
have chosen Catholic schools in which to teach. The
financial remuneration continues to be about half of that
received in the public domain. The commitment is to the
profession of teaching.
Six of the secondary parochial schools in the study
scored one to four standard deviations above the norm group
in the engagement subtest. The belief that the Catholic
school system creates a supportive and challenging climate
which affirms the dignity of all persons within the school
community was evidenced in the engagement subtest. The
respondents rated themselves highly on the items that
141
reflected teacher morale, teacher support and help, pride in
the school and enjoyment in working at the school.
Intimacy is reflected in the "value congruence" (Louis,
1993). Items on the subtest include the valuing of
workmates as friends and socializing on a regular basis.
With the value congruence already in place, developing
friendships within the school system is more the norm than
the exception.
The respondents indicated behaviors of less frustration
in such items as committee requirements, administrative
paperwork, and non-teaching duties. From the outset, the
decision to work within the Catholic school system is one of
mission. Perceptions, then, are based on mission rather
than service.
Limitations of the study
The mideast section of the United States served as the
area from which the study received data from respondents.
To make any conclusions for all parochial elementary schools
or all parochial secondary schools, the study should be
conducted in the other five regions of the United States,
that is, New England, Great Lakes, Plains, Southeast, and
West/Far West. Conducting studies in all sections of the
United States would eliminate the possibility of regional
differences should the cultural values and climate
characteristics yield the same results.
The use of the CVAT and the OCDQ provided data to
142
calculate numerically the culture and climate of the 20
schools in the sample. Hoy, Tarter, and Kottkamp (1991)
revised the OCDQ to be used in schools to determine the
climate of the school. Nelson (1990) designed the CVAT to
be used in organizations and churches to determine the
cultural characteristics.
The respondents had less difficulty completing the OCDQ
than the CVAT. The valid return rate of the OCDQ was higher
than the valid return rate of the CVAT. The directions and
the format of the CVAT had been rewritten by Dr. Ken Wilburn
of the University of North Florida. The researcher used
this new format and directions when mailing the requested
number of questionnaires to each school. When tabulating
the results, the researcher removed fifty-five CVATs from
the study. The reasons for invalid forms varied. In five
of the cases, the researcher made an error in duplication or
in arranging the packets of information. In these five
cases, either the back of one of the pages was missing or
one page was missing from the set. In three cases, the
respondent did not finish the complete questionnaire or
chose to rank only information in the real condition while
the ideal condition remained unanswered. Overwhelmingly,
the respondents of the 55 invalid responses failed to follow
the directions for ranking each set of four questions using
the number one, two, three, or four only once in each set.
The respondents used a myriad of combinations of numbers.
143
Two respondents even chose to use a whole number and a
fraction (1/2) in some of the rankings. One respondent
chose to rewrite several of the questions. Two respondents
wrote that they chose not to follow the forced ranking and
ranked as they wished. For these reasons, the researcher
removed these questionnaires from the study as invalid.
The valid return rate for the CVAT was higher in the
elementary schools than in the high schools. From the
feedback that I received from some of the principals, these
schools completed the forms as part of a faculty meeting
whereas in the secondary level, written directions
accompanied the questionnaires with a due date for return.
Some of these request letters remained attached to the
returned questionnaires.
More valid responses of the CVAT would be provided if
the researcher conducted the completion of the questionnaire
on site rather than by mail. Directions could be given by
the researcher and questions answered for the clear
understanding of the forced ranking that is the format of
the CVAT.
The research of Hoy, Tarter, and Kottkamp (1991) not
only produced the Organizational Climate Description
Questionnaire but also provided the normative group mean
scores. These scores became the basis of c~mparison when
conducting the confidence intervals at the 95% level of
confidence with the sample group scores. The authors stated
144
that 70 elementary schools in New Jersey participated in the
study. The sample was not random but rather represented a
broad spectrum of schools from urban, suburban, and rural
areas, spanning the entire range of socioeconomic status.
The authors duplicated this process on the secondary level
selecting 78 high schools from 17 of the state's 22
counties, representing 10 socioeconomic categories used by
the state to classify schools from rural, suburban, and
urban areas. The authors do not specifically state that
these schools in the sample were public schools but this is
the assumption that I have made. For this reason, the study
is limited since the comparison conducted in the confidence
intervals compared parochial schools to public schools.
Establishing a norm group comprised solely of parochial
schools would allow for comparison within the Catholic
school system itself.
Implications for Practice
Guerra, Donahue, and Benson (1990) stated that
administrators in Catholic schools strive to integrate faith
and culture and to promote the spiritual life of the
students. Before an administrator can integrate faith and
culture, the administrator must know and understand the
culture of the school. The information provided by the
Cultural Value Analysis Tool provides information concerning
the priority of the four themes. An administrator would
know how to proceed based on the cultural values of the
145
faculty. One would proceed as a leader differently
depending on which of the four themes--work, relations,
control, or thought--would be preferred in the culture of
the school. For example, if the preferred culture of the
school is control, then the administrator would identify
those faculty members exhibiting the characteristics of
political, status, dominance or leader. To effect change
within a department or school, the administrative decisions
would work within the characteristics exhibited by the
faculty to promote harmony and unison in the environment.
If organizational culture is the key to organizational
excellence as stated by Schein (1983), then the
organizational culture must be known and understood by the
leadership of the school. Sergiovanni (1984) acknowledged
that effective principals develop an appropriate and unique
school culture. To accomplish this task, principals as
leaders should have some indication, by the use of a
cultural analysis tool, of the values that already exist in
the culture. The transience of the principal in the
leadership position places most principals in an existing
culture when assuming the leadership position of the school.
The knowledge of the existing culture is primary to setting
the goals and behaviors that are considered important.
Equally important is the understanding of the climate
of the school. The Organizational Description Climate
Questionnaire provides knowledge as to the climate of the
146
school. Within this information, one also knows the
perceived principal behaviors and teacher behaviors that
affect the openness of the climate. Conducting a study to
determine the perceptions of the faculty as to the behaviors
of the principal and the teachers would provide valuable
insight into the climate of the school and provide the
necessary information to promote change if needed or
desired. Although any instrument measures only the
perception of those within the school, a statement made by
the Superintendent of Catholic schools in the Diocese of
Harrisburg still echoes in the researcher's mind. Sister
Marilou MacDonald stated that "the perception is the
reality." For those present within the situation, generally
this is true.
Implications For Further Research
The difficulties with the valid return rate of the
CVAT, notwithstanding, further research would be recommended
in all areas of the United States to examine the climate and
culture of parochial schools. The 20 schools in the sample
serve as the first piece in the puzzle to describe the
organization known as Catholic schools. Many more puzzle
pieces are needed before the picture becomes clear.
The parochial schools, themselves, need a normative
sample group with which to compare all results throughout
the United States. The comparison to the public schools
with the norm group in the research of Hoy, Tarter, and
147
Kottkamp (1991) does not provide an accurate picture of the
parochial schools in comparison to one another. Research
could be conducted to provide the normative parochial school
sample as well as the normative public school sample.
Future researchers could then compare the information to one
or the other sample or both. As the sample is enlarged,
would the parochial school results approach the results of
the norm group as established by Hoy, Tarter, and Kottkamp?
The Cultural Value Analysis Tool needs broader use in
order that a norm group reference base be established within
both parochial and public schools. This research could be
conducted by region and then compared, or an overall sample
of parochial schools could be undertaken. Once the data
base is established, comparisons could be made. The
questions remain: Do all parochial schools value the
cultural theme of relations as the number one priority? Do
all parochial schools value the cultural dimension of
quality as the number one priority? Is control the least
valued theme throughout parochial schools? Can any
inferences be made then about the culture of parochial
schools?
This descriptive study of the organizational climate
and culture of selected elementary and secondary parochial
schools posits some theories based on the data. More
importantly, this same study poses more questions to be
answered.
148
Appendix 1
149
Survey instrument deleted, paper copy available upon request.
150
Survey instrument deleted, paper copy available upon request.
151
Survey instrument deleted, paper copy available upon request.
152
Survey instrument deleted, paper copy available upon request.
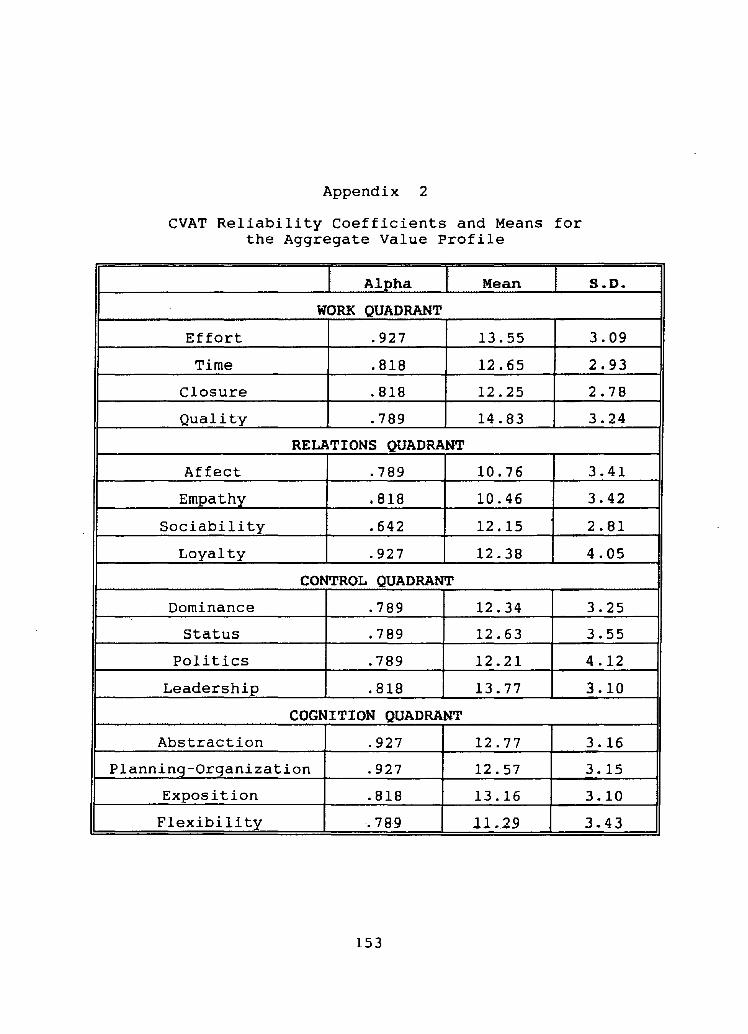
Appendix 2
CVAT Reliability Coefficients and Means for the Aggregate Value Profile
Alpha Mean
WORK QUADRANT
Effort .927 13.55
Time .818 12.65
Closure .818 12.25
Quality .789 14.83
RELATIONS QUADRANT
Affect .789 10.76
Empathy .818 10.46
Sociability .642 12.15
Loyalty .927 12.38
CONTROL QUADRANT
Dominance .789 12.34
Status .789 12.63
Politics .789 12.21
Leadership .818 13.77
COGNITION QUADRANT
Abstraction .927 12.77
Planning-Organization .927 12.57
Exposition .818 13.16
Flexibility ,.789 11.29
153
S.D.
3.09
2.93
2.78
3.24
3.41
3.42
2.81
4.05
3.25
3.55
4.12
3.10
3.16
3.15
3.10
3.43
Appendix 3
OCDQ-RE
154
Survey instrument deleted, paper copy available upon request.
155
Survey instrument deleted, paper copy available upon request.
156
Survey instrument deleted, paper copy available upon request.
Appendix 4
OCDQ-RS
157
Survey instrument deleted, paper copy available upon request.
158
Survey instrument deleted, paper copy available upon request.
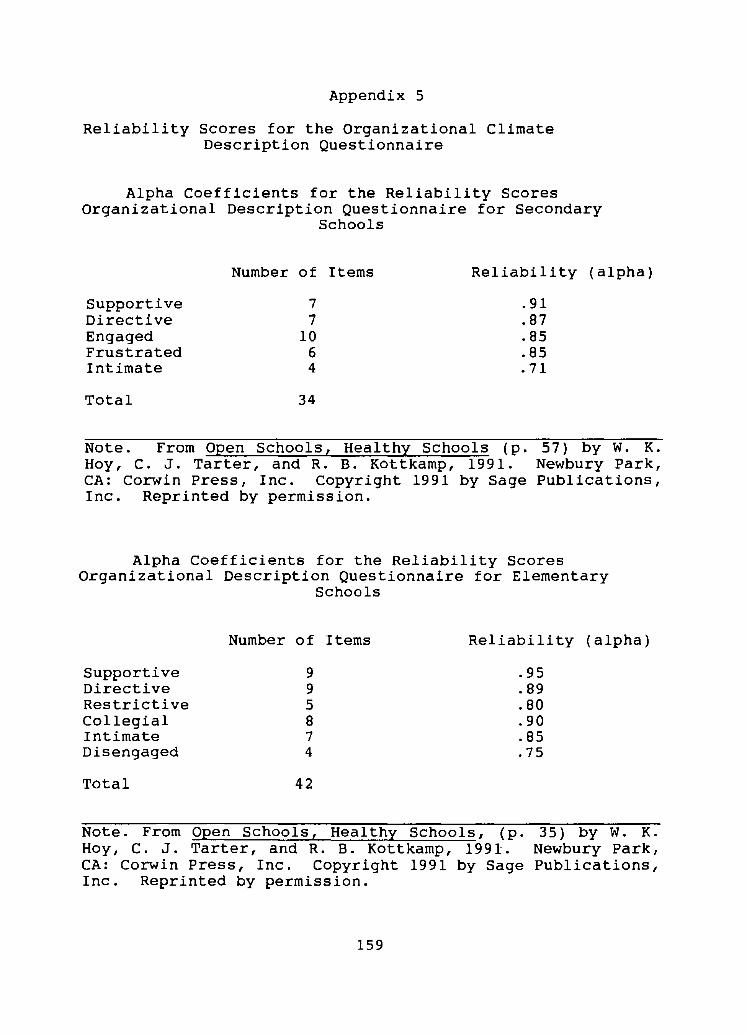
Appendix 5
Reliability Scores for the Organizational Climate Description Questionnaire
Alpha Coefficients for the Reliability Scores Organizational Description Questionnaire for Secondary
Schools
Number of Items Reliability (alpha)
Supportive 7 .91 Directive 7 .87 Engaged 10 .85 Frustrated 6 .85 Intimate 4 .71
Total 34
Note. From Open Schools, Healthy Schools (p. 57) by W. K. Hoy, C. J. Tarter, and R. B. Kottkamp, 1991. Newbury Park, CA: Corwin Press, Inc. Copyright 1991 by Sage Publications, Inc. Reprinted by permission.
Alpha Coefficients for the Reliability Scores Organizational Description Questionnaire for Elementary
Schools
Supportive Directive Restrictive Collegial Intimate Disengaged
Total
Number of Items
9 9 5 8 7 4
42
Reliability (alpha)
.95
.89
.80
.90
.85
.75
Note. From Open Schools, Healthy Schools, (p. 35) by W. K. Hoy, C. J. Tarter, and R. B. Kottkamp, 1991. Newbury Park, CA: Corwin Press, Inc. Copyright 1991 by Sage Publications, Inc. Reprinted by permission.
159
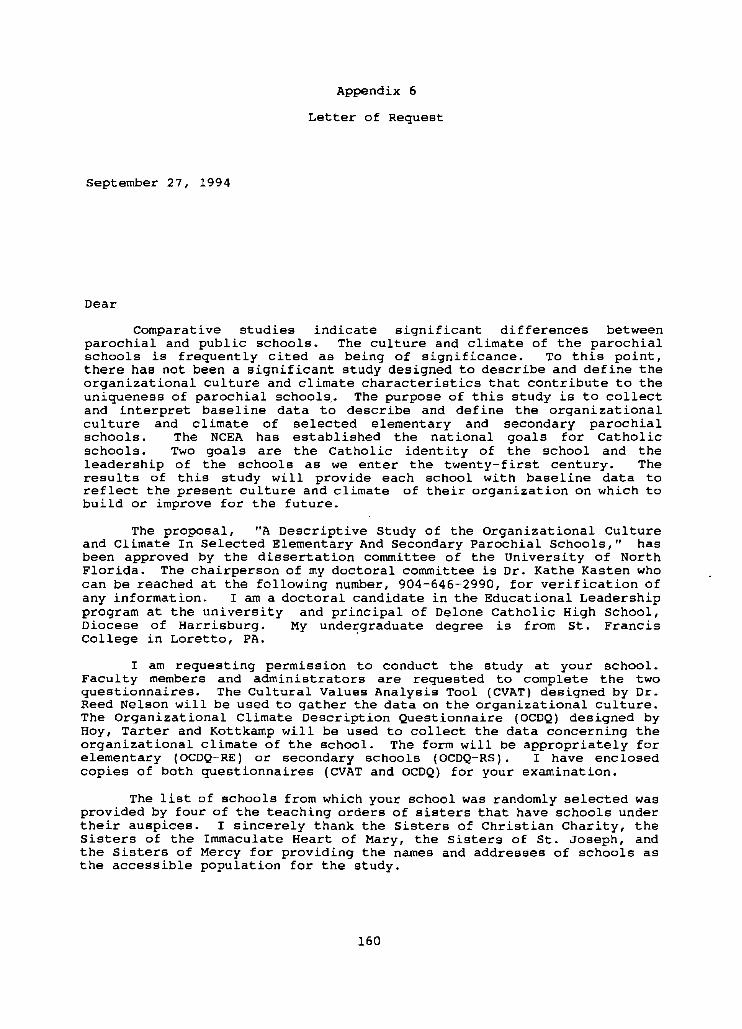
Appendix 6
Letter of Request
September 27, 1994
Dear
comparative studies indicate significant differences between parochial and public schools. The culture and climate of the parochial schools is frequently cited as being of significance. To this point, there has not been a significant study designed to describe and define the organizational culture and climate characteristics that contribute to the uniqueness of parochial schools,. The purpose of this study is to collect and interpret baseline data to describe and define the organizational culture and climate of selected elementary and secondary parochial schools. The NCEA has established the national goals for Catholic schools. Two goals are the Catholic identity of the school and the leadership of the schools as we enter the twenty-first century. The results of this study will provide each school with baseline data to reflect the present culture and climate of their organization on which to build or improve for the future.
The proposal, "A Descriptive Study of the Organizational Culture and Climate In Selected Elementary And Secondary Parochial Schools," has been approved by the dissertation committee of the University of North Florida. The chairperson of my doctoral committee is Dr. Kathe Kasten who can be reached at the following number, 904-646-2990, for verification of any information. I am a doctoral candidate in the Educational Leadership program at the university and principal of Delane Catholic High School, Diocese of Harrisburg. My undergraduate degree is from st. Francis College in Loretto, PA. .
I am requesting permission to conduct the study at your school. Faculty members and administrators are requested to complete the two questionnaires. The Cultural Values Analysis Tool (CVAT) designed by Dr. Reed Nelson will be used to gather the data on the organizational culture. The Organizational Climate Description Questionnaire (OCDQ) designed by Hoy, Tarter and Kottkamp will be used to collect the data concerning the organizational climate of the school. The form will be appropriately for elementary (OCDQ-RE) or secondary schools (OCDQ-RS). I have enclosed copies of both questionnaires (CVAT and OCDQ) for your examination.
The list of schools from which your school was randomly selected was provided by four of the teaching orders of sisters that have schools under their auspices. I sincerely thank the sisters of Christian Charity, the Sisters of the Immaculate Heart of Mary, the Sisters of St. Joseph, and the Sisters of Mercy for providing the names and addresses of schools as the accessible population for the study.
160
The total time for administration of the two questionnaires is approximately thirty minutes. Please find enclosed a postcard to be returned, requesting the number of questionnaires needed to complete the study at your school. A goal of eighty percent return rate is acceptable for a professional questionnaire. This return rate will also present each principal with a more accurate picture of the climate and culture of your school. Neither the names of individuals nor the schools will be made public. You will receive the results for your school at the completion of the study. Information concerning other schools in the study will be available but identified by code number only. As part of the organizational relationship of culture and climate in a school, research has noted that a change in the leadership tends to alter the culture and climate of the school during the first two years. For this study, I am requesting that schools participate if you, as principal, have served as such for at least two years. Please include that information on the enclosed postcard. If you have not served as principal for at least two years, I would be very happy to provide a profile of your school even if the results could not be used in my study.
Your school should expect to receive the questionnaires and return mailing instructions by mid-October. I am requesting that all questionnaires be completed and returned by Thanksgiving. This timeline should provide you the flexibility of scheduling a date for completion that is convenient to your school calendar.
I thank you in advance for making my success. May God bless you this school year. my prayers.
Sincerely,
doctoral dissertation a You will be remembered in
Maureen C. Thiec
161
Appendix 7
Letter Once Permission Had Been Granted
October 14, 1994
Dear
Thank you so much for returning the postcard and agreeing to participate in my doctoral study. Receiving permission for the study from the individual schools turned out to be one of the hardest assignment during this five year process of course work and examinations for the doctoral program. I am grateful to you for your positive response.
Please find enclosed the number of documents you indicated were needed for your school. When conducting the pilot study, I found it was much easier for me as principal, to distribute the forms at the beginning of a faculty meeting. The faculty responded at that time which took about twenty minutes of time. The best response is the one that comes to mind immediately. Pondering the questions at length does not prove to be effective. This method provided a high level of return and a lot less effort on my part attempting to track down missing forms. Please also have all members of the administration complete the questionnaire as well.
Please return the forms in the postage paid envelop enclosed. If the results could be returned by Thanksgiving, it would be appreciated. Again, thank you for your cooperation. You have made my study possible. May God continue to watch over and bless you this school year.
Sincerely,
Maureen C. Thiec
162
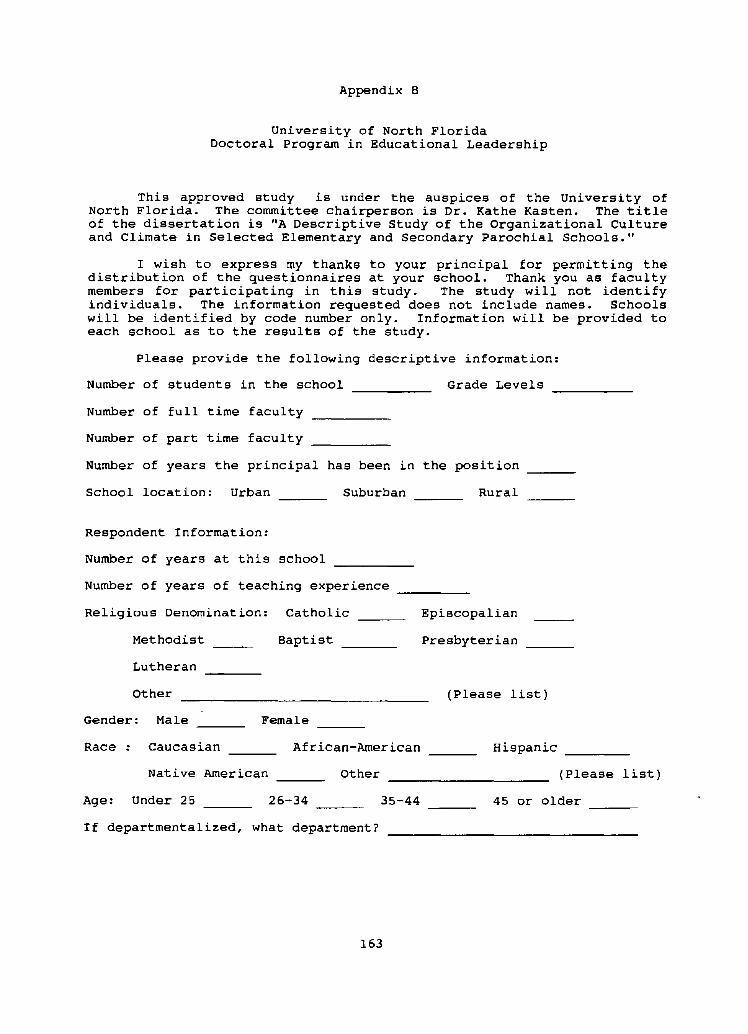
Appendix 8
University of North Florida Doctoral Program in Educational Leadership
This approved study is under the auspices of the University of North Florida. The committee chairperson is Dr. Kathe Kasten. The title of the dissertation is "A Descriptive study of the Organizational Culture and Climate in Selected Elementary and Secondary Parochial Schools."
I wish to express my thanks to your principal for permitting the distribution of the questionnaires at your school. Thank you as faculty members for participating in this study. The study will not identify individuals. The information requested does not include names. Schools will be identified by code number only. Information will be provided to each school as to the results of the study.
Please provide the following descriptive information:
Number of students in the school Grade Levels
Number of full time faculty
Number of part time faculty
Number of years the principal has been in the position
School location: Urban Suburban Rural
Respondent Information:
Number of years at this school
Number of years of teaching experience
Religious Denomination: Catholic Episcopalian
Methodist Baptist Presbyterian
Lutheran
Other (Please list)
Gender: Male Female
Race: Caucasian African-American Hispanic
Native American Other (Please list)
Age: Under 25 26-34 35-44 45 or older
If departmentalized, what department?
163
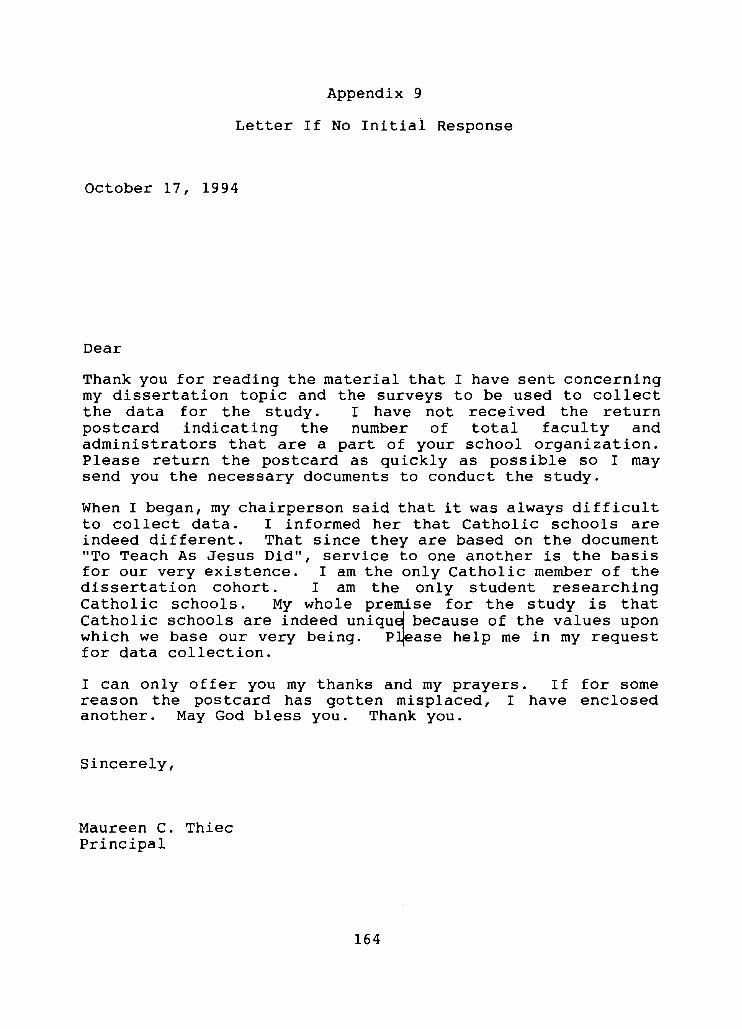
Appendix 9
Letter If No Initial Response
October 17, 1994
Dear
Thank you for reading the material that I have sent concerning my dissertation topic and the surveys to be used to collect the data for the study. I have not received the return postcard indicating the number of total faculty and administrators that are a part of your school organization. Please return the postcard as quickly as possible so I may send you the necessary documents to conduct the study.
When I began, my chairperson said that it was always difficult to collect data. I informed her that Catholic schools are indeed different. That since they are based on the document "To Teach As Jesus Did", service to one another is the basis for our very existence. I am the only Catholic member of the dissertation cohort. I am the only student researching Catholic schools. My whole premise for the study is that Catholic schools are indeed uniqu~ because of the values upon which we base our very being. p~ase help me in my request for data collection.
I can only offer you my thanks and my prayers. If for some reason the postcard has gotten misplaced, I have enclosed another. May God bless you. Thank you.
Sincerely,
Maureen C. Thiec Principal
164
Appendix 10
Individual School Profile
Report of Data
Collected From
The Cultural Value Analysis Tool (CVAT)
and
The Organizational Climate Description Questionnaire
165
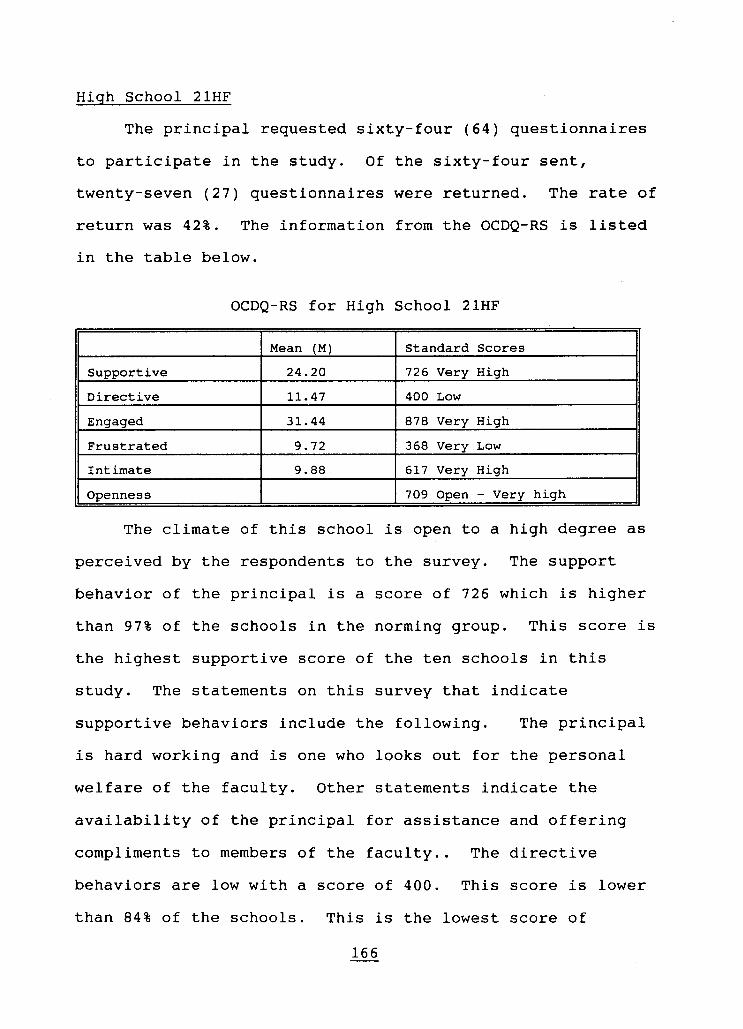
High School 21HF
The principal requested sixty-four (64) questionnaires
to participate in the study. Of the sixty-four sent,
twenty-seven (27) questionnaires were returned. The rate of
return was 42%. The information from the OCDQ-RS is listed
in the table below.
OCDQ-RS for High School 21HF
Mean (M) Standard Scores
Supportive 24.20 726 Very High
Directive 11.47 400 Low
Engaged 31.44 878 Very High
Frustrated 9.72 368 Very Low
Intimate 9.88 617 Very High
Openness 709 Open - Very high
The climate of this school is open to a high degree as
perceived by the respondents to the survey. The support
behavior of the principal is a score of 726 which is higher
than 97% of the schools in the norming group. This score is
the highest supportive score of the ten schools in this
study. The statements on this survey that indicate
supportive behaviors include the following. The principal
is hard working and is one who looks out for the personal
welfare of the faculty. Other statements indicate the
availability of the principal for assistance and offering
compliments to members of the faculty .. The directive
behaviors are low with a score of 400. This score is lower
than 84% of the schools. This is the lowest score of
166
directiveness in this study. The strongest directive
behavior indicated as a result of this survey is that the
principal does supervise the teachers closely.
The faculty members are highly engaged in the school
with a score of 878. This score is higher than 99% of the
schools in the normative survey. This score while very high
is the second highest of this study. The most noticeable
behavior as indicated on the survey is that the respondents
perceive that they are proud of their school and enjoy
working there. Additional statements on this survey that
support engaged behavior are the following. The morale is
high and faculty members are friendly with students and are
available to assist them. Faculty members are not
overburdened or frustrated with routine, administrative
tasks or committee assignments are statements on this survey
that are scored as frustration behaviors. The frustration
score is low with a score of 368. The statements that the
teachers support one another and enjoy each other's company
is the strongest response on the survey which is an
indicator for the intimacy score of 617. They are intimate
in their knowledge of family backgrounds and care about one
another are also survey statements that are intimate
behaviors. The climate of the school is open at a very high
level.
Valiq CVAT surveys totaled twenty-one.
167
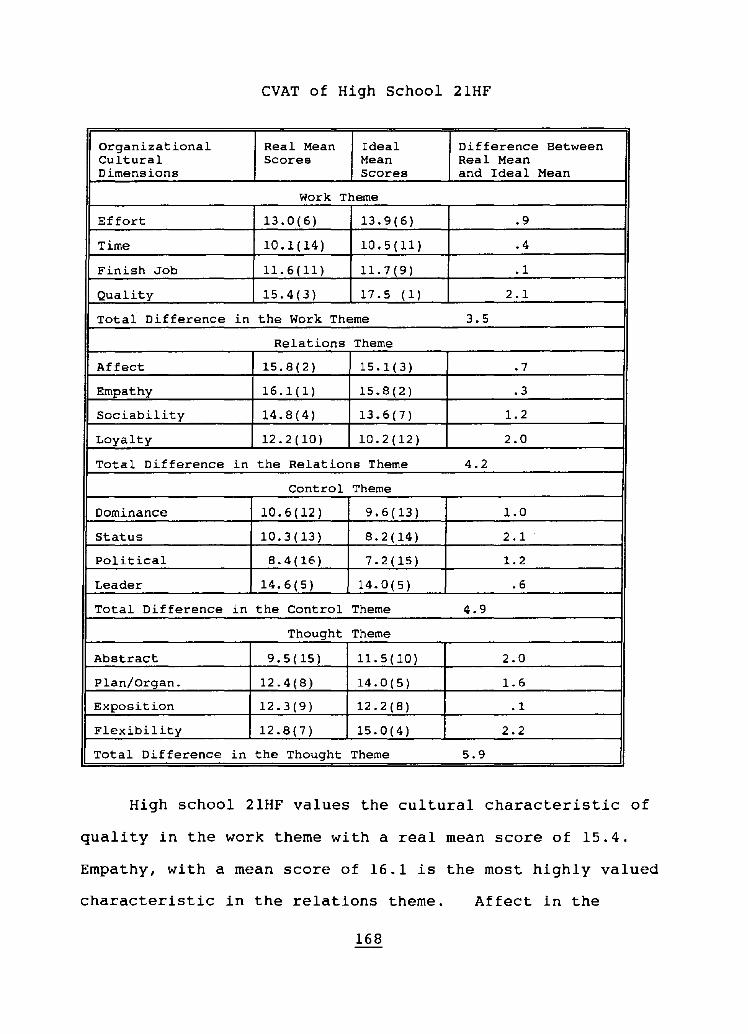
CVAT of High School 2lHF
Organizational Real Mean Ideal Difference Between Cultural Scores Mean Real Mean Dimensions Scores and Ideal Mean
Work Theme
Effort 13.0(6) 13.9(6) .9
Time 10.1(14) 10.5(11) .4
Finish Job 11.6(11) 11.7(9) .1
Quality 15.4(3) 17.5 (1 ) 2.1
Total Difference in the Work Theme 3.5
Relations Theme
Affect 15.8(2) 15.1(3) .7
Empathy 16.1(1) 15.8(2) .3
Sociability 14.8(4) 13.6(7) 1.2
Loyalty 12.2(10) 10.2(12) 2.0
Total Difference in the Relations Theme 4.2
Control Theme
Dominance 10.6(12) 9.6(13) 1.0
Status 10.3(13) 8.2(14) 2.1
Political 8.4(16) 7.2(15) 1.2
Leader 14.6(5) 14.0(5) .6
Total Difference in the Control Theme 4.9
Thought Theme
Abstract 9.5(15) 11.5(10) 2.0
Plan/Organ. 12.4(8) 14.0(5) 1.6
Exposition 12.3(9) 12.2(8) .1
Flexibility 12.8(7) 15.0(4) 2.2
Total Difference in the Thought Theme 5.9
High school 21HF values the cultural characteristic of
quality in the work theme with a real mean score of 15.4.
Empathy, with a mean score of 16.1 is the most highly valued
characteristic in the relations theme. Affect in the
168
relations theme is valued almost as highly with a score of
15.8. In the control theme, the cultural characteristic of
leader is most highly valued with a mean score of 14.6. The
thought theme indicates that flexibility is the cultural
characteristic most highly valued with a mean score of 12.8.
In the ideal situation, the normative mean scores
indicate that the members of this school would like to see a
more change in the cultural characteristics within the
thought theme with an overall change of 5.9. The members
value flexibility even more in the ideal situation with an
increase of 2.2 to the mean score. The cultural
characteristics in the control theme would differ by a
change in mean score of 4.9 with the greatest change
occurring in the characteristic of status (2.1). The
members of this high school envision a change in the
relations theme (4.2) with the quality of loyalty showing
the largest difference. Quality would continue to be the
cultural characteristic most preferred in the work theme
with a difference within the theme of 3.5.
169
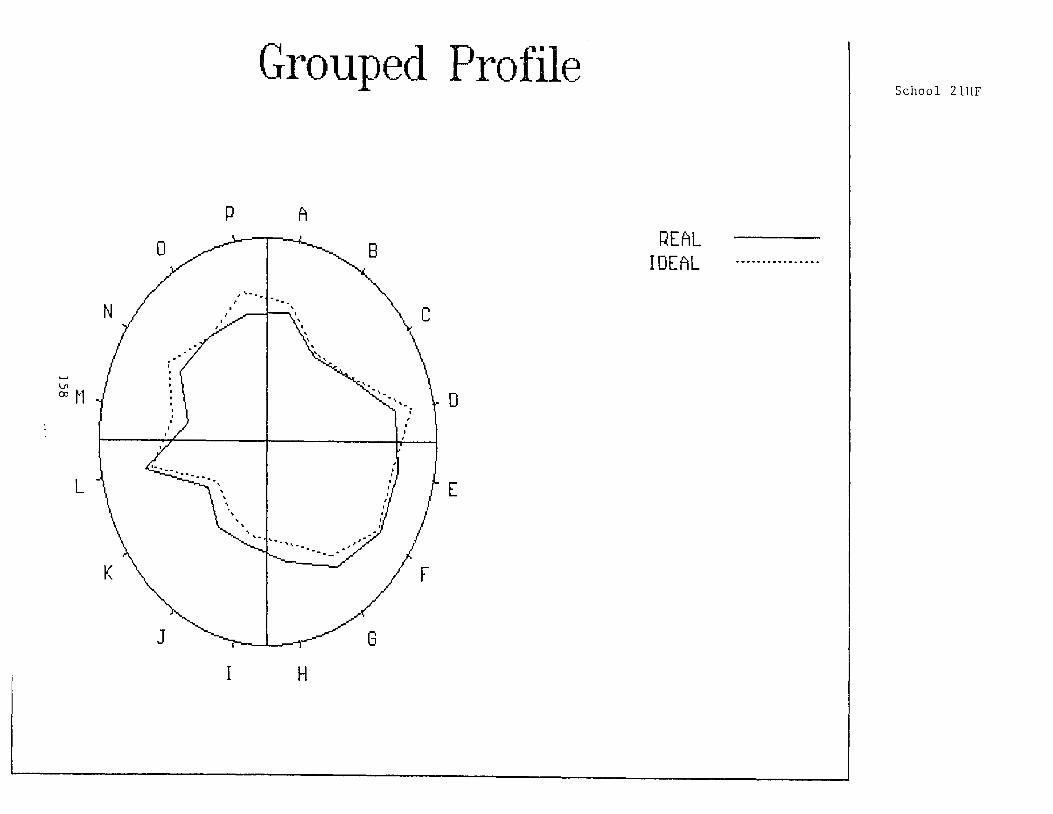
o w
, --
:::r:
158
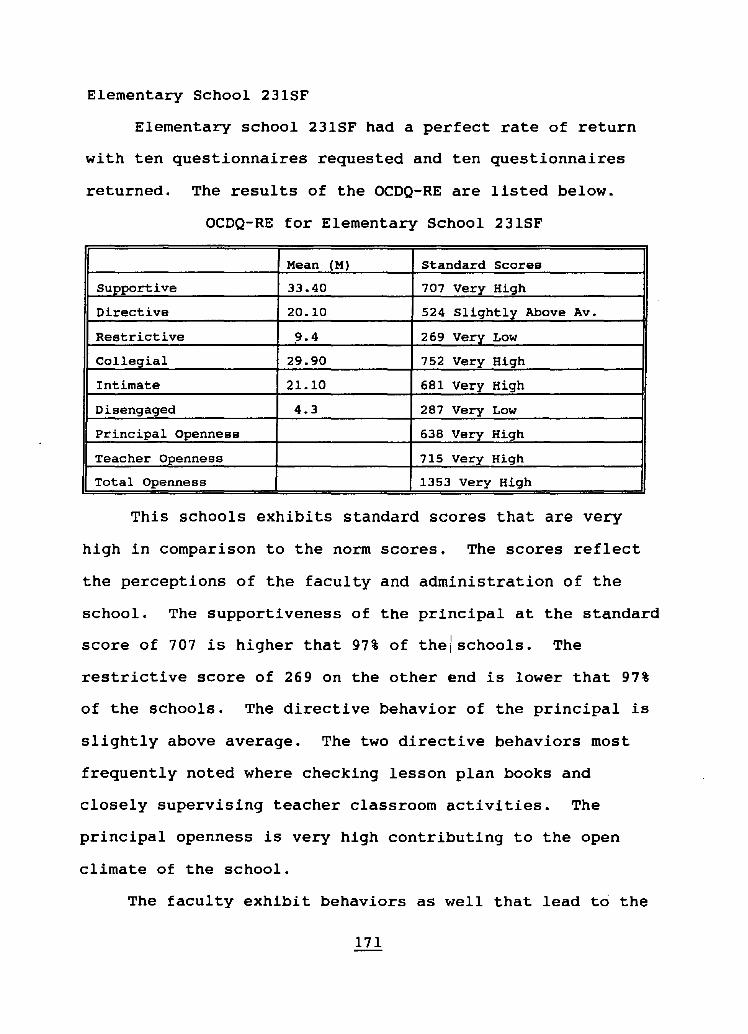
Elementary School 231SF
Elementary school 231SF had a perfect rate of return
with ten questionnaires requested and ten questionnaires
returned. The results of the OCDQ-RE are listed below.
OCDQ-RE for Elementary School 231SF
Mean (M) Standard Scores
Supportive 33.40 707 Very High
Directive 20.10 524 Slightly Above Av.
Restrictive ~.4 269 Very Low
Collegial 29.90 752 Very High
Intimate 21.10 681 Very High
Disengaged 4.3 287 Very Low
Principal Openness 638 Very High
Teacher Openness 715 Very High
Total Openness 1353 Very High
This schools exhibits standard scores that are very
high in comparison to the norm scores. The scores reflect
the perceptions of the faculty and administration of the
school. The supportiveness of the principal at the standard I score of 707 is higher that 97% of thejschools. The
restrictive score of 269 on the other end is lower that 97%
of the schools. The directive behavior of the principal is
slightly above average. The two directive behaviors most
frequently noted where checking lesson plan books and
closely supervising teacher classroom activities. The
principal openness is very high contributing to the open
climate of the school.
The faculty exhibit behaviors as well that lead to the
171
open climate of the school. The collegiality of the faculty
at a standard score of 752 is higher than that in 97% of the
schools. The intimacy score is almost two standard
deviations above the norm at 500 showing that the score is
at least 84% higher that the other schools in the norm
group. The disengaged behavior at 287 is lower that 97% of
the schools. The faculty exhibit a teachers openness score
that is very high at 715. The school has a total open
climate with faculty and principal working well together in
the school.
Elementary school 231SF returned all valid CVAT
surveys. All respondents completed the survey as directed.
The CVAT descriptive information is found in the following
table.
172
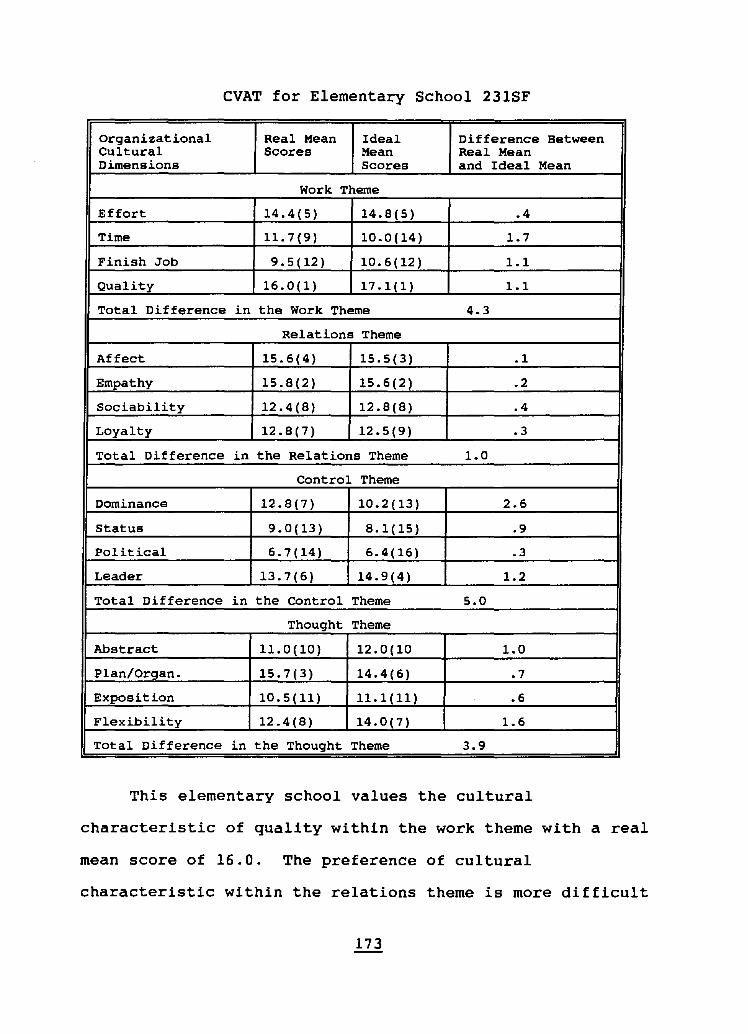
CVAT for Elementary School 231SF
Organizational Real Mean Ideal Difference Between Cultural Scores Mean Real Mean Dimensions Scores and Ideal Mean
Work Theme
Effort 14.4(5) 14.8(5) .4
Time 11.7(9) 10.0(14) 1.7
Finish Job 9.5(12) 10.6(12) 1.1
Quality 16.0(1) 17.1(1) 1.1
Total Difference in the Work Theme 4.3
Relations Theme
Affect 15.6(4) 15.5(3) .1
Empathy 15.8(2) 15.6(2) .2
Sociability 12.4(8) 12.8(8) .4
Loyalty 12.8 (7) 12.5(9) .3
Total Difference in the Relations Theme 1.0
Control Theme
Dominance 12.8(7 ) 10.2(13) 2.6
Status 9.0(13) 8.1(15) .9
Political 6.7(14) 6.4(16) .3
Leader 13.7(6) 14.9(4) 1.2
Total Difference in the Control Theme 5.0
Thought Theme
Abstract 11.0(10) 12.0(10 1.0
Plan/Organ. 15.7(3) 14.4(6) .7
Exposition 10.5(11) 11.1 (11) .6
Flexibility 12.4(8) 14.0 (7) 1.6
Total Difference in the Thought Theme 3.9
This elementary school values the cultural
characteristic of quality within the work theme with a real
mean score of 16.0. The preference of cultural
characteristic within the relations theme is more difficult
173
to determine with two mean scores as close as .2. Empathy
is valued with a real mean score of 15.8. Affect, in this
theme, has a mean score of 15.6. Within the control theme,
the characteristic of leadership is preferred with a real
mean score of 13.7. In the thought theme,
planning/organization is valued with a mean score of 15.7.
Comparing the real mean scores which indicate how my
school is to the ideal mean scores which indicate how I
would like my school to be, the differences indicate that
the greatest difference would take place within the control
theme, the work theme, and the thought theme. The control
theme would show a difference in mean score of 5.0 as
cultural preference declined most especially in dominance
(2.6). The work theme would show a difference of 4.3 with
the greatest discrepancy reflected in the dimension of time.
The thought theme would differ in mean score by 3.9 with the
greatest discrepancy in flexibility.
174
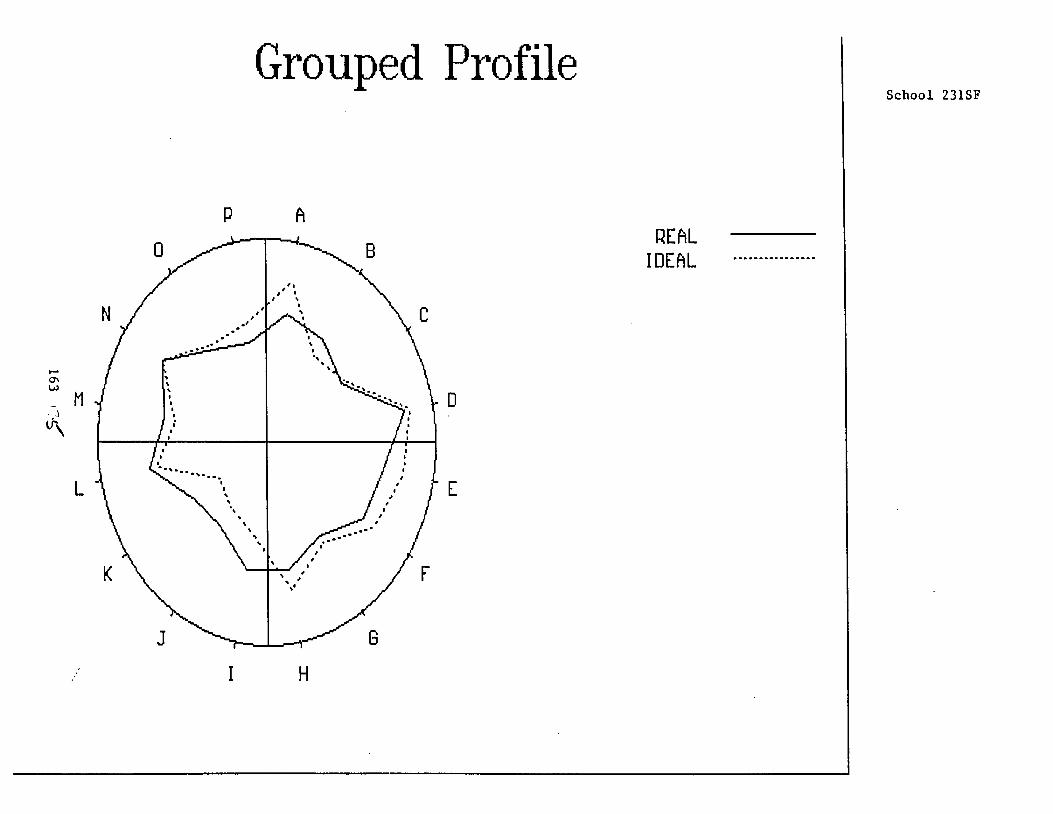
<J.) ..--4 • ....-4 ~
0 ~ ~
0 w
.-0 CJ.) 0-4 ~
0 ~ :r:
0 C
l. -
~
163 ,..,~
References
Adams, B., & Bailey, G. D. (1989). School is for teachers: Enhancing the school environment. N.A.S.S.P. Bulletin, 73(513), 44-48.
Akin, J. (1993). The effects of site culture on school reform. High School Magazine, 1(1), 29.
Bates, R. J. (1987). Corporate culture, schooling, and educational administration. Educational Administration Quarterly, 23(4), 79-115.
Blendiger, J., & Jones, L. T. to improve your schools. 22-25.
(1989). Start with culture School Administrator, 46(5),
Bolman, L. G., & Deal, T. E. (1991). Reframing organizations. San Francisco: Jossey-Bass Publishers.
Brigham, F. H. (1992). Catholic elementary and secondary schools: 1991-1992 annual statistical report on schools and staffing. Washington, D. C.: National Educational Association.
Brookover, W., Beady, B., Flood, C., Schweitzer, J., & Wisenbaker, T. ( 1979) . School social systems and student achievement: Schools can make a difference. New York: Praeger.
Bryk, A. S., & Holland, P. B. (1984a). Research provides perspectives on effective Catholic schools. Momentum, 15(3) 12-17.
Bryk, A. S., & Holland, P. (1984b). Effective Catholic Schools: An exploration. Washington, DC: National Catholic Educational Association.
Buetow, H. A. (1970). Of Singular benefit: The story of Catholic education in the United States. New York: The Macmillan Co.
Catholic schools in America. (1992). Washington, DC: Fisher Publishing Co.
Chance, E., & Grady, M. (1990). Creating a vision for the school. NASSP Bulletin, 12-17.
Chubb, J. E., & Moe, T. America's schools. Institution.
M. (1990). Politics, markets, and Washington, DC: The Brookings
176
Coleman, J. S. (1985). Schools and the communities they serve. Phi Delta Kappan, 66, 527-532.
Coleman, J. S. of youth.
(1987). Social capital and the development Momentum, 18(4), 6-8.
Coleman, J. S. (1989). Schools and communities. Chicago Studies, 28(3), 232-244.
Coleman, J. S. (1990). Equality and achievement in education. San Francisco: Westview Press.
Coleman, J., & Hoffer, T. (1987). Public and private high schools. New York: Basic Books, Inc.
Coleman, J., Hoffer, T., & Kilgore, S. (1981). High school achievement: Public, Catholic and private schools compared. New York: Basic Books, Inc.
Convey, J. J. (1986). Implications of the functional community for Catholic school parents. Momentum, 18(4), 14-15.
Convey, J. J. (1992). Catholic schools make a difference. Washington, DC: National Catholic Educational Association.
Cooper, M. (1988). Whose culture is it, anyway? In Lieberman, A. (Ed.), Building a professional culture in schools (pp. 45 -54). New York: Teachers College Press.
Corbett, H. D., Firestone, W. A., & Rossman, G. B. (1987). Resistance to planned change and the sacred in school cultures. Educational Administration Quarterly, 23(4), 36-59.
Coyle, L., & Witcher, A. (1992). Transforming the idea into action: Policies and practices to enhance school effectiveness. Urban Education, 26(4), 390-400.
Davis, J. (1987). Effective school, organization culture, and local policy initiatives. In Holmes, M., Leithwood, K., & Musella, D. (Eds.), Educational policy for effective schools (pp. 112-127). New York: Teachers College Press.
Deal, T. E., & Peterson, K. D. (1990). in shaping school culture. Government Printing Office.
177
The principal's role Washington, DC: U.S.
DeRoche, E. F. (1987). An administrator's guide for evaluating programs and personnel: An effective schools approach (2nd ed.). Boston: Allyn & Bacon.
Duignan, P. (1986). Research on effective schooling: Some implications for school improvement. Journal of Educational Administration, 24(1), 59-73.
Elmore, R. F. (1987). Reform and the culture of authority in schools. Educational Administration Quarterly, 23 (4) , 60-78.
Erickson, F. (1984). Conceptions of school culture: An overview. Educational Administration Quarterly, 23(4), 11-24.
Fichter, J. study.
H. (1958). Parochial school: A sociological Notre Dame: University of Notre Dame Press.
Firestone, W., & Herriott, R. (1982). Prescriptions for effective elementary schools don't fit secondary schools. Educational Leadership, 40(3), 51-53.
Firestone, W., & Wilson, B. (1985). Using bureaucratic and cuI tural linkages to improve instruction: The principal's contribution. Educational Administration Quarterly, £.!(2), 7 - 30.
Fisher, R. A., & Yates, F. (1938). Statistical tables for biological, agricultural and medical research. Edinburgh, London: Oliver and Boyd Ltd.
Fuller, B., & Izu, J. (1986). Explaining school cohesion: What shapes the organizational beliefs of teachers? American Journal of Education, 94(4), 501-535.
Gopalan, S. (1991). An empirical investigation of the relationship between organizational and national cultures in the United States, Brazil, and India. Unpublished doctoral dissertation, Louisiana Tech University, Louisiana.
Grant, G. (1988). The world we created at Hamilton High. Cambridge, MA: Harvard University Press.
Greeley, A. M. (1969) . Catholic high schools and the secular city. In Shaw, R., & Hurley, R. J. (Eds.), Trends and issues in Catholic education (pp. 83-93). New York: Citation Press.
Greeley, A. M. (1989). My research on Catholic schools. Chicago Studies, 28(3), 245-263.
178
Greeley, A. M., McCready, W. C., & McCourt, K. (1976). Catholic schools in a declining church. Kansas City: Sheed & Ward.
Greeley, A. M. & Rossi, P. H. (1966). The education of Catholic Americans. Chicago: Aldine Publishing Company.
Guerra, M. J. (1991). Liqhting new fires: Catholic schooling in America 25 years after Vatican II. Washington DC: National Catholic Educational Association.
Guerra, M. J., Donahue, M. J., & Benson, P. L. (1990). The heart of the matter: Effects of Catholic high schoolson student values, beliefs and behaviors. Washington, DC: National Catholic Educational Association.
Gutmann, A. ( 1989) . Democratic theory and the role of teachers in democratic education. In J. Hannaway, & R. Crowson, (Eds.), The politics of reforming school administration (pp.183-199). New York: Fa1mer Press.
Hafner, A., Ingels, S., Schneider, B., & Stevenson, D. (1990). A profile of the American eighth grader: NELS: 88 students' descriptive summary. Washington, DC: National Center for Education Statistics.
Holmes, M. (1987). School effectiveness: From research to implementation to improvement. In M. Holmes, K. Leithwood, & D. F. Musella (Eds.), Educational policy for effective schools (pp. 3-30). Ontario: Ontario Institute for Studies in Education.
Hoy, W. K., Tarter, C. J., & Kottkamp, R. B. (1991). Open schools/healthy schools. Newbury Park, CA: Sage Publications.
Johnston, J. H. (1987). Values, culture, and the effective school. NASSP Bulletin, 11(497), 79-88.
Kaest1e, C. (1991). The public schools and the public mood. In R. Long (Ed.), The state of u.S. education (pp. 14 -28), New York: H.W. Wilson Company.
Koob, C. A. (Ed.). (1966). What is happeninq to Catholic education? Washington, DC: National Catholic Educational Association.
Lane, B. (1992). Cultural leaders in effective schools: The builders and brokers of excellence. NASSP Bulletin, 76(541), 85-96.
179
Leithwood, K., Begley, P., & Cousins, J. (1990). The nature, causes and consequences of principals' practices: An agenda for future research. Journal of Educational Administration, 28(4), 5-31.
Levine, M. (1986). Excellence in education: America's best-run companies and schools. Journal of Education, 63(2), 150-186.
Lessons from Peabody
Lightfoot, S. L. (1983). The qood hiqh school: Portraits of character and culture. New York: Basic Books, Inc.
Louis, K. S. (1993). Professional cultures and reforming schools. In J. Murphy & P. Hallinger (Eds.), Restructuring schooling: Learning from ongoing efforts (pp. 216 - 250). Newbury Park, CA: Corwin Press, Inc.
Louis, K. S., & Miles, M. B. (1990). Improving the urban high school. New York: Teachers College Press.
)
Malone, J. (1989). The religious dimension of Catholic education. Chicago Studies, 28(3), 264-276.
Maxwell, T. & Thomas, A. (1991). School climate and school culture. Journal of Educational Administration, 29(2), 72 - 82.
McCarren, E. P. (1969). Catholic education: Let's get down to facts. In Shaw, R. & Hurley, R. J. (Eds.), Trends and issues in Catholic education (pp. 57-73). New York: Scholastic Magazines, Inc.
McCluskey, N. G. (Ed.). (1964). Catholic education in America: A documentary history. New York: Teachers College Press.
McCoy, R. F. (1961). American school administration: Public and Catholic. New York: McGraw Hill.
McCurdy, J. (1983). The role of the principal in effective schools: Problems and solutions. Sacramento, CA: Education News Service.
McDermott, E. J. ( 1986) . Distinctive guali ties of the Catholic schools. Washington, DC: National Catholic Educational Association.
McNamee, C. T. (1986). future. Momentum,
Preparing Catholic teachers for the 11'(3), 3.
180
Mulkeen, T., Marcus, S., & Finkel, L. (1986). Administrative decision making in schools: A case-study approach to
. strategic planning. New York: Oceana Publications, Inc.
Murphy, J. (1993). Restructuring: In search of a movement. In J. Murphy & P. Hollinger (Eds.), Restructuring schooling: Learning from ongoing efforts (pp. 1-31). Newbury Park, CA: Corwin Press.
Nelson, R. E. (1990). Diagnosing individual values and organizational culture: An introduction to the CVAT Methodologies. Unpublished manuscript.
Neuwien, R. (Ed.). (1966). Catholic Schools in action: The Notre Dame study of Catholic elementary and secondary schools in the United States. Notre Dame, ID: University of Notre Dame Press.
Peters, T. J . , excellence.
& Waterman, R. H. (1982). New York: Harper & Row.
In search of
Purkey, S. C., & Smith, N. S. (1982). Too soon to cheer? Synthesis of research on effective schools. Educational Leadership, 40, 64-69.
Purkey, S.C., & Smith, N. (1985). School reform: The district policy implications of the effective schools literature. Elementary School Journal, 85(3), 353-389.
Putka, G. (1991, March 28). Back to basics: Education reformers have new respect for Catholic schools. The Wall Street Journal, pp. 1, 8.
Raftery, F. (1985). The teacher in the Catholic school. Washington DC: National Catholic Educational Association.
Ravitch, D. (1983). A troubled crusade: American education, 1945-1980. New York: Basic Books.
Reavis, C. (1990). Utilizing curriculum, classroom practice, culture and climate. NASSP Bulletin, 74(529), 39-43.
Restine, L. N. (1993). Women in administration: Facilitators for change. Newbury Park, CA: Corwin Press, Inc.
Rokeach, M. (1968). Beliefs, attitudes and values: A theory of organization and change. San Francisco: Jossey-Bass.
Rokeach, M. (1973). The nature of human values. New York: Free Press.
181
Rutter, M., Maughan, B., Mortimore, P., Dutson, J., & Smith, A. (1979). Fifteen thousand hours: Secondary schools and their effects on children. Cambridge, MA: Harvard University Press.
Saphier, J., & King, M. (1985). Good seeds grow in strong cultures. Educational Leadership, 42(6), 67-74.
Schein, E. H. (1983). The role of the founder in creating organizational culture. Organizational Dynamics, 13-28.
Schein, E. H. (1985). Organizational culture leadership. San Francisco: Jossey-Bass.
and
Schlecty, P. (1990). Schools for the twenty-first century. San Francisco: Jossey-Bass Publishers.
Schultz, E. W., Glass, R. M., & Kamholtz, J. D. (1987). School climate: Psychological health and well-being in school. Journal of School Health, 57(10), 432-436.
Sergiovanni, T. schooling.
(1984). Leadership and excellence in Educational Leadership, 41(5), 4-13.
Sergiovanni, T. (1987). The principalship: A reflective practice perspective. Boston: Allyn and Bacon.
Sergiovanni, T. (1990). Value-added leadership: extraordinary performance in schools. Harcourt, Brace, Jovanovich Publishers.
How to get New York:
Seyfarth, J. T. (1991). Personnel management for effective schools. Boston: Allyn & Bacon.
Shaw, R., & Hurley, R. J. (Eds.). (1969). Trends and issues in Catholic education. New York: Citation Press.
Shuster, G. world.
N. (1967) . Catholic education in a changing New York: Holt, Rinehart and Winston.
Simpson, G. W. (1990). Keeping it alive: Elements of school cuI ture that sustain innovation. Educational Leadership, 47(8),34-37.
Sizer, T. (1985). Horace's compromise: The dilemma of the American high school. Boston: Houghton Mifflin.
Stevens, M. P. (1990). School climate and staff development: Keys to school reform. N.A.S.S.P. Bulletin, 74(529), 66-70.
182
Sweeney, J. (1991). Developing a strong culture: Leadership holds the key. Educational Considerations, 18(2), 15-18.
Sweeney, J. (1992). School climate: The key to excellence. N.A.S.S.P Bulletin, 76(547), 69-73.
Sykes, G., & Elmore, R. (1989). Making schools manageable: Policy and administration for tomorrow's schools. In J. Hannaway & R. Crowson (Eds.), The politics of reforming school administration (pp. 77 - 94). New York: Fa1mer Press.
Taylor, A., & Valentine, B. (1985). What research says about effective schools (Report No.1). Washington, DC: National Education Association.
Thomson, S. (1989). Commentary. In J. Hannaway & R. Crowson (Eds.), The politics of reforming school administration (pp. 201 - 218). New York: Falmer Press.
Townsend-Butterworth, D. (1992). Ten common denominators of effective schools. Principal, 72(1), 40-42.
Ubben, G. C., & Hughes, L. W. (1987). The principal: Creative leadership for effective schools. Boston: Allyn & Bacon.
United States Catholic Conference, Inc. (1973). To teach as Jesus did (Research Rep Nov. 1972). Washington, DC: Natio~al Conference of Catholic Bishops.
Vatterott, C. (1994). A change in climate: Involving parents in school. Schools in the Middle, 1(3), 12-16.
Webber, C. F., & Skau, K. G. (1992). Effective school districts: Some key components. Educational Considerations, ~(2), 49-51.
Wilmore, E. L. (1992). The "affective" middle level school: Keys to a nurturing school climate. Schools in the Middle, !(4), 31-34.
Wilson, B., & Corcoran, T. schools: Visions of education. New York:
(1988) . Successful secondary excellence in American public
Falmer Press.
Wirt, F. M., & Kirst, M. W. (1989). Schools in conflict. Berkeley: McCutchen.
Witcher, A. E. (1993). Assessing school climate: An important step for enhancing school quality. N.A.S.S.P. Bulletin, 12(554), 1-5.
183
Vita
Maureen C. Thiec RD 1 - Box 1696
Brodbecks, Pennsylvania 17329
Professional Employment
Delone Catholic High School, McSherrystown, Pennsylvania Principal - 1992 - Present
Resurrection Parish School, Jacksonville, Florida Principal - 1988-1992
Prince of Peace Catholic Church, Jacksonville, Florida Director of Religious Education - 1987-1988
Chappell School, Jacksonville, Florida Principal - 1981-1987
Chappell School, Jacksonville, Florida Science Teacher - 1978-1981
Education
University of North Florida, Jacksonville Ed. D - Summer, 1995 Major: Educational Leadership
M. Ed. - 1981 Major: Administration and Supervision
St. Francis College, Loretto, Pennsylvania B.S. - 1970 Major: Biology
Dulaney High School, Timonium, Maryland 1966 Major: College Prep
Personal
Date of Birth
Marital Status
Married twenty-five years Mother of four Michele, 24 Brent, 22 Keith, 19 Devin, 11
Recommended