Embed Size (px)
Citation preview

Running head: ORGANIZATIONAL CULTURE i
ORGANIZATIONAL CULTURE UNDER
THE SANCTUARY MODEL: A DESCRIPTIVE STUDY
By
Danielle L. Vacco
A thesis submitted by the Faculty of D'Youville College
Division of Academic Affairs in partial fulfillment of the requirements
for the degree of
Master of Science
in
Health Services Administration
Buffalo, NY
November 9,2012

UMI Number: 1521867
All rights reserved
INFORMATION TO ALL USERS The quality of this reproduction is dependent upon the quality of the copy submitted.
In the unlikely event that the author did not send a complete manuscript and there are missing pages, these will be noted. Also, if material had to be removed,
a note will indicate the deletion.
UMI 1521867
Published by ProQuest LLC 2012. Copyright in the Dissertation held by the Author. Microform Edition © ProQuest LLC.
All rights reserved. This work is protected against unauthorized copying under Title 17, United States Code.
ProQuest LLC 789 East Eisenhower Parkway
P.O. Box 1346 Ann Arbor, Ml 48106-1346

ORGANIZATIONAL CULTURE ii
Copyright (c) 2012 by Danielle L. Vacco. All rights reserved. No part of this thesis may be copied or reproduced in any form or by any means without written permission of Danielle L. Vacco.

Organizational Culture
in
THESIS APPROVAL
Thesis Committee Chairperson
Name:
Discipline:„
Committee Members
Name:
Discipline:
Name: P̂ -X? dD-Discipline:. V»(eTfe-/)lo
Thesis defended
on
November 9,2012

Organizational Culture
iv
Abstract
This study described the organizational culture of an agency that uses the
sanctuary model. The culture was described through a four-variable survey tool
which reviewed employee perceptions of involvement, consistency, adaptability,
and mission. The Organizational Culture Survey was distributed to 196
employees. Results of 42 respondents were analyzed to describe the
organization's culture and to review this organization's culture compared to a
database of other organizations who had used the Organizational Culture Survey
to describe their culture. The results of the study concluded that the organization
performed slightly above average. Performance levels were validated by ranking
above the 50th percentile in each cultural trait area and conclusions were made for
areas of improvement for the organization.

Organizational Culture
v
Acknowledgment
I would first like to recognize and thank Dr. Elizabeth Miranda for her
dedication and guidance throughout this thesis and throughout the Health Services
Administration program at D'Youville. I am forever in debt to the hard work and
time that Dr. Miranda spent in guiding me throughout this process. I would also
like to thank Dr. Judith Schiffert and Dr. Edward Weiss for their feedback and
commitment to helping me achieve this task.
I would also like to thank my family and friends for their support
throughout this process. I am particularly grateful to my parents, Louise and
Vincent, for their encouragement throughout this process and throughout the
years. Thank you.
Organizational Culture
vi
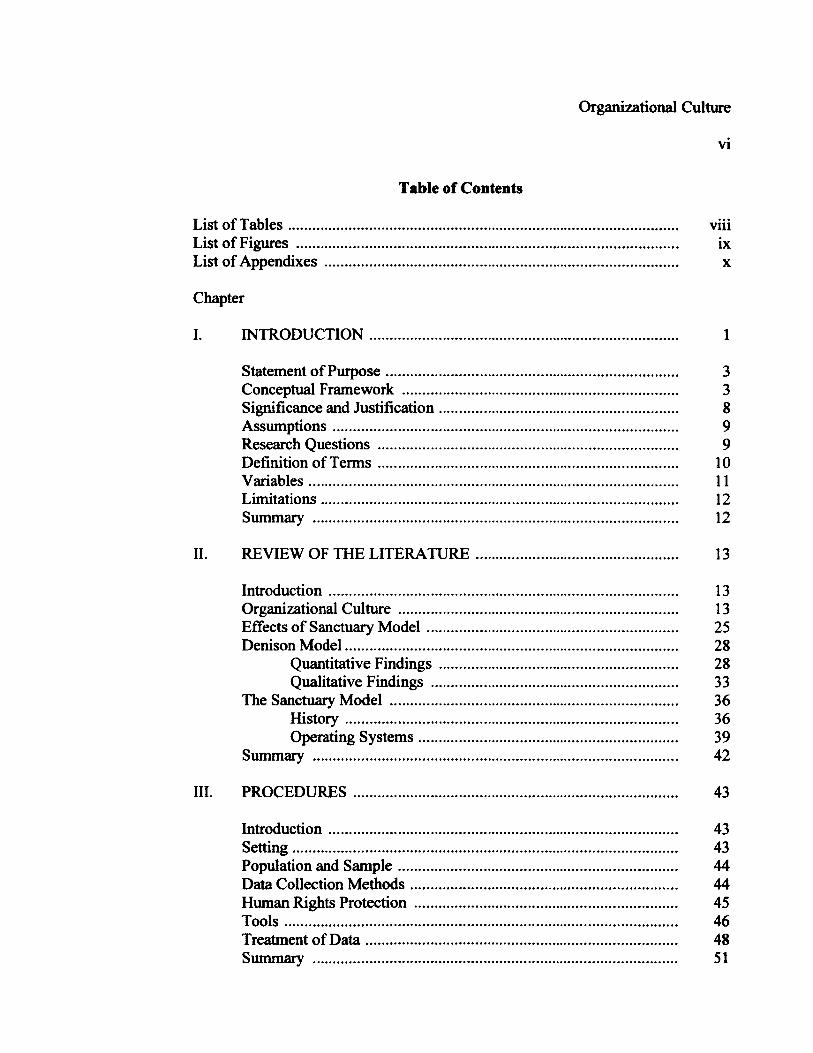
Table of Contents
List of Tables viii List of Figures ix List of Appendixes x
Chapter
I. INTRODUCTION 1
Statement of Purpose 3 Conceptual Framework 3 Significance and Justification 8 Assumptions 9 Research Questions 9 Definition of Terms 10 Variables 11 Limitations 12 Summary 12
II. REVIEW OF THE LITERATURE 13
Introduction 13 Organizational Culture 13 Effects of Sanctuary Model 25 Denison Model 28
Quantitative Findings 28 Qualitative Findings 33
The Sanctuary Model 36 History 36 Operating Systems 39
Summary 42
III. PROCEDURES 43
Introduction 43 Setting 43 Population and Sample 44 Data Collection Methods 44 Human Rights Protection 45 Tools 46 Treatment of Data 48 Summary 51

Organizational Culture
vii
IV. RESULTS 52
Introduction 52 Description of the Sample 52 Research Questions 53
Research Question 1 53 Research Question 2 53 Research Question 3 53 Research Question 4 57 Research Question 5 57 Research Question 6 57 Research Question 7 57
Summary 63
V. DISCUSSION 64
Summary 64 Conclusion 67
Relationship of the Results to the Conceptual Framework .. 67 Relationship of the Results to the Literature 68 Relationship of the Results to the Research Questions 72 Relationship of the Results to the Variables 78 Relationship of the Results to the Study Design 78 Relationship of the Results to the Tools 79 Relationship of the Results to the Data Analysis Methods .. 79
Implications for Management 80 Recommendations for Future Research 82
References 85 Appendixes 90

Organizational Culture
viii
List of Tables
Table
1. Adaptability Results 54
2. Involvement Results 55
3. Consistency Results 56
4. Mission Results 58
5. Internally versus Externally Focused 59
6. Flexible versus Stable 60

Organizational Culture
ix
List of Figures
Figure
1. The Denison Model Circumplex 4
2. The Denison Model Circumplex Percentiles 61

Organizational Culture
x
List of Appendixes
Appendix
A. Request for Approval Email to Denison and Permission from Denison for Use of Survey 90
B D'Youville College Institutional Review Board Full Approval Letter 93
C Permission Request to Agency 95
D Permission Letter from Agency 97
E Emailed Letter of Invitation 99
F Cover Letter Attached to Emailed Survey 101
G One-Week Deadline Email Reminder 103
H Final Email Notice 105
I Organizational Culture Survey 107

Organizational Culture
1
CHAPTER I
INTRODUCTION
For the last several hundred years, health service organizations have been
viewed as machines with interchangeable parts. These mechanistic type models
of organization lacked feeling/emotions and exemplified authority and power as
centralized, bureaucratic, and hierarchical (Bloom & Farragher, 2011). Not until
the 1940s, when general systems theory emerged, was it realized that a
mechanistic perspective of organizational function was oversimplified. General
systems theory, defined as "a set of interrelated elements that respond predictably
and interact with each other consistently over time" (Bloom & Farragher, 2011, p.
10), recognized organizations as having many interrelated components and thus
identified organizations as living.
With the exploration of this new concept of systems as living, a better
understanding of the many interconnected components of health systems began to
become transparent. One such understanding was that of the operating system,
known as organizational culture that binds the many interconnected components
of health service organizations (Bloom & Farragher, 2011; Marcoulides & Heck,
1993).

Organizational Culture
2
Culture can present itself tangibly in an organization as visible symbols,
slogans, languages, behaviors, histories and stories, dress codes, and rituals and
ceremonies (Mobley, Wang, & Fang, 2005). Though when a group of individuals
develop common traditions, rites, and history, more intangible signs of culture
emerge such that the work group begins to work in an almost habitual or taken-
for-granted way to achieving unitary objectives, core values, beliefs, and
assumptions (Bloom & Farragher, 2011; Mobley et al., 2005). Organizational
culture is therefore defined as a set of values, beliefs, common understanding,
thinking, and norms for behavior that are shared by all members (Marcoulides &
Heck, 1993; Mobley et al., 2005). These traits of organizational culture provide
the foundation or underlying assumptions, strategies, goals, and direction of the
organization thus often being referred to as the operating system of the
organization (Bloom & Farragher, 2011). Because organizational culture has
been identified as the operating system which guides the functioning and
establishes the identity of an organization, organizational models have emerged to
help structure the more unconscious/habitual elements of organizational culture
(Bloom & Farragher, 2011).
One such recognized organizational model which provides a framework
designed to help foster the culture of an organization is the sanctuary model.
What began as a therapeutic milieu to treat traumatized clientele, expanded into
an organizational change model designed to guide the development of structures,
processes, and behaviors of the staff, clients, and community (Bloom &
Organizational Culture
3
Farragher, 2011). It does this by presenting basic principles, known as the seven
commitments; creating a shared language, known as the SELF framework; and by
providing concrete tools for intervention including community meetings, red flag
reviews, self-care planning, safety plans, team meetings, and so on. As an
integrated theory system, the sanctuary model represents a "theory-based, trauma-
informed, evidence-supported, whole culture approach that has a clear and
structured methodology for creating or changing an organizational culture"
("Sanctuary Model," 2012a).
Statement of Purpose
This study aimed to measure the levels of adaptability, mission,
involvement, and consistency of a multi-disciplinary organization that utilizes the
sanctuary model as a system of organizational change.
Conceptual Framework
This study used a conceptual framework developed by Denison, Janovics,
Young, and Cho (2006) called the organizational culture model (OCM) (see
Figure 1). The OCM focuses on four main traits of organizational culture
including involvement, consistency, adaptability, and mission (Denison et al.,
2006). These traits were chosen as the basis for the model, by the model's
developers, based on literature showing similarities between the traits and their
relationship to organizational effectiveness (Denison, 1990; Denison & Mishra,
1995; Gordon & DiTomaso, 1992; Kotter & Heskett, 1992; Sorenson, 2002). The
traits are similar in that they are all based on functionalist and phenomenological

Organizational Culture
4
Figure 1. The Denison Model Circumplex.
Note. Permission to use this diagram can be found in Appendix A.

Organizational Culture
5
perspectives of organizations, with the functionalist perspective referring to the
innate beliefs and patterns of behavior of an organization and the
phenomenological perspective referring to the secondary phenomenon resulting
from the organization's beliefs and patterns (Denison & Mishra, 1995).
The four traits interrelate according to the sets of tensions or
contradictions that are often associated with many contemporary models of
leadership and organizational effectiveness, such as the trade-off between stability
and flexibility of an organization and the trade-off between an internal and
external focus (Denison et al., 2006). For example, when considering the trade
off between internal and external focus, mission and adaptability describe the
traits that determine the ability of an organization to externally adapt; while
involvement and consistency describe the traits that determine the ability of an
organization to internally integrate policies/procedures/values. On the other hand,
when considering the trade-off between stability and flexibility, consistency and
mission are traits that describe the capacity for an organization to remain stable
and predictable; while adaptability and involvement are the traits that describe the
capacity of an organization to change. From these similarities and relationships,
four hypotheses were created and found to be true throughout the literature
(Denison et al., 2006).
Hypothesis 1: Effective organizations tend to be those that "build their
organization around teams, empower and engage staff, and develop human
capability at all levels" (Denison et al., 2006, p. 6).

Organizational Culture
6
Hypothesis 2: Effective organizations are "consistent, well integrated and
are based on consensual governance" (Denison et al., 2006, p. 6).
Hypothesis 3: The better able an organization is "to create change, the
greater the ability to survive and grow" (Denison et al., 2006, p. 7).
Hypothesis 4: Successful organizations are those that have "defined goals
and objectives and have an expressed vision for the future" (Denison et al., 2006,
p. 8).
Based on these hypotheses and conceptual framework, Denison et al.
(2006) presents the four main traits of the OCM: involvement, consistency,
adaptability, and mission. Involvement is an important trait of organizational
culture because it describes the commitment that organizational members have to
their work. It fosters the level to which employees feel they have input into
decisions affecting their work and determines the level to which employees feel
their work is connected to the goals of the organization (Denison et al., 2006).
Consistency is additionally an important trait of organizational culture
because it is a source of stability for the organization. For example, organizations
that are well coordinated and integrated tend to have highly committed
employees, tendency to promote from within, and a clear set of do's and don'ts.
These characteristics cause an organization to form a distinct method/way of
doing business; thereby creating core values for the organization (Denison et al.,
2006).

Organizational Culture
7
Adaptability allows the organization to translate the demands of the
environment into action. Organizations that have the capacity to receive,
interpret, and translate the demands of the environment improve the
organization's chances of survival because of their ability to continuously change
and improve the organization's ability to serve their clientele. Therefore,
adaptability is an integral part of an organization's culture since it allows for
learning and change within the organization (Denison et al., 2006).
The organizational culture trait of mission is additionally important
because it provides a purpose and meaning to the work that an organization does.
Mission shapes the behavior of the organization by providing a clear direction and
provides goals that determine how employees work day to day. An organizational
culture that internalizes the mission of the organization is also advantageous since
research has shown that being able to identify with an organization's mission
contributes to the commitment employees feel to the organization (Denison et al.,
2006).
Denison et al. (2006) created a tool to measure the four traits of
involvement, consistency, adaptability, and mission within health care
organizations. The tool measures characteristics of involvement through feelings
of authority, initiative, and ability to manage work; team orientation; and
capability development, which is measured by the amount an organization invests
in enhancing employee skills. Consistency is measured by the core values or the
level to which employees feel they share a set of values; agreement, or the level to

Organizational Culture
8
which employees feel they can reach agreement on issues that arise, and
coordination and integration; meaning that all departments are able to work
together to achieve a common goal. Adaptability is measured in terms of the
organization's ability to create change, the organization's ability to understand
and react to their customers, and the organization's ability to interpret its
environment and change accordingly. Lastly, mission is measured by the extent
to which an organization's purpose is clear to employees, also referred to as
strategic direction and intent; the level to which the goals and objectives can be
linked to the company's mission, vision, and strategy; and possession of a clear
vision of the desired future of the organization. Ultimately, the survey tool can be
used to assess the four hypotheses of the OCM framework. The survey tool was
used to review the adaptability, consistency, involvement, and mission of the
organizational culture at the agency where this study was being performed.
Significance and Justification
Administration at this multi-disciplinary organization began
implementation of the sanctuary model in 2008. Administration has since
commenced in teaching the training modules to its employees. The modules help
to provide employees with the tools to help themselves as well as their clients to
heal from traumatic experiences. The sanctuary model, along with
administration, claim that the model produces a culture that can effectively
provide a cohesive context in which healing from traumatic experiences can be
addressed; though, no measures of organizational culture have been reviewed at

Organizational Culture
9
this organization to conclude if the organizational culture is effective ("Sanctuary
Model," 2012b). As commonly known, organizational culture evolves through
the development of common traditions, rites, and history of the employees;
therefore, it is significant to describe the culture from an employee viewpoint due
to the fact that organizational culture evolves from the employees. Therefore, this
descriptive study described the effectiveness of the culture of a specific
organization utilizing the sanctuary model through the perspective of the
employees. On a larger scale, organizational culture is an important attribute to
review due to its influential nature on quality care of care outcomes and
organizational performance outcomes. Therefore this study contributed to the
field of organizational culture by providing an outline for companies to review
their organizational culture.
Assumptions
For purposes of this study, it was assumed that participants will answer
honestly on the survey questions presented. It was additionally assumed that
humans interact with their environment and that this interaction makes a
difference in employees' perceptions of organizational culture.
Research Questions
The research questions for this study were as follow: At a
multidisciplinary organization which services children and where the sanctuary
model has been adopted:
1. What is the level of adaptability of the organization?

Organizational Culture
10
2. What is the level of involvement of the organization?
3. What is the level of consistency of the organization?
4. What is the level of understanding of the mission of the organization?
5. Is the organization internally or externally focused?
6. Is the organization flexible or stable?
7. How does the organizational culture of a sanctuary-based organization
compare to the database of organizations using other models of operations?
Definition of Terms
The terms in the research were defined theoretically and operationally.
1. Adaptability—is theoretically defined as translating the demands of the
business environment into action ("Denison Organizational," 2011); and
operationally defined as the manifestation of creating change, customer focus, and
organizational learning as represented in questions 31 through 45 on the
Organizational Culture Survey.
2. Consistency—is theoretically defined as the values and systems that are
the basis of a strong culture ("Denison Organizational," 2011), thereby translating
to the ability to maintain a standard resulting in harmony between parts.
Operationally defined as the manifestation of core values, agreement, and
coordination and integration as represented in questions 16 through 30 on the
Organizational Culture Survey.
3. Involvement-is theoretically defined as building human capability;
ownership and responsibility refers to the feeling that one is part of something

Organizational Culture
11
larger ("Denison Organizational," 2011). Operationally defined as the
manifestation of empowerment, team orientation, and capability development as
represented in questions 1 through 15 on the Organizational Culture Survey.
4. Mission—is theoretically defined as a meaningful long-term direction for
the organization ("Denison Organizational," 2011); therefore, consists of guiding
principles designed to meet defined goals. Operationally defined as the
manifestation of strategic direction and intent, goals and objectives, and vision as
represented in questions 46 through 60 on the Organizational Culture Survey.
5. Multi-disciplinary organization—refers to an organization that
incorporates a variety of disciplines (i.e., occupational therapy, physical therapy,
counseling, special education, etc.). Operationally defined as the organization at
which the research was conducted.
6. Sanctuary model—is theoretically defined as a trauma informed template
for system change based on seven dominant characteristics, all of which serve to
heal individuals from trauma while creating a safe environment for clients,
families, staff, and administrators (National Child Traumatic Stress Network,
2008). Operationally defined as an organizational change model implemented at
the business at which this research took place.
Variables
Variables to be described include the four main traits of the circumplex:
involvement, consistency, adaptability, and mission.

Organizational Culture
12
Limitations
A limitation of survey design applies to this study; participants' responses
are bound by the survey structure and content. Another limitation originates from
the fact that the study was conducted in one multi-disciplinary organization based
in Western New York (WNY). Survey data was not available prior to the
implementation of the sanctuary model at the organization where the study was
conducted. Therefore, conclusions cannot be made about how the culture may
have changed. The culture can be described only at this point in time.
Additionally, it is unknown whether the Denison database of companies to which
the data collected in this study are compared is limited to health care
organizations only.
Summary
Chapter I introduced the problem and purpose of the research. The
conceptual framework OCM was summarized. The significance and justification
was described along with the research questions, definition of terms, and variables
and limitations associated with the study. Chapter II will present a review of the
literature.

Organizational Culture
13
CHAPTER II
REVIEW OF THE LITERATURE
Introduction
As described previously, the aim of this study is to describe the
organizational culture of an agency that uses the sanctuary model as an
organizational change model. This chapter, therefore, presents the literature
applicable to the context of study: the sanctuary model, organizational culture,
and the model in which the survey tool is created from, the Denison model. The
chapter is presented in the following order: organizational culture, effects of the
sanctuary model, the Denison model, the sanctuary model history, and the
operating systems of the sanctuary model. Many online databases, journals, and
books were used to complete this literature review.
Organizational Culture
Organizational culture is the term used to describe underlying values,
beliefs, and principles of an organization (Bloom & Farragher, 2011; Clark, 2002;
Denison, 1990). Organizational culture determines how people enter the
organization, survive within it, and learn to work within it (Bloom & Farragher,
2011). Because of its shared nature, culture can have a dramatic effect on an

Organizational Culture
14
organization, such that characteristics of organizational culture have been linked
in the literature to various aspects of organizational performance.
As reviewed by Aiken, Smith, and Lake (1994), hospitals that have
distinct organizational features and are thus desirable workplaces, have lower
mortality rates. In their study Aiken et al. (1994) found that magnet hospitals,
defined as "hospitals that embody a set of organizational attributes that nurses
find desirable (and that are conducive to better patient care)" (p. 771), have lower
mortality than matched hospitals. From Aiken et al.'s literature review, they
hypothesized that the features of a hospital's reputation which are created from
nursing staff's perception of their workplace and which cause a hospital to be
considered a magnet hospital should be positively related to quality of patient care
(a.k.a., mortality).
The study analyzed mortality rate among hospitalized Medicare
beneficiaries at magnet hospitals to a set of hospitals who were unrepeatable in
their nursing practice but comparable in respect to other factors that have been
correlated with hospital mortality (Aiken et al., 1994). The study reviewed
mortality rate data, as reported in the 1988 Health Care Financing Administration
files, among 39 magnet hospitals. The researchers matched these 39 magnet
hospitals with five control hospitals resulting in a total of 195 control hospitals.
The researchers employed multivariate matching. Matching was determined on
identification of three factors including propensity scores; random order, nearest
available pair matching; and multiple controls per case. Analysis compared the

Organizational Culture
15
average mortality of the 39 magnet hospitals with those of the 195 control
hospitals using t tests and analysis of variance (ANOVA) (Aiken et al., 1994).
Analysis was performed in three phases, also referred to as models. Model I
analyzed the general effect of magnet hospitals on mortality, Model II analyzed
the effects that were specific to a particular magnet hospital, and Model III
reviewed chance error.
Model I estimated a reduction of approximately 9 deaths per 1,000
Medicare admissions. With hospital death rates averaging 113 per 1,000 in the
sample, Model I estimates concluded that predicted mortality in magnet hospitals
would be 7.7% less than their controls (Aiken et al., 1994). Model II controlled
for differences in predicted mortality between magnet hospitals and their matched
control hospitals. Analysis of results found that magnet hospitals, with the
adjustment for predicted hospital-specific mortality, went from 0.9 to 9.4 fewer
deaths per 1,000. A comparison between Model I and II found that over half of
the original variable in estimates of mortality of magnet hospitals was attributable
to not controlling the differences in patient characteristics between hospitals.
Model III analysis found 4.8% less excess mortality in magnet hospitals (Aiken et
al., 1994).
Because higher ratios of registered nurses to other nursing personnel have
been associated with lower hospital mortality in other studies and because the mix
or nursing personnel was one of the distinguishing characteristics of the magnet
hospitals in this study, the researchers needed to review the potential that their

Organizational Culture
16
results were skewed because of this nursing skill mix. Model II of the results was
extended to include terms for within-block and compositional differences in the
ratio of registered nurses to total nursing personnel (Aiken et al., 1994). The
extended analysis found no evidence that the differences between magnet and
matched hospitals' nursing skill mix or nurse to patient ratios significantly
affected mortality. With the potential bias resolved, the researchers concluded in
saying that hospitals in the magnet hospital study have mortality rates that are
lower than those among matched control hospitals by a factor of 5 per 1,000
Medicare discharges (Aiken et al., 1994).
A study performed by Lee and Yu (2004) looked to examine the possible
relationship between culture and organizational performance among Singaporean
companies. In this examination one of the questions to be answered included
"Does cultural strength affect organizational performance?" (Lee & Yu, 2004, p.
343). To answer this question, Lee and Yu asked management level employees
about their perception of the culture at their organization and cross analyzed this
data with performance standard data from each organization.
Lee and Yu (2004) attempted to utilize a stratified random design for
selecting organizations for this study. Letters were sent to 72 companies in three
categories of industries including manufacturing, insurance, and hospitals. Of the
respondents, 10 organizations were chosen for sampling based on high market
share measures. Seven top level management employees per firm participated in
the questionnaires pertaining to the study. Participants were presented with 54

Organizational Culture
17
value statements in which they were asked to sort the values according to the
extent in which the item was characteristic of their organization. This instrument
allowed the researchers to capture organizational values based on the employee
perspective and thus create an organizational culture profile (OCP) for each
company. Performance indicators were gathered for each company. Financial
indicators including sales turnover, return on assets, and net profitability were
collected for the manufacturing firm. Rate of growth of business in force for life
policies, and annual premiums, net returns on investments, and persistency rates
were collected for insurance companies. Internal improvement in bed occupancy
rates; reduction in the average length of stay of patients in class A, Bl, and B2
wards; and staff turnover rates were collected for hospitals (Lee & Yu, 2004).
Researchers began their analysis by first testing and retesting the
reliability over a 12-month period of the OCP that the sampled respondents had
determined. Once the validity of the OCP instrument was established, the OCP
responses were factored and analyzed using principal components analysis and an
orthogorial varimax rotation (Lee & Yu, 2004). A Q-factor analysis was
performed to create model cultural profiles. Cronbach's reliability test was then
performed on the five factors (innovation, supportive, team, humanistic, and task
orientations) making up 41.5% of the observed variances in data. Factor loadings
of the data that loaded as significant were transformed into weights. After
adjusting for relative weights, the cultural models were calculated by merging all
the respondents' scores together. Cultural strength was then assessed by

Organizational Culture
18
computing how many respondents from that particular organization belong to the
same cultural model. The cultural strength data was then correlated with
organizations' performance indicators. Spearman's rank correlation was used to
provide data on the overall firms' rankings on culture, work practice strength, as
well as their relative performance (Lee & Yu, 2004).
Findings showed that insurance company number 2 had the highest
cultural strength. Additionally in the insurance industry, cultural strength and
innovation were significantly correlated with growth in business in force, annual
policies, and sum insured; however, there was a negative correlation with net
return on investment (Lee & Yu, 2004). Manufacturing company number 3 had
the lowest cultural strength. Overall the manufacturing firm's management
practice strength and supportiveness were found to significantly correlate to
growth in net profits. Hospitals' practice strength, team orientation, and task
orientation were found to be significantly correlated with staff turnover; however,
supportiveness was negatively correlated with staff turnover rates (Lee & Yu,
2004). The researchers concluded in saying that the cultural strength of
organizations, as reported by its employees, was related to organizational
performance in some cases since results were mixed. Researchers believed that
though there was some supporting evidence of the relationship between culture
strength and organizational performance, it was not strong enough to provide a
pattern for a wider sample (Lee & Yu, 2004).

Organizational Culture
19
In research by Smalarz (2006), organizational culture traits, as identified
by organizational employees, were shown to have statistically significant effects
on quality of care outcomes. The eight quality of care outcomes reviewed in this
study included diabetic care including eye exam rates, HbAlc control rates, LDL
control rates, nephropathy monitoring, cholesterol management rates, high blood
pressure management rates, Chlamydia screening youth adult (21-26), and
adolescent well visit rates; while the nine cultural traits hypothesized to affect the
quality of care measures included collegiality, quality emphasis, organizational
identity, information emphasis, organizational trust, innovativeness, cohesiveness,
autonomy, and business emphasis.
The pre-test hypothesis proposed that collegiality, quality emphasis,
organizational identity, information emphasis, organizational trust,
innovativeness, and cohesiveness would have higher/better quality of care
outcomes. While autonomy and business emphasis were expected to be
negatively associated with the quality of care outcomes (Smalarz, 2006).
An organizational culture survey developed by Kralewski and colleagues
(as cited in Smalarz, 2006), from the employee's perspective, looked to obtain
measurements concerning nine traits: collegiality, information emphasis, quality
emphasis, organizational identity, cohesiveness, business emphasis,
organizational trust, innovativeness, and autonomy. Partaking in the survey were
734 physicians and 50 office managers/administrators from 57 physician groups
in the state of Massachusetts. The survey results were analyzed first through a

Organizational Culture
20
factor analysis and then through a regression analysis (Smalarz, 2006). Seven of
the nine cultural dimensions were statistically significant in the quality of care
outcome measures reviewed. The research findings of Smalarz (2006) indicated
the following:
1. Organizational trust/identity, collegiality, and information emphasis
were associated with diabetic eye exam rates.
2. Organizational trust/identity, collegiality, information emphasis,
innovativeness, and autonomy were associated with HbAlc control rates.
3. Organizational trust/identity and autonomy were associated with
cholesterol management rates.
4. Organizational trust/identity and cohesiveness were associated with
Chlamydia screening.
5. Innovativeness was associated with adolescent well visit rates.
Though seven of the nine traits were found to be statistically significant in
being linked to an outcome measure, not all of the associations were as
hypothesized. As hypothesized, organizational trust/identity, information
emphasis, cohesiveness, and autonomy were all found to affect the outcome
measures as hypothesized; collegiality and innovativeness had the opposite effect
from what had been hypothesized (Smalarz, 2006). For example, collegiality had
a negative effect upon the quality of care outcomes of diabetic eye exam rates and
HbAlc control rates. Likewise, innovativeness was found to have negatively

Organizational Culture
21
impacted adolescent well visit rates and HbAlc control rates which was opposite
of what had been hypothesized (Smalarz, 2006).
Quality emphasis and business emphasis were not found to be statistically
significant in any of the regression analyses performed for the quality of care
outcomes reviewed in this study. Likewise, there were additionally three qualities
of care outcome measures that were found to have no statistically significant
cultural traits associated (Smalarz, 2006). From the findings of this research it is
conclusive that cultural traits, as identified from employees, affect quality of care
outcomes.
A study analyzed by Glisson and Hemmelgarn (1998) at the Children's
Mental Health Services Research Center at The University of Tennessee in
Knoxville Tennessee, provided evidence that organizational climate/culture is a
major predictor of the outcomes and quality of children's services. The study
reviewed a pilot program in Tennessee that was developed to help improve the
provision of services to children by focusing on the mechanisms used to
coordinate services to these children. The study assessed the effects of
organizational variables, as reported by caseworkers, parents, teachers, and so on,
regarding service quality and outcomes of children being serviced in various
counties of Tennessee.
Glisson and Hemmelgarn's (1998) hypothesis for the study revolved
around a test model which linked county demographics, organizational
characteristics, and outcomes and quality of services using service coordination as

Organizational Culture
22 %
the model's central construct. The model led researchers to believe that service
coordination can directly as well as indirectly affect other variables such as the
climate of the organizations that provide coordinated services to children, the
quality of the services provided to the children, and the inter-organizational
relationship among organizations providing services to the children in respective
counties. Overall the hypothesized model suggested that the attitudes and
behaviors of those who directly serve and interact with the children must be
affected positively in order for improved service outcomes to occur (Glisson &
Hemmelgarn, 1998).
The method for study included examining the data from the 3-year state
sponsored pilot project, which provided service coordination teams to 12 counties
worth of organizations who coordinated services to children taken into custody
(Glisson & Hemmelgarn, 1998). In the 3-year period, research team members
worked with state administrators, the pilot service coordination teams, the
children's service organizations, and the service system network to gather data.
To assess the hypothesized model, the study selected 12 control counties for
assessment. The counties were matched based on total population, child poverty
rates, unemployment, and education levels. The subjects of this study thus
included children entering custody and the caseworkers in the organizations
responsible for their care. Therefore, out of the 600 children who had entered
custody in one of the 24 counties, 250 children were selected in the study analysis

Organizational Culture
23
based on the premise of remaining in custody for 1 year (Glisson & Hemmelgarn,
1998).
Psychosocial functioning data were obtained from parents, parent
surrogates, teachers, and service outcomes and was analyzed based on the
improvement of psychosocial functioning within that first year. Organizational
culture and interrelationships among the children's service systems data were
collected from the Psychological Climate Questionnaire that was provided by 260
caseworkers (Glisson & Hemmelgarn, 1998). The questionnaire reviewed the
degree to which employees view their work environment is beneficial versus
detrimental to their own well being and the success of their work. Service quality
measurements were obtained through measures of:
Comprehensiveness or the number of services received by each
child during their first year in custody.
Continuity or the average number of contacts per month that the
child's caseworker had with other professionals who provided services to
the child.
Availability or the average number of personal contacts per month
that the caseworker had with the child.
Responsiveness or the number of changes in residential placements
that were made to improve the fit between residential placement and child.
(Glisson & Hemmelgarn, 1998, p. 410)

Organizational Culture
24
Glisson and Hemmelgarn's (1998) study indicated service coordination
was assessed through:
Authorization or the number of separate authorizations required for
a child to receive services from multiple systems.
Responsibility or the number of individuals responsible for
ensuring that needed services were delivered.
Monitoring or proportion of monitoring services for each child, (p.
410)
Analysis of the data was performed in two stages/models. The first stage,
also referred to as the measurement model, used linear structural equation analysis
with LISREL VIII to examine the hypothesized model (Glisson & Hemmelgarn,
1998). Through the analysis, the measurement model determined if the observed
indicators of improved service outcomes were related to the hypothesized
constructs. The second stage, also referred to as the structural model, reviewed
the relationship between the variables using a LISREL analysis. The structural
model proposed to show any effects that organizational characteristics may have
on outcome and quality of services to the individual children.
Findings from the analysis suggested that offices with more perceived
positive climates/cultures had significantly greater improvements in the serviced
children's psychosocial functioning (Glisson & Hemmelgarn, 1998).
Additionally, children served by agencies with more positive climates/cultures
also received more comprehensive services with more continuity of services as

Organizational Culture
25
well as caseworkers who were more responsive and available. Organizational
climate/culture thus had a positive effect on both process and results. The
relationship between organizational climate/culture and outcomes of child
services was especially significant because the two variables relied on separate
methods of analysis such that organizational climate/culture was measured on
self-report scales while psychosocial functioning was measured on independent
descriptions of children's behaviors as provided by teachers (Glisson &
Hemmelgarn, 1998).
Effects of Sanctuary Model
Recent research on the sanctuary model and its effect on restraints and
critical incidents had been collected from a group of nine school-based programs
over a 7-year period (2001-2008). One of these programs included the Andrus
Children's Center, a private nonprofit organization recognized for its treatment
programs, training, and research center. The Andrus Children's Center treatment
programs include an award winning private special education school, outpatient
mental health services, and preventative outreach programs for emotionally-
disabled children and their families (Banks & Vargas, 2009c; "History of," n.d.).
Three of the programs were public school districts who were piloting the
sanctuary model as well as one public school and four special education schools
based in North Carolina, New York, and Pennsylvania who had fully
implemented the model (Banks & Vargas, 2009a).

Organizational Culture
26
Over a 7-year period (2001-2008), the Andrus Children's Center,
experienced an 84% drop in restraints from 104 restraints annually to 17 restraints
annually at the end of year seven. On a per child basis, the data show that in year
one there were 85 restraints per 100 children and by the end of year seven there
were nine restraints per every 100 children (Banks & Vargas, 2009c). Data
collected from the other eight school-based programs found that when comparing
pre-implementation of the model versus post-implementation of the model, all the
programs had experienced drops in restraints. Drops in restraints ranged from 6%
to 88% with three organizations having a decrease greater than 80% and six
organizations having a decrease greater than 33% (Banks & Vargas, 2009a).
Over the same 7-year period (2001-2008), the Andrus Children's Center,
experienced a 90% drop in the number of critical incidents from 7,518 in year one
to 747 by the end of year seven (Banks & Vargas, 2009b). On a per day basis, the
average number of incidents decreased by 90% (from 20, in 2001/2002, to 2 in
2007/2008) despite a 54% increase in the number of students served (123 in
2001/2002 and 190 in 2007/2008).
Data collected from two of the school based-programs that served more
than 100 children at a given time revealed a 30% decrease from baseline to end of
year one of implementation. Even greater amounts were found for two of the
programs serving less than 100 children at a given time, such that 60% of
incidents decreased from baseline to end of year one (Banks & Vargas, 2009a).

Organizational Culture
27
The Andrus Research Center conducted a separate 3-year study of
facilities using the sanctuary model and its effect on restraints/holds (R/H). Some
of the facilities included in the study were a school serving students from grades
K-9 with emotional challenges or autism and a residential treatment facility for
the juvenile population. Of the seven organizations that had shown a statistically
significant reduction of R/Hs, the organizations on average were 52.3% lower in
R/H after the first year of implementation. Three facilities exhibited over an 80%
decrease, two exhibited over a 40% decrease, one exhibited a 13% decrease, and
one exhibited a 6% decrease (Banks & Vargas, 2009b).
In order to understand the specific variables associated with the reduction,
Andrus researchers performed a linear regression analyses on the data (Banks &
Vargas, 2009b). From the analysis, physical aggression was found to have
positively affected R/H in that as the number of incidents of physical aggression
(client to staff) increased, so did the number of R/H. Physical aggression (client
to staff) was found to have the opposite effect in that as the number of incidents of
physical aggression (client to client) increased, the number of R/H decreased.
Thus the baseline data were conclusive in showing that physical aggression (client
to staff) and physical aggression (client to client) was statistically significant in
contributing to R/H. Year one data showed a significant decrease in the
relationship between both client to staff and client to client physical aggression
and R/H (Banks & Vargas, 2009b).

Organizational Culture
28
In a separate study reviewing seven organizations that had successfully
implemented the sanctuary model, all had experienced a decrease in direct care
staff turnover (Banks & Vargas, 2009a). The organization with the greatest
decrease went from a 46% turnover to a 24% turnover in a 2-year period of
implementation. All seven organizations sustained a 10% average drop or greater
in direct care staff turnover when comparing baseline to end of year two
implementation. The total decrease in these staff turnovers over the 2-year period
averaged close to a $170,000 savings (Banks & Vargas, 2009a).
Denison Model
Quantitative Findings
An exploratory test on Denison's cultural hypothesis was completed using
the survey method (Denison & Mishra, 1995). Survey measures were obtained
from the top executives (chief executive officers, chief operating officers, and
chief financial officers) of a sample of major industries, and these survey
measures were compared to subjective and objective measures of effectiveness
including profitability, quality, sales growth, satisfaction, and overall
effectiveness. Validity of survey items was conducted using factor analysis and
multidimensional scaling. Survey responses were obtained from 764 of the 3,625
surveys distributed lending to just over a 21% response rate (Denison & Mishra,
1995). Results found that though 15 of 20 correlations between the culture
indexes and subjective effectiveness items were significant as predictors of
quality, employee satisfaction, and overall performance, they were weak

Organizational Culture
29
predictors of sales growth and profit. When reviewing the objective measures of
return on assets, the data revealed correlations for the total sample as positive but
weak. Though for the sub-sample of organizations with greater than 100
employees, stronger correlations were found with mission being the strongest
predictor of performance (Denison & Mishra, 1995). The results for the objective
measure sales growth were similar in that the correlation between cultural traits
was slightly less strong for the total sample than for the sub sample organizations.
Between the objective measures, the cultural traits revealed to be a stronger
predictor of return on assets than sales growth. Overall, the data supported the
idea that cultural traits are related to measures of effectiveness and that size of the
firm is a factor in the correlation (Denison & Mishra, 1995).
In one study performed by Denison (1984), performance was studied in
terms of business performance measures associated with an organization's ability
to generate income/capacity to acquire resources from its environment.
Therefore, the COMPUSTAT financial indicators reviewed in this study included
income/investment and income/sales ratios. Financial indicators were compared
to a compilation of surveys which assessed individuals' perceptions of
organizational practices and conditions. The survey consisted of a 125-item
standardized questionnaire developed over a time span of 15 years at the
University of Michigan's Institute for Social Research (Denison, 1984).
Out of the Institute for Social Research database, survey data from 34
large American firms were self-selected for the study. The 34 companies

Organizational Culture
30
included in the sample represented 25 different industries as defined by Standard
and Poor's four-digit industry code. Therefore the sample included the
perceptions of43,747 respondents in 6,671 work groups from the 34 companies
that were included in the Survey of Organizations archive and Standard and
Poor's COMPUSTAT listing (Denison, 1984).
The survey indexes reviewed included organization of work and decision
making practices. The organization of work index was a composite of four survey
items that reflected the degree to which work is sensibly organized, work methods
are adapted to changing conditions, decisions are made at appropriate levels, and
the goals of the organization are perceived by the individual as clear and
reasonable (Denison, 1984). The organization of work therefore captures the
potential of a company to efficiently reorganize and adapt both in the present and
future. The decision-making practices index is a two-item measure indicating (a)
the degree of involvement that individuals have in the decisions that affect them,
and (b) the extent to which information is shared across levels of an organization
in a way that brings the best information possible to decision makers. Based on
the survey results, the 34 organizations were broken into one of two groups: the
high group which consisted of organizations that ranked above average in the
indexes of organization of work and decision making practices, or below average
in the indexes of organization of work and decision making practices (Denison,
1984). The financial data of each firm were compared with all firms listed by
COMPUSTAT within the same industry to create a standardized score which, for

Organizational Culture
31
purposes of the study, were converted to a percentile score (scaled from 1 to 100).
The two survey indexes were presented in terms of two indicators of performance:
income/investment ratio, which measures the effective utilization of resources
over time by comparing income with total investment; and income/sales ratio
which indicates operating efficiencies by comparing income with net sales
(Denison, 1984). Therefore, the financial indicators were presented in terms of
Return on Investment (ROI) and Return on Sale (ROS), and their standardized
equivalents, were computed for each firm for the 5 years following the year in
which the survey data were gathered.
The data showed that those companies perceived as having a well-
organized work environment had a significantly higher ROI. As represented in
the data, the organizations who were categorized as high in organization of work
ranked 15 to 50 percentage points higher than the organizations that were
categorized as below average. With the exception of year five, the gap between
the highs and lows appears to widen over the years. The data for the survey index
organization of work also showed a significant difference in ROS between the
highs and lows in year 0 and grew consistently wider through year 5 (Denison,
1984). Because ROI and ROS consistently grew from year 0 through 4,
researchers concluded in saying that organizations with a culture that encourages
the development of adaptable work methods linking individuals to the goals of an
organization have a clear competitive advantage (Denison, 1984).

Organizational Culture
32
In reviewing the survey index for decision making practices, the data
showed no large difference in ROI for the companies categorized in the high
versus low decision making practices at years 0,1, and 2; though in years 3
through 5, the highs outperformed the lows by a factor of two or three to one.
The data also showed that there was an initial difference between ROS for those
companies categorized as high in terms of decision making practices versus low;
but grew consistently wider over the 5-year period (Denison, 1984). Since ROI
and ROS did not appear to produce significant differences until after year three,
researchers concluded that participation in decision making appears to be an
investment but one which takes some time to pay off (Denison, 1984). Overall,
the researchers concluded that the cultural and behavioral characteristics of
organizations have a measurable effect on a company's performance. With the
results associated with decision making practices and ROI and ROS, researchers
saw that organizations with a participative culture not only perform better than
those without such a culture, but the margin of difference that widens over time
suggests a possible cause and effect relationship between culture and performance
(Denison, 1984).
In a different study, researchers used the Survey of Organizations (SOO)
to compare behavioral data with performance data collected from 34 firms over a
5-year period (Denison, 1990). Findings suggested that the following four
indexes of the involvement hypothesis directly contribute to organizational
effectiveness: organization of work, emphasis on human resources, decision-

Organizational Culture
33
making practices, and coordination between organizational units. Though
consistency was not directly addressed in the SOO, researchers viewed the
variation in survey responses between work groups of the organization as a
measure of consistency. The findings suggested that in the short term, high
consistency is associated with high performance but not over a long-term period.
From review, researchers found that in some cases, high consistency results in
lower performance in the future. The evidence for impact on the index
adaptability was limited due to the fact that only internal aspects of adaptability
were reviewed, but a positive relationship began to emerge between
organizations' responsiveness and ability to adapt work systems. Mission was
studied indirectly by several measures in the analysis of the SOO. The finding
that leadership ideals impact performance suggested that a vision or desired state
can have impact on organizational effectiveness as well as the indexes of job
clarity and goal emphasis (Denison, 1990).
Qualitative Findings
Of the 34 self-selected firms included in the Survey of Organizations
archive and Standard and Poor's COMPUSTAT listing, case analysis was
completed by comparing actual ROI and adjusted ROI scale to find performance
rankings. After review of all 34 firms' performance rankings, five firms were
chosen for review. The five firms were representative of differing combinations
of involvement and performance. Three of the cases on the surface appeared to
support the quantitative findings such that Medtronic appeared high performance,

Organizational Culture
34
high involvement; People Express appeared moderate performance, moderate
involvement; Detroit Edison appeared below average performance, low
involvement (Denison, 1990). On the contrary, two of the cases, on the surface,
appeared to contradict the quantitative findings such that Procter & Gamble was
below average performance with exceptionally high involvement, and Texas
Commerce had exceptionally high performance with below average involvement
(Denison, 1990).
Analysis of the five firms was conducted uniformly in giving the history
including influence of leaders and founders, the culture including its ideology and
belief system, normative system and management practices, review of how the
firm's culture had emerged, and its effects on performance and effectiveness
(Denison, 1990).
People Express and Medtronic provided examples of informal,
spontaneous, and autonomous involvement. Both organizations were found to be
highly effective in the early stages of development but were unable, as the firms
grew bigger, to transition to a more formal system thus resulting in less
effectiveness (Denison, 1990). Procter & Gamble and Texas Commerce provided
examples of large organizations with highly formalized systems of involvement
which created systems of high levels of involvement and high effectiveness; thus,
concluding that a distinction between formal and informal involvement is a
determinant in effectiveness (Denison, 1990).

Organizational Culture
35
From analysis of the case studies, several forms of consistency became
evident. The first being consistency between ideology and actual practice.
People Express, when restructuring, and Medtronic, when struggling to carry out
their founding ideology in business practice, exemplified this need for
consistency. People Express and Medtronic also illustrated that an internalized
type of system of shared values are the source of coordinated behavior and social
commitment (Denison, 1990). Procter & Gamble and Texas Commerce
exemplified a form of consistency that was bureaucratically controlled and
externally focused. With being successful throughout the many external changes,
the case analyses suggest that a high level of consistency and predictability may
be associated with adaptation to change. The Procter & Gamble and Texas
Commerce studies exemplified that standardized systems that allow for small
amounts of flexibility appear to be the most effective. Conformity for the
bureaucratic systems resulted in being counterproductive to producing a common
ground and integration (Denison, 1990). Thus the case studies conclude that a
well integrated structure with a tight system of control can be factor of
motivation; autonomy and ambiguity, unless produced in an environment that can
coordinate and direct, decrease motivation; while conformity can become a
barrier.
All five firms exemplified that adaptability is centrally important to
effectiveness; especially Medtronic to whom, when extreme growth occurred, a
sense of entitlement became apparent, thus becoming a barrier to its customer

Organizational Culture
36
service (Denison, 1990). People Express had experienced an over concentration
on its internal organization when restructuring, causing them to lose the ability to
recruit, train, and socialize new organizational members. Procter & Gamble and
Texas Commerce provided positive examples of how adaptability can be
achieved. While Detroit Edison experienced slow change in their core values and
systems as external factors took hold (Denison, 1990).
Medtronic was forced to reconsider their mission when they were faced
with the emerging issues of increasing government scrutiny and growing
competition, thus leading the firm to construct a tighter system of control and
concern of the external environment (Denison, 1990). It was additionally found
that with People Express, confidence was lost in the mission during the two most
uncertain periods of their history. With external changes in Detroit Edison's
environment, the firm had to transform their mission in order to link their
stakeholders to the firm, thus concluding that direction and the linking factors
must be recreated when environment changes occurs (Denison, 1990).
The Sanctuary Model
History
The concept of the sanctuary model began in 1980 when a psychiatrist,
clinical nurse specialist, and social worker began using a therapeutic milieu
approach to treating patients in a psychiatric unit (Bloom, 2000). This therapeutic
milieu referred to by Bloom as a carefully arranged environment for the treatment
of patients, was designed to begin reversing the effects of growing up in situations

Organizational Culture
37
characterized by interpersonal violence. Through this treatment approach, the
treatment team, as well as other clinicians (Bloom, 2000; Jacobson, Koehler, &
Jones-Brown, 1987; Jacobson & Richardson, 1987), discovered that the majority
of mental health patients had been exposed to severely traumatizing environments
as children.
The Adverse Childhood Experience (ACE) Study supports these early
findings. The ACE study, authored by Dr. Vincent Felitti and Dr. Robert Anda
and funded by the Centers for Disease Control and Kaiser Permanente, represents
the largest study of its kind to examine the effects of childhood adversity over the
lifespan (Felitti et al., 1998). More specifically, the ACE study "assessed,
retrospectively and prospectively, the long-term impact of abuse and household
dysfunction during childhood on the following outcomes in adults: disease risk
factors and incidence, quality of life, health care utilization, and mortality" (Felitti
et al., 1998, p. 246). The study was conducted from 1995 to 1997 with more than
19,000 baseline participants. Methodology of the study commenced with each
participant receiving a physical examination as well as completing a confidential
survey with questions pertaining to childhood maltreatment, family dysfunction,
current health status, and current health-related behaviors. Results of the survey
included 8,056 of the participants and found that out of the seven categories of
childhood exposure, 52.1% of participants experienced one or more categories of
adverse childhood exposure, and 6.2% of participants experiencing 4 categories of
adverse childhood exposure. The results also found that participants who had

Organizational Culture
38
reported one ACE were 65%-93% more probable to be exposed to an additional
category of exposure (Felitti et al., 1998).
The sample ranged from 19-92 years with 56.1 years being the average
and 43% being college graduates (Felitti et al., 1998). It is important to note the
sample from this study because it shows that what we see as the normally
developed and intelligent person has been exposed to ACE, therefore leading to
the conclusion that at some point in time, almost everyone will experience a
traumatic experience.
The results of the study also found that both the prevalence and risk of
health risk factors such as smoking, severe obesity, physical inactivity, depressed
mood, and suicide attempts increased as the number of childhood exposures
increased (Felitti et al., 1998). Thus explaining why severely traumatized patients
engage in forms of self-destructive behaviors such as self-mutilation, addiction,
eating disorders, suicidally, and so on (Bloom, 2000).
From these explorations, Bloom (2000) believed that the basic
assumptions of treatment for these mental health patients needed to be rethought.
Through the process of conceptualization, sanctuary emerged, derived from the
concept of sanctuary trauma, defined as "when an individual who has suffered
from a severe stressor next encounters what was expected to be a supportive and
protective environment and discovers only more trauma" (Bloom, 2000, p. 68 ).
Therefore, from 1985-1991, Bloom and her colleagues worked to develop a
trauma-informed approach to treatment. In 1991, The Sanctuary was formed

Organizational Culture
39
which utilized a trauma-specific program for adult survivors. As Bloom and her
colleagues worked through learning what exactly it meant to create a trauma-
informed system, several other mental health organizations sought consultation.
The first being Homewood Hospital in Geulph, Canada, which took its Program
for Traumatic Stress Recovery and applied it with Bloom's therapeutic
community milieu (Wright & Woo, 2000). Next was Salem Hospital in Salem,
Oregon, which used elements of the emerging sanctuary model to eliminate the
use of seclusion and restraint. Shortly after, the sanctuary model was being
implemented in residential treatment programs for children in Hawthorne, NY.
Most largely was the Andrus Children Center in Yonkers, NY who in the late
1990s sought consultation in creating a trauma informed culture for its
multidisciplinary organization serving approximately 2,500 children and families
each year ("History of," n.d.). Then, in 2005, The Andrus Children's Center and
Dr. Bloom partnered to create the Sanctuary Institute, a training, education, and
technical assistance program dedicated to helping organizations implement the
sanctuary model ("History of," n.d.).
Operating Systems
With the sanctuary model becoming a whole system approach, principles,
otherwise known as commitments, were established to help guide the short
term/everyday conduct as well as the long term strategy of the organization. The
commitments provide the structure or operating system of the sanctuary model

Organizational Culture
40
with the goal to support trauma recovery goals for clients, staff, and the
organization. The commitments are as follows:
Commitment to Nonviolence - to build safety skills, trust, and
resilience in the face of stress and inspire a commitment to wider
sociopolitical change.
Commitment to Emotional Intelligence - to teach emotional
management skills, build respect for emotional labor, minimize the
paralyzing effects of fear, and expand awareness of problematic cognitive-
behavior patterns and how to change them.
Commitment to Social Learning - to build cognitive skills,
improve learning and decisions, promote healthy dissent, restore memory,
unearth the skeletons in the organizational closet and give them proper
burial, and ultimately to have the skills to sustain a learning organization.
Commitment to Open Communication - to overcome barriers to
healthy communication, discuss the "undiscussables", overcome
alexithymia, increase transparency, develop conflict management skills,
reinforce healthy boundaries.
Commitment to Democracy - to develop civic skills of self-
control, self-discipline, to learn to exercise healthy authority and
leadership, to develop participatory skills, to overcome helplessness, to
develop skills for wrestling with complexity, and to honor the "voices" of
self and others.

Organizational Culture
41
Commitment to Social Responsibility - to harness the energy of
reciprocity and a yearning for justice by rebuilding restorative social
connection skills, establishing healthy and fair attachment relationships,
transforming vengeance into social justice, and concern for the common
good.
Commitment to Growth and Change - to work through loss in the
recognition that all change involves loss; to cease repeating irrelevant or
destructive past patterns of thought, feeling, and behavior, and to envision,
be guided by, skillfully plan, and prepare for a different and better future.
(Bloom & Farragher, 2011, p. 359)
The sanctuary model also recognizes the four interdependent domains of
healing which are necessities in helping an individual recover from bad
experiences. The SELF acronym presents the four domains:
Safety - attaining safety in self, relationships, and environment.
Emotional Management - identifying levels of various emotions
and modulating emotion in response to memories, persons, and events.
Loss - feeling grief and dealing with personal losses and
recognizing that all change involves loss.
Future - trying out new roles, ways of relating and behaving as a
"survivor" to ensure personal safety, envisioning a different and better
future. (Bloom & Farragher, 2011, p. 360)

Organizational Culture
42
In the sanctuary model, SELF creates a nontechnical language that clients,
families, staff, and organizations can share. This simplistic language demystifies
the sometimes-confusing clinical or psychological terminology that is used when
embarking in the recovery process (Bloom & Farragher, 2011).
Summary
The literature review defined and provided the many ways in which
perceived organizational culture affects organizations' effectiveness. The chapter
reviewed the sanctuary model and its studied effects, and the Denison model and
its studied effects.

Organizational Culture
43
CHAPTER III
PROCEDURES
Introduction
As discussed in chapter I, the purpose of this study was to measure the
levels of adaptability, mission, involvement, and consistency of a multi-
disciplinary organization that utilizes the sanctuary model as a system of
organizational change. This chapter discusses the procedures for collection and
analysis of data for this descriptive study that used survey methods.
Setting
The setting for this study was a not-for-profit organization based in
Western New York that offers a variety of services including physical therapy,
occupational therapy, speech language pathology, and counseling, as well as
educationally based services to families of children aged birth to 5 years old. The
organization provides these services through the three primary avenues of (a) the
Early Intervention (EI) program, which evaluates and services children aged 0-3,
(b) the Committee on Preschool Special Education (CPSE), which services
preschoolers, and (c) the Committee on Special Education (CSE), which services
school aged children.

Organizational Culture
44
Population and Sample
The accessible population is all employees of the agency at which this
study was conducted. The studied facility had 196 employees, 170 direct care and
26 non-direct care, who could potentially participate in this study. Direct care
level staff included occupational therapists, physical therapists, speech therapists,
teachers, teacher aides, service coordinators, and counselors/psychologists; non-
direct-care staff included administration, clerical staff, housekeeping,
maintenance, and food service staff. The study sample included those who
returned the survey to the researcher.
Data Collection Methods
After obtaining full approval from the D'Youville College Institutional
Review Board (IRB) (see Appendix B), the Division Administrator of the agency
was contacted (see Appendix C) for permission to conduct the study at the
agency. After permission was received (see Appendix D) the study was
introduced to the employees and the survey was distributed.
The survey was distributed through E-mail to all employees listed as the
agency's employee with a link to Survey Monkey (see Appendix E for letter of
invitation including link to Survey Monkey). The cover letter of the survey was
attached to the distribution email (see Appendix F). The cover letter included a
brief explanation of the study and clarified to the employees that by completing
the survey, they have consented to the terms in the cover letter. The participants
were given a 2-week period to complete the survey. A reminder E-mail (see

Organizational Culture
45
Appendix G) was sent out to all employees of the agency 1 week prior to the
deadline for completion. An additional E-mail (see Appendix H) was sent out to
all employees of the agency 2 days prior to the deadline for completion, as a final
reminder.
Human Rights Protection
An exempt review application was submitted to the D'Youville College
IRB and approval was received (see Appendix B). The cover letter was inserted
as the first page of the electronic survey. The cover letter outlined the purpose of
the study, selection criteria, duration of participation, and the expected procedure
for completion of the survey. The cover letter also outlined that participation is
voluntary and would remain anonymous. The completion and return of the
survey represented the consent to participate.
No physical or psychological risk to participants was expected as a result
of participation in this study; and if present, should not have exceeded risk
experienced in normal day-to-day activities. Because the researcher was a
director in the organization and has the power to fire employees, subjects may
have felt additional pressure to respond to the survey because of fear of
repercussions for not responding. Because of this factor, four precautionary steps
were taken.
First, the consent letter explained that participation would remain
completely anonymous and because of the survey tool used, the researcher would
have no way of knowing who had completed or failed to complete the survey. As

Organizational Culture
46
explained on the Survey Monkey website, the storage of email addresses and IP
addresses was disabled, thus leaving the responses completely anonymous to the
researcher. Secondly, the researcher's thesis advisor was listed as a contact
person to address any questions a participant may have about the research or
subjects' rights. Thirdly, the consent letter reinforced the voluntary nature of the
study and clearly stated to subjects that there were no penalties for not
responding. Fourth, gender identifiers were removed from the demographics
section of the survey due to the low number of males employed at the agency,
thereby reducing any foreseeable threat to anonymity.
The participants' data will be maintained on a CD in a locked cabinet in
the researcher's office for 3 years and then destroyed. Because of the anonymity
of the study, participants are unable to withdraw their submissions.
Tools
The tool that was used to collect data in this study was titled
Organizational Culture Survey (see Appendix I). This particular survey was
chosen because it has been validated to measure performance of organizations by
describing the organization culture through the four traits adaptability, mission,
involvement, and consistency.
The survey was created by Daniel Denison and was designed to measure a
number of dimensions of organizational culture that focus specifically on traits
that explain differences in the performance and effectiveness of organizations
(Denison et al., 2006). The survey contains four areas of concern, which are (a)

Organizational Culture
47
involvement, (b) consistency, (c) adaptability, and (d) mission. Each of these
areas is measured with three component indexes. Involvement includes the
indexes of empowerment, team orientation, and capability development.
Consistency indexes are core values, agreement, and coordination and integration.
Adaptability consists of creating change, customer focus, and organizational
learning. Mission consists of strategic direction and intent, goals and objectives,
and vision (Denison et al., 2006). The total number of survey items is 60, each
with six Likert-type response choices on a scale from strongly disagree to
strongly agree, including neutral and not applicable.
Reliability and validity of the instrument was tested through a statistical
analysis of 35,474 employees from 160 different organizations (Denison et al.,
2006). The sample consisted of companies in various industries including
manufacturing, services, high technology firms, public sector firms, and utilities.
Analysis for validation was done in three phases. Phase one examined the
psychometric properties of the tool or, in other words, the relationship of the
survey questions to the underlying organizational model theory. Phase two
consisted of an analysis of the homogeneity of the respondents' ratings. Phase
three considered the relationship between the indexes and the four areas of study
and measures of organizational effectiveness to analyze validity. Overall, the
results of the survey provided strong support for the validity of the organizational
culture survey as a measure for the areas of study outlined in the theoretical model
(Denison et al., 2006).

Organizational Culture
48
Permission was granted by Denison as shown in Appendix A. Elimination
in the demographic area of the sex of participants has been approved by Denison
researchers and agreed upon that this change does not affect the validity or
reliability of the survey.
Treatment of Data
As mentioned previously, three component indexes are the representative
measurements for a larger area of concern (otherwise known as a trait). Such
that:
1. Empowerment, team orientation, and capability development are
representative of the trait involvement.
2. Core values, agreement, and coordination and integration are
representative of the trait consistency.
3. Creating change, customer focus, and organizational learning are
representative of the trait adaptability.
4. Strategic direction and intent, goals and objectives, and vision are
representative of the trait mission.
Therefore in order to answer the research questions concerning the level of
adaptability, involvement, consistency, and mission, the three indexes
representative of the traits were averaged to provide one representative number
for the trait. Such that:

Organizational Culture
49
1. The averaged scores from the indexes empowerment, team orientation,
and capability development provided a representative number for the trait
involvement.
2. The averaged scores for the indexes core values, agreement, and
coordination and integration provided a representative number for the trait
consistency.
3. The averaged scores for the indexes creating change, customer focus,
and organizational learning provided a representative number for the trait
adaptability.
4. The averaged scores for the indexes strategic direction and intent, goals
and objectives, and vision provided a representative number for the trait of
mission.
With 1 being the lowest possible score and 5 being the highest possible
score, a representative number equating to a 1 would indicate a low level
performer, a 3 would equate to an average level performer, and a 5 would equate
to a high level performer. The averages for each trait were displayed in an excel
sheet.
The results of the excel sheet were analyzed to answer the research
questions concerning if the organization was internally or externally focused and
whether the organization was flexible or stable. Such that:
1. A high combined average in the areas of involvement and consistency
would equate to an internally focused agency versus a high combined average in

Organizational Culture
50
the areas of adaptability and mission would equate to an externally focused
agency.
2. A high combined average in the areas of adaptability and involvement
would equate to a flexible agency versus a high combined average in the areas of
mission and consistency which would equate to stability of the agency.
In order to answer the last research question of how the organization
reviewed in this study compares to other organizations, the survey results
collected from this study were provided to the Denison Consulting company for
comparison against their database of 931 other organizations who had used the
Organizational Culture Survey to review culture at their organization. The survey
results were provided to the Denison Consulting company via a template the
Denison Consulting company had provided the researcher of this study. Denison
Consulting compared the results of this survey to their database to produce a
circumplex outlining the areas of involvement, consistency, adaptability, and
mission. In each of the four areas of involvement, consistency, adaptability, and
mission, the circumplex displayed percentile scores. The percentile scores
represented the percentage the organization reviewed in this study scored in
comparison to the compilation of 931 other organizations in the database. For
example, if the circumplex produced by Denison Consulting had shown
adaptability at the 32nd percentile, this would mean that perceptions of
adaptability at the organization reviewed in this study fell at 32% and were lower
than average (50%) when compared to Denison's database of 931 other

Organizational Culture
51
organizations who had used the Organizational Culture Survey to review culture
at their respective organization.
Summary
This study was conducted at a multi-dimensional organization in Western
New York. The study used a convenience population and sample. Precautions
were taken to prevent perception of coercion and to protect anonymity since the
researcher is a member of the management team. The Organizational Culture
Survey was administered to review the traits of organizational culture including
mission, adaptability, involvement, and consistency. Data were collected and
analyzed using Denison templates and analysis.

Organizational Culture
52
CHAPTER IV
RESULTS
Introduction
This chapter reports the results of this study which examined the levels of
adaptability, mission, involvement, and consistency of a multi-disciplinary
organization that utilizes the sanctuary model as a system of organizational
change. Averages by index were calculated and utilized to produce averages for
the traits of adaptability, mission, involvement, and consistency. The Denison
Organizational Culture Survey Likert scale was used to interpret the trait average
and was used to indicate a level of performance for the traits of adaptability,
mission, involvement, and consistency for the multi-disciplinary organization
reviewed. The percentile scores produced in the circumplex created by the
Denison Consulting Company led to conclusions of how the organization
reviewed in this study compares to other organizations. A sample of 42
respondents submitted the survey.
Description of the Sample
Of 196 employees, 86.7% (170) are direct care staff, but they are only
67% (26) of the respondents. The non-direct-care staff is only 13.3% (26) of the
total employees, but they are 33% (14) of those who responded. The return rate

Organizational Culture
53
was 16.5% (28) for the direct care employees and 53.8% (14) for the non-direct-
care employees. The overall return rate was 21% (42).
Research Questions
This study aimed to answer seven questions about the performance level
of cultural traits of the organization in review.
Research Question 1
The first research question was: What is the level of adaptability of the
organization? As seen in Table 1, the average for creating change was 3.27,
customer focus was 3.70, and organizational learning was 3.34. Thus, the overall
average for adaptability was 3.44. On the Likert scale of 1 to 5, the adaptability
score falls in the middle.
Research Question 2
The second research question was: What is the level of involvement of the
organization? As seen in Table 2, the average for the index empowerment was
3.54, team orientation was 3.62, and capability development was 3.57. The
overall average for involvement was 3.58. On the Likert scale of 1 to 5, the
involvement score falls in the middle.
Research Question 3
The third research question was: What is the level of consistency of the
organization? As seen in Table 3, the average for the index core values was 3.57,
agreement was 3.37, and coordination and integration was 3.28. The overall

Organizational Culture
54
Table 1
Adaptability Results
Survey Total + Average Average ID Total by 42 Index per index per trait
Q31 120 2.86 Creating change 3.27 3.44
Q32 147 3.50 Creating change
Q33 152 3.62 Creating change
Q34 122 2.90 Creating change
Q35 145 3.45 Creating change
Q36 141 3.36 Customer focus 3.70
Q37 146 3.48 Customer focus
Q38 149 3.55 Customer focus
Q39 160 3.81 Customer focus
Q40 181 4.31 Customer focus
Q41 160 3.81 Organizational learning 3.34
Q42 138 3.29 Organizational learning
Q43 115 2.74 Organizational learning
Q44 165 3.93 Organizational learning
Q45 123 2.93 Organizational learning

Organizational Culture
55
Table 2
Involvement Results
Survey ID Total
Total + by 42 Index
Average per index
Average per trait
Q1 174 4.14 Empowerment 3.54 3.58
Q2 139 3.31 Empowerment
Q3 129 3.07 Empowerment
Q4 160 3.81 Empowerment
Q5 141 3.36 Empowerment
Q6 163 3.88 Team orientation 3.62
Q7 145 3.45 Team orientation
Q8 148 3.52 Team orientation
Q9 158 3.76 Team orientation
Q10 147 3.50 Team orientation
Ql l 143 3.40 Capability development 3.57
Q12 148 3.52 Capability development -
Q13 159 3.79 Capability development
Q14 153 3.64 Capability development
Q15 146 3.48 Capability development

Organizational Culture
56
Table 3
Consistency Results
Survey Total Average Average ID Total by 42 Index per index per trait
Q16 131 3.12 Core values 3.57 3.41
Q17 146 3.48 Core values
Q18 159 3.79 Core values
Q19 151 3.60 Core values
Q20 162 3.86 Core values
Q21 142 3.38 Agreement 3.37
Q22 152 3.62 Agreement
Q23 136 3.24 Agreement
Q24 136 3.24 Agreement
Q25 141 3.36 Agreement
Q26 140 3.33 Coordination & integration 3.28
Q27 146 3.48 Coordination & integration
Q28 127 3.02 Coordination & integration
Q29 128 3.05 Coordination & integration
Q30 148 3.52 Coordination & integration

Organizational Culture
57
average for consistency was 3.41. On the Likert scale of 1 to 5, the involvement
score for the organization studied falls in the middle.
Research Question 4
The fourth research question was: What is the level of understanding of
the mission of the organization? As seen in Table 4, the average for the index
strategic direction and intent was 3.77, goals and objectives was 3.63, and vision
was 3.44. The overall average for mission was 3.61. On the Likert scale of 1 to
5, the involvement score for the organization studied falls in the middle.
Research Question 5
The fifth research question was: Is the organization internally or externally
focused? As seen in Table 5, the combined trait average for involvement and
consistency was 3.5. The combined trait average for adaptability and mission was
3.5. Both combined trait averages were equivalent.
Research Question 6
The sixth research question was: Is the organization flexible or stable? As
seen in Table 6, the combined trait average for adaptability and involvement was
3.5. The combined trait average for mission and consistency was 3.5. Both
combined trait averages were equivalent.
Research Question 7
The seventh research question was: How does the organizational culture of
a sanctuary-based organization compare to the database of organizations using
other models of operations? As seen in Figure 2, the organization reviewed in

Table 4
Mission Results
Survey Total + ID Total by 42 Index
Q46 171 4.07
Q47 144 3.43
Q48 169 4.02
Q49 156 3.71
Q50 152 3.62
Q51 143 3.40
Q52 158 3.76
Q53 157 3.74
Q54 154 3.67
Q55 150 3.57
Q56 145 3.45
Q57 156 3.71
Q58 132 3.14
Q59 140 3.33
Q60 149 3.55
Strategic direction & intent
Strategic direction & intent
Strategic direction & intent
Strategic direction & intent
Strategic direction & intent
Goals & objectives
Goals & objectives
Goals & objectives
Goals & objectives
Goals & objectives
Vision
Vision
Vision
Vision
Vision
Organizational Culture
58
Average Average per index per trait
3.77 3.61
3.63
3.44

Organizational Culture
59
Table 5
Internally versus Externally Focused
Trait Involvement Consistency Adaptability Mission
Trait average 3.6 3.4 3.4 3.6
Combined trait average 3.5 3.5

Organizational Culture
60
Table 6
Flexible versus Stable
Trait Adaptability Involvement Mission Consistency
Trait average 3.4 3.6 3.6 3.4
Combined trait average 3.5 3.5

Organizational Culture
61
Figure 2. The Denison Model Circumplex Percentiles.

Organizational Culture
62
this study ranked at the 71st [(63+72+78)/300] percentile for the mission trait.
This percentile is an average of the scores for the three indexes within the mission
quandrant of the circumplex including strategic direction and intent (63rd
percentile); goals and objectives (72nd percentile); and vision (78th percentile).
The organization reviewed in this study ranked at the 60th [(79+31+71)/300]
percentile for the adaptability trait. This percentile is an average of the scores for
the three indexes within the adaptability quadrant of the circumplex including
organizational learning (79th percentile); customer focus (31st percentile); and
creating change (71st percentile). The organization reviewed in this study ranked
at the 57th [(66+66+39)/300] percentile for the involvement trait. This percentile
is an average of the scores for the three indexes within the involvement quandrant
of the circumplex including empowerment (66th percentile); team orientation
(66th percentile); and capability development (39th percentile). The organization
reviewed in this study ranked in the 55th [(68+50+47)/300] percentile for the
consistency trait. This percentile is an average of the scores for the three indexes
within the consistency quadrant of the circumplex including coordination and
integration (68th percentile); agreement (50th percentile); and core values (47th
percentile).
Since the combined average of adaptability (60th percentile) and mission
(71st percentile) ranked at the 65th [(60 + 71 )/2] percentile compared to the
combined average of involvement (57th percentile) and consistency (55th
percentile) which ranked at the 56th percentile [(57+55)/2], this organization

Organizational Culture
63
scored more externally than internally focused according to the circumplex. Since
the combined average of mission (71st percentile) and consistency (55th
percentile) ranked at the 63rd percentile as compared to involvement (57th
percentile) and adaptability (60th percentile) which ranked at the 59th [(57+60)/2]
percentile, this organization scored more stable than flexible according to the
circumplex.
Summary
This chapter displayed the data analysis processes that were used to
answer the seven research questions of this study. The organization reviewed in
this study was an average level performer when reviewing the traits of
adaptability, involvement, consistency, and mission, with involvement and
mission scoring slightly higher than adaptability and consistency. When these
data were compared with 931 other organizations, the organization reviewed in
this study ranked best in mission and worst in consistency according to the
percentiles represented in the circumplex. The organization was equally
internally and externally focused as well as equally stable and flexible according
to the raw data; though, when compared to a database of 931 other organizations,
the organization reviewed in this study scored more externally focused and more
stable. Out of the 196 distributed surveys, 42 surveys were returned.

Organizational Culture
64
CHAPTER V
DISCUSSION
Summary
The objective of this study was to measure the levels of cultural traits of a
multi-disciplinary organization that utilizes the sanctuary model as a system of
organizational change. The conceptual framework for this study was the
organizational culture model which introduced the concept that the following four
cultural traits of involvement, consistency, adaptability, and mission were
imperative to highly effective/performing organizations. The conceptual
framework provided a survey tool to measure the levels of the four cultural traits
through the perspective of the employee. The significance of this study was that
it provided the organization reviewed in this study with identification of weak
cultural areas that, according to the Denison model, would need to be improved in
order to be an effective organization. On a larger scale, the significance of this
study is that it provided a framework for organizations to review organizational
culture and to learn how their culture can affect the effectiveness of their
organization. It was assumed that the employees who participated in the study
would answer honestly. It was also assumed that human interaction in their
environment makes a difference in how the employees perceived the culture of

Organizational Culture
65
their organization. Seven research questions were identified to measure the levels
of cultural traits of a multi-disciplinary organization including:
1. What is the level of adaptability of the organization?
2. What is the level of involvement of the organization?
3. What is the level of consistency of the organization?
4. What is the level of understanding of the mission of the organization?
5. Is the organization internally or externally focused?
6. Is the organization flexible or stable?
7. How does the organizational culture of a sanctuary-based organization
compare to the database of organizations using other models of operations?
The following terms were defined theoretically and operationally in
chapter I: adaptability, consistency, involvement, mission, multi-disciplinary
organization, and sanctuary model. The variables identified for this study
included the four cultural traits measured through the survey tool including
adaptability, involvement, consistency, and mission. Because the study revolved
around a Likert scale survey, the participants' responses were limited to the
survey structure and content. Another limitation was that the culture of the
organization can only be described at this point in time because of the study
design; conclusions about how the culture may have changed at the organization
cannot be made. It is also unknown if Denison's comparative database consisted
only of health care organizations, therefore general comparative conclusions

Organizational Culture
66
cannot be made about this study's results as they apply to health care
organizations.
The literature review for this study explored the literature in the following
areas: organizational culture, effects of sanctuary model, Denison model
quantitative findings, Denison model qualitative findings, the sanctuary model
history, and the sanctuary model operating systems.
The study was performed on a not-for-profit organization based in
Western New York that offers a variety of services to children aged birth to 5
years old. The accessible population of the study was all employees of the
organization in review including a total of 170 direct care and 26 non-direct-care
employees. Data were collected through the use of Survey Monkey and notice of
the survey was distributed through the use of email. Human rights protection was
obtained from the D'Youville College IRB in which no physical or psychological
risk to participants was expected. Participation in the study remained completely
anonymous. The tool used to collect data included the Organizational Culture
Survey which was designed to measure a number of dimensions of organizational
culture including indexes of the traits adaptability, involvement, consistency, and
mission. There were a total of 60 survey questions which participants scored on a
Likert-type response scale from strongly disagree to strongly agree, including
neutral. Averages of the indexes were calculated to provide one representative
number for the trait with 1 being the lowest possible score and 5 being the highest
possible score. Combined averages were calculated to answer research questions

Organizational Culture
67
pertaining to if the organization were internally or externally focused as well as
flexible or stable. In order to answer if the scores of the organization compared to
other organizations, the data were compared to a database of 931 other
organizations that used the Organizational Culture Survey. Results were
presented in a circumplex with percentiles for each trait index.
The data from 42 respondents, the study sample, were analyzed for the
perceived level of adaptability, involvement, consistency, and understanding, as
well as the conflicting demands of the traits. Findings of the analysis found that
each trait scored between a 3.4 and 3.6 out of 5. Combined trait averages were
3.5 out of 5. The percentiles of the circumplex varied between 79 and 31.
Conclusion
Relationship of the Results to the Conceptual Framework
The organizational culture model provided a framework to examine the
culture of an organization that utilizes the sanctuary model as a system of
organizational change. The results of the study examined the culture according to
the four traits outlined in the conceptual framework. Calculation of combined
trait averages led to the conclusion that the organization was equally as internally
focused and externally focused as well as was as equally stable as flexible; thus,
the results of the study did not show a set of tensions or a set of contradictions as
was outlined in the conceptual framework. The survey results for each trait
ranged between 3.4 and 3.6, while the circumplex produced by Denison
Consulting Company showed that the results were not as evenly distributed

Organizational Culture
68
between the traits when compared to a database of 931 other organizations.
According to the four hypotheses of the conceptual framework, the isolated
results of the survey show that the organization is an average performer, but the
circumplex shows how accurate and how truly effective the organization is by
comparing the results to 931 other organizations. Therefore, reviewing the
hypotheses and the circumplex results in the conclusion that the organization,
when compared to other organizations, is above average in all trait areas since all
trait areas average to over 50%.
Relationship of the Results to the Literature
The review of the organizational culture literature demonstrated that
culture, and in particular staff perception of culture, provides an indication as to
the effectiveness/performance of an organization. For example, the study
performed by Aiken et al. (1994) reviewed the hypothesis that staffs perception
of their workplace could be positively related to quality of patient care (a.k.a.,
mortality). Though this study did not directly review quality of patient care, this
study did review the employees' perception of their workplace by asking survey
questions pertaining to the culture of the organization. The survey questions
allowed analysis of data which showed that the organization was average in the
cultural traits of the organizational culture model which according to the Denison
model, suggests that the organization would likewise be average when reviewing
performance standards. Aiken et al. validated their hypothesis by finding that the
magnet hospitals reviewed in the study had mortality rates lower than the matched

Organizational Culture
69
controls by a factor of 5 per 1,000 Medicare discharges. This study likewise,
validated the employee's perceptions by comparing the results to 931 other
organizations resulting in conclusions that the organization was an average if not
slightly above average organization causing the inference that quality of care
items in this child service organization would be average. Therefore, the results
of Aiken et al. as well as this study suggest that employees' perceptions of their
workplace may have a connection to the performance of the organization.
The study performed by Lee and Yu (2004) looked to review the
hypothesized relationship between organizational culture and performance by
reviewing management level employees' perceptions of their organization's
culture and comparing it against performance standard data of each organization.
The analyzed cultural strength data from each organization was correlated with
performance indicators including innovation, sum insured, and investment. The
study concluded in saying that in some cases, cultural strength, as reported by its
employees, was related to organizational performance. This study similarly
analyzed cultural strength data of the organizational culture survey that was
produced from the perceptions of employees, and made inferences about the
organization being an average performer. The organizational performance
conclusions were verified as being an average if not slightly above average
performer on cultural traits. Therefore, as in Lee and Yu's study, cultural strength
was related to performance just as in this study the circumplex displayed that the

Organizational Culture
70
perceived cultural strength of the organization was accurate and thus infers that
the performance level of the organization would be average.
Smalarz (2006) reviewed employees' perception of nine organizational
traits. From these perceptions, Smalarz compared factors of quality of care
outcomes. From reviewing Smalarz's findings, organizational trust/identity was
associated with four of the five outcome measures that were found to be
statistically linked. Though the results of this study did not assess which cultural
traits most contributed to the performance level of the organization, mission at
this organization scored 71% higher than 931 other organizations. This highly
scored trait suggests that the organization has a defined identity that employees
understand. Thus, because Smalarz identified organizational identity as having a
strong connection with outcome measures, it would be expected that the
organization reviewed would similarly have high outcome measures which was
not true since the organization's hypothesized performance level scored only
slightly above average.
The study performed by Glisson and Hemmelgarn (1998) provided
evidence that organizational climate/culture is a predictor of the outcomes and
quality of children's services. Findings revealed that offices with more perceived
positive climates/cultures had significantly greater improvements in children's
psychosocial functioning, had more continuity of services, and had more
responsive and available staff. Though the results of this study could not directly
comment on the relationship between culture and quality of children's services,

Organizational Culture
71
this study did review the organizational culture of a child service organization.
With this review, the results found that the culture of this organization was a
slightly above average performer meaning that according to Glisson and
Hemmelgarn, it may be speculated that the organization reviewed in this study
understands children's psychosocial functioning, has some continuity of services,
and has somewhat responsive and available staff but has room for improvement.
The quantitative and qualitative findings of the Denison model literature
supported the theory that certain cultural traits of an organization are related to
measures of effectiveness of the organization. Both quantitatively and
qualitatively, the Denison model literature displayed that certain performance
standards such as return on sales and return on investments were linked to cultural
traits such as organization of work, coordination between organizational units,
consistency, involvement, and so on. Though the results of this study did not
directly compare measures of effectiveness to the cultural performance levels,
based on the literature it may be implied that there is potential for the organization
in review to be an above average performer when reviewing measures of
effectiveness based on the fact that the organization was above average when
reviewing cultural traits.
Though the results of this study cannot contribute to the literature of the
sanctuary model in terms of it decreasing such things as restraints and holds, staff
turnover, and so on, the results of the circumplex do display that the organization
under review which services children under the sanctuary model ranked at the
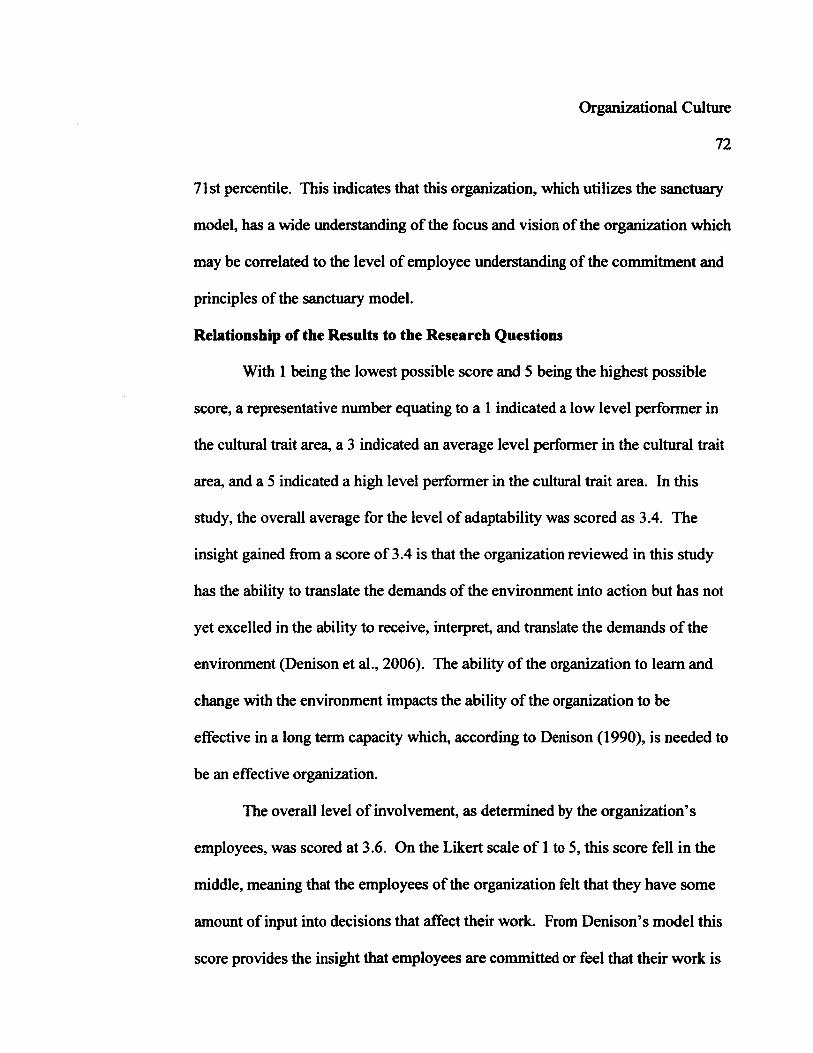
Organizational Culture
72
71st percentile. This indicates that this organization, which utilizes the sanctuary
model, has a wide understanding of the focus and vision of the organization which
may be correlated to the level of employee understanding of the commitment and
principles of the sanctuary model.
Relationship of the Results to the Research Questions
With 1 being the lowest possible score and 5 being the highest possible
score, a representative number equating to a 1 indicated a low level performer in
the cultural trait area, a 3 indicated an average level performer in the cultural trait
area, and a S indicated a high level performer in the cultural trait area. In this
study, the overall average for the level of adaptability was scored as 3.4. The
insight gained from a score of 3.4 is that the organization reviewed in this study
has the ability to translate the demands of the environment into action but has not
yet excelled in the ability to receive, interpret, and translate the demands of the
environment (Denison et al., 2006). The ability of the organization to learn and
change with the environment impacts the ability of the organization to be
effective in a long term capacity which, according to Denison (1990), is needed to
be an effective organization.
The overall level of involvement, as determined by the organization's
employees, was scored at 3.6. On the Likert scale of 1 to 5, this score fell in the
middle, meaning that the employees of the organization felt that they have some
amount of input into decisions that affect their work. From Denison's model this
score provides the insight that employees are committed or feel that their work is

Organizational Culture
73
connected to the goals of the organization, but that feelings of commitment could
be increased if democratic decision making was more prevalent (Denison et al.,
2006). Because organizational effectiveness is a "function of the level of
involvement and participation of an organization's members" (Denison, 1990, p.
7), having employees who are not highly involved, or in this circumstance not
scoring 5 in the area of involvement, do not feel the sense of ownership and
responsibility that, according to Denison, is needed to be an effective
organization.
The level of consistency for this organization was scored at 3.4 out of 5.
With the level of consistency falling in the middle of the spectrum, employees do
not have a completely clear understanding of the do's and don'ts of the
organization's culture; which means that employees do not fully understand or
share in the beliefs and values of the organization (Denison, 1990). Having
shared beliefs and values provides insight into the ability of the organization to
reach consensus on decision making and to carry out coordinated goals. This
insight impacts the ability of the organization to be effective because as explained
by Denison et al. (2006), "organizations are effective when they are consistent
and well integrated" (p. 6); therefore an organization which does not have a
complete clear understanding of the do's and don'ts of the culture will struggle to
obtain a feeling of consistency as exemplified in the organization reviewed in this
study.

Organizational Culture
74
According to the results, the level of understanding of the mission of the
organization was scored at 3.6 out of 5. The insight into this score indicates the
idea that the employees of this organization do not fully understand the purpose of
the organization and the direction or goal which the organization works toward.
Without a completely clear understanding of the purpose and the direction which
the organization works toward, employees do not have a clear understanding of
the beliefs and goals of the organization. According to Denison et al. (2006),
effective organizations have a clear sense of purpose and direction; therefore this
organization, which does not have a completely clear understanding of the
direction or goals of their organization will not be able to be a highly effective
organization until clear direction and goals are provided to the organization's
employees.
The combined trait average for involvement and consistency was scored
3.5 out of 5. This score shows that the organization recognizes the internal
dynamics of the organization such as the systems, structures, and processes that
make up the framework of the organization. But due to scoring 3.5 out of 5, it can
be concluded that employees feel that the organization has not yet been able to
perfect the dynamic of the three components to produce a high quality product
("Denison overview", n.d.). A combined trait average for adaptability and
mission was scored 3.5 out of 5. This score shows that the organization has an
external focus in which the organization does monitor the external marketplace.
Though with a score of 3.5, the employees of the organization may not feel that

Organizational Culture
75
the organization is completely in tune with their marketplace or may have
difficulty analyzing where the market is heading, thus causing the organization to
score lower in this area ("Denison overview", n.d.). Though improvements in the
areas can be made, both combined trait averages scored 3.5 out of 5 meaning that
the organization has reconciled the conflicting demands of being internally versus
externally focused; which according to Denison (1990) is the essence of effective
cultures.
The combined trait average for adaptability and involvement was scored
3.5 out of 5. This score exemplifies that employees feel this organization has the
ability to change in response to its environment, though employees may feel that
the organization may not be flexible enough in a timely manner when changes
occur in the environment thus causing this score to be lower ("Denison
overview", n.d.). A combined trait average for mission and consistency was
scored 3.5 out of 5. A score of 3.5 shows that the organization has the capacity to
remain focused and predictable, but scoring 3.5 out of 5 may indicate that
employees feel that the organization will not remain stable over time. Though
both areas could use improvement to bring, the score to 5, the demands of
flexibility versus stability had equal scores meaning that the organization has
reconciled the conflicting demands of being flexible versus stable, which
according to Denison (1990) is the essence of effective cultures.
The results of this study, otherwise referred to as the raw scores, were
compared to a database of 931 other organizations which had similarly used

Organizational Culture
76
Denison's Organizational Culture Survey to review organizational culture. The
circumplex in Figure 2 displays how the results of this study compared to a
database of 931 other organizations. The circumplex helps to give meaning to the
raw data results of this study, as described above, by helping to answer the
question of "Is that good?" ("Denison overview", n.d.). According to the results
of the circumplex, mission ranked at the 71st percentile. What this means is that
the raw score of 3.6 for the mission trait was a good score since it ranked at the
71 st percentile and therefore was a strength area for the organization in review.
In comparison, employees' perceived level of adaptability at the organization in
this study ranked at the 60th percentile. This means that the raw score of 3.4 was
a decent score since it ranked at the 60th percentile; though the organization
reviewed in this study could use some work to improve the employees'
confidence in their organization's ability to change according to the external
environment. Involvement ranked at the 57th percentile. This means that the raw
score of 3.6 for the trait involvement was reflective of being an average performer
since involvement ranked at the 57th percentile. Thus the organization reviewed
in this study could improve in the area of involvement by building teams and
empowering employees. Consistency ranked at the 55th percentile. This means
that the raw score of 3.4 was supportive of the previous assumptions that the
organization in review was an average performing organization in the area of
consistency. Therefore, because the organization ranked in the 55th percentile in
the area of consistency, the conclusion can be drawn that the organization needs

Organizational Culture
77
to improve in being more consistent, well integrated, and based on consensual
governance. Overall the organization in this study appears to be excelling in the
trait area of mission since mission was ranked at the 71st percentile. The
organization appears to be doing better than average in the trait areas of
adaptability (60th percentile), involvement (57th percentile), and consistency
(55th percentile); though it could stand to use improvement since they were only
slightly above average which, in this circumstance, would be considered the 50th
percentile.
With a combined average for adaptability and mission ranking at the 65th
percentile compared to the combined average of involvement and consistency
ranking at the 56th percentile, the organization reviewed in this study scored more
externally than internally focused. What this means is that the organization has
not reconciled the conflicting demand of external versus internally focused as
originally represented by the raw data. The organization should focus its efforts
on improving in the area of involvement and consistency in order to make the
percentiles equivalent and the demand reconciled. With a combined average for
mission and consistency ranking at the 63rd percentile, as compared to
involvement and adaptability which ranked at the 59th percentile, the organization
in review scored more stable than flexible. What this means is that the
organization has not reconciled the conflicting demand of stable versus flexible as
originally represented by the raw data. The organization should focus its efforts

Organizational Culture
78
on improving in the area of involvement and adaptability in order to make the
percentiles equivalent and the demand reconciled.
Relationship of the Results to the Variables
The results were that the involvement and mission variables scored
slighter higher than the adaptability and consistency variables. Based on these
outcomes, the organization in review had employees with a higher perception of
commitment and meaning to work and a slightly lower perception of how they are
to function in their environment and how to adapt to their changing environment.
Relationship of the Results to the Study Design
The survey was carried out from the last week of August 2012 to the
second week of September over a 15 day period. Of the 196 employees who had
the opportunity to participate in the survey, 42 (21%) employees took the online
survey. All of the completed surveys were completed fully and none were
eliminated from the study. A larger response rate may have been possible if the
timing of the study was different. For example 10-month employees were off
from August 27th to September 4th; therefore approximately a quarter of the staff
may have missed 7 days that the survey was offered if they did not read their
emails while on their time off. Another variable that may have affected the
response rate was the scenario that it was also the beginning of the 2012/2013
school year which is a very busy time of year for both the direct and non-direct-
care employees at the studied organization.

Organizational Culture
79
Relationship of the Results to the Tools
As reviewed, the validity of the tool was tested through a statistical
analysis of 35,474 employees from 160 different organizations. From the
statistical analysis, the results of the survey provided strong support for the
validity of the survey by showing the relationship between the traits and measures
of organizational effectiveness (Denison et al., 2006). The results of this study
similarly supported the validity of the tool since the results of the study scored the
performance of the organization's cultural traits as average. When comparing
these results with 931 other organizations, the organization reviewed in this study
likewise ranked above the 50th percentile for each trait, thereby giving validity to
the original analysis that the organization in review was an averagely if not
slightly above average performing organization. This validated that the survey
tool accurately measures the performance level of cultural traits of organizations.
Relationship of the Results to the Data Analysis Methods
The data analysis was implemented as planned in chapter III.
Measurements for the component indexes were combined and averaged for each
trait. Such that the averaged score for the indexes empowerment, team
orientation, and capability developed provided an averaged score of 3.6 for the
trait involvement. The averaged score for the indexes core values, agreement, and
coordination and integration provided an averaged score of 3.4 for the trait of
consistency. The averaged score for the indexes creating change, customer focus,
and organizational learning provided an averaged score of 3.4 for the trait of

Organizational Culture
80
adaptability. The averaged score for the indexes strategic direction and intent,
goals and objectives, and vision provided an averaged score of 3.6 for the trait of
mission. With 1 being the lowest possible score and 5 being the highest possible
score, all traits scored in the 3.4 to 3.6 range, meaning that the organization was
an average level performer of these cultural traits. Combined trait averages were
produced for the traits which showed that the organization reviewed was as
equally internally as externally focused and was equally as flexible as stable.
Lastly, the Denison Consulting Company produced a circumplex which compared
the results of the organization in review against 931 other organizations. The
circumplex showed that the organization in review ranked above the 50th
percentile for each trait, supporting the conclusion that the organization was an
average, if not above average, organization for the four cultural traits of
adaptability, mission, involvement, and consistency.
Implications for Management
The overall purpose of research is exploration which is needed for all
disciplines in order to enhance understanding. In order to enhance the
understanding of the results of this study, a limitation must be addressed. The
lopsided response rate in favor of the non-direct-care staff may have influenced
the results due to the possibility that direct care and non direct care employees
have different perceptions of the culture. Despite this limitation the organization
in review was found to be an above average level performer; though it has room
for improvement, especially in the area of consistency, which scored in the 55th

Organizational Culture
81
percentile. The results infer that management of this organization should focus on
the area of consistency first and foremost in order to promote a more balanced and
effective culture. Due to the fact that the organization utilizes the sanctuary
model to promote its culture, the low score in consistency may infer that the
modules of sanctuary are not being implemented uniformly in the organization.
Therefore, in order to improve scores of consistency, management should analyze
the way in which the modules of sanctuary are being taught throughout the
organization.
The raw data of this study were compared to a database of 931 other
organizations. It was unknown as to the types of organizations that encompassed
the database. Therefore the conclusions made about the percentiles outlined in
Figure 2 must be put in perspective in that the comparison database may have had
dissimilar organizations to the one reviewed in this study. For example, as seen
under the trait of adaptability in Figure 2, the organization reviewed in this study
scored at the 31st percentile for customer focus. The customer focus percentile
may have appeared low in this area because unlike the child service organization
reviewed in this study, the database may have consisted of a large number of for-
profit organizations. What this means is that normally for-profit organizations
need to stay very highly in tune with their customers due to the fact that they are
creating products that are designed to cater to customers. This is opposed to not-
for-profit service organizations which always has a large customer base due to the
fact that they are providing health services, which is a necessity as compared to a

Organizational Culture
82
product of a for-profit organization which produces products which often times
are luxuries to customers. Though not-for-profits are not creating a product, they
are providing a service which relies heavily on reputation such that individuals
can be more likely to go to a service provision organization if they have a good
reputation. Therefore, because the customer is such an integral part of service
provision, management of the organization reviewed in this study should focus on
listening to the needs of the customer in order to improve their level of
adaptability and improve their performance level.
Though the conclusions of the study cannot be generalized due to the fact
that only one child service organization was surveyed, the conclusions of this
study suggest that child service organizations could benefit from utilizing a
framework as presented in this study to review the strengths and weaknesses of
their organization's culture. Identifying the weaknesses of the organization's
culture allows management to prioritize areas of improvement which, according
to the literature, would correlate to improvement in quality care outcomes. Thus
the implications of this study help organizations to improve performance through
identifying traits of culture needing improvement.
Recommendations for Future Research
For this particular study, recommendations to improve the results would
be to separate the survey results into direct care and non-direct care. As
expressed earlier, it is commonly known that organizational culture evolves
through the development of common traditions, rites, and history of the

Organizational Culture
83
employees; therefore, organizational culture evolves from the employees. There
is a difference with organizations that utilize an organizational change model due
to the fact that administrative employees of the company typically are trying to
create the culture from top down but, as revealed in the previous statement, it
appears that culture can likewise evolve from the bottom up. In this study,
administrative employees and non-administrative employees were combined to
summarize results. A recommendation for future research which utilizes this
framework would be to separate the results of the administrative and non-
administrative employees to see if the two groups perceived the culture similarly
or differently. This recommendation is made to more accurately review the
culture of the organization and if compared to the commitments of the
organizational change model, would help researchers to more accurately assess if
the culture occurred from top down or bottom up methodology.
On the small scale, the framework of this study allowed the researcher to
review the culture of an organization and compare it to 931 other organizations in
order to give insight into the level of performance of the organization. No •
performance standards were used in this study to review the accuracy of the
conclusions about the level of performance of the organization. If performance
standards were used as a comparison factor in this existing framework, the
framework could be used on a larger scale to further compare the relationship
between cultural traits and performance measures. If these performance measures

Organizational Culture
84
were added to the framework and multiple organizations were reviewed, research
could be produced to test specific organizational culture model effectiveness.
The framework reviewed in this study can be utilized for individual
organizations to review their culture using a validated tool, though could not be
utilized to review effectiveness of organizational change models. For example,
though the organization reviewed in this study utilized an organizational change
model, the results cannot be directly linked to the organization's use of the
sanctuary model due to the fact that there is no way to assess if the results were
because the organization utilizes the change model. Therefore, a recommendation
would be to utilize this framework as a pre- and post-implementation tool in order
to review the effectiveness of organizational change models. This is an important
recommendation since there is little outside validated research on the
effectiveness of organizational change models in which organizations are relying
on to improve their quality care and performance standards.

Organizational Culture
85
References
Aiken, L. H., Smith, H. L., & Lake, E. T. (1994). Lower Medicare mortality
among a set of hospitals known for good nursing care. Medical Care,
52(8), 771-787. Retrieved from http://www.jstor.org/stable/3766652
Banks, J., & Vargas, L. A. (2009a, January). Sanctuary in schools: Preliminary
child and organizational outcomes. Andrus Center for Learning &
Innovation Research Brief. Retrieved from
http ://www. sanctuaryweb.com/PDF s_new/Banks%20and%20 V argas%20
Sanctuary%20in%20Schools.pdf
Banks, J., & Vargas, L. A. (2009b, February). Contributors to restraints and holds
in organizations using the sanctuary model. Andrus Center for Learning &
Innovation Research Brief. Retrieved from http://www.sanctuaryweb.com/
PDFs_new/Banks%20and%20Vargas%20Contributors%20to%20Restrain
ts%20and%20Holds.pdf
Banks, J., & Vargas, L. A. (2009c, March). Sanctuary at the Andrus children's
center. Andrus Center for Learning & Innovation Research Brief.
Retrieved from http://www.sanctuaryweb.com/PDFs_new/
Banks%20and%20Vargas%20Sanctuary%20at%20Andrus.pdf

Organizational Culture
86
Bloom, S. (2000). Creating sanctuary: Healing from systematic abuses of power.
Therapeutic Communities: The International Journal for Therapeutic and
Supportive Organizations, 21(2), 67-91. Retrieved from
http://www.sanctuaryweb.com/PDFs_new/Bloom%20Creating%20Sanctu
ary%20Healing%20From%20Systemic.pdf
Bloom, S. K., & Farragher, B. (2011). Destroying sanctuary: The crisis in human
service delivery systems. New York, NY: Oxford University Press.
Clark, G. (2002). Organizational culture and safety: an interdependent
relationship. Australian Health Review, 25(6), 181-189.
doi:10.1071/AH020181
Denison, D. (1984). Bringing corporate culture to the bottom line. Organizational
Dynamics, 13(2), 5-22.
Denison, D. (1990). Corporate culture and organizational effectiveness. New
York, NY: John Wiley & Sons.
Denison, D., Janovics, J., Young, J., & Cho, H. J. (2006). Diagnosing
organizational cultures: Validating a model and method. Unpublished
manuscript, University of Michigan Business School.
Denison, D., & Mishra, A. (1995). Toward a theory of organizational culture and
effectiveness. Organization Science, 6(2), 204-223. Retrieved from
http://www.jstor.org/stable/2635122

Organizational Culture
87
Denison organizational culture model. (2011). Retrieved from
http://www.denisonconsulting.com/model-surveys/denison-
model/organizational-culture
Denison overview: Introduction to the denison model.(n.d). Retrieved May 23,
2012 from
http://www.swinburne.edu.au/corporate/hr/culturesurvey2012/docs/deniso
n-model.pdf
Felitti, V. J., Anda, R. F., Nordenberg, D., Williamson, D. F., Spitz, A. M.,
Edwards, V.,... Marks, J. S. (1998). Relationship of childhood abuse and
household dysfunction to many of the leading causes of death in adults:
The adverse childhood experiences (ACE). American Journal of
Preventative Medicine, 14(4), 245-258. Retrieved from
http://download.journals.elsevierhealth.com/pdfs/journals/0749-
3797/PIIS0749379798000178.pdf
Glisson, C., & Hemmelgarn, A. (1998). How organizational culture influences
organizational climate and interorganizational coordination on the quality
of outcomes of children's service systems. Child Abuse & Neglect, 22(5),
401-421.
Gordon, G. G., & DiTomaso, N. (1992). Predicting corporate performance from
organizational culture. The Journal of Management Studies, 29(6), 783-
783. Retrieved from http://search.proquest.com/docview/
194222103?accountid=38507

Organizational Culture
88
History of the sanctuary model. (n.d.). Retrieved March 20,2012 from
http://www.sanctuaryweb.com/history.php
Jacobson, A., Koehler, J. E., & Jones-Brown, C. (1987). The failure of routine
assessment to detect histories of assault experienced by psychiatric
patients. Hospital and Community Psychiatry, 38(4), 386-389.
Jacobson, A., & Richardson, B. (1987). Assault experiences of 100 psychiatric
inpatients: Evidence of the need for routine inquiry. The American Journal
of Psychiatry, 144(1), 908-913.
Kotter, J. P., & Heskett, J. L. (1992). Corporate culture and performance. New
York, NY: The Free Press.
Lee, K., & Yu, K. (2004). Corporate culture and organizational performance.
Journal of Managerial Psychology, 19(4), 340-359. Retrieved from
ProQuest Central.
Marcoulides, G. A., & Heck, R. H. (1993). Organizational culture and
performance: Proposing and testing a model. Organization Science, 4(2),
209-209. Retrieved from http://search.proquest.com/docview/
213830419?accountid=38507
Mobley, W. H., Wang, L., & Fang, K. (2005). Organizational culture: Measuring
and developing it in your organization. Harvard Business Review China,
March 2005,128-139. Retrieved from http://www.denisonconsulting.com/
sites/default/files/documents/resources/mobley-2005-hbr-culture_0.pdf

Organizational Culture
89
National Child Traumatic Stress Network. (2008). Sanctuary model: General
information. Retrieved from http://www.sanctuaryweb.com/PDFs/
A6m.%20NCTSN%20Promising%20Practice.pdf
Sanctuary model: An integrated theory. (2012a). Retrieved March 3,2012 from
http://www.sanctuaryweb.com/sanctuary-model.php
Sanctuary model: Organizational stress and organizational culture. (2012b).
Retrieved from http://www.sanctuaryweb.com/organizational_culture.php
Smalarz, A. M. (2006). Inside the black box: The effect of physician group culture
and structure on patient cost and quality of care outcomes. Brandeis
University, The Heller School for Social Policy and Management.
ProQuest Dissertations and Theses, 145 p. Retrieved from
http://search.proquest.com/docview/304938310?accountid=3 850
Sorensen, J. B. (2002). The strength of corporate culture and the reliability of firm
performance. Administrative Science Quarterly, 47(1), 70-91. Retrieved
fromhttp://search.proquest.com/docview/203917387?accountid=38507
Wright, D. C., & Woo, W. L. (2000). Treating post-traumatic stress disorder in a
therapeutic community: The experience of a Canadian psychiatric
hospital. Therapeutic Communities: The International Journal for
Therapeutic and Supportive Organizations, 21(2), 105-118. Retrieved
from http://www.sanctuaryweb.com/PDFs_new/wright_woo.pdf

Organizational Culture
90
Appendix A
Request for Approval Email to Denison
and Permission from Denison for Use of Survey

Organizational Culture
91
Approval Email for Use of Denison Organizational Culture Survey
Ap13j12*pip0)/j
| KDarafc, • Vwnwankvn^tootoiMini. wey^^iMte^MelDrwellyMWttMteMl»taKMtywMto>M*ncefU78oi|nUioBs.
VyoM have anyqiMim, Mite to cubcttt. laabokiigforwirttoMMglttrettbofyoiir wort. Best
- 1 fcftMwi
*Mt Rid*. Api 15,
Ir.KanlWw* MjMt f*d: RaquMi to Obtain Ml U» Draon Oganninnii Cuftm 9w«y
®HK Jte 0—iMiOooBfan—fiBBtert DOCS_M.tapl*jdi
- •>** •.

Organizational Culture
92
0 denison*
tanMor 2na
Bringing Organizational Culture and Leadership to the Bottom Line,
August 20,2012
To whom it may concern:
Danielle Vacco has received permission to use Denison Consulting materials for publication and presentations with the understanding that these materials be used solely for research purposes. The details of this agreement are recorded in die Denison Consulting Toms of Use for Researchers.
KenUehara Data Manager
121W. Washington St, Suite 201 An&Aibor, MI 48104 United States of America [email protected]
734-302-6085

Organizational Culture
93
Appendix B
D'Youville College Institutional Review Board
Full Approval Letter

Organizational Culture
94
DYouville C O L L E G E
(716) 829-8000 FAX; (716) 829 7790
TO: Danielle Vacco
FROM: Dr.RogerFiedler\\ Institutional Review Board
DATE: July 30,2012
SUBJECT: ERB FULL APPROVAL
I am pleased to inform you that your application to the DTouviJle College Institutional Review Board entitled: "Orgtadtationtd Culture Under The Sanctuary Model: A
human subjects. This means that yo« may now begin your research unless you must first apply to the IRB at the institution where you plan to conduct the research.
Please note that you are required to report bade to this IRB for further review of your research should any of the following occur
1. a major change in the method of data collection 2. unanticipated advene effects on the human subjects 3. unanticipated difficulties in obtaining informed consent or maintaining
confidentiality 4. the research has not beea completed one year from the date of this letter
Congratulations and good luck on your research!
Descriptive Study" has been granted FULL A VAL with respect to the protection of
cc: Director of Graduate Studies Dr Elizabeth Miranda file

Organizational Culture
95
Appendix C
Permission Request to Agency

Organizational Culture
96
From: dvaccol To: Subject: Organizational Culture Survey Attachment: Cover Letter
Dear
As previously discussed, I would like to partner with your division to produce research on the Sanctuary Model.
I have attached the cover letter of the research proposal to further explain the research.
I am looking for written confirmation to move forward with distributing my survey to your division.
Thank you for your time and response,
Danielle Vacco Student - D'Youville College

Organizational Culture
97
Appendix D
Permission Letter from Agency

Organizational Culture
98
MS.VKO,
Ptan M Mi n^F MM ift ny vMli Hd ippranl ts dMMvlB fw fMMtft xnMy b ttit MftofNS HWR Hy BMHM. I mrt <pt kd h yar (oeadi mkam a* dfcr aiy aMMnf «tnce you my rafto k lis picas.
Skarejir,
2512 7:42 AM
Dor May,
As ptvaadf (fanned, I wald %t to patoer with jwr dnaas to confat a sarwy to describe pocqHioB of <*pmntad erfm "do fee Smary Model
I taw ttcfced (be cover fcttt of the nseack proposd to fate cqfaii te reseack E id • fe letter Irani DYC fa DtB apprwd to coodal bis stadjr.
I a botag fa writer corfariin to BOW farad wifc dsktaag ay srej to ym Mm
TlafcycofcrytwrtBe aritapnse,
DaaekVaxo Mrf-irToafrCi

Organizational Culture
99
Appendix E
Emailed Letter of Invitation
Organizational Culture
100
Subject: Organizational (Culture Survey
Dear i I am conducting a research study in partial fulfillment of the requirements for my master's degree at D'Youville College. I am seeking your participation in a 25-minute survey about your opinions on the organizational culture within
Your participation would be greatly appreciated.
This study is part of the academic requirement for my master's degree. All results are anonymous.
Please click on the following link to Survey Monkey to complete the survey. All links allowing participant identification have been disabled. If you would rather complete a hard copy, you can use the link to print out the survey and return the hard copy anonymously via interoffice mail.
Survey Monkey link:
Thank you for your time and participation.
Danielle Vacco Student - D'Youville College

Organizational Culture
101
Appendix F
Cover Letter Attached to Emailed Survey

Organizational Culture
102
I am currently conducting a research study for my master's degree entitled: Organizational Culture Under the Sanctuary Model: A Descriptive Study to determine your perceptions of organizational culture in an agency using the Sanctuary Model. You were chosen as part of the sample because you are an employee of such an agency. As a subject, you will be asked to fill out a survey which should require no more than 25 minutes. As you can see attached to this email, the survey must be completed through Survey Monkey. Completion and submission of the survey implies consent.
Your participation in this study is completely voluntary. If you choose to participate, you may change your mind at any time up to the point of submitting the survey. As surveys are anonymous and responses cannot be linked to any individual, surveys cannot be returned once submitted. There is no penalty or loss of benefits to which you are otherwise entitled to if you choose not to participate.
The procedures in this study are not considered experimental. Participation in this study has no more risk than what you experience in your normal day-today activities. There may be no direct benefits to you for participating in this research, but the knowledge gained from this research will be presented to the agency in group form only.
Any information you provide during the course of the study will remain anonymous. Your name will not be associated with your information and information about the study will be reported in group form only. The demographic section of the survey excludes sex identifiers to further protect the identity of participants.
The purpose of this letter is to assure that you are given sufficient information to make an informed decision as to whether you will consent to be a subject in a study involving research. If during the course of the study you have questions about the research, tasks, or activities you are asked to perform or complete, or your rights as a research subject, you may contact Dr. Elizabeth Miranda alMPMMBBl and your questions will be answered.
Thank You.
Danielle Vacco

Organizational Culture
103
Appendix G
One-Week Deadline Email Reminder

Organizational Culture
104
nonal Culture Survey
From: dvaccol To: Subject (irga Attachment: Research survey
Dear
This is a friendly reminder that there is one week left for me to collect the surveys for my research study. Your input is valuable to my study. If you have already completed the survey, thank you for your participation. If you have not yet decided to participate, or have not completed a survey, I would appreciate you taking the time to give your input for my study. The survey will be offered until (date).
Thank you again for your time and participation.
Danielle Vacco Student - D'Youville College

Organizational Culture
105
Appendix H
Final Email Notice

Organizational Culture
106
From: dvacco To: Subject: Urgamzafio Attachment: Research survey
ulture Purvey
Dear if-
This is a last follow up to ask for your participation in my research study. I will be collecting survey responses for two more days until date?? and would really appreciate having your input. If you have already completed the survey, thank you for your time and participation.
Danielle Vacco Student - D'Youville College

Organizational Culture
107
Appendix I
Organizational Culture Survey

Organizational Culture
108
• <~o« | iiw anew
| »«aM
m ****** • »-«-»*•"
g- tl ni0) r'upu
| 4>%M

Organizational Culture
109
rfSM, pMpI

M m m w M * i i i i i (tOt raff (M 4RK HPMi MR* Wmm MM n 4 t* w «t jb m M M k M M II M I t M
! n I I f 1 1 n 1 i ! i i M I J' * m M m ^ asss ells' nsss ill • ^ • » to M
s i n I I , t f t I
I * 1 I
• • • • • I • • • • • • ! • II • II II II •_ |f hi nun
' T *. ii i }l i I f
« r

I I 1 1 I
I 1
1 f
I
1
i J id » • #
I
<
i
1 I fii i I
.IB
i
j
liii! I hill Illii! ! • • • * * m w * * + * (I * « * • • * * * * * | * * * t t
n i s i
i i H i l l n • « m «

Organizational Culture
112
wfcii iri|

Organizational Culture
113
*2Xto< isa' fa
| 2*CHM0Mi ! MlhilM
I •—
*aci
I *" l»-I »«
*25. hi
• -• >' • «-
Ifltt
*2Cthi
way to <
»a>
teHhehawel rite tofap
!B1 a9" MtahMrt
• *'
*27.

I
i I
I J
I .t «
1 . M i ' . • I t l i f M i l l a « a • a . • • a a a a « I - « • * < l l l l l « i I I R H I
j i i s i, » j l i l l l l l l i l S * « « * « , « * « « « * < • « « « « • W f ( H 4 S « < «
J HI 81 Si il HI m • •I • • • w»sr CES USH HH 9H w HK HI UK NH IB*

I r 1
i t A
1 i
I l i
i j
f 1 J
*
1
i
I I J
i
i
I j
f i I i I i I I ! 1 i l h i f I f l u ! i f l nMh iH ! J !h ! A - « w * * w w « n « » • • « A • ^ f | A V • » # ( ! « « « t f 1 •• HMB fll̂ M MM gm JHIte MM SBH M| H flHi •HB jyagk ««
inii HI H • • ̂ inii! • IK • isi it sR H H Hi H k y H B IB IHs SP

Organizational Culture
116

Organizational Culture
117

Organizational Culture
118

Organizational Culture
119
•npaizatiM, lfc • widespread apnoMat |t.<
I*"
l»"
I 4>«fM
*53.1.
J »»PH|WI
4>A«M*
I1 '
i '* ; s>
:4 1
I»«
I1* l»*
l»* ! 4« !»«
pMptC riostainlat tobei
i»«
*• ! «•
! §»

Organizational Culture
120
*57.fei<
l , B
l»-
l»*
I4"' !•»
ialwjtei
I1"
I" I MNmM
!«•
iwtlwHii
\ ftmm
| »*l
i«»l
js»«
j i»
it-
| »H*M
I «•
• »'
*«1.hi sheMene *•*<$ i
rlMMftowviSM
! <»
i *' # »
4*t
S>6M^VM