CREATE
Noise and Vibration Assessment Methodology
June 2014
TABLE OF CONTENTS
1. INTRODUCTION....................................................................................................... 1
2. BACKGROUND ........................................................................................................ 1
3. OVERALL FTA IMPACT ASSESSMENT METHODOLOGY .......................... 2
4. KEY ELEMENTS OF NOISE ASSESSMENT ....................................................... 4
4.1 Noise Screening Procedure .................................................................................6
4.1.1 Project Limits ......................................................................................... 6
4.1.2 Screening Distances and Noise Evaluation Area ..................................7
4.1.3 Identify Sensitive Receptors ...................................................................9
4.2 General Noise Assessment .............................................................................. 11
4.2.1 Identify Noise Receptors, Receptor Clusters and Representative Receptors ........................................................ 11
4.2.2 Provide CTCO Receptor Information ...............................................13
4.2.3 Determine Background Noise Levels ................................................. 14
4.2.4 Predict Existing, No-Build and Build CREATE Program Train Noise Levels .................................................................... 17
4.2.5 Predict Overall Existing, No-Build and Build Noise Levels at Receptors with Frequent Exterior Use Areas ..........................20
4.3 Noise Impact Evaluation .................................................................................21
4.4 Detailed Noise Analysis. .................................................................................. 25
4.5 Mitigation Discussion .......................................................................................25
5. INTERIOR NOISE ASSESSMENT .......................................................................29
6. CONSTRUCTION NOISE AND VIBRATION ..................................................... 30
7. VIBRATION ASSESSMENT ..................................................................................30
7.1 Introduction ..................................................................................................... 30
7.2 Impact Assessment .......................................................................................... 33
7.2.1 Land Use Categories ............................................................................33
7.2.2 Impact Criteria .....................................................................................36
7.3 Vibration Mitigation Discussion .................................................................... 40
8. HIGHWAY-RAIL GRADE SEPARATION NOISE AND VIBRATION ASSESSMENTS ...........................................................................................................41
9. NEPA PROJECT EVALUATION .......................................................................... 42
10. VIEWPOINTS OF BENEFITED RECEPTORS AND COORDINATION WITH THE PUBLIC ............................................................................................................ 43

LIST OF FIGURES
FIGURE 3-1 FTA Noise and Vibration Assessment Process .................................... 2
FIGURE 4-1 CREATE Noise Assessment Process ..................................................... 5
FIGURE 7-1 CREATE Vibration Assessment Process ............................................. 32
LIST OF TABLES
TABLE 4-1 Screening Distances for Unobstructed Sight Lines for Low, Medium and, High Train Activity vs. Noise Receptor Location .................................................................................................. 8
TABLE 4-2 Screening Distances with Intervening Obstructions for Low, Medium, and High Train Activity vs. Noise Receptor Location .................................................................................................. 8
TABLE 4-3 Low, Medium, and High Train Activity Characteristics ................... 9
TABLE 4-4 Ambient Noise Level Categories ............................................................. 9
TABLE 4-5 Land Use Categories .............................................................................. 10
TABLE 4-6 Cumulative Noise Level Increase Defining FTA Noise Impact Criteria ...................................................................................................23
TABLE 4-7 Unit Costs for Additional Civil and Structural Work .......................27
TABLE 5-1 Building Noise Reduction Factors Due to Building Exteriors ..........29 TABLE 7-1 Ground-Borne Vibration (GBV) and Ground-Borne Noise
(GBN) Impact Criteria for General Assessment ................................32
LIST OF APPENDICES APPENDIX A Screening Distances for Potential Noise Impact by Ambient
Location and Train Activity for CREATE Projects APPENDIX B CREATE Railroad Noise Model User Guide, 2006
APPENDIX C Table and Figure Excerpts from FTA Transit Noise and
Vibration Impact Assessment (May 2006) APPENDIX D Example Project EX-1 Exhibits
APPENDIX E Example Project EX-1 Noise and Vibration Assessment
Summary Tables APPENDIX F Additional Example Exterior and Interior Noise Assessment
Summary Tables

1
1. INTRODUCTION
This document discusses procedures for assessing noise and vibration impacts of proposed projects within the CREATE Program. Each proposed project will be evaluated for potential noise and vibration impacts to fulfill National Environmental Policy Act of 1969 (NEPA) requirements. Unlike highway and transit improvement projects, there are no federal guidance documents or methods specifically applicable for the evaluation of freight train traffic noise and vibration impacts. The Federal Transit Administration (FTA) has developed a Transit Noise and Vibration Assessment, May 2006 manual (FTA Manual) for the evaluation of transit projects, but this methodology does not specifically address freight train traffic.
These procedures include modifications to the methodology described in the FTA Manual. The modifications allow for the evaluation of freight train traffic noise and vibration impacts. Other modifications, such as those related to interior noise assessments, are also included because the CREATE Program is funded through SAFETEA-LU Section 1301. Section 1301 requires the CREATE Program to be subject to requirements of Title 23, United States Code, as applicable.
The purpose of this document is to provide noise and vibration assessment guidance by defining a consistent and defensible approach for project evaluations. As each project is unique, judgment is needed in applying the procedures to the individual projects.
2. BACKGROUND
The CREATE projects include both commuter train and freight train traffic along the project corridors. There are major differences between commuter and freight train traffic. Freight trains have different and the potential for greater noise impacts than commuter trains due to the greater locomotive horsepower, and differences in train schedules (freight trains typically have more frequent and more nighttime activity), train weight (freight trains are typically heavier), and train length (freight trains are typically longer).
The FTA methodology included in the FTA Manual is generally applicable for assessing the potential noise and vibration impacts from the proposed CREATE projects; however, due to the differing characteristics of freight trains, this document modifies some aspects of the FTA methodology for the purpose of applying it to the CREATE projects. The FTA impact criteria were developed from established basic research on noise annoyance; therefore, they are considered applicable for assessing CREATE impacts. The FTA Manual does not include a methodology for performing interior noise assessments, nor does it include interior noise impact criteria. This document includes an interior noise assessment methodology that will be applied at locations where interior noise must be evaluated and utilizes the interior noise impact criterion included in 23 CFR Part 772 to determine whether impacts occur.

2
The noise screening distances and the general assessment model included in the FTA Manual have been modified to address freight train traffic associated with the CREATE Program. The train traffic input data are developed by a train traffic model that includes all of the CREATE Program infrastructure improvements. Generally, each project’s noise and vibration assessment assumes that the entire CREATE Program is implemented. Each project’s noise and vibration impacts are based on impacts resulting from implementing the entire CREATE Program rather than only the implementation of the single project that is being assessed. Any exceptions to this approach will be reviewed on a case-by-case basis.
3. OVERALL FTA IMPACT ASSESSMENT METHODOLOGY
The FTA noise assessment methodology is presented in the FTA Manual. FTA’s approach is a three-tier process and is summarized in Figure 3-1.
FIGURE 3-1 FTA Noise and Vibration Assessment Process

3
Tier 1 – Screening Procedure The Noise Screening Procedure uses screening distances to identify noise-sensitive land uses in the vicinity of the project. The FTA screening distances are based on conservative assumptions for commuter train traffic. The Noise Screening Procedure is presented in Chapter 4 of the FTA Manual. For the CREATE Program, new noise screening distances have been developed for identifying locations where a CREATE project may cause noise impacts from freight and commuter/passenger (Amtrak and Metra) train activity. The Vibration Screening Procedure uses screening distances to identify vibration- sensitive land uses in the vicinity of the project. The Vibration Screening Procedure is presented in Chapter 9 of the FTA Manual. Tier 2 – General Assessment The General Noise Assessment methodology is presented in Chapter 5 of the FTA Manual and uses project specific information. A CREATE Railroad Noise Model User Guide, included in Appendix B, has been developed specifically for application on CREATE projects. These two guidance documents are to be used for the General Noise Assessment.
Noise levels are predicted at sensitive receptor locations for the existing, no-build and build scenarios using the FTA methodology with the CREATE railroad noise model. If the General Noise Assessment methods predict potential noise impacts, then the Detailed Noise Analysis methods are used to refine the analysis and predict potential impacts.
The General Vibration Assessment methodology is presented in Chapter 10 of the FTA Manual and uses information regarding the project specifics. If the General Vibration Assessment methods predict potential vibration impacts, then the Detailed Vibration Analysis methods are used to refine the analysis and predict potential impacts.
Tier 3 – Detailed Analysis The Detailed Noise Analysis methodology is presented in Chapter 6 of the FTA Manual. The Detailed Noise Analysis provides the highest degree of accuracy using site-specific information. The Detailed Noise Analysis utilizes additional information not included in the General Noise Assessment, including topographic information. Noise impacts identified in the Detailed Noise Analysis will require the evaluation of mitigation. The FTA methodology provides equations in Chapter 6 (Detailed Noise Analysis) of the FTA Manual that are used to evaluate the effectiveness of noise walls.
The Detailed Vibration Analysis methodology is presented in Chapter 11 of the FTA Manual.

4
4. KEY ELEMENTS OF NOISE ASSESSMENT
The three-tiered methodology developed by FTA will be used to evaluate the noise impacts of proposed CREATE projects. Descriptions of the differences between the FTA Manual and procedures for the assessment of CREATE projects are discussed in the following sections. These differences relate to the utilization of the CREATE railroad noise model, the model inputs, evaluating the existing, no-build, and build conditions, and applying the FTA impact criteria consistently for all projects. Figure 4-1 presents the general flow chart for the CREATE noise evaluation. Application of the CREATE screening distances, the CREATE Noise Modeling and the FTA methodology will be demonstrated throughout the document using an example project (See Appendices D and E). The following is a general description of the example project. Example Project Description: Example project EX-1 includes signal upgrades to improve track control between the southwest/northeast (Track 1, 2, 3 and 4) track corridor and the north/south track corridor (Track 1). (See Exhibit 1 in Appendix D.) The corridor is located within the Chicago (urban) area. Currently, trains moving from one corridor to the other are limited to 10 mph due to the restricted visibility. Signal improvements will improve track control allowing trains to move through the corridor at 30 mph. Infrastructure improvements are limited to replacing the two signal controls in the signal control box. There are no track improvements proposed. In addition to the increase in train speed between the signals, the improved track control will allow more trains to move through the switches (Track 1). No speed, volume or other changes are expected on the three additional tracks (Tracks 2, 3, and 4).

5
FIGURE 4-1 CREATE Noise Assessment Process
Noise Screening Procedure
Identify Project Limits
Apply Screening Distance
Sensitive Land Use Within Evaluation Area? No
Conduct General Noise Assessment
General Noise Assessment
Yes No Further Evaluation
Identify Noise Receptors, Receptor Clusters and
Representative Receptors
Provide CTCO Receptor
Information
Determine Background Noise Levels at Receptors with Frequent Exterior Use
Predict Existing, No-Build, & Build CREATE Program Train
Noise Levels
Predict Overall Existing, No- Build and Build Noise Levels
at Receptors with Frequent Exterior Use Areas
Proceed with Impact Evaluation Based on General Assessment
Impact Evaluation
Calculate Project Noise Exposure for New and Re-introduced Rail Corridor Projects or Noise Exposure Increase
for Improvement to Existing Rail Corridor Projects
Use FTA Figure 3-1 or FTA Table 3-1 to Determine if there
are Impacts for New and Re-introduced Rail Corridor Projects. Use FTA Figure 3-2 or CREATE Table 4-6 to
Determine if there are Impacts for Improvement to Existing Rail Corridor Projects. Use Interior Criteria (if applicable) if
there are No Frequent Exterior Use Areas.
No Further Evaluation No Impact Identified?
Conduct Detailed Noise Analysis Yes
Detailed Noise Analysis
Determine Background Noise Levels at Receptors with
Frequent Exterior Use Areas
Predict Existing, No- Build, & Build CREATE
Program Train Noise Levels
Predict Overall Existing, No- Build and Build Noise
Levels at Receptors with Frequent Exterior Use Areas
Proceed with Impact Evaluation Based on Detailed Analysis
Impact Identified? No No Further Evaluation
Yes Conduct Mitigation Evaluation for Build Scenario Only Using Equations in Chapter 6 of the FTA Manual and CREATE Mitigation Criteria

6
4.1 Noise Screening Procedure
Noise Screening Procedure (Tier 1)
Identify Project Limits
Apply Screening Distance
Sensitive Land Use Within Evaluation Area? No
Conduct General Noise Assessment
Yes No Further Evaluation
4.1.1 Project Limits
Each proposed CREATE project was defined based upon its independent utility. Each project has unique features and proposed improvements. These site-specific conditions are to be considered in defining the project limits. The project’s purpose and need statement should be reviewed to assist in determining the project limits. In general, for projects where a Categorical Exclusion (CE) is anticipated, the evaluation area designated for noise assessments will be based upon the project limits. The noise evaluation area will encompass the area defined by applying the appropriate screening distances to the project’s limits. The project limits should include infrastructure directly changed by the project’s proposed improvements. All
Example Project EX-1
Infrastructure improvements are limited to upgrading two signal controls in the signal control box. While the signal controls may be in one location where the physical construction work will occur, the actual signals controlled by these improvements are in two separate locations. Therefore, the project limits extend to the signal locations and these project limits establish the basis for the noise and vibration evaluation area. See Appendix D, Exhibit 1.
infrastructure elements that affect the train characteristics (speed, volume, distance to receiver, switch locations) should be included in the project limits. The project limits do not include areas outside of the infrastructure improvement area that may experience changes as a result of the infrastructure improvements. (See example project discussion.) Projects with potentially significant impacts may require the preparation of an Environmental Assessment (EA) and/or an Environmental Impact Statement (EIS). Within these environmental documents, direct noise impacts from the proposed CREATE Program will be evaluated for sensitive receptors identified within the noise evaluation area, similar to the CE projects. Additionally, these projects may require a qualitative evaluation of secondary or indirect noise and vibration impacts for those areas beyond the project limits.

7
4.1.2 Screening Distances and Noise Evaluation Area
Once the project limits have been determined, the first tier of the FTA assessment can be applied to determine the noise evaluation area. Noise screening distances are applied to the project limits to determine the noise evaluation area. If the project being evaluated includes improvements to more than one track, the appropriate screening distances will be applied to each track to determine the noise evaluation area for the project. For CREATE projects that include only commuter/passenger trains, the noise screening procedures in Chapter 4 of the FTA Manual will be applied. For projects that include only freight trains, or both commuter/passenger and freight trains, the procedures described below will be applied.
Example Project EX-1 Infrastructure improvements are limited to the two signals. Train speeds and volumes will increase beyond the two signals. The noise and vibration evaluation area will be the area along the railroad tracks between the two signals to address potential impacts of the speed change. The screening distances are measured from the railroad tracks between the two signals. See Appendix D, Exhibit 2.
Noise screening distances for CREATE Program train traffic have been developed for low, medium and high train activity within three ambient noise condition categories. If there are unobstructed sight lines between the noise source (i.e. trains) and the sensitive receptor, use the screening distances in Table 4-1. If there are obstructions (e.g., buildings, terrain) in the sight line between the noise source (i.e. trains) and the sensitive receptor, use the screening distances in Table 4-2. Table 4-3 defines the low, medium and high ranges of train activity for freight and commuter/passenger rail. Table 4-4
the ambient noise levels for the three defined ambient noise level categories: normal suburban residential, urban residential and noisy urban residential. Refer to the supporting memorandum in Appendix A for specifics on how to use the tables. In order to utilize these tables, the build alternative(s) train traffic information must be obtained from the Chicago Transportation Coordination Office (CTCO). A determination must be made as to which sections of the projects have generally homogeneous train traffic characteristics. These sections will likely coincide with major control points where train traffic changes substantially. Once these sections have been identified, the sections should be delineated on aerial photography and provided to the CTCO, along with other receptor specific information as described in Section 4.2.2. The CTCO will provide train volumes and other train information for each section. These train volumes will be used in conjunction with Tables 4-1 through 4-4, as appropriate, in determining screening distances and establishing noise evaluation areas. The CREATE screening procedures are meant to be conservative to ensure that all potentially impacted receptors are included in the noise analysis. The highest train variable in Table 4-3 should be used to determine the activity characteristics and screening distance.

8
Screening Distance (ft from centerline of track)
Ambient Category
Train Volume
Low (Freight Only)
Low Mix (Freight and Passenger3)
Medium (Freight1 )
High (Freight1,2 )
Normal Suburban Residential
400 450 1,000
1,500
Urban Residential 300 350 750 1,200
Noisy Urban Residential
150 200 450
750
Screening Distance (ft from centerline of track)
Ambient Category
Train Volume
Low (Freight Only)
Low Mix (Freight and Passenger3)
Medium (Freight1 )
High (Freight1,2 )
Normal Suburban Residential
200 225 500
1,000
Urban Residential 150 175 375 750
Noisy Urban Residential
75 100 225
500
An alternative screening method may be used which does not require the CTCO to provide train data for the screening process. The alternative method assumes the worst- case scenario, so it is a more conservative screening method than the method described in the preceding paragraph. In this alternative screening method, use the “High (Freight)” screening distances found in Tables 4-1 and 4-2, as applicable, for the appropriate “Ambient Category” of the project (see Table 4-4). If sensitive land uses are identified within the “High” screening distance, then a General Noise Assessment must be performed as described in Section 4.2.
TABLE 4-14
Screening Distances for Unobstructed Sight Lines for Low, Medium and High Train Activity vs. Noise Receptor Location
1 Addition of commuter/passenger train traffic does not change screening distances. 2 Use this category for grade crossings where horns are sounded. 3 Appropriate category when commuter/passenger/commuter present with low freight activity. 4 Table 4-1 derived from Table 4-2.
TABLE 4-2* Screening Distances with Intervening Obstructions** for Low, Medium and High
Train Activity vs. Noise Receptor Location
1 Addition of commuter/passenger train traffic does not change screening distances. 2 Use this category for grade crossings where horns are sounded. 3 Appropriate category when commuter/passenger/commuter present with low freight activity. *Source for Tables 4-1, 4-2, and 4-3: Screening Distances for Potential Noise Impact by Ambient Location and Train Activity for CREATE Projects (see Appendix A). **Obstructions can include intervening buildings, terrain, embankments, and structures such as overpasses and retaining walls that block the line of sight between the noise source (i.e. trains) and sensitive receptors.

9
TABLE 4-3* Low, Medium and High Freight Train Activity Characteristics
Train Activity
Trains per Day Speed (mph) Length of Cars
(feet)Locomotives
/train Low 5 to 40 10 to 20 1,000 to 4,000 1 to 2.08
Medium 41 to 75 20 to 30 4,000 to 6,000 2.08 to 2.5
High More than 75 More than 30 More than 6,000 More than 2.5 *Source for Tables 4-1, 4-2, and 4-3: Screening Distances for Potential Noise Impact by Ambient Location and Train Activity for CREATE Projects, Appendix A.
TABLE 4-4*
Ambient Noise Level Categories Ambient Category
Range of Ldn
(dB(A))Average Ldn
(dB(A))Average Census Tract Population
Density per Square Mile
Normal Suburban Residential
53 to 57 55 2,000
Urban Residential 58 to 62 60 6,300
Noisy Urban Residential
63 to 67 65 20,000
*Source for Tables 4-1, 4-2 and 4-3: Screening Distances for Potential Noise Impact by Ambient Location and Train Activity for CREATE Projects, Appendix A.
4.1.3 Identify Sensitive Receptors
The noise evaluation area is utilized to determine if there are any sensitive land uses that may be affected due to implementing the project. The three FTA land use categories (1, 2, and 3) are used to categorize sensitive receptors within the noise evaluation area. These land uses and the appropriate noise metric for assessing impacts are presented in Table 4-5.

10
TABLE 4-5 Land Use Categories
Land Use Category Noise Metric dB(A) Description of Land Use
1
Outdoor Leq (h)*
Tracts of land where quiet is an essential element in their intended purpose. This category includes lands set aside for serenity and quiet, and such land uses as outdoor amphitheaters and concert pavilions, as well as National Historic Landmarks with significant outdoor use. Also included are recording studios and concert halls.
2
Outdoor Ldn
Residences and buildings where people normally sleep. This category includes homes, hospitals and hotels where a nighttime sensitivity to noise is assumed to be of utmost importance.
3
Outdoor Leq (h)*
Institutional land uses with primarily daytime and evening use. This category includes schools, libraries, theaters, and churches where it is important to avoid interference with such activities as speech, meditation and concentration on reading material. Places for meditation or study associated with cemeteries, monuments, museums, campgrounds and recreational facilities can also be considered to be in this category. Certain historical sites and parks are also included.
* Leq for the noisiest hour of transit-related activity during hours of noise sensitivity.
Source: Harris Miller Miller and Hanson, Transit Noise and Vibration Impact Assessment, FTA, 2006.
Based on the review of the land uses within the project’s noise evaluation area, sensitive receptors will be identified. The noise evaluation will continue with the General Noise Assessment if noise-sensitive land uses are identified within the noise evaluation area. If there are no noise-sensitive land uses within the noise evaluation area, then no further evaluation is required, and the project should be documented accordingly.
The noise metrics established by FTA apply to exterior use area locations. If no exterior use areas are identified for receptors within the screening distance, refer to Section 5 (Interior Noise Assessment) to evaluate these receptors. Residential land uses shall always be evaluated for exterior use areas where outdoor use is most likely to occur.
For parks, if frequent exterior use locations such as paths, picnic tables, shelters, and ball fields are within the screening limits, a general assessment must be performed for the parks at these exterior use locations. If these types of frequent exterior use locations are not within the screening limits, in general, a General Noise Assessment will not be

11
required for these parks, even though a portion of the park with no identified exterior use locations may be within the screening distance. CREATE projects often overlap or are within close proximity of other CREATE Projects in corridors with multiple rail lines. Also, some CREATE projects are in close proximity to other CREATE projects that are in different corridors. Therefore, sensitive receptors can be affected by CREATE train noise from multiple projects. When sensitive receptors have been identified for a project through the noise screening procedure, CREATE Program train noise sources from all CREATE projects, both in the same corridor and adjacent corridors, must be identified and used in the General Noise Assessment and the Detailed Noise Analysis.
4.2 General Noise Assessment
General Noise Assessment (Tier 2)
Identify Noise Receptors, Receptor Clusters and
Representative Receptors
Provide CTCO Receptor
Information
Determine Background Noise Levels at Receptors with Frequent Exterior Use
Predict Existing, No-Build, & Build CREATE Program Train
Noise Levels
Predict Overall Existing, No- Build and Build Noise Levels
at Receptors with Frequent Exterior Use Areas
Proceed with Impact Evaluation Based on General Assessment
Once sensitive receptors are identified in the screening procedure of the noise assessment, additional project-specific information is needed to conduct the General Noise Assessment. This includes receptor specific train traffic data from the CTCO and background noise levels. The FTA General Noise Assessment methodology will be applied using these data. 4.2.1 Identify Noise Receptors,
Receptor Clusters and Representative Receptors
Receptor Clusters Sensitive receptors can be clustered (grouped together) where the noise level is expected to be similar and land uses are the same. For example, a group of residences equidistant from the rail line may
Example Project EX-1
The noise and vibration screening zones depicted in Appendix D, Exhibit 2 were reviewed for sensitive receptors which are highlighted in Appendix D, Exhibit 3. The noise screening zone varies from 750 feet based on an urban area with a high train activity level (train speed greater than 30 mph), to 1,200 feet based on urban residential with a high train activity level (See Appendix D, Exhibit 2). Within each of the receptor clusters, the representative receptors locations have been identified (See Appendix D, Exhibit 3). Based on the information available, the receptor information can be tabulated and presented to the CTCO to develop the train traffic data needed for the modeling.

12
be clustered, as each will have similar noise exposure. One residence can be selected within the clustered group to represent the cluster. This approach is consistent with FTA and FHWA approaches in assessing potential impacts. See Section 6.1.3 and Appendix C in the FTA Manual for further information on receptor clusters. Receptor Location Each receptor cluster will be represented by a single receptor location. The location of this receptor within the cluster shall represent the “worst case” condition allowing for a conservative estimate for the receptor cluster. For these representative receptors, and for stand-alone receptors, the distance to the railroad tracks will be measured from the frequent exterior use area facing the noise source for noise predictions. When the land use is Category 2, (residences and buildings where people normally sleep), the frequent exterior use area may be assumed to be approximately six feet from the side of the building facing the noise source, unless there is an identifiable frequent exterior use location closer to the noise source, such as a patio near the back property line of a residence. In those cases, the frequent exterior use location closer to the noise source should be analyzed for impact. For parks (normally Category 3), use the frequent exterior use locations such as paths, picnic tables, shelters, and ball fields for assessment purposes. For schools, playgrounds are considered frequent exterior use locations. In determining and abating noise impacts, primary consideration is given to exterior areas. Abatement will usually be necessary only where frequent human use occurs and a lowered noise level would be of benefit. In those situations where there are no exterior activities to be affected, or where the exterior activities are far from or physically shielded in a manner that prevents an impact on exterior activities, FHWA’s interior criterion will be used as the basis for determining noise impacts. For those Category 2 (hospitals only) and 3 receptors without any identifiable areas of frequent exterior use, interior noise levels will be evaluated based upon the noise level at the face of the building less the appropriate noise reduction factor, rather than six feet from the building, as discussed in Section 5, Interior Noise Assessment. The exception to this is for Land Use Category 2, residential receptors, where interior assessments are not required and an exterior location will always be evaluated based on the location most likely used for outdoor use. The receptor elevation is not a factor in the General Noise Assessment as the model input only includes the horizontal distance between the source and the receptor; however, the receptor elevation (i.e. floor) in a multi-story building should be considered when evaluating the “worst-case” receptor location in the Detailed Noise Analysis. Elevated track locations have the potential to generate higher noise levels above the ground floor level. For multi-story, multi-resident buildings (e.g., apartments) and/or their common areas, the area(s) of frequent use must be analyzed for impacts. The area of frequent human
13
use will be exterior areas. In some instances, balconies/patios may be present that must be analyzed because they are identified as areas of frequent human use. In other instances, balconies may not exist or may have very limited use, but instead, common areas (e.g., pools, picnic areas, playgrounds) are present that must be analyzed because they are identified as areas of frequent human use. There may also be instances where both the balconies and the common area(s) need to be analyzed. Generally, in the case of common areas, impacts to the common area would be considered impacts on the residences of the apartments and each of the receptors/units generally would be considered to have the impact identified at the common area (i.e., all apartments would have the same impact). If other, public meeting rooms, schools, churches, libraries, hospitals and auditoriums do not have frequent exterior use areas, they also must be assessed for interior noise impacts as described in Section 5, Interior Noise Assessment. Undeveloped lands should also be considered as potential receptor locations. If the land is to be permitted as a land use meeting one of the land use categories (see Table 4-5), it should be evaluated if it is permitted for development prior to the approval of the environmental document for the project. The undeveloped lands will be considered permitted for development and should be included in the analysis if a building permit was issued/approved before the approval of the environmental document. If an undeveloped land was not included in the initial noise analysis because no building permit had been issued/approved at that time, but a building permit is issued/approved subsequent to the analysis and prior to receiving environmental approval (i.e., approval of the Categorical Exclusion (CE), the Finding of No Significant Impact (FONSI) for an Environmental Assessment, or the Record of Decision (ROD) for an Environmental Impact Statement), the undeveloped land must be assessed for noise and vibration impacts prior to environmental approval. Information for both noise and vibration receptors can be incorporated into the same exhibits.
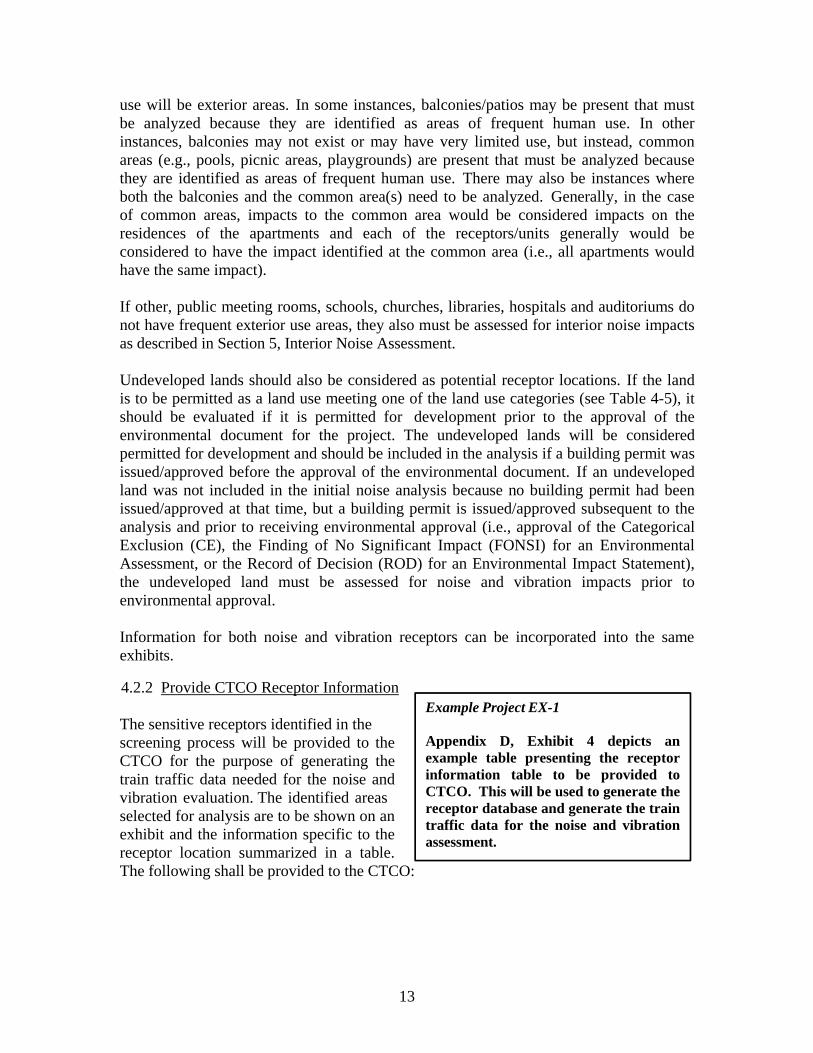
4.2.2 Provide CTCO Receptor Information The sensitive receptors identified in the screening process will be provided to the CTCO for the purpose of generating the train traffic data needed for the noise and vibration evaluation. The identified areas selected for analysis are to be shown on an exhibit and the information specific to the receptor location summarized in a table. The following shall be provided to the CTCO:
Example Project EX-1 Appendix D, Exhibit 4 depicts an example table presenting the receptor information table to be provided to CTCO. This will be used to generate the receptor database and generate the train traffic data for the noise and vibration assessment.

14
State plane coordinates, address and unique identifying number for the individual receptor or representative receptor in a cluster.
Aerial photography depicting the individual receptor or cluster, including the representative receptor.
Addresses or ranges of addresses of all receptors within a cluster.
Identification of all tracks in the vicinity of the project that may be affecting the receptors for which train traffic information is needed.
4.2.3 Determine Background Noise
Levels Background noise levels have to be determined to perform noise assessments at receptors with frequent exterior use areas. Determining background noise levels is not required when performing interior noise assessments for Improvement to Existing Rail Corridor Projects. For these project types, interior noise impacts are based solely on CREATE Program Train Noise Levels. Therefore, for those non-residential receptors without identifiable exterior use areas, proceed to Section 4.2.4 to predict CREATE Program Train Noise Levels without determining background noise levels. Determining background noise levels may be required when performing interior noise assessments for New and Re-introduced Rail Corridor Projects. If the CREATE Program Train Noise Level (Design Year) is below the interior noise impact threshold (51 dB(A)), the CREATE Program Train Noise Level
Example Project EX-1 If the CREATE Program affects train traffic on Track 1 but does not affect train traffic on Tracks 2, 3 and 4, the train noise from non-CREATE trains operating on Tracks 2, 3 and 4 will be included in the background noise level. If the CREATE Program affects train traffic on Tracks 1, 2, 3 and 4, the train noise from train operations on those tracks will be included in the CREATE Program train noise levels.
Example Project EX-1
Appendix E, Exhibit 5 presents the one- minute Leq (dB(A)) values measured at a receptor location (as an example). One train passed the meter during a five- minute period (minute 15 to minute 19). The monitoring session was extended five minutes from 60 minutes to 65 minutes to collect a full 60-minute period with no trains. The noise data with the train present was removed from the data set. Each of the remaining one-minute Leq
values was then converted to an equivalent sound pressure. The average equivalent sound pressure was then converted back to a decibel noise level to determine the overall hourly Leq value for this session (66.3 dB(A)) and represents the background noise level. If the measurement occurred between 7 am and 7 pm, the estimated Ldn value would be 64.3 dB(A) (66.3 – 2 = 64.3 which would then be rounded to 64 dB(A)). Correction factors are in Appendix D of the FTA manual.
(Design Year) will be compared to the existing background noise level to determine if there is an impact. If the CREATE Program Train Noise Level (Design Year) is more

15
than 14 dB(A) above the existing background noise level, an impact occurs. Refer to Section 5, Interior Noise Assessments, for further details. The FTA recognizes six options for determining existing noise for various land uses. These methods are described in the FTA Manual (Appendix D, Determining Existing Noise) and include look-up tables (Table 5-7, Estimating Existing Noise Exposure for General Assessment) and varying noise monitoring approaches. Given the urban setting of the CREATE Program, accurately estimating existing noise levels is important. Background noise contributions from adjacent expressways, local streets, and other rail sources need to be identified as part of estimating the existing noise levels. The background noise level determined for the existing condition will be used as the background noise level for the no-build and build scenario evaluations. For CREATE projects on new or re-introduced rail corridors, accurately estimating the existing noise levels includes capturing only background noise sources, as there is no train activity in the project corridor. For CREATE projects that improve existing corridors, accurately estimating the existing noise levels includes capturing both the background noise sources (that is, exclusive of CREATE Program train noise, such as highways, local roads, airport traffic, industrial activity, etc.) and the existing noise from CREATE Program train traffic (commuter and freight). CREATE Program train traffic can consist of two components: (1) CREATE program trains on tracks affected by the project, and (2) CREATE program trains on adjacent CREATE projects. For the purpose of assessing CREATE projects, the following modified noise monitoring methods will be used: Noise Monitoring Approach (Modified FTA Option 1 and Option 4) If CREATE freight and commuter/passenger train traffic information is provided by the CTCO for the existing scenario, noise monitoring will be used to evaluate the background noise levels using Option #1 for non-residential land uses on page D-2 of Appendix D and Option #4 for residential land uses on page D-3 of Appendix D in the FTA Manual. The FTA appendix is included in Appendix C. These options use one-hour noise monitoring periods to measure the hourly Leq. For residential land uses (Option #4), the Ldn will be computed from the hourly Leq. The noise monitoring results will be modified to account for the noise sources other than the CREATE freight or CREATE commuter trains using the corridor adjacent to the potentially affected land use if CREATE freight or commuter train traffic information is provided by the CTCO. If CREATE freight or commuter train traffic information is not provided by the CTCO for the existing scenario, the noise monitoring will have to account for all noise sources including the CREATE freight and commuter train noise sources. In these circumstances, the noise monitoring period will be determined on a case-by-case basis.
16
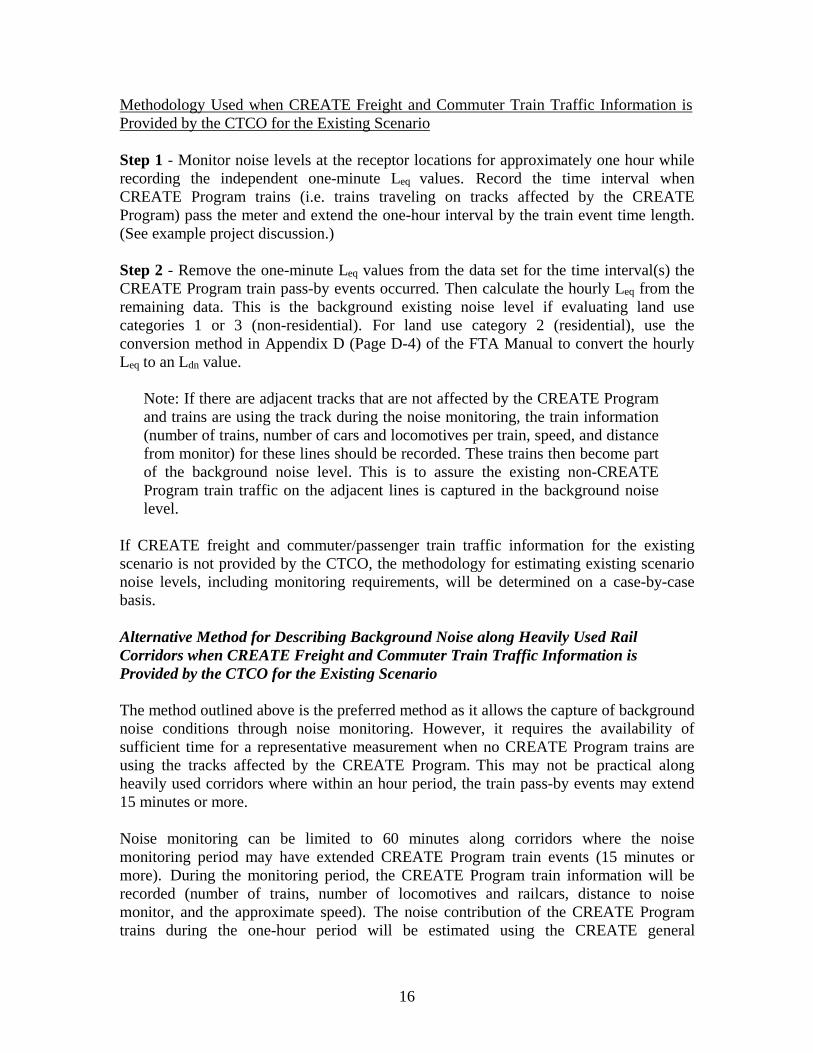
Methodology Used when CREATE Freight and Commuter Train Traffic Information is Provided by the CTCO for the Existing Scenario
Step 1 - Monitor noise levels at the receptor locations for approximately one hour while recording the independent one-minute Leq values. Record the time interval when CREATE Program trains (i.e. trains traveling on tracks affected by the CREATE Program) pass the meter and extend the one-hour interval by the train event time length. (See example project discussion.) Step 2 - Remove the one-minute Leq values from the data set for the time interval(s) the CREATE Program train pass-by events occurred. Then calculate the hourly Leq from the remaining data. This is the background existing noise level if evaluating land use categories 1 or 3 (non-residential). For land use category 2 (residential), use the conversion method in Appendix D (Page D-4) of the FTA Manual to convert the hourly Leq to an Ldn value.
Note: If there are adjacent tracks that are not affected by the CREATE Program and trains are using the track during the noise monitoring, the train information (number of trains, number of cars and locomotives per train, speed, and distance from monitor) for these lines should be recorded. These trains then become part of the background noise level. This is to assure the existing non-CREATE Program train traffic on the adjacent lines is captured in the background noise level.
If CREATE freight and commuter/passenger train traffic information for the existing scenario is not provided by the CTCO, the methodology for estimating existing scenario noise levels, including monitoring requirements, will be determined on a case-by-case basis. Alternative Method for Describing Background Noise along Heavily Used Rail Corridors when CREATE Freight and Commuter Train Traffic Information is Provided by the CTCO for the Existing Scenario The method outlined above is the preferred method as it allows the capture of background noise conditions through noise monitoring. However, it requires the availability of sufficient time for a representative measurement when no CREATE Program trains are using the tracks affected by the CREATE Program. This may not be practical along heavily used corridors where within an hour period, the train pass-by events may extend 15 minutes or more. Noise monitoring can be limited to 60 minutes along corridors where the noise monitoring period may have extended CREATE Program train events (15 minutes or more). During the monitoring period, the CREATE Program train information will be recorded (number of trains, number of locomotives and railcars, distance to noise monitor, and the approximate speed). The noise contribution of the CREATE Program trains during the one-hour period will be estimated using the CREATE general

17
assessment spreadsheet and the actual CREATE Program train information collected during the one-hour period. The noise level predicted with the CREATE general assessment spreadsheet will be subtracted from the measured hourly noise level (Leq) to predict the background noise level when performing a General Noise Assessment. The noise level predicted with the CREATE detailed analysis spreadsheet will be subtracted from the measured hourly noise level (Leq) to predict the background noise level when performing a Detailed Noise Analysis. Noise Exposure Computations from Partial Measurements Measurements can be made at some receptors and then these measurements can be used to estimate noise exposure at nearby receptors. In general, it is preferable to take noise measurements at each receptor, or at each representative receptor in a cluster; however, measurements at one receptor can be used to represent the noise environment at other receptors, but only when proximity to major noise sources is similar among the receptors. If this methodology is proposed, documentation should be provided outlining the rationale for using representative measurement sites. Typical situations where representative measurement sites can be used to estimate noise are included in the FTA Manual, Section 6.6.3.
4.2.4 Predict Existing, No-Build and Build CREATE Program Train Noise Levels
CREATE Program Train Noise Levels have to be predicted to perform noise assessments at receptors with frequent exterior use areas and for non-residential receptors with no identifiable frequent exterior use areas. In general, the CTCO, using the train model developed for the CREATE Program, will generate existing and future (design year) train traffic data for the existing, no-build and build scenarios for each CREATE project. This model provides freight traffic data from noon Wednesday to noon Sunday, a period of 96 hours. The train data provide
Example Project EX-1
Appendix E, Exhibit 6 depicts example CTCO data for one track adjacent to one receptor. This represents an example set of data that will be prepared for each track segment in front of each receptor location. Data will be provided by CTCO for the existing, no-build and build condition. For each receptor location, the train data for each track will need to be included in the noise predictions.
the arrival and departure time for each train, the train speed, the number of rail cars, the length and weight of each train, and the number of locomotives used for each train. These data are provided for each receptor location for each track affected by the CREATE Program adjacent to the receptor location. If CREATE freight or commuter/passenger train traffic information is not provided by the CTCO for the existing scenario, noise monitoring will be required to obtain CREATE Program Train Noise Levels for both freight and commuter/passenger trains. In these circumstances, the noise monitoring period will be determined on a case-by-case basis.

18
The following approach will be used to calculate the rail characteristics for the number of trains, speed, number of engines and number of cars. All of these factors are needed as inputs to the noise and vibration analyses. The rail characteristics determined using the following approach will be input into the CREATE general assessment spreadsheet along with the distance between the receptor locations and the tracks to predict the train noise levels. Approach for Ldn Estimation
1. The consultant will determine the peak traffic day, (Thursday, Friday or Saturday). Wednesday and Sunday are not to be considered as part of the evaluation due to limitations of the train traffic prediction model. The day with the peak number of trains will be used for the analysis.
2. For both the daytime (7 am to 10 pm) and nighttime periods (10 pm to 7 am), the
following values will be calculated:
a. Average speed b. Average number of locomotives per train c. Average length of railcars per train d. Average number of trains per hour
3. The length of cars will be calculated based upon the total train length and average
length of locomotives (75 feet) using the following formula:
Length of Railcars = Total train length (ft) – (No. of Locomotives * 75 ft) Variation for Leq Estimation
For receptor locations where the Leq noise metric is used, the CTCO data will need to be evaluated to predict the peak hour train volume that corresponds to the hours of receptor noise-sensitivity. The above listed data will need to be calculated for the peak hour. Approach for Lmax Estimation The Lmax is the maximum A-weighted sound level for a single pass by event. The Ldn and Leq noise metrics will be used to determine the potential noise impacts; however, computation of the Lmax for the existing, build and no-build alternatives provides a more complete description of the noise effects of the proposed project. Appendix F of the FTA Manual provides the formulas for calculating Lmax for the locomotives and for the railcars.
The Lmax calculation is based on the reference sound exposure level (SELref), distance between the noise receptor and tracks, the speed and the length of locomotives or railcars. Determination of the project Lmax will likely require computing the Lmax for several combinations of distance, speed and length. The SELref values for the various noise sources are provided in the CREATE Railroad Noise Model User Guide (Table 1)

19
provided in Appendix B. The project documentation will report the Lmax for the receptor location with the highest Lmax value and indicate the noise source (locomotive or railcar). In order to determine which receptor location has the highest Lmax value, Lmax will be calculated for each receptor requiring a Detailed Noise Analysis.
Additional Noise Inputs for the General Noise Assessment
Other potential noise sources within a corridor include idling trains, horn noise, track crossovers, and worn wheels. All of these can occur under existing and future conditions on the rail lines. The CREATE general assessment spreadsheet includes input for additional noise sources not included in the original FTA general assessment spreadsheet, including idling trains and track crossovers.
Idling Trains - The hourly Leq or Ldn value should be estimated for the idling train using the CREATE general assessment spreadsheet. The idling train noise source is identified as “layover track”. The inputs for the layover track include distance (between locomotives and receiver) and number of trains per hour. The CTCO data will identify idling trains as trains with different “HE Arrival” and “HE Departure” times. The noise assessment should capture idling noise and add that component to the General Noise Assessment. The proposed projects will likely reduce idling activity; however, there may be new locations where trains are staged.
Horn Noise - The hourly Leq or Ldn value can be estimated for horn noise using the SELREF provided in the FTA Manual (Table 6-3, Source Reference SELs at 50 feet: Fixed Guideway Sources at 50 mph). The noise assessment should capture horn noise (i.e. grade crossings) and add that component to the General Noise Assessment. The proposed projects will likely reduce horn noise activity; however, there may be new locations where trains are staged. Horn noise associated with locomotive startup for idling trains is considered short in duration and will not be included in the noise assessment. Worn Wheels - One variation between the evaluation of commuter train traffic and freight train traffic is the variability of wheel maintenance between carriers. In addition, one train may have rail cars from several different freight carriers. The likelihood of worn wheels on a freight train is greater when compared to commuter rail lines. To account for the higher probability of worn wheels, the CREATE general assessment freight railcars noise source includes an input for the percentage of worn wheels. Unless project specific data are available, the percentage of worn wheels should be input as 1%.
Track Crossovers – Track crossovers include switches, turnouts, crossing diamonds, or other track irregularities that create a wheel to rail impact, which would potentially increase the noise level. The CREATE general assessment spreadsheet includes track crossovers as a noise source. Inputs for this noise source include distance (between the track crossover and the receptor), the number of trains per hour using the crossover (day and night), and the average duration of train pass-by events in seconds (day and night). The average pass-by duration can be determined based on the average train length and average train speed.

20
As noted in Section 4.2.3, interior noise impacts are based solely on CREATE Program Train Noise Levels. Therefore, for those non-residential receptors without identifiable frequent exterior use areas, predict CREATE Program Train Noise Levels as follows:
For New and Re-introduced Rail Corridor Projects, there are no existing or no-build CREATE Program Train noise levels. Therefore, only the Build Scenario CREATE Program Train Noise Level (Design Year) will have to be predicted. Build Scenario CREATE Program Train Noise Level (Design Year) includes all train noise from build scenario (design year) trains operating on CREATE Program tracks.
For Improvement to Existing Rail Corridor Projects, CREATE Program Train Noise Levels will be predicted for the existing, no-build and build scenarios as follows:
1. Existing Scenario CREATE Program Train Noise Level includes all train noise from existing trains operating on tracks affected by the CREATE Program.
2. No-Build Scenario CREATE Program Train Noise Level (Design Year) includes all train noise from no-build scenario (design year) trains operating on tracks affected by the CREATE Program.
3. Build Scenario CREATE Program Train Noise Level (Design Year) includes all train noise from build scenario (design year) trains operating on tracks affected by the CREATE Program.
For non-residential receptors without identifiable frequent exterior use areas, proceed to Section 5, Interior Noise Assessments. For receptors with frequent exterior use areas, proceed to Section 4.2.5. 4.2.5 Predict Overall Existing, No-Build and Build Noise Levels at Receptors with
Frequent Exterior Use Areas
Noise assessments will be performed for the existing, no-build and build scenarios. Based on the methodology presented in Section 4.2.3, the background noise level can be predicted at each receptor location based on measurements at the site, or representative data from a similar receptor site (see Section 4.2.3 Determine Background Noise Levels, subsection “Noise Exposure Computations from Partial Measurements”). For New and Re-introduced Rail Corridor Projects, the noise levels for the existing and no-build scenarios will be identical; therefore the noise evaluation will predict two noise levels, which are reported as whole numbers, for the scenarios as follows:
4. Existing and No-Build Scenario Noise Level (Background Noise Level)
5. Build Scenario CREATE Program Train Noise Level (Design Year)
Build Scenario CREATE Program Train Noise Level (Design Year) includes all train noise from build scenario (design year) trains operating on tracks affected by the CREATE Program.

21
For Improvement to Existing Rail Corridor Projects, the noise evaluation will predict noise levels for the existing, no-build and build scenarios. The noise levels for each scenario are determined by adding the background noise level to each of the three CREATE Program train noise levels as follows:
1. Existing Scenario Noise Level (Background Noise Level + Existing Scenario CREATE Program Train Noise Level)
Background Noise Level includes all non-train noise and all train noise from trains operating on tracks not affected by the CREATE Program.
Existing Scenario CREATE Program Train Noise Level includes all train noise from existing trains operating on tracks affected by the CREATE Program.
2. No-Build Scenario Noise Level (Background Noise Level + No-Build Scenario CREATE Program Train Noise Level (Design Year))
No-Build Scenario CREATE Program Train Noise Level (Design Year) includes all train noise from no-build scenario (design year) trains operating on tracks affected by the CREATE Program.
3. Build Scenario Noise Level (Background Noise Level + Build Scenario CREATE Program Train Noise Level (Design Year))
Build Scenario CREATE Program Train Noise Level (Design Year) includes all train noise from build scenario (design year) trains operating on tracks affected by the CREATE Program
The impact evaluation is presented in the following section (Section 4.3). As part of the NEPA documentation, the existing, no-build, and build noise levels will be presented with a narrative and supporting table.
4.3 Noise Impact Evaluation
Impact Evaluation
Calculate Project Noise Exposure for New and Re-introduced Rail Corridor Projects or Noise Exposure Increase
for Improvement to Existing Rail Corridor Projects
Use FTA Figure 3-1 or FTA Table 3-1 to Determine if there
are Impacts for New and Re-introduced Rail Corridor Projects. Use FTA Figure 3-2 or CREATE Table 4-6 to
Determine if there are Impacts for Improvement to Existing Rail Corridor Projects. Use Interior Criteria for non-
residential receptors if there are No Frequent Exterior Use Areas.
No Further Evaluation No Impact Identified?
Conduct Detailed Noise Analysis Yes

22
Exterior Areas The noise impact evaluation outlined in the FTA Manual is based on the comparison of the existing noise levels to the proposed project noise level. The impact criteria as presented in Figure 3-1 (Noise Impact Criteria for Transit Projects) in the FTA manual are most applicable to areas without existing rail activities. For CREATE projects on new and re-introduced rail corridors, Figure 3-1 or Table 3-1 in the FTA Manual will be used for evaluating potential CREATE Program noise impacts. Figure 3-1 and Table 3-1 from the FTA Manual are included in Appendix C. Most of the CREATE projects improve existing active rail systems and have an existing train noise contribution that will be present in the build condition. For this reason, Figure 3-2 (Increase in Cumulative Noise Level Allowed by Criteria (Land Use Cat. 1& 2)) in the FTA manual can be used for evaluating potential CREATE Program noise impacts on the majority of the CREATE projects; however, Figure 3-2 does not include impact criteria for land use Category 3. Table 4-6, Cumulative Noise Level Increase Allowed by FTA Noise Impact Criteria, includes impact thresholds for Categories 1, 2 and 3, and therefore should be used instead of Figure 3-2 in the FTA Manual to determine impacts for Improvement to Existing Rail Corridor Projects.

23
TABLE 4-6 Cumulative Noise Level Increase Defining FTA Noise Impact Criteria
Existing Noise Exposure
Impact Threshold for Increase in Cumulative Noise Exposure (dB(A))Category 1 or 2 Sites Category 3 Sites
Leq or Ldn
No Impact
Impact
Severe Impact No Impact Impact
Severe Impact
45 <9 9-14 >14 <13 13-19 >19 46 <8 8-13 >13 <13 13-18 >18 47 <8 8-12 >12 <12 12-17 >17 48 <7 7-12 >12 <11 11-16 >16 49 <7 7-11 >11 <11 11-16 >16 50 <6 6-10 >10 <10 10-15 >15 51 <6 6-10 >10 <9 9-14 >14 52 <5 5-9 >9 <9 9-14 >14 53 <5 5-8 >8 <8 8-13 >13 54 <4 4-8 >8 <8 8-12 >12 55 <4 4-7 >7 <7 7-12 >12 56 <4 4-7 >7 <7 7-11 >11 57 <4 4-6 >6 <7 7-10 >10 58 <3 3-6 >6 <6 6-10 >10 59 <3 3-5 >5 <6 6-9 >9 60 <3 3-5 >5 <6 6-9 >9 61 <3 3-5 >5 <5 5-9 >9 62 <3 3-4 >4 <5 5-8 >8 63 <3 3-4 >4 <5 5-8 >8 64 <3 3-4 >4 <5 5-8 >8 65 <2 2-4 >4 <4 4-7 >7 66 <2 2-4 >4 <4 4-7 >7 67 <2 2-3 >3 <4 4-7 >7 68 <2 2-3 >3 <4 4-6 >6 69 <2 2-3 >3 <4 4-6 >6 70 <2 2-3 >3 <4 4-6 >6 71 <2 2-3 >3 <4 4-6 >6 72 <2 2-3 >3 <3 3-6 >6 73 <2 2 >2 <3 3-5 >5 74 <2 2 >2 <3 3-5 >5 75 <1 1-2 >2 <2 2-5 >5
Ldn is used for land uses where nighttime sensitivity is a factor; Maximum 1-hour Leq is used for land use involving only daytime activities.
The use of Figures 3-1 and 3-2 (FTA Manual), and Table 4-6 is for exterior locations and will require the use of two noise levels to conduct the impact evaluation. The following outlines the general procedure to evaluate the potential noise impacts for exterior use areas:

24
New and Re-introduced Rail Corridor Projects
1. Determine the project noise exposure based on the train traffic data provided by the CTCO. This is determined by calculating the CREATE Program Build Train Noise Level (Design Year).
2. Determine the potential for an impact from FTA Figure 3-1 or FTA Table 3-1
using the Existing Scenario Noise Level (background noise level) and the project noise exposure determined in Step 1 above.
3. Determine if the project noise exposure generates no impact, a moderate impact,
or a severe impact. Improvement to Existing Rail Corridor Projects
1. Determine the noise exposure increase due to the implementation of the CREATE Program based on the train traffic data provided by CTCO. This is determined by arithmetic subtraction of the Existing Scenario Noise Level from the Build Scenario Noise Level.
Build Scenario Noise Level (dB(A)) – Existing Scenario Noise Level (dB(A)) = Noise Exposure Increase
2. Determine the potential for an impact from CREATE Table 4-6 or FTA Figure
3-2 using the Existing Scenario Noise Level (X-axis) and the noise exposure increase (Y-axis) determined in Step 1 above.
3. Determine if the noise exposure increase generates no impact, a moderate impact,
or a severe impact. If an impact is determined to occur using the General Noise Assessment methodology, then a Detailed Noise Analysis is required which will use additional project information to refine the predicted noise levels. The impact evaluation outlined in this section (Section 4.3) will be conducted again using the refined build and existing noise levels. Interior Areas As previously noted, the methodology for evaluating interior noise impacts is included in Section 5.

25
4.4 Detailed Noise Analysis
Detailed Noise Analysis (Tier 3)
Determine Background Noise Levels at Receptors with
Frequent Exterior Use Areas
Predict Existing, No- Build, & Build CREATE
Program Train Noise Levels
Predict Overall Existing, No- Build and Build Noise
Levels at Receptors with Frequent Outdoor Use Areas
Proceed with Impact Evaluation Based on Detailed Analysis
Impact Identified? No No Further Evaluation
Yes Conduct Mitigation Evaluation for Build Scenario Only Using Equations in
Chapter 6 of the FTA Manual and CREATE Mitigation Criteria
The Detailed Noise Analysis is the third tier in the FTA noise impact assessment methodology and is conducted when noise impacts are determined using the General Noise Assessment. The Detailed Noise Analysis uses additional receptor and track information to refine the noise analysis results. The FTA methodology in Chapter 6 of the FTA Manual provides the approach used to collect and analyze the additional data. Once the overall existing, no-build, and build noise levels are predicted using the Detailed Noise Analysis, the impact evaluation presented in Section 4.3 is used to re- evaluate the potential noise impacts. The re-evaluation is only necessary for those receptors where impacts were identified in the General Noise Assessment. The determination of noise impacts using the Detailed Noise Analysis warrants the evaluation of noise mitigation for the project at the impacted receptor locations using the mitigation criteria included in Section 4.5 of these procedures. The effects of incorporating noise mitigation measures into the proposed project can be predicted using the FTA Manual (Detailed Noise Analysis).
4.5 Mitigation Discussion
In general, mitigation evaluation will be based upon the full build condition of the CREATE Program. Any exceptions to this approach will be reviewed on a case-by-case basis. Mitigation based on the full build condition is necessary, as isolating the impacts of individual projects on receptors is generally not feasible.

26
The Detailed Noise Analysis in the FTA manual provides equations for evaluating noise barriers. When there is a noise impact, noise abatement must be considered subject to the following criteria:
1. Feasibility
Feasibility generally addresses the engineering aspects of implementing a noise barrier. This includes considerations for operations, safety, drainage, and utilities.
Noise mitigation measures must provide a Build Scenario CREATE Program Train Noise Level (Design Year) noise reduction of at least five (5) dB(A) (both exterior and interior) for the mitigation measure to be considered feasible.
2. Reasonableness
Cost-Effectiveness: For exterior moderate impacts, noise mitigation measures
must not exceed a cost of $5,000 per benefited receptor for each decibel meeting and exceeding the moderate impact threshold up to a total limit of $30,000 per benefited receptor. For exterior impacts that are severe, noise walls must not exceed a cost of $30,000 per benefited receptor for which a severe impact has been identified. This can include receptors located above ground-floor elevation in multi-story buildings (e.g., second-floor apartments).
Cost-Effectiveness: For interior impacts, noise mitigation measures must not
exceed a cost of $5,000 per benefited receptor for each decibel exceeding the Existing Scenario CREATE Program Train Noise Level up to a total limit of $30,000 per benefited receptor.
Viewpoints of Benefited Receptors: For interior and exterior impacts, the viewpoints of benefited receptors shall be solicited to determine their desire for implementation of the noise mitigation measures. The viewpoint responses will be used as a component of the reasonableness criteria. Further details of the viewpoint solicitation process can be found in Section 10.
Generally, the barrier should extend four times as far in each direction as the distance from the receiver to the barrier. In some circumstances, shielding from other structures may allow the length of the barrier to be less than four times as far in each direction as the distance from the receiver to the barrier. Noise mitigation measure costs are based on a $25.00 per square foot unit cost for walls up to and including 15 feet tall; $37.50 per square foot up to and including 30 feet tall, and $50.00 per square foot up to and including 45 feet tall. In some cases, additional costs such as land acquisition or additional civil and structural work may be necessary to implement a feasible noise wall. When these situations arise, the additional costs could be included as part of the analysis to determine reasonableness (cost-effectiveness) of the noise mitigation. The analysis should include making a determination as to the lowest cost of installing a feasible noise barrier based on the proposed site conditions. For example, in some cases, it may be less costly to install a taller noise wall; however, in

27
other cases, it may be less costly to make minor modifications (i.e., additional civil and/or structural work). Table 4-7 contains example unit costs for additional civil and structural work that could be used in the analysis. If the additional work necessary to implement a feasible noise wall includes work not listed in Table 4-7, it may be appropriate to use other justified unit costs to reflect the actual scope of proposed work. These considerations should be coordinated in advance with IDOT and FHWA and the documentation supporting the use of these unit costs will be required.
TABLE 4-7 Example Unit Costs for Additional Civil and Structural Work
Description Unit Estimated Unit Cost
Furnished Fill Cubic Yard $41
The equipment, material and labor necessary to install fill to sub-base elevations, compacted to specifications and ready to receive sub-ballast, ballast, roadway base course, as required for completing final grading and or installing transportation systems. Clearing, grubbing and landscaping is incidental to embankment work.
Vehicular bridge Square Foot $358
The equipment, material and labor necessary to perform structural excavation, install foundations, substructures, concrete, structural steel, stone and waterproofing as required to construct a highway bridge structure.
Tall Cast-In-Place Retaining Wall Installation (>15'): E-80 loading
Square Foot $360
The equipment, material and labor necessary to construct a cast-in-place concrete retaining wall complete with foundation to accommodate E-80 loading. Includes excavation, backfill above the heel. Cast in place retaining wall: Highway loading Square Foot $342 The equipment, material and labor necessary to construct a cast-in-place concrete retaining wall complete with foundation to accommodate highway loading. Includes excavation, backfill above the heel.
For exterior impacts, a benefited receptor is defined as a receptor with predicted noise impacts and that receives a Build Scenario CREATE Program Train Noise Level (Design Year) noise reduction of five (5) dB(A) or more. For interior impacts, a benefited receptor is defined as a receptor with predicted noise impacts and that receives an interior Build Scenario CREATE Program Train Noise Level (Design Year) noise reduction of five (5) dB(A) or more. This can include receptors located above ground-floor elevation in multi-story buildings (e.g. second-floor hospital rooms). Multi-story, Multi-Resident Buildings
For multi-resident buildings, each unit (i.e., apartment) afforded at least a 5 dB(A) noise reduction would represent one benefited receptor. When analyzing abatement for common areas, generally consider all units to be benefited if a noise reduction of five (5) dB(A) or more is achieved at the common area.

28
Existing noise levels for above ground floors may be modeled when balconies are present. Actual measurements do not have to be taken above ground levels. Mitigation should not be excluded for lower floor impacts merely on the basis that mitigation cannot be provided for upper floor impacts. In any instance, mitigation should be analyzed to benefit as many floors and units as possible. Non-residential Buildings
If impacts are identified for motels, hotels, public meeting rooms, schools, churches, libraries, hospitals or auditoriums, mitigation shall be considered. If school playgrounds are determined to have moderate or severe impacts, generally the number of classrooms facing the noise source will be used as the number of benefited receptors for the purpose of determining whether noise mitigation measures are reasonable. If an impacted playground is not located between the school and the noise source, contact FHWA/IDOT for further guidance. Other Noise Mitigation Strategies
Noise barriers are generally the most practical noise mitigation option given their overall effectiveness and the ability to incorporate the option on railroad right-of-way; however, they may not meet the feasible (5 dB(A) Build Scenario CREATE Program Train Noise Level (Design Year) noise reduction) or reasonable (cost-effectiveness) criteria based on site characteristics or constraints. Acquisition of real property or interests therein (predominantly unimproved property) may be used as a noise mitigation strategy to serve as a buffer zone to preempt development which would be adversely impacted by noise.
The use of noise insulation to mitigate noise impacts for non-residential receptor locations shall be discussed with FHWA on a case-by-case basis. If none of these measures are determined to be feasible or reasonable, noise abatement measures other than these may be proposed on a case-by-case basis. Noise Abatement Documentation A project's noise and/or vibration impacts may need to be re-assessed if there are revisions to the CREATE Program or to the project that may cause the results of the noise and/or vibration assessment to change. Therefore, the following statement will be included in all CREATE Program environmental documents:
“The noise and/or vibration analyses for this project may need to be reassessed if: a) the project is revised in a manner in which impacts of the project may change due to the project revisions (e.g., a new track alignment is moved closer to a receptor), or b) the CREATE Program's train model is updated due to projects being removed or added to the CREATE Program.”
The following statement will be included in all CREATE Program environmental

29
documents where noise mitigation measures are deemed feasible and reasonable:
“Based on the noise analysis, noise abatement measures are likely to be implemented based on the preliminary design. The noise barriers determined to meet the feasible and reasonable criteria are identified in Table (reference table). If it subsequently develops during final design that constraints not foreseen in the preliminary design occur, or public input substantially changes reasonableness, the abatement measure may need to be modified or removed from the project plans. A final decision on the installation of the noise abatement measure(s) will be made upon the completion of the project’s final design and the public involvement process.”
5. INTERIOR NOISE ASSESSMENT
If there are no exterior activities to be affected by the project noise (e.g., a school with no outdoor common areas), or where the exterior activities are far from or physically shielded from the project in a manner that prevents an impact on exterior activities, FHWA’s interior criterion will be used as the basis of determining noise impacts for non- residential receptor locations.
In this circumstance, Leq will be calculated to determine impacts. The predicted interior Build Scenario CREATE Program Train Noise Level (Design Year) may be derived by subtracting the noise reduction factor for the building in question from the computed exterior Build Scenario CREATE Program Train Noise Level (Design Year). If field measurements of these noise reduction factors are obtained or the factors are calculated from detailed acoustical analyses, the measured or calculated reduction factors should be used. In the absence of such calculations or field measurements of noise reduction, the noise reduction factor may be obtained from the following table:
TABLE 5-1 Building Noise Reduction Factors due to Building Exteriors
Building Type Window Condition Structure Reduction All Open 10 dB
Light Frame Ordinary Sash (closed) 20 dB Storm Windows 25 dB
Masonry Single Glazed 25 dB Double Glazed 35 dB
Note: The window shall be considered open unless there is firm knowledge that the windows are in fact kept closed almost every day of the year. Source: USDOT FHWA, Highway Traffic Noise: Analysis and Abatement Guidance, December 2011.
An impact occurs if the interior Build Scenario CREATE Program Train Noise Level (Design Year) is 51 Leq(h) or greater; or if the predicted interior Build Scenario CREATE Program Train Noise Level (Design Year) exceeds the interior Existing Scenario CREATE Program Train Noise Level by more than 14 dB(A). If an impact occurs using the General Noise Assessment methodology, then the Detailed Noise Analysis methodology will be used with additional project information to refine

30
the predicted interior noise levels. When assessing noise levels for multi-story buildings in the Detailed Noise Analysis, the vertical distance between the noise source(s) and the receptor must be a component included in the noise propagation equations. A Detailed Noise Analysis of interior noise levels likely will evaluate several floors of multi-story buildings. The impact evaluation outlined in this section will be conducted again during the Detailed Noise Analysis using the refined build, no-build and existing interior CREATE Program Train Noise Levels that are developed in the Detailed Noise Analysis. Mitigation assessments will be conducted using the procedures and criteria in Section 4.5.
When schools are evaluated for interior noise impacts, each classroom facing the noise source is a receptor, and a library, dining facility or auditorium facing the noise source will be equivalent to two receptors. When churches are evaluated for interior noise impacts, it is a single receptor. When hospitals, nursing homes and other similar facilities are evaluated for interior noise impacts, each room that faces the noise source that has facilities where patients/residents sleep is a receptor. See Appendix F for additional example exterior and interior noise assessment summary tables.
6. CONSTRUCTION NOISE AND VIBRATION
The following text will be included in all CREATE project environmental documents:
“Construction Noise and Vibration
The construction of the proposed project could result in temporary noise and vibration increases within and adjacent to the project area. The noise and vibration will be generated primarily from trucks and heavy machinery used during construction. Any anticipated noise and vibration impacts will likely be confined to normal working hours, which are generally considered to be “noise and vibration tolerant” periods. Construction contractors need to be aware of local noise ordinances to assure compliance in Cook County and within the cities that construction activities occur. No adverse noise and vibration impacts are anticipated during the construction phase of the project.”
7. VIBRATION ASSESSMENT
7.1 Introduction
Vibration impacts include both Ground-Borne Vibration and Ground-Borne Noise. Vibration impacts are assessed for a one-time event and based on the maximum vibration level. While the freight locomotives are slightly heavier than the commuter/passenger locomotives, the vibration screening distances included in the FTA Manual, Section 9.2.2, Table 9-2, will be used for freight train and commuter/passenger train evaluations. The screening distances in this table are measured from existing or proposed railroad

31
right-of-way to the receptor (see Appendix D, Exhibit 3). This application of FTA vibration screening distances is with the understanding that the FTA screening distances were developed for commuter/passenger rail projects and may have limitations in their applicability to freight rail projects. Figure 10-1 (Generalized Ground Surface Vibration Curves) in the FTA Manual, which is included in Appendix C, depicts the same vibration curve for passenger and freight locomotives. Therefore, the General Vibration Assessment methodology included in the FTA Manual is generally applicable to both commuter/passenger and freight rail projects. The vibration assessment project limits are identical to the noise assessment project limits identified for the noise assessment in Section 4.1.2. Vibration Screening Procedure The Vibration Screening Procedure follows the methodology presented in the FTA Manual. The screening distances in Table 9-2 (FTA Manual) are applied to the project limits to identify the vibration assessment evaluation area. If there are any sensitive land uses within the vibration evaluation area, a General Vibration Assessment is required. General Vibration Assessment and Detailed Vibration Analysis The vibration impact evaluation for the CREATE projects generally follows the methodology presented in the FTA Manual; however, a Detailed Vibration Analysis may not always be required. When the General Vibration Assessment identifies an impact, the determination as to whether a Detailed Vibration Analysis is required will be made on a case-by-case basis. Special track support systems and trenches have not been proven as effective measures for mitigating vibration impacts for freight rail projects, nor for at-grade or elevated heavy-rail commuter/passenger rail projects. Therefore, the only vibration mitigation measures that will be considered for the CREATE Program, other than maintenance programs, are planning and design of special track work and buffer zones. If planning and design of special track work and/or buffer zones are viable mitigation measures for CREATE projects when impacts are identified in the General Vibration Assessment, then a Detailed Vibration Analysis will be required. If planning and design of special track work and/or buffer zones are not viable mitigation measures for CREATE projects when impacts are identified in the General Vibration Assessment, then a Detailed Vibration Analysis will not be required. Figure 7-1 depicts the basic flow chart for the vibration assessment.

32
FIGURE 7-1 CREATE Vibration Assessment Process
Vibration Screening Procedure
Identify Project Limits
Apply Screening Distance
Sensitive Land Uses Within Evaluation Area? No
Conduct General Assessment
Yes No Further Evaluation
General Vibration Assessment
Define Generalized Ground Surface Vibration
Curve and Apply Adjustments
Determine Build Vibration Level
Proceed with Impact Evaluation Based on General
Assessment
Impact Evaluation
Use Table 7-1 for New or Re-Introduced Rail Corridor Projects, or Section 7.2.2 for Improvement to Existing Rail
Corridor Projects for Impact Evaluation
Review Train Traffic Information to Determine the
Applicable Criteria
No Further Evaluation No
Impact Identified and Mitigation Measures
Viable?
Compare Predicted Build Vibration Levels to Vibration
Criteria
Proceed with Detailed Analysis Yes
Detailed Vibration Analysis
Survey Existing Vibration
Determine Build Vibration Level
Proceed with Impact Evaluation Based on Detailed
Analysis
Impact Identified? No No Further Evaluation
Yes
Conduct Mitigation Evaluation for Build Scenario Only Using Equations in Detailed Assessment Section of FTA Guidance Manual and CREATE
Mitigation Criteria

33
7.2 Impact Assessment
7.2.1 Land Use Categories
The criteria for acceptable ground-borne vibration are expressed in terms of rms velocity levels in decibels and the criteria for acceptable ground-borne noise are expressed in terms of A-weighted sound levels. The limits are specified for the three land-use categories defined below:
• Vibration Category 1 - High Sensitivity: Included in Category 1 are buildings where vibration would interfere with operations within the building, including levels that may be well below those associated with human annoyance. Concert halls and other special-use facilities are covered separately in FTA Manual, Table 8-2. Typical land uses covered by Category 1 are: vibration-sensitive research and manufacturing, hospitals with vibration-sensitive equipment, and university research operations. The degree of sensitivity to vibration will depend on the specific equipment that will be affected by the vibration. Equipment such as electron microscopes and high resolution lithographic equipment can be very sensitive to vibration, and even normal optical microscopes will sometimes be difficult to use when vibration is well below the human annoyance level. Manufacturing of computer chips is an example of a vibration-sensitive process.
The vibration limits for Vibration Category 1 are based on acceptable vibration for moderately vibration-sensitive equipment such as optical microscopes and electron microscopes with vibration isolation systems. Defining limits for equipment that is even more sensitive requires a detailed review of the specific equipment involved. This type of review is usually performed during the Detailed Vibration Analysis associated with the final design phase and not as part of the environmental impact assessment. Mitigation of transit vibration that affects sensitive equipment typically involves modification of the equipment mounting system or relocation of the equipment rather than applying vibration control measures to the rail project.
Note that this category does not include most computer installations or telephone switching equipment. Although the owners of this type of equipment often are very concerned about the potential of ground-borne vibration interrupting smooth operation of their equipment, it is rare for computer or other electronic equipment to be particularly sensitive to vibration. Most such equipment is designed to operate in typical building environments where the equipment may experience occasional shock from bumping and continuous background vibration caused by other equipment.
• Vibration Category 2 - Residential: This category covers all residential land uses and any buildings where people sleep, such as hotels and hospitals. No differentiation is made between different types of residential areas. This is primarily because ground-borne vibration and noise are experienced indoors and building occupants have practically no means to reduce their exposure. Even in a noisy urban

34
area, the bedrooms often will be quiet in buildings that have effective noise insulation and tightly closed windows. Moreover, street traffic often abates at night when trains continue to operate. Hence, an occupant of a bedroom in a noisy urban area is likely to be just as exposed to ground-borne noise and vibration as someone in a quiet suburban area. The criteria apply to the rail-generated ground-borne vibration and noise whether the source is subway or surface running trains.
• Vibration Category 3 - Institutional: Vibration Category 3 includes schools,
churches, other institutions, and quiet offices that do not have vibration-sensitive equipment, but still have the potential for activity interference. Although it is generally appropriate to include office buildings in this category, it is not appropriate to include all buildings that have any office space. For example, most industrial buildings have office space, but it is not intended that buildings primarily for industrial use be included in this category.
Table 7-1 (referenced from FTA Manual Table 8-1) shows the land use categories for ground-borne vibration and noise, which are similar to those for noise assessments.

35
TABLE 7-1 Ground-Borne Vibration (GBV) and Ground-Borne Noise (GBN) Impact Criteria
for General Assessment
Land Use Category
GBV Impact Levels1
(VdB re 1 micro inch/sec)GBN Impact Levels1
(dB re 20 micro Pascals)Frequent Events 2
Occasional Events3
Infrequent Events 43
Frequent Events 2
Occasional Events 3
Infrequent Events 4
Category 1: Buildings where low background vibration is essential for interior operations.
65 VdB5
65 VdB5
65 VdB5
N/A5
N/A5
N/A 5
Category 2: Residences and buildings where people normally sleep.
72 VdB
75 VdB
80 VdB
35 dB(A)
38 dB(A)
43 dB(A)
Category 3: Institutional land uses with primarily daytime use.
75 VdB
78 VdB
83 VdB
40 dB(A)
43 dB(A)
48 dB(A)
1. An impact occurs if the GBV and GBN levels in the table are achieved or exceeded. 2. “Frequent Events” is defined as more than 70 vibration events per day. For a typical
line-haul freight train where the rail car vibration lasts for several minutes, the frequent events criterion should be applied to the rail car vibration. Most rapid transit projects fall into this category.
3. “Occasional Events” is defined as between 30 and 70 vibration events of the same source per day. Most commuter trunk lines have this many operations. Generally this category not applicable to freight rail cars but could apply to freight locomotives.
4. “Infrequent Events” is defined as fewer than 30 vibration events per day. This category includes most commuter rail branch lines. Generally this category is not applicable to freight rail cars but could apply to freight locomotives. The locomotive vibration only lasts for a short time, the infrequent-events criteria are appropriate for fewer than 30 events per day.
5. This criterion limit is based on levels that are acceptable for most moderately sensitive equipment such as optical microscopes. Vibration sensitive manufacturing or research will require detailed evaluation to define the acceptable vibration levels. Ensuring lower vibration levels in a building often requires special design of the HVAC systems and stiffened floors.
Note: Vibration-sensitive equipment is not sensitive to ground-borne noise. Source: Harris Miller Miller and Hanson, Transit Noise and Vibration Impact Assessment, FTA, 2006.

36
7.2.2 Impact Criteria
Vibrations from locomotives and railcars must be assessed separately for freight rail trains. To determine the unadjusted ground surface vibration for locomotives, use the “Locomotive Powered Passenger or Freight (50 mph)” curve shown in Figure 10-1 (FTA Manual). For freight rail cars, use the “Rapid Transit or Light Rail Vehicles (50 mph)” curve shown in Figure 10-1 (FTA Manual). Adjustment factors for the generalized prediction of ground-borne vibration and noise are included in Table 10-1 (FTA Manual). Once the base curve has been selected, these adjustment factors can be used to develop vibration projections for specific receiver positions inside the buildings. It has been determined that the elevated structure adjustment in Table 10-1 would not be appropriate for embankments and only a -5VdB adjustment should be made for embankments. If vibration impact levels from either locomotives or rail cars meet or exceed the criteria in Table 7-1, an impact occurs. Vibrations from locomotives and railcars are not assessed separately for commuter/passenger rail trains. If the project being evaluated includes improvements to more than one track, and there are sensitive land uses within the vibration evaluation area, the General Vibration Assessment and the Detailed Vibration Analysis (if required) must evaluate the track that most closely approaches the impact threshold if no impacts are identified, or the track that exceeds to impact criteria to the greatest degree if impacts are identified. New or Re-introduced Rail Corridor
Table 7-1 will be used to determine if there are impacts. Improvement to Existing Rail Corridor
One factor not incorporated in the criteria is how to account for existing vibration. In most cases, the existing environment does not include a substantial number of perceptible ground-borne vibration or noise events. The existing train vibration can be either measured or estimated using the General Assessment procedures in Chapter 10 of the FTA Manual. The most common example of needing to account for the pre-existing vibration is when the project is located in an existing rail corridor. Following are methods of handling representative scenarios: 1. Infrequently-used rail corridor (existing train volume is fewer than 5 trains per day):
Use the general vibration criteria, Table 7-1, to determine whether the Build Scenario CREATE Program Train Vibration Level (Design Year) exceeds the impact criteria. The Build Scenario CREATE Program Train Vibration Level (Design Year) only considers vibrations from the additional trains operating on tracks affected by the CREATE Program - in the design year. When using Table 7-1, the frequency category (frequent, occasional, or infrequent) and impact level is determined by the additional number of commuter/passenger rail trains and freight rail trains (use “frequent events” if any additional freight trains) operating on the tracks affected by

37
the CREATE Program as a result of the implementation of the CREATE Program. If the Build Scenario CREATE Program Train Vibration Level (Design Year) exceeds the impact criteria, a potential impact occurs. If the Build Scenario CREATE Program Train Vibration Level (Design Year) does not exceed the impact criteria, a potential impact does not occur and no further analysis is required. Existing vibration, even if it exceeds the impact criteria, is not a factor in determining whether the Build Scenario CREATE Program Train Vibration Level (Design Year) results in an impact.
2. Moderately-used rail corridor (existing train volume is from 5 to 12 trains per day):
If the existing train vibration exceeds the impact criteria given in Table 7-1, there will be no impact from the Build Scenario CREATE Program Train Vibration Level (Design Year) if the levels estimated using the procedures outlined in either Chapter 10 or 11 of the FTA Manual are at least 5 VdB less than the existing train vibration. The impact criteria shall be applied as described for the following two conditions:
Existing Train Vibration Exceeds the Impact Criteria: If the Build Scenario CREATE Program Train Vibration Level (Design Year) is at least 5 VdB or less than existing, then a potential impact does not occur and no further analysis is required. For example, if the existing vibration level is 65 VdB, no impact would be assessed if the Design Year vibration level was 60 VdB or less. Otherwise, use the general vibration criteria, Table 7-1, to determine whether the Build Scenario CREATE Program Train Vibration Level (Design Year) exceeds the impact criteria. If the Build Scenario CREATE Program Train Vibration Level (Design Year) exceeds the impact criteria, a potential impact occurs. If the Build Scenario CREATE Program Train Vibration Level (Design Year) does not exceed the impact criteria, a potential impact does not occur and no further analysis is required.
Existing Train Vibration Does Not Exceed the Impact Criteria: Use the general vibration criteria, Table 7-1, to determine whether the Build Scenario CREATE Program Train Vibration Level (Design Year) exceeds the impact criteria. If the Build Scenario CREATE Program Train Vibration Level (Design Year) exceeds the impact criteria, a potential impact occurs. If the Build Scenario CREATE Program Train Vibration Level (Design Year) does not exceed the impact criteria, a potential impact does not occur and no further analysis is required.
3. Heavily-used rail corridor (existing train volume is more than 12 trains per day): If
the existing train vibration exceeds the impact criteria given in Table 7-1, the Build Scenario CREATE Program Train Vibration Level (Design Year) will cause additional impact if the Build Scenario CREATE Program train volumes substantially increase the number of vibration events. Approximately doubling the number of events is required for a substantial increase.
If the existing train vibration exceeds the impact criteria given in Table 7-1, and there is not a significant increase in vibration events, there will be additional impact only if the Build Scenario CREATE Program Train Vibration Level (Design Year),
38
estimated using the procedures of Chapters 10 or 11 (of the FTA Manual), is 3 VdB or more than the existing vibration level.
If the existing train vibration does not exceed the impact criteria given in Table 7-1, use the general vibration criteria, Table 7-1, to determine whether the Build Scenario CREATE Program Train Vibration Level (Design Year) exceeds the impact criteria. If the Build Scenario CREATE Program Train Vibration Level (Design Year) exceeds the impact criteria, an impact occurs. If the Build Scenario CREATE Program Train Vibration Level (Design Year) does not exceed the impact criteria, an impact does not occur and no further analysis is required.
4. Moving existing tracks: Another scenario where existing vibration can be substantial
is when new train operations will use an existing railroad right-of-way and result in shifting the location of existing railroad tracks. The track relocation and reconstruction can result in lower vibration levels, in which case the CREATE Program is beneficial to those receptors within project’s vibration evaluation area. On the other hand, the track relocation and reconstruction can result in higher vibration levels, in which case the CREATE Program may result in an adverse impact to those receptors within the project’s vibration evaluation area.
If the existing (pre-move) train vibration equals or exceeds the impact criteria given in Table 7-1, and the post-move vibration from existing operations exceeds the pre- move vibration by 3 VdB or more, an impact occurs.
If the existing (pre-move) train vibration equals or exceeds the impact criteria given in Table 7-1, and the post-move vibration from existing operations does not exceed the pre-move vibration by 3 VdB or more, the determination as to whether impacts occur should be determined by applying the appropriate criteria from either scenario 1, 2, or 3 above. In this instance, for the tracks that are moved, use the total number of trains using the moved tracks in the design year to determine the frequency category (frequent, occasional or infrequent) and impact level in Table 7-1. For example, if the existing (pre-move) train vibration equals or exceeds the impact criteria in Table 7-1, and the post-move vibration from existing operations does not exceed the pre-move vibration by 3 VdB or more, and the train volumes in the corridor on the tracks affected by the CREATE Program meet the definition of a heavily used rail corridor, apply the criteria in scenario 3 above to determine if an impact occurs.
If the existing (pre-move) train vibration does not equal or exceed the impact criteria given in Table 7-1, the determination as to whether impacts occur should be determined by applying the appropriate criteria from either scenario 1, 2 or 3 above. In this instance, for the tracks that are moved, use the total number of trains using those tracks in the design year to determine the frequency category (i.e., frequent, occasional or infrequent) and the vibration impact level in Table 7-1.

39
The General Vibration Assessment identifies the potential ground-borne vibration and ground-borne noise impacts; a detailed assessment confirms whether a vibration impact occurs. As presented in Section 7.1, the need for a Detailed Vibration Analysis will generally be conducted if planning and design of special trackwork or buffer areas are viable mitigation options. Spreadsheet examples have been prepared for each of the four scenarios and for the no- build alternative (see Appendix E). The analyst should be aware of the following:
1. The spreadsheets are based upon the specific conditions in Example Project EX-1. In the example project, two tracks are affected by the CREATE Program, and the train traffic characteristics are similar for both tracks. Therefore, in the spreadsheets, the same adjustment factors (speed, source, path and receiver) are applied to both tracks. If these assumptions are not valid for the project being assessed, the analyst will have to modify the spreadsheets to reflect the specific project’s conditions. For instance, the spreadsheets may need to be revised to analyze a different number of involved tracks. Additionally, different adjustment factors may have to be applied to each track based upon the specific train traffic characteristics for each track.
2. The distance measured is from the centerline of the track to the face of the
building.
3. The Moving Existing Tracks spreadsheets are applicable for projects in which the CREATE Program will move existing tracks. The spreadsheets simply evaluate the effect of changing the distance between the track and the receptor. The existing (pre-move) and build (post-move) scenarios are both analyzed using the existing train operations.
The Moving Existing Tracks spreadsheets are used to perform a quick screening within the general assessment process that requires few calculations. If an impact is assessed based on the quick screening process, then the detailed assessment should be considered. If an impact is not assessed using the quick screening process, then the standard general assessment spreadsheets (infrequently-used, moderately-used, or heavily-used corridor analyses) must be used to determine if an impact would be assessed based upon the Build Scenario CREATE Program Train Vibration Level (Design Year). The Moving Existing Tracks spreadsheets cannot be used to determine that a project does not result in vibration impacts.

40
7.3 Vibration Mitigation Discussion
In general, when there is a vibration impact based on the Detailed Vibration Analysis, vibration abatement should be evaluated as part of the proposed project unless any one of the following cannot be satisfied:
1. The minimum length of track mitigated must be determined from calculations based on the FTA Detailed Vibration Analysis method.
2. The vibration mitigation treatment must provide at least 3 VdB reduction for every impacted dwelling to be considered effective.
3. The following formula will be applied to determine if the mitigation is cost effective: Mitigation cost divided by VdB reduction divided by number of buildings protected. If this dollar amount exceeds $15,000, the treatment is not considered to be cost effective.
A commitment will be included in the NEPA document to re-assess the project's vibration impacts if there are revisions to the CREATE Program or the project may cause the results of the vibration assessment to change. Vibration Abatement Documentation
The following text will be included in all CREATE Program environmental documents when vibration impacts occur:
“The following maintenance procedures will be accomplished by the rail industry to mitigate vibration impacts through minimizing vibration sources:
Regularly scheduled rail grinding
Wheel truing programs
Vehicle reconditioning programs
Use of wheel-flat detectors”

41
8. HIGHWAY-RAIL GRADE SEPARATION NOISE AND VIBRATION ASSESSMENTS
For highway-rail grade separation projects, highway noise analyses will be performed as per IDOT’s Bureau of Design and Environment Manual, Chapter 26, Section 26-6. Furthermore, the following screening procedures will be applied to determine if train noise and vibration analyses are required for potential receptors adjacent to the rail corridor:
Noise Screening Procedure
Identify Project Limits (4.1.1)
Apply Screening Distance (4.1.2)
Noise sensitive Land Use Within Evaluation Area? No
Is the CREATE Grade Separation Project Physically Altering the Rail Tracks
(horizontal or vertical alignment changes), or Adding Capacity,
or Is the CREATE Grade Separation Project
Increasing Train Traffic/and or Speed?
Yes
No
No Further Evaluation
Yes
On a Case-By-Case Basis, IDOT/FHWA Will Determine the Need for Further Evaluations (i.e.,
Conducting a General Assessment, Detailed Analysis and Mitigation Evaluation as Required as per Sections
4 and 5).
Vibration Screening Procedure
Identify Project Limits (4.1.1)
Apply Screening Distance (Table 9.2 FTA Manual)
Noise sensitive Land Use No Within Evaluation Area?
Is the CREATE Grade Separation Project Physically Altering the Rail Tracks
(horizontal or vertical alignment changes), or Adding Additional Capacity,
or Is the CREATE Grade Separation Project
Increasing Train Traffic/and or Speed?
Yes
No
No Further Evaluation
Yes
On a Case-By-Case Basis, IDOT/FHWA Will Determine the Need for Further Evaluations (i.e.,
Conducting a General Assessment, Detailed Analysis and Mitigation Evaluation as Required as per
Section 7).

42
9. NEPA PROJECT EVALUATION
The CREATE Program noise and vibration impact assessment is being conducted to fulfill NEPA requirements. Using the evaluation outlined in this methodology manual, the potential noise and vibration impacts will be identified using the suggested documentation formats. Example tables of the noise and vibration evaluation data are included in Appendix E. Exterior noise impacts will be identified as no impact, moderate impact, or severe impact. Interior noise impacts will be identified as no impact or impact. Vibration impacts will be identified as no impact or impact. Based on the evaluation results, IDOT and FHWA will review the data and documentation. This will include but is not limited to the review of the following:
Build alternative(s) noise/vibration levels compared to the existing and no- build alternative levels
Build alternative(s) level of impact (no impact, moderate impact or severe impact for exterior use areas; no impact or impact for interior use areas)
Absolute noise/vibration levels Noise/vibration level above impact criteria Receptor type Number of impacted receptors Feasibility and reasonableness of mitigation options
FHWA, in consultation with IDOT, will determine if any of the noise and/or vibration impacts are significant, based on both context and intensity of impacts. The following summarizes the actions to be taken based on the results of the noise and vibration (which includes ground-borne vibration and ground-borne noise) impact evaluation:
If no noise or vibration impacts are identified, the evaluation should be documented and presented to the public through the normal public involvement activities.
If noise or vibration impacts are identified but mitigation is determined not to be feasible and reasonable, and if there are any potential historic buildings (over 50 years old) within the possible impact area, an ESRF addendum will be required to determine if the resource is potentially eligible for the National Register of Historic Places (NRHP).
If noise or vibration impacts are identified, mitigation is determined to be feasible and reasonable and is proposed, and impacts still occur with proposed mitigation; and if there are any potential historic buildings (over 50 years old) within the possible impact area, an ESRF addendum will be required to determine if the resource is potentially eligible for the NRHP.

43
If noise or vibration impacts are identified, regardless of proposed mitigation measures, IDOT and FHWA will determine if the impacts are significant.
o If the impacts are deemed significant, an EIS will be required which includes the noise and vibration impact analyses. The Draft EIS (DEIS) will be available for public review and comment.
o If the impacts are deemed non-significant, the ECAD or Environmental Assessment process can continue and the information will be presented through the normal public involvement process. Information presented will include the noise and vibration impact evaluations.
If mitigation is feasible and cost-effective, the desires of the benefited receptors will be determined via the viewpoints solicitation process (see Section 10 for further details).
If vibration impacts have been identified, it should be determined if mitigation is feasible and reasonable. Programmatic mitigation measures should always be documented in the environmental document when impacts are identified. These programmatic measures will be identified as activities that are being implemented to minimize impacts. This information shall be presented to the public through the normal public involvement process.
10. Viewpoints of Benefited Receptors and Coordination with the Public The viewpoints of benefited receptors shall be solicited via written correspondence in the form of letters and viewpoint solicitation forms for noise barriers found to be feasible and cost-effective. The viewpoints of benefited receptors shall be used to determine the desire for implementation of the noise barriers. Benefited receptors include property owners (including non-residential properties) and renters/leasers residing on the benefited property. While the desire is to obtain as many responses as possible, the goal is to obtain responses from at least one-third (33-percent) of the benefited receptors for each noise barrier being considered. If responses from one-third of the benefited receptors are not received after the first attempt, a second attempt shall be made. IDOT Division of Public and Intermodal Transportation (DPIT) may consider delivering the second attempt for viewpoint solicitation by certified mail or other form of certified delivery. The desire for the proposed noise abatement can be determined after viewpoints from at least one-third of the responses have been received or after two attempts have been made to obtain the responses. If after the second attempt there are still less than one-third of the responses received, the tally can be conducted based on the responses received. Once the responses have been collected, the viewpoints must be tallied. In order for noise barrier to be implemented, greater than 50-percent of the benefited receptors responding must be in favor of it. Viewpoints will be tallied for each individual noise barrier. A response from first row benefited receptors (receptors directly abutting the railroad right-

44
of-way) will be counted and weighted as two responses. Benefited receptors not in the first row will count as one vote. The purpose of providing more weight to the front row receptors is to give them additional consideration in the decision-making process. In the case of rental properties, the tenant shall always count as one response and the owner shall always count as one response per benefited unit. First row rental properties will not be weighted. As part of the public involvement process, the noise analysis should be presented at the public meeting/hearing for any recommended noise barriers. The information is typically presented on project exhibits and should include evaluated noise barrier locations and noise barriers likely to be implemented pending the viewpoints of benefited receptors (provided they are feasible and cost-effective). Supporting noise analysis information (i.e., noise analysis memorandum/report) should be available for review at the public meeting or hearing. The purpose of sharing the noise analysis information is to engage local officials, property owners and residents adjacent to the project area, with a particular emphasis given to soliciting the viewpoints benefited receptors. The public meeting or hearing is one of the recommended mechanisms to obtain the viewpoint from at least one-third of the benefited receptors. Every effort should be made to identify the intent and need of getting documented feedback from the benefited receptors. This may include identifying benefited receptors on the exhibits. The level of public involvement will vary from one project to another and is influenced by the type of project, level of noise impacts that may result as well as corresponding noise barriers, and general interest shown by the public. Comments may be solicited from the public by a variety of methods, including the following:
Public meetings Public hearings Letters Newspaper advertisements Telephone, door-to-door or mail surveys Flyers and/or posters Website Telephone hotline
The views of benefited receptors, including whether they find a proposed barrier(s) acceptable or desirable, are a major consideration in determining the reasonableness of the proposed barrier(s). Comments from the benefited receptors regarding noise wall texture and color will also be considered; however, all design features are ultimately decided upon by IDOT. In order for any proposed noise barrier comment from benefited receptors to be taken into consideration, it must be submitted in writing in letter format, e-mail or recorded at a public meeting or public hearing. The noise analysis memorandum/report and the NEPA documentation will summarize the specific steps taken to solicit the viewpoints of benefited receptors, as well as the conclusions from this process.

APPENDIX A
Screening Distances for Potential Noise Impact by Ambient Location and Train Activity for
CREATE Projects
HARRIS MILLER MILLER & HANSON INC. 77 South Bedford Street Burlington, MA 01803 T 781.229.0707 F 781.229.7939 W www.hmmh.com
T E C H N I C A L M E M O R A N D U M To: Diane Campione, Benesch
From: Jason Ross, Senior Consultant Carl Hanson, P.E. PhD, Senior Vice President
Date: February 10, 2006 / CREATE Program Clarification (12/12/06)
Subject: Screening Distances for Potential Noise Impact by Ambient Location and Train Activity for CREATE Projects
Reference: HMMH Job No. 301340.000
BACKGROUND
Harris Miller Miller & Hanson Inc. (HMMH) has developed screening distances for determining the potential limits of noise impact from freight and passenger (Amtrak and Metra) train activity for CREATE projects. These screening distances have been determined from a railroad noise model developed for the CREATE project and are based on train operations data provided by CTCO and general ambient noise categories. The CREATE railroad noise model is based on the Federal Transit Administration (FTA) General Transit Noise Assessment spreadsheet, but includes additional noise sources such as freight locomotives, freight cars and track crossovers.
The train operations data include train symbols, arrival and departure times, speeds, total cars, total tonnage, length of trains and number of locomotives per train for noise-sensitive receptors over several days. Low, medium and high train activity levels have been calculated for the number of trains, train speed, length of cars in train and the number of locomotives in train. Data were provided for a total of 258 receptor-days.
CREATE TRAIN OPERATIONS DATA
The train operations data provided were intended to show a representative range of freight, Amtrak and Metra train activities for which screening distances can be determined. The projects for which data were provided were:
• 3C-NV-P2 • 3C10-P-2 • NV-5BB10-P-2 • 5BB10-WA-3
• 3C10-WA-3 • 3C-WA-3 • NV-3C-EW-4 • NV-3C10-EW-4
• NV-5BB-EW-4 • 3C-NV-B3 • 3C10-NV-B3 • 5BB10-NV-B3
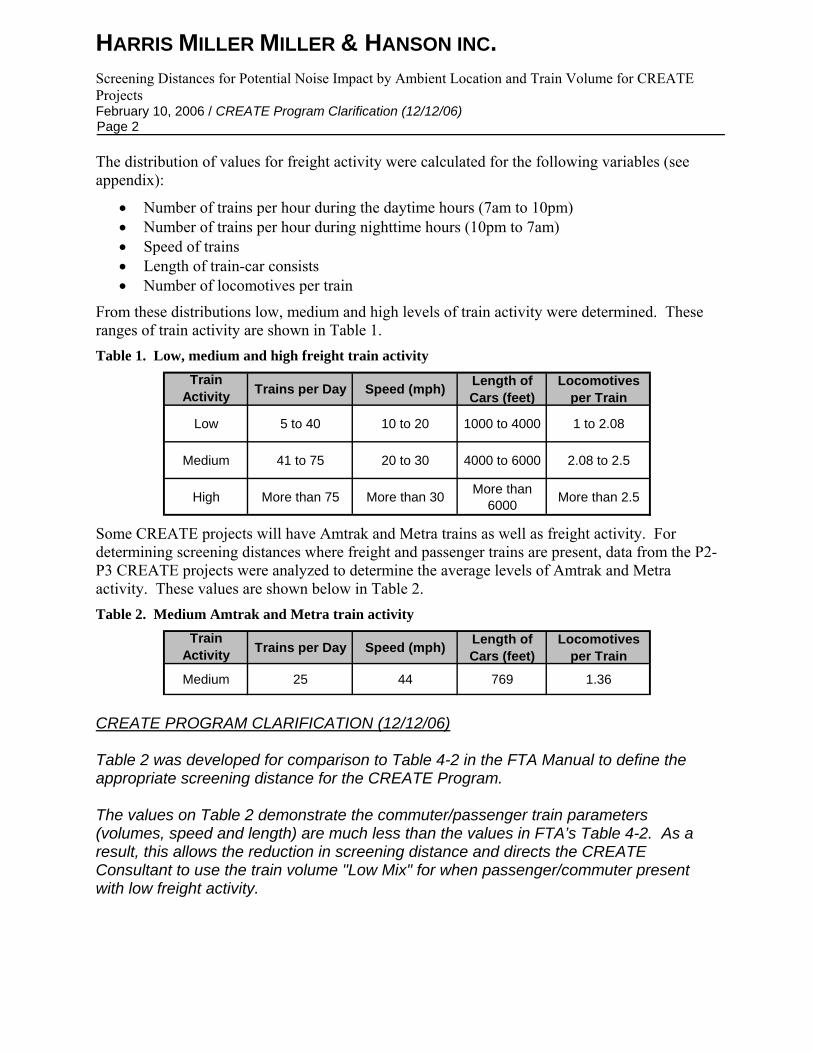
HARRIS MILLER MILLER & HANSON INC. Screening Distances for Potential Noise Impact by Ambient Location and Train Volume for CREATE Projects February 10, 2006 / CREATE Program Clarification (12/12/06) Page 2 The distribution of values for freight activity were calculated for the following variables (see appendix):
• Number of trains per hour during the daytime hours (7am to 10pm) • Number of trains per hour during nighttime hours (10pm to 7am) • Speed of trains • Length of train-car consists • Number of locomotives per train
From these distributions low, medium and high levels of train activity were determined. These ranges of train activity are shown in Table 1. Table 1. Low, medium and high freight train activity
Train Activity Trains per Day Speed (mph) Length of
Cars (feet)Locomotives
per Train
Low 5 to 40 10 to 20 1000 to 4000 1 to 2.08
Medium 41 to 75 20 to 30 4000 to 6000 2.08 to 2.5
High More than 75 More than 30 More than 6000 More than 2.5
Some CREATE projects will have Amtrak and Metra trains as well as freight activity. For determining screening distances where freight and passenger trains are present, data from the P2-P3 CREATE projects were analyzed to determine the average levels of Amtrak and Metra activity. These values are shown below in Table 2. Table 2. Medium Amtrak and Metra train activity
Train Activity Trains per Day Speed (mph) Length of
Cars (feet)Locomotives
per Train
Medium 25 44 769 1.36
CREATE PROGRAM CLARIFICATION (12/12/06) Table 2 was developed for comparison to Table 4-2 in the FTA Manual to define the appropriate screening distance for the CREATE Program. The values on Table 2 demonstrate the commuter/passenger train parameters (volumes, speed and length) are much less than the values in FTA’s Table 4-2. As a result, this allows the reduction in screening distance and directs the CREATE Consultant to use the train volume "Low Mix" for when passenger/commuter present with low freight activity.
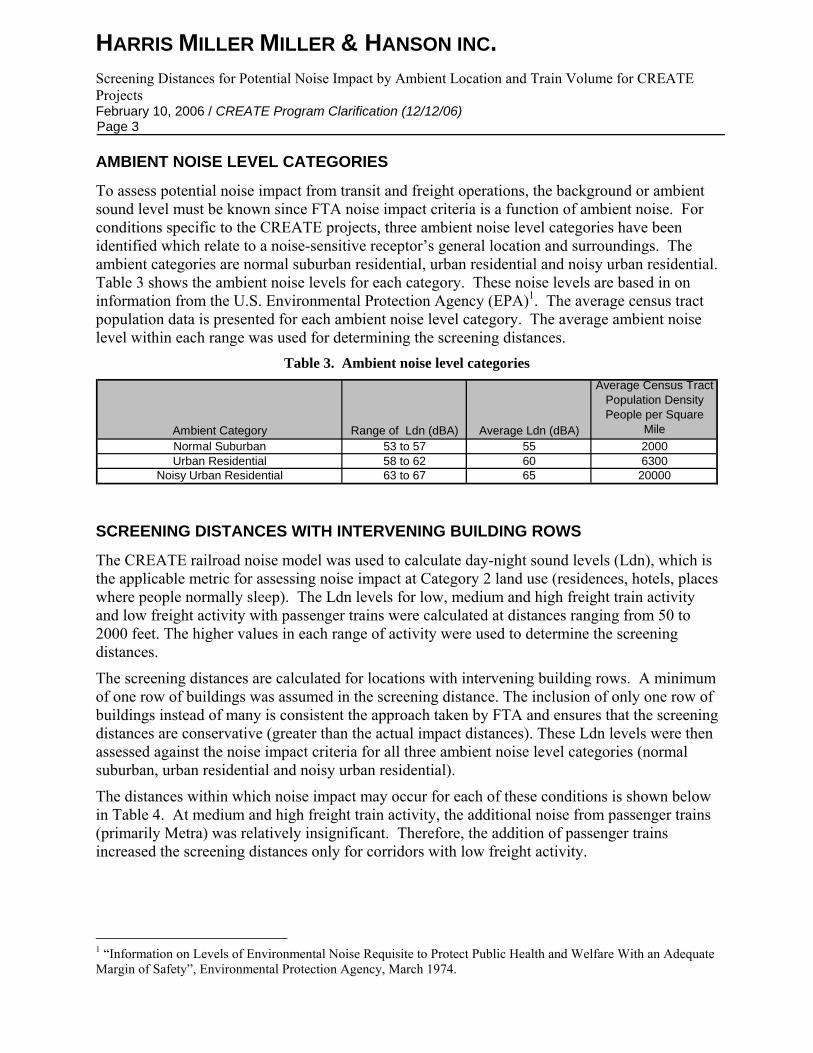
HARRIS MILLER MILLER & HANSON INC. Screening Distances for Potential Noise Impact by Ambient Location and Train Volume for CREATE Projects February 10, 2006 / CREATE Program Clarification (12/12/06) Page 3 AMBIENT NOISE LEVEL CATEGORIES
To assess potential noise impact from transit and freight operations, the background or ambient sound level must be known since FTA noise impact criteria is a function of ambient noise. For conditions specific to the CREATE projects, three ambient noise level categories have been identified which relate to a noise-sensitive receptor’s general location and surroundings. The ambient categories are normal suburban residential, urban residential and noisy urban residential. Table 3 shows the ambient noise levels for each category. These noise levels are based in on information from the U.S. Environmental Protection Agency (EPA)1. The average census tract population data is presented for each ambient noise level category. The average ambient noise level within each range was used for determining the screening distances.
Table 3. Ambient noise level categories
Ambient Category Range of Ldn (dBA) Average Ldn (dBA)
Average Census Tract Population Density People per Square
MileNormal Suburban 53 to 57 55 2000Urban Residential 58 to 62 60 6300
Noisy Urban Residential 63 to 67 65 20000
SCREENING DISTANCES WITH INTERVENING BUILDING ROWS
The CREATE railroad noise model was used to calculate day-night sound levels (Ldn), which is the applicable metric for assessing noise impact at Category 2 land use (residences, hotels, places where people normally sleep). The Ldn levels for low, medium and high freight train activity and low freight activity with passenger trains were calculated at distances ranging from 50 to 2000 feet. The higher values in each range of activity were used to determine the screening distances.
The screening distances are calculated for locations with intervening building rows. A minimum of one row of buildings was assumed in the screening distance. The inclusion of only one row of buildings instead of many is consistent the approach taken by FTA and ensures that the screening distances are conservative (greater than the actual impact distances). These Ldn levels were then assessed against the noise impact criteria for all three ambient noise level categories (normal suburban, urban residential and noisy urban residential).
The distances within which noise impact may occur for each of these conditions is shown below in Table 4. At medium and high freight train activity, the additional noise from passenger trains (primarily Metra) was relatively insignificant. Therefore, the addition of passenger trains increased the screening distances only for corridors with low freight activity.
1 “Information on Levels of Environmental Noise Requisite to Protect Public Health and Welfare With an Adequate Margin of Safety”, Environmental Protection Agency, March 1974.

HARRIS MILLER MILLER & HANSON INC. Screening Distances for Potential Noise Impact by Ambient Location and Train Volume for CREATE Projects February 10, 2006 / CREATE Program Clarification (12/12/06) Page 4 Table 4. Screening distances for low, medium and high train activity vs. noise receptor location
Screening Distance (ft from centerline of corridor) with Intervening Building Rows for CREATE Program3
Train Volume Ambient
Conditions Low (Freight Only)
Low Mix (Freight and Passenger)
Med (Freight 1) High (Freight 1,2)
Normal Suburban 200 225 500 1000 Urban Residential 150 175 375 750
Noisy Urban Residential 75 100 225 500
1 Addition of passenger train traffic does not change screening distances. 2 Use this category for grade crossings where horns are sounded. 3 CREATE Program Clarification (12/12/06)
APPLICATION OF SCREENING DISTANCES
The screening distances presented here are for general consideration in determining the outer limits to noise impact. The areas defined by the screening distances are meant to be sufficiently large to encompass all potentially impacted locations. It should be noted that while these distances have a factor of safety included by using the upper limit of the range of activity, the screening distances do not specifically include additional noise sources that may be present such as horn blowing, wheel flats and/or track crossovers.
To determine the applicable ambient noise level category, ideally ambient noise measurements would be available to properly select the screening distance; however, typically noise measurement data are not available at the preliminary stages of noise impact assessment. Therefore, the selection of ambient noise level category should be made based on census tract population data or, in general, how well a location matches one of the noise level categories. For example, for residential areas near major roadways (expressways) it is appropriate to use the “noisy urban residential” category for screening distances based on the knowledge that a major roadway will significantly contribute to ambient sound levels.
Determining which level of train activity (low, medium or high) to use may be difficult when screening distances are needed for a location that might have a mixture of low, medium and high activity for each of the separate activity variables. In these situations it is necessary to consider all train activity variables and their relations to the given categories to determine which screening distance to use. If any parameter exceeds the ranges given, then the next highest category should be used. For example, if a particular node has 38 freight trains/day and would normally be categorized “Low”, but the speeds average 30 mph, the appropriate category for screening would be “Medium.”
If horn blowing at a grade crossing is a known noise source, then the “High” category should be used and the screening distance is applied over the length of track the horns are sounded.

HARRIS MILLER MILLER & HANSON INC. Screening Distances for Potential Noise Impact by Ambient Location and Train Volume for CREATE Projects February 10, 2006 / CREATE Program Clarification (12/12/06) Page 5 CREATE PROGRAM CLARIFICATION (12/12/06) The CREATE screening procedures are meant to be conservative to make sure all potential impacts are included. The highest train activity should be used to determine the screening distance.

HARRIS MILLER MILLER & HANSON INC. Screening Distances for Potential Noise Impact by Ambient Location and Train Volume for CREATE Projects February 10, 2006 / CREATE Program Clarification (12/12/06) Page 6 APPENDIX
0
10
20
30
40
50
60
0 to 0.07 0.07 to0.55
0.55 to1.03
1.03 to1.51
1.51 to1.99
1.99 to2.47
2.47 to2.95
2.95 to3.43
3.43 to3.91
3.91 to4.39
4.39 to4.87
Number of Daytime Trains per Hour
Num
ber o
f Sam
ples
Figure 1. Distribution of trains per hour during the daytime (7am to 10pm)
0
10
20
30
40
50
60
70
0 to 0 0 to 0.43 0.43 to0.87
0.87 to1.3
1.3 to1.73
1.73 to2.17
2.17 to2.6
2.6 to3.03
3.03 to3.47
3.47 to3.9
3.9 to4.33
Number of Nighttime Trains per Hour
Num
ber o
f Sam
ples
Figure 2. Distribution of trains per hour during the nighttime (10pm to 7am)

HARRIS MILLER MILLER & HANSON INC. Screening Distances for Potential Noise Impact by Ambient Location and Train Volume for CREATE Projects February 10, 2006 / CREATE Program Clarification (12/12/06) Page 7
0
10
20
30
40
50
60
0 to 9.1 9.1 to11.6
11.6 to14.1
14.1 to16.6
16.6 to19.1
19.1 to21.5
21.5 to 24 24 to 26.5 26.5 to 29 29 to 31.5 31.5 to 34
Train Speed (mph)
Num
ber o
f Sam
ples
Figure 3. Distribution of train speeds
0
10
20
30
40
50
60
70
80
0 to 1017 1017 to1662
1662 to2308
2308 to2954
2954 to3599
3599 to4245
4245 to4890
4890 to5536
5536 to6181
6181 to6827
6827 to7473
Length of Cars (feet)
Num
ber o
f Sam
ples
Figure 4. Distribution of length of cars in train

HARRIS MILLER MILLER & HANSON INC. Screening Distances for Potential Noise Impact by Ambient Location and Train Volume for CREATE Projects February 10, 2006 / CREATE Program Clarification (12/12/06) Page 8
0
10
20
30
40
50
60
70
80
1 to 1.91 1.91 to 2 2 to 2.08 2.08 to2.17
2.17 to2.26
2.26 to2.34
2.34 to2.43
2.43 to2.52
2.52 to2.6
2.6 to2.69
2.69 to2.78
Locomotives per Train
Num
ber o
f Sam
ples
Figure 5. Distribution of locomotives per train
APPENDIX B
CREATE Railroad Noise Model User Guide, 2006
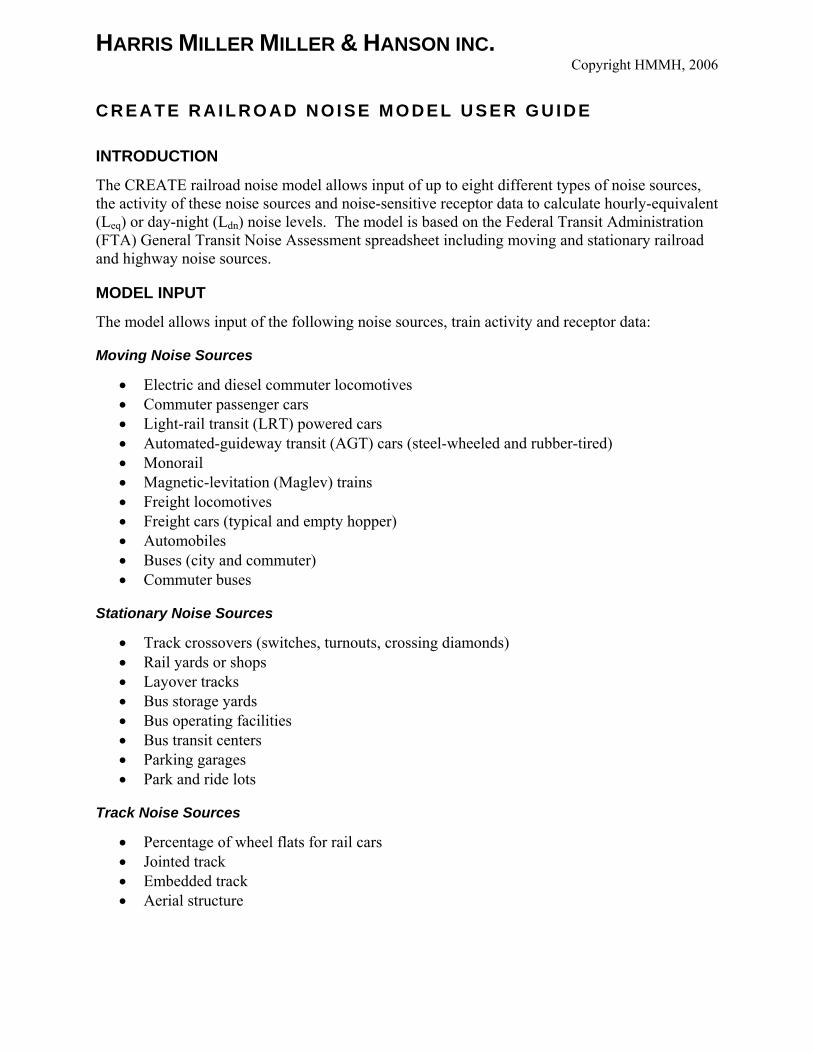
HARRIS MILLER MILLER & HANSON INC. Copyright HMMH, 2006
CREATE RAILROAD NOISE MODEL USER GUIDE
INTRODUCTION
The CREATE railroad noise model allows input of up to eight different types of noise sources, the activity of these noise sources and noise-sensitive receptor data to calculate hourly-equivalent (Leq) or day-night (Ldn) noise levels. The model is based on the Federal Transit Administration (FTA) General Transit Noise Assessment spreadsheet including moving and stationary railroad and highway noise sources.
MODEL INPUT
The model allows input of the following noise sources, train activity and receptor data:
Moving Noise Sources
• Electric and diesel commuter locomotives • Commuter passenger cars • Light-rail transit (LRT) powered cars • Automated-guideway transit (AGT) cars (steel-wheeled and rubber-tired) • Monorail • Magnetic-levitation (Maglev) trains • Freight locomotives • Freight cars (typical and empty hopper) • Automobiles • Buses (city and commuter) • Commuter buses
Stationary Noise Sources
• Track crossovers (switches, turnouts, crossing diamonds) • Rail yards or shops • Layover tracks • Bus storage yards • Bus operating facilities • Bus transit centers • Parking garages • Park and ride lots
Track Noise Sources
• Percentage of wheel flats for rail cars • Jointed track • Embedded track • Aerial structure

HARRIS MILLER MILLER & HANSON INC. CREATE Railroad Noise Model User Guide Copyright HMMH, 2006
Page 2
Train Activity Data
• Number of trains per hour for: o Light-rail, commuter, AGT, monorail, Maglev, freight trains o Rail yards or shops and layover tracks o Track crossovers
• Number of vehicles per hour for: o Automobiles, city and commuter buses o Parking garages (automobiles) and park and ride lots (automobiles and buses) o Bus storage yards and bus transit center o Bus operating facilities (buses present and serviced) o Bus operating facility (buses serviced)
• Number of locomotives per train for: o Commuter trains (electric and diesel) o Freight trains
• Number of cars per train for: o Commuter, LRT, AGT, monorail and Maglev trains o Freight trains (length of cars)
• Duration of trains for: o Track crossovers
• Speed of vehicles for: o Trains and automobiles
Noise-Sensitive Receptor Data
• Land use type (FTA Category 1,2,3) • Distance to noise sources • Presence of noise barrier • Intervening building rows
NOISE MODEL PROCESS
To calculate noise levels for sensitive receptors, perform the steps outlined in the flow diagram in Figure 1. Once the noise source number (one thru 23) is input, different metrics will appear in rows 26 to 38 that require input. Once all these variables are input, the noise model will automatically calculate the noise levels from each individual noise source (up to eight) as well as the cumulative noise levels from all noise sources together.
Figure 2 shows an example of typical input data into the CREATE railroad noise model.

HARRIS MILLER MILLER & HANSON INC. CREATE Railroad Noise Model User Guide Copyright HMMH, 2006
Page 3
Input Noise-Sensitive Receptor DataReceptor/case name
FTA land use category (1,2 or 3)Distance to noise sourcesIntervening building rows
Presence of noise barriers
Input Noise Sources (up to eight)Use source reference list
Input Noise Source ActivityVehicles per hour
Cars / locomotives per trainDuration of trainsVehicle speeds
Input Noise Source DetailsPercentage of wheel flats
Jointed trackEmbedded trackAerial structure
Output Noise LevelHourly-equivalent noise level (Leq)
Day-night noise level (Ldn)
Figure 1. Flow diagram of noise modeling process
ParameterSource Num. Commuter Electric Locomotive 1Distance (source to receiver) distance (ft) 50Daytime Hours speed (mph) 25(7 AM - 10 PM) trains/hour 3
locos/train 2Nighttime Hours speed (mph) 25(10 PM - 7 AM) trains/hour 1
locos/train 2Wheel Flats?Jointed Track? Y/N NEmbedded Track? Y/N NAerial Structure? Y/N NBarrier Present? Y/N NIntervening Rows of of Buildings number of rows 0
Source 1
Figure 2. Example of model input data

HARRIS MILLER MILLER & HANSON INC. CREATE Railroad Noise Model User Guide Copyright HMMH, 2006
Page 4 NOISE SOURCE AND RECEPTOR DETAILS
Summary of Noise Source Reference SELs
Reference SELs at 50 feet and speed coefficients are shown for all moving noise sources in Table 1. These reference SELs are per vehicle except for freight cars and hopper cars, which are based on 2000-feet of cars.
Table 2 shows the reference SELs at 50 feet and coefficients for all stationary noise sources. All of the stationary noise source coefficients are 10; however, the references are different (i.e. duration of pass-bys, trains per locomotive, buses per hour, etc.)
Table 1. Moving Noise Source Reference SELs and Speed Coefficients
Moving Noise Sources SEL at 50 feet Speed Coefficient Reference Speed (mph)Commuter Electric Locomotive 90 10.0 50Commuter Diesel Locomotive 92 -10.0 50Commuter Rail Car 82 20.0 50RRT/LRT 82 20.0 50AGT, Steel Wheel 80 20.0 50AGT, Rubber Tire 78 20.0 50Monorail 82 20.0 50Maglev 72 20.0 50Freight Locomotive 97 10.0 40Freight Cars* 100 20.0 40Hopper Cars (empty)* 104 20.0 40Hopper Cars (full)* 100 20.0 40Automobile 73 28.1 50City Bus 84 23.9 50Commuter Bus 88 14.6 50* Freight and Hopper Cars+A51 SEL is based on 2000 feet of cars
Table 2. Stationary Noise Source Reference SELs and Coefficients
Stationary Noise Sources SEL at 50 feet Reference Coefficient Reference Value Reference MetricTrack Crossover 100 10 3600 (seconds) duration of pass-bysRail Yard or Shop 118 10 20 (trains per hour)Layover Tracks 109 10 1 (trains during hour)Bus Storage Yard 111 10 100 (buses per hour)Bus Oerations Facility 114 10 200 (buses per hour)Bus Transit Center 101 10 / 10 20 / 60 (buses per hour) / (buses services per hour)Parking Garage 92 10 1000 (autos per hour)Park & Ride Lot 101 10 / 10 2000 / 24 (autos per hour) / (buses per hour)
Moving Noise Sources
Moving noise sources (listed in the Model Input section) are modeled to propagate noise as a line source over soft ground (grass, soft dirt). This results in a sound propagation rate of 4.5 decibels per distance doubling.
Moving noise sources also have a “speed coefficient” which represents the variability of the sound exposure level (SEL) of a vehicle pass-by as function of vehicle speed. The speed coefficients of each vehicle are a function of the potential increase or decrease in maximum noise level due to factors such as wheel/rail interaction, tire/pavement interaction or engine speed and the duration of the pass-by (a higher speed pass-by can actually result in a lower SEL due to

HARRIS MILLER MILLER & HANSON INC. CREATE Railroad Noise Model User Guide Copyright HMMH, 2006
Page 5 the shorter duration of the event). For the moving noise sources in the CREATE model, speed coefficients range from –10 to 28.1.
Increasing the number of vehicles for moving sources relates to SEL on a 10 Log-basis. This results in a three-decibel increase in SEL for each doubling of the number of vehicles. For freight trains, the same relationship exists but is based on the length of cars rather than the specific number of cars.
Stationary Noise Sources
Stationary noise sources (listed in the Model Input section) are modeled to propagate noise as a point source over soft ground (grass, soft dirt). This results in a sound propagation rate of 7.5 decibels per distance doubling.
The SELs from noise sources such as rail yards, bus storage yards and parking lots, vary based on the number of vehicles present on a 10-Log basis. Similar to moving sources, a doubling in the number of vehicles results in an SEL increase of three decibels.
For the inclusion of idling locomotive noise sources, use layover tracks as a stationary source. This noise source will require the input of the number of trains during an hour. If one locomotive were to idle for 15 minutes, this is equivalent to 0.25 trains during an hour.
Track Noise Sources
For the inclusion of LRT, commuter or freight cars, the average percentage of wheel flats present should be input. The adjustment for wheel flats on cars could be as high as an additional five decibels; however, typically the actual percentage of cars with wheel flats is relatively low and noise levels typically increase by less than one decibel.
Jointed track produces an additional noise source at the wheel/rail interface as compared to continuous-welded rail (CWR). The presence of jointed track, therefore, will increase sound levels of commuter locomotives, commuter cars, LRT cars, freight locomotives and freight cars by five decibels.
For the operation of trains on embedded track, noise levels will be three decibels higher than on ballast and tie. This increase is due to the hard ground between the noise source and receptor allowing more efficient sound propagation.
Tracks that are elevated on an aerial structure will typically produce noise levels that are four decibels higher than tracks at grade. This increase in noise level is due to the radiation of the aerial structure as well as more efficient sound propagation from a source that is at a higher elevation.
The presence of a track crossover such as a switch, turnout or crossing diamond acts as a stationary noise source whenever the train travels over it. For this noise source, the duration and the number of trains per hour are required to determine the SEL from this source.

HARRIS MILLER MILLER & HANSON INC. CREATE Railroad Noise Model User Guide Copyright HMMH, 2006
Page 6 Noise-Sensitive Receptor Data
The FTA land use category must be input into the model. Land use category 1 and 3 correspond to locations where noise-sensitive receptors are present only during daytime hours and do not typically sleep (e.g. schools, churches and medical offices). Land use category 2 corresponds to locations where noise-sensitive receptors often sleep (e.g. hotel, motels, residences and hospitals). The hourly-equivalent (Leq) noise level for the loudest-hour of train-related activity during hours of noise-sensitivity is used to assess potential impact at a category 1 or 3 receptor and the day-night (Ldn) noise level is used to assess potential impact at a category 2 receptor. The Ldn noise level includes a 10-decibel penalty for noise events that occur between 10pm and 7am; therefore, the input of both daytime and nighttime events is required for category 2 receptors
The presence of a noise barrier can be included in modeling noise levels. However, in a general assessment no details of the height or location of the noise barrier are input. It is assumed that the noise barrier would be effective in lowering noise levels a minimum of five decibels.
The model allows input of the number of intervening rows for receptors that are not adjacent to the noise source. For the first intervening building row, noise levels are modeled to decrease 4.5-decibels. For each additional intervening row (between two and five) an additional 1.5-decibel reduction is taken into account up to a maximum reduction of 10 decibels.
SPREADSHEET INFORMATION
To minimize the potential for error in modifying the CREATE railroad noise model, the spreadsheet has been password protected. The password protection disallows the deletion or modification to cells other than input or output cells (grey). Should modification of the spreadsheet be required for some reason, the spreadsheet can be unlocked with the password: “create”.

Noise Model
Noise Model Based on Federal Transit Adminstration General Transit Noise AssessmentDeveloped for Chicago Create ProjectCopyright 2006, HMMH Inc.Case:
Noise SourceAll SourcesSource 1 Source 2Source 3Source 4Source 5Source 6Source 7Source 8
Enter noise receiver land use category below
Enter data for up to 8 noise sources below - see reference list for source numbersNOISE SOURCE PARAMETERSParameterSource Num.Distance (source to receiver)Daytime Hours (7 AM - 10 PM)
Nighttime Hours (10 PM - 7 AM)
Wheel Flats?Jointed Track?Embedded Track?Aerial Structure?Barrier Present?Intervening Rows of of Buildings
Source NumberCommuter Electric Locomotive 1Commuter Diesel Locomotive 2Commuter Rail Cars 3RRT/LRT 4AGT, Steel Wheel 5AGT, Rubber Tire 6Monorail 7Maglev 8Freight Locomotive 9Freight Cars 10Hopper Cars (empty) 11Hopper Cars (full) 12Crossover 13Automobiles 14City Buses 15Commuter Buses 16Rail Yard or Shop 17Layover Tracks 18Bus Storage Yard 19Bus Op. Facility 20Bus Transit Center 21Parking Garage 22Park & Ride Lot 23
SOURCE REFERENCE LIST
Ldn (dB)Enter Land Use
Leq - daytime (dB)
Source 6
Noise receiver land use category (1, 2 or 3)
Source 4 Source 5 Source 7
RESULTS
Source 1 Source 2 Source 3
Leq - nighttime (dB)
LAND USE CATEGORY
Source 8
Page 1

Noise Model
1 2 3 4 5 6 7 8 9 10 11 12 13 14 15 16 17 18 19 20 21
Term Sou 1 Sou 2 Sou 3 Sou 4 Sou 5 Sou 6 Sou 7 Sou 8 Term 1 Term 2 Term 3 CombineSELref 0.0 0.0 0.0 0.0 0.0 0.0 0.0 0.0 Num Desc Ref SEL Dist Term Desc Denom Min Coef Desc Denom Min Coef Desc Denom Min Coef Jointed Embedded Aerial Barrier 1&2?C1 - Coef 0.0 0.0 0.0 0.0 0.0 0.0 0.0 0.0 0 0 0 0 0 0 C1 - Denom 0.0 0.0 0.0 0.0 0.0 0.0 0.0 0.0 1 Commuter Electric Locomotive 90 15 speed (mph) 50 20 10.0 trains/hour 1 0.01 10.0 locos/train 1 1 10 5.0 3.0 4.0 -5.0 0.0C1 - Day Num 0.00 0.00 0.00 0.00 0.00 0.00 0.00 0.00 2 Commuter Diesel Locomotive 92 15 speed (mph) 50 20 -10.0 trains/hour 1 0.01 10.0 locos/train 1 1 10 5.0 3.0 4.0 -5.0 0.0C1 - Night Num 0.00 0.00 0.00 0.00 0.00 0.00 0.00 0.00 3 Commuter Rail Cars 82 15 speed (mph) 50 20 20.0 trains/hour 1 0.01 10.0 cars/train 1 1 10 5.0 3.0 4.0 -5.0 0.0C1 - Day 0.0 0.0 0.0 0.0 0.0 0.0 0.0 0.0 4 RRT/LRT 82 15 speed (mph) 50 20 20.0 trains/hour 1 0.01 10.0 cars/train 1 1 10 5.0 3.0 4.0 -5.0 0.0C1 - Night 0.0 0.0 0.0 0.0 0.0 0.0 0.0 0.0 5 AGT, Steel Wheel 80 15 speed (mph) 50 20 20.0 trains/hour 1 0.01 10.0 cars/train 1 1 10 -5.0 0.0C2 - Coef 0.0 0.0 0.0 0.0 0.0 0.0 0.0 0.0 6 AGT, Rubber Tire 78 15 speed (mph) 50 20 20.0 trains/hour 1 0.01 10.0 cars/train 1 1 10 -5.0 0.0C2 - Denom 0.0 0.0 0.0 0.0 0.0 0.0 0.0 0.0 7 Monorail 82 15 speed (mph) 50 20 20.0 trains/hour 1 0.01 10.0 cars/train 1 1 10 -5.0 0.0C2 - Day Num 0.00 0.00 0.00 0.00 0.00 0.00 0.00 0.00 8 Maglev 72 15 speed (mph) 50 20 20.0 trains/hour 1 0.01 10.0 cars/train 1 1 10 4.0 -5.0 0.0C2 - Night Num 0.00 0.00 0.00 0.00 0.00 0.00 0.00 0.00 9 Freight Locomotive 97 15 speed (mph) 40 20 10.0 trains/hour 1 0.01 10.0 locos/train 1 1 10 5.0 3.0 4.0 -5.0 0.0C2 - Day 0.0 0.0 0.0 0.0 0.0 0.0 0.0 0.0 10 Freight Cars 100 15 speed (mph) 40 20 20.0 trains/hour 1 0.01 10.0 h of cars (ft) 2000 40 10 5.0 3.0 4.0 -5.0 0.0C2 - Night 0.0 0.0 0.0 0.0 0.0 0.0 0.0 0.0 11 Hopper Cars (empty) 104 15 speed (mph) 40 20 20.0 trains/hour 1 0.01 10.0 h of cars (ft) 2000 40 10 5.0 3.0 4.0 -5.0 0.0C3 - Coef 0.0 0.0 0.0 0.0 0.0 0.0 0.0 0.0 12 Hopper Cars (full) 100 15 speed (mph) 40 20 20.0 trains/hour 1 0.01 10.0 h of cars (ft) 2000 40 10 5.0 3.0 4.0 -5.0 0.0C3 - Denom 0.0 0.0 0.0 0.0 0.0 0.0 0.0 0.0 13 Crossover 100 25 trains/hour 1 0.01 10.0 on of one trai 3600 0.01 10.0 3.0 4.0 -5.0 0.0C3 - Day Num 0.00 0.00 0.00 0.00 0.00 0.00 0.00 0.00 14 Automobiles 73 15 speed (mph) 50 30 28.1 vehicles/hou 1 0.01 10.0 -5.0 0.0C3 - Night Num 0.00 0.00 0.00 0.00 0.00 0.00 0.00 0.00 15 City Buses 84 15 speed (mph) 50 30 23.9 vehicles/hou 1 0.01 10.0 -5.0 0.0C3 - Day 0.0 0.0 0.0 0.0 0.0 0.0 0.0 0.0 16 Commuter Buses 88 15 speed (mph) 50 30 14.6 vehicles/hou 1 0.01 10.0 -5.0 0.0C3 - Night 0.0 0.0 0.0 0.0 0.0 0.0 0.0 0.0 17 Rail Yard or Shop 118 25 trains/hour 20 0.01 10.0 -5.0 0.0Leq50ft - Day 0.0 0.0 0.0 0.0 0.0 0.0 0.0 0.0 18 Layover Tracks 109 25 trains/hour 1 0.01 10.0 -5.0 0.0Leq50ft - Night 0.0 0.0 0.0 0.0 0.0 0.0 0.0 0.0 19 Bus Storage Yard 111 25 buses/hour 100 0.01 10.0 -5.0 0.0Ldn50ft 6.4 6.4 6.4 6.4 6.4 6.4 6.4 6.4 20 Bus Op. Facility 114 25 buses/hour 200 0.01 10.0 es serviced/h 60 0.01 10.0 -5.0 1.0Dist Coef 0.0 0.0 0.0 0.0 0.0 0.0 0.0 0.0 21 Bus Transit Center 101 25 buses/hour 20 0.01 10.0 -5.0 0.0Adj. Dist 0.0 0.0 0.0 0.0 0.0 0.0 0.0 0.0 22 Parking Garage 92 25 autos/hour 1000 0.01 10.0 -5.0 0.0Adj. Wheel Flats 0.0 0.0 0.0 0.0 0.0 0.0 0.0 0.0 23 Park & Ride Lot 101 25 autos/hour 2000 0.01 10.0 buses/hour 24 0.01 10.0 -5.0 1.0Adj. Jointed 0 0 0 0 0 0 0 0Adj. Embed 0 0 0 0 0 0 0 0Adj. Aerial 0 0 0 0 0 0 0 0Adj. Shield 0 0 0 0 0 0 0 0 Category Ldn/LeqLeq - Day 0.0 0.0 0.0 0.0 0.0 0.0 0.0 0.0 0Leq - Night 0.0 0.0 0.0 0.0 0.0 0.0 0.0 0.0 1 LeqLdn 0.0 0.0 0.0 0.0 0.0 0.0 0.0 0.0 2 LdnNeed Land Use 1 3 LeqCalc Leq 0
CALCULATIONS REFERENCE DATA
LAND USE DATA
Page 2

APPENDIX C
Table and Figure Excerpts from FTA Transit Noise and Vibration Impact Assessment
(May 2006)

TRANSIT NOISE AND VIBRATION IMPACT ASSESSMENT
FTA-VA-90-1003-06 May 2006
Office of Planning and Environment
Federal Transit Administration
REPORT DOCUMENTATION PAGE Form Approved OMB No. 0704-0188
Public reporting burden for this collection of information is estimated to average 1 hour per response, including the time for reviewing instructions, searching existing data sources, gathering and maintaining the data needed, and completing and reviewing the collection of information. Send comments regarding this burden estimate or any other aspect of this collection of information, including suggestions for reducing this burden, to Washington Headquarters Services, Directorate for Information Operations and Reports, 1215 Jefferson Davis Highway, Suite 1204, Arlington, VA 22202-4302, and to the Office of Management and Budget, Paperwork Reduction Project (0704-0188), Washington, DC 20503. 1. AGENCY USE ONLY (Leave blank)
2. REPORT DATE May 2006
3. REPORT TYPE AND DATES COVERED Final Report
4. TITLE AND SUBTITLE
Transit Noise and Vibration Impact Assessment 6. AUTHOR(S)
Carl E. Hanson, David A. Towers, and Lance D. Meister
5. FUNDING NUMBERS
7. PERFORMING ORGANIZATION NAME(S) AND ADDRESS(ES) Harris Miller Miller & Hanson Inc. 77 South Bedford Street Burlington, MA 01803
8. PERFORMING ORGANIZATION REPORT NUMBER
299600
9. SPONSORING/MONITORING AGENCY NAME(S) AND ADDRESS(ES) U.S. Department of Transportation Federal Transit Administration Office of Planning and Environment 1200 New Jersey Avenue, S.E. Washington, DC 20590
10. SPONSORING/MONITORING AGENCY REPORT NUMBER
FTA-VA-90-1003-06
11. SUPPLEMENTARY NOTES
Contract management and final production performed by: Frank Spielberg and Kristine Wickham Vanasse Hangen Brustlin, Inc. 8300 Boone Blvd., Suite 700 Vienna, VA 22182 12a. DISTRIBUTION/AVAILABILITY STATEMENT This document is available from the National Technical Information Service, Springfield VA 22161. Phone: 1-888-584-8332 or 703-605-6050; Web site: www.ntis.gov.
12b. DISTRIBUTION CODE
13. ABSTRACT (Maximum 200 words)
This report is the second edition of a guidance manual originally issued in 1995 which presents procedures for predicting and assessing noise and vibration impacts of proposed mass transit projects. All types of bus and rail projects are covered. Procedures for assessing noise and vibration impacts are provided for different stages of project development, from early planning before mode and alignment have been selected through preliminary engineering and final design. Both for noise and vibration, there are three levels of analysis described. The framework acts as a screening process, reserving detailed analysis for projects with the greatest potential for impacts while allowing a simpler process for projects with little or no effects.
This updated guidance contains noise and vibration impact criteria that are used to assess the magnitude of predicted impacts. A range of mitigation measures are described for dealing with adverse noise and vibration impacts. There is a discussion of noise and vibration during the construction stage and also discussion of how the technical information should be presented in the Federal Transit Administration’s environmental documents. This guidance will be of interest not only to technical specialists who conduct the analyses but also to transit agency staff, federal agency reviewers, and members of the general public who may be affected by the projects.
15. NUMBER OF PAGES
274 14. SUBJECT TERMS
Transit noise and vibration analysis, noise and vibration impact criteria, noise and vibration mitigation measures, environmental impact assessment, National Environmental Policy Act compliance. 16. PRICE CODE
17. SECURITY CLASSIFICATION OF REPORT
Unclassified
18. SECURITY CLASSIFICATION OF THIS PAGE
Unclassified
19. SECURITY CLASSIFICATION OF ABSTRACT
Unclassified
20. LIMITATION OF ABSTRACT
NSN 7540-01-280-5500 Standard Form 298 (Rev. 2-89) Prescribed by ANSI Std. 239-18298-102

NOTICE This document is disseminated under the sponsorship of the Department of Transportation in the interest of information exchange. The United States Government assumes no liability for its contents or use thereof. The United States Government does not endorse products or manufacturers. Trade or manufacturers’ names appear in the document only because they are considered essential to the content of the report.

TRANSIT NOISE AND VIBRATION IMPACT ASSESSMENT
FTA-VA-90-1003-06 May 2006 Prepared for: Federal Transit Administration
Office of Planning and Environment Washington DC 20590
Prepared by: Harris Miller Miller & Hanson Inc. 77 South Bedford Street Burlington, MA 01803 Produced by: Vanasse Hangen Brustlin, Inc. 8300 Boone Boulevard, Suite 700
Vienna, VA 22182

Chapter 3: Noise Impact Criteria 3-3
on local streets and separate roadways built exclusively for buses. In contrast, for busways and HOV lanes which are to be integrated in existing highways (e.g., the addition of new lanes or the redesignation of existing lanes on a highway), FHWA's noise abatement criteria are the appropriate noise criteria to use. Likewise, if the project is a new highway involving both general-purpose and dedicated bus/HOV lanes, the FHWA approach is followed. The FHWA criteria are briefly summarized in Section 3.3. 3.1.1 Basis of Noise Impact Criteria The noise impact criteria in Figure 3-1 and Table 3-1 are based on comparison of the existing outdoor noise levels and the future outdoor noise levels from the proposed project. They incorporate both absolute criteria, which consider activity interference caused by the transit project alone, and relative criteria, which consider annoyance due to the change in the noise environment caused by the transit project.
The noise criteria and descriptors depend on land use, as defined in Table 3-2. Further guidance on the definition of land use, the selection of the appropriate noise metric and the application of the criteria is given in Section 3.2 of this chapter, with more detailed guidelines given in Chapters 5 and 6.
Figure 3-1. Noise Impact Criteria for Transit Projects

Table 3-1. Noise Levels Defining Impact for Transit Projects Existing
Noise Exposure*
Leq(h) or Ldn (dBA)
Project Noise Impact Exposure,* Leq(h) or Ldn (dBA) Category 1 or 2 Sites Category 3 Sites
No Impact Moderate
Impact Severe Impact No Impact Moderate
Impact Severe Impact
<43 < Ambient+10 Ambient +
10 to 15 >Ambient+15 <Ambient+15 Ambient +
15 to 20 >Ambient+20 43 <52 52-58 >58 <57 57-63 >63 44 <52 52-58 >58 <57 57-63 >63 45 <52 52-58 >58 <57 57-63 >63 46 <53 53-59 >59 <58 58-64 >64 47 <53 53-59 >59 <58 58-64 >64 48 <53 53-59 >59 <58 58-64 >64 49 <54 54-59 >59 <59 59-64 >64 50 <54 54-59 >59 <59 59-64 >64 51 <54 54-60 >60 <59 59-65 >65 52 <55 55-60 >60 <60 60-65 >65 53 <55 55-60 >60 <60 60-65 >65 54 <55 55-61 >61 <60 60-66 >66 55 <56 56-61 >61 <61 61-66 >66 56 <56 56-62 >62 <61 61-67 >67 57 <57 57-62 >62 <62 62-67 >67 58 <57 57-62 >62 <62 62-67 >67 59 <58 58-63 >63 <63 63-68 >68 60 <58 58-63 >63 <63 63-68 >68 61 <59 59-64 >64 <64 64-69 >69 62 <59 59-64 >64 <64 64-69 >69 63 <60 60-65 >65 <65 65-70 >70 64 <61 61-65 >65 <66 66-70 >70 65 <61 61-66 >66 <66 66-71 >71 66 <62 62-67 >67 <67 67-72 >72 67 <63 63-67 >67 <68 68-72 >72 68 <63 63-68 >68 <68 68-73 >73 69 <64 64-69 >69 <69 69-74 >74 70 <65 65-69 >69 <70 70-74 >74 71 <66 66-70 >70 <71 71-75 >75 72 <66 66-71 >71 <71 71-76 >76 73 <66 66-71 >71 <71 71-76 >76 74 <66 66-72 >72 <71 71-77 >77 75 <66 66-73 >73 <71 71-78 >78 76 <66 66-74 >74 <71 71-79 >79 77 <66 66-74 >74 <71 71-79 >79
>77 <66 66-75 >75 <71 71-80 >80 * Ldn is used for land use where nighttime sensitivity is a factor; Leq during the hour of maximum transit noise exposure is used for land use
involving only daytime activities.

Figure 3-2. Increase in Cumulative Noise Levels Allowed by Criteria (Land Use Cat. 1 &2)

Chapter 4: Noise Screening Procedure 4-3
Table 4-1. Screening Distances for Noise Assessments Screening Distance* (ft)
Type of Project Unobstructed Intervening Buildings Fixed Guideway Systems:
Commuter Rail Mainline 750 375 With Horn Blowing 1,600 1,200 Commuter Rail
Station Without Horn Blowing 250 200 Commuter Rail-Highway Crossing with Horns and Bells
1,600 1,200
Rail Rapid Transit 700 350 Rail Rapid Transit Station 200 100 Light Rail Transit 350 175
Access Roads 100 50 Steel Wheel 125 50
Low- and Intermediate- Capacity Transit
Rubber Tire 90 40
Monorail 175 70
Yards and Shops 1000 650 Parking Facilities 125 75
Access Roads 100 50 Ancillary Facilities
Ventilation Shafts 200 100 Power Substations 250 125
Bus Systems: Busway 500 250 BRT on exclusive roadway 200 100
Access Roads
100 50
Transit Mall 225 150 Transit Center
225 150
Storage & Maintenance
350 225
Bus Facilities
Park & Ride Lots w/Buses
225 150
Ferry Boat Terminals: 300 150 *Measured from centerline of guideway/roadway for mobile sources; from center of noise-generating activity for stationary sources.

4-4 Transit Noise and Vibration Impact Assessment
Table 4-2. Assumptions for Screening Distances for Noise Assessments Type of Project Operations Speeds Descriptor
Fixed Guideway Systems: Commuter Rail Mainline 66 day /12 night; 1 loco, 6 cars 55 mph Ldn
With Horn Blowing 22 day / 4 night N/A Ldn Commuter Rail Station W/O Horn Blowing 22 day / 4 night N/A Ldn Commuter Rail-Highway Crossing with Horns and Bells
22 day / 4 night 55 mph Ldn
Rail Rapid Transit 220 day / 24 night; 6-car trains 50 mph Ldn Rail Rapid Transit Station 220 day / 24 night 20 mph Ldn
Light Rail Transit 150 day / 18 night; 2 artic veh.
35 mph Ldn
Access Roads to Stations 1000 cars, 12 buses 35 mph PH Leq* Steel Wheel 220 day / 24 night 30 mph Ldn Rubber Tire 220 day / 24 night 30 mph Ldn
Low- and Intermediate- Capacity Transit
Monorail 220 day / 24 night 30 mph Ldn
Yards and Shops 20 train movements N/A PH Leq Parking Facilities 1000 cars N/A PH Leq Access Roads to Parking 1000 cars 35 mph PH Leq Ancillary Facilities Ventilation Shafts Rapid Transit in Subway 50 mph Ldn Power Substations Sealed shed, air conditioned N / A Ldn Bus Systems: Busway 30 buses, 120 automobiles 50 mph PH Leq BRT on exclusive roadway 30 buses 35 mph PH Leq
Access Roads 1000 cars 35 mph PH Leq Transit Mall 20 buses N/A PH Leq Transit Center 20 buses N/A PH Leq Storage & Maintenance
30 buses N/A PH Leq Bus Facilities
Park & Ride Lots w/Buses
1000 cars, 12 buses N/A PH Leq
Ferry Boat Terminals: 8 boats with horns used in normal docking cycle
N/A PH Leq
* PH Leq = hour of maximum transit activity

Chapter 5: General Noise Assessment 5-15
Table 5-7. Estimating Existing Noise Exposure for General Assessment Distance from Major Noise Source1 (feet) Noise Exposure Estimates Interstate Highways2
Other Roadways3
Railroad Lines4
Population Density (people per sq mile) Leq
Day Leq
Evening Leq
Night Ldn
10 - 50 75 70 65 75 50 - 100 70 65 60 70
100 - 200 65 60 55 65 200 - 400 60 55 50 60 400 - 800 55 50 45 55
800 and up 50 45 40 50 10 - 50 70 65 60 70 50 - 100 65 60 55 65 100 - 200 60 55 50 60 200 - 400 55 50 45 55 400 and up 50 45 40 50 10 - 30 -- -- -- 75 30 - 60 -- -- -- 70 60 - 120 -- -- -- 65 120 - 240 -- -- -- 60 240 - 500 -- -- -- 55 500 - 800 -- -- -- 50 800 and up -- -- -- 45 1 - 100 35 30 25 35 100 - 300 40 35 30 40 300 - 1000 45 40 35 45 1000 - 3000 50 45 40 50 3000 - 10000 55 50 45 55 10000 - 30000 60 55 50 60 30000 and up 65 60 55 65 NOTES: 1 Distances do not include shielding from intervening rows of buildings. General rule for estimating shielding attenuation in populated areas: Assume 1 row of buildings every 100 ft; -4.5 dB for the first row, -1.5 dB for every subsequent row up to a maximum of -10 dB attenuation.
2 Roadways with 4 or more lanes that permit trucks, with traffic at 60 mph.
3 Parkways with traffic at 55 mph, but without trucks, and city streets with the equivalent of 75 or more heavy trucks per hour and 300 or more medium trucks per hour at 30 mph.
4 Main line railroad corridors typically carrying 5-10 trains per day at speeds of 30-40 mph.

Table 6-3. Source Reference SELs at 50 Feet: Fixed-Guideway Sources @ 50 mph
Source Reference SEL (dBA)
Approximate Lmax (dBA)
PreferMeasurements?
Rail Cars 82 80 NO Locomotives – Diesel 92 88 NO Locomotives – Electric 90 86 NO Diesel Multiple Unit (DMU) 85 81 YES AGT - Steel Wheel 80 78 YES AGT - Rubber Tire 78 75 YES Monorail 82 80 YES Maglev 72 70 YES Transit Car Horns (Emergency) 93 90 NO Transit Car Whistles 81 78 NO Locomotive Horns At Grade Crossing 113 110 From Crossing to 1/8 mile 113-3*(Dp/660) 110 From 1/8 mile to ¼ mile 110 110
NO
Dp = distance from grade crossing parallel to tracks
Step 2: Conversion to Noise Exposure at 50 feet

Table 6-7. Source Reference SELs at 50 Feet: Stationary Sources
Source Reference SEL (dBA)
Approximate Lmax (dBA)
PreferMeasurements?
Auxiliary Equipment 101 65 YES
Locomotive Idling 109 73 NO Rail Transit Idling 106 70 NO Buses Idling 111 75 NO Ferry Boat Landing, Idling and Departing 91 78 NO
Ferry Boat Fog Horn 90 84 NO Track Crossover 100 90 NO Track Curve Squeal 136 100 YES Car Washes 111 75 YES Crossing Signals 109 73 NO Substations 99 63 NO

Table 9-2. Screening Distances for Vibration Assessment Type of Project Critical Distance for Land Use
Categories*
Distance from Right-of-Way or Property Line
Cat. 1 Cat. 2 Cat. 3 Conventional Commuter Railroad 600 200 120Rail Rapid Transit 600 200 120 Light Rail Transit 450 150 100 Intermediate Capacity Transit 200 100 50 Bus Projects (if not previously screened out) 100 50 -- * The land-use categories are defined in Chapter 8. Some vibration-sensitive land uses are not included in thesecategories. Examples are: concert halls and TV studios which, for the screening procedure, should be evaluated as Category 1; and theaters and auditoriums which should be evaluated as Category 2.

10 20 30 40 50 60 80 100 150 200 30050
55
60
65
70
75
80
85
90
95
100
Distance from track centerline, ft(Use diagonal distance for underground systems)
RM
S V
eloc
ity le
vel,
VdB
re
1 m
icro
in./s
ec
Rapid Transit orLight Rail Vehicles(50 mph)
Rubber-TiredVehicles(30 mph)
Locomotive PoweredPassenger or Freight(50 mph)
Figure 10-1. Generalized Ground Surface Vibration Curves


APPENDIX D
Example Project EX-1 Exhibits


NOISE and VIBRATION RECEPTOR INFORMATIONCREATE Project EX-1
State Plane CoordinatesEasting Northing
EX-1-R1North of RR tracks and west of Chicago Skyway along E. 94th St.
2838 to 2864 E. 94th. 1489218.2 15154654.4 Residence Noise
EX-1-R2North of RR tracks and west of Chicago Skyway along Escanaba Av.
9300 to 9400 Escanaba Ave. 1489234.6 15154876.2 Residence Noise
EX-1-R3North of RR tracks and west of Chicago Skyway along Anthony Ave.
9310 to 9312 Anthony Av. 1489522.1 15154966.6 Residence Noise
EX-1-R4North of RR tracks and west of Chicago Skyway along S. Commercial Ave.
9413 to 9422 S. Commercial Ave. 1489957.5 15154358.6 Residence Noise and Vibration
EX-1-R5Northwest quadrant of S. Commercial Avenue and E.95th Street
9450 S. Commercial Ave. 1489982.2 15153997.1 Residence Noise and Vibration
EX-1-R6South of E. 95th Street between S. Commercial and S. Houston Ave.
3017 to 3025 E. 95th, 9500 to 9515 S. Commercial Av. 1490253.3 15153915.0 Residence and
Church Noise
EX-1-R7 West of RR tracks along E. 96th St. 3045 to 3065 E. 96th 1490376.5 15153233.1 Residence Noise
EX-1-R8 Residential area east of RR tracks and Chicago Skyway
9658 to 9713 S. Avenue N, 9712 S. Avenue M 1493383.4 15152340.9 Residence Noise
EX-1-R9 Residential area east of RR tracks and Chicago Skyway
9713 to 9753 S. Avenue N, 9712 to 9815 S. Avenue M 1493375.2 15152193.0 Residence Noise
EX-1-R10 Residential area east of RR tracks and Chicago Skyway
9800 to 9831 S. Avenue M, 9828 to 9861 S. Avenue L, 9900 to 9906 S. EXing Ave
1493736.7 15151724.7 Residence Noise
EX-1-R11 West of tracks and east of Calumet River 9914 to 9919 S. Avenue M 1493629.9 15151157.9 Residence Noise
EX-1-R12 West of tracks and east of Calumet River 9920 to 9963 S. Avenue M 1493827.0 15150821.0 Residence Noise
Exhibit 4
EvaluationReceptor ID Location Addresses Receptor Type

APPENDIX E
Example Project EX- 1 Noise and Vibration Assessment Summary Tables

EXHIBIT 5Example Hourly Leq Measurements
Minute Leq, dBA Equivalent Sound Pressure(10^(Leq/10))
1 65.6 3630780.5482 65.9 3890451.453 66.3 4265795.1884 66.8 4786300.9235 66.5 4466835.9226 65.6 3630780.5487 65.1 3235936.5698 64.8 3019951.729 64.7 2951209.227
10 64.7 2951209.22711 65.9 3890451.4512 66.5 4466835.92213 67.1 5128613.8414 69.2 8317637.71115 70.3 Data removed16 72.5 due to train passing17 78.918 76.819 76.420 69.2 8317637.71121 68.7 7413102.41322 67.5 5623413.25223 66.7 4677351.41324 65.8 3801893.96325 65.3 3388441.56126 64.8 3019951.7227 67.1 5128613.8428 66.3 4265795.18829 66.5 4466835.92230 66.8 4786300.92331 67.9 6165950.01932 66.8 4786300.92333 66.3 4265795.18834 65.8 3801893.96335 65.4 3467368.50536 66.8 4786300.92337 66.7 4677351.41338 65.8 3801893.96339 64.9 3090295.43340 64.8 3019951.7241 64.9 3090295.43342 65.7 3715352.29143 65.5 3548133.89244 66.9 4897788.19445 67.1 5128613.8446 66.8 4786300.92347 66.7 4677351.41348 69.7 9332543.00849 65.8 3801893.96350 64.9 3090295.43351 65.9 3890451.4552 66.4 4365158.32253 66.8 4786300.92354 66.4 4365158.32255 65.9 3890451.4556 65.7 3715352.29157 65.3 3388441.56158 65.9 3890451.4559 65.1 3235936.56960 64.5 2818382.93161 64.9 3090295.43362 64.5 2818382.93163 65.9 3890451.4564 66.4 4365158.32265 66.9 4897788.194
Average 4314366.003Leq (hourly), dBA 66.3 (10 x LOG (Average Equivalent Sound Pressure))

EXHIBIT 6
Detector Node Train Symbol HE Arrival HE Departure TE Departure Speed Loads Empties Tons Feet Locos Number Cars DD:HH:MM:SS DD:HH:MM:SS DD:HH:MM:SS MPH
Wed: 7 TrainsNV001-WA-3-1 SB-681-14-4 1-We:12:53:34 We:12:53:34 We:13:35:40 10 0 124 3027 2524 3NV001-WA-3-1 NS2-LC10 10-4 1-We:15:00:51 We:15:00:51 We:15:01:34 14 7 4 1121 264 3NV001-WA-3-1 SB-43G-14-4 1-We:17:43:40 We:17:43:40 We:17:59:09 14 11 75 3394 1747 2NV001-WA-3-1 SU-45E-14-4 1-We:19:01:58 We:19:01:58 We:19:22:27 14 28 49 4794 1569 2NV001-WA-3-1 UU-UP-PWR1-14-4 1-We:21:13:25 We:21:13:25 We:21:13:34 14 0 0 352 150 2NV001-WA-3-1 BS-TV 30-14-4 1-We:21:54:00 We:21:54:00 We:21:54:10 14 0 0 300 150 2NV001-WA-3-1 SN-174-14-4 1-We:22:01:32 We:22:01:32 We:22:08:22 14 34 89 6698 2480 2
Thurs: 14 TrainsNV001-WA-3-1 BN-T265-5 2-Th:04:48:27 Th:04:48:27 Th:05:06:18 5 28 47 4625 1644 4NV001-WA-3-1 SB-21N-15-5 2-Th:05:16:06 Th:05:16:06 Th:05:17:24 14 15 0 1715 480 1NV001-WA-3-1 UU-UP-PWR1-15-5 2-Th:05:20:49 Th:05:20:49 Th:05:20:59 14 0 0 352 150 2NV001-WA-3-1 SS-19A-15-5 2-Th:05:23:39 Th:05:33:26 Th:05:34:47 0 3 19 1319 479 2NV001-WA-3-1 BN-TV265-5 2-Th:07:27:27 Th:07:27:27 Th:07:47:15 5 40 0 4626 1962 2NV001-WA-3-1 SU-23M-15-5 2-Th:10:04:03 Th:10:04:03 Th:10:06:18 14 25 0 3702 828 3NV001-WA-3-1 SB-43G-15-5 2-Th:10:30:25 Th:10:30:25 Th:10:40:59 14 5 53 2432 1193 2NV001-WA-3-1 SS-43E-15-5 2-Th:11:01:22 Th:11:01:22 Th:11:05:25 14 14 59 3585 1490 2NV001-WA-3-1 NS2-LC10 11-5 2-Th:16:54:12 Th:16:54:12 Th:16:55:51 15 15 15 2373 612 3NV001-WA-3-1 SB-681-15-5 2-Th:17:07:25 Th:17:07:25 Th:17:29:45 14 0 126 2836 2541 2NV001-WA-3-1 SB-23N-15-5 2-Th:18:41:40 Th:18:41:40 Th:18:43:59 14 18 9 3474 846 1NV001-WA-3-1 SU-45E-15-5 2-Th:19:33:12 Th:19:33:12 Th:19:36:58 14 25 43 3963 1391 2NV001-WA-3-1 SN-174-15-5 2-Th:21:44:45 Th:21:44:45 Th:21:50:58 14 58 56 7928 2302 2NV001-WA-3-1 BS-TV 30-15-5 2-Th:23:40:10 Th:23:40:10 Th:23:40:20 14 0 0 300 150 2
Fri: 15 Trains (Maximum Day)NV001-WA-3-1 UU-UP-PWR1-16-6 3-Fr:04:29:49 Fr:04:29:49 Fr:04:29:58 14 0 0 352 150 2 0 NIGHTNV001-WA-3-1 SB-21N-16-6 3-Fr:05:16:25 Fr:05:16:25 Fr:05:17:09 14 8 0 1655 266 1 3 Average speed = 14 mphNV001-WA-3-1 SS-19A-16-6 3-Fr:08:56:28 Fr:08:56:28 Fr:08:58:18 14 11 22 2124 676 1 11 Average number of locos = 2NV001-WA-3-1 SS-43E-16-6 3-Fr:10:49:34 Fr:10:49:34 Fr:10:53:25 14 29 39 4948 1413 3 22 Average number of cars = 17NV001-WA-3-1 SB-25K-16-6 3-Fr:11:43:45 Fr:11:43:45 Fr:12:11:11 14 273 0 6128 3187 3 54 Average per hour = (8 trains/9 hours) = 0.9NV001-WA-3-1 NS2-LC10 12-6 3-Fr:12:20:23 Fr:12:20:23 Fr:12:22:02 14 15 15 2373 612 3 7NV001-WA-3-1 SU-23M-16-6 3-Fr:13:19:17 Fr:13:19:17 Fr:13:23:13 14 41 5 5378 1446 2 24 DAYNV001-WA-3-1 SB-25K-17-6 3-Fr:15:02:44 Fr:15:02:44 Fr:15:18:02 14 22 4 3072 1747 2 29 Average speed = 14 mphNV001-WA-3-1 SN-174-16-6 3-Fr:16:20:52 Fr:16:20:52 Fr:16:27:25 14 57 62 8322 2401 2 41 Average number of locos = 2NV001-WA-3-1 SB-681-16-6 3-Fr:16:39:54 Fr:16:39:54 Fr:17:01:23 14 0 123 2756 2482 2 42 Average number of cars = 27NV001-WA-3-1 SB-43G-16-6 3-Fr:17:11:13 Fr:17:11:13 Fr:17:48:34 14 5 61 2710 1351 2 22 Average per hour = (7 trains/15 hours) = 0.5NV001-WA-3-1 SU-45E-16-6 3-Fr:18:30:42 Fr:18:30:42 Fr:18:35:10 14 37 44 5367 1648 2 27NV001-WA-3-1 BS-TV 30-16-6 3-Fr:22:11:43 Fr:22:11:43 Fr:22:11:53 14 0 0 300 150 2 0 NIGHTNV001-WA-3-1 SN-174-17-6 3-Fr:22:22:31 Fr:22:22:31 Fr:22:26:09 14 32 30 5086 1338 5 18 Trains included in estimates listed above.NV001-WA-3-1 SN-174X-16-6 3-Fr:23:51:56 Fr:23:51:56 Fr:23:56:50 14 15 74 4060 1807 2 30
Sat: 13 TrainsNV001-WA-3-1 SB-667-16-7 4-Sa:04:05:49 Sa:04:05:49 Sa:04:24:00 14 0 101 2295 2046 2NV001-WA-3-1 SB-21N-17-7 4-Sa:05:40:22 Sa:05:40:22 Sa:05:40:52 14 5 0 1235 175 1NV001-WA-3-1 SS-19A-17-7 4-Sa:07:52:53 Sa:07:52:53 Sa:07:55:10 14 4 36 1866 836 2NV001-WA-3-1 SB-2_25K-17-7 4-Sa:09:13:13 Sa:09:13:13 Sa:09:40:32 14 149 0 4723 3114 3NV001-WA-3-1 SS-43E-17-7 4-Sa:10:14:16 Sa:10:14:16 Sa:10:18:41 14 22 58 4338 1628 2NV001-WA-3-1 SB-23N-17-7 4-Sa:11:45:46 Sa:11:45:46 Sa:11:47:19 15 17 1 1966 571 1NV001-WA-3-1 SU-23M-17-7 4-Sa:12:16:49 Sa:12:16:49 Sa:12:20:44 14 45 1 6055 1446 2NV001-WA-3-1 SB-681-17-7 4-Sa:13:02:49 Sa:13:02:49 Sa:13:24:45 14 0 125 2829 2522 2NV001-WA-3-1 SB-43G-17-7 4-Sa:15:37:03 Sa:15:37:03 Sa:15:52:20 14 11 74 4340 1794 5NV001-WA-3-1 NS2-LC10 13-7 4-Sa:16:39:55 Sa:16:39:55 Sa:16:41:34 15 15 15 2373 612 3NV001-WA-3-1 SU-45E-17-7 4-Sa:18:22:43 Sa:18:22:43 Sa:18:25:20 14 18 28 3151 955 2NV001-WA-3-1 SB-667-17-7 4-Sa:20:49:09 Sa:20:49:09 Sa:21:08:31 14 0 110 2650 2247 3NV001-WA-3-1 BS-TV 30-17-7 4-Sa:23:45:50 Sa:23:45:50 Sa:23:46:00 14 0 0 300 150 2
Sun: 4 TrainsNV001-WA-3-1 SB-21N-18-8 8:06:15:41 8:06:15:41 8:06:16:16 14 6 0 1326 205 1NV001-WA-3-1 SB-681X-17-8 8:07:06:24 8:07:06:24 8:07:28:31 14 0 126 2856 2541 2NV001-WA-3-1 SB-25K-18-8 8:12:04:01 8:12:04:01 8:12:31:08 14 270 0 6717 3152 3NV001-WA-3-1 NS2-LC10 14-8 8:16:36:08 8:16:36:08 8:16:37:47 14 15 15 2373 612 3
Number of Rail Cars = (Total Length - (Number of Locomotives *75 ft)) / 55 feet
Data comes sorted by train symbol. Resort data by HE arrival time (data shown here is already sorted).
EXAMPLE TRAIN DATA FOR RECEPTOR 1 - TRACK 1
R:\Benesch\CREATE\Various\N&V Memo\[Example CTCO data.xls]3C
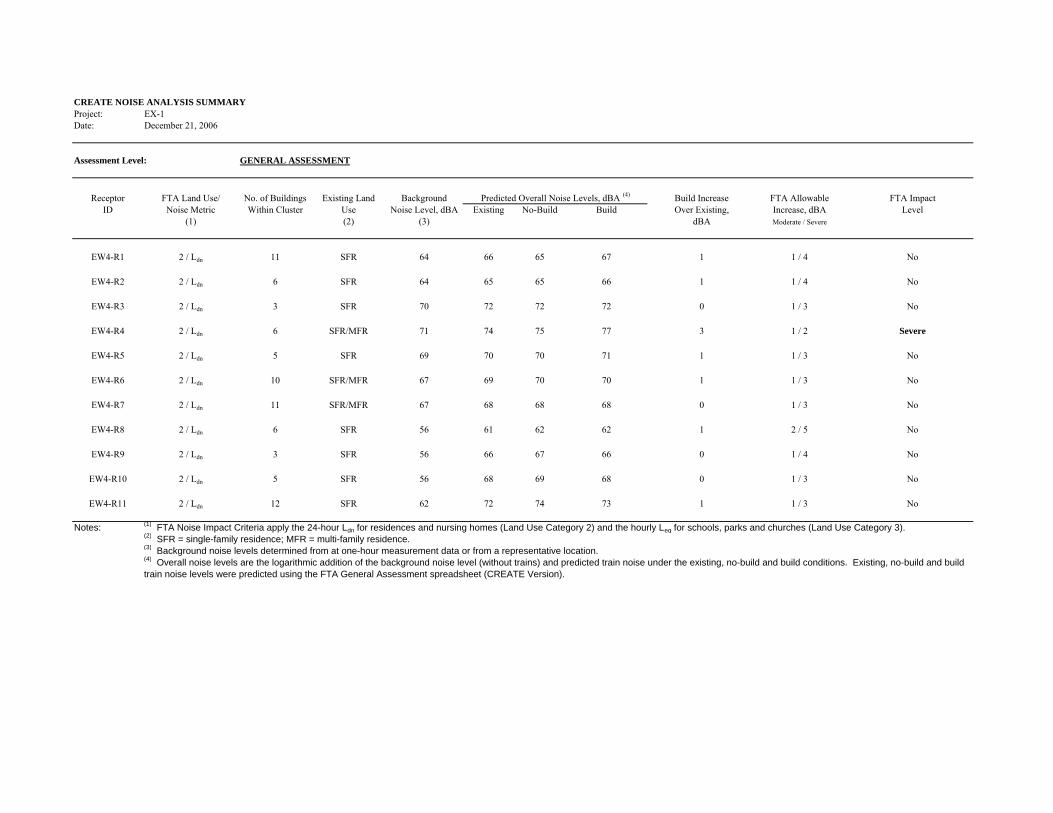
CREATE NOISE ANALYSIS SUMMARYProject: EX-1Date: December 21, 2006
Assessment Level: GENERAL ASSESSMENT
Receptor FTA Land Use/ No. of Buildings Existing Land Background Predicted Overall Noise Levels, dBA (4) Build Increase FTA Allowable FTA ImpactID Noise Metric Within Cluster Use Noise Level, dBA Existing No-Build Build Over Existing, Increase, dBA Level
(1) (2) (3) dBA Moderate / Severe
EW4-R1 2 / Ldn 11 SFR 64 66 65 67 1 1 / 4 No
EW4-R2 2 / Ldn 6 SFR 64 65 65 66 1 1 / 4 No
EW4-R3 2 / Ldn 3 SFR 70 72 72 72 0 1 / 3 No
EW4-R4 2 / Ldn 6 SFR/MFR 71 74 75 77 3 1 / 2 Severe
EW4-R5 2 / Ldn 5 SFR 69 70 70 71 1 1 / 3 No
EW4-R6 2 / Ldn 10 SFR/MFR 67 69 70 70 1 1 / 3 No
EW4-R7 2 / Ldn 11 SFR/MFR 67 68 68 68 0 1 / 3 No
EW4-R8 2 / Ldn 6 SFR 56 61 62 62 1 2 / 5 No
EW4-R9 2 / Ldn 3 SFR 56 66 67 66 0 1 / 4 No
EW4-R10 2 / Ldn 5 SFR 56 68 69 68 0 1 / 3 No
EW4-R11 2 / Ldn 12 SFR 62 72 74 73 1 1 / 3 No
Notes: (1) FTA Noise Impact Criteria apply the 24-hour Ldn for residences and nursing homes (Land Use Category 2) and the hourly Leq for schools, parks and churches (Land Use Category 3).(2) SFR = single-family residence; MFR = multi-family residence.(3) Background noise levels determined from at one-hour measurement data or from a representative location.(4) Overall noise levels are the logarithmic addition of the background noise level (without trains) and predicted train noise under the existing, no-build and build conditions. Existing, no-build and build train noise levels were predicted using the FTA General Assessment spreadsheet (CREATE Version).
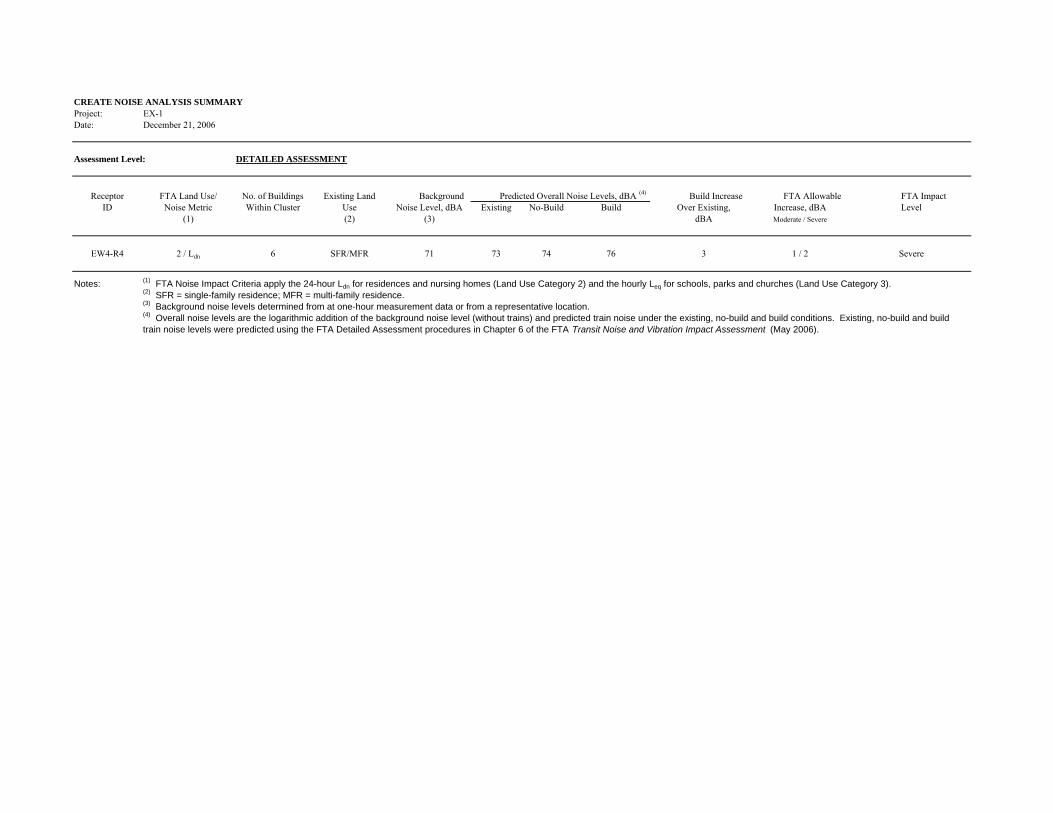
CREATE NOISE ANALYSIS SUMMARYProject: EX-1Date: December 21, 2006
Assessment Level: DETAILED ASSESSMENT
Receptor FTA Land Use/ No. of Buildings Existing Land Background Predicted Overall Noise Levels, dBA (4) Build Increase FTA Allowable FTA ImpactID Noise Metric Within Cluster Use Noise Level, dBA Existing No-Build Build Over Existing, Increase, dBA Level
(1) (2) (3) dBA Moderate / Severe
EW4-R4 2 / Ldn 6 SFR/MFR 71 73 74 76 3 1 / 2 Severe
Notes: (1) FTA Noise Impact Criteria apply the 24-hour Ldn for residences and nursing homes (Land Use Category 2) and the hourly Leq for schools, parks and churches (Land Use Category 3).(2) SFR = single-family residence; MFR = multi-family residence.(3) Background noise levels determined from at one-hour measurement data or from a representative location.(4) Overall noise levels are the logarithmic addition of the background noise level (without trains) and predicted train noise under the existing, no-build and build conditions. Existing, no-build and build train noise levels were predicted using the FTA Detailed Assessment procedures in Chapter 6 of the FTA Transit Noise and Vibration Impact Assessment (May 2006).

CREATE NOISE ABATEMENT EVALUATIONEX-1
Date: December 21, 2006
Assessment Level:ABATEMENT EVALUATION
Receptor EX1-R4
Potential Barrier Location Toe of Embankment
Noise Metric Ldn
Build Scenario Noise Level Without Barrier (Future CREATE Program Train Noise + Background), dBA 76
Noise Wall Height, ft 15
Noise Wall Length, ft 400
Unit Noise Wall Cost, $ (1) $25.00
Total Noise Wall Cost, $ $150,000
Future CREATE Program Train Noise Reduction, dBA 5
Build Scenario Noise Reduction (Future CREATE program Noise+Background), dBA (2) 2
Number of Benefited Receptors (3) 2
Cost Per Benefited Receptor $75,000
Impact Level Severe Impact
Build Scenario Noise Level Increase that Does Not Result in a Moderate Impact, dBA 1
Build Scenario Noise Level Increase Over Existing Noise Level, dBA 3
Predicted Noise Level Increase Over Moderate Impact Threshold, dBA 2
IF MODERATE IMPACT:Reasonable Cost Level per Benefited Receptor for Decibels
Exceeding Moderate Impact Threshold (Policy Value) (4)
Not Applicable due to Severe Impact
IF SEVERE IMPACT:Reasonable Cost Per Benefited Receptor (5) $30,000
Does Noise Wall Achieve Noise Reduction Goal? (6) Yes
Does Noise Wall Achieve the Economic Reasonability Policy Value? (7) No
Is Noise Wall Likely to Be Implemented? No
Notes:(1) Noise wall costs are based on $25.00 per square foot unit cost for walls up to 15 feet tall; $37.50 per square foot up to 30 feet tall; and $50.00 per square foot up to 45 feet tall.
(2) Build Scenario Noise Reduction is a decrease in the overall noise (CREATE Program Train Noise + Background).
(3) A benefited receptor is a receptor with predicted noise impacts and that receives a Build Scenario CREATE Program Train Noise Level (Design Year) noise reduction of five (5) dBA or more(4) For moderate impacts, an upper limit of $5,000 per benefited receptor for each decibel exceeding the impact threshold, up to $30,000 per dwelling.
(7) Does the "Reasonable Cost per Benefited Receptor" exceed the "Cost per Benefited Receptor"? If "Yes", then the noise wall achieves the Economic Reasonability Policy Value.
(5) For severe impacts, an upper limit of $30,000 per benefited receptor
(6) Noise mitigation measures must provide a Build Scenario CREATE Program Train Noise Level (Design Year) noise reduction of at least five (5) dBA for the mitigation measure to be considered feasible.

SAMPLE SPREADSHEETS FOR THE VIBRATION ASSESSMENT NOTE: The following spreadsheets are based upon the specific conditions in Example Project EX-1. In the example project, two tracks are affected by the CREATE Programand the train traffic characteristics are similar for both tracks. Therefore, in the spreadsheets, the same adjustment factors (speed, source, path and receiver) are applied to both tracks. If these assumptions are not valid for the project being assessed, the analyst will have to modify the spreadsheets to reflect the specific project’s conditions. For instance, the spreadsheets may need to be revised to analyze a different number of involved tracks. Additionally, different adjustment factors may have to be applied to each track based upon the specific train traffic characteristics for each track.

Vibration General Assessment Report Form For No-Build AlternativeSource Calculations: LocomotivesCREATE Project EX-1
Receptors
Peak Day No-Build
Volumes
No-Build Frequency Category (1)
Distance(2)
Existing Track 1 (feet)
Distance(2)
Existing Track 2 (feet)
Generalized Vibration Curve(3)
Existing Track 1 (VdB)
Generalized Vibration Curve(3)
Existing Track 2 (VdB)
Highest(4) No-Build Vibration Level at Each Receptor
(VdB)EX-R3 4 infrequent 50 65 85 83 87EX-R4 4 infrequent 60 75 83 81 85EX-R5 4 infrequent 225 240 70 69 70EX-R6 4 infrequent 150 165 74 73 75EX-R10 4 infrequent 50 65 85 83 84EX-R11 4 infrequent 60 75 83 81 85
Notes:
(3) Generalized Ground Surface Vibration Curve (Figure 10-1) for locomotive-powered passenger or freight trains at 50 mph.(4) Highest vibration level, from the Generalized Vibration Curve (Figure 10-1), of either Track 1 or Track 2 at each receptor. The example project assumes the same adjustments are applied to both tracks. If the same adjustments cannot be applied to all tracks, the analyst may have to apply adjustments to the tracks individually to determine the highest predicted vibration at each receptor.The "Predicted No-Build" is the "No-Build Scenario CREATE Program Train Vibration Level (Design Year)" which includes all train vibration from no-build scenario (design year) trains operating on tracks affected by the CREATE Program.
(1) Determine if event is frequent; occasional or infrequent event. Refer to Table 7-1 for definition.(2) Distances measured from centerlines of existing tracks to faces of buildings.

Vibration General Assessment Report Form For No-Build AlternativeVibration Adjustment Factors LocomotivesCREATE Project EX-1
UnadjustedSpeed Adjustments Source Adjustments Path Adjustments
Receptors
Highest(1)
Vibration Level @ 50
mph at Each
Receptor No-Build
(VdB)
Average Track
Speed - No-Build
(mph)
Speed Adjustment
No-Build (VdB)
Vehicle(2)
Condition Existing (VdB)
Elevated Structure(3)
Adjustment Existing (VdB)
Propagation Geology(4)
Adjustment Existing (VdB)
Wood Frame
Structure (VdB)
1-5 Floors Above Grade (VdB)
Floor Amplifi- cation (VdB)
No-Build Vibration
(VdB)
No-Build GBN (dBA)
EX-R3 87 10 -14 0 -5 10 -5 -2 6 77 27EX-R4 85 10 -14 0 -5 10 -5 -2 6 75 25EX-R5 70 10 -14 0 -5 10 -5 -2 6 60 10EX-R6 75 10 -14 0 -5 10 -5 -2 6 65 15EX-R10 84 10 -14 0 -5 10 -5 -2 6 74 24EX-R11 85 50 0 0 -5 10 -5 -2 6 89 39
Notes:
(4) Existing geological conditions assumed to have "efficient" vibration propagation.The "Predicted No-Build" is the "No-Build Scenario CREATE Program Train Vibration Level (Design Year)" which includes all train vibration from no-build scenario (design year) trains operating on tracks affected by the CREATE Program.
Adjusted
(1) Highest Vibration Level, from the Generalized Vibration Curve (Figure 10-1), of either the Southbound (Track 1) or Northbound (Track 2) at each receptor.(2) For locomotives assume no worn wheel adjustment(3) The existing tracks are on elevated structure/embankment (they are at least 1 feet higher than the base elevation at all receptors).
No Build AdjustmentsReceiver Adjustments

Vibration General Assessment Report Form For No-Build AlternativeSource Calculations: Freight Rail CarCREATE Project EX-1
Receptors
Peak Day No-Build
Volumes
No-Build Impact
Frequency Category (1)
Distance(2)
Existing Track 1 (feet)
Distance(2)
Existing Track 2 (feet)
Generalized Vibration Curve(3)
Existing Track 1 (VdB)
Generalized Vibration Curve(3)
Existing Track 2 (VdB)
Highest(4) Predicted No-Build Vibration
Level at Each Receptor (VdB)
EX-R9 50 frequent 50 65 73 71 76EX-R3 16 frequent 50 65 73 71 75EX-R4 20 frequent 60 75 72 70 73EX-R5 24 frequent 225 240 59 59 59EX-R6 28 frequent 150 165 64 63 64EX-R10 28 frequent 50 65 73 71 72EX-R11 20 frequent 60 75 72 70 73EX-R12 52 frequent 50 65 73 71 72Notes:
The "Predicted No-Build" is the "No-Build Scenario CREATE Program Train Vibration Level (Design Year)" which includes all train vibration from no-build scenario (design year) trains operating on tracks affected by the CREATE Program.
(1) Determine if event is frequent; occasional or infrequent event. Refer to Table 7-1 for definition.(2) Distances measured from centerlines of existing and proposed tracks to faces of buildings.(3) Generalized Ground Surface Vibration Curve (Figure 10-1) for rapid transit or light rail vehicles at 50 mph.(4) Highest vibration level, from the Generalized Vibration Curve (Figure 10-1), of either Track 1 or Track 2 at each receptor. The example project assumes the same adjustments are applied to both tracks. If the same adjustments cannot be applied to all tracks, the analyst may have to apply adjustments to the tracks individually to determine the highest predicted vibration at each receptor.

-
Vibration General Assessment Report Form For No-Build AlternativeVibration Adjustment Factors Freight Rail CarCREATE Project EX-1
Unadjusted No-Build Adjustments AdjustedSpeed Adjustments Source Adjustments Path Adjustments Receiver Adjustments
Receptors
Highest(1)
Vibration Level @ 50
mph at Each
Receptor Predicted No-Build
(VdB)
Average Track
Speed - NoBuild(mph)
Speed Adjustment -
No Build (VdB)
Vehicle(2)
Condition Existing (VdB)
Elevated Structure(3)
Adjustment Existing (VdB)
Propagation Geology(4)
Adjustment Existing (VdB)
Wood Frame
Structure (VdB)
1-5 Floors Above Grade (VdB)
Floor Amplifi- cation (VdB)
No-Build Vibration
(VdB)
No-Build GBN (dBA)
EX-R9 76 24 -6 10 -5 10 -5 -2 6 84 34EX-R3 75 10 -14 10 -5 10 -5 -2 6 75 25EX-R4 73 10 -14 10 -5 10 -5 -2 6 73 23EX-R5 59 10 -14 10 -5 10 -5 -2 6 59 9EX-R6 64 10 -14 10 -5 10 -5 -2 6 64 14EX-R10 72 50 0 10 -5 10 -5 -2 6 86 36EX-R11 73 50 0 10 -5 10 -5 -2 6 87 37EX-R12 72 50 0 10 -5 10 -5 -2 6 86 36
Notes:(1) Highest Vibration Level, from the Generalized Vibration Curve (Figure 10-1), of either the Southbound (Track 1) or Northbound (Track 2) at each rece(2) Worn wheel adjustment made for Freight Rail Car. For locomotives assume no worn wheel adjustment(3) The existing tracks are on elevated structure/embankment (they are at least 1 feet higher than the base elevation at all receptors).(4) Existing geological conditions assumed to have "efficient" vibration propagation.
The "Predicted No-Build" is the "No-Build Scenario CREATE Program Train Vibration Level (Design Year)" which includes all train vibration from no-build scenario (design year) trains operating on tracks affected by the CREATE Program.

Vibration General Assessment Report Form For Infrequently Used (existing train volume < 5 trains/day)Source Calculations: LocomotivesCREATE Project EX-1
Receptors
Peak Day Existing Volumes
Peak Day Predicted
Build Volumes
Predicted Build
Frequency Category (1)
Distance(2)
Existing Track 1 (feet)
Distance(2)
Existing Track 2 (feet)
Distance(2)
Proposed Track 1 (feet)
Distance(2)
Proposed Track 2 (feet)
Generalized Vibration Curve(3)
Existing Track 1 (VdB)
Generalized Vibration Curve(3)
Existing Track 2 (VdB)
Generalized Vibration Curve(3)
Proposed Track 1 (VdB)
Generalized Vibration Curve(3)
Proposed Track 2 (VdB)
Highest(4) Predicted Existing Vibration
Level at Each Receptor (VdB)
Highest(4) Predicted Build Vibration Level at Each
Receptor (VdB)
EX-R3 4 4 infrequent 50 65 40 55 85 83 87 84 85 87EX-R4 4 4 infrequent 60 75 50 65 83 81 85 82 83 85EX-R5 4 4 infrequent 225 240 215 230 70 69 70 70 70 70EX-R6 4 4 infrequent 150 165 140 155 74 73 75 74 74 75EX-R10 4 4 infrequent 50 65 55 75 85 83 84 81 85 84EX-R11 4 4 infrequent 60 75 50 65 83 81 85 82 83 85
Notes:
The "Predicted Build" is the same as the "Build Scenario CREATE Program Train Vibration Level (Design Year)" as referenced in the Noise and Vibration Methodology Section 7.2.2 except when analyzing moved existing tracks. When analyzing moved existing tracks, the "Predicted Build" considers the total number of trains using those tracks in the design year to determine the frequency category (frequent, occasional or infrequent) and impact level in Table 7-1, as well as the vibration level.
(4) Highest vibration level, from the Generalized Vibration Curve (Figure 10-1), of either Track 1 or Track 2 at each receptor. The example project assumes the same adjustments are applied to both tracks. If the same adjustments cannot be applied to all tracks, the analyst may have to apply adjustments to the tracks individually to determine the highest predicted vibration at each receptor.
(1) Determine if event is frequent; occasional or infrequent event. Refer to Table 7-1 for definition.(2) Distances measured from centerlines of existing and proposed tracks to faces of buildings.(3) Generalized Ground Surface Vibration Curve (Figure 10-1) for locomotive-powered passenger or freight trains at 50 mph.

Vibration General Assessment Report Form For Infrequently Used (existing train volume < 5 trains/day)Vibration Adjustment Factors LocomotivesCREATE Project EX-1
Speed Adjustments Source Adjustments Path Adjustments Speed Adjustments Source Adjustments Path Adjustments
Receptors
Highest(1)
Vibration Level @
50 mph at Each
Receptor Existing (VdB)
Highest(1)
Vibration Level @ 50
mph at Each
Receptor Predicted
Build (VdB)
Average Track
Speed- Existing(mph)
Speed Adjustment -
Existing (VdB)
Vehicle(2)
Condition -Existing (VdB)
Elevated Structure(3)
Adjustment - Existing(VdB)
Propagation Geology(4)
Adjustment - Existing (VdB)
Wood Frame
Structure (VdB)
1-5 Floors Above Grade (VdB)
Floor Amplifi- cation (VdB)
Average Track
Speed - Predicted
Build(mph)
Speed Adjustment -
Predicted Build(VdB)
Vehicle(2)
Condition - Existing(VdB)
Elevated Structure(3)
Adjustment- Predicted
Build(VdB)
Propagation Geology(4)
Adjustment - Existing (VdB)
Wood Frame
Structure (VdB)
1-5 Floors Above Grade (VdB)
Floor Amplifi- cation (VdB)
Predicted Existing Vibration
(VdB)
Predicted Build
Vibration (VdB)
EX-R3 85 87 10 -14 0 -5 10 -5 -2 6 10 -14 0 -5 10 -5 -2 6 75 77EX-R4 83 85 10 -14 0 -5 10 -5 -2 6 10 -14 0 -5 10 -5 -2 6 73 75EX-R5 70 70 10 -14 0 -5 10 -5 -2 6 10 -14 0 -5 10 -5 -2 6 60 60EX-R6 74 75 10 -14 0 -5 10 -5 -2 6 10 -14 0 -5 10 -5 -2 6 64 65EX-R10 85 84 10 -14 0 -5 10 -5 -2 6 50 0 0 -5 10 -5 -2 6 75 88EX-R11 83 85 50 0 0 -5 10 -5 -2 6 50 0 0 -5 10 -5 -2 6 87 89
Notes:
(2) For locomotives assume no worn wheel adjustment.(3) Existing and proposed tracks are elevated structure/embankment, because both the existing and proposed tracks would be at least 1 feet higher than the base elevation at all receptors(4) Existing and proposed geological conditions assumed to have "efficient" vibration propagation.
The "Predicted Build" is the same as the "Build Scenario CREATE Program Train Vibration Level (Design Year)" as referenced in the Noise and Vibration Methodology Section 7.2.2 except when analyzing moved existing tracks. When analyzing moved existing tracks, the "Predicted Build" considers the total number of trains using those tracks in the design year to determine the frequency category (frequent, occasional or infrequent) and impact level in Table 7-1, as well as the vibration level.
Unadjusted
(1) Highest Vibration Level, from the Generalized Vibration Curve (Figure 10-1), of either the Southbound (Track 1) or Northbound (Track 2) at each receptor.
AdjustedExisting Adjustments Predicted Build AdjustmentsReceiver Adjustments Receiver Adjustments

Vibration General Assessment Report Form For Infrequently Used (existing train volume < 5 trains/day)Vibration Impact Summary LocomotivesCREATE Project EX-1
1 2 3 4 5 6 7 8
Receptors
FTA (2)
Vibration Land Use Category
Predicted Build
Vibration Frequency
event (1)
Predicted Build - FTA Vibration Impact
Criteria (3)
(VdB)
Predicted Existing Vibration
(VdB)
Predicted Build
Vibration (VdB)
Difference between Predicted Existing vibration
and Predicted
Build vibration
(VdB)
Potential Impact?
(Does the Predicted
Build Vibration equal or
exceed the FTA impact criteria in
Column 4?) - Yes or No
EX-R3 2 infrequent 80 75 77 2 NoEX-R4 2 infrequent 80 73 75 2 NoEX-R5 2 infrequent 80 60 60 0 NoEX-R6 2 infrequent 80 64 65 1 NoEX-R10 2 infrequent 80 75 88 13 YesEX-R11 2 infrequent 80 87 89 2 Yes
Notes:(1) Determine if event is frequent; occasional or infrequent event. Refer to Table 7-1 for definition.(2) FTA Vibration Land Use Category #2 includes residences and other buildings where people normally sleep, and Category Land Use #3 includes institutional land uses with primarily daytime uses, such as schools and churches.
Ground-borne Vibration (GBV) Impacts
The "Predicted Build" is the same as the "Build Scenario CREATE Program Train Vibration Level (Design Year)" as referenced in the Noise and Vibration Methodology Section 7.2.2 except when analyzing moved existing tracks. When analyzing moved existing tracks, the "Predicted Build" considers the total number of trains using those tracks in the design year to determine the frequency category (frequent, occasional or infrequent) and impact level in Table 7-1, as well as the vibration level.
(3) Source Table 7-1NA = Not applicable

Vibration General Assessment Report Form For Infrequently Used (existing train volume < 5 trains/day)GBN Impact Summary LocomotivesCREATE Project EX-1
1 2 3 4 5 6 7 8
Receptors
FTA (2)
Vibration Land Use Category
Predicted Build GBN Frequency
event (1)
Predicted Build - FTA GBN Impact
Criteria (3)
(dBA)
Predicted Existing
GBN (dBA) (4)
Predicted Build
GBN (dBA)
Difference between Predicted Existing
GBN and Predicted Build GBN
(dBA)
Potential Impact? (Does the Predicted
Build Vibration equal or exceed the FTA impact
criteria in Column 4?) -
Yes or No
EX-R3 2 infrequent 43 25 27 2 NoEX-R4 2 infrequent 43 23 25 2 NoEX-R5 2 infrequent 43 10 10 0 NoEX-R6 2 infrequent 43 14 15 1 NoEX-R10 2 infrequent 43 25 38 13 NoEX-R11 2 infrequent 43 37 39 2 No
Notes:
Ground-borne Noise (GBN) Impacts
(2) FTA Vibration Land Use Category #2 includes residences and other buildings where people normally sleep, and Category Land Use #3 includes institutional land uses with primarily daytime uses, such as schools and churches.
The "Predicted Build" is the same as the "Build Scenario CREATE Program Train Vibration Level (Design Year)" as referenced in the Noise and Vibration Methodology Section 7.2.2 except when analyzing moved existing tracks. When analyzing moved existing tracks, the "Predicted Build" considers the total number of trains using those tracks in the design year to determine the frequency category (frequent, occasional or infrequent) and impact level in Table 7-1, as well as the vibration level.
(1) Determine if event is frequent; occasional or infrequent event. Refer to Table 7-1 for definition.
(3) Source Table 7-1(4) Assumes adjustment of -50 dB for low frequency vibration sources (FTA Manual Table 10-1).NA = Not applicable

Vibration General Assessment Report Form For Infrequently Used (existing train volume < 5 trains/day)Source Calculations: Freight CarsCREATE Project EX-1
Receptors
Peak Day Existing Volumes
Peak Day Predicted
Build Volumes
Predicted Build Frequency Category (1)
Distance(2)
Existing Track 1 (feet)
Distance(2)
Existing Track 2 (feet)
Distance(2)
Proposed Track 1 (feet)
Distance(2)
Proposed Track 2 (feet)
Generalized Vibration Curve(3)
Existing Track 1 (VdB)
Generalized Vibration Curve(3)
Existing Track 2 (VdB)
Generalized Vibration Curve(3)
Proposed Track 1 (VdB)
Generalized Vibration Curve(3)
Proposed Track 2 (VdB)
Highest(4) Predicted Existing Vibration
Level at Each Receptor (VdB)
Highest(4) Predicted Build Vibration Level
at Each Receptor (VdB)
EX-R3 4 4 frequent 50 65 40 55 73 71 76 74 73 76EX-R4 4 4 frequent 60 75 50 65 72 70 73 7 72 73EX-R5 4 4 frequent 225 240 215 230 59 59 59 59 59 59EX-R6 4 4 frequent 150 165 140 155 64 63 64 63 64 64EX-R10 4 4 frequent 50 65 55 75 73 71 72 70 73 72EX-R11 4 4 frequent 60 75 50 65 72 70 73 7 72 73
Notes:
The "Predicted Build" is the same as the "Build Scenario CREATE Program Train Vibration Level (Design Year)" as referenced in the Noise and Vibration Methodology Section 7.2.2 except when analyzing moved existing tracks. When analyzing moved existing tracks, the "Predicted Build" considers the total number of trains using those tracks in the design year to determine the frequency category (frequent, occasional or infrequent) and impact level in Table 7-1, as well as the vibration level.
(4) Highest vibration level, from the Generalized Vibration Curve (Figure 10-1), of either Track 1 or Track 2 at each receptor. The example project assumes the same adjustments are applied to both tracks. If the same adjustments cannot be applied toall tracks, the analyst may have to apply adjustments to the tracks individually to determine the highest predicted vibration at each receptor.
(1) Determine if event is frequent; occasional or infrequent event. Refer to Table 7-1 for definition. Freight cars always assumed frequent(2) Distances measured from centerlines of existing and proposed tracks to faces of buildings.(3) Generalized Ground Surface Vibration Curve (Figure 10-1) for rapid transit or light rail vehicles at 50 mph.

Vibration General Assessment Report Form For Infrequently Used (existing train volume < 5 trains/day)Vibration Adjustment Factors Freight CarsCREATE Project EX-1
Speed Adjustments Source Adjustments Path Adjustments Speed Adjustments Source Adjustments Path Adjustments
Receptors
Highest(1)
Vibration Level @
50 mph at Each
Receptor Existing (VdB)
Highest(1)
Vibration Level @ 50
mph at Each
Receptor Predicted
Build(VdB)
Average Track
Speed - Existing (mph)
Speed Adjustment
Existing (VdB)
Vehicle(2)
Condition Existing (VdB)
Elevated Structure(3)
Adjustment Existing (VdB)
Propagation Geology(4)
Adjustment Existing (VdB)
Wood Frame
Structure (VdB)
1-5 Floors Above Grade (VdB)
Floor Amplifi- cation (VdB)
Average Track
Speed - Predicted
Build(mph)
Speed Adjustment -
Predicted Build(VdB)
Vehicle(2)
Condition Existing (VdB)
Elevated Structure(3)
Adjustment - Predicted
Build(VdB)
Propagation Geology(4)
Adjustment Existing (VdB)
Wood Frame
Structure (VdB)
1-5 Floors Above Grade (VdB)
Floor Amplifi- cation (VdB)
Predicted Existing Vibration
(VdB)
Predicted Build
Vibration (VdB)
EX-R3 73 76 10 -14 10 -5 10 -5 -2 6 10 -14 10 -5 10 -5 -2 6 73 76EX-R4 72 73 10 -14 10 -5 10 -5 -2 6 10 -14 10 -5 10 -5 -2 6 72 73EX-R5 59 59 10 -14 10 -5 10 -5 -2 6 10 -14 10 -5 10 -5 -2 6 59 59EX-R6 64 64 10 -14 10 -5 10 -5 -2 6 10 -14 10 -5 10 -5 -2 6 64 64EX-R10 73 72 10 -14 10 -5 10 -5 -2 6 50 0 10 -5 10 -5 -2 6 73 86EX-R11 72 73 50 0 10 -5 10 -5 -2 6 50 0 10 -5 10 -5 -2 6 86 87
Notes:
Unadjusted
(1) Highest Vibration Level, from the Generalized Vibration Curve (Figure 10-1), of either the Southbound (Track 1) or Northbound (Track 2) at each receptor.
AdjustedExisting Adjustments Predicted Build AdjustmentsReceiver Adjustments Receiver Adjustments
(2) For locomotives assume no worn wheel adjustment(3) Existing and proposed tracks are elevated structure/embankment, because both the existing and proposed tracks would be at least 1 feet higher than the base elevation at all receptors(4) Existing and proposed geological conditions assumed to have "efficient" vibration propagation.
The "Predicted Build" is the same as the "Build Scenario CREATE Program Train Vibration Level (Design Year)" as referenced in the Noise and Vibration Methodology Section 7.2.2 except when analyzing moved existing tracks. When analyzing moved existing tracks, the "Predicted Build" considers the total number of trains using those tracks in the design year to determine the frequency category (frequent, occasional or infrequent) and impact level in Table 7-1, as well as the vibration level.

Vibration General Assessment Report Form For Infrequently Used (existing train volume < 5 trains/day)Vibration Impact Summary Freight CarsCREATE Project EX-1
1 2 3 4 5 6 7 8
Receptors
FTA (2)
Vibration Land Use Category
Predicted Build Vibration
Frequency event (1)
Predicted Build - FTA Vibration Impact
Criteria (3)
(VdB)
Predicted Existing Vibration
(VdB)
Predicted Build
Vibration (VdB)
Difference between Predicted Existing vibration
and Predicted
Build vibration
(VdB)
Potential Impact? (Does the Predicted Build vibration
equal or exceed the FTA impact
criteria in Column 4?) -
Yes or No
EX-R3 2 frequent 72 73 76 3 YesEX-R4 2 frequent 72 72 73 1 YesEX-R5 2 frequent 72 59 59 0 NoEX-R6 2 frequent 72 64 64 0 NoEX-R10 2 frequent 72 73 86 13 YesEX-R11 2 frequent 72 86 87 1 Yes
Notes:(1) Determine if event is frequent; occasional or infrequent event. Refer to Table 7-1 for definition.(2) FTA Vibration Land Use Category #2 includes residences and other buildings where people normally sleep, and Category Land Use #3 includes institutional land uses with primarily daytime uses, such as schools and churches.
Ground-borne Vibration (GBV) Impacts
The "Predicted Build" is the same as the "Build Scenario CREATE Program Train Vibration Level (Design Year)" as referenced in the Noise and Vibration Methodology Section 7.2.2 except when analyzing moved existing tracks. When analyzing moved existing tracks, the "Predicted Build" considers the total number of trains using those tracks in the design year to determine the frequency category (frequent, occasional or infrequent) and impact level in Table 7-1, as well as the vibration level.
(3) Source Table 7-1NA = Not applicable

Vibration General Assessment Report Form For Infrequently Used (existing train volume < 5 trains/day)GBN Impact Summary Freight CarsCREATE Project EX-1
1 2 3 4 5 6 7 8
Receptors
FTA (2)
Vibration Land Use Category
Predicted Build GBN Frequency
event (1)
Predicted Build - FTA GBN Impact
Criteria (3)
(dBA)
Predicted Existing
GBN(dBA) (4)
Predicted Build GBN
(dBA)
Difference between Predicted Existing
GBN and Predicted Build GBN
(dBA)
Potential Impact? (Does the Predicted
Build GBN equal or exceedthe FTA impact
criteria in Column 4?) -
Yes or No
EX-R3 2 frequent 35 23 26 3 NoEX-R4 2 frequent 35 22 23 1 NoEX-R5 2 frequent 35 9 9 0 NoEX-R6 2 frequent 35 14 14 0 NoEX-R10 2 frequent 35 23 36 13 YesEX-R11 2 frequent 35 36 37 1 Yes
Notes:(1) Determine if event is frequent; occasional or infrequent event. Refer to Table 7-1 for definition.
Ground-borne Noise (GBN) Impacts
(2) FTA Vibration Land Use Category #2 includes residences and other buildings where people normally sleep, and Category Land Use #3 includes institutional land uses with primarily daytime uses, such as schools and churches.
The "Predicted Build" is the same as the "Build Scenario CREATE Program Train Vibration Level (Design Year)" as referenced in the Noise and Vibration Methodology Section 7.2.2 except when analyzing moved existing tracks. When analyzing moved existing tracks, the "Predicted Build" considers the total number of trains using those tracks in the design year to determine the frequency category (frequent, occasional or infrequent) and impact level in Table 7-1, as well as the vibration level.
(3) Source Table 7-1(4) Assumes adjustment of -50 dB for low frequency vibration sources (FTA Manual Table 10-1).NA = Not applicable

Vibration General Assessment Report Form For Moderately Used Rail Corridor (existing train volume from 5 to 12 trains/day)Source Calculations: LocomotivesCREATE Project EX-1
Receptors
Peak Day Existing Volumes
Peak Day Predicted
Build Volumes
Existing Impact Frequency Category (1)
Build Impact Frequency Category (1)
Distance(2)
Existing Track 1 (feet)
Distance(2)
Existing Track 2 (feet)
Distance(2)
Proposed Track 1 (feet)
Distance(1)
Proposed Track 2 (feet)
Generalized Vibration Curve(3)
Existing Track 1 (VdB)
Generalized Vibration Curve(3)
Existing Track 2 (VdB)
Generalized Vibration Curve(3)
Proposed Track 1 (VdB)
Generalized Vibration Curve(3)
Proposed Track 2 (VdB)
Highest(4) Predicted Existing Vibration
Level at Each Receptor (VdB)
Highest(4) Predicted Build Vibration Level at Each
Receptor (VdB)
EX-R3 4 6 infrequent infrequent 50 65 40 55 85 83 87 84 85 87EX-R4 6 6 infrequent infrequent 60 75 50 65 83 81 85 82 83 85EX-R5 14 7 infrequent infrequent 225 240 215 230 70 69 70 70 70 70EX-R6 30 6 occasional infrequent 150 165 140 155 74 73 75 74 74 75EX-R10 6 6 infrequent infrequent 50 65 55 75 85 83 84 81 85 84EX-R11 16 20 infrequent infrequent 60 75 50 65 83 81 85 82 83 85EX-R12 4 6 infrequent infrequent 50 65 55 70 85 83 84 82 85 84Notes:(1) Determine if event is frequent; occasional or infrequent event. Refer to Table 7-1 for definition.(2) Distances measured from centerlines of existing and proposed tracks to faces of buildings.(3) Generalized Ground Surface Vibration Curve (Figure 10-1) for locomotive-powered passenger or freight trains at 50 mph.(4) Highest vibration level, from the Generalized Vibration Curve (Figure 10-1), of either Track 1 or Track 2 at each receptor. The example project assumes the same adjustments are applied to both tracks. If the same adjustments cannot be applied to all tracks, the analyst may have to apply adjustments to the tracks individually to determine the high predicted vibration at each receptor.
The "Predicted Build" is the same as the "Build Scenario CREATE Program Train Vibration Level (Design Year)" as referenced in the Noise and Vibration Methodology Section 7.2.2 except when analyzing moved existing tracks. When analyzing moved existing tracks, the "Predicted Build" considers the total number of trains using those tracks in the design year to determine the frequency category (frequent, occasional or infrequent) and impact level in Table 7-1, as well as the vibration level.

Vibration General Assessment Report Form For Moderately Used Rail Corridor (existing train volume from 5 to 12 trains/day)Vibration Adjustment Factors LocomotivesCREATE Project EX-1
Unadjusted Existing Adjustments Predicted Build Adjustments AdjustedSpeed Adjustments Source Adjustments Path Adjustments Receiver Adjustments Speed Adjustments Source Adjustments Path Adjustments Receiver Adjustments
Receptors
Highest(1)
Vibration Level @
50 mph at Each
Receptor Existing (VdB)
Highest(1)
Vibration Level @ 50
mph at Each
Receptor Predicted
Build(VdB)
Average Track
Speed - Existing (mph)
Speed Adjustment
Existing (VdB)
Vehicle(2)
Condition Existing (VdB)
Elevated Structure(3)
Adjustment Existing (VdB)
Propagation Geology(4)
Adjustment Existing (VdB)
Wood Frame
Structure (VdB)
1-5 Floors Above Grade (VdB)
Floor Amplifi- cation (VdB)
Average Track
Speed - Predicted
Build(mph)
Speed Adjustment -
Predicted Build(VdB)
Vehicle(2)
Condition Existing (VdB)
Elevated Structure(3)
Adjustment - Predicted
Build(VdB)
Propagation Geology(4)
Adjustment Existing (VdB)
Wood Frame
Structure (VdB)
1-5 Floors Above Grade (VdB)
Floor Amplifi- cation (VdB)
Predicted Existing Vibration
(VdB)
Predicted Build
Vibration (VdB)
EX-R3 85 87 10 -14 0 -5 10 -5 -2 6 10 -14 0 -5 10 -5 -2 6 75 77EX-R4 83 85 10 -14 0 -5 10 -5 -2 6 10 -14 0 -5 10 -5 -2 6 73 75EX-R5 70 70 10 -14 0 -5 10 -5 -2 6 10 -14 0 -5 10 -5 -2 6 60 60EX-R6 74 75 10 -14 0 -5 10 -5 -2 6 10 -14 0 -5 10 -5 -2 6 64 65EX-R10 85 84 50 0 0 -5 10 -5 -2 6 10 -14 0 -5 10 -5 -2 6 89 74EX-R11 83 85 50 0 0 -5 10 -5 -2 6 50 0 0 -5 10 -5 -2 6 87 89EX-R12 85 84 10 -14 0 -5 10 -5 -2 6 50 0 0 -5 10 -5 -2 6 75 88
Notes:(1) Highest Vibration Level, from the Generalized Vibration Curve (Figure 10-1), of either the Southbound (Track 1) or Northbound (Track 2) at each receptor.(2) Worn wheel adjustment made for Freight Rail Car. For locomotives assume no worn wheel adjustment(3) Existing and proposed tracks are elevated structure/embankment, because both the existing and proposed tracks would be at least 1 feet higher than the base elevation at all receptors(4) Existing and proposed geological conditions assumed to have "efficient" vibration propagation.
The "Predicted Build" is the same as the "Build Scenario CREATE Program Train Vibration Level (Design Year)" as referenced in the Noise and Vibration Methodology Section 7.2.2 except when analyzing moved existing tracks. When analyzing moved existing tracks, the "Predicted Build" considers the total number of trains using those tracks in the design year to determine the frequency category (frequent, occasional or infrequent) and impact level in Table 7-1, as well as the vibration level.

Vibration General Assessment Report Form For Moderately Used Rail Corridor (existing train volume from 5 to 12 trains/day)Vibration Impact Summary LocomotivesCREATE Project EX-1
Ground-borne Vibration (GBV) Impacts1 2 3 4 5 6 7 8 9 10 11 12 13
Receptors
FTA (2)
Vibration Land Use Category
Existing Vibration
Frequency event (1)
Existing- FTA
Vibration Impact
Criteria (3)
(VdB)
Predicted Build
Vibration Frequency
event (1)
Predicted Build - FTA Vibration Impact
Criteria (3)
(VdB)
Predicted Existing Vibration
(VdB)
Predicted Build
Vibration (VdB)
Difference between Predicted Existing vibration
and Predicted
Build vibration
(VdB)
Does the Predicted Existing vibration equal or
exceed the FTA impact criteria in
Column 4? If Yes, go to
Column 11. If No, go to
Column 12.?
Is the Predicted Build vibration lower
than Existing vibration by 5 VdB or greater? If Yes, go to Column 13
and indicate "No" - there is No Potential Impact . If No, Go to
Column 12.
Does the Predicted Build vibration equal or exceed the FTA impactcriteria in Column 6? IfYes, go to Column 13
and Indicate "Yes", there is a Potential Impact. If No, go to
Column 13 and indicate "No", there is No Potential Impact.
Potential Impact? If
Yes, proceed to Detailed
Analysis if mitigation measures are viable.
EX-R3 2 infrequent 80 infrequent 80 75 77 2 No NA No NoEX-R4 2 infrequent 80 infrequent 80 73 75 2 No NA No NoEX-R5 2 infrequent 80 infrequent 80 60 60 0 No NA No NoEX-R6 2 occasional 75 infrequent 80 64 65 1 No NA No NoEX-R10 2 infrequent 80 infrequent 80 89 74 -15 Yes Yes, Lower NA NoEX-R11 2 infrequent 80 infrequent 80 87 89 2 Yes No Yes YesEX-R12 2 infrequent 80 infrequent 80 75 88 13 No NA Yes Yes
Notes:(1) Determine if event is frequent; occasional or infrequent event. Refer to Table 7-1 for definition.(2) FTA Vibration Land Use Category #2 includes residences and other buildings where people normally sleep, and Category Land Use #3 includes institutional land uses with primarily daytime uses, such as schools and churches.(3) Source Table 7-1(4) See Source Calculations for existing and build volumes and refer to Section 7.2.2 item #3NA = Not applicable The "Predicted Build" is the same as the "Build Scenario CREATE Program Train Vibration Level (Design Year)" as referenced in the Noise and Vibration Methodology Section 7.2.2 except when analyzing moved existing tracks. When analyzing moved existing tracks, the "Predicted Build" considers the total number of trains using those tracks in the design year to determine the frequency category (frequent, occasional or infrequent) and impact level in Table 7-1, as well as the vibration level.
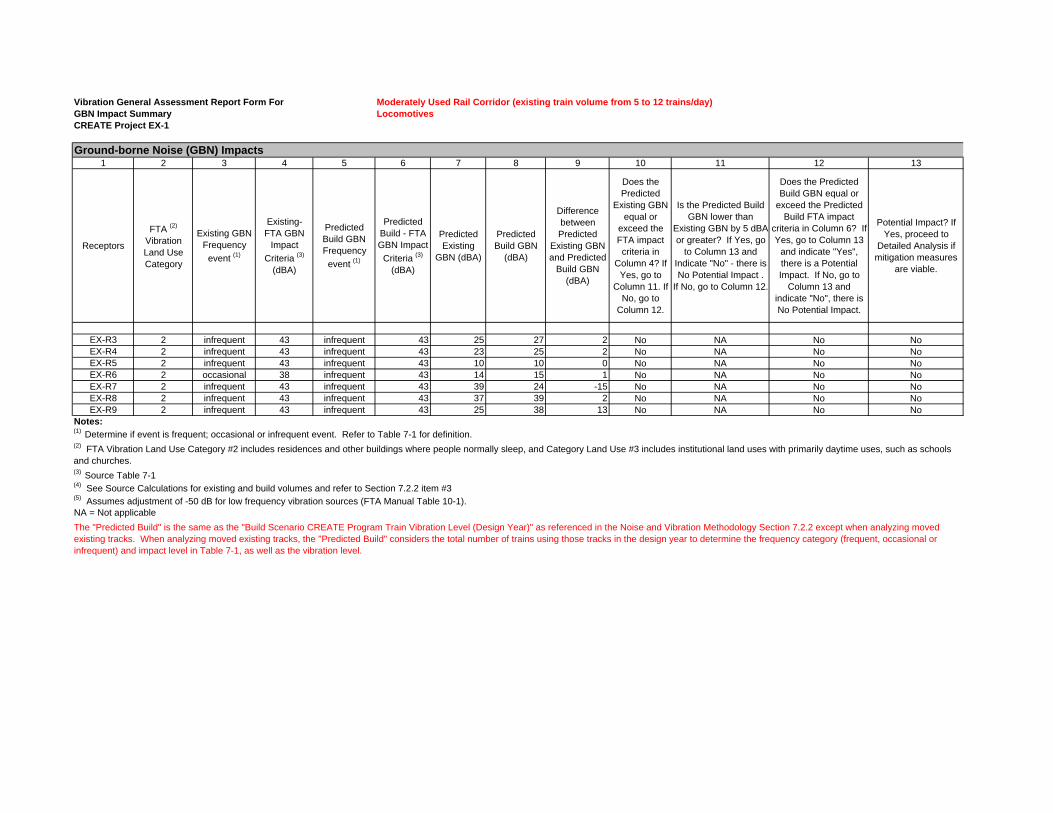
Vibration General Assessment Report Form For Moderately Used Rail Corridor (existing train volume from 5 to 12 trains/day)GBN Impact Summary LocomotivesCREATE Project EX-1
Ground-borne Noise (GBN) Impacts1 2 3 4 5 6 7 8 9 10 11 12 13
Receptors
FTA (2)
Vibration Land Use Category
Existing GBN Frequency
event (1)
Existing- FTA GBN
Impact Criteria (3)
(dBA)
Predicted Build GBN Frequency event (1)
Predicted Build - FTA GBN Impact
Criteria (3)
(dBA)
Predicted Existing
GBN (dBA)
Predicted Build GBN
(dBA)
Difference between Predicted
Existing GBN and Predicted
Build GBN (dBA)
Does the Predicted
Existing GBN equal or
exceed the FTA impact criteria in
Column 4? If Yes, go to
Column 11. If No, go to
Column 12.
Is the Predicted Build GBN lower than
Existing GBN by 5 dBA or greater? If Yes, go
to Column 13 and Indicate "No" - there is No Potential Impact .
If No, go to Column 12.
Does the Predicted Build GBN equal or
exceed the Predicted Build FTA impact
criteria in Column 6? If Yes, go to Column 13
and indicate "Yes", there is a Potential Impact. If No, go to
Column 13 and indicate "No", there is No Potential Impact.
Potential Impact? If Yes, proceed to
Detailed Analysis if mitigation measures
are viable.
EX-R3 2 infrequent 43 infrequent 43 25 27 2 No NA No NoEX-R4 2 infrequent 43 infrequent 43 23 25 2 No NA No NoEX-R5 2 infrequent 43 infrequent 43 10 10 0 No NA No NoEX-R6 2 occasional 38 infrequent 43 14 15 1 No NA No NoEX-R7 2 infrequent 43 infrequent 43 39 24 -15 No NA No NoEX-R8 2 infrequent 43 infrequent 43 37 39 2 No NA No NoEX-R9 2 infrequent 43 infrequent 43 25 38 13 No NA No No
Notes:(1) Determine if event is frequent; occasional or infrequent event. Refer to Table 7-1 for definition.(2) FTA Vibration Land Use Category #2 includes residences and other buildings where people normally sleep, and Category Land Use #3 includes institutional land uses with primarily daytime uses, such as schools and churches.(3) Source Table 7-1(4) See Source Calculations for existing and build volumes and refer to Section 7.2.2 item #3(5) Assumes adjustment of -50 dB for low frequency vibration sources (FTA Manual Table 10-1).NA = Not applicable The "Predicted Build" is the same as the "Build Scenario CREATE Program Train Vibration Level (Design Year)" as referenced in the Noise and Vibration Methodology Section 7.2.2 except when analyzing moved existing tracks. When analyzing moved existing tracks, the "Predicted Build" considers the total number of trains using those tracks in the design year to determine the frequency category (frequent, occasional or infrequent) and impact level in Table 7-1, as well as the vibration level.

Vibration General Assessment Report Form For Moderately Used Rail Corridor (existing train volume from 5 to 12 trains/day)Source Calculations: Freight CarsCREATE Project EX-1
Receptors
Peak Day Existing Volumes
Peak Day Predicted
Build Volumes
Existing Impact Frequency Category (1)
Predicted Build Impact Frequency Category (1)
Distance(2)
Existing Track 1 (feet)
Distance(2)
Existing Track 2 (feet)
Distance(2)
Proposed Track 1 (feet)
Distance(1)
Proposed Track 2 (feet)
Generalized Vibration Curve(3)
Existing Track 1 (VdB)
Generalized Vibration Curve(3)
Existing Track 2 (VdB)
Generalized Vibration Curve(3)
Proposed Track 1 (VdB)
Generalized Vibration Curve(3)
Proposed Track 2 (VdB)
Highest(4) Predicted Existing Vibration
Level at Each Receptor (VdB)
Highest(4) Predicted Build Vibration Level at Each
Receptor (VdB)
EX-R3 4 6 frequent frequent 50 65 40 55 73 71 75 72 73 75EX-R4 6 6 frequent frequent 60 75 50 65 72 70 73 71 72 73EX-R5 14 7 frequent frequent 225 240 215 230 59 59 59 59 59 59EX-R6 30 6 frequent frequent 150 165 140 155 64 63 64 63 64 64EX-R10 6 6 frequent frequent 50 65 55 75 73 71 72 70 73 72EX-R11 16 20 frequent frequent 60 75 50 65 72 70 73 71 72 73EX-R12 4 6 frequent frequent 50 65 55 70 73 71 72 71 73 72Notes:
The "Predicted Build" is the same as the "Build Scenario CREATE Program Train Vibration Level (Design Year)" as referenced in the Noise and Vibration Methodology Section 7.2.2 except when analyzing moved existing tracks. When analyzing moved existing tracks, the "Predicted Build" considers the total number of trains using those tracks in the design year to determine the frequency category (frequent, occasional or infrequent) and impact level in Table 7-1, as well as the vibration level.
(4) Highest vibration level, from the Generalized Vibration Curve (Figure 10-1), of either Track 1 or Track 2 at each receptor. The example project assumes the same adjustments are applied to both tracks. If the same adjustments cannot be applied to all tracks, the analyst may have to apply adjustments to the tracks individually to determine the highest predicted vibration at each receptor.
(1) Determine if event is frequent; occasional or infrequent event. Refer to Table 7-1 for definition.(2) Distances measured from centerlines of existing and proposed tracks to faces of buildings.(3) Generalized Ground Surface Vibration Curve (Figure 10-1) for rapid transit or light rail vehicles at 50 mph.

Vibration General Assessment Report Form For Moderately Used Rail Corridor (existing train volume from 5 to 12 trains/day)Vibration Adjustment Factors Freight CarsCREATE Project EX-1
Unadjusted Existing Adjustments Predicted Build Adjustments AdjustedSpeed Adjustments Source Adjustments Path Adjustments Receiver Adjustments Speed Adjustments Source Adjustments Path Adjustments Receiver Adjustments
Receptors
Highest(1)
Vibration Level @
50 mph at Each
Receptor Existing (VdB)
Highest(1)
Vibration Level @ 50
mph at Each
Receptor Predicted
Build(VdB)
Average Track
Speed - Existing (mph)
Speed Adjustment
Existing (VdB)
Vehicle(2)
Condition Existing (VdB)
Elevated Structure(3)
Adjustment Existing (VdB)
Propagation Geology(4)
Adjustment Existing (VdB)
Wood Frame
Structure (VdB)
1-5 Floors Above Grade (VdB)
Floor Amplifi- cation (VdB)
Average Track
Speed - Predicted
Build(mph)
Speed Adjustment -
Predicted Build(VdB)
Vehicle(2)
Condition Existing (VdB)
Elevated Structure(3)
Adjustment - Predicted
Build(VdB)
Propagation Geology(4)
Adjustment Existing (VdB)
Wood Frame
Structure (VdB)
1-5 Floors Above Grade (VdB)
Floor Amplifi- cation (VdB)
Predicted Existing Vibration
(VdB)
Predicted Build
Vibration(VdB)
EX-R3 73 75 10 -14 10 -5 10 -5 -2 6 10 -14 10 -5 10 -5 -2 6 73 75EX-R4 72 73 10 -14 10 -5 10 -5 -2 6 10 -14 10 -5 10 -5 -2 6 72 73EX-R5 59 59 10 -14 10 -5 10 -5 -2 6 10 -14 10 -5 10 -5 -2 6 59 59EX-R6 64 64 10 -14 10 -5 10 -5 -2 6 10 -14 10 -5 10 -5 -2 6 64 64EX-R10 73 72 50 0 10 -5 10 -5 -2 6 10 -14 10 -5 10 -5 -2 6 87 72EX-R11 72 73 50 0 10 -5 10 -5 -2 6 50 0 10 -5 10 -5 -2 6 86 87EX-R12 73 72 10 -14 10 -5 10 -5 -2 6 50 0 10 -5 10 -5 -2 6 73 86
Notes:(1) Highest Vibration Level, from the Generalized Vibration Curve (Figure 10-1), of either the Southbound (Track 1) or Northbound (Track 2) at each receptor.(2) Worn wheel adjustment made for Freight Rail Car. For locomotives assume no worn wheel adjustment.(3) Existing and proposed tracks are elevated structure/embankment, because both the existing and proposed tracks would be at least 1 feet higher than the base elevation at all receptors(4) Existing and proposed geological conditions assumed to have "efficient" vibration propagation.
The "Predicted Build" is the same as the "Build Scenario CREATE Program Train Vibration Level (Design Year)" as referenced in the Noise and Vibration Methodology Section 7.2.2 except when analyzing moved existing tracks. When analyzing moved existing tracks, the "Predicted Build" considers the total number of trains using those tracks in the design year to determine the frequency category (frequent, occasional or infrequent) and impact level in Table 7-1, as well as the vibration level.

Vibration General Assessment Report Form For Moderately Used Rail Corridor (existing train volume from 5 to 12 trains/day)Vibration Impact Summary Freight CarsCREATE Project EX-1
Ground-borne Vibration (GBV) Impacts1 2 3 4 5 6 7 8 9 10 11 12 14
Receptors
FTA (2)
Vibration Land Use Category
Existing Vibration
Frequency event (1)
Existing- FTA (3)
Vibration Impact Criteria(VdB)
Preicted Build
Vibration Frequency
event (1)
Predicted Build - FTA Vibration Impact
Criteria (3)
(VdB)
Predicted Existing Vibration
(VdB)
Predicted Build
Vibration(VdB)
Difference between Predicted Existing Vibration
and Predicted
Build Vibration
(VdB)
Does the Existing vibration
impact equal or exceed the FTA criteria in Column 4? If
Yes, go to Column 11. If
No, go to Column 12.
Is the Predicted Build vibration lower
than Predicted Existing vibration by 5 VdB or greater? If yes, go to Column
13 and indicate "No" - there is No
Potential Impact . If No, go to Column
12.
Does the Predicted Build vibration equal or exceed the FTA impactcriteria in Column 6? IfYes, go to Column 13
and indicate "Yes", there is a Potential Impact. If No, go to
Column 13 and indicate "No", there is No Potential Impact.
Potential Impact? If
Yes, proceed to Detailed
Analysis if mitigation measures are viable.
EX-R3 2 frequent 72 frequent 72 73 75 2 Yes No Yes YesEX-R4 2 frequent 72 frequent 72 72 73 1 Yes No Yes YesEX-R5 2 frequent 72 frequent 72 59 59 0 No NA No NoEX-R6 2 frequent 72 frequent 72 64 64 0 No NA No NoEX-R10 2 frequent 72 frequent 72 87 72 -15 Yes Yes, Lower NA NoEX-R11 2 frequent 72 frequent 72 86 87 1 Yes No Yes YesEX-R12 2 frequent 72 frequent 72 73 86 13 Yes No Yes Yes
Notes:(1) Determine if event is frequent; occasional or infrequent event. Refer to Table 7-1 for definition.(2) FTA Vibration Land Use Category #2 includes residences and other buildings where people normally sleep, and Category Land Use #3 includes institutional land uses with primarily daytime uses, such as schools and churches.(3) Source Table 7-1(4) See Source Calculations for existing and build volumes and refer to Section 7.2.2 item #3NA = Not applicable The "Predicted Build" is the same as the "Build Scenario CREATE Program Train Vibration Level (Design Year)" as referenced in the Noise and Vibration Methodology Section 7.2.2 except when analyzing moved existing tracks. When analyzing moved existing tracks, the "Predicted Build" considers the total number of trains using those tracks in the design year to determine the frequency category (frequent, occasional or infrequent) and impact level in Table 7-1, as well as the vibration level.

Vibration General Assessment Report Form For Moderately Used Rail Corridor (existing train volume from 5 to 12 trains/day)GBN Impact Summary Freight CarsCREATE Project EX-1
Ground-borne Noise (GBN) Impacts1 2 3 4 5 6 7 8 9 10 11 12 13
Receptors
FTA (2)
Vibration Land Use Category
Existing GBN Frequency
event (1)
Existing- FTA GBN
Impact Criteria (3)
(dBA)
Predicted Build GBN Frequency event (1)
Predicted Build FTA (3)
GBN Impact Criteria(dBA)
Total Predicted Existing
GBN(dBA)
Total Predicted Build GBN
(dBA)
Difference between Total
Predicted Existing GBN
and Build GBN(dBA)
Does the Existing GBN Impact equal or exceed the FTA criteria in Column 4? If
Yes, go to Column 11. If
No, go to Column 12.
Is the Predicted Build GBN lower than
Existing GBN by 5 dBA or greater? If Yes, go
to Column 13 and indicate "No" - there is No Potential Impact .
If No, go to Column 12.
Does the Predicted Build GBN equal or
exceed the FTA impact criteria in Column 6? If Yes, go to Column 13
and indicate "Yes", there is a Potential Impact. If No, go to
Column 13 and indicate "No", there is No Potential Impact.
Potential Impact? If Yes, proceed to
Detailed Analysis if mitigation measures
are viable.
EX-R3 2 frequent 35 frequent 35 23 25 2 No NA No NoEX-R4 2 frequent 35 frequent 35 22 23 1 No NA No NoEX-R5 2 frequent 35 frequent 35 9 9 0 No NA No NoEX-R6 2 frequent 35 frequent 35 14 14 0 No NA No NoEX-R7 2 frequent 35 frequent 35 37 22 -15 Yes Yes, Lower NA NoEX-R8 2 frequent 35 frequent 35 36 37 1 Yes No Yes YesEX-R9 2 frequent 35 frequent 35 23 36 13 No NA Yes Yes
Notes:(1) Determine if event is frequent; occasional or infrequent event. Refer to Table 7-1 for definition.(2) FTA Vibration Land Use Category #2 includes residences and other buildings where people normally sleep, and Category Land Use #3 includes institutional land uses with primarily daytime uses, such as schools and churches.(3) Source Table 7-1(4) See Source Calculations for existing and build volumes and refer to Section 7.2.2 item #3(5) Assumes adjustment of -50 dB for low frequency vibration sources (FTA Manual Table 10-1).NA = Not applicable The "Predicted Build" is the same as the "Build Scenario CREATE Program Train Vibration Level (Design Year)" as referenced in the Noise and Vibration Methodology Section 7.2.2 except when analyzing moved existing tracks. When analyzing moved existing tracks, the "Predicted Build" considers the total number of trains using those tracks in the design year to determine the frequency category (frequent, occasional or infrequent) and impact level in Table 7-1, as well as the vibration level.

Vibration General Assessment Report Form For Heavily Used Rail Corridor (existing train volume >12 trains/day)Source Calculations: LocomotivesCREATE Project EX-1
Receptors
Peak Day Existing Volumes
Peak Day Predicted
Build Volumes
Existing Impact Frequency Category (1)
Predicted Build Impact Frequency Category (1)
Distance(2)
Existing Track 1 (feet)
Distance(2)
Existing Track 2 (feet)
Distance(2)
Proposed Track 1 (feet)
Distance(1)
Proposed Track 2 (feet)
Generalized Vibration Curve(3)
Existing Track 1 (VdB)
Generalized Vibration Curve(3)
Existing Track 2 (VdB)
Generalized Vibration Curve(3)
Proposed Track 1 (VdB)
Generalized Vibration Curve(3)
Proposed Track 2 (VdB)
Highest(4) Predicted Existing Vibration
Level at Each Receptor (VdB)
Highest(4) Predicted Build Vibration Level at Each
Receptor (VdB)
EX-R9 40 50 occasional occasional 50 65 30 45 85 83 89 86 85 89EX-R3 16 16 infrequent infrequent 50 65 40 55 85 83 87 84 85 87EX-R4 16 20 infrequent infrequent 60 75 50 65 83 81 85 82 83 85EX-R5 16 24 infrequent infrequent 225 240 215 230 70 69 70 70 70 70EX-R6 16 28 infrequent infrequent 150 165 140 155 74 73 75 74 74 75EX-R10 16 28 infrequent infrequent 50 65 55 75 85 83 84 81 85 84EX-R11 16 20 infrequent infrequent 60 75 50 65 83 81 85 82 83 85EX-R12 24 52 infrequent occasional 50 65 55 75 85 83 84 81 85 84Notes:
The "Predicted Build" is the same as the "Build Scenario CREATE Program Train Vibration Level (Design Year)" as referenced in the Noise and Vibration Methodology Section 7.2.2 except when analyzing moved existing tracks. When analyzing moved existing tracks, the "Predicted Build" considers the total number of trains using those tracks in the design year to determine the frequency category (frequent, occasional or infrequent) and impact level in Table 7-1, as well as the vibration level.
(4) Highest vibration level, from the Generalized Vibration Curve (Figure 10-1), of either Track 1 or Track 2 at each receptor. The example project assumes the same adjustments are applied to both tracks. If the same adjustments cannot be applied to all tracks, the analyst may have to apply adjustments to the tracks individually to determine the highest predicted vibration at each receptor.
(1) Determine if event is frequent; occasional or infrequent event. Refer to Table 7-1 for definition.(2) Distances measured from centerlines of existing and proposed tracks to faces of buildings.(3) Generalized Ground Surface Vibration Curve (Figure 10-1) for locomotive-powered passenger or freight trains at 50 mph.
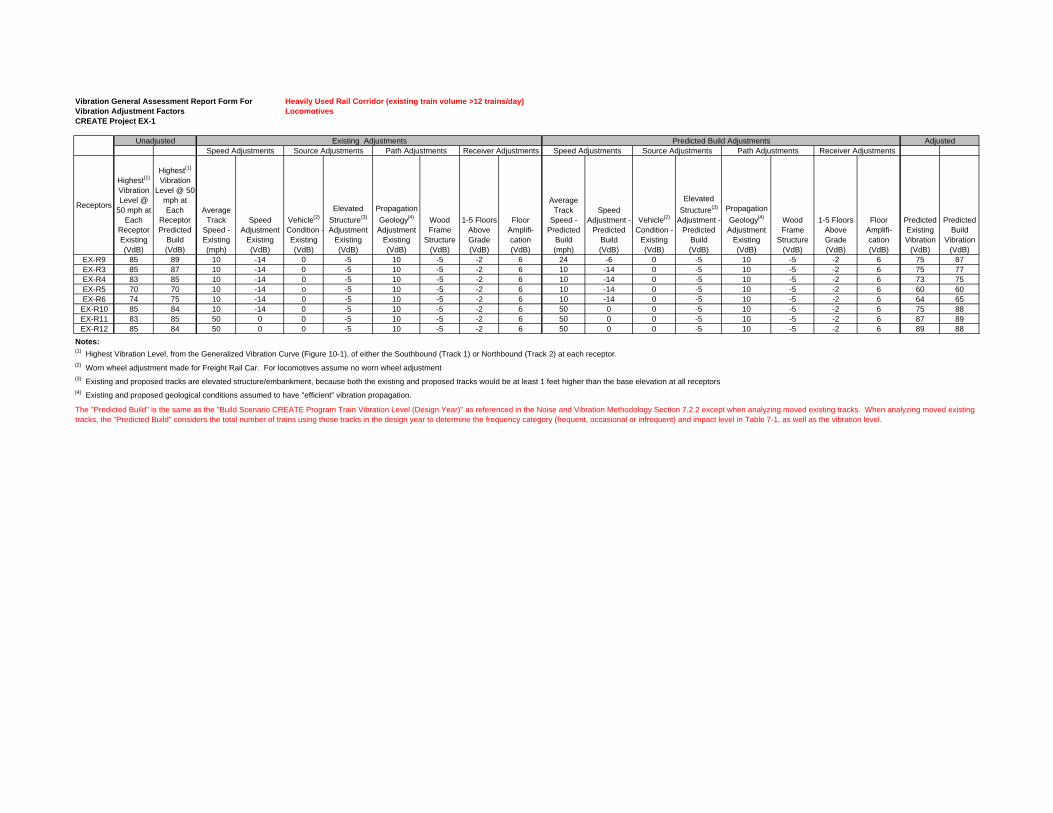
-
Vibration General Assessment Report Form For Heavily Used Rail Corridor (existing train volume >12 trains/day)Vibration Adjustment Factors LocomotivesCREATE Project EX-1
Unadjusted Existing Adjustments Predicted Build Adjustments AdjustedSpeed Adjustments Source Adjustments Path Adjustments Receiver Adjustments Speed Adjustments Source Adjustments Path Adjustments Receiver Adjustments
Receptors
Highest(1)
Vibration Level @
50 mph at Each
Receptor Existing (VdB)
Highest(1)
Vibration Level @ 50
mph at Each
Receptor Predicted
Build(VdB)
Average Track
Speed - Existing(mph)
Speed Adjustment
Existing (VdB)
Vehicle(2)
Condition Existing (VdB)
Elevated Structure(3)
Adjustment Existing (VdB)
Propagation Geology(4)
Adjustment Existing (VdB)
Wood Frame
Structure (VdB)
1-5 Floors Above Grade (VdB)
Floor Amplifi- cation (VdB)
Average Track
Speed - Predicted
Build(mph)
Speed Adjustment -
Predicted Build(VdB)
Vehicle(2)
Condition - Existing (VdB)
Elevated Structure(3)
Adjustment - Predicted
Build(VdB)
Propagation Geology(4)
Adjustment Existing (VdB)
Wood Frame
Structure (VdB)
1-5 Floors Above Grade (VdB)
Floor Amplifi- cation (VdB)
Predicted Existing Vibration
(VdB)
Predicted Build
Vibration (VdB)
EX-R9 85 89 10 -14 0 -5 10 -5 -2 6 24 -6 0 -5 10 -5 -2 6 75 87EX-R3 85 87 10 -14 0 -5 10 -5 -2 6 10 -14 0 -5 10 -5 -2 6 75 77EX-R4 83 85 10 -14 0 -5 10 -5 -2 6 10 -14 0 -5 10 -5 -2 6 73 75EX-R5 70 70 10 -14 0 -5 10 -5 -2 6 10 -14 0 -5 10 -5 -2 6 60 60EX-R6 74 75 10 -14 0 -5 10 -5 -2 6 10 -14 0 -5 10 -5 -2 6 64 65EX-R10 85 84 10 -14 0 -5 10 -5 -2 6 50 0 0 -5 10 -5 -2 6 75 88EX-R11 83 85 50 0 0 -5 10 -5 -2 6 50 0 0 -5 10 -5 -2 6 87 89EX-R12 85 84 50 0 0 -5 10 -5 -2 6 50 0 0 -5 10 -5 -2 6 89 88
Notes:(1) Highest Vibration Level, from the Generalized Vibration Curve (Figure 10-1), of either the Southbound (Track 1) or Northbound (Track 2) at each receptor.(2) Worn wheel adjustment made for Freight Rail Car. For locomotives assume no worn wheel adjustment(3) Existing and proposed tracks are elevated structure/embankment, because both the existing and proposed tracks would be at least 1 feet higher than the base elevation at all receptors(4) Existing and proposed geological conditions assumed to have "efficient" vibration propagation.
The "Predicted Build" is the same as the "Build Scenario CREATE Program Train Vibration Level (Design Year)" as referenced in the Noise and Vibration Methodology Section 7.2.2 except when analyzing moved existing tracks. When analyzing moved existing tracks, the "Predicted Build" considers the total number of trains using those tracks in the design year to determine the frequency category (frequent, occasional or infrequent) and impact level in Table 7-1, as well as the vibration level.

Vibration General Assessment Report Form For Heavily Used Rail Corridor (existing train volume >12 trains/day)Vibration Impact Summary LocomotivesCREATE Project EX-1
Ground-borne Vibration (GBV) Impacts1 2 3 4 5 6 7 8 9 10 11 12 13 14
Receptors
FTA (2)
Vibration Land Use Category
Existing Vibration
Frequency event (1)
Existing FTA
Vibration Impact
Criteria (3)
(VdB)
Predicted Build
Vibration Frequency
event (1)
Predicted Build FTA Vibration Impact
Criteria (3)
(VdB)
Predicted Existing Vibration
(VdB)
Predicted Build
Vibration(VdB)
Difference between Predicted Existing Vibration
and Predicted
Build Vibration
(VdB)
Does Predicted Existing Vibration equal or
exceed the FTA impact
criteria in Column 4? If
Yes, go to Column 11. If
No, go to Column 13.
Does the ratio of Build Train Events to
Existing Train Events equal or
exceed 2? If Yes, go to Column 14
and indicate "Yes." If No, go to column
12 (4)
Does the Predicted Build vibration exceed the Predicted Existing vibration by 3 VdB or
Greater? If Yes, go to Column 14 and
indicate "Yes" - there is a Potential Impact. If No, go to Column 14 and indicate "No" -
there is No Potential Impact. (4)
Does Predicted Build Ground-borne
Vibration equal or exceed the FTA impact criteria in Column 6? If Yes, go to Column 14 and indicate "Yes" - there is a Potential Impact. If No, go to
Column 14 and indicate "No" - there is No Potential Impact. (4)
Potential impact? If
Yes, proceed to Detailed
Analysis if mitigation measures are viable.
EX-R9 2 occasional 75 occasional 75 75 87 12 Yes No Yes NA YesEX-R3 2 infrequent 80 infrequent 80 75 77 2 No NA NA No NoEX-R4 2 infrequent 80 infrequent 80 73 75 2 No NA NA No NoEX-R5 2 infrequent 80 infrequent 80 60 60 0 No NA NA No NoEX-R6 2 infrequent 80 infrequent 80 64 65 1 No NA NA No No
EX-R10 2 infrequent 80 infrequent 80 75 88 13 No NA NA Yes YesEX-R11 2 infrequent 80 infrequent 80 87 89 2 Yes No No NA NoEX-R12 2 infrequent 80 occasional 75 89 88 -1 Yes Yes NA NA Yes
Notes:(1) Determine if event is frequent; occasional or infrequent event. Refer to Table 7-1 for definition.(2) FTA Vibration Land Use Category #2 includes residences and other buildings where people normally sleep, and Category Land Use #3 includes institutional land uses with primarily daytime uses, such as schools and churches.(3) Source Table 7-1(4) See Source Calculations for existing and build volumes and refer to Section 7.2.2 item #3NA = Not applicable
The "Predicted Build" is the same as the "Build Scenario CREATE Program Train Vibration Level (Design Year)" as referenced in the Noise and Vibration Methodology Section 7.2.2 except when analyzing moved existing tracks. When analyzing moved existing tracks, the "Predicted Build" considers the total number of trains using those tracks in the design year to determine the frequency category (frequent, occasional or infrequent) and impact level in Table 7-1, as well as the vibration level.

Vibration General Assessment Report Form For Heavily Used Rail Corridor (existing train volume >12 trains/day)GBN Impact Summary LocomotivesCREATE Project EX-1
Ground-borne Noise (GBN) Impacts1 2 3 4 5 6 7 8 9 10 11 12 13 14
Receptors
FTA (2)
Vibration Land Use Category
Existing GBN
Frequency event (1)
Existing- FTA GBN
Impact Criteria (3)
(dBA)
Predicted Build GBN Frequency
event (1)
Predicted Build FTA
GBN Impact
Criteria (3)
(dBA)
Predicted Existing
GBN(dBA) (5)
Predicted Build GBN (dBA) (5)
Difference between Predicted Existing
GBN and Predicted Build GBN
(dBA)
Does the Predicted
Existing GBN equal or
exceed the FTA impact criteria in
Column 4? If Yes, go to
Column 11. If No, go to
Column 13.
Does the ratio of Predicted Build train
impact events to Existing equal or
exceed 2? If Yes, go to Column 14 and
indicate "Yes." If no, go to column 12 (4)
Does the Predicted Build GBN exceed the
Predicted Existing GBN by 3 dBA or
greater? If yes, go to Column 14 and
indicate "Yes" - there is a Potential Impact. If No, go to Column 14 and indicate "No" -
there is No Potential Impact. (4)
Does Predicted Build GBN equal or exceed
the FTA impact criteria in Column 6? If Yes, go to Column
14 and indicate "Yes" there is a Potential Impact. If No, go to
Column 14 and indicate "No" - there is No Potential Impact.
(4)
-
Potential Impact? If
Yes, proceed to Detailed
Analysis if mitigation measures are viable.
EX-R2 2 occasional 38 occasional 38 25 37 12 No NA NA No NoEX-R3 2 infrequent 43 infrequent 43 25 27 2 No NA NA No NoEX-R4 2 infrequent 43 infrequent 43 23 25 2 No NA NA No NoEX-R5 2 infrequent 43 infrequent 43 10 10 0 No NA NA No NoEX-R6 2 infrequent 43 infrequent 43 14 15 1 No NA NA No NoEX-R7 2 infrequent 43 infrequent 43 25 38 13 No NA NA No NoEX-R8 2 infrequent 43 infrequent 43 37 39 2 No NA NA No NoEX-R9 2 infrequent 43 occasional 38 39 38 -1 No NA NA Yes Yes
Notes:(1) Determine if event is frequent; occasional or infrequent event. Refer to Table 7-1 for definition.(2) FTA Vibration Land Use Category #2 includes residences and other buildings where people normally sleep, and Category Land Use #3 includes institutional land uses with primarily daytime uses, such as schools and churches.(3) Source Table 7-1(4) See Source Calculations for existing and build volumes and refer to Section 7.2.2 item #3(5) Assumes adjustment of -50 dBA for low frequency vibration sources (FTA Manual Table 10-1).
NA = Not applicable
The "Predicted Build" is the same as the "Build Scenario CREATE Program Train Vibration Level (Design Year)" as referenced in the Noise and Vibration Methodology Section 7.2.2 except when analyzing moved existing tracks. When analyzing moved existing tracks, the "Predicted Build" considers the total number of trains using those tracks in the design year to determine the frequency category (frequent, occasional or infrequent) and impact level in Table 7-1, as well as the vibration level.

Vibration General Assessment Report Form For Heavily Used Rail Corridor (existing train volume >12 trains/day)Source Calculations: Freight Rail CarCREATE Project EX-1
Receptors
Peak Day Existing Volumes
Peak Day Predicted
Build Volumes
Existing Impact Frequency Category (1)
Build Impact Frequency Category (1)
Distance(2)
Existing Track 1 (feet)
Distance(2)
Existing Track 2 (feet)
Distance(2)
Proposed Track 1 (feet)
Distance(1)
Proposed Track 2 (feet)
Generalized Vibration Curve(3)
Existing Track 1 (VdB)
Generalized Vibration Curve(3)
Existing Track 2 (VdB)
Generalized Vibration Curve(3)
Proposed Track 1 (VdB)
Generalized Vibration Curve(3)
Proposed Track 2 (VdB)
Highest(4) Predicted Existing Vibration
Level at Each Receptor (VdB)
Highest(4) Predicted Build Vibration Level at Each
Receptor (VdB)
EX-R9 40 50 frequent frequent 50 65 30 45 73 71 76 74 73 76EX-R3 16 16 frequent frequent 50 65 40 55 73 71 75 72 73 75EX-R4 16 20 frequent frequent 60 75 50 65 72 70 73 71 72 73EX-R5 16 24 frequent frequent 225 240 215 230 59 59 59 59 59 59EX-R6 16 28 frequent frequent 150 165 140 155 64 63 64 63 64 64EX-R10 16 28 frequent frequent 50 65 55 75 73 71 72 70 73 72EX-R11 16 20 frequent frequent 60 75 50 65 72 70 73 71 72 73EX-R12 24 52 frequent frequent 50 65 55 75 73 71 72 70 73 72Notes:
(4) Highest vibration level, from the Generalized Vibration Curve (Figure 10-1), of either Track 1 or Track 2 at each receptor. The example project assumes the same adjustments are applied to both tracks. If the same adjustments cannot be applied to all tracks, the analyst may have to apply adjustments to the tracks individually to determine the highest predicted vibration at each receptor.
(1) Determine if event is frequent; occasional or infrequent event. Refer to Table 7-1 for definition.(2) Distances measured from centerlines of existing and proposed tracks to faces of buildings.
The "Predicted Build" is the same as the "Build Scenario CREATE Program Train Vibration Level (Design Year)" as referenced in the Noise and Vibration Methodology Section 7.2.2 except when analyzing moved existing tracks. When analyzing moved existing tracks, the "Predicted Build" considers the total number of trains using those tracks in the design year to determine the frequency category (frequent, occasional or infrequent) and impact level in Table 7-1, as well as the vibration level.
(3) Generalized Ground Surface Vibration Curve (Figure 10-1) for rapid transit or light rail vehicles at 50 mph.

Vibration General Assessment Report Form For Heavily Used Rail Corridor (existing train volume >12 trains/day)Vibration Adjustment Factors Freight Rail CarCREATE Project EX-1
Unadjusted Existing Adjustments Predicted Build Adjustments AdjustedSpeed Adjustments Source Adjustments Path Adjustments Receiver Adjustments Speed Adjustments Source Adjustments Path Adjustments Receiver Adjustments
Receptors
Highest(1)
Vibration Level @
50 mph at Each
Receptor Existing (VdB)
Highest(1)
Vibration Level @ 50
mph at Each
Receptor Predicted
Build(VdB)
Average Track
Speed - Existing (mph)
Speed Adjustment -
Existing (VdB)
Vehicle(2)
Condition Existing (VdB)
Elevated Structure(3)
Adjustment Existing (VdB)
Propagation Geology(4)
Adjustment Existing (VdB)
Wood Frame
Structure (VdB)
1-5 Floors Above Grade (VdB)
Floor Amplifi- cation (VdB)
Average Track
Speed - Predicted
Build (mph)
Speed Adjustment -
Predicted Build(VdB)
Vehicle(2)
Condition Existing (VdB)
Elevated Structure(3)
Adjustment - Predicted
Build(VdB)
Propagation Geology(4)
Adjustment Existing (VdB)
Wood Frame
Structure (VdB)
1-5 Floors Above Grade (VdB)
Floor Amplifi- cation (VdB)
Predicted Existing Vibration
(VdB)
Predicted Build
Vibration (VdB)
EX-R9 73 76 10 -14 10 -5 10 -5 -2 6 24 -6 10 -5 10 -5 -2 6 73 84EX-R3 73 75 10 -14 10 -5 10 -5 -2 6 10 -14 10 -5 10 -5 -2 6 73 75EX-R4 72 73 10 -14 10 -5 10 -5 -2 6 10 -14 10 -5 10 -5 -2 6 72 73EX-R5 59 59 10 -14 10 -5 10 -5 -2 6 10 -14 10 -5 10 -5 -2 6 59 59EX-R6 64 64 10 -14 10 -5 10 -5 -2 6 10 -14 10 -5 10 -5 -2 6 64 64EX-R10 73 72 10 -14 10 -5 10 -5 -2 6 50 0 10 -5 10 -5 -2 6 73 86EX-R11 72 73 50 0 10 -5 10 -5 -2 6 50 0 10 -5 10 -5 -2 6 86 87EX-R12 73 72 50 0 10 -5 10 -5 -2 6 50 0 10 -5 10 -5 -2 6 87 86
Notes:(1) Highest Vibration Level, from the Generalized Vibration Curve (Figure 10-1), of either the Southbound (Track 1) or Northbound (Track 2) at each receptor.(2) Worn wheel adjustment made for Freight Rail Car. For locomotives assume no worn wheel adjustment(3) Existing and proposed tracks are elevated structure/embankment, because both the existing and proposed tracks would be at least 1 feet higher than the base elevation at all receptors(4) Existing and proposed geological conditions assumed to have "efficient" vibration propagation.
The "Predicted Build" is the same as the "Build Scenario CREATE Program Train Vibration Level (Design Year)" as referenced in the Noise and Vibration Methodology Section 7.2.2 except when analyzing moved existing tracks. When analyzing moved existing tracks, the "Predicted Build" considers the total number of trains using those tracks in the design year to determine the frequency category (frequent, occasional or infrequent) and impact level in Table 7-1, as well as the vibration level.

t
Vibration General Assessment Report Form For Heavily Used Rail Corridor (existing train volume >12 trains/day)Vibration Impact Summary Freight Rail CarCREATE Project EX-1
Ground-borne Vibration (GBV) Impacts1 2 3 4 5 6 7 8 9 10 11 12 13 14
Receptors
FTA (2)
Vibration Land Use Category
Existing Vibration
Frequency event (1)
Existing- FTA
Vibration Impact
Criteria (3)
(VdB)
Predicted Build
Vibration Frequency
event (1)
Proposed FTA
Vibration Impact
Criteria (3)
(VdB)
Predicted Existing Vibration
(VdB)
Predicted Build
Vibration (VdB)
Difference between Predicted Existing vibration
and Predicted
Build vibration
(VdB)
Does the Predicted Existing vibration equal or
exceed the FTA impact criteria in
Column 4? If Yes, go to
Column 11. If No, go to
Column 13.
Does the ratio of Predicted Build train
impact events to Existing equal or
exceed 2? If Yes, go to Column 14
and indicate "Yes". If No, go to column
12 (4)
Does the Predicted Build vibration exceed the Predicted Existing vibration by 3 VdB or greater? If Yes, go to
Column 14 and indicate "Yes" - there is a Potential Impact.
If No, go to Column 14 and indicate "No" -
there is No Potential Impact. (4)
Does the Predicted Build vibration equal orexceed the FTA impaccriteria in Column 6? If Yes, go to Column
14 and indicate "Yes" -there is a Potential Impact. If No, go to
Column 14 and indicate "No" - there is No Potential Impact. (4)
Potential Impact? If
Yes, proceed to Detailed
Analysis if mitigation measures are viable.
EX-R9 2 frequent 72 frequent 72 73 84 11 Yes No Yes NA YesEX-R3 2 frequent 72 frequent 72 73 75 2 Yes No No NA NoEX-R4 2 frequent 72 frequent 72 72 73 1 Yes No No NA NoEX-R5 2 frequent 72 frequent 72 59 59 0 No NA NA No NoEX-R6 2 frequent 72 frequent 72 64 64 0 No NA NA No NoEX-R10 2 frequent 72 frequent 72 73 86 13 Yes No Yes NA YesEX-R11 2 frequent 72 frequent 72 86 87 1 Yes No No NA NoEX-R12 2 frequent 72 frequent 72 87 86 -1 Yes Yes NA NA Yes
Notes:(1) Determine if event is frequent; occasional or infrequent event. Refer to Table Table 7-1 for definition.(2) FTA Vibration Land Use Category #2 includes residences and other buildings where people normally sleep, and Category Land Use #3 includes institutional land uses with primarily daytime uses, such as schools and churches.(3) Source Table 7-1(4) See Source Calculations for existing and build volumes and refer to Section 7.2.2 item #3NA = Not applicable
The "Predicted Build" is the same as the "Build Scenario CREATE Program Train Vibration Level (Design Year)" as referenced in the Noise and Vibration Methodology Section 7.2.2 except when analyzing moved existing tracks. When analyzing moved existing tracks, the "Predicted Build" considers the total number of trains using those tracks in the design year to determine the frequency category (frequent, occasional or infrequent) and impact level in Table 7-1, as well as the vibration level.

Vibration General Assessment Report Form For Heavily Used Rail Corridor (existing train volume >12 trains/day)GBN Impact Summary Freight Rail CarCREATE Project EX-1
Ground-borne Noise (GBN) Impacts1 2 3 4 5 6 7 8 9 10 11 12 13 14
Receptors
FTA (2)
Vibration Land Use Category
Existing GBN
Frequency event (1)
Existing- FTA GBN
Impact Criteria (3)
(dBA)
Predicted Build GBN Frequency
event (1)
Proposed FTA GBN
Impact Criteria (3)
(dBA)
Predicted Existing
GBN (dBA) (5)
Predicted Build GBN (dBA) (5)
Difference between Predicted Existing
GBN and Predicted Build GBN
(dBA)
Does the Predicted
Existing GBN equal or
exceed the FTA impact criteria in
Column 4? If Yes, go to
Column 11. If No, go to
Column 13.
Does the ratio of Predicted Build train
impact events to Existing equal or
exceed 2? If Yes, go to Column 14 and
indicate "Yes." If No, go to column 12. (4)
Does the Predicted Build GBN exceed the
Predicted Existing GBN by 3 dBA or
greater? If Yes, go to Column 14 and
indicate "Yes" - there is a Potential Impact. If No, go to Column 14 and indicate "No" -
there is No Potential Impact. (4)
Does the Predicted Build GBN equal or
exceed the FTA impact criteria in
Column 6? If Yes, go to Column 14 and
indicate "Yes" - there is a Potential Impact. If No, go to Column
14 and indicate "No" - there is No Potential
Impact. (4)
Potential Impact? If
Yes, proceed to Detailed
Analysis if mitigation measures are viable.
EX-R2 2 frequent 35 frequent 35 23 34 11 No NA NA No NoEX-R3 2 frequent 35 frequent 35 23 25 2 No NA NA No NoEX-R4 2 frequent 35 frequent 35 22 23 1 No NA NA No NoEX-R5 2 frequent 35 frequent 35 9 9 0 No NA NA No NoEX-R6 2 frequent 35 frequent 35 14 14 0 No NA NA No NoEX-R7 2 frequent 35 frequent 35 23 36 13 No NA NA Yes YesEX-R8 2 frequent 35 frequent 35 36 37 1 Yes No No NA NoEX-R9 2 frequent 35 frequent 35 37 36 -1 Yes Yes NA NA Yes
Notes:(1) Determine if event is frequent; occasional or infrequent event. Refer to Table 7-1 for definition.(2) FTA Vibration Land Use Category #2 includes residences and other buildings where people normally sleep, and Category Land Use #3 includes institutional land uses with primarily daytime uses, such as schools and churches.(3) Source Table 7-1(4) See Source Calculations for existing and build volumes and refer to Section 7.2.2 item #3(5) Assumes adjustment of -50 dB for low frequency vibration sources (FTA Manual Table 10-1).NA = Not applicable The "Predicted Build" is the same as the "Build Scenario CREATE Program Train Vibration Level (Design Year)" as referenced in the Noise and Vibration Methodology Section 7.2.2 except when analyzing moved existing tracks. When analyzing moved existing tracks, the "Predicted Build" considers the total number of trains using those tracks in the design year to determine the frequency category (frequent, occasional or infrequent) and impact level in Table 7-1, as well as the vibration level.

Vibration General Assessment Report Form For Moving Existing TracksSource Calculations: LocomotivesCREATE Project EX-1
Receptors
Peak Day Existing Volumes
Existing Impact Frequency Category (1)
Distance(2)
Existing Track 1 (feet)
Distance(2)
Existing Track 2 (feet)
Distance(2)
Proposed Track 1 (feet)
Distance(2)
Proposed Track 2 (feet)
Generalized Vibration Curve(3)
Existing Track 1 (VdB)
Generalized Vibration Curve(3)
Existing Track 2 (VdB)
Generalized Vibration Curve(3)
Proposed Track 1 (VdB)
Generalized Vibration Curve(3)
Proposed Track 2 (VdB)
Highest(4) Predicted Pre-Move Vibration
Level at Each Receptor (based on existing operations)
(VdB)
Highest(5) Predicted Post-Move
Vibration level at Each Receptor
(based on existing operations)
(VdB)EX-R1EX-R2 40 occasional 50 65 40 55 85 83 87 84 85 87EX-R3 16 infrequent 50 65 40 55 85 83 87 84 85 87EX-R4 16 infrequent 60 75 50 65 83 81 85 82 83 85EX-R5 16 infrequent 225 240 215 230 70 69 70 70 70 70EX-R6 16 infrequent 150 165 140 155 74 73 75 74 74 75EX-R7 40 occasional 50 65 55 75 85 83 84 81 85 84EX-R8 40 occasional 50 65 40 55 85 83 87 84 85 87EX-R9 40 occasional 50 65 30 45 85 83 89 86 85 89Notes:
(5) Potential vibration effects of moving tracks.
(1) Determine if event is frequent; occasional or infrequent event. Refer to Table 7-1 for definition.
(4) Highest vibration level, from the Generalized Vibration Curve (Figure 10-1), of either Track 1 or Track 2 at each receptor. The example project assumes the same adjustments are applied to both tracks. If the same adjustments cannot be applied to all tracks, the analyst may have to apply adjustments to the tracks individually to determine the highest predicted vibration at each receptor.
(2) Distances measured from centerlines of existing and proposed tracks to faces of buildings.(3) Generalized Ground Surface Vibration Curve (Figure 10-1) for locomotive-powered passenger or freight trains at 50 mph.

Vibration General Assessment Report Form For Moving Existing TracksVibration Adjustment Factors LocomotivesCREATE Project EX-1
Unadjusted Existing Adjustments AdjustedSpeed Adjustments Source Adjustments Path Adjustments Receiver Adjustments
Receptors
Highest(1)
Vibration Level @ 50 mph at Each Receptor - Pre-Move (based on existing
operations)(VdB)
Highest(1)
Vibration Level @ 50 mph at Each Receptor - Post-Move (based on existing
operations)(VdB)
Average Track Speed
Existing (mph)
Speed Adjustment
Existing (VdB)
Vehicle(2)
Condition Existing (VdB)
Elevated Structure(3)
Adjustment Existing (VdB)
Propagation Geology(4)
Adjustment Existing (VdB)
Wood Frame
Structure (VdB)
1-5 Floors Above Grade (VdB)
Floor Amplifi- cation (VdB)
Predicted Pre-Move Vibration (based on existing
operations)(VdB)
Predicted Post-Move Vibration (based on existing
operations) (VdB)
EX-R2 85 87 10 -14 0 -5 10 -5 -2 6 75 77EX-R3 85 87 10 -14 0 -5 10 -5 -2 6 75 77EX-R4 83 85 10 -14 0 -5 10 -5 -2 6 73 75EX-R5 70 70 10 -14 0 -5 10 -5 -2 6 60 60EX-R6 74 75 10 -14 0 -5 10 -5 -2 6 64 65EX-R7 85 84 10 -14 0 -5 10 -5 -2 6 75 74EX-R8 85 87 24 -6 0 -5 10 -5 -2 6 83 85EX-R9 85 89 24 -6 0 -5 10 -5 -2 6 83 87
Notes:(1) Highest Vibration Level, from the Generalized Vibration Curve (Figure 10-1), of either the Southbound (Track 1) or Northbound (Track 2) at each receptor.(2) For locomotives assume no worn wheel adjustment(3) The existing and proposed tracks are both on elevated structure/embankment (they are at least 1 foot higher than the base elevation of all receptors), therefore, they both receive the same elevated structure adjustments. If the proposed tracks have different elevated structure adjustments than the existing tracks, the analyst would need to account for this difference by applying a different elevated structure adjustment to predict the Post-Move Vibration.(4) Existing and proposed geological conditions assumed to have "efficient" vibration propagation.

Vibration General Assessment Report Form For Moving Existing TracksVibration Impact Summary LocomotivesCREATE Project EX-1
Ground-borne Vibration (GBV) Impacts1 2 3 4 5 6 7 8 9 10 11
Receptors
FTA (2)
Vibration Land Use Category
Pre-Move and Post-
Move Vibration
Frequency event (1)
(based on existing
operations)
Pre-Move and Post-Move FTA Vibration Impact
Criteria (3)
(based on existing
operations)(VdB)
Predicted Pre-Move Vibration
(VdB) (based on existing
operations)
Predicted Post-Move Vibration (based on existing
operations) (VdB)
Difference between Predicted Pre-Move vibration
and Predicted Post-Move vibration
(VdB)
Does the predicted Pre-
Move Vibration equal or
exceed the FTA impact criteria in
Column 4? If Yes, go to
Column 9. If No, go to
Column 10.
Is the difference between the Predicted
Pre-Move Vibration and Predicted Post-
Move Vibration 3 VdB or greater? If Yes, go
to Column 11 and indicate "Yes" - there isa Potential Impact. If No, go to Column 10.
Use appropriate Infrequently-(I), Moderately-(M), or Heavily-Used
(H) corridor criteria to
determine if there is an
Impact.
Potential Impact? If
Yes, Proceed to
Detailed Analysis if mitigation measures are viable.
EX-R22 occasional 75 75 77 2
Yes No Use I, M or H Spreadsheet
EX-R3 2 infrequent 80 75 77 2 No NA Use I, M or H Spreadsheet
EX-R4 2 infrequent 80 73 75 2 No NA Use I, M or H Spreadsheet
EX-R5 2 infrequent 80 60 60 0 No NA Use I, M or H Spreadsheet
EX-R6 2 infrequent 80 64 65 1 No NA Use I, M or H Spreadsheet
EX-R7 2 occasional 75 75 74 -1 Yes No Use I, M or H Spreadsheet
EX-R8 2 occasional 75 83 85 2 Yes No Use I, M or H Spreadsheet
EX-R9 2 occasional 75 83 87 4Yes Yes NA Yes
Notes:(1) Determine if event is frequent; occasional or infrequent event. Refer to Table 7-1 for definition.(2) FTA Vibration Land Use Category #2 includes residences and other buildings where people normally sleep, and Category Land Use #3 includes institutional land uses with primarily daytime uses, such as schools and churches.(3) Source Table 7-1NA = Not applicable

a
Vibration General Assessment Report Form For Moving Existing TracksGBN Impact Summary LocomotivesCREATE Project EX-1
Ground-borne Noise (GBN) Impacts1 2 3 4 5 6 7 8 9 10 11
Receptors
FTA (2)
Vibration Land Use Category
Pre-Move and Post-
Move GBN Frequency
event (1)
(based on existing
operations)
Pre-Move and Post-Move FTA
GBN Impact Criteria (3)
(based on existing
operations)(dBA)
Predicted Pre-move
GBN (dBA) (4) (based on
existing operations)
Predicted Post-Move
GBN (based on existing
operations) (dBA)
Difference between Predicted Pre-Move GBN and Predicted
Post-Move GBN (dBA)
Does the Predicted Pre-
Move GBN equal or
exceed the FTA impact criteria in
Column 4? If Yes, go to
Column 9. If No, go to
Column 10.
Is the difference between the Predicted
Pre-Move GBN and Predicted Post-Move
GBN 3 dBA or greater? If Yes, go to
Column 11 and indicate "Yes" - there is a Potential Impact.
If No, go to Column 10.
Use appropriate Infrequently-(I), Moderately-(M), or Heavily-Used
(H) Corridor Criteria to
determine if there is an
Impact.
Potential Impact? If
Yes, proceed to Detailed
Analysis if mitigation measures are viable.
EX-R22 occasional 38 25 27 2
No NA Use I, M or H Spreadsheet
EX-R3 2 infrequent 43 25 27 2 No NA Use I, M or H Spreadsheet
EX-R4 2 infrequent 43 23 25 2 No NA Use I, M or H Spreadsheet
EX-R5 2 infrequent 43 10 10 0 No NA Use I, M or H Spreadsheet
EX-R6 2 infrequent 43 14 15 1 No NA Use I, M or H Spreadsheet
EX-R7 2 occasional 38 25 24 -1 No NA Use I, M or H Spreadsheet
EX-R8 2 occasional 38 33 35 2 No NA Use I, M or H Spreadsheet
EX-R9 2 occasional 38 33 37 4 No NA Use I, M or H Spreadsheet
Notes:(1) Determine if event is frequent; occasional or infrequent event. Refer to Table 7-1 for definition.(2) FTA Vibration Land Use Category #2 includes residences and other buildings where people normally sleep, and Category Land Use #3 includes institutionland uses with primarily daytime uses, such as schools and churches.(3) Source Table 7-1(4) Assumes adjustment of -50 dB for low frequency vibration sources (FTA Manual Table 10-1).NA = Not applicable

Vibration General Assessment Form For Moving Existing TracksSource Calculations:CREATE Project EX-1
Receptors
Peak Day Existing Volumes
Existing Impact Frequency Category (1)
Distance(2)
Existing Track 1 (feet)
Distance(2)
Existing Track 2 (feet)
Distance(2)
Proposed Track 1 (feet)
Distance(2)
Proposed Track 2 (feet)
Generalized Vibration Curve(3)
Existing Track 1 (VdB)
Generalized Vibration Curve(3)
Existing Track 2 (VdB)
Generalized Vibration Curve(3)
Proposed Track 1 (VdB)
Generalized Vibration Curve(3)
Proposed Track 2 (VdB)
Highest(4) Predicted Pre-Move Vibration
Level at Each Receptor (based on existing operations)
(VdB)
Highest(5) Predicted Post-Move
Vibration Level at Each Receptor
(based on existing operations) (VdB)
EX-R1EX-R2 40 frequent 50 65 40 55 73 71 75 72 73 75EX-R3 16 frequent 50 65 40 55 73 71 75 72 73 75EX-R4 16 frequent 60 75 50 65 72 70 73 71 72 73EX-R5 16 frequent 225 240 215 230 59 59 59 59 59 59EX-R6 16 frequent 150 165 140 155 64 63 64 63 64 64EX-R7 40 frequent 50 65 55 75 73 71 72 70 73 72EX-R8 40 frequent 50 65 40 55 73 71 75 72 73 75EX-R9 40 frequent 50 65 30 45 73 71 76 74 73 76Notes:
(5) Potential vibration effects of moving tracks.
(3) Generalized Ground Surface Vibration Curve (Figure 10-1) for rapid transit or light rail vehicles at 50 mph.
(1) Determine if event is frequent; occasional or infrequent event. Refer to Table 7-1 for definition.
Freight Cars
(4) Highest vibration level, from the Generalized Vibration Curve (Figure 10-1), of either Track 1 or Track 2 at each receptor. The example project assumes the same adjustments are applied to both tracks. If the same adjustments cannot be applied to all tracks, the analyst may have to apply adjustments to the tracks individually to determine the highest predicted vibration at each receptor.
(2) Distances measured from centerlines of existing and proposed tracks to faces of buildings.

Vibration General Assessment Form For Moving Existing TracksVibration Adjustment Factors Freight CarsCREATE Project EX-1
Unadjusted Existing Adjustments AdjustedSpeed Adjustments Source Adjustments Path Adjustments Receiver Adjustments
Receptors
Highest(1)
Vibration Level @ 50
mph at Each Receptor - Pre-move (based on existing
operations)(VdB)
Highest(1)
Vibration Level @ 50
mph at Each Receptor - Post-move (based on existing
operations)(VdB)
Average Track Speed
Existing (mph)
Speed Adjustment
Existing (VdB)
Vehicle(2)
Condition Existing (VdB)
Elevated Structure(3)
Adjustment Existing (VdB)
Propagation Geology(4)
Adjustment Existing (VdB)
Wood Frame
Structure (VdB)
1-5 Floors Above Grade (VdB)
Floor Amplifi- cation (VdB)
Predicted Pre-Move Vibration (based on existing
operations)(VdB)
Predicted Post-Move Vibration (based on existing
operations) (VdB)
EX-R2 73 75 10 -14 10 -5 10 -5 -2 6 73 75EX-R3 73 75 10 -14 10 -5 10 -5 -2 6 73 75EX-R4 72 73 10 -14 10 -5 10 -5 -2 6 72 73EX-R5 59 59 10 -14 10 -5 10 -5 -2 6 59 59EX-R6 64 64 10 -14 10 -5 10 -5 -2 6 64 64EX-R7 73 72 10 -14 10 -5 10 -5 -2 6 73 72EX-R8 73 75 24 -6 10 -5 10 -5 -2 6 81 83EX-R9 73 76 24 -6 10 -5 10 -5 -2 6 81 84
Notes:(1) Highest Vibration Level, from the Generalized Vibration Curve (Figure 10-1), of either the Southbound (Track 1) or Northbound (Track 2) at each receptor.(2) Existing and proposed freight trains anticipated as having worn wheels based on worst-cast scenario.(3) The existing and proposed tracks are both on elevated structure/embankment (they are at least 1 foot higher than the base elevation of all receptors), therefore, they both receive the same elevated structure adjustments. If the proposed tracks have different elevated structure adjustments than the existing tracks, the analyst would need to account for this difference by applying a different elevated structure adjustment to predict the Post-Move Vibration.(4) Existing and proposed geological conditions assumed to have "efficient" vibration propagation.

Vibration General Assessment Report Form For Moving Existing TracksVibration Impact Summary Freight CarsCREATE Project EX-1
1 2 3 4 5 6 7 8 9 10 11
Receptors
FTA (2)
Vibration Land Use Category
Pre-Move and Post-
Move Vibration
Frequency event (1)
(based on existing
operations)
Pre-Move and Post-Move FTA Vibration Impact
Criteria (3)
(based on existing
operations)(VdB)
Predicted Pre-Move Vibration
(VdB) (based on existing
oeprations)
Predicted Post-Move Vibration (based on existing
operations) (VdB)
Difference between Predicted Pre-Move Vibration
and Predicted Post-Move Vibration
(VdB)
Does the Predicted Pre-
Move Vibration equal or
exceed the FTA impact criteria in
Column 4? If Yes, go to
Column 9. If No, go to
Column 10.
Is the difference between the Predicted
Pre-Move Vibration and Predicted Post-
Move Vibration 3 VdB or greater? If Yes, go
to Column 11 and indicate "Yes" - there is a Potential Impact. If No, go to Column 10.
Use appropriate Infrequently-(I), Moderately-(M), or Heavily-Used
(H) corridor criteria to
determine if there is an
Impact.
Potential Impact? If
Yes, proceed to Detailed
Analysis if mitigation measures are viable.
EX-R2 2 frequent 72 73 75 2 Yes No Use I, M or H Spreadsheet
EX-R3 2 frequent 72 73 75 2 Yes No Use I, M or H Spreadsheet
EX-R4 2 frequent 72 72 73 1 Yes No Use I, M or H Spreadsheet
EX-R5 2 frequent 72 59 59 0 No NA Use I, M or H Spreadsheet
EX-R6 2 frequent 72 64 64 0 No NA Use I, M or H Spreadsheet
EX-R7 2 frequent 72 73 72 -1 Yes No Use I, M or H Spreadsheet
EX-R8 2 frequent 72 81 83 2 Yes No Use I, M or H Spreadsheet
EX-R9 2 frequent 72 81 84 3Yes Yes NA Yes
Notes:
Ground-borne Vibration (GBV) Impacts
(2) FTA Vibration Land Use Category #2 includes residences and other buildings where people normally sleep, and Category Land Use #3 includes institutional land uses with primarily daytime uses, such as schools and churches.
(1) Determine if event is frequent; occasional or infrequent event. Refer to Table 7-1 for definition.
(3) Source Table 7-1NA = Not applicable

Vibration General Assessment Report Form For Moving Existing TracksGBN Impact Summary Freight CarsCREATE Project EX-1
Ground-borne Noise (GBN) Impacts1 2 3 4 5 6 7 8 9 10 11
Receptors
FTA (2)
Vibration Land Use Category
Pre-Move and Post-
Move Vibration
Frequency event (1)
(based on existing
operations)
Pre-Move and Post-Move FTA
GBN Impact
Criteria (3)
(based on existing
operations)(dBA)
Predicted Pre-Move
GBN(dBA) (4)
(based on existing
operations)
Predicted Post-Move
GBN (Based on Existing
Operations)(dBA)
Difference between Pre-Move GBN and
Post-Move GBN(dBA)
Does the Pre-Move GBN
equal or exceed the FTA impact criteria in
Column 4? If Yes, go to
Column 9. If No, go to
Column 10.
Is the difference between the Predicted
Pre-Move GBN and the Predicted Post-Move GBN 3 dBA or
greater? If Yes, go to Column 11 and
indicate "Yes" - there is a Potential Impact. If No, go to Column
10.
Use appropriate Infrequently-(I), Moderately-(M), or Heavily-Used
(H) corridor criteria to
determine if there is an
Impact.
Potential Impact? If
Yes, proceed to Detailed
Analysis if mitigation measures are viable.
EX-R2 2 frequent 35 23 25 2 No NA Use I, M or H Spreadsheet
EX-R3 2 frequent 35 23 25 2 No NA Use I, M or H Spreadsheet
EX-R4 2 frequent 35 22 23 1 No NA Use I, M or H Spreadsheet
EX-R5 2 frequent 35 9 9 0 No NA Use I, M or H Spreadsheet
EX-R6 2 frequent 35 14 14 0 No NA Use I, M or H Spreadsheet
EX-R7 2 frequent 35 23 22 -1 No NA Use I, M or H Spreadsheet
EX-R8 2 frequent 35 31 33 2 No NA Use I, M or H Spreadsheet
EX-R9 2 frequent 35 31 34 3 No NA Use I, M or H Spreadsheet
Notes:(1) Determine if event is frequent; occasional or infrequent event. Refer to Table 7-1 for definition.(2) FTA Vibration Land Use Category #2 includes residences and other buildings where people normally sleep, and Category Land Use #3 includes institutional land uses with primarily daytime uses, such as schools and churches.(3) Source Table 7-1(4) Assumes adjustment of -50 dB for low frequency vibration sources (FTA Manual Table 10-1).NA = Not applicable

APPENDIX F
Additional Example Exterior and Interior Noise Assessment Summary Tables

Table 1: Receptor Clusters and Distances
Receptor
Exterior Or
Interior Uses
FTA Land Use(1)
Noise Metric
Number of Buildings
Within Cluster
Existing Land Use(2)
Location Relative To Metra Tracks
Distance(3) to Exist. Track 1 Southbound
(feet)
Distance(3) to Exist. Track 2 Northbound
(feet)
Distance(3) to Prop. Track 1 Southbound
(feet)
Distance(3) to Prop. Track 2 Northbound
(feet)
Rows of Intervening Structures
R1 single-family residence 221 W. 66th Street Exterior 2/ Ldn 1 SFR 1st Row
West 74 60 51 34 0
R1A single-family residence 6621 S. Yale Avenue Exterior 2/ Ldn 4 SFR 1st Row
West 129 115 110 92 0
R1B single-family residence 6451 S. Yale Avenue Exterior 2/ Ldn 3 SFR 1st Row
West 84 70 68 46 0
R1C single-family residence 6653 S. Yale Avenue Exterior 2/ Ldn 1 SFR 1st Row
West 71 57 56 32 0
R2 single-family residence 6566 S. Ross Avenue Exterior 2/ Ldn 10 SFR 1st Row
West 84 70 53 38 0 R3 single-family residence 6067 S. LaSalle Street Exterior 2/ Ldn 5 SFR 1st Row
West 99 86 85 70 0 R4 single-family residence 5959 S. LaSalle Street Exterior 2/ Ldn 12 SFR 1st Row
West 129 113 113 90 0 R5 Alden Princeton 255 W. 69th Street Interior 1 Nursing
home 1st Row
East 124 138 124 138 0 R6 Alden Wentworth 201 W. 69th Street Exterior 2/ Ldn 1 Nursing
home 2nd Row
East 360 375 360 375 1 R7 Parker School 6800 S. Stewart Avenue Interior 1 Elementary
School 1st Row West 117 101 108 94 0
R8 Kennedy King College 6800 S. Wentworth Avenue Interior 1 College 1st Row
East 150 164 164 179 0 R9 single-family residence 5928 S. Lafayette Avenue Exterior 2/ Ldn 3 SFR 1st Row
East 147 163 163 189 0 R10 single-family residence 6630 S. Yale Avenue Exterior 2/ Ldn 4 SFR 2nd Row
West 226 213 211 189 1 R11 The Yale Apartments 6565 S. Yale Avenue Interior 1 MFR 2nd Row
West 155 142 124 109 1 R12 single-family residence 6545 S. Wentworth Avenue Exterior 2/ Ldn 3 SFR 1st Row
East 128 142 166 181 0 R13 single-family residence 6066 S. LaSalle Street Exterior 2/ Ldn 15 SFR 2nd Row
West 244 231 231 216 1 R14 single-family residence 5958 S. LaSalle Street Exterior 2/ Ldn 10 SFR 2nd Row
West 272 257 257 234 1 R15 Prairie Haven Homes 301 W. Marquette Road Interior 1 Senior
Housing 1st Row West 144 130 130 108 0
R16 Pleasant – Green Church 140 W. 59th Street Interior 1 Church 2nd Row
West 284 269 269 241 1 R17 Kingdom Hall 48 W. 59th Street Interior 1 Church 1st Row
East 174 188 189 218 0 R18 single-family residence 5851 S. LaSalle Street Exterior 2/ Ldn 10 SFR 1st Row
West 128 112 112 84 0 R19 single-family residence 6547 S. Yale Avenue Exterior 2/ Ldn 6 SFR & MFR 2nd Row
West 227 209 188 173 1 R20 single-family residence 310 W. Normal Parkway Exterior 2/ Ldn 1 SFR 1st Row
West 174 160 160 137 0 R21 single-family residence 5750 S. Lafayette Avenue Exterior 2/ Ldn 14 SFR 2nd Row
East 297 312 299 315 1
Notes: (1) FTA Noise Impact Criteria apply the 24-hour Ldn for residences and nursing homes (Land Use Category 2) and the hourly Leq for schools, parks, and churches (Land Use Category 3). (2) SFR = single-family residence; MFR = multifamily residence. (3) Distances are measured perpendicularly from the centerline of the tracks, to the building face for interior receptors and to a point six feet from the building face for exterior receptors.
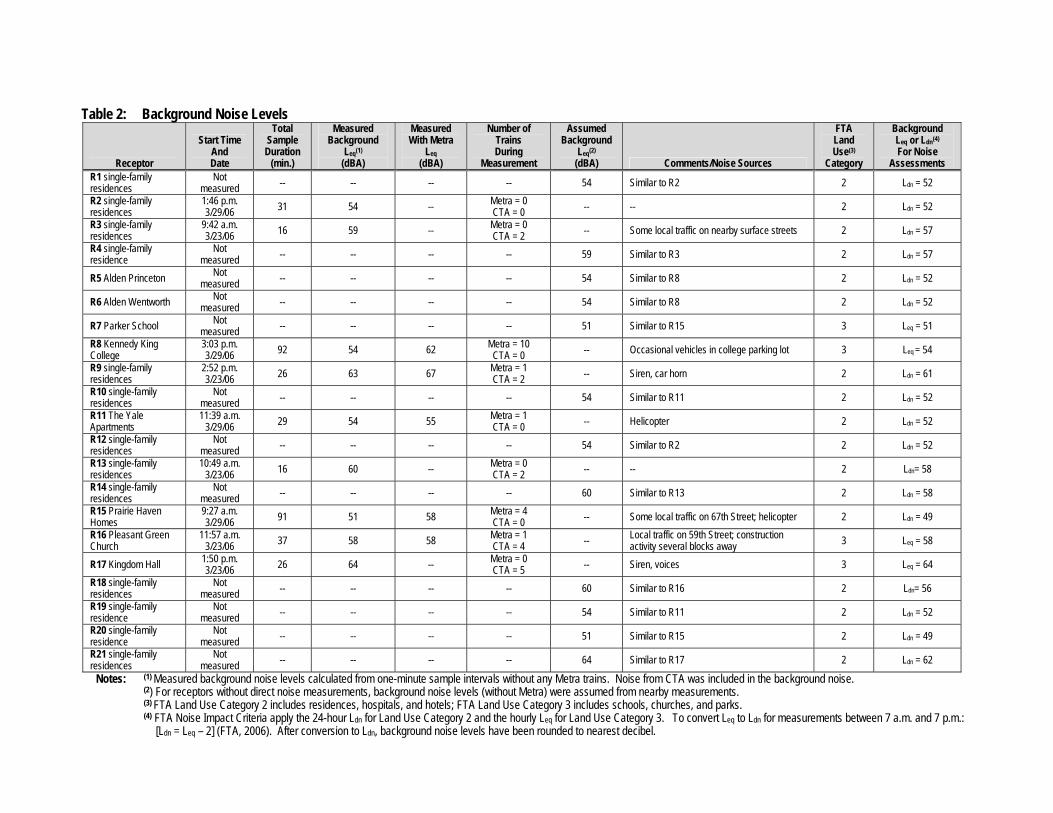
Table 2: Background Noise Levels
Receptor
Start Time And Date
Total Sample Duration
(min.)
Measured Background
Leq(1)
(dBA)
Measured With Metra
Leq(dBA)
Number of Trains During
Measurement
Assumed Background
Leq(2)
(dBA) Comments/Noise Sources
FTA Land Use(3)
Category
Background Leq or Ldn(4)
For Noise Assessments
R1 single-family residences
Not measured -- -- -- -- 54 Similar to R2 2 Ldn = 52
R2 single-family residences
1:46 p.m. 3/29/06 31 54 -- Metra = 0
CTA = 0 -- -- 2 Ldn = 52 R3 single-family residences
9:42 a.m. 3/23/06 16 59 -- Metra = 0
CTA = 2 -- Some local traffic on nearby surface streets 2 Ldn = 57 R4 single-family residence
Not measured -- -- -- -- 59 Similar to R3 2 Ldn = 57
R5 Alden Princeton Not measured -- -- -- -- 54 Similar to R8 2 Ldn = 52
R6 Alden Wentworth Not measured -- -- -- -- 54 Similar to R8 2 Ldn = 52
R7 Parker School Not measured -- -- -- -- 51 Similar to R15 3 Leq = 51
R8 Kennedy King College
3:03 p.m. 3/29/06 92 54 62 Metra = 10
CTA = 0 -- Occasional vehicles in college parking lot 3 Leq = 54 R9 single-family residences
2:52 p.m. 3/23/06 26 63 67 Metra = 1
CTA = 2 -- Siren, car horn 2 Ldn = 61 R10 single-family residences
Not measured -- -- -- -- 54 Similar to R11 2 Ldn = 52
R11 The Yale Apartments
11:39 a.m. 3/29/06 29 54 55 Metra = 1
CTA = 0 -- Helicopter 2 Ldn = 52 R12 single-family residences
Not measured -- -- -- -- 54 Similar to R2 2 Ldn = 52
R13 single-family residences
10:49 a.m. 3/23/06 16 60 -- Metra = 0
CTA = 2 -- -- 2 Ldn= 58 R14 single-family residences
Not measured -- -- -- -- 60 Similar to R13 2 Ldn = 58
R15 Prairie Haven Homes
9:27 a.m. 3/29/06 91 51 58 Metra = 4
CTA = 0 -- Some local traffic on 67th Street; helicopter 2 Ldn = 49 R16 Pleasant Green Church
11:57 a.m. 3/23/06 37 58 58 Metra = 1
CTA = 4 -- Local traffic on 59th Street; construction activity several blocks away 3 Leq = 58
R17 Kingdom Hall 1:50 p.m. 3/23/06 26 64 -- Metra = 0
CTA = 5 -- Siren, voices 3 Leq = 64 R18 single-family residences
Not measured -- -- -- -- 60 Similar to R16 2 Ldn= 56
R19 single-family residence
Not measured -- -- -- -- 54 Similar to R11 2 Ldn = 52
R20 single-family residence
Not measured -- -- -- -- 51 Similar to R15 2 Ldn = 49
R21 single-family residences
Not measured -- -- -- -- 64 Similar to R17 2 Ldn = 62
Notes: (1) Measured background noise levels calculated from one-minute sample intervals without any Metra trains. Noise from CTA was included in the background noise. (2) For receptors without direct noise measurements, background noise levels (without Metra) were assumed from nearby measurements.
(3) FTA Land Use Category 2 includes residences, hospitals, and hotels; FTA Land Use Category 3 includes schools, churches, and parks. (4) FTA Noise Impact Criteria apply the 24-hour Ldn for Land Use Category 2 and the hourly Leq for Land Use Category 3. To convert Leq to Ldn for measurements between 7 a.m. and 7 p.m.:
[Ldn = Leq – 2] (FTA, 2006). After conversion to Ldn, background noise levels have been rounded to nearest decibel.

Table 3: CTCO Rail Operations Summary Input
Existing Conditions
Future No-Build Alternative
Future Build Alternative
Peak daily number of trains in both directions for maximum weekday(1) 78 78 108
North Bound/ Track 2
South Bound/ Track 1
North Bound/ Track 2
South Bound/ Track 1
North Bound/ Track 2
South Bound/ Track 1
V = Average daily hourly volume of train traffic(2) (trains/hour) 1.63 1.63 1.63 1.63 2.25 2.25
Vd = Average daytime hourly volumes(3) 7 a.m. to 10 p.m. (trains/hour)
2.13
2.33
2.13
2.33
2.93
3.2
Vn = Average nighttime hourly volumes(4)
10 p.m. to 7 a.m. (trains/hour) 0.78 0.44 0.78 0.44 1.11 .667
Highest hourly train volume(5) 6 (8-9 a.m.)
1 (8-9 a.m.)
6 (8-9 a.m.)
1 (8-9 a.m.)
8 (8-9 a.m.)
2 (8-9 a.m.)
Nlocos = Average daytime number of locomotives per train(6)
7 a.m. to 10 p.m. 1 1 1 1 1 1
Nlocos = Average nighttime number of locomotives per train(6)
10 p.m. to 7 a.m. 1 1 1 1 1 1
Ncars = Average daytime number of rail cars per train(7)
7 a.m. to 10 p.m. 6 6 6 6 6 6
Ncars = Average nighttime number of rail cars per train(7)
10 p.m. to 7 a.m. 6 6 6 6 6 6
S = Average daytime train speed(8) (miles/hour) 7 a.m. to 10 p.m.
40 40 40 40 70 70
S = Average nighttime train speed(8) (miles/hour) 10 p.m. to 7 a.m.
40 40 40 40 70 70
Notes and Sources: (1) Total number of trains per weekday is the busiest weekday in the CTCO data, from midnight to midnight. Existing
and future train data for CREATE Project P-1 were provided by the CTCO. The CTCO data includes non-revenue trains in addition to scheduled trains on Metra line. CTCO data are provided for a 96-hour block, from noon Wednesday to noon Sunday.
(2) Average daily hourly volume equals total trains per day divided by 24. (3) Average daytime hourly volumes equal total number of train pass-bys between 7 a.m. and 10 p.m., divided by 15. (4) Average nighttime hourly volumes equal total number of train pass-bys between 10 p.m. and 7 a.m., divided by 9. (5) To determine noisiest hour of transit-related activity, for Land Use Category 3 under FTA Noise Impact Criteria.
Corresponds to the morning rush hour, at peak-hour volumes and when schools would be in session. (6) The average number of locomotives per train was determined from the CTCO data. (7) The average number of rail cars per train based on CTCO data. (8) Speed data obtained from Metra (Dec. 2004) for Existing conditions and from CTCO data for Future conditions.

Table 4: General Noise Assessment – Exterior Noise Levels
Predicted Overall Noise Levels(4) Build Scenario Impacts
Receptor
FTA Land Use(1)
Noise Metric
Number of Bldgs.
Within Cluster
Existing Land Use(2)
Background Noise Levels Measured(3)
(Without Metra) (dBA)
Existing Train Noise
Exposure (dBA)
No-Build Train Noise
Exposure (dBA)
Build Train Noise
Exposure (dBA)
Increase in Overall Noise
Exposure
Build over Existing (dBA)
FTA Allowable Increase
(dBA)
Impact Under FTA
Criteria R1 single-family residence 221 W. 66th Street 2/ Ldn 9 SFR 52 65 65 71 6 2-4 – Moderate
>4 - Severe Severe
R2 single-family residence 6566 S. Ross Avenue 2/ Ldn 10 SFR 52 65 65 70 5 2-4 – Moderate
>4 - Severe Severe
R3 single-family residence 6067 S. LaSalle Street 2/ Ldn 5 SFR 57 64 64 67 3 2 – Moderate
4 - Severe Moderate
R4 single-family residence 5959 S. LaSalle Street 2/ Ldn 12 SFR 57 63 63 66 3 3-4 – Moderate
>4 - Severe Moderate
R6 Alden Wentworth 201 W. 69th Street 2/ Ldn 1 Nursing
home 52 54 54 55 1 4-8 – Moderate >8 - Severe No Impact
R9 single-family residence 5928 S. Lafayette Avenue 2/ Ldn 3 SFR 61 64 64 64 0 3-5 – Moderate
>5 - Severe No Impact
R10 single-family residence 6630 S. Yale Avenue 2/ Ldn 4 SFR 52 56 56 57 1 4-7 – Moderate
>7 - Severe No Impact
R12 single-family residence 6545 S. Wentworth Avenue 2/ Ldn 3 SFR 52 62 62 62 0 3-4 – Moderate
>4 - Severe No Impact
R13 single-family residence 6066 S. LaSalle Street 2/ Ldn 15 SFR 58 59 59 60 1 3-5 – Moderate
>5 - Severe No Impact
R14 single-family residence 5958 S. LaSalle Street 2/ Ldn 10 SFR 58 59 59 60 1 2-5 – Moderate
>5 - Severe No Impact
R18 single-family residence 5851 S. LaSalle Street 2/ Ldn 10 SFR 56 63 63 66 3 3-4 – Moderate
>4 - Severe Moderate
R19 single-family residence 6547 S. Yale Avenue 2/ Ldn 6 SFR & MFR 52 56 56 58 2 4-7 – Moderate
>7 - Severe No Impact R20 single-family residence 310 W. Normal Parkway 2/ Ldn 1 SFR 49 59 59 62 3 3-5 – Moderate
>5 – Severe Moderate R21 single-family residence 5750 S. Lafayette Avenue 2/ Ldn 14 SFR 62 62 62 63 1 3-4 – Moderate
>4 - Severe No Impact
Notes: (1) FTA Noise Impact Criteria apply the 24-hour Ldn for residences and nursing homes (Land Use Category 2) and the hourly Leq for schools, parks, and churches (Land Use Category 3). (2) SFR = single-family residence; MFR = multifamily residence. (3) Background Noise Levels calculated from measured, one-minute sample intervals without any Metra trains. Noise from CTA trains was included in background noise. (4) Overall Noise Levels are the logarithmic addition of the measured Background Noise (without Metra) plus predicted Metra train noise under Existing, No-Build, and Build conditions.
Existing and future Metra noise levels predicted with FTANOISE spreadsheet model (CREATE Version).

Table 5: General Noise Assessment – Interior Noise Levels
Receptor
FHWA Interior Noise
Criterion Leq (dBA)
Receptor Type
Number of Buildings
w/in Cluster
Window Condition
And Building
Type
Noise Reduction Factor(1)
(dBA)
Exterior Existing
Predicted Train
Noise(2) Leq (dBA)
Interior Existing
Predicted Train
Noise(3) Leq (dBA)
Exterior Predicted No-Build
Train Noise(2)
Leq (dBA)
Interior Predicted No-Build
Train Noise(3)
Leq (dBA)
Exterior Predicted
Build Train
Noise(2) Leq (dBA)
Interior Predicted
Build Train
Noise(3) Leq (dBA)
Interior Predicted
Build Approach
Or Exceed(4) 52 dBA?
Level Of
Interior Noise
Impact(5)
R5 Alden Princeton 255 W. 69th Street 52 Nursing
Home 1 Operable
windows, a/c, masonry
10 60 50 60 50 62 52 Yes Impact
R7 Parker School 6800 S. Stewart Avenue
52 Elementary School 1
Operable windows, a/c,
masonry 10 62 52 62 52 65 55 Yes Impact
R8 Kennedy King College 6800 S. Wentworth Ave.
52 College 1 Non-operable windows, a/c,
concrete 25 59 34 59 34 61 36 No None
R11 The Yale Apartments 6565 S. Yale Ave.
52 MFR 1 Operable
windows, a/c, masonry
10 55 45 55 45 59 49 No None
R15 Prairie Haven Homes 301 W. Marquette Road
52 Senior Housing 1
Operable windows, a/c,
masonry 10 60 50 60 50 64 54 Yes Impact
R16 Pleasant – Green Church 140 W. 59th Street
52 Church 1 Non-operable windows, a/c,
masonry 25 51 26 51 26 54 29 No None
R17 Kingdom Hall 48 W. 59th Street 52 Church 1
Non-operable windows, a/c,
masonry 25 58 33 58 33 60 35 No None
Notes: (1) Noise reduction factors for each receptor were determined from site visits and FHWA factors in Table 5-1 of CREATE Methodology. (2) Exterior rail noise from CREATE Program tracks predicted with the FTA spreadsheet model (CREATE Version). (3) Interior noise levels estimated by subtracting noise reduction factor from predicted exterior train noise. (4) Would the Predicted Interior Build Scenario CREATE Program Train Noise Level be 51 Leq(h) or higher? (5) A potential impact would occur if Interior Predicted Build Leq(h) would be 51 dBA or greater. The “Existing” is the same as the “Existing Scenario CREATE Program Train Noise” referenced in the CREATE Noise and Vibration Methodology Section 4.2.5. The “Predicted No-Build” is the same as the “No-Build Scenario CREATE Program Train Noise Level (Design Year)” referenced in the CREATE Noise and Vibration Methodology Section 4.2.5. The “Predicted Build” is the same as the “Build Scenario CREATE Program Train Noise Level (Design Year)” referenced in the CREATE Noise and Vibration Methodology Section 4.2.5.

Table 6: Detailed Noise Analysis – Exterior Noise Levels Predicted Overall Noise Levels(4) Build Alternative Impacts
Receptor
FTA Land Use(1)
Noise Metric
No. of Bldgs. Within Cluster
Existing Land Use(2)
Background Noise Levels Measured(3)
(Without Metra) (dBA)
Existing Train Noise
Exposure (dBA)
No-Build Train Noise
Exposure (dBA)
Build Train Noise
Exposure (dBA)
Increase in Overall Noise
Exposure
Build over Existing
(dBA) FTA Allowable Increase (dBA)
Impact Under FTA
Criteria R1 single-family residence 221 W. 66th Street 2/ Ldn 1 SFR 52 64 66 2 3-4 - Moderate
>4 - Severe None
R1A single-family residence 6621 S. Yale Avenue 2/ Ldn 4 SFR 52 61 64 3 3-5 - Moderate
>5 - Severe Moderate
R1B single-family residence 6451 S. Yale Avenue 2/ Ldn 3 SFR 52 64 68 4 3-4 - Moderate
>4 - Severe Moderate
R1C single-family residence 6653 S. Yale Avenue 2/ Ldn 1 SFR 52 68 67 2 2-4 - Moderate
>4 - Severe Moderate
R2 single-family residence 6566 S. Ross Avenue 2/ Ldn 10 SFR 52 64 64 66 2 3-4 – Moderate
>4 – Severe None
R3 single-family residence 6067 S. LaSalle Street 2/ Ldn 5 SFR 57 63 63 65 2 3-4 – Moderate
>4 – Severe None
R4 single-family residence 5959 S. LaSalle Street 2/ Ldn 12 SFR 57 62 62 65 3 3-4 – Moderate
>4 – Severe Moderate
R18 single-family residence 5851 S. LaSalle Street 2/ Ldn 10 SFR 56 62 62 65 3 3-4 – Moderate
>4 – Severe Moderate R20 single-family residence 310 W. Normal Parkway 2/ Ldn 1 SFR 49 59 59 62 3 3-5 – Moderate
>5 – Severe Moderate
Notes: (1) FTA Noise Impact Criteria apply the 24-hour Ldn for residences and nursing homes (Land Use Category 2) and the hourly Leq for schools, parks, and churches (Land Use Category 3). (2) SFR = single-family residence; MFR = multifamily residence. (3) Background Noise Levels calculated from measured, one-minute sample intervals without any Metra trains. Noise from CTA trains was included in background noise. (4) Overall Noise Levels are the logarithmic addition of the measured Background Noise (without Metra) plus the predicted Metra train noise under Existing, No-Build, and Build
conditions. Existing and future CREATE Program noise levels predicted with the FTA detailed noise analysis procedures in Chapter 6 of the FTA Manual.

Table 7: Detailed Noise Assessment – Interior Noise Levels
Receptor
FHWA Interior Noise
Criterion Leq (dBA)
Receptor Type
Number of Buildings w/in Cluster
Window Condition
And Building
Type
Noise Reduction Factor(1)
(dBA)
Exterior Existing
Predicted Train
Noise(2) Leq (dBA)
Interior Existing
Predicted Train
Noise(3) Leq (dBA)
Exterior Predicted No-Build
Train Noise(2)
Leq (dBA)
Interior Predicted No-Build
Train Noise(3)
Leq (dBA)
Exterior Predicted
Build Train
Noise(2) Leq (dBA)
Interior Predicted
Build Train
Noise(3) Leq (dBA)
Interior Predicted
Build Approach
Or Exceed(4) 52 dBA?
Level Of
Interior Noise
Impact(5)
R5 Alden Princeton First Floor 52 Nursing
Home 1 Operable
windows, a/c, masonry
10 59 49 59 49 62 52 Yes Impact
R5 Alden Princeton Second Floor 52 Nursing
Home 1 Operable
windows, a/c, masonry
10 60 50 60 50 62 52 Yes Impact
R5 Alden Princeton Third Floor 52 Nursing
Home 1 Operable
windows, a/c, masonry
10 60 50 60 50 63 53 Yes Impact
R7 Parker School First Floor 52 Elementary
School 1Operable
windows, a/c, masonry
10 61 51 61 51 64 54 Yes Impact
R7 Parker School Second Floor 52 Elementary
School 1Operable
windows, a/c, masonry
10 61 51 61 51 64 54 Yes Impact
R7 Parker School Third Floor 52 Elementary
School 1Operable
windows, a/c, masonry
10 62 52 62 52 64 54 Yes Impact
R7 Parker School Fourth Floor 52 Elementary
School 1Operable
windows, a/c, masonry
10 62 52 62 52 65 55 Yes Impact
R15 Prairie Haven First Floor 52 Senior
Housing 1Operable
windows, a/c, masonry
10 59 49 59 49 63 53 Yes Impact
R15 Prairie Haven Second Floor 52 Senior
Housing 1Operable
windows, a/c, masonry
10 60 50 60 50 63 53 Yes Impact
Notes: (1) Noise reduction factors for each receptor were determined from site visits and FHWA factors in Table 5-1 of CREATE Methodology. (2) Exterior rail noise from CREATE Program tracks predicted with the FTA spreadsheet model (CREATE Version). (3) Interior noise levels estimated by subtracting noise reduction factor from predicted exterior train noise. (4) Would the Predicted Interior Build Scenario CREATE Program Train Noise Level be 51 Leq(h) or higher? (5) A potential impact would occur if Interior Predicted Build Leq(h) would be 51 dBA or greater. The “Existing” is the same as the “Existing Scenario CREATE Program Train Noise” referenced in the CREATE Noise and Vibration Methodology Section 4.2.5. The “Predicted No-Build” is the same as the “No-Build Scenario CREATE Program Train Noise Level (Design Year)” referenced in the CREATE Noise and Vibration Methodology Section 4.2.5. The “Predicted Build” is the same as the “Build Scenario CREATE Program Train Noise Level (Design Year)” referenced in the CREATE Noise and Vibration Methodology Section 4.2.5.

Table 8: Abatement Evaluation—Receptor R1 Receptor R1 R1A R1B R1C
Potential Barrier Location Not Required On top of proposed retaining wall
On top of proposed retaining wall
On top of proposed retaining wall
Noise Metric Ldn Ldn Ldn Ldn
Existing Overall Scenario (Predicted Existing CREATE + Background) 64 dBA 61 dBA 64 dBA 65 dBA Build Overall Scenario (Predicted Build CREATE + Background) 66 dBA 64 dBA 68 dBA 67 dBA Increase in Overall Noise Exposure, Build over Existing 2 dBA 3 dBA 4 dBA 2 dBA
FTA/CREATE Impact Threshold Moderate: 3-4 dBA Severe: >4 dBA
Moderate: 3-5 dBA Severe: >5 dBA
Moderate: 3-4 dBA Severe: >4 dBA
Moderate: 2-4 dBA Severe: >4 dBA
Impact? None Moderate Moderate Moderate Reasonable Cost Level per Benefited Residence for Decibels Exceeding Impact Threshold(1) N/A $5,000 $10,000 $5,000
Number of Benefited Receptors(2) 0 4 3 1 Reasonable Mitigation Cost for Benefited Receptors $0 $20,000 $30,000 $5,000 Total Reasonable Mitigation Cost for Entire Cluster $55,000
Noise Wall Height at Analysis Location N/A 6 feet above top of proposed retaining wall
5 feet above top of proposed retaining wall
2 feet above top of proposed retaining wall
CREATE Program Train Noise Reduction with Noise Wall, at Analysis Location(3) N/A 5 dBA 5 dBA 6 dBA
Approximate Noise Wall Length 844 feet Total Noise Wall Cost(3) $158,000 Does Noise Wall Achieve Noise Reduction Goal? (minimum 5-dBA reduction) N/A Yes Yes Yes
Does Noise Wall Achieve the Policy Economic Reasonability Value?(4) No Is Noise Wall Likely to be Implemented? No Notes: (1) For “Moderate” Impacts, an upper limit of $5,000 per dwelling for each decibel exceeding the impact threshold, up to a limit of $30,000 per dwelling.
(2) Benefited Receptor defined as a receptor with predicted noise impacts and that receives a noise reduction of 5 dBA or more in Build Scenario CREATE Program Train Noise.
(3) Noise-wall costs based on $25.00 per square foot unit cost for walls up to 15 feet tall; $37.50 per square foot up to 30 feet tall, and $50.00 per square foot up to 45 feet tall. (4) Does “Total Reasonable Mitigation Cost” exceed the “Total Noise Wall Cost”?

Table 9: Abatement Evaluation—Exterior Noise Levels Receptor R4 R18 R20
Potential Barrier Location Along right of way, bottom of noise wall at ground level
Along right of way, bottom of noise wall at ground level
Along right of way, bottom of noise wall at ground level
Noise Metric Ldn Ldn Ldn
Overall Build Scenario Noise Level Without Barrier (Future CREATE Program Noise + Background) 65 dBA 65 dBA 62 dBA
Noise Wall Height 17 ft (Above ground level)
14 ft (Above ground level)
21 ft (Above ground level)
Approximate Noise Wall Length 1,000 ft 1,125 ft 850 ft Unit Noise Wall Cost(1) $37.50/sq-ft $25.00/sq-ft $37.50/sq-ft Total Noise Wall Cost $638,000 $394,000 $670,000 Future CREATE Program Train Noise Reduction(2) 6 dBA 5 dBA 5 dBA Number of Benefited Receptors(3) 12 10 1 Cost per Benefited Receptor $53,200 $39,400 $670,000 FTA Impact Level Moderate Moderate Moderate Allowable Noise Level Increase Under FTA Criteria (Moderate Impact Threshold)
Moderate: 3-4 dBA Severe: >4 dBA
Moderate: 3-4 dBA Severe: >4 dBA
Moderate: 3-5 dBA Severe: >5 dBA
Predicted Increase in Overall Noise Exposure (Build over Existing) 3 dBA 3 dBA 3 dBA
Predicted Noise Increase over Moderate Impact Threshold 1 dBA 1 dBA 1 dBA
Reasonable Cost Level per Benefited Residence for Decibels Exceeding Moderate Impact Threshold(4)
$5,000 $5,000 $5,000
Does Noise Wall Achieve Noise Reduction Goal? (minimum 5-dBA reduction) Yes Yes Yes
Does Noise Wall Achieve the Policy Economic Reasonability Value?(5) No No No
Is Noise Wall Likely to be Implemented? No No No Notes: (1) Noise wall costs are based on a $25.00 per square foot unit cost for walls up to 15 feet tall; $37.50 per square foot up to 30 feet tall, and $50.00 per square foot up to 45 feet tall. At
R2, the noise wall would be on top of the proposed retaining wall, and the height of the retaining wall was deducted from the overall height of the noise wall to determine the total cost of the noise wall.
(2) Noise reduction goal of a feasible reduction of 5 dBA or more in future CREATE Program train noise. (3) Benefited receptor assumed to receive a noise reduction of at least 5 dBA. (4) For “Moderate” Impacts, an upper limit of $5,000 per dwelling for each decibel exceeding the impact threshold, up to a limit of $30,000 per dwelling. Minimum of $5,000 per dwelling
for “Noise Level over Allowable” of less than 1 dBA. (5) Does “Reasonable Cost per Benefited Value” exceed the “Cost per Benefited Receptor”?

Table 10: Abatement Evaluation—Interior Noise Levels Receptor R5 Alden Princeton
First Floor R5 Alden Princeton
Second Floor R5 Alden Princeton
Third Floor R15 Prairie Haven
First Floor R15 Prairie Haven
Second Floor
Potential Barrier Location Along right of way,
bottom of noise wall at ground level
Along right of way, bottom of noise wall at
ground level
Along right of way, bottom of noise wall at
ground level
Along right of way, above proposed
retaining wall
Along right of way, above proposed
retaining wall Noise Metric Leq Leq Leq Leq Leq
Noise Wall Height 20 ft above ground 23 ft above ground 26 ft above ground 17 ft above proposed retaining wall
20 ft above proposed retaining wall
Approximate Noise Wall Length 1,000 ft 1,000 ft 1,000 ft 850 ft 850 ft Unit Noise Wall Cost(1) $37.50/sq-ft $37.50/sq-ft $37.50/sq-ft $37.50/sq-ft $37.50/sq-ft Total Noise Wall Cost $750,000 $863,000 $975,000 $542,000 $638,000 CREATE Program Train Noise Reduction with Noise Wall(2)
5 dBA At first floor
5 dBA At second floor
5 dBA At Third Floor
6 dBA At first floor
5 dBA At second floor
Predicted Interior Build Scenario CREATE Program Train Noise (Without Barrier) 52 dBA 52 dBA 53 dBA 53 dBA 53 dBA
Predicted Interior Existing Scenario CREATE Program Train Noise 49 dBA 50 dBA 50 dBA 49 dBA 50 dBA
Number of Decibels Interior Build Scenario Exceeds Existing Scenario, at Floor of Receptor 3 dBA 2 dBA 3 dBA 4 dBA 3 dBA
Reasonable Mitigation Cost per Benefited Unit at Floor of Receptor(3) $15,000 $10,000 $15,000 $20,000 $15,000
Number of Benefited Units(4) 1st floor = 14 units 1st floor = 14 units 2nd floor = 14 units
Total = 28 units
1st floor = 14 units 2nd floor = 14 units 3rd floor = 14 units
Total = 42 units 1st floor = 4 units
1st floor = 4 units 2nd floor = 4 units
Total = 8 units
Reasonable Mitigation Cost per Floor 1st: 14*15,000=$210,000 1st: 14*15,000=$210,000 2nd: 14*10,000=$140,000
1st: 14*15,000=$210,000 2nd: 14*10,000=$140,000 3rd: 14*15,000=$210,000
1st: 4*20,000=$80,000 1st: 4*20,000=$80,000 2nd: 4*15,000=$60,000
Total Reasonable Mitigation Cost $210,000 $350,000 $560,000 $80,000 $140,000 Does Noise Wall Achieve Noise Reduction Goal? (minimum 5-dBA reduction) Yes Yes Yes Yes Yes
Does Noise Wall Achieve the Policy Economic Reasonability Value?(5) No No No No No
Is Noise Wall Likely to be Implemented? No No No No No Notes: (1) Noise-wall costs based on $25.00 per square foot unit cost for walls up to 15 feet tall; $37.50 per square foot up to 30 feet tall, and $50.00 per square foot up to 45 feet tall. (2) Noise reduction goal of a feasible reduction of 5 dBA or more in interior CREATE Program train noise. (3) For interior impacts, noise walls must not exceed a cost of $5,000 per benefited receptor for each decibel exceeding the Existing Scenario CREATE Program Train Noise, up to a total
limit of $30,000 per benefited receptor. (4) Benefited Units are units facing the tracks that would receive a noise reduction of at least 5 dBA in CREATE Program train noise. (5) Does “Total Reasonable Mitigation Cost” exceed the “Total Noise Wall Cost”?

Table 11: Abatement Evaluation—Parker School Receptor R7 Parker School
First Floor R7 Parker School
Second Floor R7 Parker School
Third Floor R7 Parker School
Fourth Floor
Potential Barrier Location Along right of way,
bottom of noise wall at ground level
Along right of way, bottom of noise wall at
ground level
Along right of way, bottom of noise wall at
ground level
Along right of way, bottom of noise wall at
ground level Noise Metric Leq Leq Leq Leq
Noise Wall Height 15 ft above ground 20 ft above ground 26 ft above ground 32 ft above ground Approximate Noise Wall Length 800 ft 800 ft 800 ft 800 ft Unit Noise Wall Cost(1) $25.00/sq-ft $37.50/sq-ft $37.50/sq-ft $50.00/sq-ft Total Noise Wall Cost $300,000 $600,000 $780,000 $1,280,000
CREATE Program Train Noise Reduction with Noise Wall(2) 6 dBA At first floor
5 dBA At second floor
5 dBA At third floor
6 dBA At fourth floor
Predicted Interior Build Scenario CREATE Program Train Noise (Without Barrier) 54 dBA 54 dBA 54 dBA 55 dBA
Predicted Interior Existing Scenario CREATE Program Train Noise 51 dBA 51 dBA 52 dBA 52 dBA Number of Decibels Interior Build Scenario Exceeds Existing Scenario, at Floor of Receptor 3 dBA 3 dBA 2 dBA 3 dBA
Reasonable Mitigation Cost per Benefited Unit at Floor of Receptor(3) $15,000 $15,000 $10,000 $15,000
Number of Benefited Units(4) 1st floor = 7 units 1st floor = 7 units 2nd floor = 4 units Total = 11 units
1st floor = 7 units 2nd floor = 4 units 3rd floor = 9 units Total = 20 units
1st floor = 7 units 2nd floor = 4 units 3rd floor = 9 units 4th floor = 7 units Total = 27 units
Reasonable Mitigation Cost per Floor 1st: 7*15,000=$105,000 1st: 7*15,000=$105,000 2nd: 4*15,000=$60,000
1st: 7*15,000=$105,000 2nd: 4*15,000=$60,000 3rd: 9*10,000=$90,000
1st: 7*15,000=$105,000 2nd: 4*15,000=$60,000 3rd: 9*10,000=$90,000 4th: 7*15,000=$105,000
Total Reasonable Mitigation Cost $105,000 $165,000 $255,000 $360,000 Does Noise Wall Achieve Noise Reduction Goal? (minimum 5-dBA reduction) Yes Yes Yes Yes
Does Noise Wall Achieve the Policy Economic Reasonability Value?(5) No No No No Is Noise Wall Likely to be Implemented? No No No No Notes: (1) Noise-wall costs based on $25.00 per square foot unit cost for walls up to 15 feet tall; $37.50 per square foot up to 30 feet tall, and $50.00 per square foot up to 45 feet tall. (2) Noise reduction goal of a feasible reduction of 5 dBA or more in interior CREATE Program train noise. (3) For interior impacts, noise walls must not exceed a cost of $5,000 per benefited receptor for each decibel exceeding the Existing Scenario CREATE Program Train Noise, up to a total
limit of $30,000 per benefited receptor. (4) Benefited Units are units facing the tracks that would receive a noise reduction of at least 5 dBA in CREATE Program train noise. (5) Does “Total Reasonable Mitigation Cost” exceed the “Total Noise Wall Cost”?

Table 12: Predicted Exterior Maximum Noise Levels Existing Conditions No Build Build
Receptor LmaxLocos
LmaxRailcars
LmaxTrain
LmaxLocos
LmaxRailcars
LmaxTrain
LmaxLocos
LmaxRailcars
LmaxTrain
R1- Residences Under revision
R2- Residences 86 73 86 86 73 86 90 76 90 R3- Residences 85 73 85 85 73 85 88 76 88 R4- Residences 84 73 84 84 73 84 87 76 87 R5- Alden Princeton 83 73 83 83 73 83 86 76 86 R7- Parker School 84 73 84 84 73 84 87 76 87 R15- Prairie Haven 83 73 83 83 73 83 86 76 86 R18- Residences 84 73 84 84 73 84 88 76 88 R20- Residences 83 73 83 83 73 83 86 76 86

CREATE NOISE ABATEMENT EVALUATIONB-8
Date: November 16, 2007
Assessment Level: ABATEMENT EVALUATION
Receptor B8-R2 (1) B8-R2.1 (1)
Receptor Type Interior Exterior
Potential Barrier Location Along ROW Along ROW
Noise Metric Leq Ldn
Overall Build Scenario Noise Level Without Barrier (Future CREATE Program Noise + Background), dBA
Not Applicable 70
Interior CREATE Build Train Noise Level, dBA 62 Not Applicable
Noise Wall Height, ft
Approximate Noise Wall Length, ft
Unit Noise Wall Cost (2)
Total Noise Wall Construction Cost
Future CREATE Train Noise Reduction, dBA 5 5
Future Overall Noise Level Reduction, dBA (3)
(Only Calculated for Exterior Receptors)Not Calculated 4
Number of Benefited Receptors (4) 1 23
FHWA/FTA/CREATE Impact Level Impact ModerateAllowable Noise Level Increase Under FTA Criteria (Moderate
Impact Threshold)(Only Use for Exterior Impacts)
Not Applicable 1
Predicted Noise Level Increase in Overall Noise Exposure (Buildover Existing)
(Only Calculated for Exterior Receptors)Not Calculated 2
Predicted Noise Level Increase over Moderate Impact Threshold(Use for Exterior Impacts Only)
Not Applicable 1
Predicted Build CREATE Train Interior Noise Level Increase over Existing CREATE Train Interior Noise Level
(Use for Interior Impacts Only)2 Not Applicable
Reasonable Cost Level per Benefited Receptor per Decibel Increase Build Over Existing Noise Level (Interior) or per Decibel
Exceeding Moderate Impact Threshold (Exterior) (5)$5,000 $5,000
Reasonable Cost Per Benefited Receptor $10,000 $5,000
Total Reasonable Cost of Noise Wall (6)
Does Noise Wall Achieve Noise Reduction Goal? (minimum 5-dBAreduction) (7) Yes Yes
Does Noise Wall Achieve the Economic Reasonability Policy Value? (8)
Is Noise Wall Likely to Be Implemented?
Notes:
(3) The total wall construction cost for R2/R2.1 is 2300 ft.*8 ft.*25.00 per square foot = 460,000.
(2) Noise wall costs based on $25.00 per square foot unit cost for wall up to 15 feet tall; $37.50 per square foot upto 30 feet tall; and $50.00 per square foot up to 45 feet tall.
$125,000 (9)
No
No
(1) Abatement for receptor B8-R2 and B8-R2.1 were analyzed individually; however, for final evaluation to determine the total reasonableness of a noise wall, the abatement analysis of receptor B8-R2.1 was combined with receptor B8-R2, as they share a common noise wall.
8
2,300
$25.00
$460,000(3)
(4) A benefited receptor is a receptor with predicted noise impacts and that receives a Build Scenario CREATE Program Train Noise Level (Design Year) noise reduction of five (5) dBA or more.
(7) Noise mitigation measures must provide a Build Scenario CREATE Program Train Noise Level (Design Year) noise reduction of at least five (5) dBA for the mitigation measure to be considered feasible.
Receptors that are grouped together share a common noise wall. All of the benefited receptors are included in the cost analysis.
(9) For R2/R2.1: ($10,000 * 1) + ($5,000 * 23) = $125,000
(5) Exterior - For "Moderate" impacts, a upper limit of $5,000 per dwelling for each decibel exceeding the impact threshold, up to a limit of $30,000 per dwelling. Minimum of $5,000 per dwelling for "Noise Level over Allowable" of less than 1 dBA. For severe impacts, an upper limit of $30,000 per benefited receptor. Interior - Upper limit of $5,000 per receptor for each decibel the CREATE build interior train noise level exceeds the CREATE existing interior train noise level, up to a maximum of $30,000 per receptor.
(6) "Total Reasonable Cost of Noise Wall" is the "Reasonable Cost Level per Benefited Receptor" times the total "Number of Benefited Receptors". This is the maximum noise wall cost that would be economically reasonable.
(8) Does the "Total Reasonable Cost of Noise Wall" exceed the "Total Noise Wall Construction Cost"? If "Yes", then the noise wall achieves the Economic Reasonability Policy Value.
Recommended