Embed Size (px)
Citation preview
ZScope M-Class Digital Storage Oscilloscope Soft Front Panel
Models ZT4611, ZT4612, ZT4211, ZT4212,
ZT4421, ZT4422, ZT4431, ZT4432, ZT4441, ZT4442
User’s Manual: 0004-000062 Revision 2a
September 25, 2009
®

2 0004-000062
Contact ZTEC Instruments 7715 Tiburon Street NE Albuquerque, NM 87109
Telephone: (505) 342-0132 Fax: (505) 342-0222 Web Site: www.ztecinstruments.com
ZTEC Instruments, Inc. welcomes your comments on this manual. All manuals are thoroughly reviewed before distribution. We are, however, grateful for any comments from our users which will further help to improve the content and quality of our documents.
Copyright Copyright 2008 by ZTEC Instruments
Printed in the United States of America.
All rights reserved under copyright laws of the United States and other countries. All technical data and computer software documentation contained herein is proprietary and confidential to ZTEC Instruments, Inc. or its licensor. The reproduction and/or transmission of this publication in whole or in part by any means, electronic or mechanical, is prohibited without the prior written consent of ZTEC Instruments, Inc. ZTEC, ZScope, ZWave, and associated logos are registered trademarks of ZTEC Instruments ZTEC Instruments has attempted throughout this publication to distinguish proprietary trademarks from descriptive terms by following the capitalization style used by the manufacturer. Product names listed are trademarks of their respective manufacturers. Company names listed are trademarks or trade names of their respective companies. LabVIEW™ National Instruments Corporation Windows™ Microsoft Corporation
The material in this manual is for informational purposes only and is subject to change without notice. ZTEC Instruments, Inc. assumes no responsibility for any error or for consequential damages that may result from the use or misinterpretation of any of the procedures in this publication.

0004-000062 3
Handling Precautions for Electronic Devices Subject to Damage by
Static Electricity
This instrument is susceptible to Electronic Static Discharge (ESD) damage. When transporting, place the instrument or module in conductive (anti-static) envelopes or carriers. Open only at an ESD-approved work surface. An ESD safe work surface is defined as follows: • The work surface must be conductive and reliably connected to an earth ground
with a safety resistance of approximately 250 kilohms.
• The surface must NOT be metal. A resistance of 30–300 kilohms per square inch is suggested.
Ground the frame of any line-powered equipment, chassis, test instruments, lamps, soldering irons, etc., directly to the earth ground. To avoid shorting out the safety resistance, ensure that the grounded equipment has rubber feet or other means of insulation from the work surface. Avoid placing tools or electrical parts on insulators. Do NOT use any hand tool that can generate a static charge, such as a non-conductive plunger-type solder sucker. Use a conductive strap or cable with a wrist cuff to reliably ground to the work surface. The cuff must make electrical contact directly with the skin; do NOT wear it over clothing. Note: Resistance between the skin and the work surface is typically 250 kilohms
to 1 megohm using a commercially-available personnel grounding device. Avoid circumstances that are likely to produce static charges, such as wearing clothes of synthetic material, sitting on a plastic-covered stool (especially when wearing woolen material), combing the hair, or making extensive pencil erasures. These circumstances are most significant when the air is dry. When testing static sensitive devices, ensure DC power is ON before, during, and after application of test signals. Ensure all pertinent voltages are switched OFF while circuit boards or components are removed or inserted.

4 0004-000062
Revision History
Rev Date Section Description
1 4-24-07 All Initial Release
1a 10-10-07 Introduction, Instrument, Status
Added Clear Memory and updated screenshots
1b 1-4-08 Instrument Add Instrument
1c 4-10-08 All Added zt4210, system restore, limit external output, calc no-op, and limit test count.
2 9-17-08 All Updated panel, calc mask gating, introduction
2a 9-25-09 All Updated images, cursor centering, control panel minimization

0004-000062 5
Table of Contents Introduction.........................................................................................................8
General .............................................................................................................8 Compatibility......................................................................................................8 Instrument Interface ..........................................................................................8 Design ...............................................................................................................9
Graph Display....................................................................................................11 Measurement Display .......................................................................................15
Measurement Sets ..........................................................................................15 Cursor Measurements.....................................................................................16 Limit Measurements ........................................................................................16
Controls .............................................................................................................17 Control Panel...................................................................................................17 Palettes ...........................................................................................................18 Control Functionality........................................................................................20
Acquisition ...................................................................................................20 Segmenting..................................................................................................22 Horizontal.....................................................................................................23 Pan/Zoom ....................................................................................................25 Vertical.........................................................................................................27 Input Channels.............................................................................................29 Calculations .................................................................................................31 Advanced Calculations ................................................................................32 Trigger & Arm ..............................................................................................35 Advanced Trigger ........................................................................................39 Pattern Trigger.............................................................................................41 Outputs ........................................................................................................42 Measurement Sets.......................................................................................44 Measurement Options .................................................................................45 Cursors ........................................................................................................46 Save and Recall...........................................................................................47 Instrument....................................................................................................50 Graph Options .............................................................................................52 Status ..........................................................................................................54

6 0004-000062
List of Figures Figure 1.1: SFP Layout ................................................................................................... 9 Figure 2.1: Graph Display Controls ............................................................................. 11 Figure 3.1: Measurement Display................................................................................ 15 Figure 3.2: Cursor Measurement Display .................................................................. 16 Figure 3.3: Limit Measurement Display ...................................................................... 16 Figure 4.1: Control Panel .............................................................................................. 17 Figure 4.2: Palette Selects............................................................................................ 18 Figure 4.3: Sample Palette Tab ................................................................................... 19 Figure 4.4: Acquisition Control Panel Controls.......................................................... 20 Figure 4.5: Acquisition Palette Controls ..................................................................... 21 Figure 4.6: Segment Palette Controls......................................................................... 22 Figure 4.7: Horizontal Control Panel Controls ........................................................... 23 Figure 4.8: Horizontal Palette Controls....................................................................... 24 Figure 4.9: Pan/Zoom Control Panel Controls .......................................................... 25 Figure 4.10: Pan/Zoom Graph Controls ..................................................................... 26 Figure 4.11: Vertical Control Panel Controls ............................................................. 27 Figure 4.12: Vertical Palette Controls ......................................................................... 28 Figure 4.13: Input Channel Control Panel Controls .................................................. 29 Figure 4.14: Input Channel Palette Controls.............................................................. 30 Figure 4.15: Calculation Channel Palette Controls................................................... 31 Figure 4.16: Calculation Limit and Measurement Palette Controls........................ 32 Figure 4.17: Calculation Mask Palette Controls ........................................................ 33 Figure 4.18: Trigger Control Panel Controls .............................................................. 35 Figure 4.19: Trigger B Control Panel Controls .......................................................... 35 Figure 4.20: Arm Control Panel Controls ................................................................... 35 Figure 4.21: Arm Alternate Controls............................................................................ 35 Figure 4.22: Trigger Palette Controls.......................................................................... 37 Figure 4.23: Trigger Level Palette Controls ............................................................... 38 Figure 4.24: Pulse Width Trigger Palette Controls ................................................... 39 Figure 4.25: Video Trigger Palette Controls .............................................................. 40 Figure 4.26: Glitch Trigger Palette Controls .............................................................. 40 Figure 4.27: Advanced Trigger Palette Controls ....................................................... 41 Figure 4.28: External Output and ROSC Palette Controls ...................................... 42 Figure 4.29: Logic Trigger Output Palette Controls .................................................. 43 Figure 4.30: Measurement Set Palette Controls ....................................................... 44 Figure 4.31: Measurement Advanced Palette Controls ........................................... 45 Figure 4.32: Cursor Control Panel Controls............................................................... 46 Figure 4.33: Cursor Palette Controls .......................................................................... 47 Figure 4.34: Save and Recall Front Panel Controls ................................................. 47 Figure 4.35: Save and Recall Palette Controls ......................................................... 48 Figure 4.36: Save and Recall Additional Controls .................................................... 49 Figure 4.37: Instrument Palette Controls.................................................................... 50 Figure 4.38: Graph Palette Controls ........................................................................... 52 Figure 4.39: Status Palette Controls ........................................................................... 54

0004-000062 7
List of Tables Table 4.1: Palette Organization ................................................................................... 18

8 0004-000062
Introduction
General The ZScope® M-Class Soft Front Panel is designed for use with all ZTEC® M-Class Oscilloscopes. ZScope® automatically detects any PCI, PXI or VXI instruments that are available and allows the user to dynamically switch the panel’s view and control between all available M-Class oscilloscopes. LXI instruments need to have their resource names added to the system through the ZFind™ utility before ZScope® will be able to see them. ZTEC® instruments of other classes and types have their own soft front panels. ZScope® is a Windows and Linux application. ZScope® provides a simulation mode which can be used whether or not instruments are available; however, most instrument functionality requires an active instrument.
Compatibility ZScope® M-Class Soft Front Panel revision 2.0 breaks compatibility with previous hardware firmware revisions. Hardware firmware revisions prior to 4.10 must use revision 1 soft front panels (ZScope® revision 1 is available for Windows™ only). Please visit ZTEC® Support at www.ztecinstruments.com/support for information on interface compatibility as well as for upgrade guides.
Instrument Interface It is ZTEC®’s philosophy that functionality is kept on the instrument. This keeps intelligence centralized and user interfaces simple. What this means to ZScope® is the user interface is merely a viewer; it is a graphical representation of states and functionality which reside on the instrument. There are a couple of side effects from this:
1. The instrument state may become un-synced from the states displayed in the panel. ZScope® does not have the ability to know when the instrument’s state is changed through another interface (such as driver calls or a second application). In order to ensure that ZScope® is accurate, it is necessary to re-sync the settings, using the provided button in the SETTINGS:INSTRUMENT tab, whenever the instrument has been changed outside of the application.
2. Not all ZScope states affect the instrument. Disabling waveform display, moving docks, disabling cursors, changing refresh rates and other display options only change the viewer settings, not the instrument. Opening ZScope® will disable the measurement error state to allow for invalid measurement warnings (see the M-Class DSO Instrument Manual for

0004-000062 9
more detail) and may also change the data format and byte order. Closing ZScope® has no affect on the instrument state.
3. Most functionality is not available in simulation mode.
There are also many benefits from this architecture, for instance, complex calculations will not tax the host computer and instrument capture rates are not slowed by viewing them in ZScope®. This also makes ZScope® a useful debugging tool. Opening ZScope® while debugging code makes it easy to view all instrument settings simultaneously and to see a visual representation of the captured data. Syncing the panel while stepping through code can make it easy to see what is changing and notice coerced values. Due to connection limitations, viewing the instrument with ZScope® while debugging code may not be possible with ZTEC®’s LXI instruments.
Design ZScope® is designed to mimic more traditional bench-top scopes in appearance, while also utilizing the inherent functionality allowed to a PC panel. This design is aimed to maximize ease of use for all users, including users who have only previously utilized bench-top scopes. The panel consists of five main areas:
1. Graph Display -Shows the captured waveforms 2. Palette Selects - Access Advanced User Controls 3. Measurement Display - Waveform measurements and scaling 4. Control Panel - Basic User Controls 5. Message Log - Displays error and other messages. Can be cleared by
pressing the button above the message display.
Figure 1.1: SFP Layout

10 0004-000062
The Control Panel (4) would be hard knobs and buttons on a traditional scope interface. The Graphical and Measurement Display areas (1, 3) would traditionally appear on a screen. Advanced functionality is in palettes that overlap the bottom of the Graph Display area (2). The next sections will describe the controls available on ZScope®. For explanations of instrument functionality, please see the instrument manual: MClassDSO_Instrument_Manual.pdf.

0004-000062 11
Graph Display
Figure 2.1: Graph Display Controls
Full Waveform Display
This graph is a display of the entire waveform as captured by the instrument. This waveform is always displayed at 1000 points resolution unless Actual Points is selected in SETTINGS:GRAPH.
12 0004-000062
Trigger Time Indicators The indicators show the trigger time in relation to each waveform display. The exact trigger time in relation to the center of the Main Waveform Display is also shown in the Horizontal Scale Display area. To center the Main Waveform Display at the trigger point, double click on the trigger time indicator from the Full Waveform Display. The trigger time can be changed by turning the Horizontal Position knob or by changing either Trigger Position control in the ACQUISITION:HORIZONTAL tab. It can also be adjusted by grabbing either of the indicators with the mouse and dragging them to a new location. When the position is changed, a secondary faded indicator will show the new position. This position will be used upon the next instrument capture. The original indicators will stay to show the trigger position of the current capture.
Zoom Window
The Zoom Window shows which part of the entire waveform is displayed on the Main Waveform Display. Use the mouse to change the position and size of the window:
1. Left Click – drag box to new position 2. Double Left Click – jump to selected position on Full Waveform 3. Right Click – zoom out one step 4. Shift-Right Click – zoom in one step. 5. Scroll Wheel – zoom in and out
Other zooming functionality is supported in the control panel. See Pan/Zoom Controls for control information.
Main Waveform Display
Displays a section of the waveform as selected by the zoom window, this waveform is always displayed at 1000 points resolution unless Actual Points is selected in SETTINGS:GRAPH. Waveforms displayed while running are always displayed at 1000 points. To achieve this point scale the waveform may be decimated or interpolated. Some waveforms, such as FFT or Histogram calculations may not be zoomed.

0004-000062 13
Trigger Level Indicators Indicators show the trigger level for active input channel trigger sources. When a trigger source is selected as one of the input channels (or pattern), a marker that is the same color as the selected channel(s) will appear to indicate the voltage level requested for the trigger event. Trigger levels are relative to the position of the waveform. Note the external trigger level is not indicated by a marker, as it has no associated waveform. The trigger level can be changed by left clicking on the indicator and dragging it to the desired level. Digital and knob controls are also available in the TRIGGER:LEVEL tab.
Horizontal Scale Display
Display for information about the horizontal settings of the Main Waveform Display. In the left column, the horizontal scale in seconds per division and Hertz per division are displayed. The right column shows the sample rate in samples per second and the offset between the center of the Full Waveform Display and the trigger position.
Filter State Display
This display shows an icon for any input channels with filtering enabled. The color and placement order of each indicator match those of the channels in other displays.
Cursors
Drag cursors to measure waveforms. Cursors can be enabled and the cursor source and snap state can be selected in the control panel. Note the selection of the cursor source affects the cursors’ scale.
Save/Recall Shortcuts
Click for fast save/recall access. Explanation, alternate and additional buttons are listed under SETTINGS:SAVE/RECALL.
Waveform Position Indicators
The indicators show the zero level of the associated waveform. Left Click and drag the indicator to change the position. The position can also be set digitally by setting the channel’s offset in the VERTICAL:OFFSET tab, or using the traditional Vertical Position knobs in the control panel. The most recently positioned waveform’s indicator appears on top. If a position is hidden under other indicators, use the knob or numeric control to adjust it and it will come to the top.

14 0004-000062
Vertical Scale Displays Displays a textual readout of the vertical scale of the associated channel on the Main Waveform Display. Units are dependent on the waveform type and are displayed in units per division. Note returned values from vertical scale commands are in total range, not scale per division. The vertical scale can be adjusted using the scale knob in the vertical section of the control panel.
Channel Display Enable
Selects whether or not the associated channel’s waveform is displayed on the graphs. Enabled channel displays will appear depressed and colored and will also show the Vertical Scale Display for that channel. This display does not affect instrument waveform capturing. This control only selects whether the captured waveform is visible or hidden. Hiding a waveform can make other waveforms easier to view, as well as speed up capturing as it reduces the number of bytes being read from the instrument every capture. Hidden waveforms can still be used for calculations and measurements.

0004-000062 15
Measurement Display
Measurement Sets
Figure 3.1: Measurement Display
Measurement Set Select
Select which set of measurements is displayed in the Measurement Display area. There are four sets of traditional measurements. Cursor measurements and limit test reports are also available in this area.
Measurement Source
This is a display of the source channel that the measurement is performed on. All measurement information is also displayed in the source channel’s color for additional clarity.
Measurement
This is a display of the type of measurement that is performed. A longer version of the measurement name can be seen in the associated Measurement Select control in the MEASURE:MEAS X tab.
Measurement Units Each measurement is displayed with the appropriate scientific units and
prefixes.
Measurement Status This display’s the measurement’s returned status. A green check
indicated no errors, an orange exclamation point indicates a warning of a possibly invalid measurement and a red X indicates a measurement that is invalid. See the instrument manual for a list of possible reasons for a measurement failure.

16 0004-000062
Measurement Result The measurement’s returned value. A value of “NAN” (Not A Number)
indicates that the measurement returned an invalid value.
Cursor Measurements
Figure 3.2: Cursor Measurement Display
Cursor Measurements are in the same format and window as regular measurements. The display shows the positions (x and y) of both cursors as well as the difference between the cursor positions. The measurements are the same color as the cursor source channel.
Note: Since both cursors’ scales and offsets are dependent upon the selected source channel, cursor measurements may appear incorrect when visually compared to other channels.
Limit Measurements
Figure 3.3: Limit Measurement Display
Limit Measurements become available in the Measurement Set Select when a calculation channel is set to perform limit testing. The display shows the limit test report for the associated calculation channel. Limit tests can be set up and the report statistics cleared in the VERTICAL:ADVANCED CALC tab.
0004-000062 17
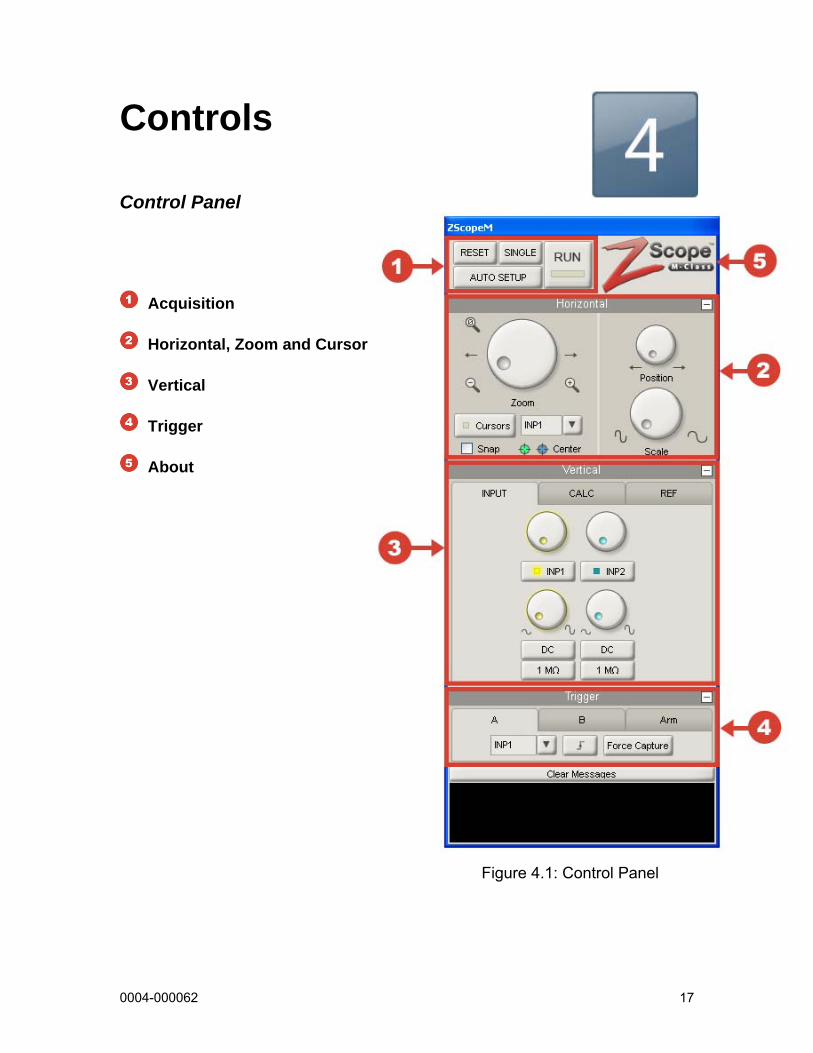
Controls
Control Panel
Acquisition
Horizontal, Zoom and Cursor
Vertical
Trigger
About
Figure 4.1: Control Panel

18 0004-000062
Palettes
Palette Tabs
Input
Calc
Calc Limit/Meas
Calc Mask
Vertical
Offset
Acquisition
Horizontal Acquisition
Segment
Trigger
Level Trigger
Pattern
Meas 1
Meas 2
Meas 3
Meas 4
Measure
Advanced
External Out Output
Logic Trigger Out
Save/Recall
Instrument
Graph Settings
Status Table 4.1: Palette Organization
Figure 4.2: Palette Selects

0004-000062 19
Figure 4.3: Sample Palette Tab
Active Palette Select An active Palette Select indicates the corresponding palette is currently
displayed. Clicking an active select will deselect the palette set, hiding the controls.
Active Tab
An active Tab indicates the corresponding tab is currently displayed. The active tab in a palette is saved when a palette is deselected and will remain active when the palette is re-selected.
Inactive Tab
Other tabs in the same palette can be brought forward by selecting the appropriate tab.
Minimize
Click to hide the palette view.
Inactive Select Select to change the currently displayed palette. Switching between palettes does not affect which tab is in the front of each palette.
20 0004-000062
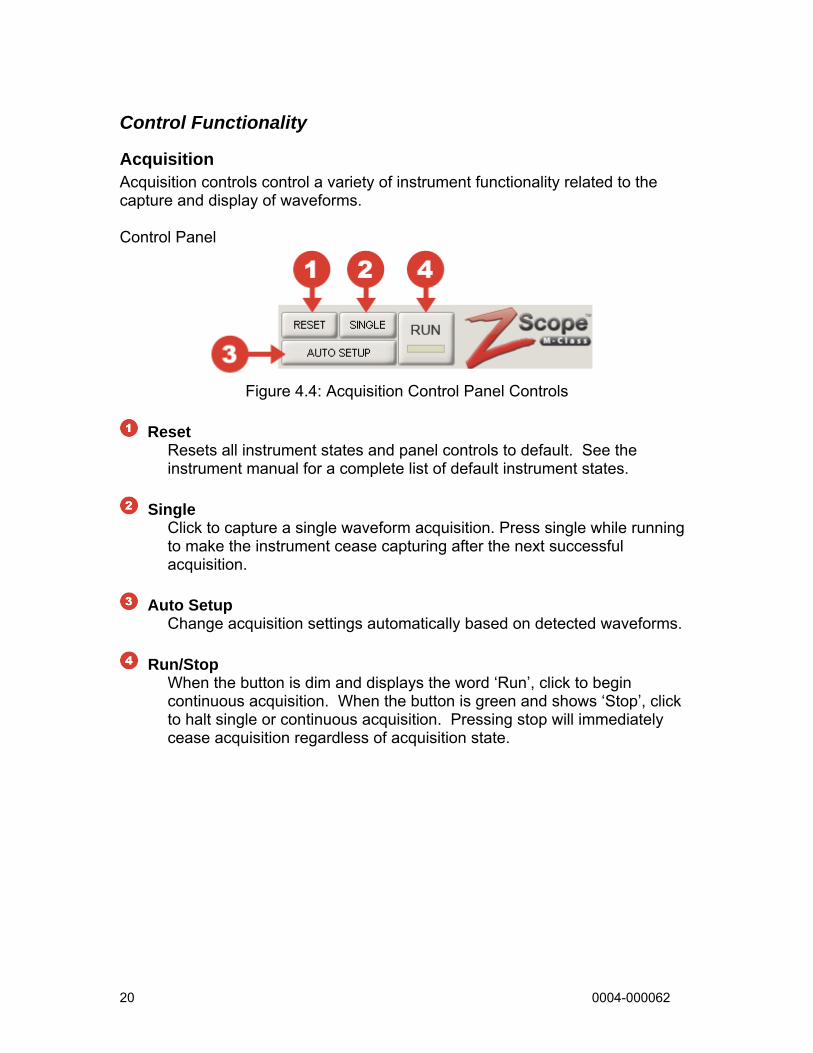
Control Functionality
Acquisition Acquisition controls control a variety of instrument functionality related to the capture and display of waveforms. Control Panel
Figure 4.4: Acquisition Control Panel Controls
Reset
Resets all instrument states and panel controls to default. See the instrument manual for a complete list of default instrument states.
Single
Click to capture a single waveform acquisition. Press single while running to make the instrument cease capturing after the next successful acquisition.
Auto Setup
Change acquisition settings automatically based on detected waveforms.
Run/Stop When the button is dim and displays the word ‘Run’, click to begin continuous acquisition. When the button is green and shows ‘Stop’, click to halt single or continuous acquisition. Pressing stop will immediately cease acquisition regardless of acquisition state.

0004-000062 21
Palette Tabs: ACQUISITION:ACQUISITION
Figure 4.5: Acquisition Palette Controls
Acquisition Type Select
Change the type of acquisition. Only one type can be selected at a time. Please see the instrument manual for descriptions of the acquisition types. Note available sample rates may change depending of the acquisition type selected.
Number of Acquisitions Select the number of acquisitions to use in averaging mode. This is only applicable for Average, Envelope and Equivalent Time acquisitions.
Envelope Select
Select the active waveform for envelope and peak detect waveforms: Minimum or Maximum. The envelope select affects measurements, saving and copying waveforms, and calculations.

22 0004-000062
Segmenting ZTEC M-Class oscilloscopes are capable of storing past captures for post-acquisition inspection. Palette Tabs: ACQUISITION:SEGMENT
Figure 4.6: Segment Palette Controls
Memory Mode
Set the memory mode to either Segment or Zoom. In Segment mode, many waveforms per channel may be captured and stored over time. In Zoom mode a single waveform per channel is captured utilizing maximum memory and sample rates. Expanded information on these modes can be found in the instrument manual.
Historical Segments
The number of available segments currently stored in memory. This number will reset if any changes are made to the acquisition parameters that are incompatible with old segments.
Displayed Segments
Select how many of the currently available segments to display at once.
Active Segment Select the segment to display and use for calculations and measurements. If more than one segment is selected in Displayed Segments, the displayed segments will begin with the active segment: for example, if Active Segment is 2 and the Displayed Segments is 4, segments 2, 3, 4 and 5 will be displayed.
0004-000062 23
Average View Select the average view. This option is only available in Average or Envelope acquisition modes. When Average is selected, the averaged or envelope waveforms are visible. When Segment is selected, the segments which form the averaged waveform are available. Note there is only one averaged waveform, so switching between active segments is not available in this view.
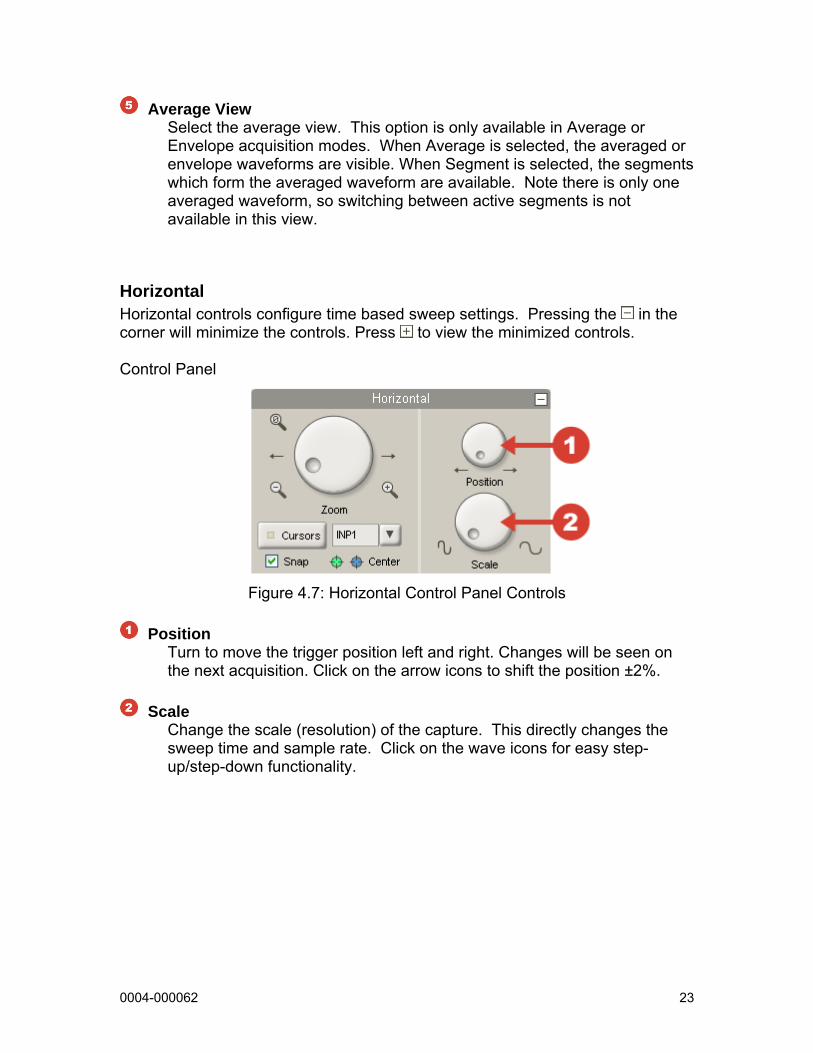
Horizontal Horizontal controls configure time based sweep settings. Pressing the in the corner will minimize the controls. Press to view the minimized controls. Control Panel
Figure 4.7: Horizontal Control Panel Controls
Position
Turn to move the trigger position left and right. Changes will be seen on the next acquisition. Click on the arrow icons to shift the position ±2%.
Scale
Change the scale (resolution) of the capture. This directly changes the sweep time and sample rate. Click on the wave icons for easy step-up/step-down functionality.

24 0004-000062
Palette Tabs: ACQUISITION:HORIZONTAL
Figure 4.8: Horizontal Palette Controls
Sweep Time
Set the total time interval captured in seconds.
Trigger Position - Time Set the position of the trigger relative to the waveform in seconds.
Sweep Points Select the number of points to capture.
Trigger Position - Percent
Set the position of the trigger relative to the waveform as a percentage of total waveform length.
0004-000062 25
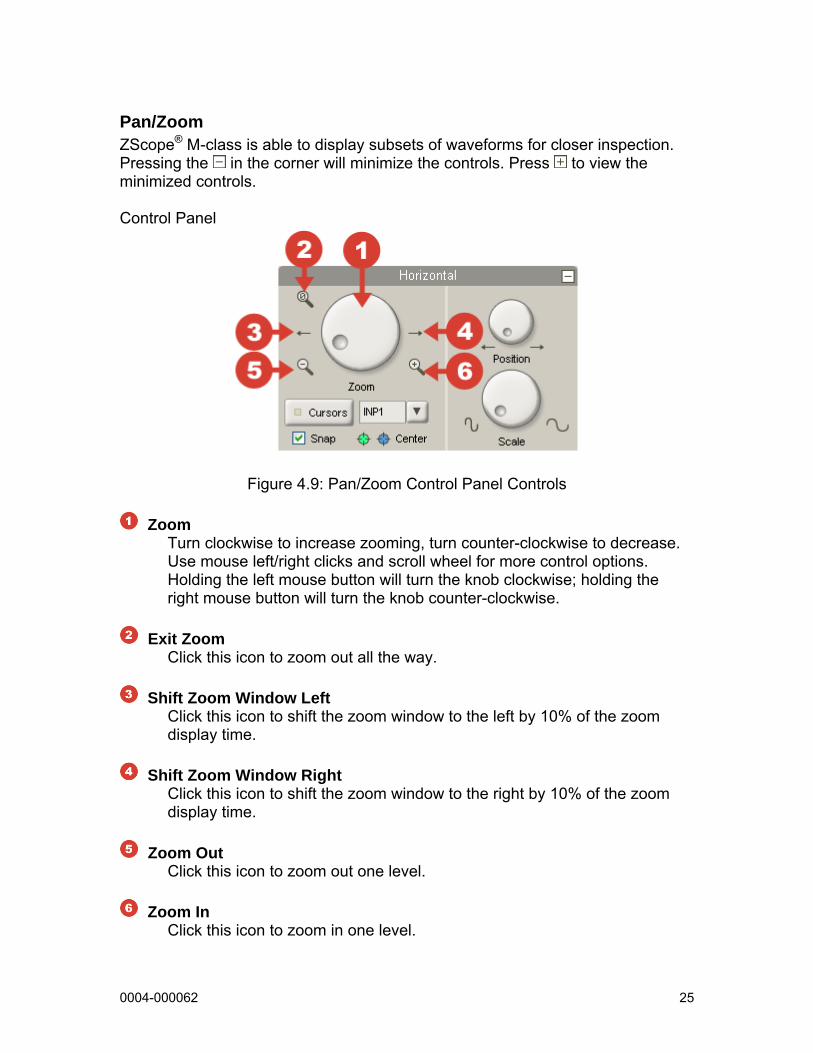
Pan/Zoom ZScope® M-class is able to display subsets of waveforms for closer inspection. Pressing the in the corner will minimize the controls. Press to view the minimized controls. Control Panel
Figure 4.9: Pan/Zoom Control Panel Controls
Zoom
Turn clockwise to increase zooming, turn counter-clockwise to decrease. Use mouse left/right clicks and scroll wheel for more control options. Holding the left mouse button will turn the knob clockwise; holding the right mouse button will turn the knob counter-clockwise.
Exit Zoom
Click this icon to zoom out all the way.
Shift Zoom Window Left Click this icon to shift the zoom window to the left by 10% of the zoom display time.
Shift Zoom Window Right
Click this icon to shift the zoom window to the right by 10% of the zoom display time.
Zoom Out
Click this icon to zoom out one level.
Zoom In Click this icon to zoom in one level.

26 0004-000062
Figure 4.10: Pan/Zoom Graph Controls
Zoom Window
Shows which part of the entire waveform is displayed on the Main Waveform Display. To change the displayed area, the window has four control options:
1. Left Click – drag box to new position 2. Double Left Click – jump to selected position on Full Waveform 3. Right Click – zoom out one step 4. Shift-Right Click – zoom in one step. 5. Scroll Wheel – zoom in and out
Trigger Time
The indicator shows the trigger time relative to the full waveform display. Double click this indicator to center the Zoom Window to the time of trigger.

0004-000062 27
Vertical Vertical settings configure basic channel options. Pressing the in the corner will minimize the controls. Press to view the minimized controls. Control Panel
Figure 4.11: Vertical Control Panel Controls
Channel Type Select
Tab to the set of desired channel controls. The choices are: input channels, calculation channels, or reference channels.
Channel Enable
Enables or disables the associated channel. Disabled channels will not be captured by the instrument.
Position
Change the position of the channel’s waveform display. Clicking and pulling the Waveform Position Indicator or setting the channel’s offset will also change the position of the channel’s waveform display.
Scale
Changes the channel’s vertical scale. See the Vertical Scale Displays on the left side of the panel. For input and calculation channels this will change the displayed waveform; reference channels are static codes and changing the scale will only change the preamble and the scale display.

28 0004-000062
PaletteTabs: VERTICAL:OFFSET
Figure 4.12: Vertical Palette Controls
Offset
The voltage offset of the associated channel. This value directly correlates to the channel position.

0004-000062 29
Input Channels Input channel settings configure the instrument front-end specifications for waveform capture. Pressing the in the corner will minimize the controls. Press
to view the minimized controls. Control Panel
Figure 4.13: Input Channel Control Panel Controls
Input Coupling
The input channel’s coupling: AC or DC.
Input Impedance The input channel’s impedance: 50Ω or 1 MΩ.
30 0004-000062
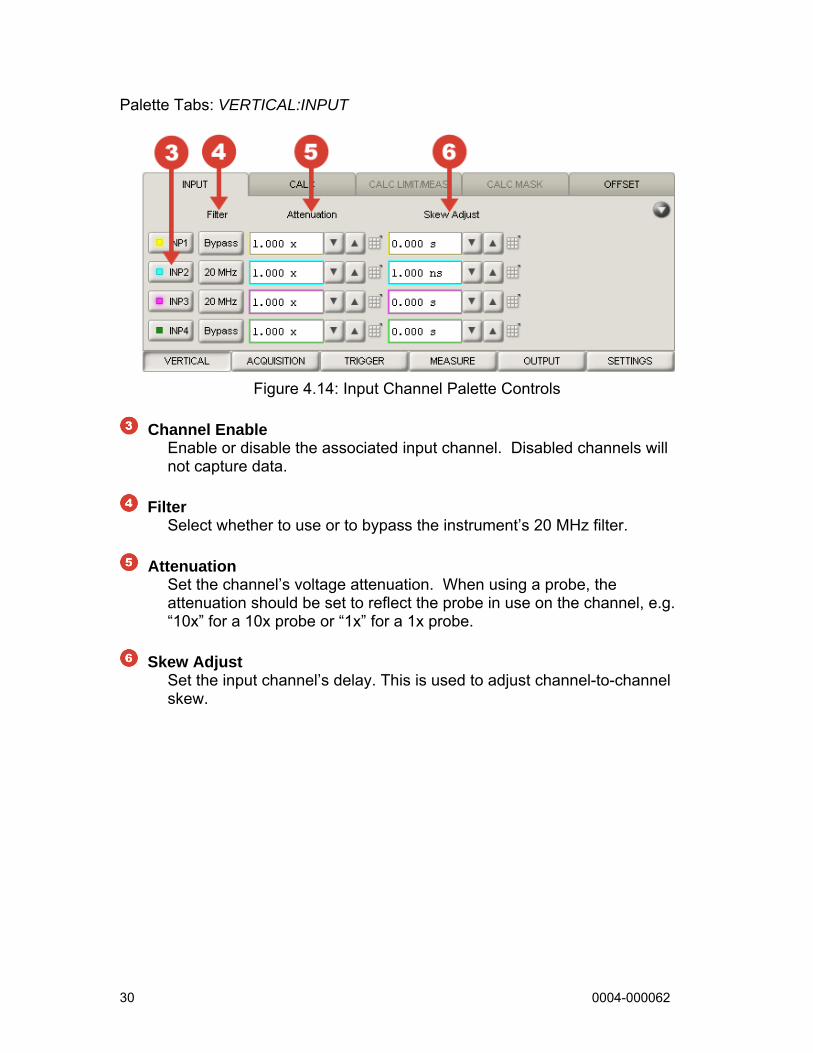
Palette Tabs: VERTICAL:INPUT
Figure 4.14: Input Channel Palette Controls
Channel Enable
Enable or disable the associated input channel. Disabled channels will not capture data.
Filter
Select whether to use or to bypass the instrument’s 20 MHz filter.
Attenuation Set the channel’s voltage attenuation. When using a probe, the attenuation should be set to reflect the probe in use on the channel, e.g. “10x” for a 10x probe or “1x” for a 1x probe.
Skew Adjust
Set the input channel’s delay. This is used to adjust channel-to-channel skew.

0004-000062 31
Calculations ZTEC® M-Class Oscilloscopes provide an extensive array of on-board calculations, all of which are available in ZScope®. PaletteTabs: VERTICAL:CALC
Figure 4.15: Calculation Channel Palette Controls
Channel Enable
Enable or disable the associated calculation channel. Disabled channels will not be re-calculated by the instrument.
Source 1
Select the first (or only) source used in the calculation
Operation Select the operation to be performed: Add, Subtract, Multiply, Absolute Value, Copy, Derivative, FFT, Histogram, Integral, Inverse, Limit Test, Measurement Trending, Smooth or No Operation.
Source 2
Select the second source used in two-source calculations.
Points Set the number of points to use for smoothing functions.
Window Select the FFT window type: Rectangular, Hamming, Hanning, Blackman or Flat Top.

32 0004-000062
Format Select the display format for FFT calculations: Linear, Logarithmic, Phase, Real or Imaginary.
Advanced Calculations Limit, mask, and measurement trending calculations require additional controls. These controls are provided in separate tabs which become available when a calculation channel’s operation is set to one of these functions. PaletteTabs: VERTICAL:CALC LIMIT/MEAS, VERTICAL:CALC MASK
Figure 4.16: Calculation Limit and Measurement Palette Controls
Note: This panel is only available when a calculation channel’s operation is
set to either limit testing or measurement trending.
Limit Test Set the measurement to use for a limit test. Mask testing is a subset of limit testing and can be selected in this menu.
Lower Limit
Set the lower limit for a limit test. This limit is a reference or calculation channel for mask testing.
Upper Limit
Set the upper limit for a limit test. This limit is a reference or calculation channel for mask testing.

0004-000062 33
Reset Statistics Reset the statistics returned in the limit test report. This also resets the
counter for the limit fail count.
Calculate Measurement Select the measurement to use for a measurement trending calculation.
Reset Reset the calculation measurement trend history.
Stop on Fail Number
Select the number of limit test failures until continuous acquisition is automatically halted. This will not affect captures in non-continuous mode.
Figure 4.17: Calculation Mask Palette Controls
Note: This panel is only available when a calculation channel’s operation is
set to mask testing. Limit Test gating is controlled by measurement gates.
Method
Change the gate method: Gated or Entire Waveform.
Gate Type Change the type of gate to: Time, Frequency, Points or Cursors.
Gate Start

34 0004-000062
Set the start limit for the mask gate. Units depend on gate type. In cursor gating this is determined automatically by the cursor positions.
Gate Stop
Set the stop limit for the mask gate. Units depend on gate type. In cursor gating this is determined automatically by the cursor positions.
Generate Masks
Generates masks for the calculation source and stores them in reference. Generated masks for calculation channels 1 or 3 are initially stored in reference channels 1 and 2. Generated masks for calculation channels 2 or 4 are initially stored in reference channels 3 and 4. Note two reference masks are required for each mask calculation. This means only 2 mask tests may be performed simultaneously unless one or more references are common.
Mask Vertical Offset Set the vertical offset to use for generated masks.
Mask Horizontal Offset
Set the horizontal offset to use for generated masks.

0004-000062 35
Trigger & Arm M-class scopes have many triggering options to allow the user to pinpoint the correct event for triggers. Control Panel
Figure 4.18: Trigger Control Panel Controls
Figure 4.19: Trigger B Control Panel Controls
Figure 4.20: Arm Control Panel Controls
Figure 4.21: Arm Alternate Controls
36 0004-000062
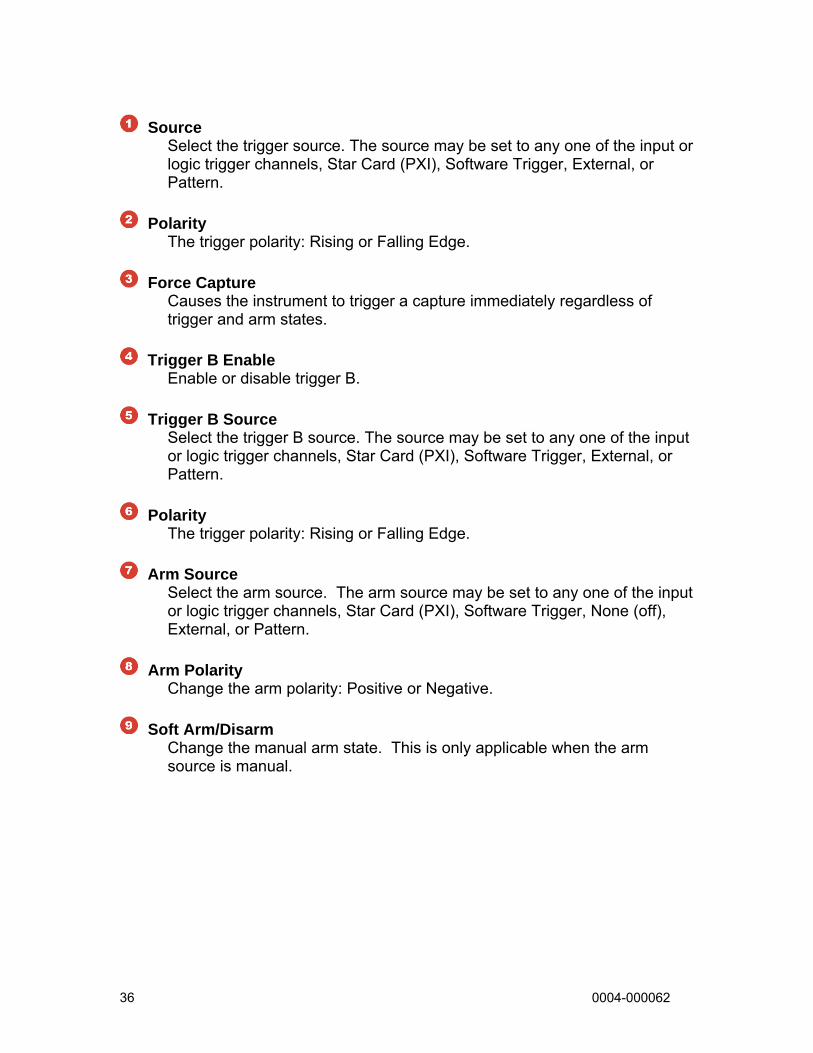
Source
Select the trigger source. The source may be set to any one of the input or logic trigger channels, Star Card (PXI), Software Trigger, External, or Pattern.
Polarity
The trigger polarity: Rising or Falling Edge.
Force Capture Causes the instrument to trigger a capture immediately regardless of trigger and arm states.
Trigger B Enable
Enable or disable trigger B.
Trigger B Source Select the trigger B source. The source may be set to any one of the input
or logic trigger channels, Star Card (PXI), Software Trigger, External, or Pattern.
Polarity
The trigger polarity: Rising or Falling Edge.
Arm Source Select the arm source. The arm source may be set to any one of the input or logic trigger channels, Star Card (PXI), Software Trigger, None (off), External, or Pattern.
Arm Polarity
Change the arm polarity: Positive or Negative.
Soft Arm/Disarm Change the manual arm state. This is only applicable when the arm
source is manual.

0004-000062 37
Palette Tabs: TRIGGER:TRIGGER, TRIGGER:LEVEL
Figure 4.22: Trigger Palette Controls
Trigger Type
The type of trigger event: Edge, Pulse Width, Video or Glitch.
Holdoff Set the holdoff time to wait before accepting trigger events.
Count
Set the number of trigger events to occur before triggering
Soft Trigger A Bypasses trigger A in the trigger processing, regardless of its count. This does not affect trigger B settings, but will allow events though to trigger B, as if trigger A count was satisfied.
Trigger Mode
The acquisition triggering mode: Normal or Automatic. Automatic will perform a capture even if no trigger event occurs. Normal mode will wait indefinitely for a trigger event. This can be manually activated by pressing the Force Capture button.
External Impedance The impedance of the external input: 50 Ω or 1 MΩ.

38 0004-000062
Figure 4.23: Trigger Level Palette Controls
Trigger Level
Set the trigger voltage levels associated with the input and external trigger sources. Input channel trigger levels can also be changed by clicking and dragging the Trigger Level Indicators on the Graphical Display area.
0004-000062 39
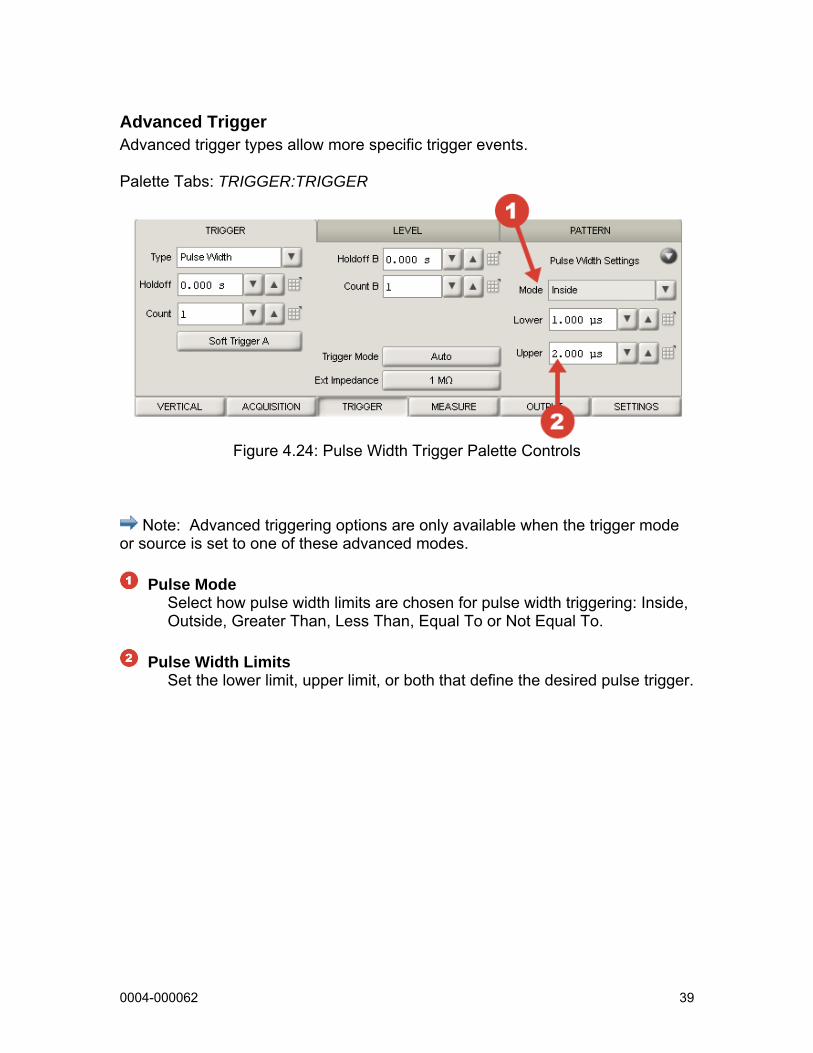
Advanced Trigger Advanced trigger types allow more specific trigger events. Palette Tabs: TRIGGER:TRIGGER
Figure 4.24: Pulse Width Trigger Palette Controls
Note: Advanced triggering options are only available when the trigger mode or source is set to one of these advanced modes.
Pulse Mode
Select how pulse width limits are chosen for pulse width triggering: Inside, Outside, Greater Than, Less Than, Equal To or Not Equal To.
Pulse Width Limits
Set the lower limit, upper limit, or both that define the desired pulse trigger.
40 0004-000062
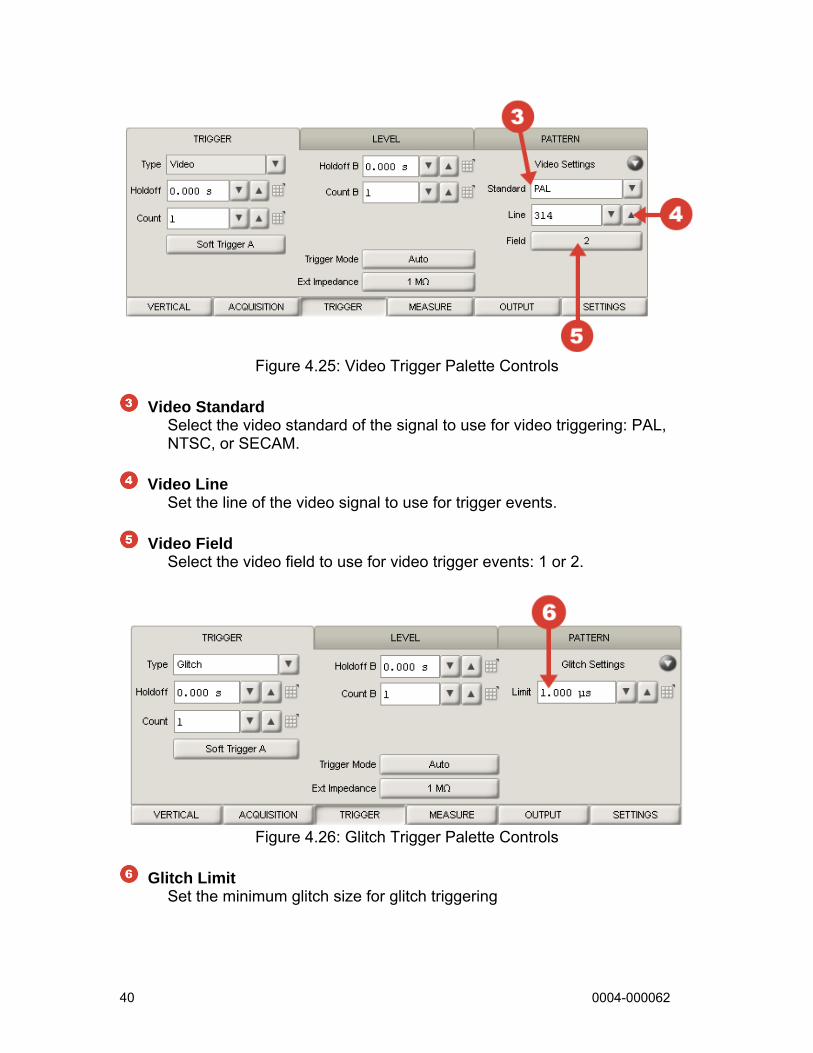
Figure 4.25: Video Trigger Palette Controls
Video Standard
Select the video standard of the signal to use for video triggering: PAL, NTSC, or SECAM.
Video Line Set the line of the video signal to use for trigger events.
Video Field Select the video field to use for video trigger events: 1 or 2.
Figure 4.26: Glitch Trigger Palette Controls
Glitch Limit
Set the minimum glitch size for glitch triggering

0004-000062 41
Pattern Trigger ZTEC M-class scopes can trigger based on the state of multiple sources, this common pattern trigger source can be used for triggering and/or arming the instrument. Palette Tabs: TRIGGER:PATTERN
Figure 4.27: Advanced Trigger Palette Controls
Pattern Mask Enable or disable a source that is used for pattern triggering. If a source is
masked as off, the pattern trigger does not care about its state.
Pattern Logic Set the logical state for the pattern source: High or Low. A pattern source will activate a trigger or arm event when all enabled sources match their selected logic states.

42 0004-000062
Outputs External and backplane logic trigger outputs provide basic clock, pulse and event driven pulse outputs. Palette Tabs: OUTPUT:EXTERNAL OUT, OUTPUT: LOGIC TRIGGER OUT
Figure 4.28: External Output and ROSC Palette Controls
External Output Enable Enable or disable the external output.
External Output Source
Select the source for the external output: Arm Event, Trigger Event, Trigger A Event, Trigger B Event, Capture Complete, Operation Complete, Master Summary Status, Constant State, Reference, Limit Test Success Event, Probe Compensation, Pulse or Clock.
External Output Polarity
Click to change the polarity of the external output: Positive or Negative.
External Output Pulse Period Set the clock or pulse period for the external output. Only available if
external output source is set to Clock or Pulse.
Output Event Width Select the width for event driven pulses on the external output or logic trigger outputs. Event driven pulses come from the following sources: Arm Event, Trigger Event, Trigger A Event, Trigger B Event, Capture Event, Operation Complete, Master Summary Status, and Limit Test Success.

0004-000062 43
Reference Oscillator Source Select the source for the reference oscillator: Internal, External, or Clock 10.
Reference Oscillator Frequency This displays the current reference oscillator frequency.
Reference Oscillator Output Enable Enable or disable the output from the reference oscillator output. (PCI only)
Figure 4.29: Logic Trigger Output Palette Controls
Logic Trigger Output Enable
Enable or disable TTL and ECL(VXI only) trigger outputs.
Logic Trigger Output Source Select the source for the TTL and ECL(VXI only) trigger outputs: Arm Event, Trigger Event, Trigger A Event, Trigger B Event, Capture Event, Operation Complete or Constant State.
Logic Trigger Output Polarity
Select the polarity of the TTL and ECL(VXI only) trigger outputs: Positive or Negative.
44 0004-000062
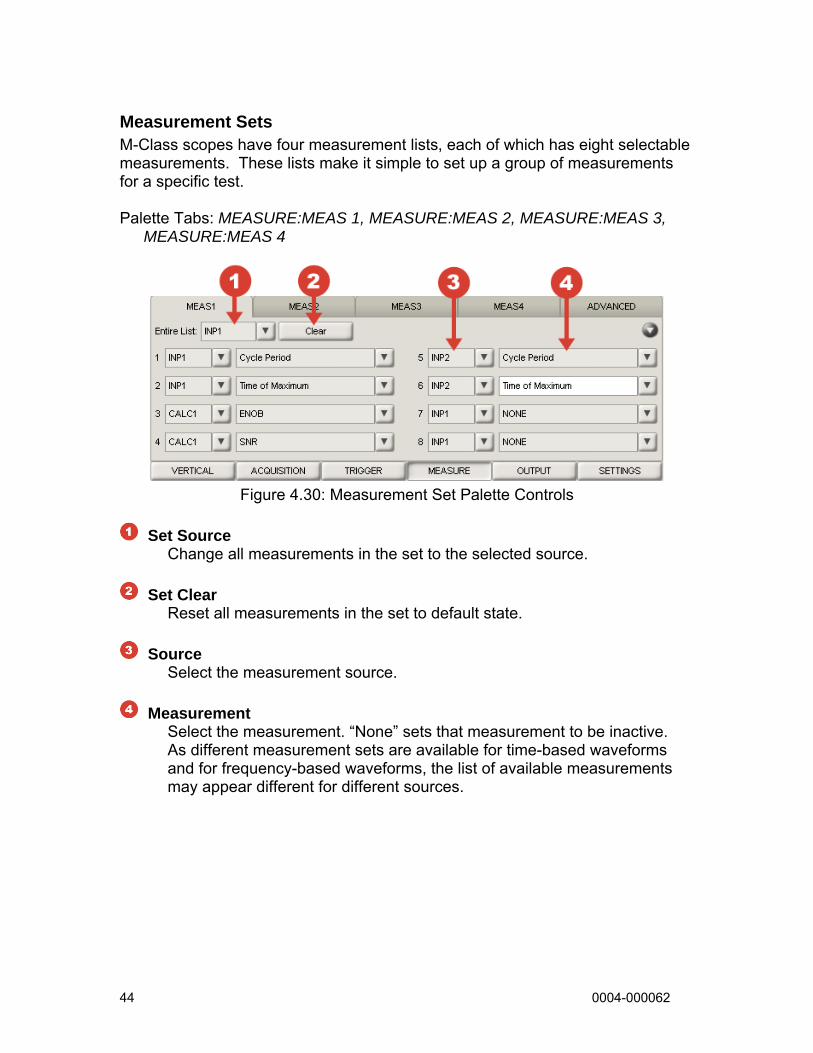
Measurement Sets M-Class scopes have four measurement lists, each of which has eight selectable measurements. These lists make it simple to set up a group of measurements for a specific test. Palette Tabs: MEASURE:MEAS 1, MEASURE:MEAS 2, MEASURE:MEAS 3,
MEASURE:MEAS 4
Figure 4.30: Measurement Set Palette Controls
Set Source
Change all measurements in the set to the selected source.
Set Clear Reset all measurements in the set to default state.
Source Select the measurement source.
Measurement Select the measurement. “None” sets that measurement to be inactive. As different measurement sets are available for time-based waveforms and for frequency-based waveforms, the list of available measurements may appear different for different sources.

0004-000062 45
Measurement Options Advanced measurement options allow for the customization of measurement data. Palette Tabs: MEASURE:ADVANCED
Figure 4.31: Measurement Advanced Palette Controls
Measurement Method
Set the measurement method: Gated or Entire Waveform.
Gate Type Select the type of gate to use for gated measurements: Time, Frequency,
Points or Cursors.
Gate Limits Set the limits for the measurement gate. Units depend on gate type. Not
available for cursor gating as the limits are determined by the cursor positions.
Measurement Reference
Change the measurement reference: Voltage(absolute) or Percent(relative).
Reference Levels
Set the reference levels in either units or percent.
Edge Number Select the number of the edge to use for edge measurements.
46 0004-000062
Nth Maximum Select the number of the maximum to use for maximum and time of maximum measurements.
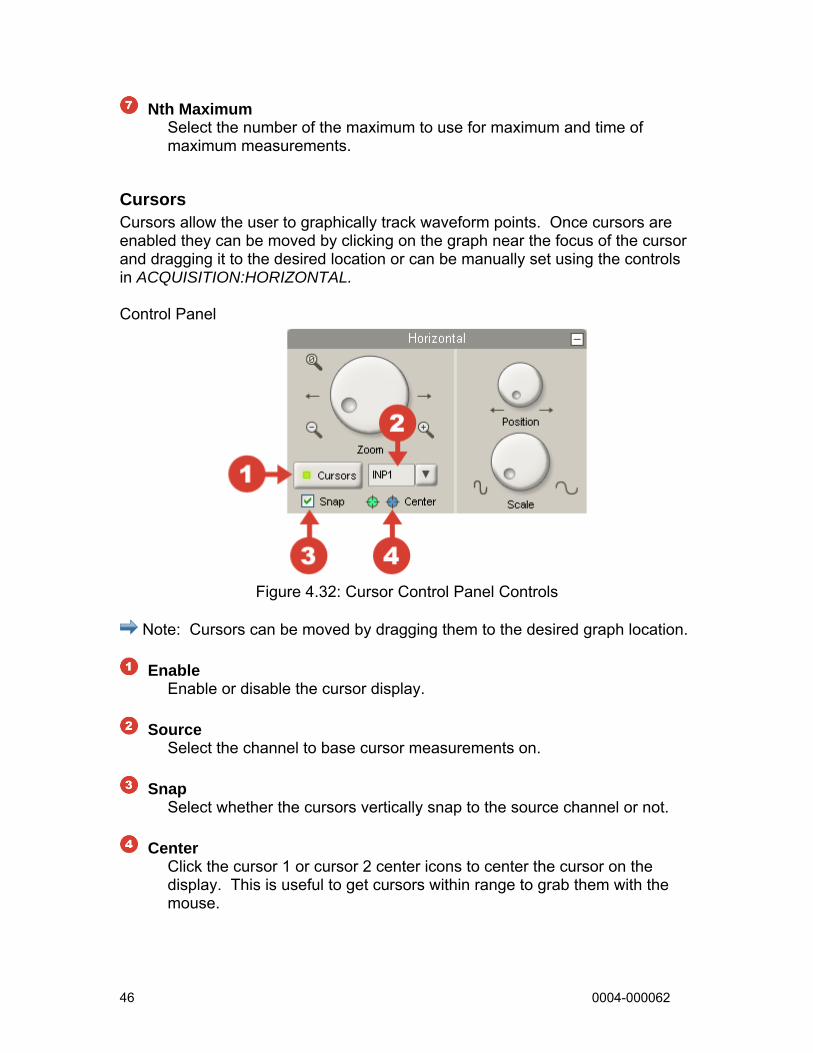
Cursors Cursors allow the user to graphically track waveform points. Once cursors are enabled they can be moved by clicking on the graph near the focus of the cursor and dragging it to the desired location or can be manually set using the controls in ACQUISITION:HORIZONTAL. Control Panel
Figure 4.32: Cursor Control Panel Controls
Note: Cursors can be moved by dragging them to the desired graph location.
Enable
Enable or disable the cursor display.
Source Select the channel to base cursor measurements on.
Snap Select whether the cursors vertically snap to the source channel or not.
Center Click the cursor 1 or cursor 2 center icons to center the cursor on the
display. This is useful to get cursors within range to grab them with the mouse.

0004-000062 47
Palette Tabs: ACQUISITION:HORIZONTAL
Figure 4.33: Cursor Palette Controls
Cursor 1 Position Set the horizontal position of cursor 1 to a specific value.
Edge Number Set the horizontal position of cursor 2 to a specific value.
Save and Recall Save and Recall functionality allows for waveforms and instrument settings to be stored either on the instrument or externally in comma separated value (.csv) files. Due to the memory architecture of M-Class instruments, it is not possible to save or upload waveforms while the instrument is capturing. Front Panel
Figure 4.34: Save and Recall Front Panel Controls

48 0004-000062
Tabs: SETTINGS:SAVE/RECALL
Figure 4.35: Save and Recall Palette Controls
Save Waveform to File
Save a waveform’s data in a comma separated value file (.csv).
Load Waveform from File Load a waveform from a .csv file to a reference channel.
Copy Waveform to Reference
Copy a waveform from any instrument channel to a reference channel.
Save Screenshot Save an image file of the graph and displayed measurements.
Save All Waveforms to File Save all active channels to a single .csv file.
Save Instrument Settings to Instrument
Save the current instrument settings and store them on the instrument.
Recall Instrument Settings from Instrument Change the instrument’s settings to match those stored previously.
Save Instrument Settings to File
Save the current instrument settings in a .csv file.
Recall Instrument Settings from File Change the instrument’s settings to match those in a .csv file.
0004-000062 49
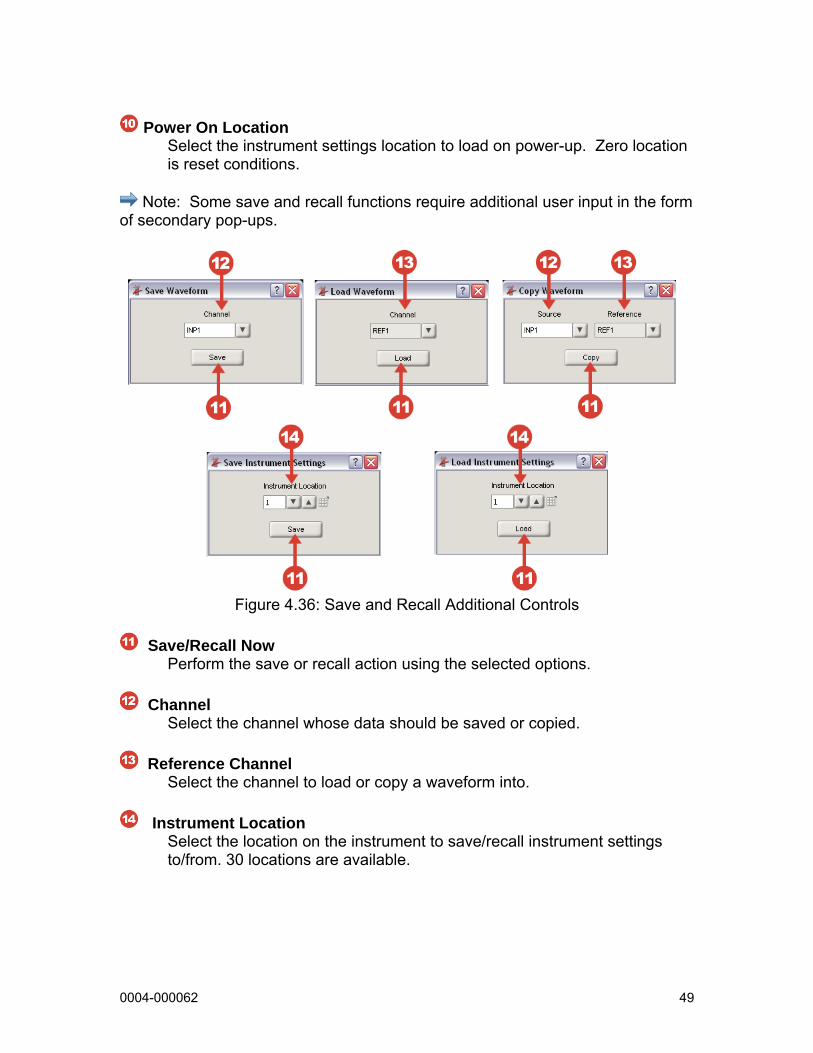
Power On Location
Select the instrument settings location to load on power-up. Zero location is reset conditions.
Note: Some save and recall functions require additional user input in the form
of secondary pop-ups.
Figure 4.36: Save and Recall Additional Controls
Save/Recall Now
Perform the save or recall action using the selected options.
Channel Select the channel whose data should be saved or copied.
Reference Channel Select the channel to load or copy a waveform into.
Instrument Location Select the location on the instrument to save/recall instrument settings to/from. 30 locations are available.

50 0004-000062
Instrument The instrument tab controls instrument communication and advanced commands. Palette Tabs: SETTINGS:INSTRUMENT
Figure 4.37: Instrument Palette Controls
Instrument Location
Select the location of the instrument that the panel is talking to. To add LXI instruments that are not in the list, close the ZScopeM® interface and use the Add utility in ZFindTM; see the Adding an Instrument section of the ZFindTM User’s Guide for more detail. Instruments may also be selected when launching ZScopeM ® from the command-line. LXI instruments still need to be added in ZFind TM to use them through this feature. To select an instrument from the command-line, simply type the resource string as an argument. For example, to select a VXI instrument, the command may be as follows:
ZScopeM VXI0::19::INSTR
Instrument Information This area displays information describing the instrument.
Status This LED indicates the instrument communication status. A red LED
indicates that the instrument communication session has failed.
Temperature This is a display of the instrument temperature in degrees Celsius.

0004-000062 51
Identify Self Cause the instrument’s HST (PCI, PXI and VXI) or LAN (LXI) light to flash until clicked again.
Find Refresh the list of instruments in the Instrument ID pull down.
Sync Update all panel values with current instrument state.
Communicate
Attempt to establish an instrument communication session. This is only necessary if the status LED indicates that there is not currently a successful session.
Clear Memory
Clear flash memory including reference channels.
Undo Undo an instrument reset, auto setup or state recall.
Self Calibrate
Perform instrument self calibration. This operation may take several minutes.
Restore Calibration
Return instrument to factory calibration settings. This operation may take several minutes.
Self Test
Perform an instrument self test. This operation may take several minutes.

52 0004-000062
Graph Options Graph options control settings related only to the display of waveforms and do not change acquisition settings. PaletteTabs: SETTINGS:GRAPH
Figure 4.38: Graph Palette Controls
Waveform Auto Spread Automatically position all displayed waveforms a set distance apart.
Waveform Auto Center
Automatically position all displayed waveforms in the center of the display
Spread Divisions Set the number of divisions to spread waveforms apart when automatically
spreading them. Spread Divisions is limited to 10 (the full graph).
Resolution Change the waveform display resolution. In Normal resolution, all waveforms in the main graph display are shown at 1000 points. This may require decimation or interpolation of the waveform data. In Real resolution all available real points are shown. Real resolution may slow waveform downloads for large waveforms.

0004-000062 53
Refresh Rate Set the maximum rate at which to acquire and display new waveforms while in run mode. Auto selects the predefined panel refresh rate. Manual allows the user to select a specific rate. Auto rate is set at 5 captures a second. Keeping the rate low allows measurements to be read, and limits the amount of CPU processing required for the application. This rate is NOT the rate at which waveforms are captured by the instrument, it is only the rate at which waveforms are downloaded from the instrument and displayed in the application. The instrument will capture at the maximum rate possible based on the current acquisition settings.
Maximum Refreshes per Second Set the maximum number of new waveforms to display each second while in run mode. Only available if the refresh rate is set to Manual.
Point Style
Select the style in which to draw plots: Points or Line.
Grid Lines Select which grid lines are shown on the graph display.
Graph Color
Adjust the background and grid line colors.
54 0004-000062
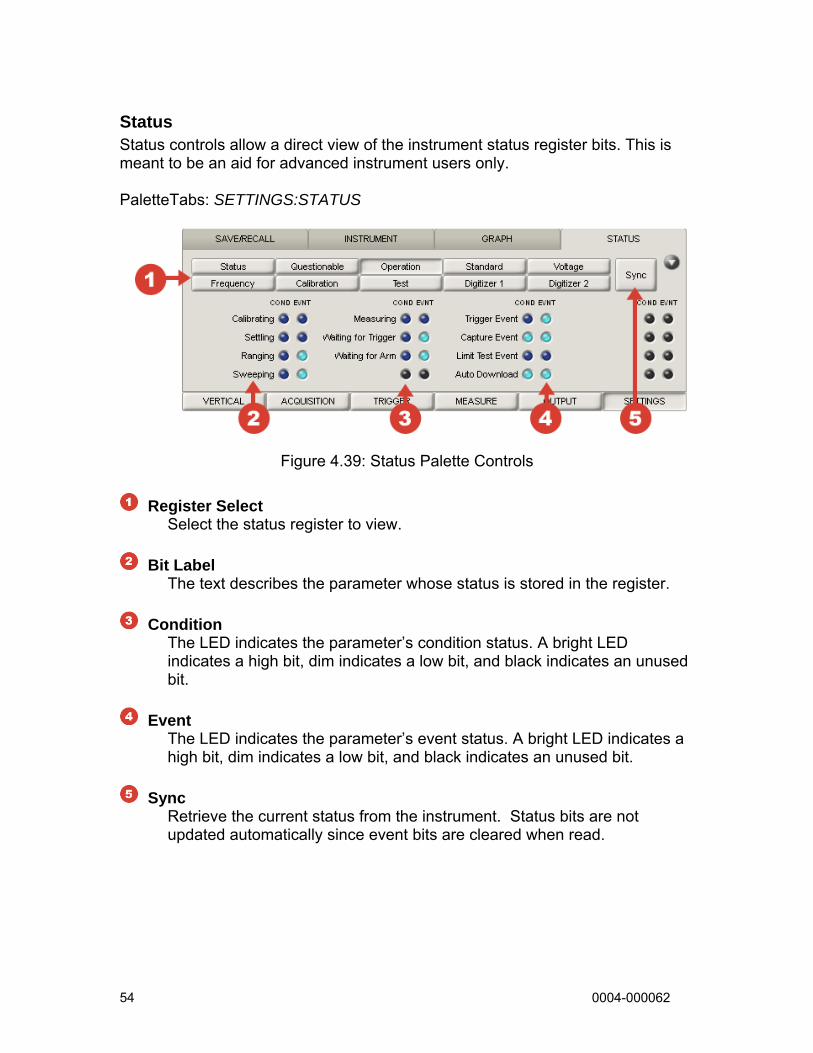
Status Status controls allow a direct view of the instrument status register bits. This is meant to be an aid for advanced instrument users only. PaletteTabs: SETTINGS:STATUS
Figure 4.39: Status Palette Controls
Register Select Select the status register to view.
Bit Label
The text describes the parameter whose status is stored in the register.
Condition The LED indicates the parameter’s condition status. A bright LED indicates a high bit, dim indicates a low bit, and black indicates an unused bit.
Event
The LED indicates the parameter’s event status. A bright LED indicates a high bit, dim indicates a low bit, and black indicates an unused bit.
Sync Retrieve the current status from the instrument. Status bits are not updated automatically since event bits are cleared when read.

0004-000062 55
ZTEC® Instruments
®