Embed Size (px)
Citation preview
WOMEN AND MENin Bosnia and Herzegovina
Agency for Statistics of Bosnia and Herzegovina
Tematski biltenThematic Bulletin
Sarajevo, 2009
ISSN 1840-104X
Bosna i HercegovinaBosnia and Herzegovina
Agencija za statistikuBosne i Hercegovine
ŽENE I MUŠKARCIu Bosni i Hercegovini
Sarajevo, 2009

Izdaje i štampa: Agencija za statistiku Bosne i Hercegovine, Sarajevo, Zelenih beretki 26.
Published and printed by: Agency for Statistics of Bosnia and Herzegovina, Sarajevo, Zelenih beretki 26.
Telefon / Phone: +387 33 22 06 26 Fax / Phone: +387 33 22 06 22 E-mail / E-mail: [email protected]
Internet stranica / Web site: www.bhas.ba
Odgovara: ����������� ��direktor
Person responsible: ������������� �����irector
Tabele pripremila: ������� �����������������������������
������������������������ �����������������������������
Dizajn korica: Alen Mrgud � ����������������������
Priprema za štampu: Aziz Vreto
Editing: Aziz Vreto
Molimo korisnike Biltena da prilikom upotrebe podataka obavezno navedu izvor Users are kindly requested to state the source

������� CONTENTS
Predgovor 5 Foreword ���� ������������ 6 Abbrevations and symbols Metodološka objašnjenja 7 Notes on methodology �������!�������"��#���$%���#���&����� 11 Population, births, deaths and marriages Obrazovanje 36 Education Zaposleni i lica koja ���'����(�����#� 45 Employees and persons looking for employment Socijalna zaštita – korisnici i ustanove 66 Social welfare – beneficiaries and institutions )�����'���� 75 Living conditions *���/�������� 78 Political power Rezultati Lokalnih izbora 2008. 83 Results of Local elections 2008. *�����$"� 89 Administration of justice


PREDGOVOR
FOREWORD
Agencija za statistiku Bosne i Hercegovine ��� ������put, u kontinuitetu, objavljuje publikaciju “����� � ������ �� ����� ����� ����� �������� �� �������������������������������������������������! Publikacija se sastoji od slij���"�� ���������#�stanovništvo i vitalne statistike, obrazovanje, za����������� ��������� �������� ������ ������� �����������������������$������������%&&'!��������(�! U njoj ������������������)���������������������������������������� ��� ���� �������� ���� ���� �)� ����� ��im korisnicima zainteresovanim ��� �������� ����� �muškaraca i za jednakost spolova u Bosni i Hercegovini. Zakon o ravnopravnosti spolova u Bosni i Hercegovini donesen je 2003. �����!� *����� ��(����� �� ���� i štiti jednakopravnost spolova i garantuje jednake ���"����� �� � ��(�� ��� ����� �� �������� ����� � ��privatnoj sferi druš���������������������������������diskriminaciju zasnovanu na spolu. +��������-'!�����������������������������������������)� �������������������������������������(����������� � ���� �� ��� �� � ��� ��� ���� � ������ �� �ustanova ��� ����� � � ����� � ������" �� �ostalim subjektima, moraju biti iskazani po spolu. 1�"��������������������������������������������������������������������4�����������������������������������"�� ���������� ���� �������!� 5���� �� ��������������������������������������������������ime navedeno ispod tabela i grafikona. Ovi podaci ������������������������������� ��������u našem društvu. S ciljem poboljšanja narednih izdanja, sve primjedbe i sugestije su dobrodošle.
The Agency for Statistics of Bosnia and Herzegovina, in continuity, publishes fourth publication “Women and Men in BiH” consisted of different statistical and other field data classified by sex. The publication consists of the following chapters: population and vital statistics, education, employment, social welfare, living conditions, political power, Local Elections 2008 and administration of justice. The publication presents tables and graphs without any additional data analyses and could serve as a source of information to all users interested in position of women and men, as well as in gender equality in Bosnia and Herzegovina. Gender Equality Act was adopted in 2003 in Bosnia and Herzegovina. It regulates, promotes and protects gender equality and defines equal opportunities to all citizens in all spheres of public and private life, and prevents direct and indirect discrimination based on sex. Article 18 of this Act says that all statistical data and information collected, recorded and processed by state authorities at all levels, public administration bodies and institutions, state and private agencies and other entities shall be classified by sex. Most of the data presented in this publication are results of statistical surveys of the Agency for Statistics of BiH and of available statistical documents. A minor part of the data has been taken from other state institutions, the names of which are stated bellow tables. This data are giving a brief overview of position of women and men in the society. All comments and suggestions contributing to better quality of future publications are very much welcomed.
*������5����" Direktor / �����!�
Agencija za statistiku BiH / Agency for Statistics of BiH
�����������������������������������������Žene i muškarci u Bosni i Hercegovini 5Women and Men in Bosnia and Herzegovina
�;��<�=�>�����=�;?@����� �;��<�=�>� BiH Bosna i Hercegovina FBiH Federacija Bosne i Hercegovine RS Republika Srpska 6��������6��������� SKD Standardna klasifikacija djelatnosti �=�;?@� - nema pojave ( ) podatak je manje siguran (( )) podatak je nesiguran :������������������������� ���������� 000 hiljada
¹ znak za napomenu * komentar
ABBREVATIONS AND SYMBOLS ABBREVATIONS BiH Bosnia and Herzegovina
FBiH Federation of Bosnia and Herzegovina
RS Republic of Srpska
�"������� "������!���!
SCEA Standard classification of economic activities SYMBOLS - no occurence of event ( ) less accurate estimate (( )) inaccurate estimate #�����������$!��%������������!����!� 000 thousand
¹ footnote * comment
�����������������������������������������6 Žene i muškarci u Bosni i Hercegovini
Women and Men in Bosnia and Herzegovina
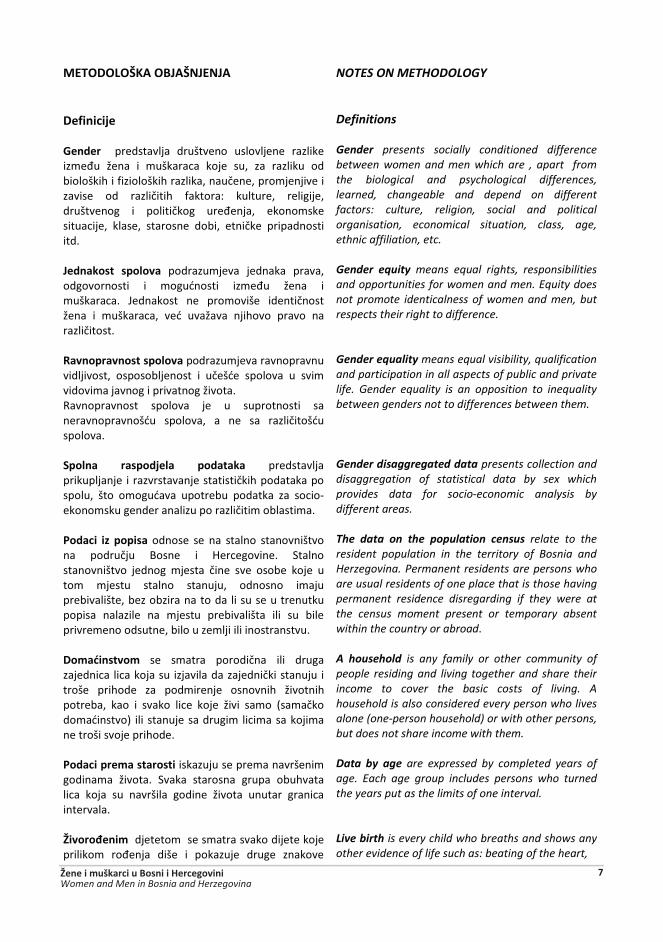
�C?�?J?K;��?N��K=��=�� Definicije Gender predstavlja društveno uslovljene razlike � �(�� ����� � �������� ����� ���� ��� ������ ������������)�������������������������� �������������� ��� ������� )�����#� �������� ����������������� � ��������� ��(������ ����� ����situacije�� ������� �������� ����� ������� ���������itd. ���������� �(������ podrazumjeva jednaka prava, ����������� � ���"����� � �(�� ����� � �������!� <��������� ��� �� ����� ��������������� � ��������� ��"� �������� ������� ����� �����������!� Ravnopravnost spolova podrazumjeva ravnopravnu ���������� ��������������� � ����"�� �������� �� �� ����� �����������������������!� Ravnopravnost spolova je u suprotnosti sa ������������"�� ��������� �� ��� ��� �������"��spolova. Spolna raspodjela podataka predstavlja ����������� ������������������������������������������ ���� � ���"���� �������� �������� ��� ����-����� ������������������������� ������� �! Podaci iz popisa odnose se na stalno stanovništvo ��� �������� ���ne i Hercegovine. Stalno ������������ ������� ������ ���� ���� ������ ����� ��tom mjestu stalno stanuju, odnosno imaju prebivalište, bez obzira na to da li su se u trenutku popisa nalazile na mjestu prebivališta ili su bile privremeno odsutne, bilo u zemlji ili inostranstvu. ��%� �����%� ��� � ���� �������� �� �������������� ������������ ��������������������������� ������ ������ ��� ��� ����� �������� ��������������� ���� � ������ ���� ����� ��� �� �� =�� ������� �"�����>� �� �������������� � �� ���� kojima ne troši svoje prihode. Podaci prema starosti iskazuju se prema navršenim ����� �� �����!� ?����� �������� ����� ������������� ����� ��� ������� ������ ������ ������ ������intervala. �����"��%� djetetom se smatra svako dijete koje prilikom r�(����� ���� � ��������� ����� ��������
NOTES ON METHODOLOGY
Definitions Gender presents socially conditioned difference between women and men which are , apart from the biological and psychological differences, learned, changeable and depend on different factors: culture, religion, social and political organisation, economical situation, class, age, ethnic affiliation, etc. Gender equity means equal rights, responsibilities and opportunities for women and men. Equity does not promote identicalness of women and men, but respects their right to difference. Gender equality means equal visibility, qualification and participation in all aspects of public and private life. Gender equality is an opposition to inequality between genders not to differences between them. Gender disaggregated data presents collection and disaggregation of statistical data by sex which provides data for socio-economic analysis by different areas. The data on the population census relate to the resident population in the territory of Bosnia and Herzegovina. Permanent residents are persons who are usual residents of one place that is those having permanent residence disregarding if they were at the census moment present or temporary absent within the country or abroad. A household is any family or other community of people residing and living together and share their income to cover the basic costs of living. A household is also considered every person who lives alone (one-person household) or with other persons, but does not share income with them. Data by age are expressed by completed years of age. Each age group includes persons who turned the years put as the limits of one interval. Live birth is every child who breaths and shows any other evidence of life such as: beating of the heart,
�����������������������������������������Žene i muškarci u Bosni i Hercegovini 7Women and Men in Bosnia and Herzegovina
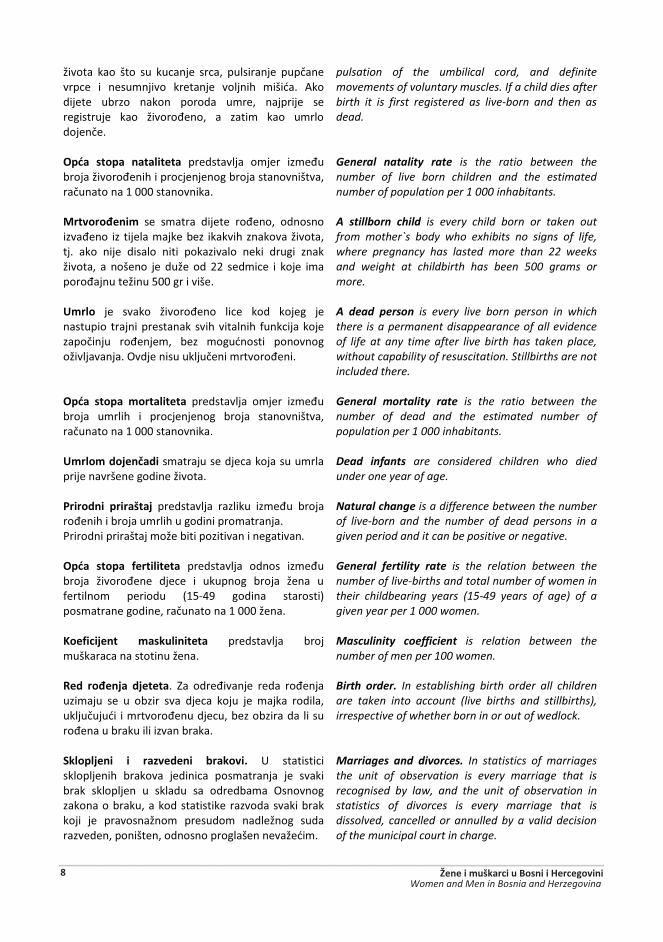
������ ���� ���� ��� �������� ����� ��������� ������������� � ���� ����� �������� ������� �"�!� 4���dijete ubrzo nakon poroda umre, najprije se �������� ���� ����(����� �� ��� � ���� � ����������!� ?( �� ���(�� ��������a ����������� � ��� � �(�����������(����������������������������������������������-�&&&����������! ������"��%� ��� � ���� ������ �(����� �����������(���� �� ������ ��������� ���������������������tj. ako nije disalo niti pokazivalo neki drugi znak ������� �� ������� ��� ����� ��� %%� ��� ��� � ����� �����(�����������C&&�������! Umrlo ��� ������ ����(���� ���� ���� ������ ���nastupio trajni prestanak svih vitalnih funkcija koje ��������� �(���� �� ���� ���"����� ��������������������!�E������������������ ����(��!� ?( �� ���(�� %��������� ����������� � ��� � �(��broja umrlih i procjenjenog broja stanovništva, �����������-�&&&����������!� )%���%���#��/���smatraju se djeca koja su umrla �����������������������!� Prirodni priraštaj ����������� ������ � �(�� ������(����������� ������������ ������!� G����������� ������������������������. ?( � stopa fertiliteta ����������� ������ � �(������� ����(���� ������ � �������� ����� ����� ��fertilnom periodu =-C-49 godina starosti) posmatrane godine, ������� ���-�&&&�����! Koeficijent maskuliniteta predstavlja broj ����������������������! ���� ��"��#�� �#�����. Za odre(������ ���� �(�����uzimaju se u obzir sva djeca koju je majka rodila, ���������"� � ����(����������������������� ������(����������������������!� Sklopljeni i razvedeni brakovi. U statistici sklopljenih brakova jedinica posmatranja je svaki brak sklopljen u skladu sa odredbama Osnovnog zakona o braku, a kod statistike razvoda svaki brak ���� ��� ���������� � ������ � ���������� ����������������������������������������������" !
pulsation of the umbilical cord, and definite movements of voluntary muscles. If a child dies after birth it is first registered as live-born and then as dead. General natality rate is the ratio between the number of live born children and the estimated number of population per 1 000 inhabitants. A stillborn child is every child born or taken out from mother`s body who exhibits no signs of life, where pregnancy has lasted more than 22 weeks and weight at childbirth has been 500 grams or more. A dead person is every live born person in which there is a permanent disappearance of all evidence of life at any time after live birth has taken place, without capability of resuscitation. Stillbirths are not included there. General mortality rate is the ratio between the number of dead and the estimated number of population per 1 000 inhabitants. Dead infants are considered children who died under one year of age. Natural change is a difference between the number of live-born and the number of dead persons in a given period and it can be positive or negative. General fertility rate is the relation between the number of live-births and total number of women in their childbearing years (15-49 years of age) of a given year per 1 000 women. Masculinity coefficient is relation between the number of men per 100 women. Birth order. In establishing birth order all children are taken into account (live births and stillbirths), irrespective of whether born in or out of wedlock. Marriages and divorces. In statistics of marriages the unit of observation is every marriage that is recognised by law, and the unit of observation in statistics of divorces is every marriage that is dissolved, cancelled or annulled by a valid decision of the municipal court in charge.
�����������������������������������������8 Žene i muškarci u Bosni i Hercegovini
Women and Men in Bosnia and Herzegovina
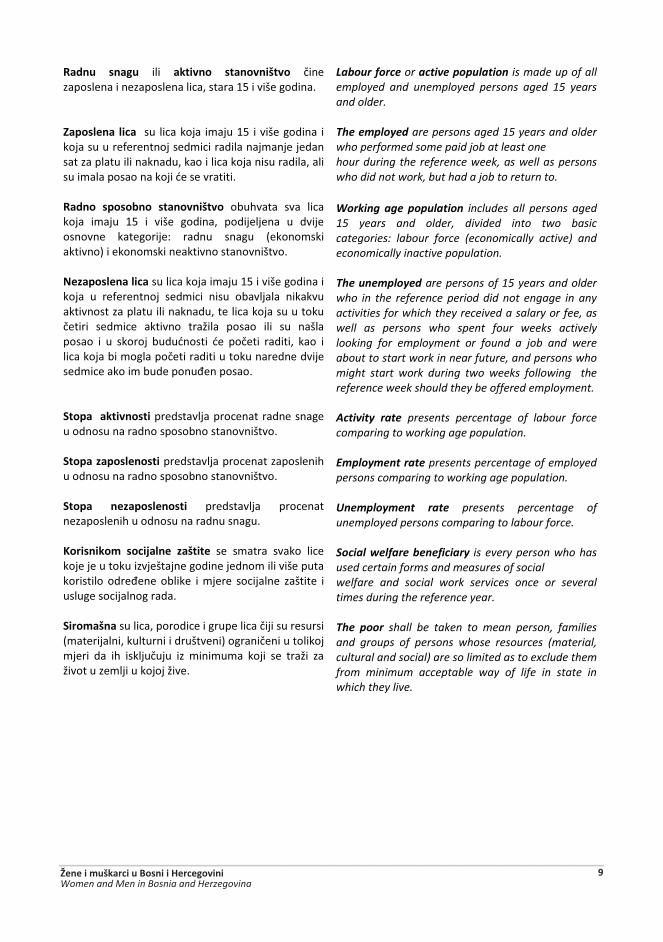
Radnu snagu ili aktivno stanovništvo �������������������������������������-C�����������! Zaposlena lica su lica koja ����-C� ����������� i koja su u referentnoj sedmici radila najmanje jedan sat za platu ili naknadu, kao i lica koja nisu radila, ali ��� �����������������"�����vratiti. Radno sposobno stanovništvo obuhvata sva lica koja ima��� -C� � ���� ������� ���������� u dvije �������� ��������#� ����� ������ =����� ���aktivno) i ekonomski neaktivno stanovništvo. =���(�����a lica su lica ����� ����-C�������������koja u referentnoj sedmici nisu obavljala nikakvu aktivnost za platu ili naknadu, te lica koja su u toku ���� ��� ce aktivno tra��� posao ili su našla posao i u sko��� ����"����� "�� ������ ����� ���� ������������ ����������������������������������se� ������� ����������(��������!� Stopa aktivnosti predstavlja procenat radne snage u odnosu na radno sposobno stanovništvo. Stopa zaposlenosti predstavlja procenat zaposlenih u odnosu na radno sposobno stanovništvo. Stopa nezaposlenosti predstavlja procenat nezaposlenih u odnosu na radnu snagu. Korisnikom socijalne zaštite se smatra svako lice koje je u toku izvještajne godine jednom ili više puta ������� ���(���� ������ � ���� ��������� ������� �usluge socijalnog rada. Siromašna su lica, ����������������������������= ������������������������>������������������ ��� ��� �� ���������� �� � � �� ���� ��� ���� ������������ ��������������!
Labour force or active population is made up of all employed and unemployed persons aged 15 years and older. The employed are persons aged 15 years and older who performed some paid job at least one hour during the reference week, as well as persons who did not work, but had a job to return to. Working age population includes all persons aged 15 years and older, divided into two basic categories: labour force (economically active) and economically inactive population. The unemployed are persons of 15 years and older who in the reference period did not engage in any activities for which they received a salary or fee, as well as persons who spent four weeks actively looking for employment or found a job and were about to start work in near future, and persons who might start work during two weeks following the reference week should they be offered employment. Activity rate presents percentage of labour force comparing to working age population. Employment rate presents percentage of employed persons comparing to working age population. Unemployment rate presents percentage of unemployed persons comparing to labour force. Social welfare beneficiary is every person who has used certain forms and measures of social welfare and social work services once or several times during the reference year. The poor shall be taken to mean person, families and groups of persons whose resources (material, cultural and social) are so limited as to exclude them from minimum acceptable way of life in state in which they live.
�����������������������������������������Žene i muškarci u Bosni i Hercegovini 9Women and Men in Bosnia and Herzegovina

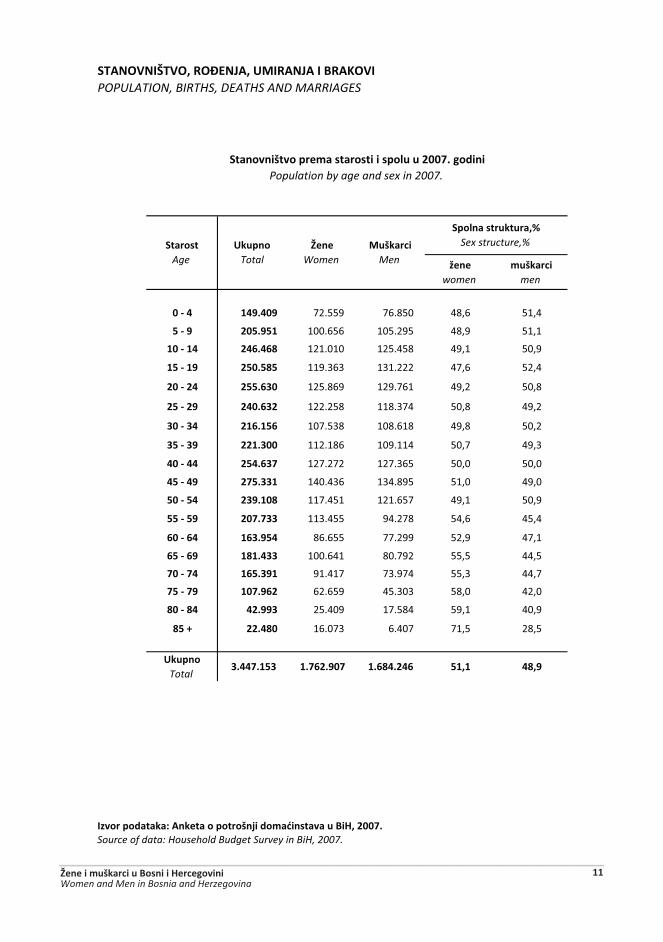
�C�=?@=�KC@?���?W�=����)���=�����N��;?@�POPULATION, BIRTHS, DEATHS AND MARRIAGES
'����women
muškarci men
0 - 4 149.409 72.559 76.850 48,6 51,4
5 - 9 205.951 100.656 105.295 48,9 51,1
10 - 14 246.468 121.010 125.458 49,1 50,9
15 - 19 250.585 119.363 131.222 47,6 52,4
20 - 24 255.630 125.869 129.761 49,2 50,8
25 - 29 240.632 122.258 118.374 50,8 49,2
30 - 34 216.156 107.538 108.618 49,8 50,2
35 - 39 221.300 112.186 109.114 50,7 49,3
40 - 44 254.637 127.272 127.365 50,0 50,0
45 - 49 275.331 140.436 134.895 51,0 49,0
50 - 54 239.108 117.451 121.657 49,1 50,9
55 - 59 207.733 113.455 94.278 54,6 45,4
60 - 64 163.954 86.655 77.299 52,9 47,1
65 - 69 181.433 100.641 80.792 55,5 44,5
70 - 74 165.391 91.417 73.974 55,3 44,7
75 - 79 107.962 62.659 45.303 58,0 42,0
80 - 84 42.993 25.409 17.584 59,1 40,9
85 + 22.480 16.073 6.407 71,5 28,5
)�$(���Total
3.447.153 1.762.907 1.684.246 51,1 48,9
������(������������������(����!�#���%� �������$�NX��Y[[\]�Source of data: Household Budget Survey in BiH, 2007.
�������!����(��%������������(��$�$�Y[[\]�����Population by age and sex in 2007.
�(��������$��$���^Sex structure,% ��������
Age)�$(���
Total�����
Women$!�����
Men
�����������������������������������������Žene i muškarci u Bosni i Hercegovini 11Women and Men in Bosnia and Herzegovina
85 +80-8475-8070-7465-6960-6455-5950-5445-4940-4435-3930-3425-2920-2415-1910-14
5-90-4
75 +70-7465-6960-6455-5950-5445-4940-4435-3930-3425-2920-2415-1910-14
5-90-4
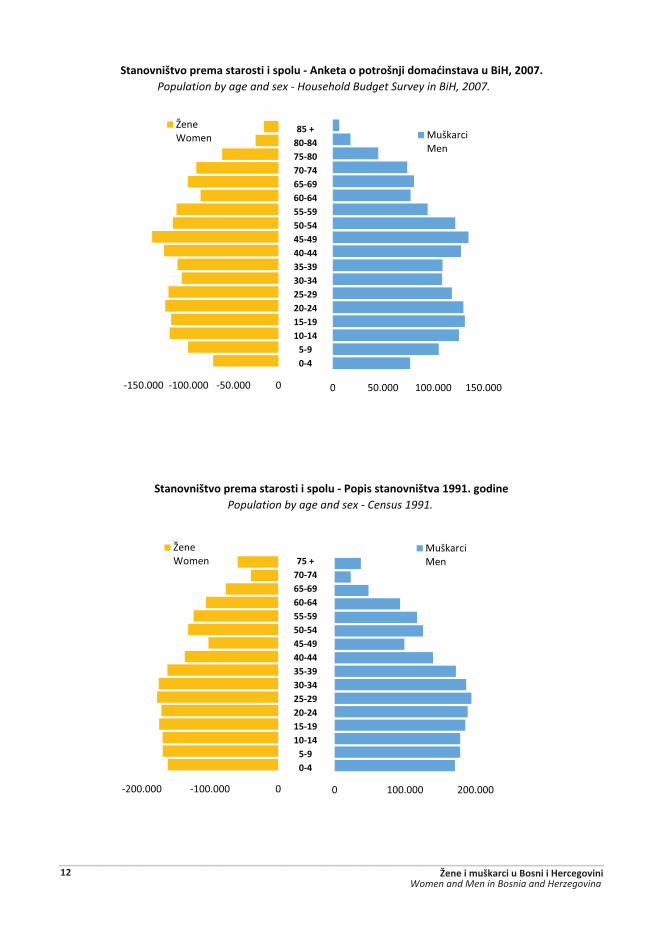
Population by age and sex - Household Budget Survey in BiH, 2007. �������!����(��%������������(��$�_����������(����!�#���%� �������$�NX��Y[[\]
�������!����(��%������������(��$�_�*�(���������!����`qq`]������Population by age and sex - Census 1991.
-200.000 -100.000 0
����V� ��
0 100.000 200.000
Muškarci5��
-150.000 -100.000 -50.000 0
�����V� ��
0 50.000 100.000 150.000
5������5��
�����������������������������������������12 Žene i muškarci u Bosni i Hercegovini
Women and Men in Bosnia and Herzegovina
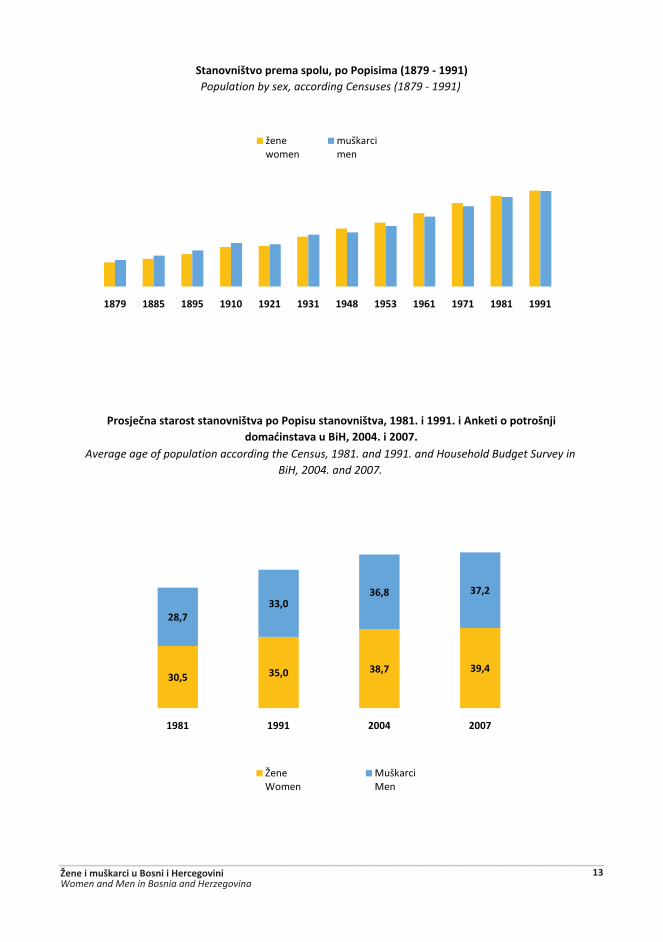
Average age of population according the Census, 1981. and 1991. and Household Budget Survey in BiH, 2004. and 2007.
*���#�/������������������!����(��*�(�$��������!�����`qw`]��`qq`]����������(����!�#���%� �������$�NX��Y[[y]��Y[[\]�
�������!����(��%���(��$��(��*�(�%��{`w\q�_�`qq`|Population by sex, according Censuses (1879 - 1991)
1879 1885 1895 1910 1921 1931 1948 1953 1961 1971 1981 1991
����X� ��
muškarci ��
30,5 35,0 38,7 39,4
28,733,0
36,8 37,2
1981 1991 2004 2007
����V� ��
Muškarci5��
�����������������������������������������Žene i muškarci u Bosni i Hercegovini 13Women and Men in Bosnia and Herzegovina

2004 2007
0 - 5 100,2 101,4
6 - 17 102,8 107,7
18 - 34 103,2 101,0
35 - 64 96,3 95,3
>= 65 76,9 75,6
)�$(��Total
96,1 95,5
������(������������������(����!�#���%� �������$�NX��Y[[y]��Y[[\]�Source of data: Household Budget Survey in BiH, 2004. and 2007.
;����#����%���$������Masculinity coefficient
���$��$����������!������������`����!��������(��%��&��/��%�����$�$���(��$�$�Y[[\]�����Distribution of population 15 years and older by marital status and sex in 2007.
;����#����%���$�������(��%���������%���$(�%��$�Y[[y]��Y[[\]�����Masculinity coefficient by age groups in 2004. and 2007.
30,7
63,8
1,5
4,1
21,5
59,8
2,6
16,2
Y��������[��������?����
E������[������������������������)� ���� �����
$�����\� ������������������
]�������[�������������[�6����������������
+�����[��V��X�
����V� ��
Muškarci5��
�����������������������������������������14 Žene i muškarci u Bosni i Hercegovini
Women and Men in Bosnia and Herzegovina
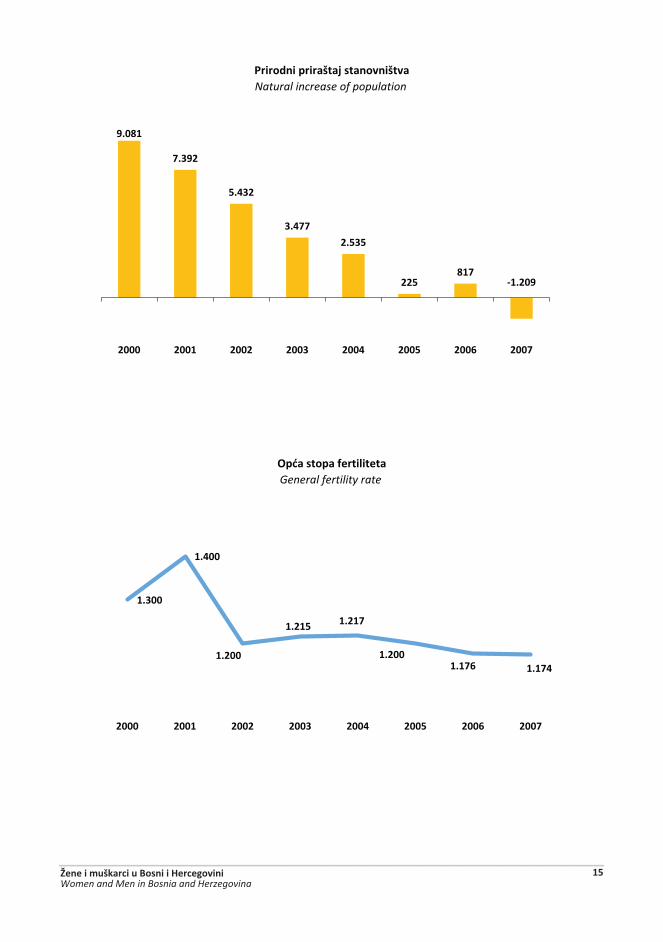
*������(���!��#��������!���Natural increase of population
General fertility rate?( �����(�����������
9.081
7.392
5.432
3.477
2.535
225817
-1.209
2000 2001 2002 2003 2004 2005 2006 2007
1.300
1.400
1.200
1.215 1.217
1.2001.176 1.174
2000 2001 2002 2003 2004 2005 2006 2007
�����������������������������������������Žene i muškarci u Bosni i Hercegovini 15Women and Men in Bosnia and Herzegovina

)�$(����Total
�#���#/���Girls
�#�/���Boys
2000 39.563 19.156 20.407
2001 37.717 18.317 19.400
2002 35.587 17.290 18.297
2003 35.234 16.904 18.330
2004 35.151 17.018 18.133
2005 34.627 16.830 17.797
2006 34.033 16.486 17.547
2007 33.835 16.301 17.534
?( �����(�����������General natality rate
10,5
9,9
�����"���(��%���(��$��Live births by sex
Live births by sex
8,8
9,3
9,2
9,1
9,0
8,9
�����"���(��%���(��$��
0
2.000
4.000
6.000
8.000
10.000
12.000
14.000
16.000
18.000
20.000
2000 2001 2002 2003 2004 2005 2006 2007
6���������^��
6��������\�
�����������������������������������������16 Žene i muškarci u Bosni i Hercegovini
Women and Men in Bosnia and Herzegovina
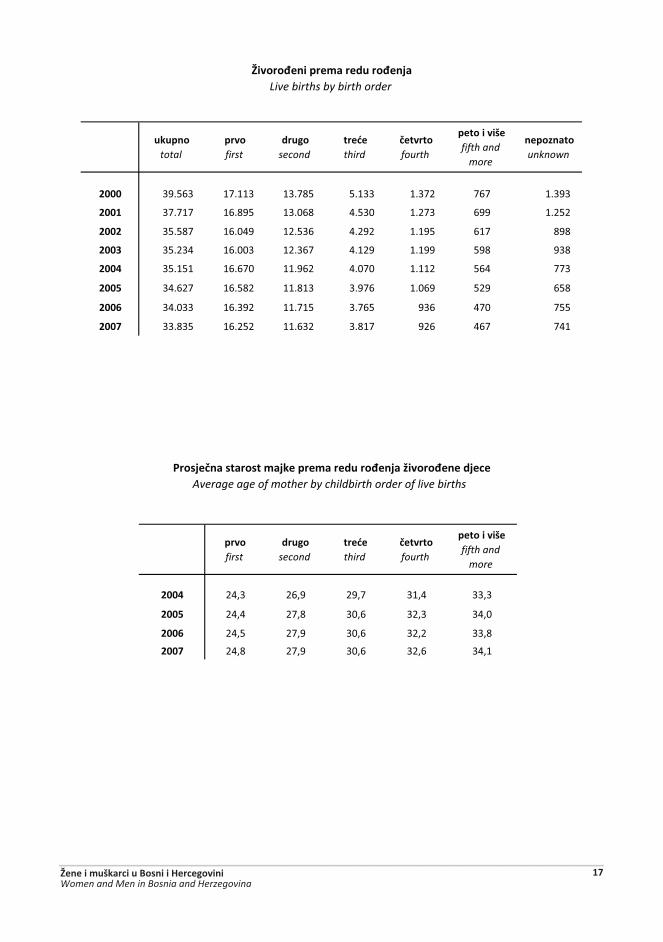
$�$(���total
(����first
��$���second
��� ��third
/�������fourth
(������!��fifth and
more
��(�������unknown
2000 39.563 17.113 13.785 5.133 1.372 767 1.393
2001 37.717 16.895 13.068 4.530 1.273 699 1.252
2002 35.587 16.049 12.536 4.292 1.195 617 898
2003 35.234 16.003 12.367 4.129 1.199 598 938
2004 35.151 16.670 11.962 4.070 1.112 564 773
2005 34.627 16.582 11.813 3.976 1.069 529 658
2006 34.033 16.392 11.715 3.765 936 470 755
2007 33.835 16.252 11.632 3.817 926 467 741
(����first
��$���second
��� ��third
/�������fourth
(������!��fifth and
more
2004 24,3 26,9 29,7 31,4 33,3
2005 24,4 27,8 30,6 32,3 34,0
2006 24,5 27,9 30,6 32,2 33,8
2007 24,8 27,9 30,6 32,6 34,1
�����"���(��%�����$���"��#�Live births by birth order
*���#�/�����������%�#���(��%�����$���"��#��'����"�����#���Average age of mother by childbirth order of live births
�����������������������������������������Žene i muškarci u Bosni i Hercegovini 17Women and Men in Bosnia and Herzegovina
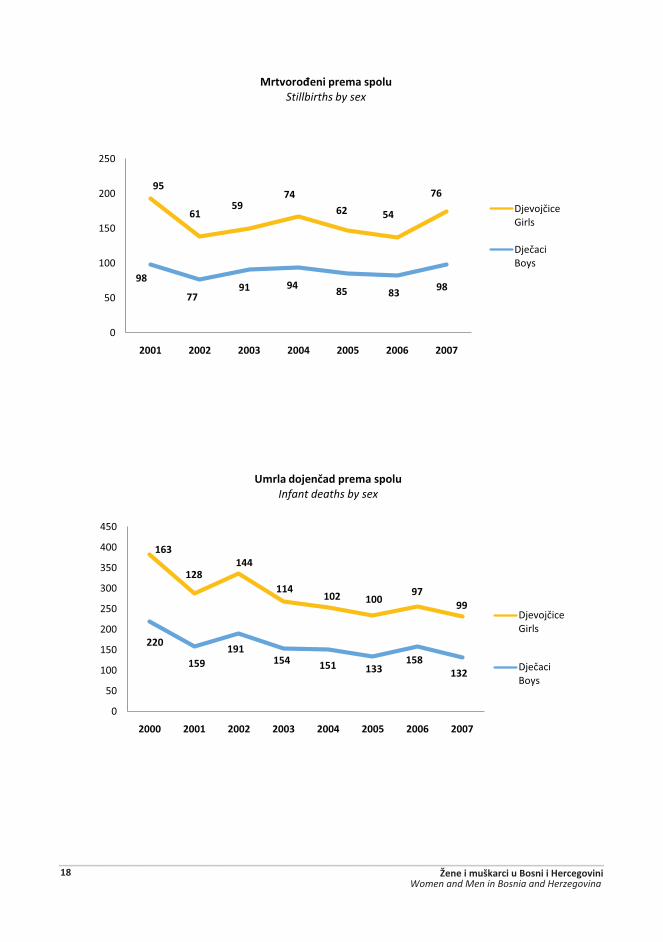
98
7791 94 85 83 98
95
6159
74
62 54
76
0
50
100
150
200
250
2001 2002 2003 2004 2005 2006 2007
������"���(��%���(��$������Stillbirths by sex
6���������^��
6��������\�
220
159191
154 151 133158
132
163
128144
114102 100
9799
0
50
100
150
200
250
300
350
400
450
2000 2001 2002 2003 2004 2005 2006 2007
)%������#��/���(��%���(��$������Infant deaths by sex
6���������^��
6��������\�
�����������������������������������������18 Žene i muškarci u Bosni i Hercegovini
Women and Men in Bosnia and Herzegovina
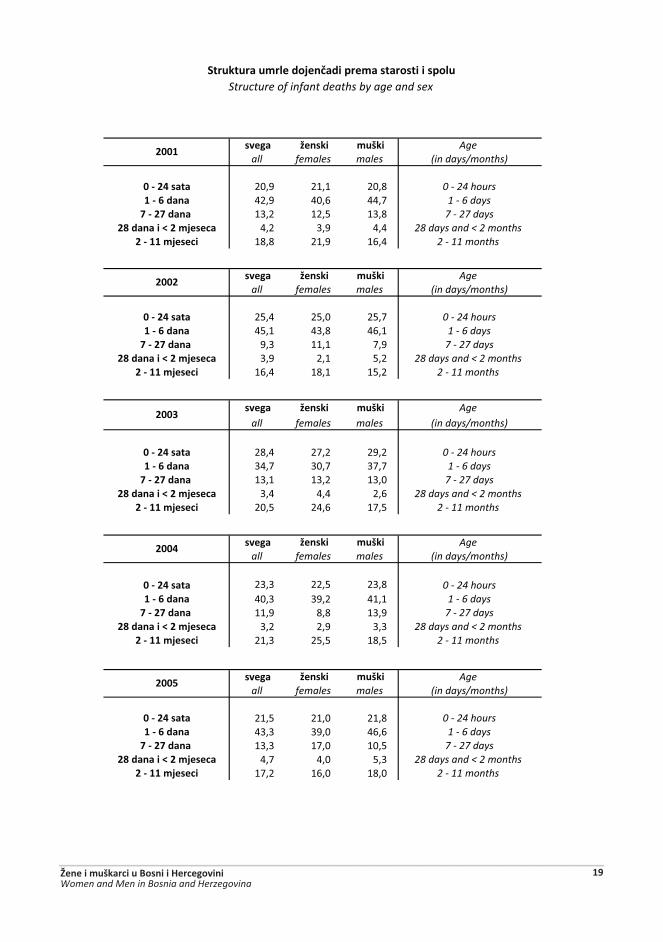
����� '���� muški Age all females males (in days/months)
[�_�Yy����� 20,9 21,1 20,8 0 - 24 hours`�_������� 42,9 40,6 44,7 1 - 6 days
\�_�Y\������ 13,2 12,5 13,8 7 - 27 daysYw���������Y�%#����� 4,2 3,9 4,4 28 days and < 2 months
Y�_�``�%#���� 18,8 21,9 16,4 2 - 11 months
����� '���� muški Age all females males (in days/months)
[�_�Yy����� 25,4 25,0 25,7 0 - 24 hours`�_������� 45,1 43,8 46,1 1 - 6 days
\�_�Y\������ 9,3 11,1 7,9 7 - 27 daysYw���������Y�%#����� 3,9 2,1 5,2 28 days and < 2 months
Y�_�``�%#���� 16,4 18,1 15,2 2 - 11 months
����� '���� muški Age all females males (in days/months)
[�_�Yy����� 28,4 27,2 29,2 0 - 24 hours`�_������� 34,7 30,7 37,7 1 - 6 days
\�_�Y\������ 13,1 13,2 13,0 7 - 27 daysYw���������Y�%#����� 3,4 4,4 2,6 28 days and < 2 months
Y�_�``�%#���� 20,5 24,6 17,5 2 - 11 months
����� '���� muški Age all females males (in days/months)
[�_�Yy����� 23,3 22,5 23,8 0 - 24 hours`�_������� 40,3 39,2 41,1 1 - 6 days
\�_�Y\������ 11,9 8,8 13,9 7 - 27 daysYw���������Y�%#����� 3,2 2,9 3,3 28 days and < 2 months
Y�_�``�%#���� 21,3 25,5 18,5 2 - 11 months
����� '���� muški Age all females males (in days/months)
[�_�Yy����� 21,5 21,0 21,8 0 - 24 hours`�_������� 43,3 39,0 46,6 1 - 6 days
\�_�Y\������ 13,3 17,0 10,5 7 - 27 daysYw���������Y�%#����� 4,7 4,0 5,3 28 days and < 2 months
Y�_�``�%#���� 17,2 16,0 18,0 2 - 11 months
Structure of infant deaths by age and sex ���$��$���$%������#��/���(��%������������(��$��
2005
2001
2002
2003
2004
�����������������������������������������Žene i muškarci u Bosni i Hercegovini 19Women and Men in Bosnia and Herzegovina

=�������Continued
����� '���� muški Age all females males (in days/months)
[�_�Yy����� 23,5 22,7 24,1 0 - 24 hours`�_������� 40,8 39,2 41,8 1 - 6 days
\�_�Y\������ 15,7 19,6 13,3 7 - 27 daysYw���������Y�%#����� 5,9 3,1 7,6 28 days and < 2 months
Y�_�``�%#���� 14,1 15,5 13,3 2 - 11 months
����� '���� muški Age
all females males (in days/months)
[�_�Yy����� 16,0 16,2 15,9 0 - 24 hours`�_������� 35,9 33,3 37,9 1 - 6 days
\�_�Y\������ 21,7 22,2 21,2 7 - 27 daysYw���������Y�%#����� 5,2 8,1 3,0 28 days and < 2 months
Y�_�``�%#���� 21,2 20,2 22,0 2 - 11 months
2006
2007
16,2
33,3
22,2
8,1
20,2
15,9
37,9
21,2
3,0
22,0
0% 20% 40% 60% 80% 100%
0-%`�����[����
1-q�����[��\�
7-%x�����[��\��
%'�����[��\���y�%� ������[ �����
2---� �����[ �����
���$��$���$%������#��/���(��%������������(��$�$�Y[[\]�����������Structure of infant deaths by age and sex in 2007.
������)� ����
���� ����
�����������������������������������������20 Žene i muškarci u Bosni i Hercegovini
Women and Men in Bosnia and Herzegovina

)�$(����Total
�������Females
$!����Males
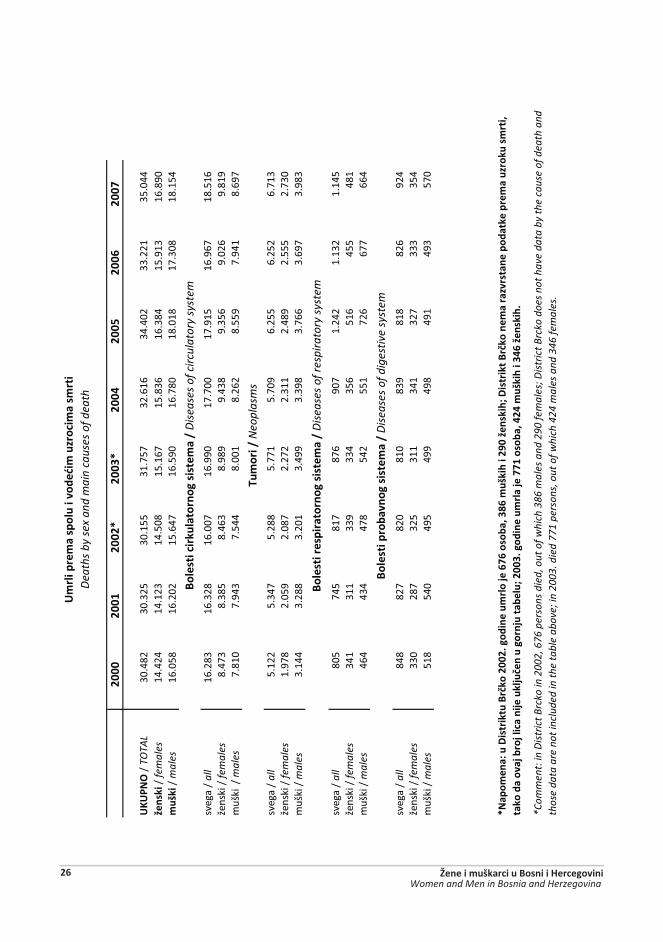
2000 30.482 14.424 16.0582001 30.325 14.123 16.2022002 30.155 14.508 15.6472003 31.757 15.167 16.5902004 32.616 15.836 16.7802005 34.402 16.384 18.0182006 33.221 15.913 17.3082007 35.044 16.890 18.154
2000 66,8 69,7 64,22001 67,2 70,2 64,62002 67,8 70,7 65,02003 68,4 71,2 65,82004 68,9 71,7 66,32005 69,3 72,2 66,82006 69,4 72,2 66,82007 69,6 72,5 66,9
*���#�/�����������$%�������&���Average age of deaths
)%���(��%���(��$��Deaths by sex
$!��Males
)�$(���Total
�������Females
8,59,08,69,1
?( �����(��%���������General mortality rate
8,18,07,98,3
60
62
64
66
68
70
72
74
2000 2001 2002 2003 2004 2005 2006 2007
*���#�/�����������$%�������&�������Average age of deaths
�������{� ����
5����5����
�����������������������������������������Žene i muškarci u Bosni i Hercegovini 21Women and Men in Bosnia and Herzegovina

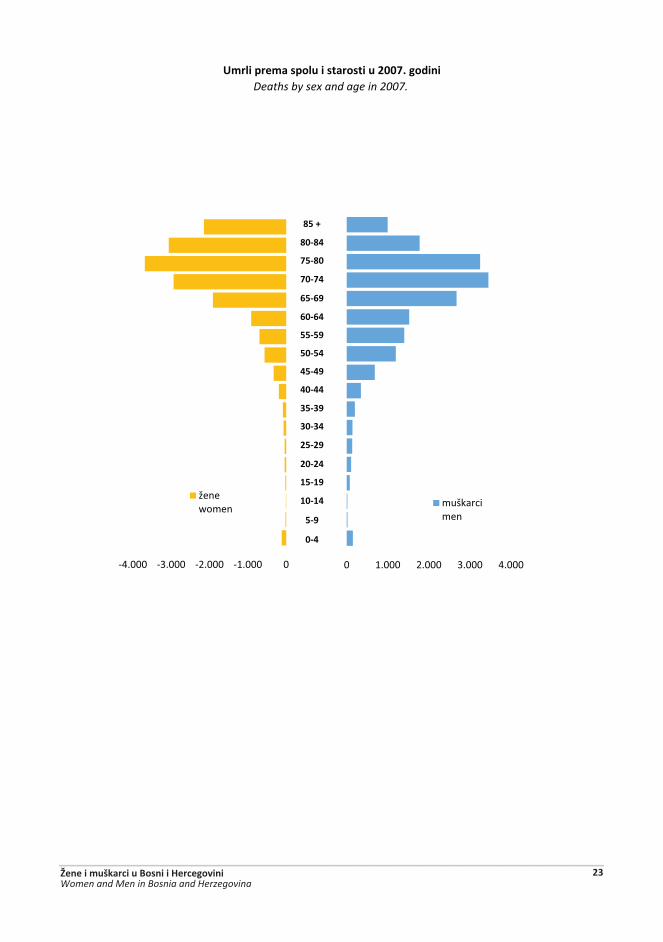
'���women
muškarcimen
0 - 4 268 118 150 44,0 56,0
5 - 9 43 22 21 51,2 48,8
10 - 14 29 12 17 41,4 58,6
15 - 19 101 26 75 25,7 74,3
20 - 24 149 41 108 27,5 72,5
25 - 29 178 43 135 24,2 75,8
30 - 34 209 70 139 33,5 66,5
35 - 39 285 87 198 30,5 69,5
40 - 44 538 193 345 35,9 64,1
45 - 49 1.012 329 683 32,5 67,5
50 - 54 1.762 566 1.196 32,1 67,9
55 - 59 2.098 697 1.401 33,2 66,8
60 - 64 2.437 915 1.522 37,5 62,5
65 - 69 4.588 1.914 2.674 41,7 58,3
70 - 74 6.389 2.938 3.451 46,0 54,0
75 - 79 6.937 3.688 3.249 53,2 46,8
80 - 84 4.838 3.064 1.774 63,3 36,7
85 + 3.145 2.147 998 68,3 31,7
��(�������unknown
38 20 18 52,6 47,4
)%���(��%���(��$����������$�Y[[\]�����Deaths by sex and age in 2007.
�(��������$��$���^Sex structure,% $!����
Men����
Women)�$(���
Total�����
Age
�����������������������������������������22 Žene i muškarci u Bosni i Hercegovini
Women and Men in Bosnia and Herzegovina
85 +
80-84
75-80
70-74
65-69
60-64
55-59
50-54
45-49
40-44
35-39
30-34
25-29
20-24
15-19
10-14
5-9
0-4
)%���(��%���(��$����������$�Y[[\]�����Deaths by sex and age in 2007.
-4.000 -3.000 -2.000 -1.000 0
����X� ��
0 1.000 2.000 3.000 4.000
muškarci ��
�����������������������������������������Žene i muškarci u Bosni i Hercegovini 23Women and Men in Bosnia and Herzegovina
$�$(���total
����������$/�#�
accident
��%�$&�����suicide
$&�����murder
��(�������unknown
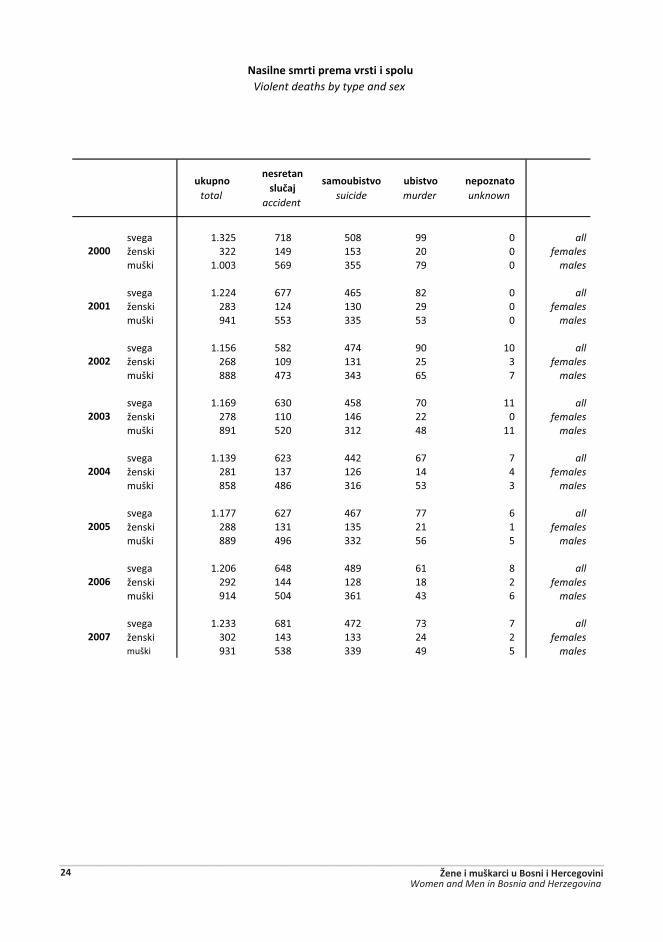
����� 1.325 718 508 99 0 all����� 322 149 153 20 0 femalesmuški 1.003 569 355 79 0 males
����� 1.224 677 465 82 0 all����� 283 124 130 29 0 femalesmuški 941 553 335 53 0 males
����� 1.156 582 474 90 10 all����� 268 109 131 25 3 femalesmuški 888 473 343 65 7 males
����� 1.169 630 458 70 11 all����� 278 110 146 22 0 femalesmuški 891 520 312 48 11 males
����� 1.139 623 442 67 7 all����� 281 137 126 14 4 femalesmuški 858 486 316 53 3 males
����� 1.177 627 467 77 6 all����� 288 131 135 21 1 femalesmuški 889 496 332 56 5 males
����� 1.206 648 489 61 8 all����� 292 144 128 18 2 femalesmuški 914 504 361 43 6 males
����� 1.233 681 472 73 7 all����� 302 143 133 24 2 femalesmuški 931 538 339 49 5 males
2007
2000
2001
2002
2003
=�������%���(��%���������(��$�Violent deaths by type and sex
2004
2005
2006
�����������������������������������������24 Žene i muškarci u Bosni i Hercegovini
Women and Men in Bosnia and Herzegovina

0
200
400
600
800
1.000
1.200
1.400
2002 2003 2004 2005 2006 2007
=�������%���(��%���(��$Violent deaths by sex
������)� ����
���� ����
0 200 400 600 800
����������������������
�� �������������
������� ���
=�������%���(��%���������(��$�$�Y[[\]�����Violent deaths by type and sex in 2007.
������)� ����
���� ����
�����������������������������������������Žene i muškarci u Bosni i Hercegovini 25Women and Men in Bosnia and Herzegovina
2000
2001
2002
*20
03*
2004
2005
2006
2007
);)
*=?
�[�T
OTA
L30
.482
30.3
2530
.155
31.7
5732
.616
34.4
0233
.221
35.0
44'�
���
�[�fe
mal
es14
.424
14.1
2314
.508
15.1
6715
.836
16.3
8415
.913
16.8
90m
uški
�[�m
ales
16.0
5816
.202
15.6
4716
.590
16.7
8018
.018
17.3
0818
.154
����
��[�
all
16.2
8316
.328
16.0
0716
.990
17.7
0017
.915
16.9
6718
.516
����
��[
�fem
ales
8.47
38.
385
8.46
38.
989
9.43
89.
356
9.02
69.
819
muš
ki [
mal
es7.
810
7.94
37.
544
8.00
18.
262
8.55
97.
941
8.69
7
����
��[
all
5.12
25.
347
5.28
85.
771
5.70
96.
255
6.25
26.
713
����
��[
�fem
ales
1.97
82.
059
2.08
72.
272
2.31
12.
489
2.55
52.
730
��
��[
�mal
es3.
144
3.28
83.
201
3.49
93.
398
3.76
63.
697
3.98
3
����
��[�
all
805
745
817
876
907
1.24
21.
132
1.14
5��
���
�[�fe
mal
es34
131
133
933
435
651
645
548
1
���
�[�m
ales
464
434
478
542
551
726
677
664
����
��[�
all
848
827
820
810
839
818
826
924
����
��[
�fem
ales
330
287
325
311
341
327
333
354
��
��[
�mal
es51
854
049
549
949
849
149
357
0
N���
���(
��&�
����
���
��%
����
Dis
ease
s of
dig
estiv
e sy
stem
�=�(
�%��
���$
���
���
�$�N
�/��
�Y[[
Y]��
���
��$%
����
#���
\���
��&�
���w�
�%$!
���
�Yq[
�'��
���
����
���
��N�
/���
��%
����
����
����
�(��
����
�(��
%��
$���
�$��
%��
����
����
����
�#�&
��#��
���
�#�
�$��
#$/�
��$�
����
#$��
�&��
$��Y
[[�]
����
���
$%��
��#�
�\\`
����
&���y
Yy�%
$!�
����
y��'
����
�]
*Com
men
t: in
Dis
tric
t Brc
ko in
200
2, 6
76 p
erso
ns d
ied,
out
of w
hich
386
mal
es a
nd 2
90 fe
mal
es; D
istr
ict B
rcko
doe
s no
t hav
e da
ta b
y th
e ca
use
of d
eath
and
th
ose
data
are
not
incl
uded
in th
e ta
ble
abov
e; in
200
3. d
ied
771
pers
ons,
out
of w
hich
424
mal
es a
nd 3
46 fe
mal
es.
)%
���(
��%
���(
��$�
����
� %
�$��
��%
���%
���
Dea
ths
by s
ex a
nd m
ain
caus
es o
f dea
th
N���
����
��$
����
����
���
��%
����
Dis
ease
s of
circ
ulat
ory
syst
em
C$%
����
�Neo
plas
ms
N���
����
��(
����
����
���
��%
����
Dis
ease
s of
resp
irat
ory
syst
em
�����������������������������������������26 Žene i muškarci u Bosni i Hercegovini
Women and Men in Bosnia and Herzegovina
2000
2001
2002
*20
03*
2004
2005
2006
2007
����
��[�
all
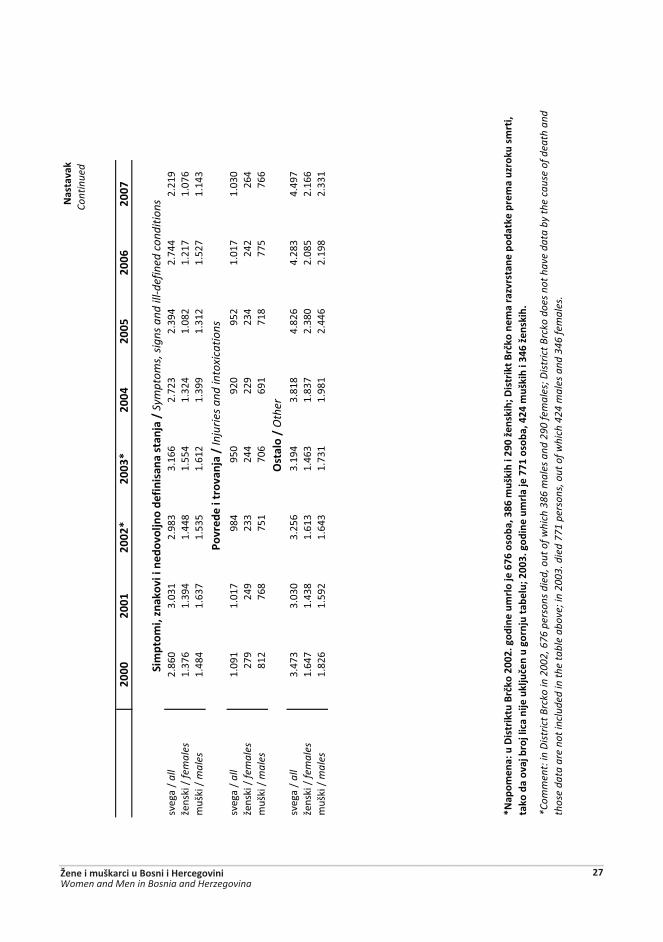
2.86
03.
031
2.98
33.
166
2.72
32.
394
2.74
42.
219
����
��[
�fem
ales
1.37
61.
394
1.44
81.
554
1.32
41.
082
1.21
71.
076
��
��[
�mal
es1.
484
1.63
71.
535
1.61
21.
399
1.31
21.
527
1.14
3
����
��[�
all
1.09
11.
017
984
950
920
952
1.01
71.
030
����
��[
�fem
ales
279
249
233
244
229
234
242
264
��
��[
�mal
es81
276
875
170
669
171
877
576
6
����
��[�
all
3.47
33.
030
3.25
63.
194
3.81
84.
826
4.28
34.
497
����
��[
�fem
ales
1.64
71.
438
1.61
31.
463
1.83
72.
380
2.08
52.
166
��
��[
�mal
es1.
826
1.59
21.
643
1.73
11.
981
2.44
62.
198
2.33
1
�%
(��%
����
����
���
����
��#�
����
���
����
����
#���
�Sym
ptom
s, s
igns
and
ill-d
efin
ed c
ondi
tions
*���
����
����
���#
����
Inju
ries
and
into
xica
tions
*Com
men
t: in
Dis
tric
t Brc
ko in
200
2, 6
76 p
erso
ns d
ied,
out
of w
hich
386
mal
es a
nd 2
90 fe
mal
es; D
istr
ict B
rcko
doe
s no
t hav
e da
ta b
y th
e ca
use
of d
eath
and
th
ose
data
are
not
incl
uded
in th
e ta
ble
abov
e; in
200
3. d
ied
771
pers
ons,
out
of w
hich
424
mal
es a
nd 3
46 fe
mal
es.
�=�(
�%��
���$
���
���
�$�N
�/��
�Y[[
Y]��
���
��$%
����
#���
\���
��&�
���w�
�%$!
���
�Yq[
�'��
���
����
���
��N�
/���
��%
����
����
����
�(��
����
�(��
%��
$���
�$��
%��
����
����
����
�#�&
��#��
���
�#�
�$��
#$/�
��$�
����
#$��
�&��
$��Y
[[�]
����
���
$%��
��#�
�\\`
����
&���y
Yy�%
$!�
����
y��'
����
�]
=��
����
�Co
ntin
ued
?��
����
��O
ther
�����������������������������������������Žene i muškarci u Bosni i Hercegovini 27Women and Men in Bosnia and Herzegovina
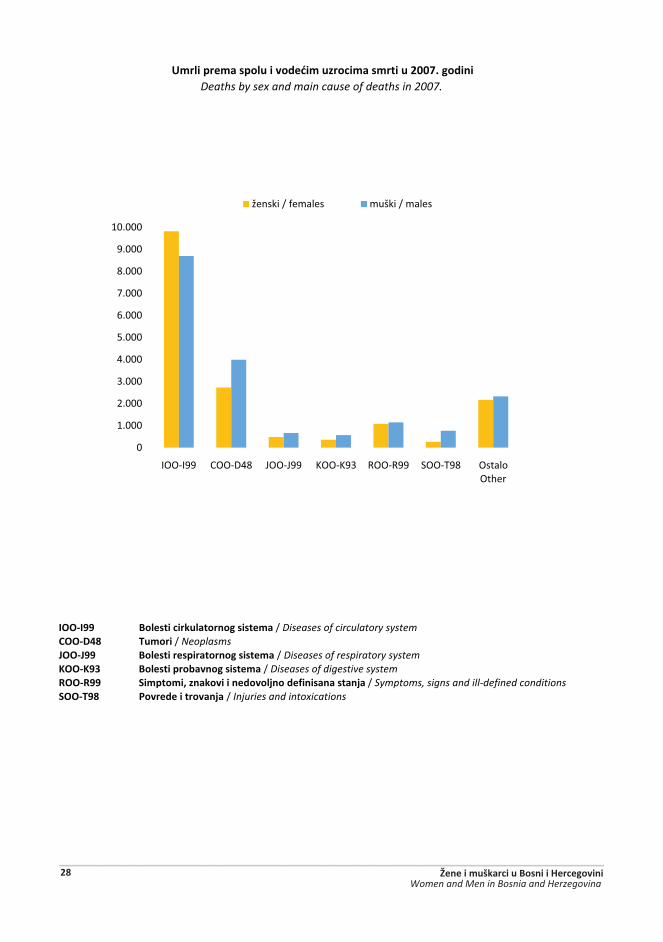
IOO-I99 N���������$�������������%��[�Diseases of circulatory systemCOO-D48 C$%���[�Neoplasms�??_�qq N���������(�������������%��[�Diseases of respiratory system;??_;q� N������(��&����������%��[�Diseases of digestive systemROO-R99 �%(��%�����������������#����������������#��[�Symptoms, signs and ill-defined conditionsSOO-T98 *��������������#��[ Injuries and intoxications
)%���(��%���(��$������ %�$����%���%���$�Y[[\]�����Deaths by sex and main cause of deaths in 2007.
0
1.000
2.000
3.000
4.000
5.000
6.000
7.000
8.000
9.000
10.000
IOO-I99 COO-D48 JOO-J99 KOO-K93 ROO-R99 SOO-T98 E������E���
������[�)� ���� ����[� ����
�����������������������������������������28 Žene i muškarci u Bosni i Hercegovini
Women and Men in Bosnia and Herzegovina
2000
21.8
972
3.74
88.
925
4.70
41.
983
996
964
561
14
2001
20.3
021
3.57
18.
316
4.21
11.
800
949
861
573
20
2002
20.7
661
3.46
58.
422
4.53
91.
899
911
930
544
55
2003
20.7
331
3.26
08.
541
4.58
71.
865
958
960
536
25
2004
22.2
521
3.34
99.
054
5.10
72.
125
970
1.04
358
518
2005
21.6
980
3.14
78.
707
5.17
42.
076
991
946
623
24
2006
21.5
010
2.98
28.
215
5.47
72.
223
1.00
596
759
834
2007
23.4
940
3.16
58.
745
6.24
72.
455
1.07
71.
168
622
15
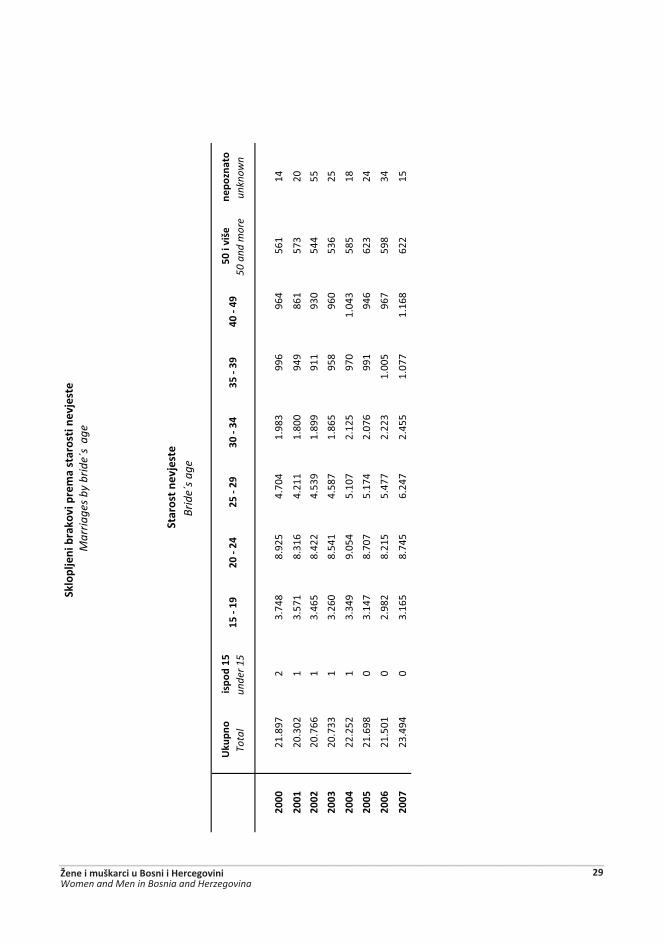
����
(�#�
��&
����
��(
��%
����
����
���
��#�
����
�M
arri
ages
by
brid
e´s
age
����
�����
��#�
���
Brid
e´s
age
15 -
1920
- 24
25 -
2930
- 34
35 -
3940
- 49
)�$
(���
Tota
l�
(���
`�un
der 1
5�[
���
!�50
and
mor
e��
(���
���
unkn
own
�����������������������������������������Žene i muškarci u Bosni i Hercegovini 29Women and Men in Bosnia and Herzegovina
2000
21.8
970
284
6.23
87.
165
3.87
71.
958
1.38
998
15
2001
20.3
020
277
5.87
76.
704
3.36
11.
741
1.39
993
58
2002
20.7
660
283
5.84
86.
944
3.53
51.
822
1.32
998
916
2003
20.7
330
275
5.69
47.
111
3.44
61.
778
1.46
394
719
2004
22.2
520
303
5.94
27.
724
3.83
41.
863
1.57
71.
000
5
2005
21.6
980
280
5.71
67.
586
3.81
61.
772
1.52
01.
003
5
2006
21.5
010
338
5.25
67.
569
3.94
41.
806
1.53
11.
052
5
2007
23.4
940
293
5.65
48.
425
4.44
51.
918
1.64
31.
109
7
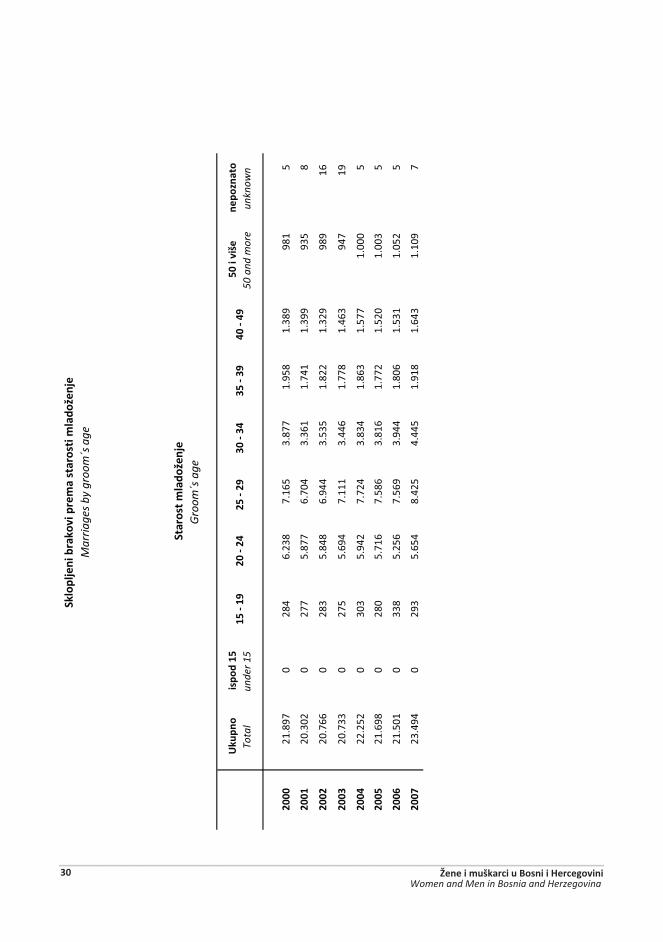
����
(�#�
��&
����
��(
��%
����
����
��%
����
'��#
��M
arri
ages
by
groo
m´s
age
����
����
%��
��'�
�#�
Gro
om´s
age
15 -
1920
- 24
25 -
2930
- 34
35 -
3940
- 49
)�$
(���
Tota
l�
(���
`�un
der 1
5�[
���
!�50
and
mor
e��
(���
���
unkn
own
�����������������������������������������30 Žene i muškarci u Bosni i Hercegovini
Women and Men in Bosnia and Herzegovina
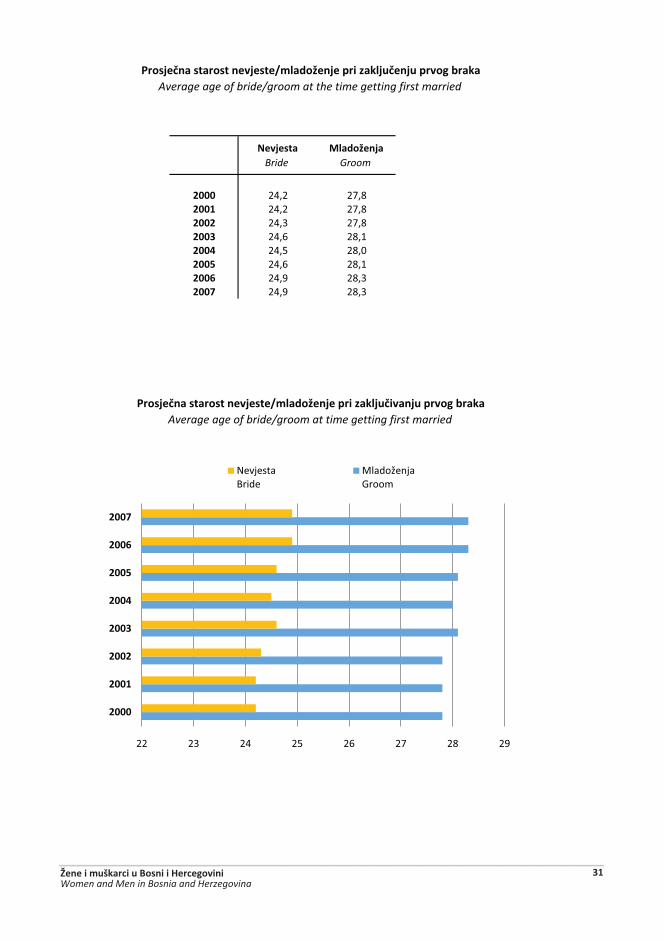
=��#�����Bride
����'��#��Groom
2000 24,2 27,82001 24,2 27,82002 24,3 27,82003 24,6 28,12004 24,5 28,02005 24,6 28,12006 24,9 28,32007 24,9 28,3
*���#�/��������������#�����%����'��#��(������#$/��#$�(�����&����Average age of bride/groom at the time getting first married
*���#�/��������������#�����%����'��#��(������#$/���#$�(�����&����Average age of bride/groom at time getting first married
22 23 24 25 26 27 28 29
2000
2001
2002
2003
2004
2005
2006
2007
Y�����������
5����������Groom
�����������������������������������������Žene i muškarci u Bosni i Hercegovini 31Women and Men in Bosnia and Herzegovina
2000
1.92
90
2424
535
732
131
244
521
114
2001
2.12
60
2628
039
737
230
948
324
514
2002
2.31
10
3131
944
237
734
150
729
04
2003
1.91
80
3228
036
132
530
738
122
93
2004
1.52
30
2024
430
826
222
230
016
52
2005
1.76
30
1923
737
627
723
238
124
10
2006
1.65
90
2323
529
828
021
737
123
50
2007
1.82
60
2024
536
133
121
737
927
30
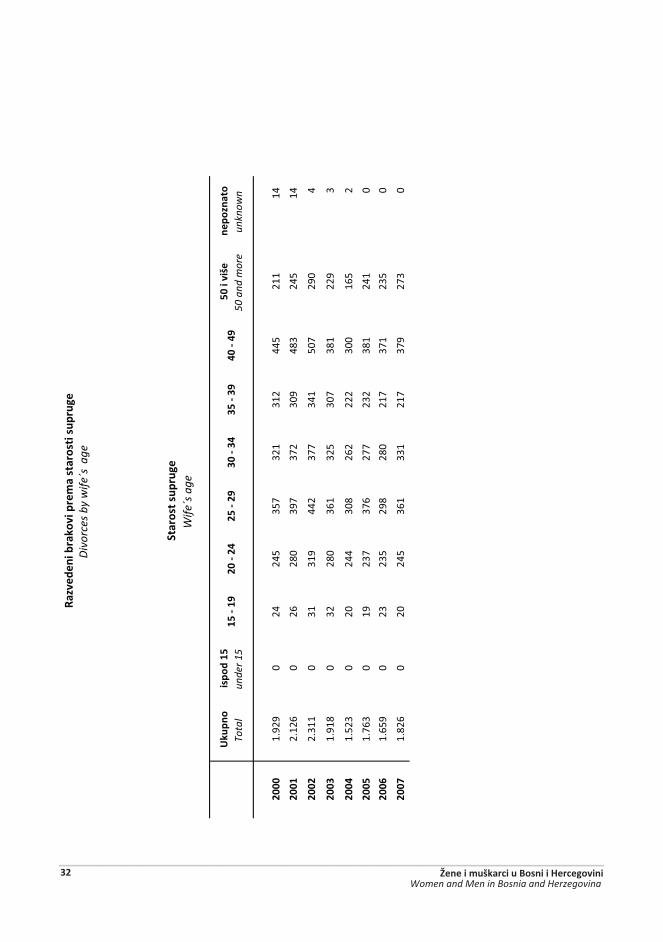
����
����
�&��
���
�(��
%��
����
���
��$(
�$��
Div
orce
s by
wife
´s a
ge
����
�����
$(�$
��W
ife´s
age
15 -
1920
- 24
25 -
2930
- 34
35 -
3940
- 49
)�$
(���
Tota
l�
(���
`�un
der 1
5�[
���
!�50
and
mor
e��
(���
���
unkn
own
�����������������������������������������32 Žene i muškarci u Bosni i Hercegovini
Women and Men in Bosnia and Herzegovina
2000
1.92
90
411
526
435
536
448
832
514
2001
2.12
60
511
131
439
637
954
336
513
2002
2.31
10
111
937
641
339
061
039
57
2003
1.91
80
311
233
833
731
150
730
73
2004
1.52
30
193
254
292
290
367
225
1
2005
1.76
30
111
126
530
331
043
533
80
2006
1.65
90
492
246
285
259
438
335
0
2007
1.82
60
597
283
316
316
442
366
1
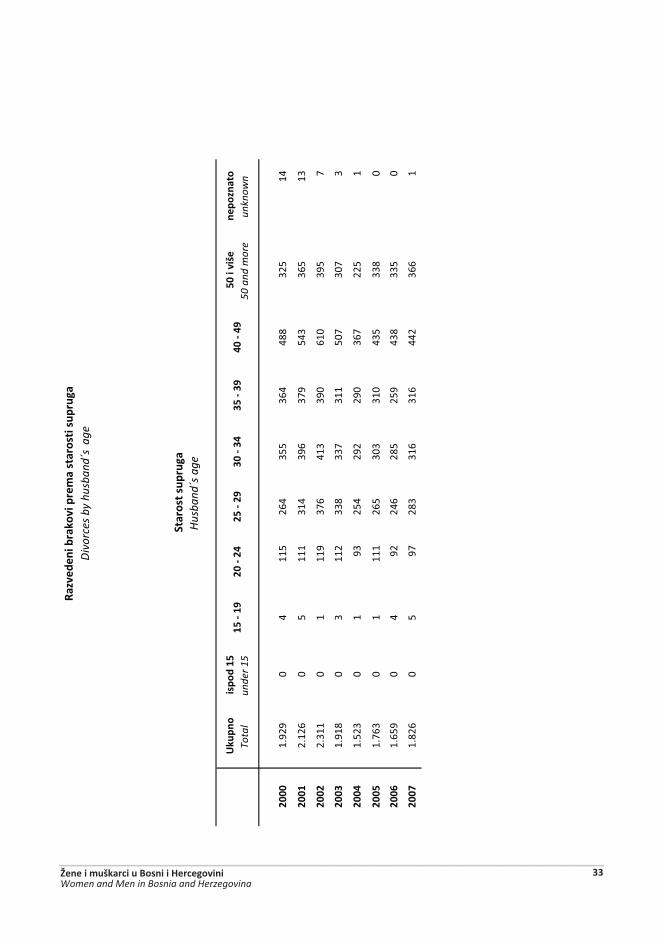
����
����
�&��
���
�(��
%��
����
���
��$(
�$��
�D
ivor
ces
by h
usba
nd´s
age
����
�����
$(�$
��H
usba
nd´s
age
15 -
1920
- 24
25 -
2930
- 34
35 -
3940
- 49
)�$
(���
Tota
l�
(���
`�un
der 1
5�[
���
!�50
and
mor
e��
(���
���
unkn
own
�����������������������������������������Žene i muškarci u Bosni i Hercegovini 33Women and Men in Bosnia and Herzegovina
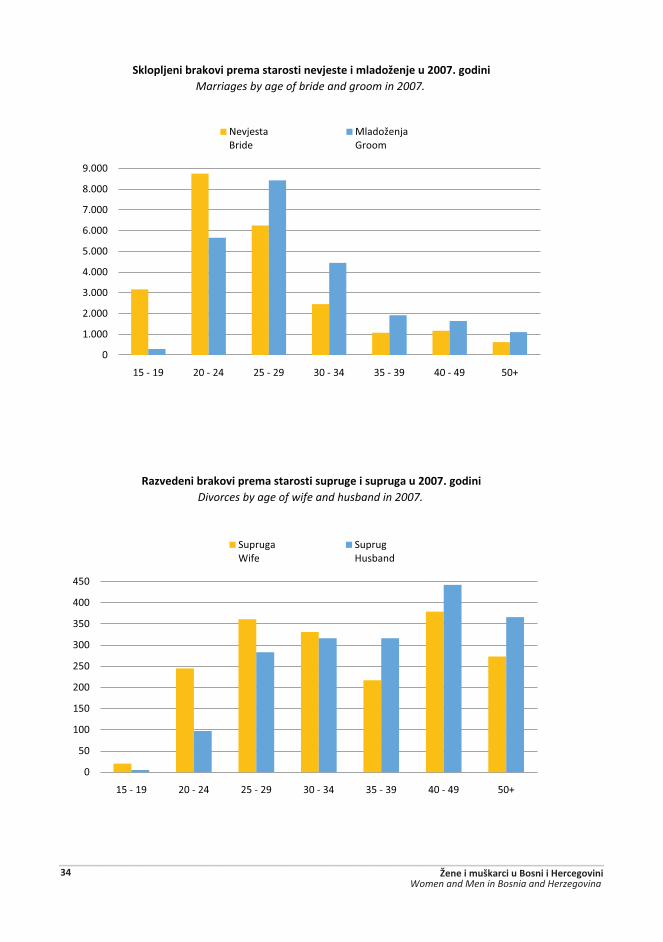
����(�#���&������(��%�������������#������%����'��#��$�Y[[\]�����Marriages by age of bride and groom in 2007.
���������&������(��%�����������$(�$�����$(�$���$�Y[[\]�����Divorces by age of wife and husband in 2007.
0
1.000
2.000
3.000
4.000
5.000
6.000
7.000
8.000
9.000
-C�- 19 %&�- 24 %C�- 29 �&�- 34 �C�- 39 `&�- 49 50+
Y����������
5���������Groom
0
50
100
150
200
250
300
350
400
450
-C�- 19 %&�- 24 %C�- 29 �&�- 34 �C�- 39 `&�- 49 50+
?�����V)��
?������������
�����������������������������������������34 Žene i muškarci u Bosni i Hercegovini
Women and Men in Bosnia and Herzegovina
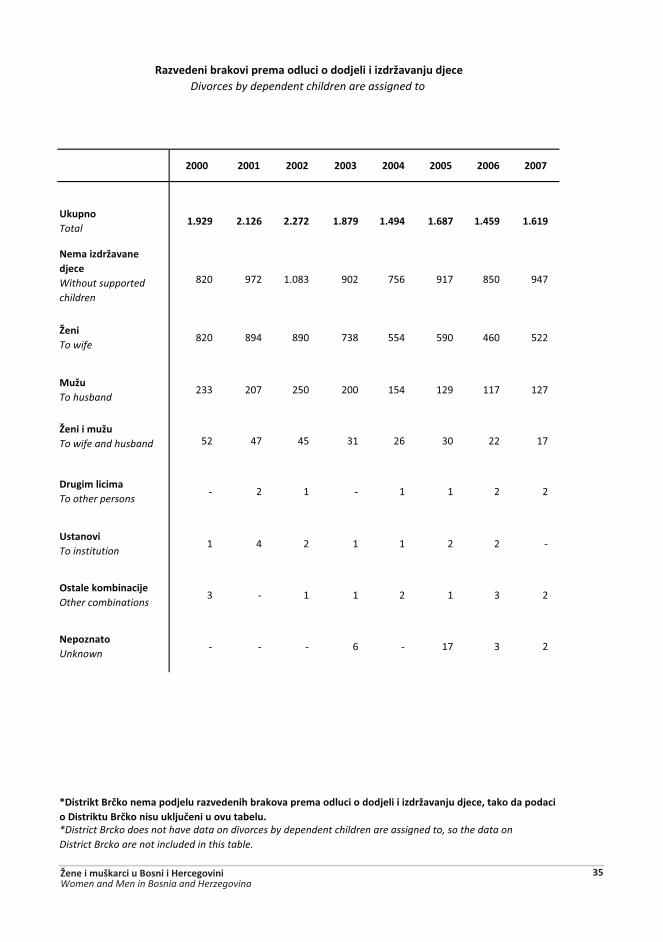
2000 2001 2002 2003 2004 2005 2006 2007
)�$(��Total
1.929 2.126 2.272 1.879 1.494 1.687 1.459 1.619
=�%�����'�������#���Without supported children
820 972 1.083 902 756 917 850 947
���To wife
820 894 890 738 554 590 460 522
$'$To husband
233 207 250 200 154 129 117 127
�����%$'$To wife and husband 52 47 45 31 26 30 22 17
��$�%���%�To other persons
- 2 1 - 1 1 2 2
)������To institution
1 4 2 1 1 2 2 -
?��������%&���#�Other combinations
3 - 1 1 2 1 3 2
=�(������Unknown
- - - 6 - 17 3 2
���������&������(��%�����$�������#�������'����#$��#���Divorces by dependent children are assigned to
��������N�/�����%��(��#��$�����������&�������(��%�����$�������#�������'����#$��#�������������(�������������$�N�/�����$�$��#$/���$���$���&��$]*District Brcko does not have data on divorces by dependent children are assigned to, so the data on District Brcko are not included in this table. �����������������������������������������Žene i muškarci u Bosni i Hercegovini 35Women and Men in Bosnia and Herzegovina
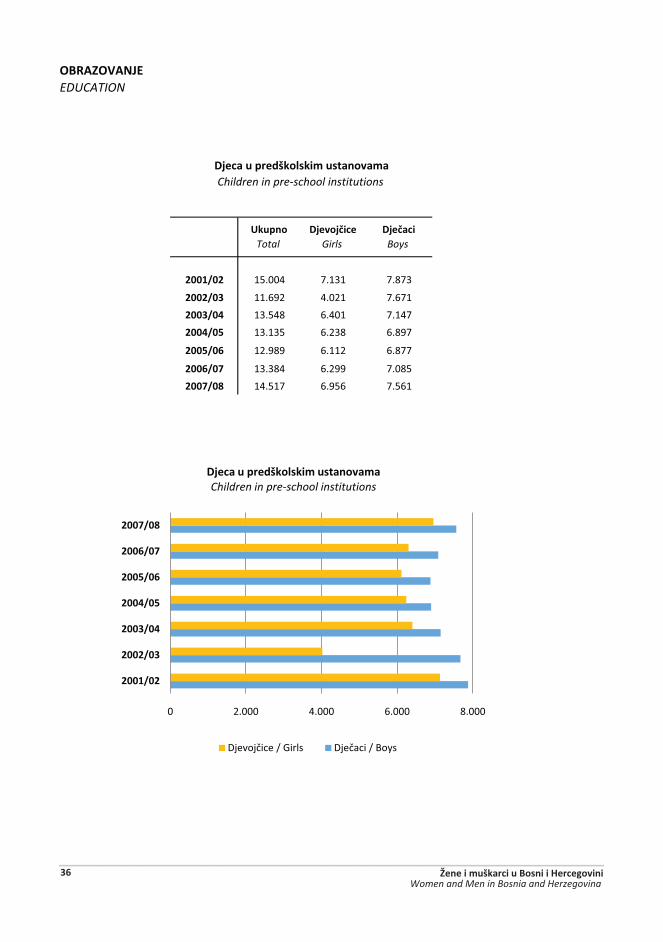
?N���?@�=��EDUCATION
Y[[`�[Y 15.004 7.131 7.873
Y[[Y�[� 11.692 4.021 7.671
Y[[��[y 13.548 6.401 7.147
Y[[y�[� 13.135 6.238 6.897
Y[[��[� 12.989 6.112 6.877
Y[[��[\ 13.384 6.299 7.085
Y[[\�[w 14.517 6.956 7.561
)�$(���Total
�#���#/��Girls
�#�/���Boys
�#����$�(���!�����%�$�������%�Children in pre-school institutions
0 2.000 4.000 6.000 8.000
Y[[`�[Y
Y[[Y�[�
Y[[��[y
Y[[y�[�
Y[[��[�
Y[[��[\
Y[[\�[w
�#����$�(���!�����%�$�������%�������Children in pre-school institutions
6���������[�^�� 6������[���\�
�����������������������������������������36 Žene i muškarci u Bosni i Hercegovini
Women and Men in Bosnia and Herzegovina
)/���� )/���
Female pupils
Male pupils
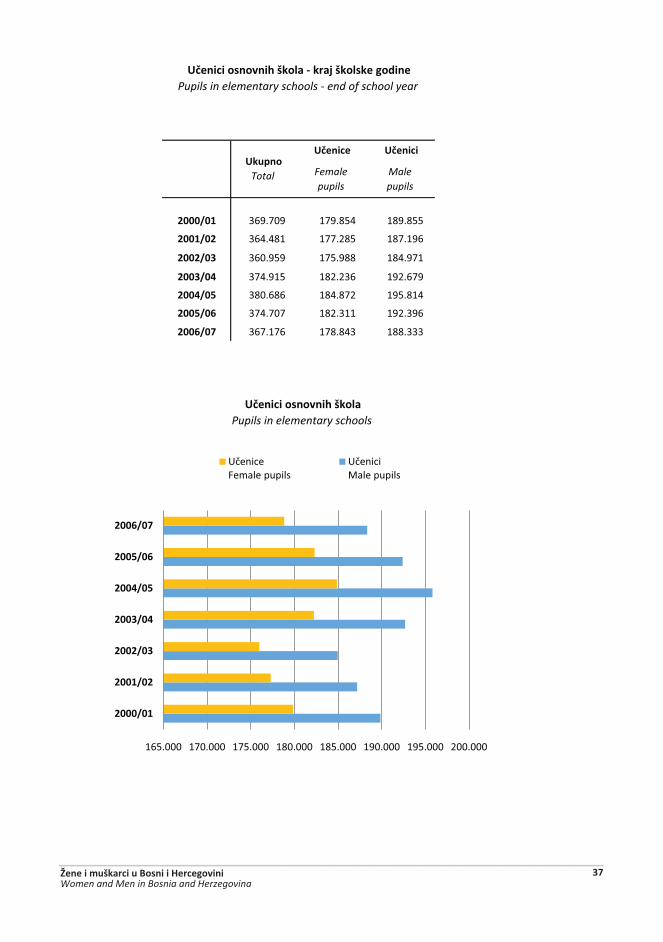
Y[[[�[` 369.709 179.854 189.855
Y[[`�[Y 364.481 177.285 187.196
Y[[Y�[� 360.959 175.988 184.971
Y[[��[y 374.915 182.236 192.679
Y[[y�[� 380.686 184.872 195.814
Y[[��[� 374.707 182.311 192.396
Y[[��[\ 367.176 178.843 188.333
)�$(���Total
)/������������!�����_����#�!������������Pupils in elementary schools - end of school year
)/������������!����Pupils in elementary schools
165.000 170.000 175.000 180.000 185.000 190.000 195.000 200.000
Y[[[�[`
Y[[`�[Y
Y[[Y�[�
Y[[��[y
Y[[y�[�
Y[[��[�
Y[[��[\
+������{� ���������
+�����5���������
�����������������������������������������Žene i muškarci u Bosni i Hercegovini 37Women and Men in Bosnia and Herzegovina
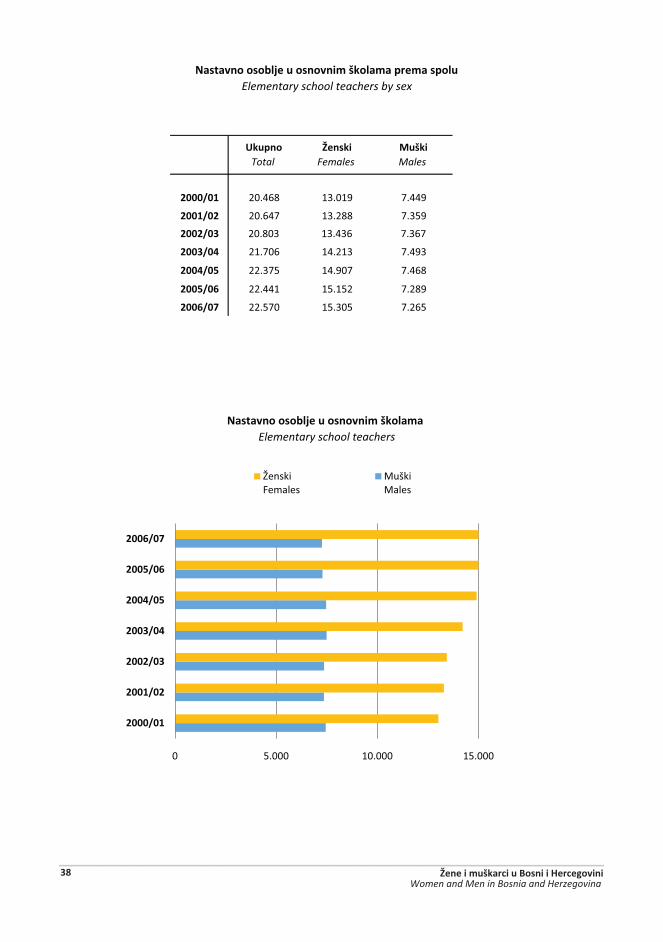
Y[[[�[` 20.468 13.019 7.449
Y[[`�[Y 20.647 13.288 7.359
Y[[Y�[� 20.803 13.436 7.367
Y[[��[y 21.706 14.213 7.493
Y[[y�[� 22.375 14.907 7.468
Y[[��[� 22.441 15.152 7.289
Y[[��[\ 22.570 15.305 7.265
=�����������&�#��$�������%�!����%��(��%���(��$�Elementary school teachers by sex
=�����������&�#��$�������%�!����%���Elementary school teachers
)�$(��Total
�����Females
$!�Males
0 5.000 10.000 15.000
Y[[[�[`
Y[[`�[Y
Y[[Y�[�
Y[[��[y
Y[[y�[�
Y[[��[�
Y[[��[\
�����{� ����
Muški5����
�����������������������������������������38 Žene i muškarci u Bosni i Hercegovini
Women and Men in Bosnia and Herzegovina
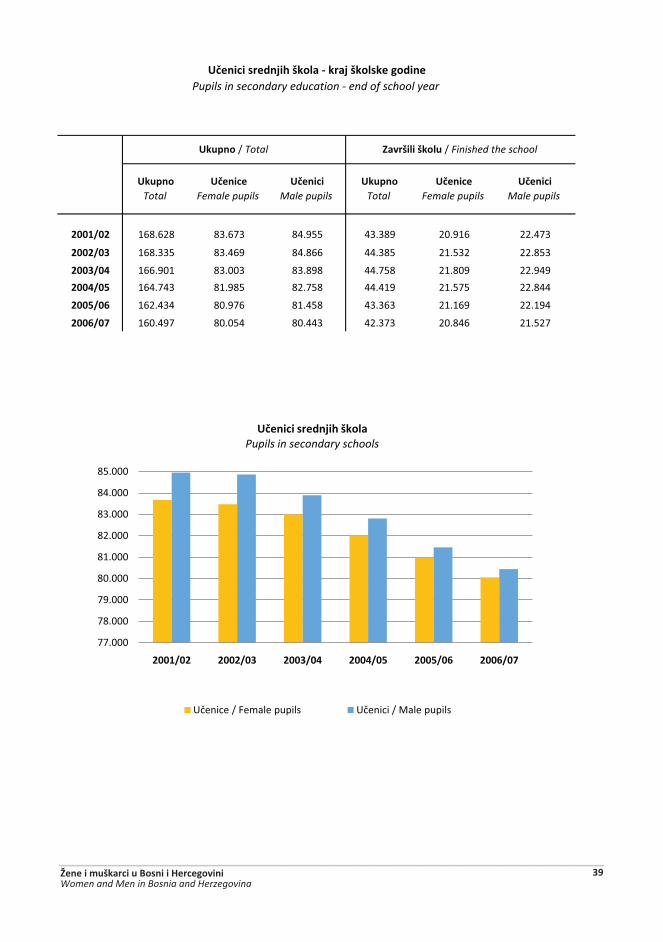
Y[[`�[Y 168.628 83.673 84.955 43.389 20.916 22.473
Y[[Y�[� 168.335 83.469 84.866 44.385 21.532 22.853
Y[[��[y 166.901 83.003 83.898 44.758 21.809 22.949
Y[[y�[� 164.743 81.985 82.758 44.419 21.575 22.844
Y[[��[� 162.434 80.976 81.458 43.363 21.169 22.194
Y[[��[\ 160.497 80.054 80.443 42.373 20.846 21.527
����!��!���$�[�Finished the school)�$(���[ Total
)�$(���Total
)�$(���Total
)/���������#��!�����_����#�!������������Pupils in secondary education - end of school year
)/����Female pupils
)/���Male pupils
)/����Female pupils
)/���Male pupils
77.000
78.000
79.000
80.000
81.000
82.000
83.000
84.000
85.000
Y[[`�[Y Y[[Y�[� Y[[��[y Y[[y�[� Y[[��[� Y[[��[\
)/���������#��!��������������Pupils in secondary schools
+������[�{� ��������� +�����[�5���������
�����������������������������������������Žene i muškarci u Bosni i Hercegovini 39Women and Men in Bosnia and Herzegovina
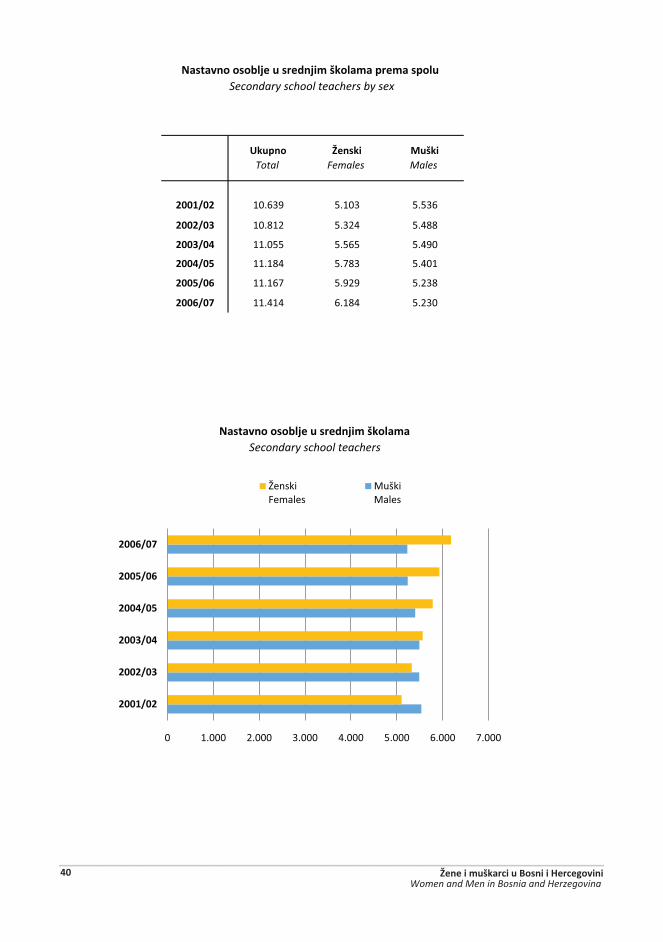
Y[[`�[Y 10.639 5.103 5.536
Y[[Y�[� 10.812 5.324 5.488
Y[[��[y 11.055 5.565 5.490
Y[[y�[� 11.184 5.783 5.401
Y[[��[� 11.167 5.929 5.238
Y[[��[\ 11.414 6.184 5.230
=�����������&�#��$������#%�!����%��(��%���(��$��Secondary school teachers by sex
=�����������&�#��$������#%�!����%���Secondary school teachers
)�$(��Total
�����Females
$!�Males
0 1.000 2.000 3.000 4.000 5.000 6.000 7.000
Y[[`�[Y
Y[[Y�[�
Y[[��[y
Y[[y�[�
Y[[��[�
Y[[��[\
�����{� ����
Muški5����
�����������������������������������������40 Žene i muškarci u Bosni i Hercegovini
Women and Men in Bosnia and Herzegovina
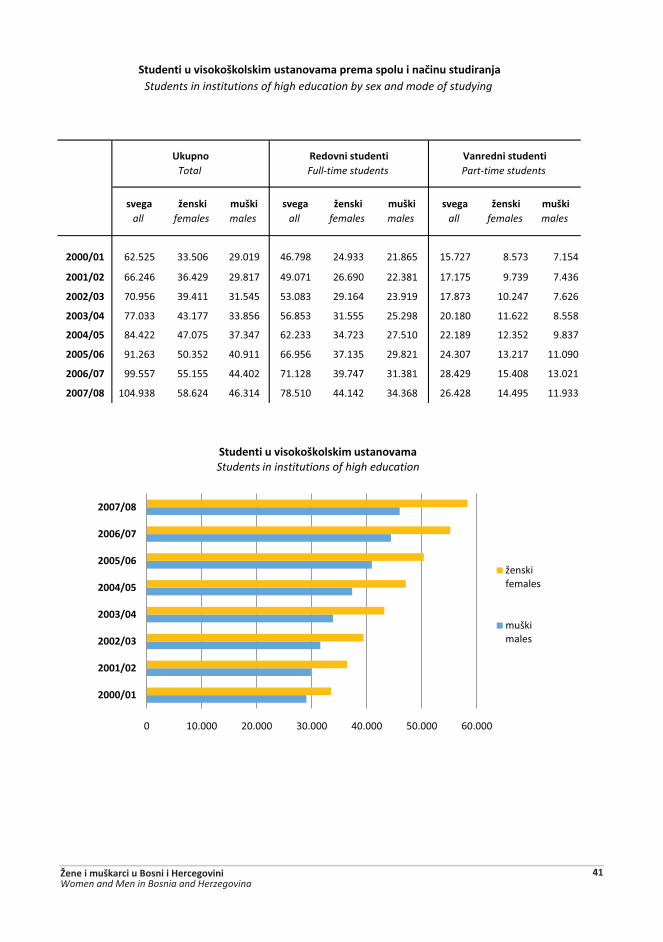
Y[[[�[` 62.525 33.506 29.019 46.798 24.933 21.865 15.727 8.573 7.154
Y[[`�[Y 66.246 36.429 29.817 49.071 26.690 22.381 17.175 9.739 7.436
Y[[Y�[� 70.956 39.411 31.545 53.083 29.164 23.919 17.873 10.247 7.626
Y[[��[y 77.033 43.177 33.856 56.853 31.555 25.298 20.180 11.622 8.558
Y[[y�[� 84.422 47.075 37.347 62.233 34.723 27.510 22.189 12.352 9.837
Y[[��[� 91.263 50.352 40.911 66.956 37.135 29.821 24.307 13.217 11.090
Y[[��[\ 99.557 55.155 44.402 71.128 39.747 31.381 28.429 15.408 13.021
Y[[\�[w 104.938 58.624 46.314 78.510 44.142 34.368 26.428 14.495 11.933
)�$(���Total
���������$�����Full-time students
@���������$�����Part-time students
��$�����$������!�����%�$�������%��(��%���(��$����/�$���$����#�Students in institutions of high education by sex and mode of studying
muškimales
�����all
'����females
muškimales
�����all
'����females
muškimales
�����all
'����females
0 10.000 20.000 30.000 40.000 50.000 60.000
Y[[[�[`
Y[[`�[Y
Y[[Y�[�
Y[[��[y
Y[[y�[�
Y[[��[�
Y[[��[\
Y[[\�[w
��$�����$������š�����%�$�������%��������Students in institutions of high education
������)� ����
���� ����
�����������������������������������������Žene i muškarci u Bosni i Hercegovini 41Women and Men in Bosnia and Herzegovina
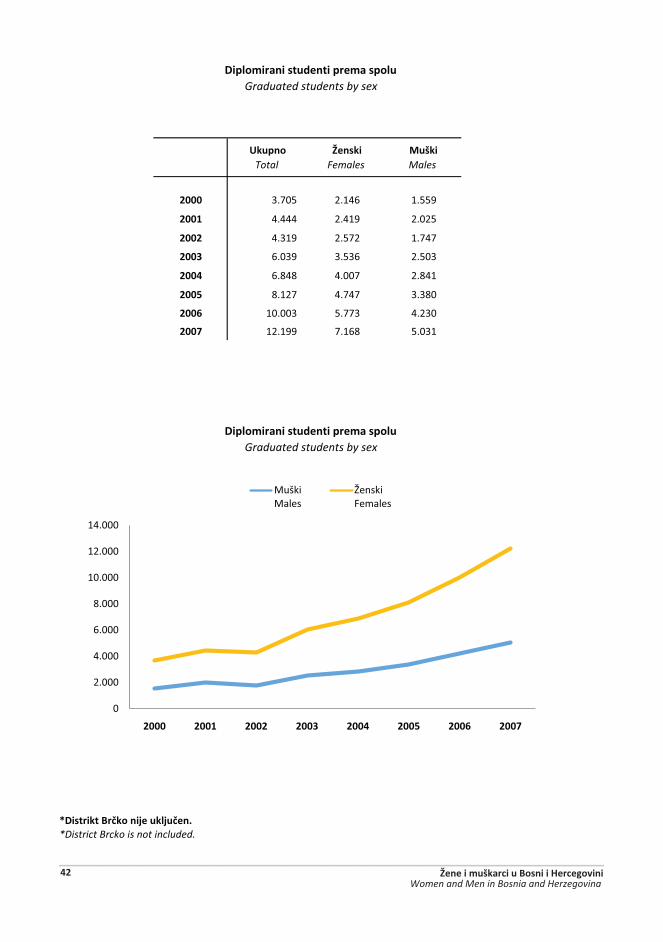
)�$(���Total
������Females
$!��Males
2000 3.705 2.146 1.559
2001 4.444 2.419 2.025
2002 4.319 2.572 1.747
2003 6.039 3.536 2.503
2004 6.848 4.007 2.841
2005 8.127 4.747 3.380
2006 10.003 5.773 4.230
2007 12.199 7.168 5.031
��������N�/����#��$��#$/��]*District Brcko is not included.
Graduated students by sex�(��%������$�����(��%���(��$�
�(��%������$�����(��%���(��$�Graduated students by sex
0
2.000
4.000
6.000
8.000
10.000
12.000
14.000
2000 2001 2002 2003 2004 2005 2006 2007
5����5����
������{� ����
�����������������������������������������42 Žene i muškarci u Bosni i Hercegovini
Women and Men in Bosnia and Herzegovina
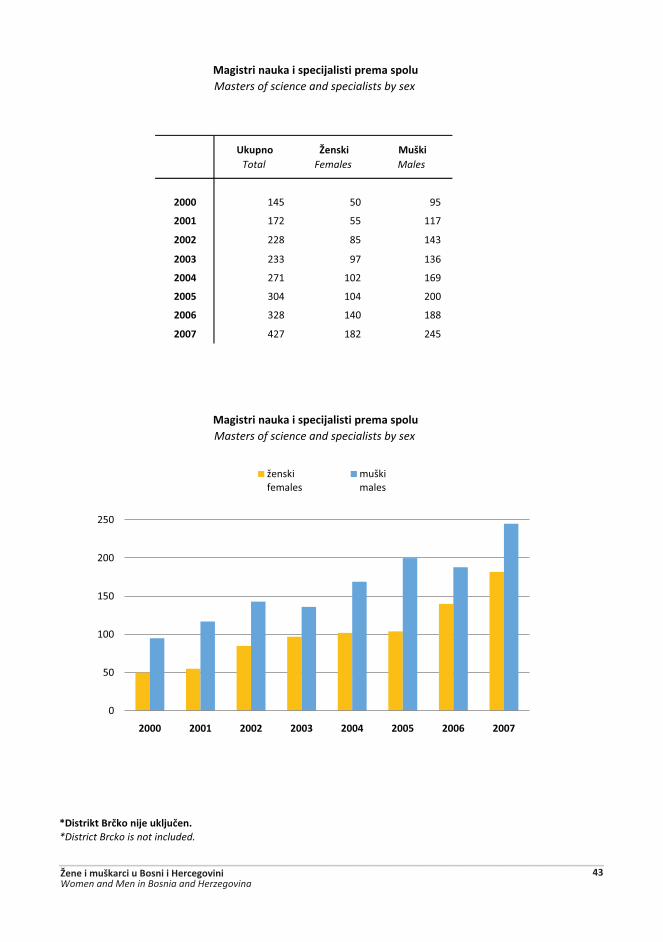
)�$(���Total
������Females
$!��Males
2000 145 50 95
2001 172 55 117
2002 228 85 143
2003 233 97 136
2004 271 102 169
2005 304 104 200
2006 328 140 188
2007 427 182 245
��������N�/����#��$��#$/��]*District Brcko is not included.
��������$�����(��#�����(��%���(��$Masters of science and specialists by sex
��������$�����(��#�����(��%���(��$Masters of science and specialists by sex
0
50
100
150
200
250
2000 2001 2002 2003 2004 2005 2006 2007
������)� ����
���� ����
�����������������������������������������Žene i muškarci u Bosni i Hercegovini 43Women and Men in Bosnia and Herzegovina
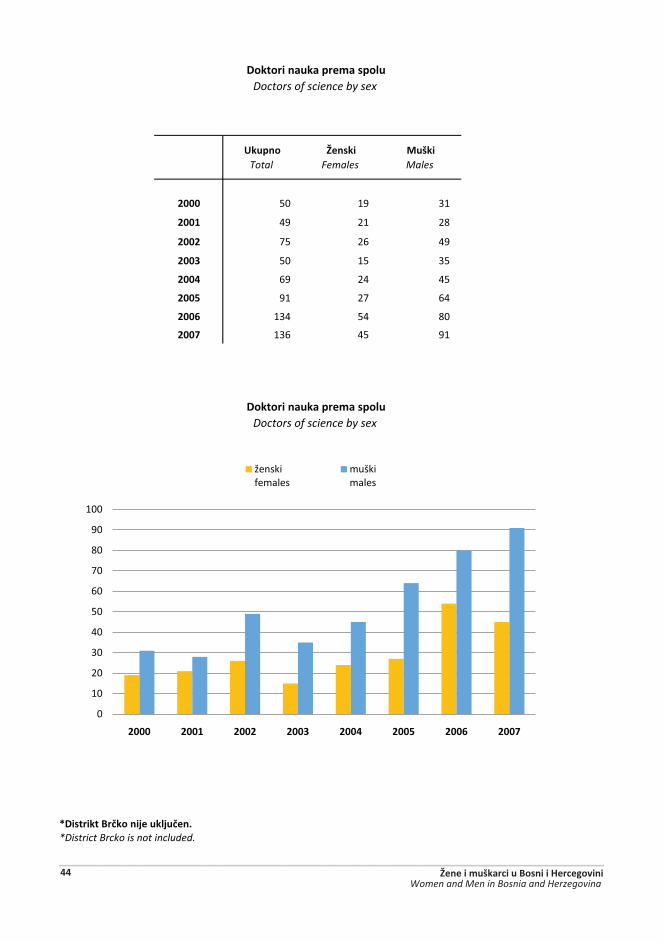
)�$(���Total
������Females
$!��Males
2000 50 19 31
2001 49 21 28
2002 75 26 49
2003 50 15 35
2004 69 24 45
2005 91 27 64
2006 134 54 80
2007 136 45 91
��������N�/����#��$��#$/��]*District Brcko is not included.
Doctors of science by sex���������$���(��%���(��$
Doctors of science by sex���������$���(��%���(��$
0
10
20
30
40
50
60
70
80
90
100
2000 2001 2002 2003 2004 2005 2006 2007
������)� ����
���� ����
�����������������������������������������44 Žene i muškarci u Bosni i Hercegovini
Women and Men in Bosnia and Herzegovina

��*?�J�=����J�>��;?���C�������*?�J�=��EMPLOYEES AND PERSONS LOOKING FOR EMPLOYMENT
2000 568.175 201.986 366.189
2001 554.965 200.571 354.394
2002 533.887 199.143 334.744
2003 518.810 195.514 323.296
2004 517.166 197.429 319.737
2005 513.847 198.280 315.567
2006 506.461 199.648 306.813
2007 668.313 258.887 409.426
2008 702.332 275.528 426.804
��(������(��%���(��$�Employees by sex
��(������(��%���(��$�Employees by sex
)�$(��Total
�����Females
$!�Males
0
50.000
100.000
150.000
200.000
250.000
300.000
350.000
400.000
450.000
2000 2001 2002 2003 2004 2005 2006 2007 2008
�����{� ����
Muški5����
�����������������������������������������Žene i muškarci u Bosni i Hercegovini 45Women and Men in Bosnia and Herzegovina
2007
2008
2007
2008
2007
2008
668.
313
702.
332
258.
887
275.
528
409.
426
426.
804
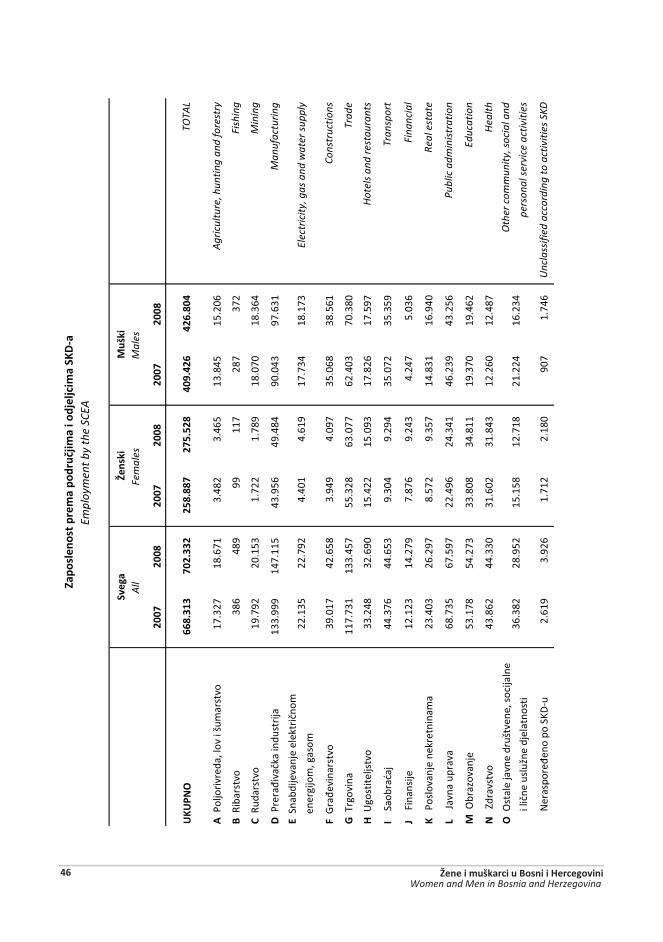
A��G
����
�
����
�����
���
���
��17
.327
18.6
713.
482
3.46
513
.845
15.2
06
N��]
��
����
386
489
9911
728
737
2
C��]
���
����
19.7
9220
.153
1.72
21.
789
18.0
7018
.364
D��G
��
(��
����
���
��
��13
3.99
914
7.11
543
.956
49.4
8490
.043
97.6
31
���?
����
����
����
����
��
��
�
�����
���
��
�����
�
F��^
�(�
���
���
�39
.017
42.6
583.
949
4.09
735
.068
38.5
61
G���
���
��
117.
731
133.
457
55.3
2863
.077
62.4
0370
.380
X��+
����
�����
���
33.2
4832
.690
15.4
2215
.093
17.8
2617
.597
I����?
���
�"��
44.3
7644
.653
9.30
49.
294
35.0
7235
.359
�����{
���
���
12.1
2314
.279
7.87
69.
243
4.24
75.
036
;���G
����
����
����
���
���
�
23.4
0326
.297
8.57
29.
357
14.8
3116
.940
J����
<���
����
���
68.7
3567
.597
22.4
9624
.341
46.2
3943
.256
��E
���
����
��53
.178
54.2
7333
.808
34.8
1119
.370
19.4
62
N���
*��
����
�43
.862
44.3
3031
.602
31.8
4312
.260
12.4
87
O��E
����
����
����
���
����
����
����
���
�����
����
����
����
����
����
����
�����Y
���
���
(���
����
?�6
��2.
619
3.92
61.
712
2.18
090
71.
746
);)
*=?
TOTA
L
A
gric
ultu
re, h
untin
g an
d fo
rest
ry
Fi
shin
g
M
inin
g
Unc
lass
ified
acc
ordi
ng to
act
iviti
es S
KD
Re
al e
stat
e
Pu
blic
adm
inis
trat
ion
Ed
ucat
ion
H
ealth
O
ther
com
mun
ity, s
ocia
l and
��(�
����
����
(��%
��(�
��$/
#%��
���#
��#�
%��
�;�
_�Em
ploy
men
t by
the
SCEA
pe
rson
al s
ervi
ce a
ctiv
ities
36.3
8215
.158
21.2
24
Co
nstr
uctio
ns
Tr
ade
H
otel
s an
d re
stau
rant
s
Tr
ansp
ort
Fi
nanc
ial
M
anuf
actu
ring
22.1
354.
401
17.7
34
Elec
tric
ity, g
as a
nd w
ater
sup
ply
����
�A
ll��
���
Fem
ales
$!
�M
ales
22.7
92
28.9
52
4.61
9
12.7
18
18.1
73
16.2
34
�����������������������������������������46 Žene i muškarci u Bosni i Hercegovini
Women and Men in Bosnia and Herzegovina
)�$(���Total
������Females
$!��Males
2000 419.780 230.143 278.466
2001 425.830 190.779 230.033
2002 442.342 192.861 234.595
2003 450.175 197.322 236.765
2004 472.972 218.330 254.642
2005 508.478 236.033 272.446
2006 516.216 240.957 274.731
2007 526.178 249.817 275.907
2008 493.405 245.792 247.613
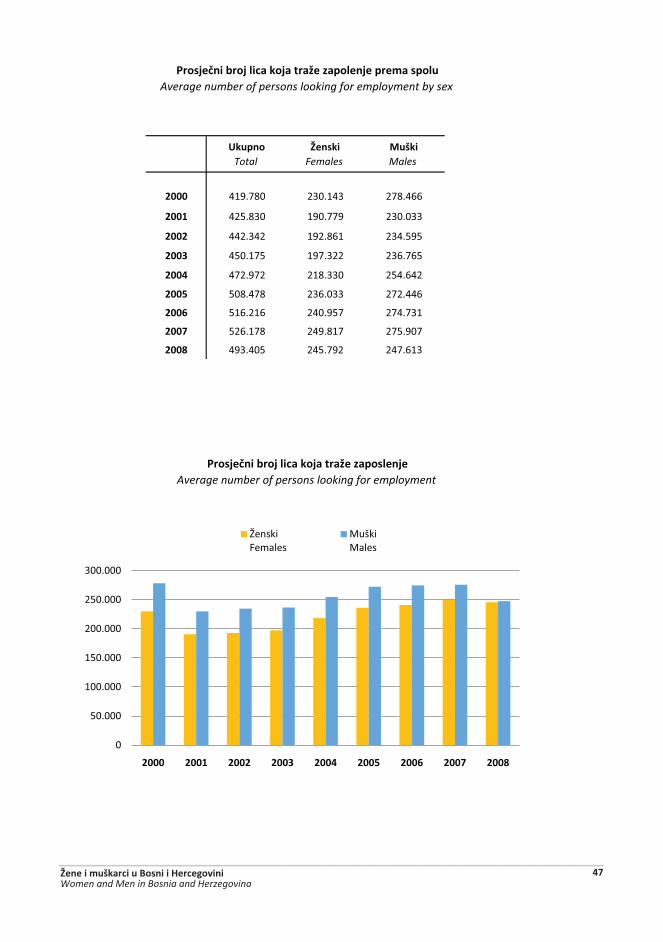
*���#�/��&��#�������#�����'����(�����#�Average number of persons looking for employment
Average number of persons looking for employment by sex*���#�/��&��#�������#�����'����(����#��(��%���(��$
0
50.000
100.000
150.000
200.000
250.000
300.000
2000 2001 2002 2003 2004 2005 2006 2007 2008
������{� ����
5����5����
�����������������������������������������Žene i muškarci u Bosni i Hercegovini 47Women and Men in Bosnia and Herzegovina
(000)
2007 2008 2007 2008 2007 2008
`]�)�$(����������!����{����\| Total population (3+6+7)
3.315 3.211 1.703 1.645 1.613 1.566
Y]��������(���&����������!�������Working age population
2.725 2.649 1.408 1.371 1.317 1.278
�]�������������{y��| Labour force (4+5)
1.196 1.162 436 433 760 729
y]���(����� Persons in employment
850 890 292 317 557 573
�]�=���(����� Unemployed persons
347 272 144 116 203 156
�]�=������ Inactive persons
1.529 1.486 972 938 557 549
\]�J���%��"�����`�����������Persons less then 15 years
590 563 294 274 296 289
w]�J������`��_��y������ Persons 15 - 64 years
2.235 2.120 1.128 1.071 1.107 1.048
���(����������Activity rate
43,9 43,9 31,0 31,6 57,7 57,1
���(����(��������Employment rate
31,2 33,6 20,8 23,1 42,3 44,9
���(������(��������Unemployment rate
29,0 23,4 32,9 26,8 26,7 21,4
)/�! ���������!�����(���`�������Share of population under 15 age
17,8 17,5 17,3 16,7 18,3 18,4
)/�! ���������!�����������`��_��y������Share of population 15 - 64 age
67,4 66,0 66,2 65,1 68,6 66,9
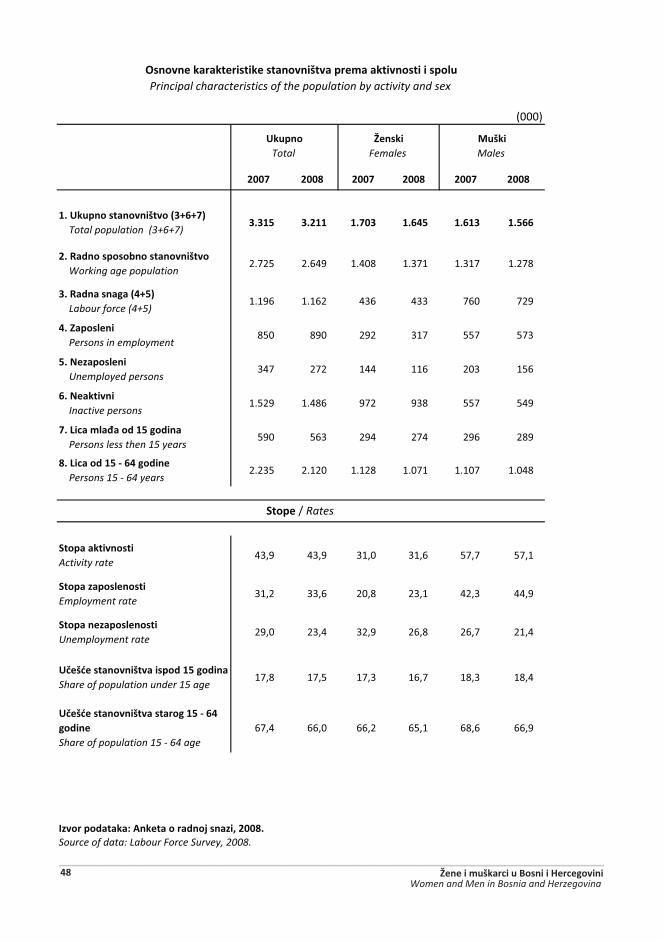
������(�����������������������#�������Y[[w]Source of data: Labour Force Survey, 2008.
?���������������������������!����(��%�������������(��$Principal characteristics of the population by activity and sex
���(��[�Rates
)�$(���������Total
������Females
$!��Males
�����������������������������������������48 Žene i muškarci u Bosni i Hercegovini
Women and Men in Bosnia and Herzegovina

������(�����������������������#�������Y[[w]Source of data: Labour Force Survey, 2008.
?���������������������������!����(��%�������������(��$�$�Y[[w]�����Principal characteristics of the population by activity and sex in 2008.
31,6
23,126,8
57,1
44,9
21,4
?�������������4����\����
?����������������� ���\ �������
?������������������+�� ���\ �������
������{� ����
5����5����
�����������������������������������������Žene i muškarci u Bosni i Hercegovini 49Women and Men in Bosnia and Herzegovina
(%)
2007 2008 2007 2008 2007 2008
)�$(�� 43,9 43,9 31,2 33,6 29,0 23,4 Total
15 - 24 33,4 33,2 13,9 17,4 58,4 47,5 15 - 24
25 - 49 67,0 68,6 48,8 53,4 27,1 22,1 25 - 49
50 - 64 38,9 40,5 31,9 34,4 17,8 15,2 50 - 64
65 + 5,9 5,4 5,7 5,4 � � 65 +
15 - 64 52,2 53,5 36,8 40,7 29,6 24,0 15 - 64
)�$(�� 31,0 31,6 20,8 23,1 32,9 26,8 Total
15 - 24 25,7 25,6 9,5 12,2 63,1 52,3 15 - 24
25 - 49 50,2 52,4 34,2 38,4 31,9 26,7 25 - 49
50 - 64 23,7 25,7 19,7 22,4 16,6 (13,0) 50 - 64
65 + (3,6) (3,2) (3,6) (3,2) � - 65 +
15 - 64 37,8 39,5 25,0 28,7 33,7 27,4 15 - 64
)�$(�� 57,7 57,1 42,3 44,9 26,7 21,4 Total
15 - 24 40,8 40,0 18,1 22,1 55,6 44,8 15 - 24
25 - 49 84,0 85,1 63,6 68,8 24,3 19,2 25 - 49
50 - 64 55,4 57,2 45,2 47,9 18,4 16,3 50 - 64
65 + 9,0 8,3 8,6 8,2 � � 65 +
15 - 64 67,0 67,7 48,7 52,9 27,3 21,9 15 - 64
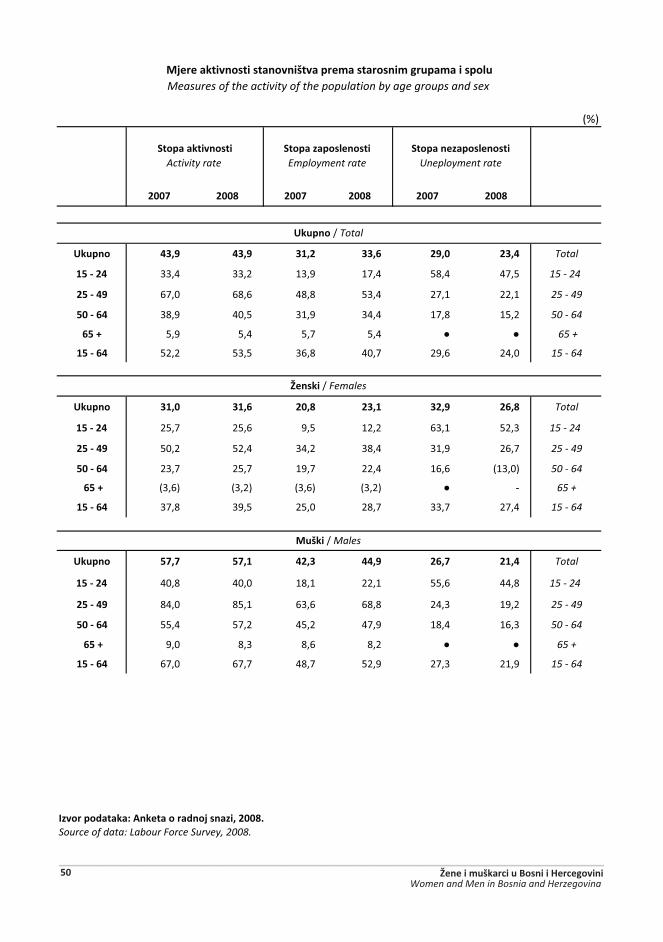
������(�����������������������#�������Y[[w]Source of data: Labour Force Survey, 2008.
)�$(���[�Total
������[�Females
$!��[�Males
#��������������������!����(��%���������%���$(�%����(��$Measures of the activity of the population by age groups and sex
���(�����������Activity rate
���(����(���������Employment rate
���(������(���������Uneployment rate
�����������������������������������������50 Žene i muškarci u Bosni i Hercegovini
Women and Men in Bosnia and Herzegovina

������(�����������������������#�������Y[[w]Source of data: Labour Force Survey, 2008.
���(����(����������������!����(��%���������%���$(�%����(��$�$�Y[[w]�����Employment rate of the population by age groups and sex in 2008.
0
20
40
60
80
100
120
-C�- %`� %C�- 49 C&�- 64 65+
muški ����
�����)� ����
�����������������������������������������Žene i muškarci u Bosni i Hercegovini 51Women and Men in Bosnia and Herzegovina
(000)
2007 2008 2007 2008 2007 2008
)�$(���Total
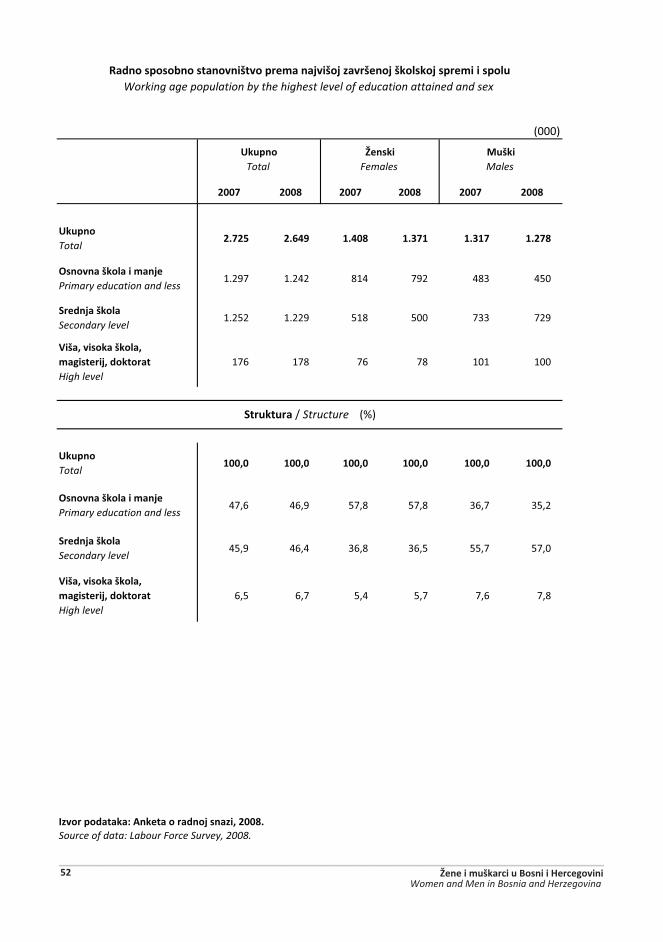
2.725 2.649 1.408 1.371 1.317 1.278
?�������!������%��#�Primary education and less
1.297 1.242 814 792 483 450
�����#��!�����Secondary level
1.252 1.229 518 500 733 729
@!���������!������%������#����������High level
176 178 76 78 101 100
�
)�$(���Total
100,0 100,0 100,0 100,0 100,0 100,0
?�������!������%��#�Primary education and less
47,6 46,9 57,8 57,8 36,7 35,2
�����#��!�����Secondary level
45,9 46,4 36,8 36,5 55,7 57,0
@!���������!������%������#����������High level
6,5 6,7 5,4 5,7 7,6 7,8
������(�����������������������#�������Y[[w]Source of data: Labour Force Survey, 2008.
�������(���&����������!����(��%����#�!�#�����!���#�!������#��(��%���(��$�������������������
���$��$���[�Structure ���=�>
)�$(����Total
�������Females
$!����Males
Working age population by the highest level of education attained and sex
�����������������������������������������52 Žene i muškarci u Bosni i Hercegovini
Women and Men in Bosnia and Herzegovina

������(�����������������������#�������Y[[w]Source of data: Labour Force Survey, 2008.
���$��$����������(���&�����������!����(��%��!������#��(��%�$�Y[[w]�����Structure of working age population by level of education in 2008.
57,8
36,5
5,7
35,2
57,0
7,8
E�������������� ����G �\������������������
?������������?������\������
1����������������� ���������������
���������
�������{� ����
5������5����
�����������������������������������������Žene i muškarci u Bosni i Hercegovini 53Women and Men in Bosnia and Herzegovina
(000)
2007 2008 2007 2008 2007 2008
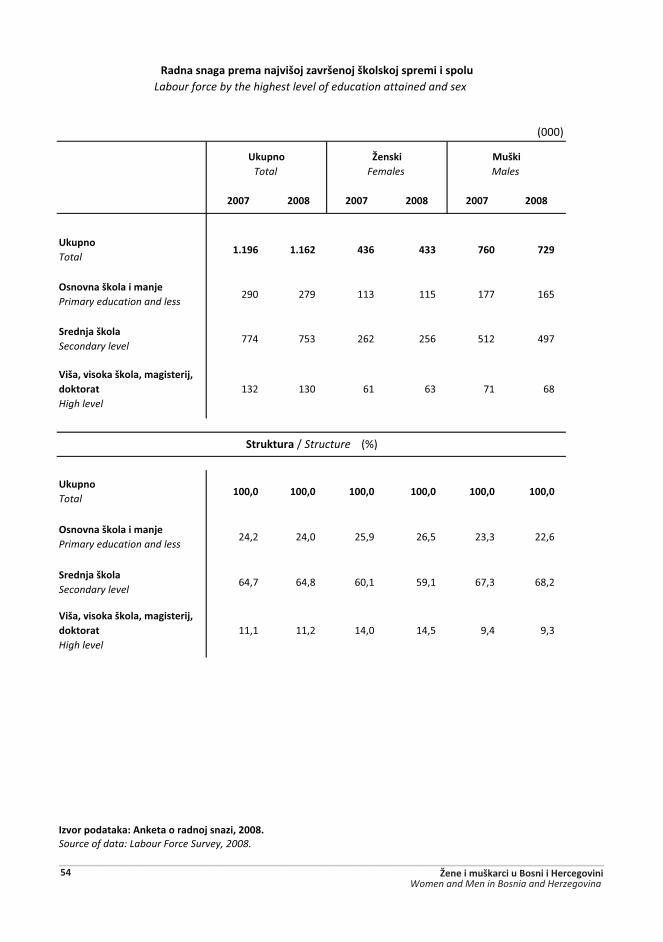
)�$(���Total
1.196 1.162 436 433 760 729
?�������!������%��#�Primary education and less
290 279 113 115 177 165
�����#��!�����Secondary level
774 753 262 256 512 497
@!���������!������%������#����������High level
132 130 61 63 71 68
�
)�$(���Total
100,0 100,0 100,0 100,0 100,0 100,0
?�������!������%��#�Primary education and less
24,2 24,0 25,9 26,5 23,3 22,6
�����#��!�����Secondary level
64,7 64,8 60,1 59,1 67,3 68,2
@!���������!������%������#����������High level
11,1 11,2 14,0 14,5 9,4 9,3
������(�����������������������#�������Y[[w]Source of data: Labour Force Survey, 2008.
���$��$���[�Structure ���=�>
����������������(��%����#�!�#�����!���#�!������#��(��%���(��$���������������������������������Labour force by the highest level of education attained and sex
)�$(����Total
�������Females
$!����Males
�����������������������������������������54 Žene i muškarci u Bosni i Hercegovini
Women and Men in Bosnia and Herzegovina
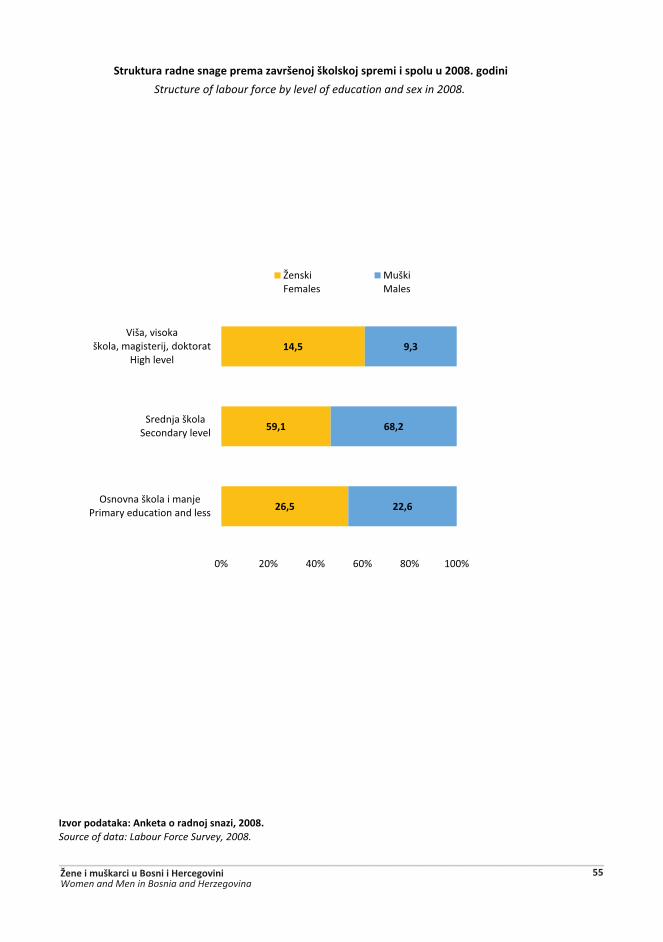
������(�����������������������#�������Y[[w]Source of data: Labour Force Survey, 2008.
���$��$���������������(��%������!���#�!������#��(��%���(��$�$�Y[[w]�����
Structure of labour force by level of education and sex in 2008.
26,5
59,1
14,5
22,6
68,2
9,3
0% 20% 40% 60% 80% 100%
E�������������� ����G �\������������������
?������������?������\������
1����������������� ���������������
���������
�������{� ����
5������5����
�����������������������������������������Žene i muškarci u Bosni i Hercegovini 55Women and Men in Bosnia and Herzegovina
� �
(000)
2007 2008 2007 2008 2007 2008
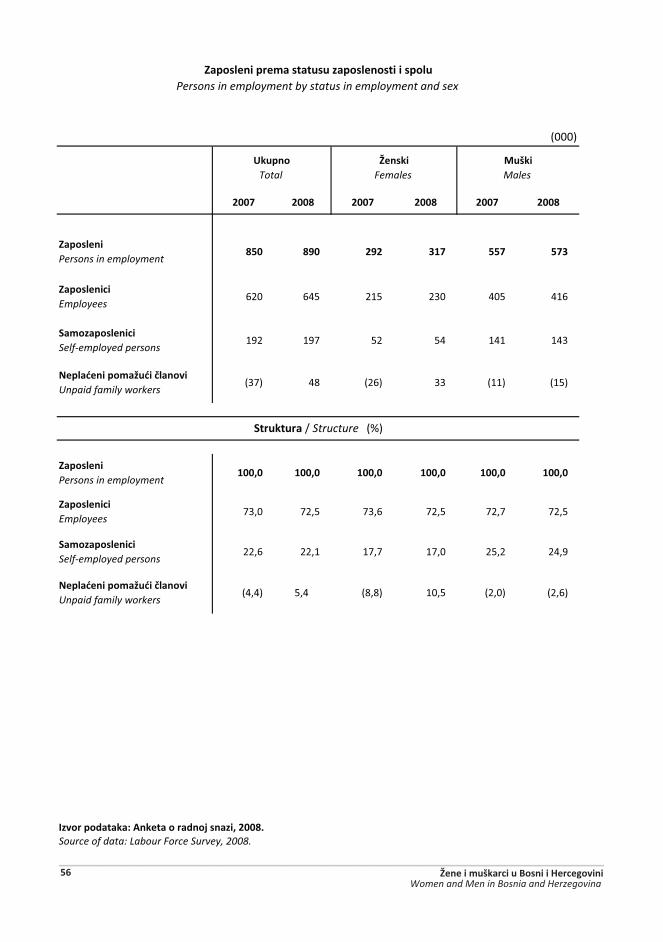
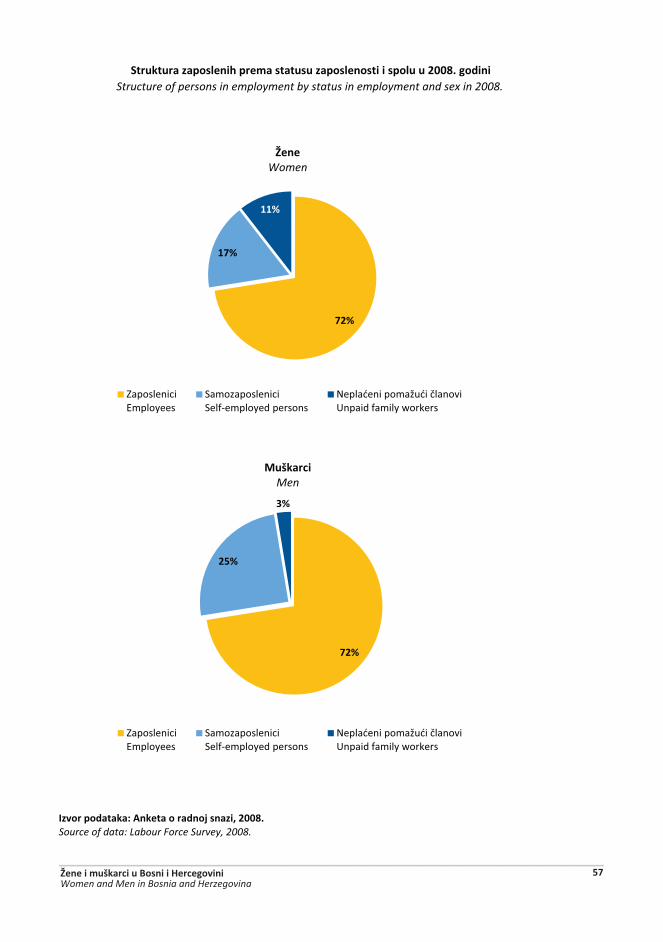
��(�����Persons in employment
850 890 292 317 557 573
��(������Employees
620 645 215 230 405 416
��%���(������Self-employed persons
192 197 52 54 141 143
=�(�� ���(�%�'$ �/�����Unpaid family workers
(37) 48 (26) 33 (11) (15)
��(�����Persons in employment
100,0 100,0 100,0 100,0 100,0 100,0
��(������Employees
73,0 72,5 73,6 72,5 72,7 72,5
��%���(������Self-employed persons
22,6 22,1 17,7 17,0 25,2 24,9
=�(�� ���(�%�'$ �/�����Unpaid family workers
(4,4) 5,4 (8,8) 10,5 (2,0) (2,6)
������(�����������������������#�������Y[[w]Source of data: Labour Force Survey, 2008.
���$��$���[�Structure ��=�>
��(������(��%������$�$���(�����������(��$Persons in employment by status in employment and sex
)�$(����Total
�������Females
$!����Males
�����������������������������������������56 Žene i muškarci u Bosni i Hercegovini
Women and Men in Bosnia and Herzegovina
������(�����������������������#�������Y[[w]Source of data: Labour Force Survey, 2008.
���$��$�����(�������(��%������$�$���(�����������(��$�$�Y[[w]�����Structure of persons in employment by status in employment and sex in 2008.
\Y^
`\^
``^
����Women
*��������� ���\���
?� ����������?��)-� ���\���������
Y����"����� ���"�������+�����)� �\�X����
\Y^
Y�^
�^
$!����Men
*��������� ���\���
?� ����������?��)-� ���\���������
Y����"����� ���"�������+�����)� �\�X����
�����������������������������������������Žene i muškarci u Bosni i Hercegovini 57Women and Men in Bosnia and Herzegovina

� �
(000)
2007 2008 2007 2008 2007 2008
)�$(��Total
850 890 292 317 557 573
*��#�(�������Agriculture
168 183 62 71 106 113
=�(��#�(��������Industry
277 289 53 59 224 230
)��$'����#���������Services
404 418 177 188 227 230
)�$(��Total
100,0 100,0 100,0 100,0 100,0 100,0
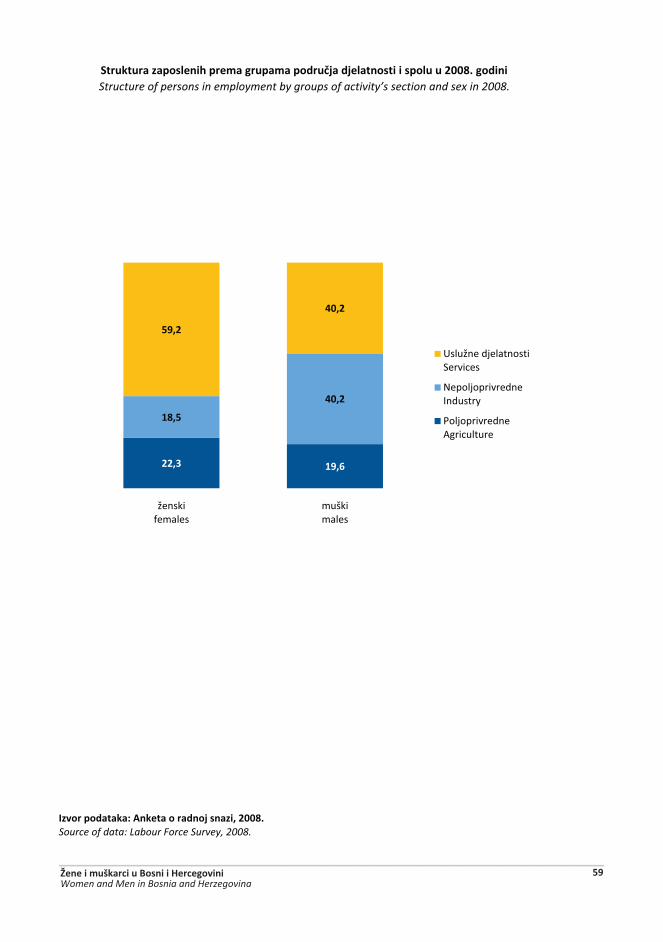
*��#�(�������Agriculture
19,8 20,6 21,3 22,3 19,0 19,6
=�(��#�(��������Industry
32,6 32,5 18,1 18,5 40,2 40,2
)��$'����#���������Services
47,6 47,0 60,6 59,2 40,8 40,2
������(�����������������������#�������Y[[w]Source of data: Labour Force Survey, 2008.
¹ ��$(��(���$/#���#���������{=�>������`]`|��(��#�(��������{��N|����(��#�(��������{>������|��$��$'���{��X�����;�J��=�?�*��|��¹ �groups of activity’s section (NACE Rev 1.1): agriculture (A,B), industry (C,D,E,F), services (G,H,I,J,K,L,M,N,O,P,Q)
���$��$���[�Structure ��=�>
��(������(��%����$(�%��(���$/#���#������������(��$
Persons in employment by groups of activity’s section ¹ and sex
)�$(����Total
�������Females
$!����Males
�����������������������������������������58 Žene i muškarci u Bosni i Hercegovini
Women and Men in Bosnia and Herzegovina
������(�����������������������#�������Y[[w]Source of data: Labour Force Survey, 2008.
���$��$�����(�������(��%����$(�%��(���$/#���#�����������(��$�$�Y[[w]������Structure of persons in employment by groups of activity’s section and sex in 2008.
22,3 19,6
18,5
40,2
59,2
40,2
�����)� ����
muški ����
+������������������?�����
Y�������������������\
G����������4�������
�����������������������������������������Žene i muškarci u Bosni i Hercegovini 59Women and Men in Bosnia and Herzegovina
������(�����������������������#�������Y[[w]Source of data: Labour Force Survey, 2008.
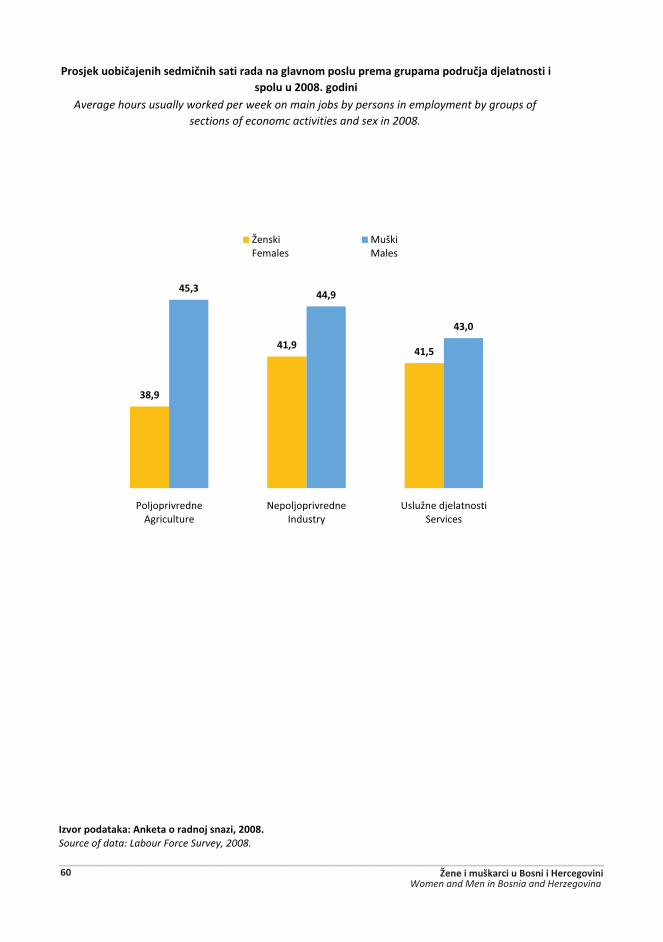
*���#���$�&/�#�������%/���������������������%�(���$�(��%����$(�%��(���$/#���#�������� i �(��$�$�Y[[w]�����
Average hours usually worked per week on main jobs by persons in employment by groups of sections of economc activities and sex in 2008.
38,9
41,941,5
45,344,9
43,0
G����������4�������
Y�������������������\
+������������������?�����
�������{� ����
5������5����
�����������������������������������������60 Žene i muškarci u Bosni i Hercegovini
Women and Men in Bosnia and Herzegovina
(000)
2007 2008 2007 2008 2007 2008
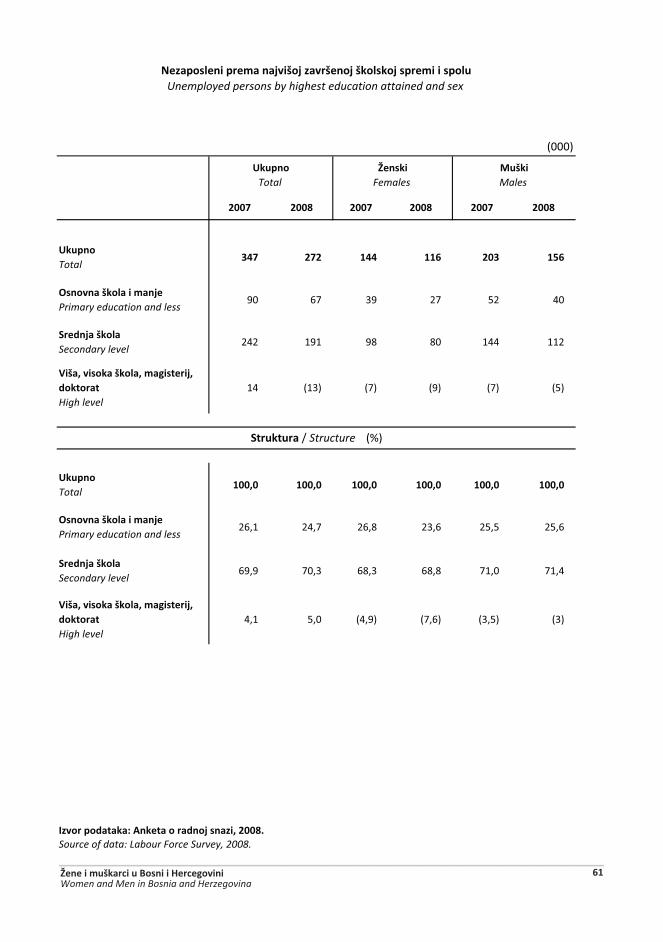
)�$(��Total
347 272 144 116 203 156
?�������!������%��#�Primary education and less
90 67 39 27 52 40
�����#��!����Secondary level
242 191 98 80 144 112
@!���������!������%������#����������High level
14 (13) (7) (9) (7) (5)
�
)�$(��Total
100,0 100,0 100,0 100,0 100,0 100,0
?�������!������%��#�Primary education and less
26,1 24,7 26,8 23,6 25,5 25,6
�����#��!����Secondary level
69,9 70,3 68,3 68,8 71,0 71,4
@!���������!������%������#����������High level
4,1 5,0 (4,9) (7,6) (3,5) (3)
������(�����������������������#�������Y[[w]Source of data: Labour Force Survey, 2008.
=���(������(��%����#�!�#�����!���#�!������#��(��%���(��$�Unemployed persons by highest education attained and sex
���$��$���[�Structure ���=�>
)�$(����Total
�������Females
$!����Males
�����������������������������������������Žene i muškarci u Bosni i Hercegovini 61Women and Men in Bosnia and Herzegovina

������(�����������������������#�������Y[[w]Source of data: Labour Force Survey, 2008.
���(������(���������(��%��!������#��(��%���(��$�$�Y[[w]�����Rate of unemployed persons by highest education attained and sex in 2008.
23,8
31,2
14,1
24,3
22,4
6,9
E�������������� ����G �\������������������
?�����������?������\�������
1����������������� ���������������
���������
�����)� ����
muški ����
�����������������������������������������62 Žene i muškarci u Bosni i Hercegovini
Women and Men in Bosnia and Herzegovina

(000)
2007 2008 2007 2008 2007 2008
)�$(��Total
347 272 144 116 203 156
��!��(���������#�!��������found job, but still not working
((2)) ((3)) � ((2)) ((2)) �
%��#�������%#����less then 5 months
20 16 (7) (7) (12) (9)
��������``�%#����6 - 11 months
25 18 (12) (7) (14) (11)
���`Y����Y��%#�����12 - 23 months
34 29 16 (13) 18 17
���Yy�����q�%#����24 - 59 months
92 66 38 29 54 37
����[����``q�%#����60 - 119 months
80 66 32 29 48 37
`Y[���!��%#����120 and more months
94 74 38 30 56 44
)�$(��Total
100,0 100,0 100,0 100,0 100,0 100,0
��!��(���������#�!��������found job, but still not working
((0,7)) ((1,1)) � ((1,4)) ((0,8)) �
%��#�������%#����less then 5 months
5,6 5,9 (5,0) (5,9) (6,1) (5,9)
��������``�%#����6 - 11 months
7,3 6,7 (8,1) (6,2) 6,7 (7,1)
���`Y����Y��%#�����12 - 23 months
9,8 10,8 11,2 10,8 8,7 10,8
���Yy�����q�%#����24 - 59 months
26,4 24,3 26,4 25,4 26,4 23,5
����[����``q�%#����60 - 119 months
23,0 24,1 22,1 24,7 23,6 23,7
`Y[���!��%#����120 and more months
27,3 27,0 26,7 25,7 27,7 28,0
������(�����������������������#�������Y[[w]Source of data: Labour Force Survey, 2008.
���$��$���[�Structure (%)
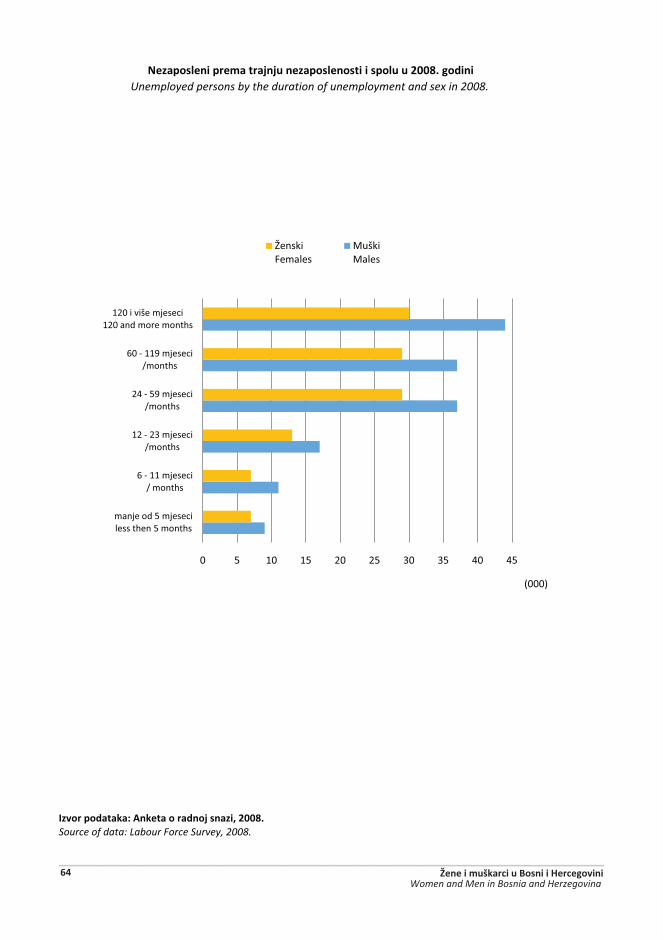
=���(������(��%�����#��#$�����(�����������(��$Unemployed persons by duration of unemployment and sex
)�$(����Total
�������Females
$!����Males
�����������������������������������������Žene i muškarci u Bosni i Hercegovini 63Women and Men in Bosnia and Herzegovina
(000)
������(�����������������������#�������Y[[w]Source of data: Labour Force Survey, 2008.
=���(������(��%�����#�#$�����(�����������(��$�$�Y[[w]�����Unemployed persons by the duration of unemployment and sex in 2008.
0 5 10 15 20 25 30 35 40 45
��������C� ���������������C� �����
q�- --� �����[� �����
-%�- %�� �����[ �����
%`�- C�� �����[ �����
q&�- --�� �����[ �����
-%&������ �����-%&����� ��� �����
�������{� ����
5������5����
�����������������������������������������64 Žene i muškarci u Bosni i Hercegovini
Women and Men in Bosnia and Herzegovina
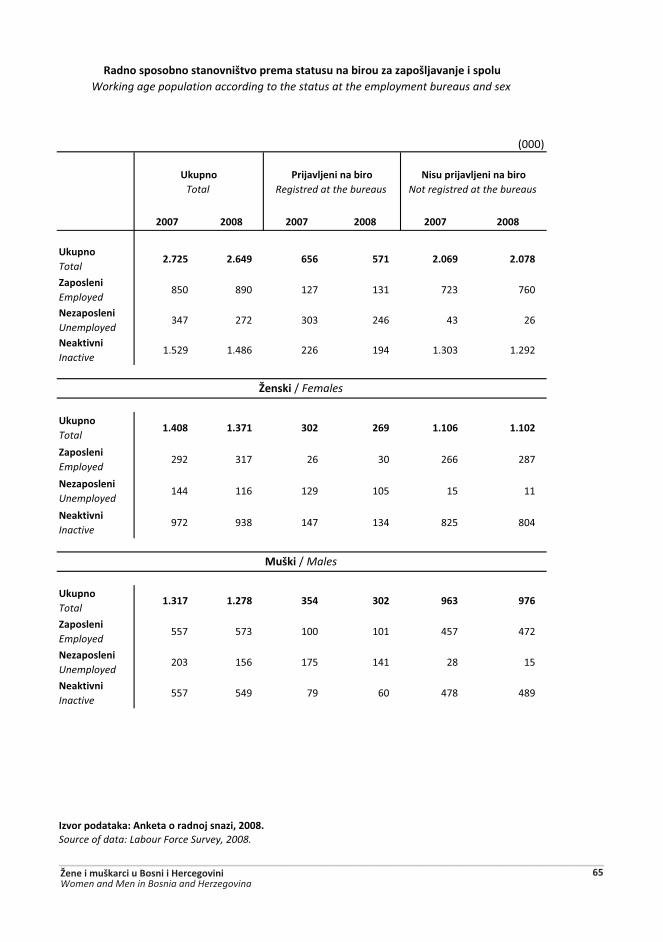
(000)
2007 2008 2007 2008 2007 2008
)�$(��Total
2.725 2.649 656 571 2.069 2.078
��(�����Employed
850 890 127 131 723 760
=���(�����Unemployed
347 272 303 246 43 26
=������Inactive
1.529 1.486 226 194 1.303 1.292
)�$(��Total
1.408 1.371 302 269 1.106 1.102
��(�����Employed
292 317 26 30 266 287
=���(�����Unemployed
144 116 129 105 15 11
=������Inactive
972 938 147 134 825 804
)�$(��Total
1.317 1.278 354 302 963 976
��(�����Employed
557 573 100 101 457 472
=���(�����Unemployed
203 156 175 141 28 15
=������Inactive
557 549 79 60 478 489
������(�����������������������#�������Y[[w]Source of data: Labour Force Survey, 2008.
�������(���&����������!����(��%������$�$����&��$������(�!�#����#����(��$Working age population according to the status at the employment bureaus and sex
������[ Females
$!��[ Males
)�$(���Total
*�#���#������&��Registred at the bureaus
=�$�(�#���#������&��Not registred at the bureaus
�����������������������������������������Žene i muškarci u Bosni i Hercegovini 65Women and Men in Bosnia and Herzegovina
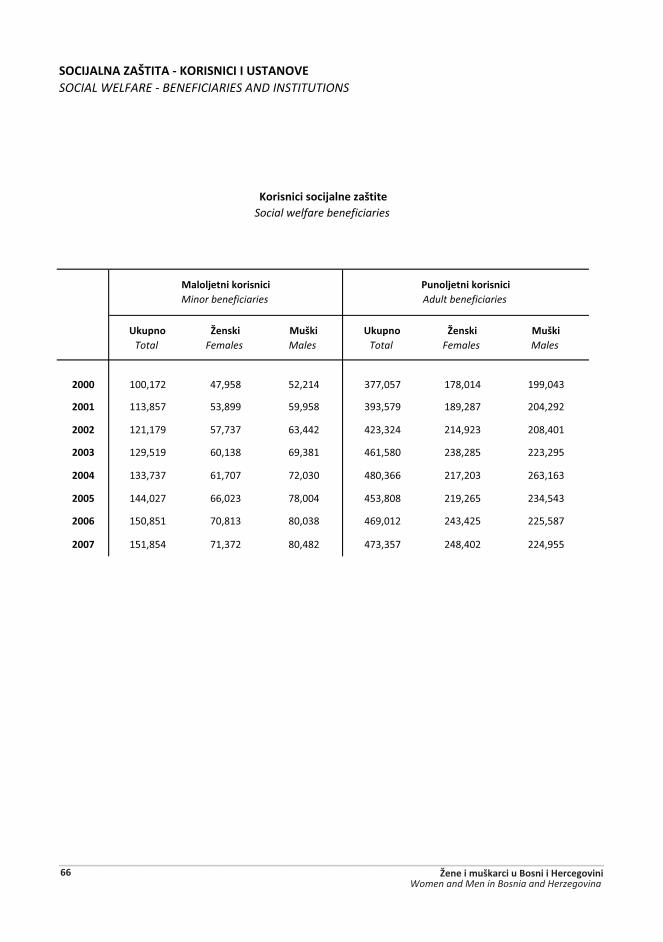
�?>���J=����KC�C��_�;?���=�>����)�C�=?@�SOCIAL WELFARE - BENEFICIARIES AND INSTITUTIONS
)�$(���Total
������Females
$!��Males
)�$(���Total
������Females
$!��Males
2000 100,172 47,958 52,214 377,057 178,014 199,043
2001 113,857 53,899 59,958 393,579 189,287 204,292
2002 121,179 57,737 63,442 423,324 214,923 208,401
2003 129,519 60,138 69,381 461,580 238,285 223,295
2004 133,737 61,707 72,030 480,366 217,203 263,163
2005 144,027 66,023 78,004 453,808 219,265 234,543
2006 150,851 70,813 80,038 469,012 243,425 225,587
2007 151,854 71,372 80,482 473,357 248,402 224,955
����#����������Minor beneficiaries
*$���#����������Adult beneficiaries
;���������#�������!���Social welfare beneficiaries
�����������������������������������������66 Žene i muškarci u Bosni i Hercegovini
Women and Men in Bosnia and Herzegovina
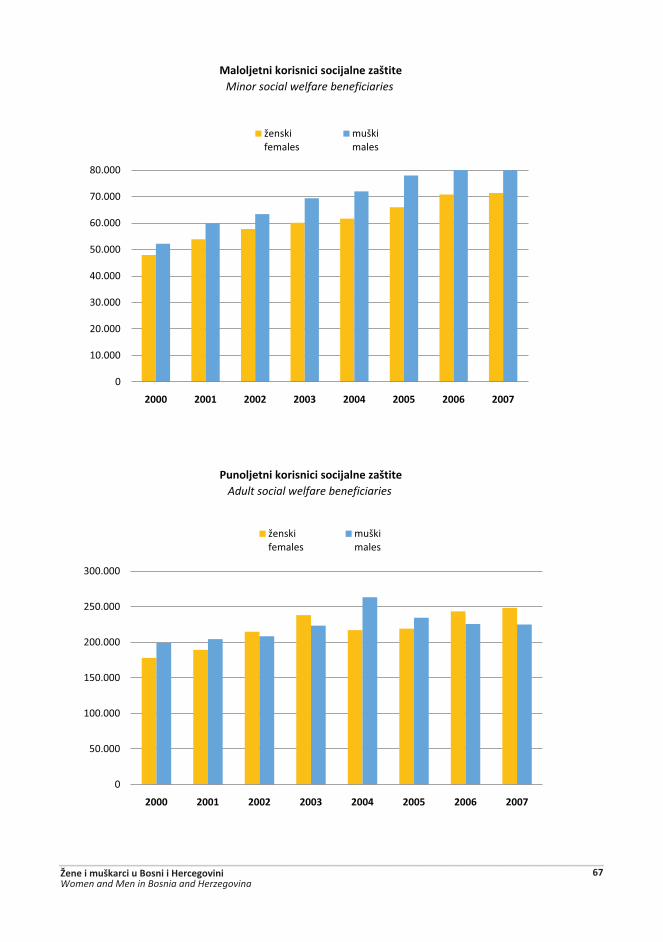
����#��������������#�������!���Minor social welfare beneficiaries
*$���#��������������#�������!���Adult social welfare beneficiaries
0
10.000
20.000
30.000
40.000
50.000
60.000
70.000
80.000
2000 2001 2002 2003 2004 2005 2006 2007
�������)� ����
���� ����
0
50.000
100.000
150.000
200.000
250.000
300.000
2000 2001 2002 2003 2004 2005 2006 2007
������)� ����
���� ����
�����������������������������������������Žene i muškarci u Bosni i Hercegovini 67Women and Men in Bosnia and Herzegovina
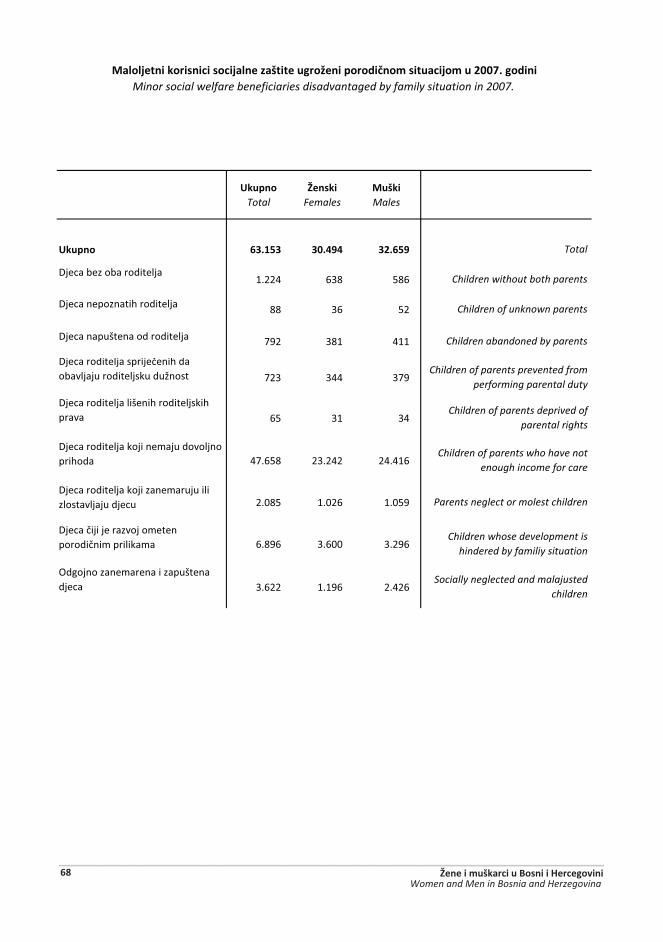
)�$(��Total
�����Females
$!�Males
)�$(�� 63.153 30.494 32.659
6���������������������1.224 638 586
6����������������������� 88 36 52
6�������������������������� 792 381 411
6����������������������������������������������������� 723 344 379
6���������������������������������� 65 31 34
6������������������� ������������������� 47.658 23.242 24.416
6��������������������� �������������������������� 2.085 1.026 1.059
6������������������ ����������� ����� �� 6.896 3.600 3.296
E����������� ���������������������� 3.622 1.196 2.426
����#��������������#�������!����$���'���(����/��%���$��#�%�$�Y[[\]�����Minor social welfare beneficiaries disadvantaged by family situation in 2007.
Socially neglected and malajusted children
Children without both parents
Children abandoned by parents
Children of unknown parents
Total
Children of parents prevented from performing parental duty
Children of parents deprived of parental rights
Children of parents who have not enough income for care
Parents neglect or molest children
Children whose development is hindered by familiy situation
�����������������������������������������68 Žene i muškarci u Bosni i Hercegovini
Women and Men in Bosnia and Herzegovina

)�$(��Total
�����Females
$!�Males
)�$(��� 473.357 248.402 224.955
���������������������������15.691 7.708 7.983
$������� ����� ���������� ��)���� ������� 37.917 18.373 19.544
$���������������������������������� 7.344 2.132 5.212
G���������������� 5.974 2.668 3.306
$���������� ���������������������������������� 175.430 91.200 84.230
$������������������������������������������ 211.809 116.384 95.425
��������)������������ 19.192 9.937 9.255
*$���#��������������#�������!����(��%���������#�%����(��$�$�Y[[\]�����Adult social welfare beneficiaries by category and sex in 2007.
Persons in different social and protective needs
Without specific category
Total
Beneficiaries of subventions
Menatally and physically handicapped persons
Persons with socially unacceptable behaviour
Mentally ill persons
Persons not having a sufficient income to support themselves
�����������������������������������������Žene i muškarci u Bosni i Hercegovini 69Women and Men in Bosnia and Herzegovina
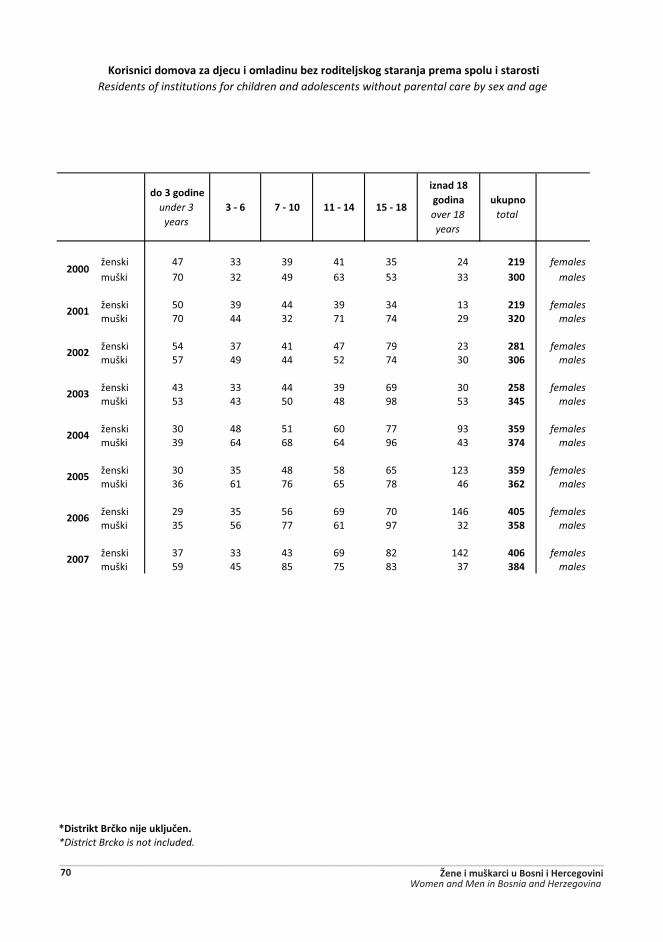
����������under 3
years3 - 6 7 - 10 11 - 14 15 - 18
�����`w�������over 18 years
$�$(���total
������ 47 33 39 41 35 24 219 females ���� 70 32 49 63 53 33 300 males
������ 50 39 44 39 34 13 219 females ���� 70 44 32 71 74 29 320 males
������ 54 37 41 47 79 23 281 females ���� 57 49 44 52 74 30 306 males
������ 43 33 44 39 69 30 258 females ���� 53 43 50 48 98 53 345 males
������ 30 48 51 60 77 93 359 females ���� 39 64 68 64 96 43 374 males
������ 30 35 48 58 65 123 359 females ���� 36 61 76 65 78 46 362 males
������ 29 35 56 69 70 146 405 females ���� 35 56 77 61 97 32 358 males
������ 37 33 43 69 82 142 406 females ���� 59 45 85 75 83 37 384 males
��������N�/����#��$��#$/��]*District Brcko is not included.
2002
2007
2003
2004
2005
2006
;��������%��������#��$���%����$�&���������#�����������#��(��%���(��$���������Residents of institutions for children and adolescents without parental care by sex and age
2000
2001
�����������������������������������������70 Žene i muškarci u Bosni i Hercegovini
Women and Men in Bosnia and Herzegovina
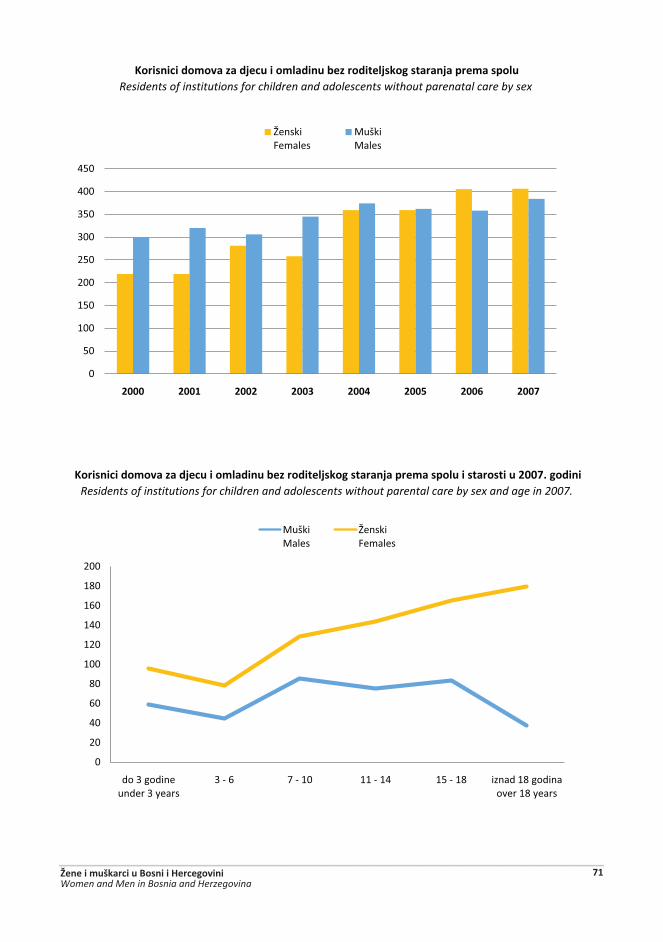
;��������%��������#��$���%����$�&���������#�����������#��(��%���(��$�Residents of institutions for children and adolescents without parenatal care by sex
;��������%��������#��$���%����$�&���������#�����������#��(��%���(��$����������$�Y[[\]�����Residents of institutions for children and adolescents without parental care by sex and age in 2007.
0
20
40
60
80
100
120
140
160
180
200
�����������������\���
��- 6 x�- 10 --�- 14 -C�- 18 �����-'�����������-'�\���
Muški5����
�����{� ����
0
50
100
150
200
250
300
350
400
450
2000 2001 2002 2003 2004 2005 2006 2007
�����{� ����
Muški5����
�����������������������������������������Žene i muškarci u Bosni i Hercegovini 71Women and Men in Bosnia and Herzegovina

���`[������younger then
10 years11 - 13 14 - 15 16 - 17 18 - 21
Y`���!�21 and more
$�$(���total
����� 60 68 32 49 41 161 411 femalesmuški 59 61 34 70 91 512 827 males
����� 60 68 36 41 41 161 407 femalesmuški 55 59 47 53 70 554 838 males
����� 56 74 47 40 57 169 443 femalesmuški 57 74 59 57 83 545 875 males
����� 54 91 58 48 56 226 533 femalesmuški 79 86 63 52 104 576 960 males
����� 69 78 54 56 47 269 573 femalesmuški 80 73 75 46 87 517 878 males
����� 61 61 65 50 66 276 579 femalesmuški 69 88 60 50 78 558 903 males
����� 65 57 58 62 67 290 599 femalesmuški 64 94 44 59 72 621 954 males
����� 53 54 54 61 82 288 592 femalesmuški 58 74 50 52 76 609 919 males
��������N�/����#��$��#$/��]*District Brcko is not included.
2002
2007
2003
2004
2005
2006
;������$������������#��$���%����$��%����$�$�(��/��%����/��%������#$�(��%���(��$���������Residents of institutions for mentally and physically handicapped children and youth by sex and age
2000
2001
�����������������������������������������72 Žene i muškarci u Bosni i Hercegovini
Women and Men in Bosnia and Herzegovina
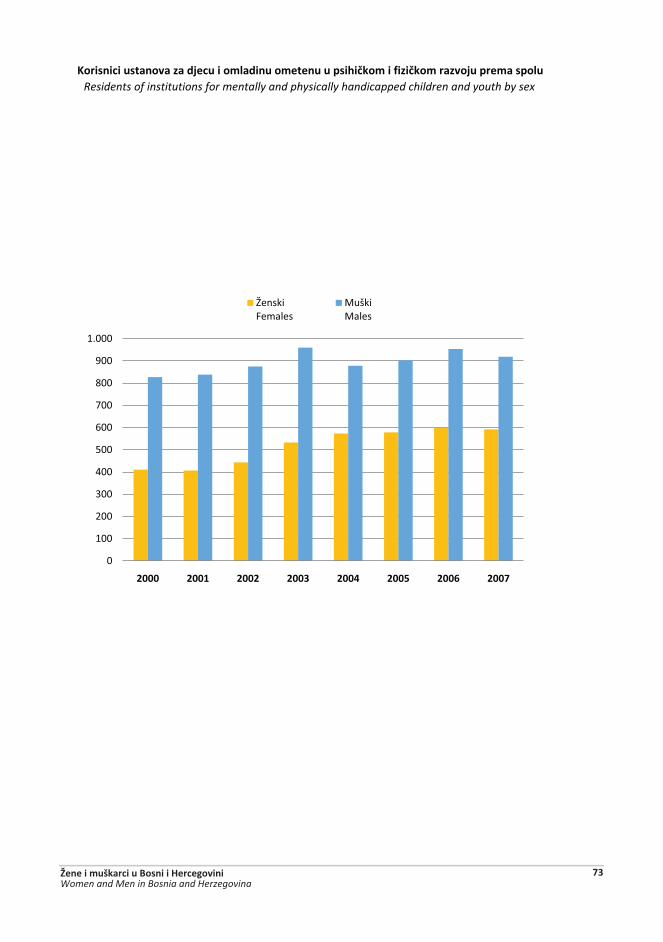
;������$������������#��$���%����$��%����$�$�(��/��%����/��%������#$�(��%���(��$�Residents of institutions for mentally and physically handicapped children and youth by sex
0
100
200
300
400
500
600
700
800
900
1.000
2000 2001 2002 2003 2004 2005 2006 2007
�����{� ����
Muški5����
�����������������������������������������Žene i muškarci u Bosni i Hercegovini 73Women and Men in Bosnia and Herzegovina
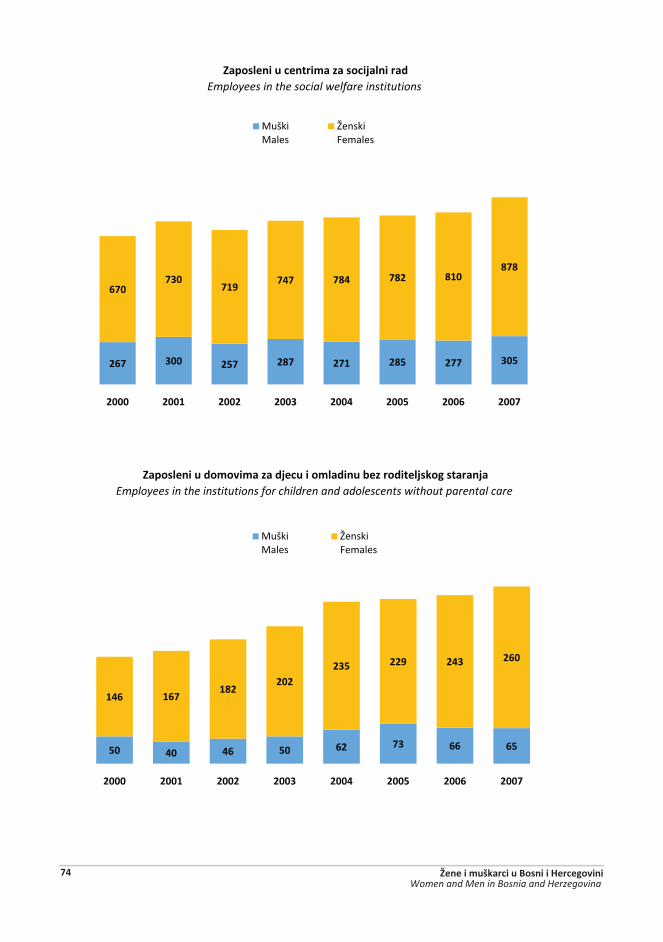
��(������$������%��������#�������Employees in the social welfare institutions
��(������$���%��%������#��$���%����$�&���������#�����������#�Employees in the institutions for children and adolescents without parental care
267 300 257 287 271 285 277 305
670730
719747 784 782 810
878
2000 2001 2002 2003 2004 2005 2006 2007
5����5����
������{� ����
50 40 46 50 62 73 66 65
146 167182
202235 229 243 260
2000 2001 2002 2003 2004 2005 2006 2007
5����5����
������{� ����
�����������������������������������������74 Žene i muškarci u Bosni i Hercegovini
Women and Men in Bosnia and Herzegovina
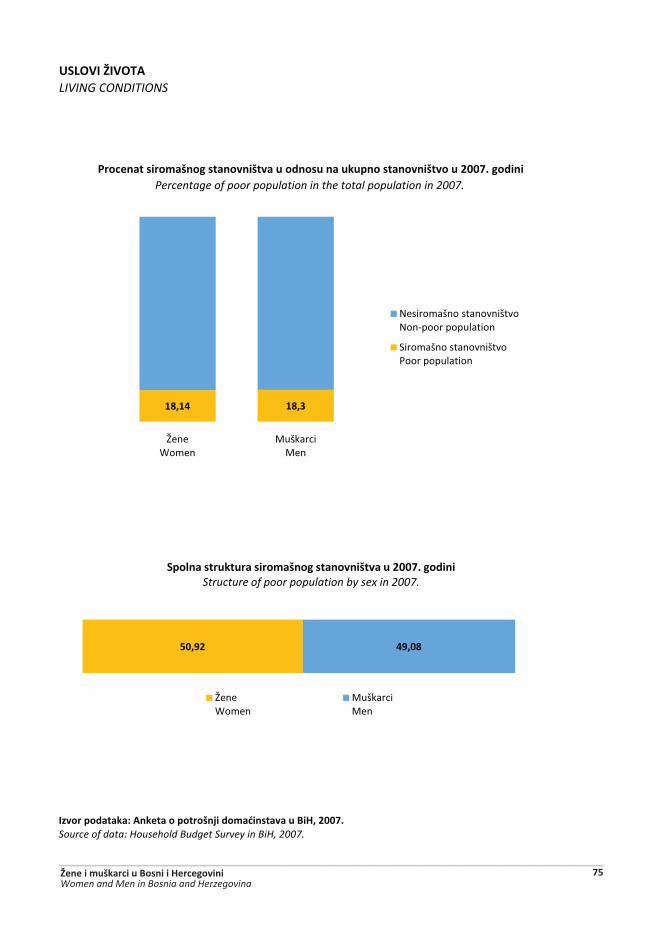
)�J?@����@?C�LIVING CONDITIONS
������(������������������(����!�#���%� �������$�NX��Y[[\]�Source of data: Household Budget Survey in BiH, 2007.
*�����������%�!�����������!����$������$����$�$(����������!����$�Y[[\]�����Percentage of poor population in the total population in 2007.
18,14 18,3
�����V� ��
5������5��
Y��� ����������������Y��-�������������
?� ����������������G������������
50,92 49,08
�(��������$��$������%�!�����������!����$�Y[[\]�����Structure of poor population by sex in 2007.
�����V� ��
5������5��
�����������������������������������������Žene i muškarci u Bosni i Hercegovini 75Women and Men in Bosnia and Herzegovina
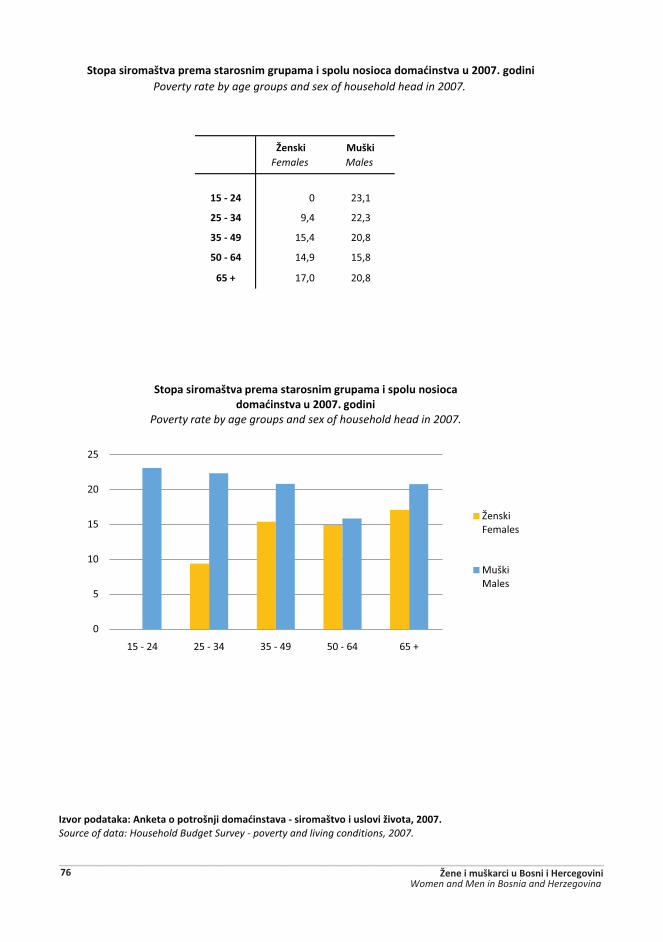
������Females
$!��Males
15 - 24 0 23,1
25 - 34 9,4 22,3
35 - 49 15,4 20,8
50 - 64 14,9 15,8
65 + 17,0 20,8
������(������������������(����!�#���%� �������_����%�!�����$�����'������Y[[\]Source of data: Household Budget Survey - poverty and living conditions, 2007.
���(�����%�!����(��%���������%���$(�%����(��$����������%� ������$�Y[[\]�����Poverty rate by age groups and sex of household head in 2007.
0
5
10
15
20
25
-C�- 24 %C�- 34 �C�- 49 C&�- 64 qC��
���(�����%�!����(��%���������%���$(�%����(��$����������%� ������$�Y[[\]���������������������������������������������
Poverty rate by age groups and sex of household head in 2007.
������{� ����
5����5����
�����������������������������������������76 Žene i muškarci u Bosni i Hercegovini
Women and Men in Bosnia and Herzegovina
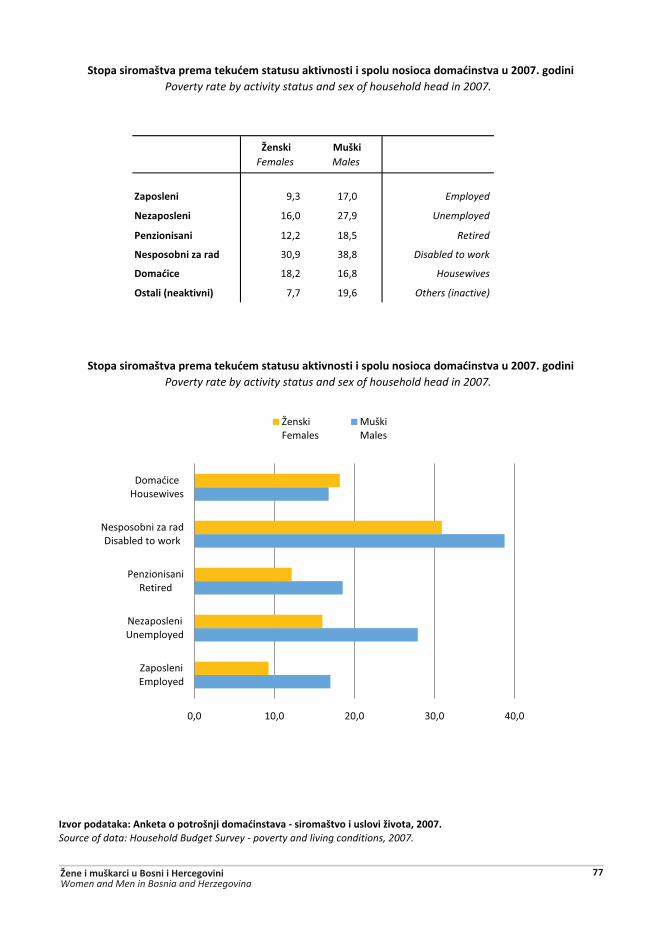
������Females
$!��Males
��(����� 9,3 17,0 Employed
=���(����� 16,0 27,9 Unemployed
*�������� 12,2 18,5 Retired
=��(���&�������� 30,9 38,8 Disabled to work
��%� �� 18,2 16,8 Housewives
?�����{�������| 7,7 19,6 Others (inactive)
������(������������������(����!�#���%� �������_����%�!�����$�����'������Y[[\]Source of data: Household Budget Survey - poverty and living conditions, 2007.
���(�����%�!����(��%�����$ �%�����$�$������������(��$����������%� ������$�Y[[\]�����Poverty rate by activity status and sex of household head in 2007.
���(�����%�!����(��%�����$ �%�����$�$������������(��$����������%� ������$�Y[[\]�����Poverty rate by activity status and sex of household head in 2007.
0,0 10,0 20,0 30,0 40,0
*�������� ���\��
Y���������+�� ���\��
G��������]����
Y��������������6����������X��
6� �"�������X���
������{� ����
5����5����
�����������������������������������������Žene i muškarci u Bosni i Hercegovini 77Women and Men in Bosnia and Herzegovina
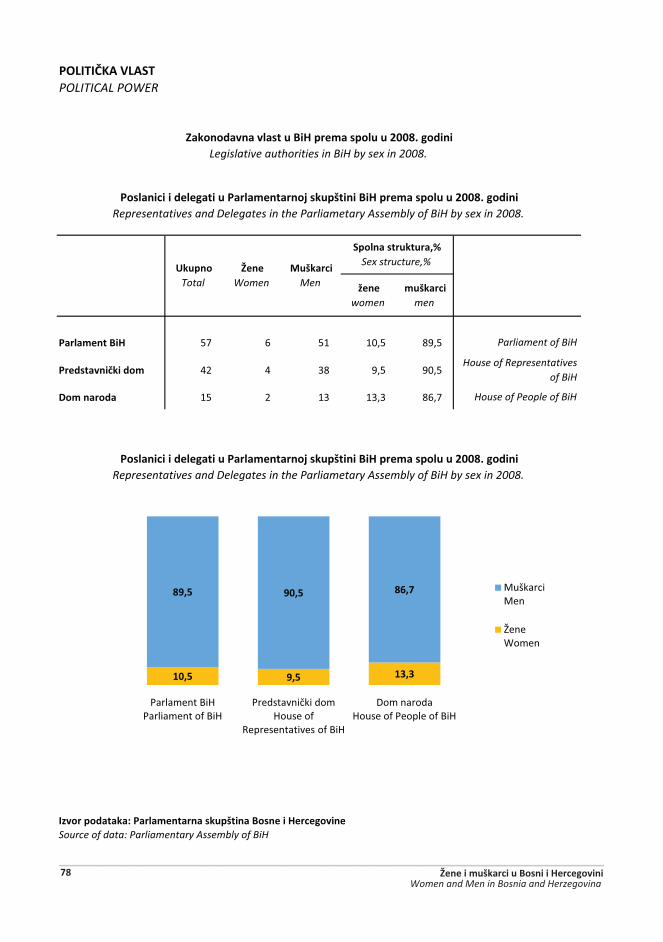
*?J�C��;��@J��CPOLITICAL POWER
'����women
muškarci men
*����%����NX 57 6 51 10,5 89,5
*��������/����% 42 4 38 9,5 90,5
��%������� 15 2 13 13,3 86,7
������(���������*����%����������$(!����N������X���������Source of data: Parliamentary Assembly of BiH
������������������$�NX�(��%���(��$�$�Y[[w]�����Legislative authorities in BiH by sex in 2008.
*����������������$�*����%�������#���$(!���NX�(��%���(��$�$�Y[[w]�����Representatives and Delegates in the Parliametary Assembly of BiH by sex in 2008.
House of Representatives of BiH
*����������������$�*����%�������#���$(!���NX�(��%���(��$�$�Y[[w]�����Representatives and Delegates in the Parliametary Assembly of BiH by sex in 2008.
House of People of BiH
�(��������$��$���^Sex structure,%
)�$(���Total
����Women
$!����Men
Parliament of BiH
10,5 9,5 13,3
89,5 90,5 86,7
G��� ������G��� �����)���
G������������ �������)�
]��������������)���
6� �������������)�G�������)���
5������5��
�����V� ��
�����������������������������������������78 Žene i muškarci u Bosni i Hercegovini
Women and Men in Bosnia and Herzegovina
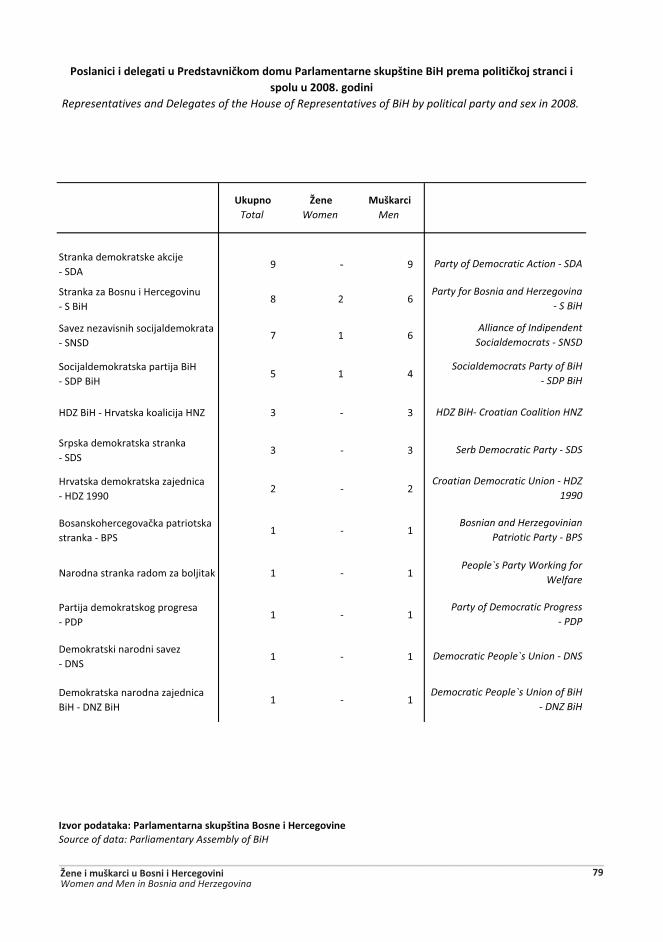
?�������� �����������������?64
9 - 9
?����������������������������?���
8 2 6
?���������������������� ���������?Y?6
7 1 6
?������� �������������������?6G���
5 1 4
�6*�����������������������Y* 3 - 3
?������� �����������������?6?
3 - 3
���������� ������������������������6*�-��&
2 - 2
���������������������������������������G?
1 - 1
Y���������������� ����������� 1 - 1
G������� ������������������G6G
1 - 1
6� ���������������������6Y?
1 - 1
6� �����������������������������6Y*���
1 - 1
������(���������*����%����������$(!����N������X���������Source of data: Parliamentary Assembly of BiH
Democratic People`s Union of BiH - DNZ BiH
Socialdemocrats Party of BiH - SDP BiH
HDZ BiH- Croatian Coalition HNZ
Serb Democratic Party - SDS
Croatian Democratic Union - HDZ 1990
Bosnian and Herzegovinian Patriotic Party - BPS
People`s Party Working for Welfare
Party for Bosnia and Herzegovina - S BiH
*����������������$�*��������/��%���%$�*����%����������$(!����NX�(��%��(���/��#����������(��$�$�Y[[w]�����
Representatives and Delegates of the House of Representatives of BiH by political party and sex in 2008.
Party of Democratic Progress - PDP
Democratic People`s Union - DNS
Alliance of Indipendent Socialdemocrats - SNSD
)�$(���Total
�����Women
$!�����Men
Party of Democratic Action - SDA
�����������������������������������������Žene i muškarci u Bosni i Hercegovini 79Women and Men in Bosnia and Herzegovina
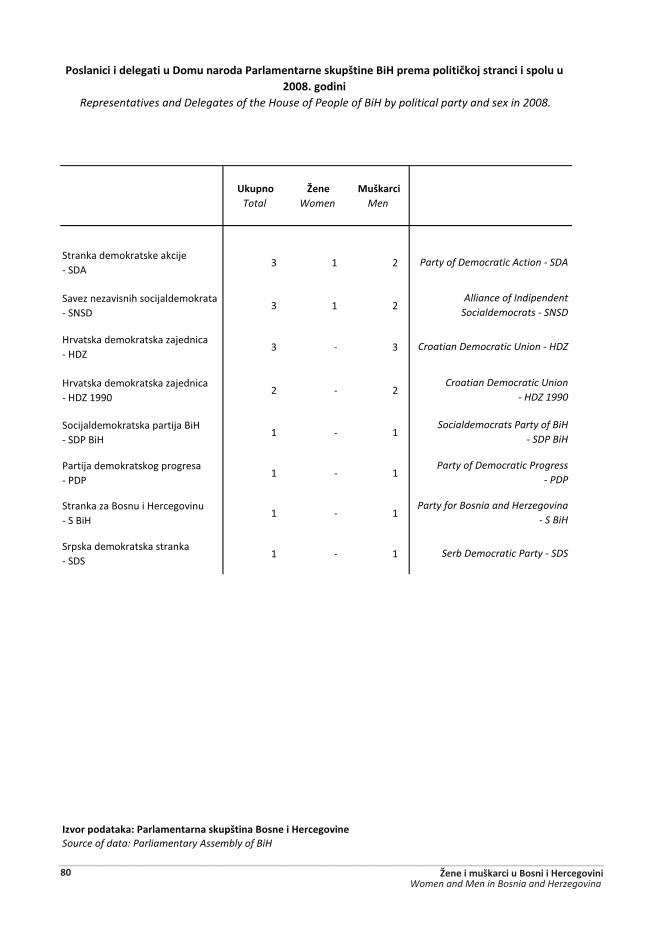
)�$(���Total
�����Women
$!�����Men
?�������� ����������������?64
3 1 2
?���������������������� ����������?Y?6
3 1 2
���������� �������������������������6*
3 - 3
���������� �������������������������6*�-��&
2 - 2
?������� �������������������?6G���
1 - 1
G������� ������������������G6G
1 - 1
?����������������������������?���
1 - 1
?������� �����������������?6?
1 - 1
������(���������*����%����������$(!����N������X���������Source of data: Parliamentary Assembly of BiH
*����������������$���%$��������*����%����������$(!����NX�(��%��(���/��#����������(��$�$�Y[[w]�����
Representatives and Delegates of the House of People of BiH by political party and sex in 2008.
Party of Democratic Progress - PDP
Party for Bosnia and Herzegovina - S BiH
Serb Democratic Party - SDS
Party of Democratic Action - SDA
Alliance of Indipendent Socialdemocrats - SNSD
Croatian Democratic Union - HDZ
Croatian Democratic Union - HDZ 1990
Socialdemocrats Party of BiH - SDP BiH
�����������������������������������������80 Žene i muškarci u Bosni i Hercegovini
Women and Men in Bosnia and Herzegovina
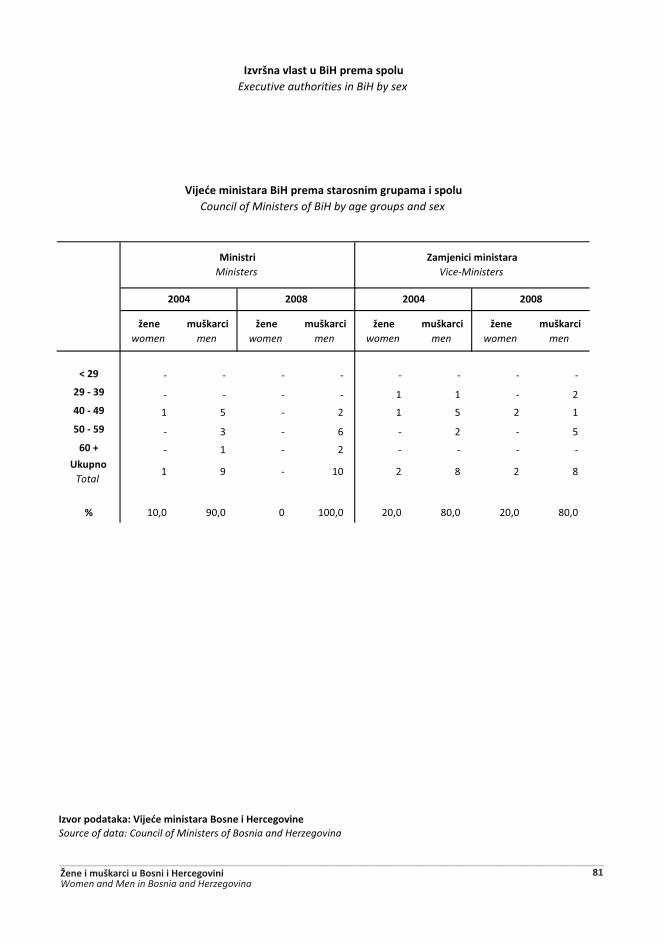
'����women
muškarci men
'����women
muškarci men
'����women
muškarci men
'����women
muškarci men
� 29 - - - - - - - -
29 - 39 - - - - 1 1 - 2
40 - 49 1 5 - 2 1 5 2 1
50 - 59 - 3 - 6 - 2 - 5
60 + - 1 - 2 - - - -)�$(���
Total1 9 - 10 2 8 2 8
^ 10,0 90,0 0 100,0 20,0 80,0 20,0 80,0
������(���������@#� ��%�������N������X���������Source of data: Council of Ministers of Bosnia and Herzegovina
2004 2008 2004 2008
����!���������$�NX�(��%���(��$Executive authorities in BiH by sex
@#� ��%�������NX�(��%���������%���$(�%����(��$Council of Ministers of BiH by age groups and sex
�����Ministers
��%#����%�������Vice-Ministers
�����������������������������������������Žene i muškarci u Bosni i Hercegovini 81Women and Men in Bosnia and Herzegovina
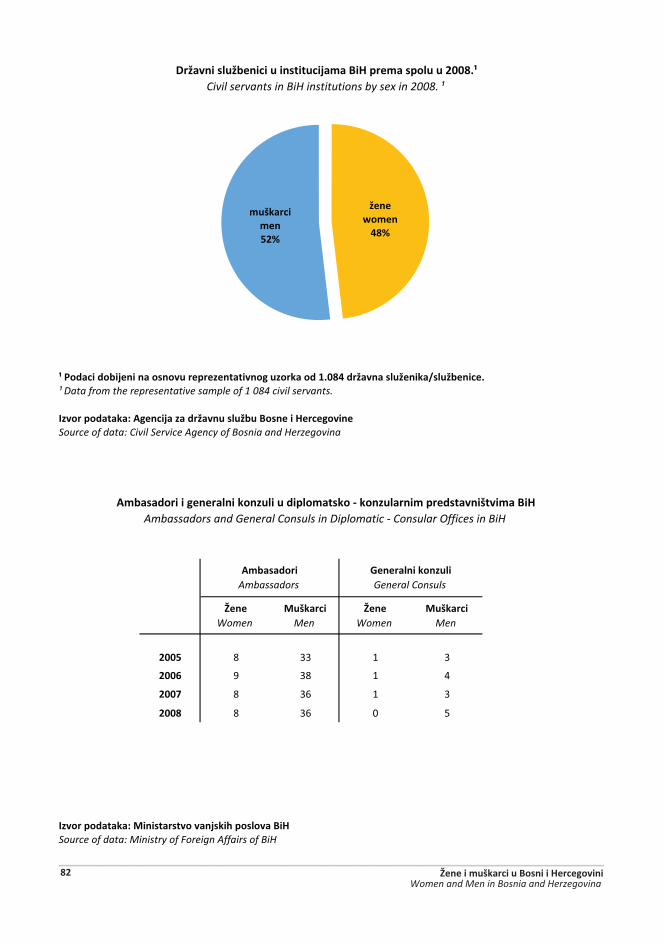
��*�������&#�����������$���(�������������$���������`][wy���'�������$'�������$'&����]¹ Data from the representative sample of 1 084 civil servants.
������(��������������#�������'���$���$'&$�N������X���������Source of data: Civil Service Agency of Bosnia and Herzegovina
����Women
$!����Men
����Women
$!����Men
2005 8 33 1 3
2006 9 38 1 4
2007 8 36 1 3
2008 8 36 0 5
������(����������������������#����(�������NXSource of data: Ministry of Foreign Affairs of BiH
��'������$'&����$�����$�#�%��NX�(��%���(��$�$�Y[[w]¹Civil servants in BiH institutions by sex in 2008. ¹
�%&���������������������$��$��(��%������_�����$����%�(��������!��%��NX�
�%&������Ambassadors
�������������$�General Consuls
Ambassadors and General Consuls in Diplomatic - Consular Offices in BiH
'������%��
yw^
muškarci %���Y^
�����������������������������������������82 Žene i muškarci u Bosni i Hercegovini
Women and Men in Bosnia and Herzegovina
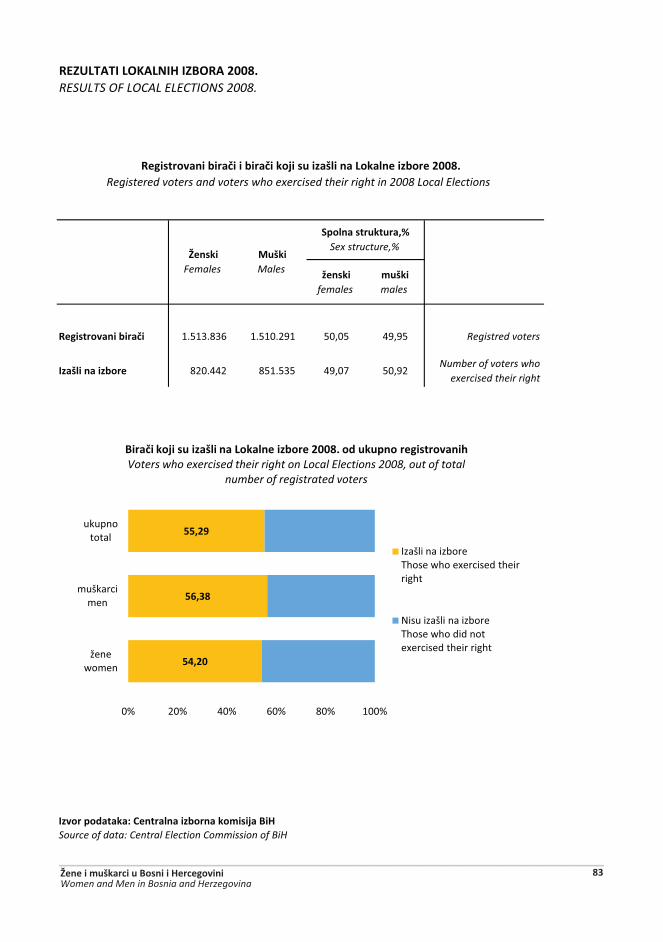
���)JC�C��J?;�J=�X���N?���Y[[w]RESULTS OF LOCAL ELECTIONS 2008.
'�����females
muški males
�����������&��/ 1.513.836 1.510.291 50,05 49,95 Registred voters
���!������&��� 820.442 851.535 49,07 50,92Number of voters who
exercised their right
������(���������>����������&�������%�#��NXSource of data: Central Election Commission of BiH
������Females
$!��Males
�(��������$��$���^Sex structure,%
�����������&��/��&��/���#��$���!�����J��������&����Y[[w]Registered voters and voters who exercised their right in 2008 Local Elections
54,20
56,38
55,29
0% 20% 40% 60% 80% 100%
�����X� ��
������ ��
������������
N��/���#��$���!�����J��������&����Y[[w]����$�$(��������������Voters who exercised their right on Local Elections 2008, out of total
number of registrated voters
��������������������X������������������
Y����������������������X�������������������������
�����������������������������������������Žene i muškarci u Bosni i Hercegovini 83Women and Men in Bosnia and Herzegovina
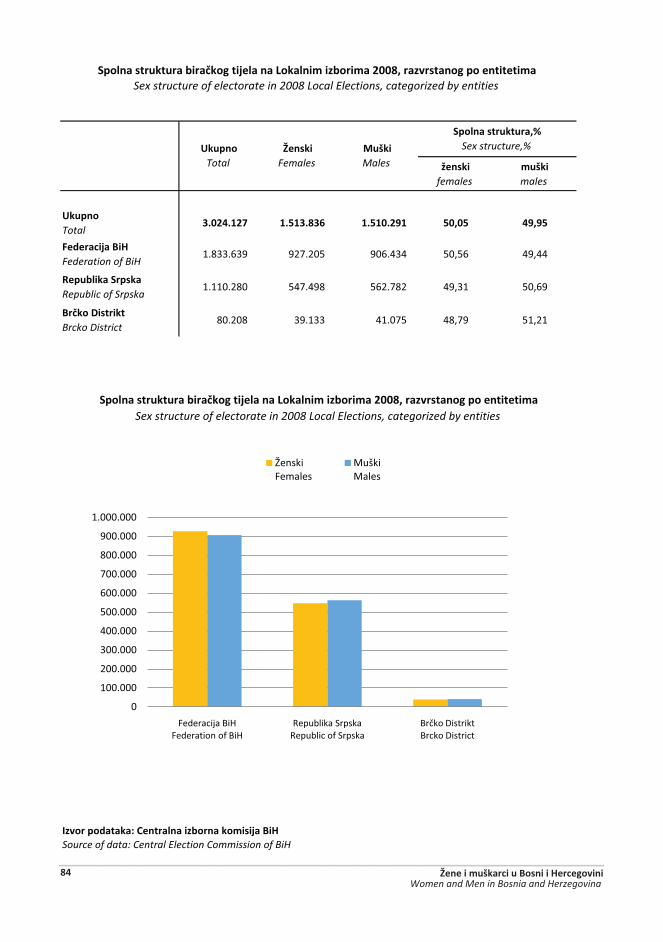
'�����females
muški males
)�$(���Total
3.024.127 1.513.836 1.510.291 50,05 49,95
�������#��NX�Federation of BiH
1.833.639 927.205 906.434 50,56 49,44
��($&������(���Republic of Srpska
1.110.280 547.498 562.782 49,31 50,69
N�/����������Brcko District
80.208 39.133 41.075 48,79 51,21
������(���������>����������&�������%�#��NXSource of data: Central Election Commission of BiH
�(��������$��$���&��/�����#�������J�����%��&��%��Y[[w��������������(��������%�Sex structure of electorate in 2008 Local Elections, categorized by entities
�(��������$��$���&��/�����#�������J�����%��&��%��Y[[w��������������(��������%�Sex structure of electorate in 2008 Local Elections, categorized by entities
)�$(���Total
������Females
$!��Males
�(��������$��$���^Sex structure,%
0
100.000
200.000
300.000
400.000
500.000
600.000
700.000
800.000
900.000
1.000.000
{�����������{���������)���
]��������?����]��������)�?����
�����6����������6����
������{� ����
5����5����
�����������������������������������������84 Žene i muškarci u Bosni i Hercegovini
Women and Men in Bosnia and Herzegovina

'�����females
muški males
)�$(���Total
10.245 18.798 35,28 64,72
����[�������up to 30 years of age
3.920 3.129 55,61 44,39
(������[�������over 30 years of age
6.325 15.674 28,75 71,25
������(���������>����������&�������%�#��NXSource of data: Central Election Commission of BiH
;����������J�����%��&��%��Y[[w]�(��%������������(��$Candidates for 2008 Local Elections, by age and sex
;����������J�����%��&��%��Y[[w]�(��%������������(��$Candidates for 2008 Local Elections, by age and sex
������Females
$!��Males
�(��������$��$���^Sex structure,%
0
2.000
4.000
6.000
8.000
10.000
12.000
14.000
16.000
����&��������������&�\�����)����
������&������������&�\�����)����
������{� ����
5����5����
�����������������������������������������Žene i muškarci u Bosni i Hercegovini 85Women and Men in Bosnia and Herzegovina
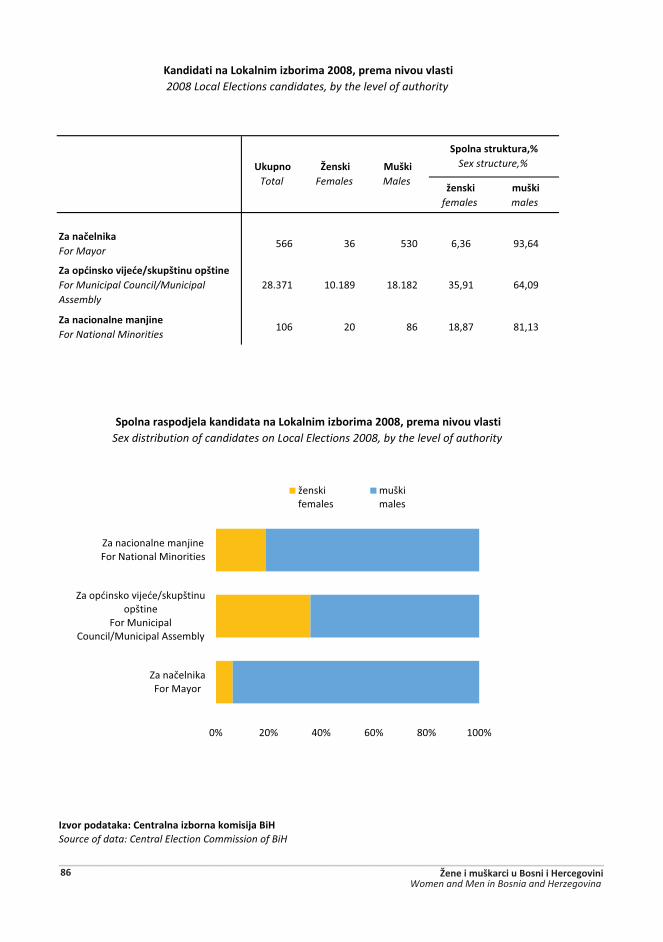
'�����females
muški males
�����/�����For Mayor
566 36 530 6,36 93,64
����( ������#� ����$(!��$��(!���For Municipal Council/Municipal Assembly
28.371 10.189 18.182 35,91 64,09
�������������%��#��For National Minorities
106 20 86 18,87 81,13
������(���������>����������&�������%�#��NXSource of data: Central Election Commission of BiH
;����������J�����%��&��%��Y[[w��(��%�����$������2008 Local Elections candidates, by the level of authority
�(��������(��#����������������J�����%��&��%��Y[[w��(��%�����$������Sex distribution of candidates on Local Elections 2008, by the level of authority
)�$(���Total
������Females
$!��Males
�(��������$��$���^Sex structure,%
0% 20% 40% 60% 80% 100%
*����������{��5�\�
*����"��������"�[���������������
{��5�������������[5�������4��� ��\
*������������ �����{��Y�������5�����
������)� ����
���� ����
�����������������������������������������86 Žene i muškarci u Bosni i Hercegovini
Women and Men in Bosnia and Herzegovina
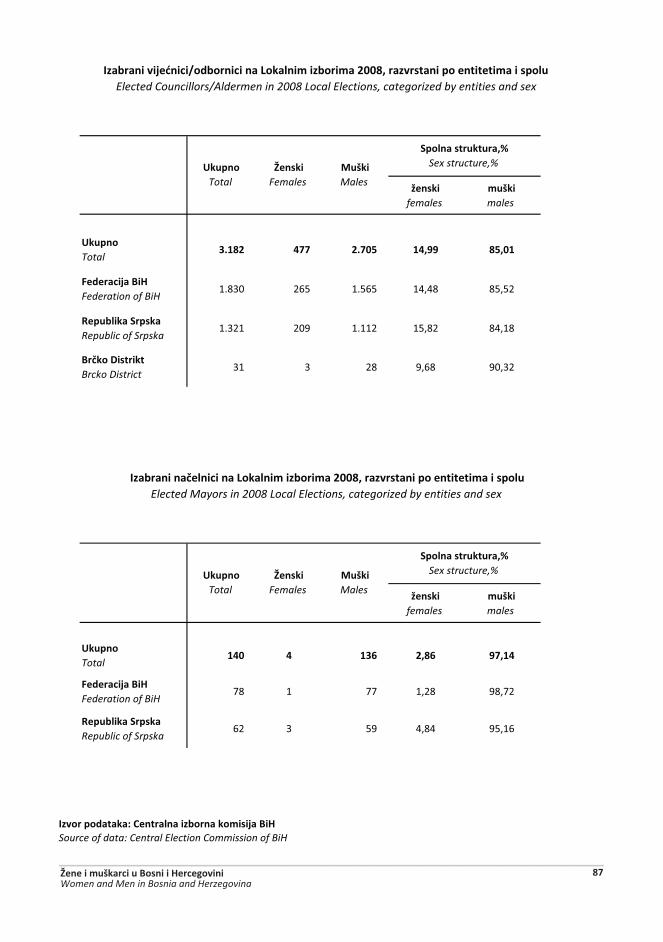
'�����females
muški males
)�$(���Total
3.182 477 2.705 14,99 85,01
�������#��NX�Federation of BiH
1.830 265 1.565 14,48 85,52
��($&������(���Republic of Srpska
1.321 209 1.112 15,82 84,18
N�/����������Brcko District
31 3 28 9,68 90,32
'�����females
muški males
)�$(���Total
140 4 136 2,86 97,14
�������#��NX�Federation of BiH
78 1 77 1,28 98,72
��($&������(���Republic of Srpska
62 3 59 4,84 95,16
������(���������>����������&�������%�#��NXSource of data: Central Election Commission of BiH
)�$(���Total
������Females
$!��Males
�(��������$��$���^Sex structure,%
���&�����#� �����&��������J�����%��&��%��Y[[w������������(��������%����(��$�Elected Councillors/Aldermen in 2008 Local Elections, categorized by entities and sex
���&������/��������J�����%��&��%��Y[[w������������(��������%����(��$Elected Mayors in 2008 Local Elections, categorized by entities and sex
)�$(���Total
������Females
$!��Males
�(��������$��$���^Sex structure,%
�����������������������������������������Žene i muškarci u Bosni i Hercegovini 87Women and Men in Bosnia and Herzegovina
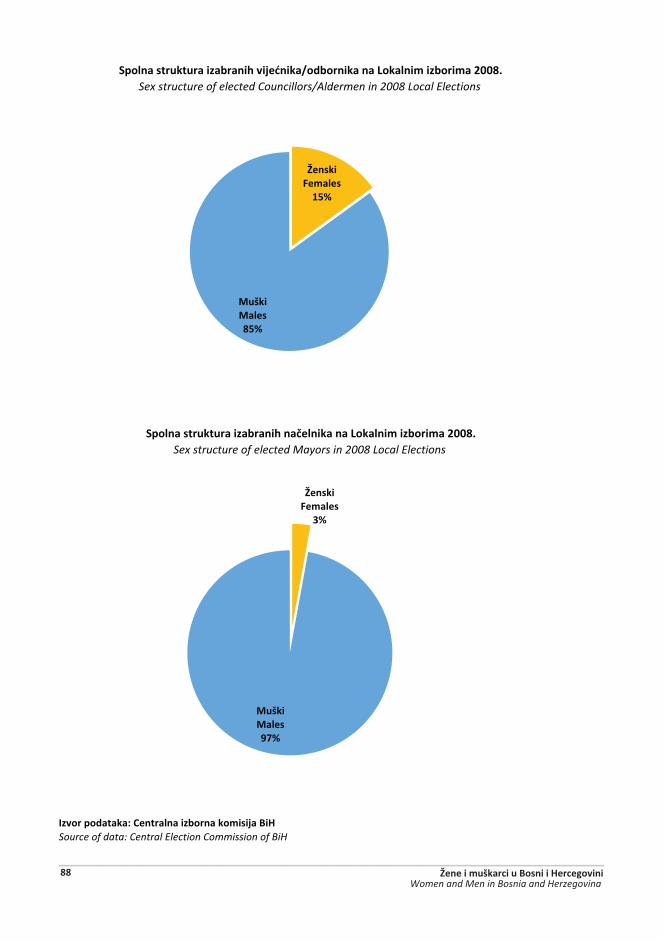
������(���������>����������&�������%�#��NXSource of data: Central Election Commission of BiH
�(��������$��$�����&������#� ������&���������J�����%��&��%��Y[[w]Sex structure of elected Councillors/Aldermen in 2008 Local Elections
�(��������$��$�����&�������/���������J�����%��&��%��Y[[w]Sex structure of elected Mayors in 2008 Local Elections
��������%����
`�^
$!������w�^
��������%����
�^
$!������q\^
�����������������������������������������88 Žene i muškarci u Bosni i Hercegovini
Women and Men in Bosnia and Herzegovina
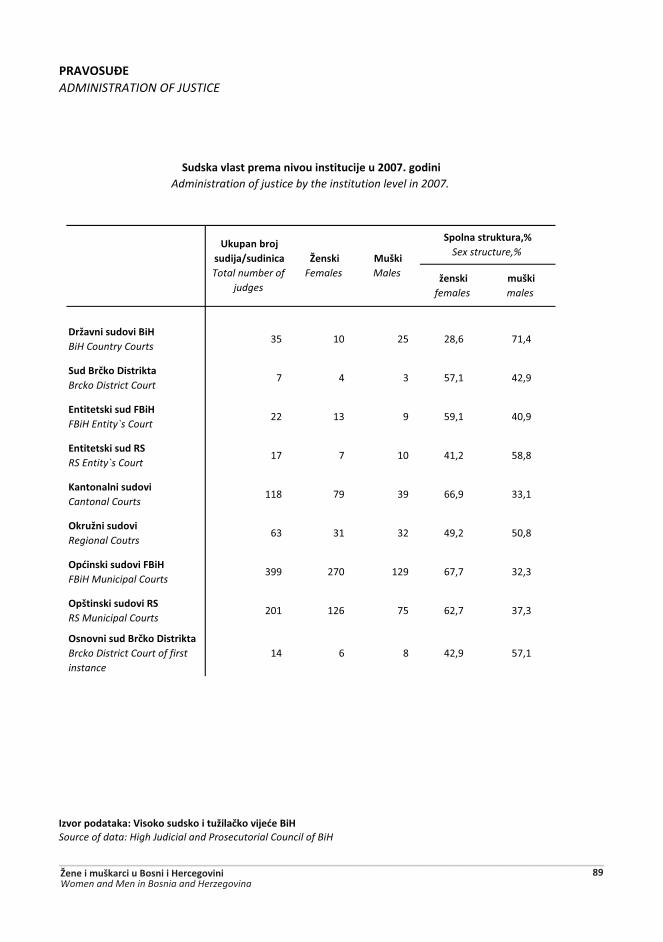
*��@?�)W��ADMINISTRATION OF JUSTICE
'�����females
muški males
��'�����$����NX�BiH Country Courts
35 10 25 28,6 71,4
�$��N�/�����������Brcko District Court
7 4 3 57,1 42,9
����������$���NX�FBiH Entity`s Court
22 13 9 59,1 40,9
����������$�����RS Entity`s Court
17 7 10 41,2 58,8
;����������$����Cantonal Courts
118 79 39 66,9 33,1
?��$'���$����Regional Coutrs
63 31 32 49,2 50,8
?( �����$�����NX�FBiH Municipal Courts
399 270 129 67,7 32,3
?(!������$�������RS Municipal Courts
201 126 75 62,7 37,3
?�������$��N�/�����������Brcko District Court of first instance
14 6 8 42,9 57,1
������(���������@������$�������$'��/����#� ��NXSource of data: High Judicial and Prosecutorial Council of BiH
�$�����������(��%�����$�����$�#��$�Y[[\]�����Administration of justice by the institution level in 2007.
)�$(���&��#��$�#���$����Total number of
judges
������Females
$!��Males
�(��������$��$���^Sex structure,%
�����������������������������������������Žene i muškarci u Bosni i Hercegovini 89Women and Men in Bosnia and Herzegovina
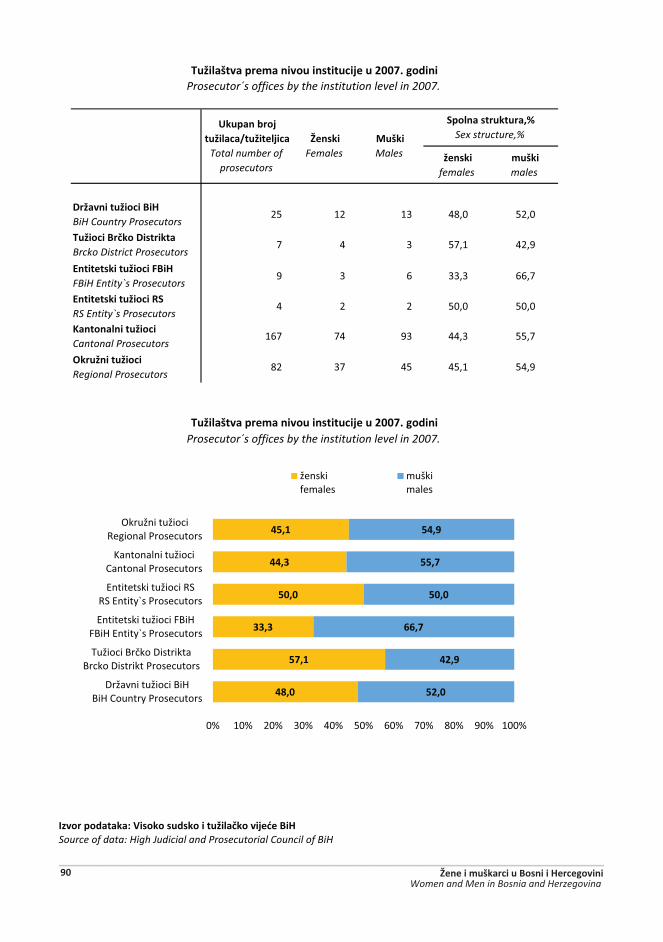
'�����females
muški males
��'�����$'���NXBiH Country Prosecutors
25 12 13 48,0 52,0
C$'���N�/�����������Brcko District Prosecutors
7 4 3 57,1 42,9
����������$'����NX�FBiH Entity`s Prosecutors
9 3 6 33,3 66,7
����������$'������RS Entity`s Prosecutors
4 2 2 50,0 50,0
;����������$'���Cantonal Prosecutors
167 74 93 44,3 55,7
?��$'���$'��Regional Prosecutors
82 37 45 45,1 54,9
������(���������@������$�������$'��/����#� ��NXSource of data: High Judicial and Prosecutorial Council of BiH
C$'��!����(��%�����$�����$�#��$�Y[[\]�����Prosecutor´s offices by the institution level in 2007.
C$'��!����(��%�����$�����$�#��$�Y[[\]�����Prosecutor´s offices by the institution level in 2007.
�(��������$��$���^Sex structure,%
)�$(���&��#��$'������$'���#��
Total number of prosecutors
������Females
$!��Males
48,0
57,1
33,3
50,0
44,3
45,1
52,0
42,9
66,7
50,0
55,7
54,9
0% 10% 20% 30% 40% 50% 60% 70% 80% 90% 100%
6���������������������\�G��������
�����������6�����������6�����G���������
���������������{���{�������\���G��������
���������������]?�]?�����\���G��������
������������������������G��������
E����������]�������G��������
������)� ����
���� ����
�����������������������������������������90 Žene i muškarci u Bosni i Hercegovini
Women and Men in Bosnia and Herzegovina