Embed Size (px)
Citation preview

182
Rīga, 2014
UNIVERSITY OF LATVIAFACULTY OF GEOGRAPHY AND EARTH SCIENCES
DEPARTMENT OF ENVIRONMENTAL SCIENCE
Zane Vincēviča-Gaile
IMPACT OF ENVIRONMENTAL CONDITIONS ON MICRO- AND MACROELEMENT
CONTENT IN SELECTED FOOD FROM LATVIA
VIDES APSTĀKĻU IETEKME UZ MIKRO- UN MAKROELEMENTU SATURU
PĀRTIKAS PRODUKTOS LATVIJĀ
Doctoral Thesis
ISBN 978-9984-45-829-8
Zane Vincēviča-Gaile Im
pact of Environmental Conditions on M
icro- and Macroelem
ent Content in Selected Food from Latvia

University of LatviafacULty of GeoGraphy and earth sciences
department of environmentaL science
Zane Vincēviča-Gaile
iMPACT OF ENViRONMENTAL CONDiTiONS ONMiCRO- AND MACROELEMENT CONTENT
iN SELECTED FOOD FROM LATViA
VIDES APSTĀKĻU IETEKME UZ MIKro- Un MAKroElEMEnTU SATUrU
PĀrTIKAS ProDUKToS lATVIjĀ
doctoraL thesis
scientific supervisor:professor, Dr. habil. chem. māris Kļaviņš
submitted for the degree of doctor of chemistry in environmental sciencesubfield of environmental chemistry and ecotoxicology
riga, 2014

isBn 978-9984-45-829-8
The research for doctoral thesis was carried out at the department of environmental science, faculty of Geography and earth sciences, University of Latvia, from 2009 to 2013.
This work has been supported by the european social fund within the project “support for doctoral studies at University of Latvia”, no. 2009/0138/1dp/1.1.2.1.2./09/ipia/viaa/004.
The thesis contains the introduction, 3 chapters, conclusions, reference list, 4 appendices.form of the thesis: dissertation in chemistry, field of environmental science, subfield of environmental chemistry and ecotoxicology.
supervisor: professor, Dr. habil. chem. Māris Kļaviņš
reviewers:professor, Dr. habil. chem. Andris Zicmanis, University of Latvia, Latvia;professor, Dr. Stanley Lutts, catholic University of Leuven, Belgium;Dr. chem. Vadims Bartkevičs, institute of food safety, animal health and environment Bior, Latvia.
The thesis will be defended at the public session of the doctoral committee of environmental science, University of Latvia, at the faculty of Geography and earth sciences of the University of Latvia (alberta street 10, riga, Latvia) on april 24, 2014 at 10:00.
The thesis is available at the Library of the University of Latvia (raiņa blvd. 19, riga, Latvia).
The thesis was accepted for the commencement of the degree of doctor of chemistry, environmental science on January 16, 2014 by the doctoral committee of environmental science, University of Latvia.
chairman of the doctoral committee:prof., Dr. biol. Viesturs Melecis
secretary of the doctoral committee:assoc. prof., Dr. biol. Gunta Spriņģe
IEGULDĪJUMS TAVĀ NĀKOTNĒ
© Zane vincēviča-Gaile, 2014 © University of Latvia, 2014
ContentS
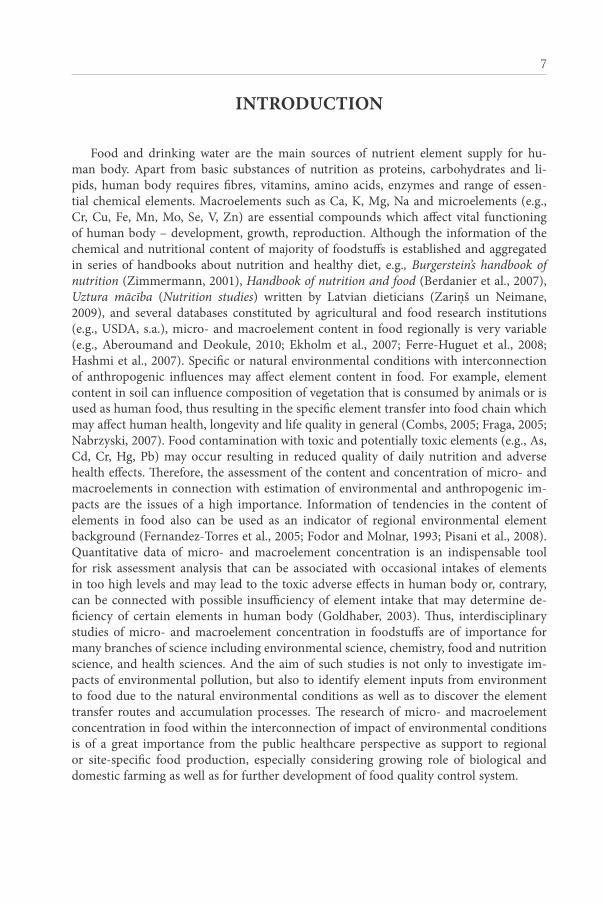
ABBReVIAtIonS AnD GLoSSARY ...................................................................... 5
AnnotAtIon .......................................................................................................... 6
AnotĀCIJA .............................................................................................................. 6
IntRoDUCtIon ..................................................................................................... 7
1. LIteRAtURe ReVIeW ....................................................................................... 141.1. Characteristics of elements in human health and diet – interconnection with
environment ........................................................................................................... 141.1.1. Essentiality of elements .............................................................................. 141.1.2. Toxicity of elements ................................................................................... 151.1.3. Transfer routes of elements in human nutrition ......................................... 19
1.2. Contamination sources and natural occurrence of elements in food .................... 221.2.1. Impact of natural environmental background on the concentration of
elements in food ......................................................................................... 221.2.2. Agricultural impact on the concentration of elements in food .................. 261.2.3. Environmental pollution as a source of potentially toxic elements in
food ............................................................................................................. 281.2.4. Impact of food processing on element concentration in food ................... 301.2.5. Food contamination from storage and packaging materials ...................... 31
1.3. Bioavailability of elements ................................................................................... 321.3.1. Element bioavailability in soil-plant system .............................................. 331.3.2. Bioavailability of elements from food to human organism ....................... 34
1.4. Recent studies in Latvia – micro- and macroelement analysis ............................ 36
2. MAteRIALS AnD MetHoDS ............................................................................ 382.1. Food sampling, sample preparation and pretreatment .......................................... 38
2.1.1. Collection of food samples ......................................................................... 382.1.2. Pretreatment of food samples prior quantitative analysis .......................... 40
2.2. Experimental setup of element transfer study ...................................................... 422.2.1. Soil sampling and the crop growth experiment ......................................... 422.2.2. Pretreatment of soil samples ...................................................................... 442.2.3. Sampling of experimentally grown vegetables .......................................... 442.2.4. Element speciation analysis ........................................................................ 44
2.3. Quantitative analysis of elements ......................................................................... 462.3.1. Analytical methods ..................................................................................... 462.3.2. Quality assurance of analytical methods .................................................... 47
2.4. Reagents and laboratory equipment ...................................................................... 502.5. Data statistical analysis ......................................................................................... 51

4
3. ReSULtS AnD DISCUSSIon .............................................................................. 523.1. Assessment of the performance of analytical methods ........................................ 52
3.1.1. Verificationofanalyticalmethodsbyanalysisofcertifiedreferencesamples ....................................................................................................... 52
3.1.2. Comparison of food sample analysis done by different analytical techniques .................................................................................................. 55
3.1.3. Comparative evaluation of food sample pretreatment procedures ........... 573.2. Concentration of elements in studied food samples ............................................. 59
3.2.1. Concentration of elements in food of plant origin ..................................... 593.2.2. Concentration of elements in food of animal origin .................................. 713.2.3. Element concentration in beverages ........................................................... 79
3.3. Conditionsinfluencingelementconcentrationinanalysedfoodsamples ............ 813.3.1. Impact of seasonality on element concentration in food ........................... 813.3.2. Impactofsite-specificconditionsontheconcentrationofelements
in food ......................................................................................................... 863.3.3. Impact of botanical origin on element concentration in food .................... 883.3.4. Impact of processing or agricultural practice on the concentration
of elements in food ..................................................................................... 913.4. Assessment of element bioavailability .................................................................. 97
3.4.1. Characteristics of soil samples ................................................................... 973.4.2. Accumulation of elements in experimentally grown food crops ............... 1023.4.3. Assessment of element bioavailability in food chain segment
soil-plant ..................................................................................................... 1113.4.4. Assessment of element bioavailability in food chain segment
plant-human; the case study with lettuce ................................................... 114
ConCLUSIonS ........................................................................................................ 116
ACKnoWLeDGeMentS ........................................................................................ 118
ReFeRenCeS ............................................................................................................ 119
APPenDICeS ............................................................................................................ 132
PRoMoCIJAS DARBA KoPSAVILKUMS .............................................................. 143

5
ABBReVIAtIonS AnD GLoSSARYaas atomic absorption spectrometry
cec cation exchange capacity
dW; WW dry weight; wet weight
ear estimated average requirement: a nutrient intake value that is estimated to meet the requirement of half of the healthy individuals in a life stage and gender group (duffus et al., 2007)
faas flame atomic absorption spectrometry
Gfaas graphite furnace atomic absorption spectrometry
icp-aes; icp-oes inductively coupled plasma atomic emission spectrometry; inductively coupled plasma optical emission spectrometry
icp-ms inductively coupled plasma mass spectrometry
Ld lethal dose
Lod limit of detection
mrL minimal risk level
ptfe/tfm® polytetrafluoroethylene/tfm® (teflon)
rda recommended dietary allowance: the dietary intake level that is sufficient to meet the nutrient requirements of nearly all healthy individuals in a life stage and gender group (duffus et al., 2007)
rni reference nutrient intake
sUL safe upper level
tXrf total reflection X-ray fluorescence spectrometry
UL tolerable upper intake level: the highest level of nutrient intake that is likely to pose no risk of adverse health effects for almost all individuals in the general population (duffus et al., 2007)

6
AnnotAtIon
Besides the transfer of essential micro- and macroelements from environment to food, contamination of food chain with toxic and potentially toxic elements, e.g., as, cd, hg, pb may occur. The aim of the doctoral thesis “impact of environmental conditions on micro- and macroelement content in selected food from Latvia” included quantitative investigation of food samples collected in Latvia to discover factors influencing the con-centration and possible transfer routes of elements in food. in addition, element bioavail-ability in food chain was studied by experimental food crop growth in contaminated soil. obtained results revealed influence of several factors, e.g., seasonality, botanical origin, site-specific factors, applied agricultural practice, food processing on the concentration of elements in food.
Key words: micro- and macroelements, quantitative analysis, element transfer, food composition, environment, Latvia.
AnotĀCIJA
Bez vitāli svarīgo mikro- un makroelementu ieneses pārtikā no vides (augsnes, ūdens un gaisa) ir iespējams arī barības ķēdes, t. sk., pārtikas piesārņojums ar toksiskiem vai potenciāli toksiskiem elementiem, piemēram, as, cd, hg, pb. promocijas darba mērķa ietvaros tika veikta Latvijā iegūtu pārtikas produktu paraugu mikro- un makroelementu sastāva kvantitatīvā analīze, lai noskaidrotu vides apstākļu ietekmi uz elementu koncen-trāciju un ieneses ceļiem pārtikā. papildus, lai vērtētu elementu biopieejamību barības ķēdē, tika veikta eksperimentāla pārtikas kultūraugu audzēšana mākslīgi piesārņotā aug-snē. iegūtie dati liecina par vairāku dabiskas un antropogēnas izcelsmes vides apstākļu, piemēram, sezonalitātes, botāniskās izcelsmes, vietas specifisku apstākļu, lauksaimniecī-bas prakses, pārtikas pārstrādes, ietekmi uz elementu koncentrāciju pārtikā.
Atslēgvārdi: mikro- un makroelementi, kvantitatīvā analīze, elementu pārnese, pārti-kas sastāvs, vide, Latvija.
7
IntRoDUCtIon
food and drinking water are the main sources of nutrient element supply for hu-man body. apart from basic substances of nutrition as proteins, carbohydrates and li-pids, human body requires fibres, vitamins, amino acids, enzymes and range of essen-tial chemical elements. macroelements such as ca, K, mg, na and microelements (e.g., cr, cu, fe, mn, mo, se, v, Zn) are essential compounds which affect vital functioning of human body – development, growth, reproduction. although the information of the chemical and nutritional content of majority of foodstuffs is established and aggregated in series of handbooks about nutrition and healthy diet, e.g., Burgerstein’s handbook of nutrition (Zimmermann, 2001), Handbook of nutrition and food (Berdanier et al., 2007), Uztura mācība (Nutrition studies) written by Latvian dieticians (Zariņš un neimane, 2009), and several databases constituted by agricultural and food research institutions (e.g., Usda, s.a.), micro- and macroelement content in food regionally is very variable (e.g., aberoumand and deokule, 2010; ekholm et al., 2007; ferre-huguet et al., 2008; hashmi et al., 2007). specific or natural environmental conditions with interconnection of anthropogenic influences may affect element content in food. for example, element content in soil can influence composition of vegetation that is consumed by animals or is used as human food, thus resulting in the specific element transfer into food chain which may affect human health, longevity and life quality in general (combs, 2005; fraga, 2005; nabrzyski, 2007). food contamination with toxic and potentially toxic elements (e.g., as, cd, cr, hg, pb) may occur resulting in reduced quality of daily nutrition and adverse health effects. Therefore, the assessment of the content and concentration of micro- and macroelements in connection with estimation of environmental and anthropogenic im-pacts are the issues of a high importance. information of tendencies in the content of elements in food also can be used as an indicator of regional environmental element background (fernandez-torres et al., 2005; fodor and molnar, 1993; pisani et al., 2008). Quantitative data of micro- and macroelement concentration is an indispensable tool for risk assessment analysis that can be associated with occasional intakes of elements in too high levels and may lead to the toxic adverse effects in human body or, contrary, can be connected with possible insufficiency of element intake that may determine de-ficiency of certain elements in human body (Goldhaber, 2003). Thus, interdisciplinary studies of micro- and macroelement concentration in foodstuffs are of importance for many branches of science including environmental science, chemistry, food and nutrition science, and health sciences. and the aim of such studies is not only to investigate im-pacts of environmental pollution, but also to identify element inputs from environment to food due to the natural environmental conditions as well as to discover the element transfer routes and accumulation processes. The research of micro- and macroelement concentration in food within the interconnection of impact of environmental conditions is of a great importance from the public healthcare perspective as support to regional or site-specific food production, especially considering growing role of biological and domestic farming as well as for further development of food quality control system.
8
The aim of the work was to study concentration of micro- and macroelements in se-lected foodstuffs collected over the territory of Latvia to characterize the impact of envi-ronmental conditions influencing element content, concentration and transfer in food, and to study the provisional bioavailability of elements in food chain soil-plant-human.
Tasks of the work � application and development of methodology for foodstuff sampling, pretreat-
ment and quantitative analysis of element concentration considering quality as-surance requirements.
� collection of food samples in Latvia and subsequent quantitative analysis of el-ement concentration, data statistical analysis, assessment of the impact of envi-ronmental conditions influencing element content in foodstuffs in respect to, e.g., environmental pollution, impact of natural and anthropogenic conditions.
� study of the routes of micro- and macroelement movement within the food chain soil-plant-human and assessment of provisional bioavailability of elements in food chain segments soil-plant and plant-human.
� provisional risk and benefit assessment of element contribution in human nutri-tion as well as comparison of micro- and macroelement concentration in food in Latvia with corresponding data from other countries.
The main focus of the work was the implementation of screening analysis of select-ed food in Latvia to discover the tendencies of micro- and macroelement concentration within the framework of impact of environmental conditions.
HypothesisQuantitative analysis of micro- and macroelements in food samples in Latvia is one of
the indicators of food quality, safety and nutritional value that can be affected by natural and anthropogenic environmental conditions.
Proposed theses1. Quantitative analysis of micro- and macroelements in food samples using meth-
ods of analytical chemistry – a challenge for the improvement of food analysis methodology and development of screening methods.
2. analysis of micro- and macroelements in food is a significant indicator of food safety and quality that can be assessed estimating specific conditions of food pro-duction process.
3. seasonality, site-specific, botanical factors, impact of agricultural practice, food processing specifics – conditions that affect micro- and macroelement composi-tion and concentration in food.
4. investigation of bioavailability of elements in food chain segments – important aspect of pollution transfer into nutrition with food.
5. Quantitative analysis of food is a perspective research direction within the context of environmental science, chemistry and health sciences that has to be developed in larger scale.

9
Scientific novelty1. further improvements of analytical methodologies of food and environmental
sample analysis, supporting advancement of prospective in food quality mon-itoring principles, with the prospective implementation of quality assurance procedures.
2. development of interdisciplinary approach for the investigation of natural and an-thropogenic factor impacts on food composition.
3. comparative evaluation of the accumulation processes of elements in foodstuffs derived in different conditions, e.g., biological farming versus conventional farm-ing etc.
4. development of micro- and macroelement analysis (fingerprint concept) as a tool for tracking food origin, identity and quality.
Practical importanceThe first comprehensive quantitative analysis of micro- and macroelement concen-
tration in representative foodstuffs in Latvia that reveals in general beneficial (in respect to human nutrition) composition of elements in food produced in Latvia, low impacts of environmental pollution and good perspectives to identify and label food produced in Latvia as compliable to highest quality criteria. determined tendencies of element trans-fer in food chain and provisional bioavailability assessment may be developed further in a favour of sustainable agriculture and gardening. estimation of food nutritional value regarding micro- and macroelements, local dietary specifics, food safety and provisional consumer risk assessment in Latvia can be used for further analysis of public health and for comparison of food composition on a worldwide scale.
ApprobationThe results of the doctoral thesis are published in 12 scientific articles. The results of
the research work have been presented in 15 reports at international conferences and in 10 reports at local conferences in Latvia.
related to the research field the author of the thesis has supervised 4 Bachelor re-search works and has advised the preparation of 3 master theses.
Scientific publications1. Vincevica-Gaile, Z., Klavins, m. (2013) concentration of elements in food: how can
it reflect impact of environmental and other influencing factors? Scientific Journal of Riga Technical University, Series: Environmental & Climate Technologies1 12: 15-19.
2. stapkevica, m., Vincevica-Gaile, Z., Klavins, m. (2013) metal uptake from con-taminated soils by some plant species – radish, lettuce, dill. Research for Rural Development2 1: 43-49.
1 Peer reviewed journal, indexed by the databases SCOPUS, EBSCO, CSA-ProQuest, VINITI; ISSN:1691-5208 (print version).
2 Peer reviewed proceedings, indexed by the databases AGRIS, CAB ABSTRACTS, CABI full text; EBSCO Academic Search Complete, Thomson Reuters ISI Web of Science, SCOPUS; ISSN:1691-4031.

10
3. Vincevica-Gaile, Z., Klavins, m., rudovica, v., viksna, a. (2013) research review trends of food analysis in Latvia: major and trace element content. Environmental Geochemistry & Health1 35: 693-703.
4. Vincevica-Gaile, Z., rudovica, v., Burlakovs, J., Klavins, m., priedite, e. (2013) analysis of major and trace elements in food: aspects of methodological applica-tions. SGEM 2013 GeoConference Proceedings on Ecology, Economics, Education & Legislation2 1: 49-56.
5. Vincevica-Gaile, Z., Gaga, K., Klavins, m. (2013) food and environment: trace ele-ment content of hen eggs from different housing types. APCBEE Procedia3 5: 221-226.
6. Vincevica-Gaile, Z., Klavins, m. (2012) transfer of metals in food chain: an exam-ple with copper and lettuce. Scientific Journal of Riga Technical University, Series: Environmental & Climate Technologies4 10: 21-24.
7. Vincevica-Gaile, Z., Klavins, m. (2012) root vegetables from Latvia: Quantitative analysis of potentially toxic elements. Research for Rural Development5 1: 131-136.
8. Vincevica-Gaile, Z., Klavins, m., rudovica, v., viksna, a. (2012) potentially tox-ic metals in honey from Latvia: is there connection with botanical origin? in: ramos, r.a.r., straupe, i., panagopoulos, t. (eds.) Recent Researches in Environment, Energy Systems and Sustainability6. Wseas press: faro, 297 p., 158-163.
9. Vincevica-Gaile, Z., Klavins, m., rudovica, v., viksna, a. (2011) trace and major el-ements in food articles in Latvia: root vegetables. Scientific Journal of Riga Technical University, Series: Environmental and Climate Technologies7 13(7): 119-124.
10. Vincevica-Gaile, Z., Klavins, m., rudovica, v., viksna, a. (2011) Geographical dis-semination of trace and major elements in honey. in: Brebbia, c.a. (ed.) Sustainability Today8. Wit press: southampton, 488 p., 211-220.
11. Vincevica-Gaile, Z., Klavins, m., Zilgalve, L. (2011) trace and major element con-centration in cottage cheese from Latvia. in: mastorakis, n., mladenov, v., savkovic-stevanovic, J. (eds.) Recent Researches in Sociology, Financing, Environment and Health Sciences9. Wseas press: meloneras, 356 p., 169-173.
1 Peer reviewed journal, imprint of SPRINGER (IF=2.076 (2012)), indexed by the databases SpringerLink, SCOPUS; ISSN:0269-4042 (print version), ISSN:1573-2983 (electronic version).
2 Peer reviewed proceedings, indexed by the databases SCOPUS, EBSCO, Thomson Reuters ISI Web of Knowledge, CrossRef Database, CrossRef Cited By Linking, ProQuest, Scirus, GeoRef; ISBN:978-619-7105-04-9, ISSN:1314-2704.
3 Peer reviewed journal, imprint of ELSEVIER, indexed by the database Science Direct, SCOPUS; ISSN:2212-6708.
4 Peer reviewed journal, indexed by the databases SCOPUS, EBSCO, CSA-ProQuest, VINITI; ISSN:1691-5208 (print version).
5 Peer reviewed proceedings, indexed by the databases AGRIS, CAB ABSTRACTS, CABI full text; EBSCO Academic Search Complete, Thomson Reuters Web of Science, SCOPUS; ISSN:1691-4031.
6 Peer reviewed proceedings, indexed by the databases Thomson Reuters ISI Web of Knowledge, SCOPUS, British Library, EBSCO etc.; ISSN:2227-4359, ISBN:978-1-61804-088-6.
7 Peer reviewed journal, indexed by the databases SCOPUS, EBSCO, CSA-ProQuest, VINITI; ISSN:1691-5208 (print version).
8 Edited book; ISBN:978-1-84564-652-3, eISBN: 978-1-84564-653-0.9 Peer reviewed proceedings, indexed by the databases Thomson Reuters ISI Web of Knowledge,
SCOPUS, British Library, EBSCO etc.; ISBN:978-960-474-287-5.

11
12. Vincēviča-Gaile, Z. (2010) makro- un mikroelementu saturs medū / macro- and trace elements in honey. [in Latvian] Proceedings of the Latvia University of Agriculture1 25(320): 54-66.
Reports presented at international conferences1. riga technical University 54th international scientific conference. Latvia, riga,
october 14-16, 2013. report “Quantitative content of elements in food: how can it reflect impact of environmental and other influencing factors?” (Vincevica-Gaile, Z., Klavins, m.)
2. The 44th iUpac (International Union of Pure and Applied Chemistry) Word chemistry congress. turkey, istanbul, august 8-16, 2013. report “metal uptake and bioavail-ability: from soil to food through crops” (Vincevica-Gaile, Z., stapkevica, m., dudare, d., Klavins, m.)
3. The 13th international multidisciplinary scientific Geo conference SGEM 2013. Bulgaria, albena, June 16-22, 2013. report “analysis of major and trace elements in food: aspects of methodological applications” (Vincevica-Gaile, Z., rudovica, v., Burlakovs, J., Klavins, m.)
4. The 19th annual international scientific conference Research for Rural Development 2013. Latvia, Jelgava, may 15-17, 2013. report “metal uptake from contaminated soils by some plant species (radish, lettuce, dill)” (stapkevica, m., Vincevica-Gaile, Z., Klavins, m.)
5. international conference Environmental Health 2013, Science and Policy to Protect Future Generations. Usa, massachusetts, Boston, march 3-6, 2013. report “presence of arsenic in baby food: is it the issue of concern?” (Vincevica-Gaile, Z., Lawgali, y.f., meharg, a.a., Klavins, m.)
6. The 14th international conference on environmental science and development. Uae, dubai, January 19-20, 2013. report “food and environment: trace element content of hen eggs from different housing types” (Vincevica-Gaile, Z., Gaga, K., Klavins, m.)
7. riga technical University 53rd international scientific conference. Latvia, riga, october 11-12, 2012. report “transfer of metals in food chain: an example with copper and lettuce” (Vincevica-Gaile, Z., Klavins, m.)
8. sino-european symposium on environment and health SESEH 2012. ireland, Galway, august 20-25, 2012. report “research of food from Latvia: analysis of es-sential elements and possible contaminants” (Vincevica-Gaile, Z., Klavins, m., rudovica, v., viksna, a.)
9. The 18th annual international scientific conference Research for Rural Development 2012. Latvia, Jelgava, may 16-18, 2012. report “root vegetables from Latvia: Background levels and risks of contamination with toxic elements” (Vincevica-Gaile, Z., Klavins, m.)
10. The 8th iasme/Wseas (International Association of Mechanical Engineering / World Scientific and Engineering Academy and Society) conference on energy, environment,
1 Peer reviewed journal, indexed by the databases CAB Abstracts, AGRIS; ISSN:1407-4427 (print version), ISSN:2255-8535 (electronic version).
12
ecosystems and sustainable development EEESD 2012. portugal, faro, may 2-4, 2012. report “potentially toxic metals in honey from Latvia: is there connection with botanical origin?” (Vincevica-Gaile, Z., Klavins, m., rudovica, v., viksna, a.)
11. The 12th eurasia conference on chemical sciences EuAsC2S 2012. Greece, corfu, dassia, april 16-21, 2012. report “trace and major elements in root vegetables: a study in Latvia” (Vincevica-Gaile, Z., Klavins, m., rudovica, v., viksna, a.)
12. The 3rd United World congress of Latvian scientists and the 4th Letonika (Latvian studies) congress, section Quality of the environment of Latvia: Current situation, challenges, problem solutions. Latvia, riga, october 24-27, 2011. report “trace and major element analysis within the context of environmental science” [in Latvian] (Vincevica-Gaile, Z., Klavins, m., rudovica, v., viksna, a.)
13. The 4th international conference on medical Geology GEOMED 2011. italy, Bari, september 20-25, 2011. report “risk and benefit assessment of trace and major el-ements detected in honey of different origins” (Vincevica-Gaile, Z., Klavins, m., rudovica, v., viksna, a.)
14. The 1st international conference on food and environment FENV 2011. United Kingdom, new forest, Lyndhurst, June 21-23, 2011. report “Geographical dissem-ination of trace and major elements in honey” (Vincevica-Gaile, Z., Klavins, m., rudovica, v., viksna, a.)
15. The 2nd Wseas (World Scientific and Engineering Academy and Society) international conference on environment, medicine and health sciences EMEH 2011. spain, Gran canaria, playa meloneras, march 24-26, 2011. report “trace and major ele-ment concentration in cottage cheese from Latvia” (Vincevica-Gaile, Z., Zilgalve, L., Klavins, m.)
Reports presented at local conferences in Latvia1. The 72nd scientific conference of University of Latvia. riga, January 27, 2014. report
“impact of environmental conditions on the content of microelements in food: analysis of cereal products” [in Latvian] (Vincēviča-Gaile, Z., Gāga, K., rudoviča, v., Kļaviņš, m.) abstract published in: Geography. Geology. Environmental Science: Book of abstracts, 67-69.
2. The 71st scientific conference of University of Latvia. riga, January 29, 2013. report “transfer of heavy metals in food chain soil-plant” [in Latvian] (stapkēviča, m., Vincēviča-Gaile, Z., Kļaviņš, m.) abstract published in: Geography. Geology. Environmental Science: Book of abstracts, 215-216.
3. The 70th scientific conference of University of Latvia. riga, January 31, 2012. report “content of micro- and macroelements in root vegetables in Latvia” [in Latvian] (Vincēviča-Gaile, Z., Kļaviņš, m., rudoviča, v., vīksna, a.) abstract published in: Geography. Geology. Environmental Science: Book of abstracts, 398-399.
4. The 70th scientific conference of University of Latvia. riga, January 31, 2012. report “transfer of metals within the food chain soil-plant (example of cu2+)” [in Latvian] (Vincēviča-Gaile, Z., Kļaviņš, m.) abstract published in: Geography. Geology. Environmental Science: Book of abstracts, 397-398.

13
5. The 70th scientific conference of University of Latvia. riga, January 31, 2012. report “application of total reflection X-ray spectrometry for direct analysis of liquid sam-ples” [in Latvian] (Vincēviča-Gaile, Z., purmalis, o., Kļaviņš, m.) abstract published in: Geography. Geology. Environmental Science: Book of abstracts, 400-401.
6. The 70th scientific conference of University of Latvia. riga, January 31, 2012. report “influence of seasonality on micro- and macroelement content of hen eggs” [in Latvian] (Gāga, K., Vincēviča-Gaile, Z., Kļaviņš, m.) abstract published in: Geography. Geology. Environmental Science: Book of abstracts, 291-292.
7. The 70th scientific conference of University of Latvia. riga, January 31, 2012. report “influence of botanical origin on the element content of honey in Latvia” [in Latvian] (priedīte, e., Vincēviča-Gaile, Z., Kļaviņš, m., rudoviča, v., vīksna, a.) abstract published in: Geography. Geology. Environmental Science: Book of abstracts, 356-357.
8. The 69th scientific conference of University of Latvia. riga, february, 2011. report “environmental conditions influencing fluctuation of micro- and macroelement con-tent of cottage cheese” [in Latvian] (Vincēviča-Gaile, Z., Zilgalve, L., Kļaviņš, m.) abstract published in: Geography. Geology. Environmental Science: Book of abstracts, 501-504.
9. The 69th scientific conference of University of Latvia. riga, february, 2011. report “significance of micro- and macroelement content of honey within the context of environmental science” [in Latvian] (Vincēviča-Gaile, Z., Bula, r., Kļaviņš, m.) abstract published in: Geography. Geology. Environmental Science: Book of abstracts, 499-501.
10. The 68th scientific conference of University of Latvia. riga, february, 2010. report “Biogeochemical relevance of selenium” [in Latvian] (Vincēviča-Gaile, Z.) abstract published in: Geography. Geology. Environmental Science: Book of abstracts, 440-442.
14
1. LIteRAtURe ReVIeW
1.1. Characteristics of elements in human health and diet – interconnection with environment
Basic elements (c, h, n and o) form up to 97 % of the matter of living systems. content of these elements in the tissues and organs of human body is estimated as fol-lows: o (61 %) >c (23 %) >h (10 %) >n (2.6 %), respectively, in average of human body weight. other elements can be subdivided in macro- and microelements. macroelements are ca, cl, K, mg, na, p, s and si; each of them accounts about 0.03-1.4 % of human body weight. microelement concentration in human body is variable – from less than 0.1 mg/kg to more than 100 mg/kg. microelement group involves such elements as ag, al, as, au, B, Ba, Br, cd, co, cr, cs, cu, f, fe, i, mn, mo, ni, pb, rb, sc, se, sn, sr, v, Zn, but the list may vary due to the traits of the lifestyle, diet and habitation environment of an individual (aras and ataman, 2006; Baltes, 1998; fraga, 2005; Garrett, 2005; Goldhaber, 2003).
nutrition, including food, beverages and drinking water, is the main source of el-ements for human body. Therefore, the composition of chemical elements in diet can be assessed as important transition matter for the uptake of nutritionally important as well as potentially toxic elements. in this chapter essentiality and toxicity of elements in respect to human health and element transition routes in food from the environment is discussed.
1.1.1. Essentiality of elementsfrom all known chemical elements about 50 elements can be found in living organ-
isms, including plants, animals and humans, but only for 23 elements the physiological relevance for humans has been revealed (combs, 2005; fraga, 2005). elements are essen-tial if they are vitally important and irreplaceable for normal physiology of the organism (aras and ataman, 2006; Goldhaber, 2003). essentiality to the element is attributed if the consumption of element at levels above the safe adequate intake induces alterations in physiological functions of organs and tissues (aras and ataman, 2006). The group of es-sential compounds involve not only chemical elements, but also amino acids, fatty acids, vitamins – compounds that cannot be synthesized by organism itself but are unambigu-ously needed for the biological functions (combs, 2005). however, the term essentiality is a relative designation due to the specific needs of biological systems for various elements in different amounts, i.e., some elements considered as essential for certain species can be non-essential or even toxic for another species and some elements can be essential in certain amount while in higher concentration they become toxic. for example, v and co are essential elements for blue-green algae, one within the function of photosynthesis and another is involved in the process of nitrogen fixation. at the same time function of cobalt in higher plants is unknown and, if attributed to humans, biological function of v is not clearly understood (Kabata-pendias, 2011).
c.a. Bowman with colleagues (2003) listed elements that are essential for all living organisms (c, co, cu, fe, h, K, Li, mg, mn, mo, n, p, s and Zn) and those essential for

15
most of the living organisms (al, as, B, Br, ca, cd, cl, cr, f, i, na, ni, o, se, si and v). The role of some elements (e.g., al, as, B, sn, v) in human health is still under the sci-entific investigation and, therefore, the term possibly essential elements can be attributed. elements can be toxic, potentially toxic or non-toxic elements, nevertheless, it depends on the element concentration (atsdr, s.a.; szefer and Grembecka, 2007; Who, 1996). according to a. Kabata-pendias and a.B. mukherjee (2007), elements that are found in detectable levels in human body can be listed as follows: a) essential elements – as, B, Br, cl, co, cr, cu, f, fe, i, Li, mn, mo, p, s, se, si, v and Zn; b) possibly essential ele-ments – al, Ba, Ge, ni, rb, sn, sr and ti; c) non-essential elements – ag, au, cs, hf, in, ir, sb, ta, te, U, y, Zr, including rare earth elements; d) non-essential and highly toxic elements – Be, Bi, cd, hg, pb and tl. in the group of suspected essentials G.f. combs (2005) involved such elements as as, B, ni, pb, si, v. however, the classification of ele-ments is conditional and may vary due to the subjective research results and up-to-date scientific findings.
General contribution of elements in human physiology is following: a) ca, f, mg and p are involved in structures of bones and membranes; b) cl, K and na supports the balance of water and electrolytes; c) cu, mg, mo, se and Zn participate in metabolic catalysis; d) fe is involved in binding of oxygen; e) i and cr are associated with hormone formation and activity (aras and ataman, 2006; combs, 2005). in details the main functions of essential and possibly essential elements and the main food sources are summarized in appendix i.
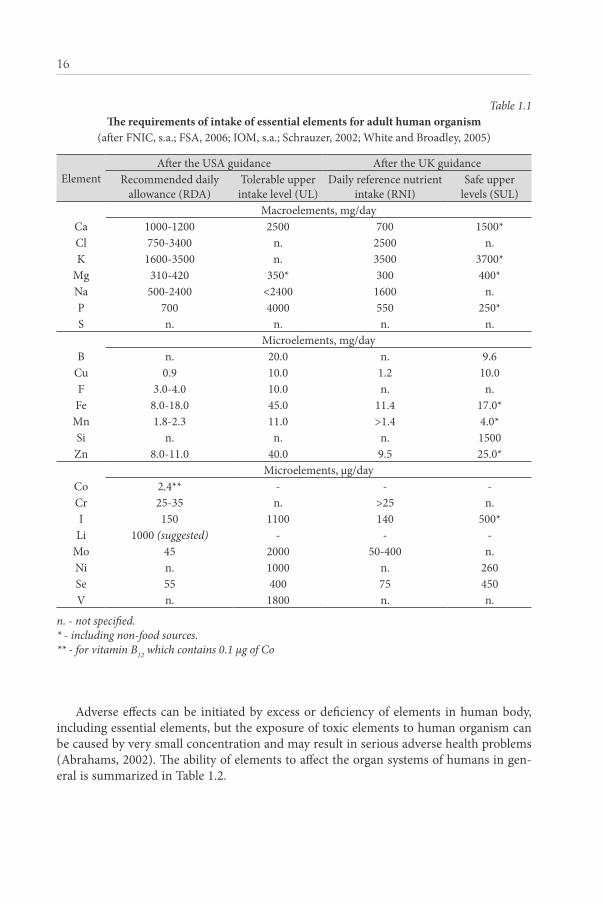
nutritionally important elements can be subdivided in macroelements or macronu-trients (e.g., ca, K, mg, na) and microelements or micronutrients (e.g., co, cr, cu, mo, ni, se), depending on the required daily consumption amounts. daily requirement of microelements usually is less than 100 mg/day, while macronutrients for human body are necessary in larger quantities (abrahams, 2002; fraga, 2005). requirements usually are calculated taking into account the studies of regional dietary surveys. several terms are used to set and describe required element concentration for humans, e.g., recommend-ed daily allowance (rda), estimated average requirement (ear), upper intake level (UL), reference nutrient intake (rni) etc. (duffus et al., 2007; fsa, 2006; iom, s.a.; schrauzer, 2002; White and Broadley, 2005). requirements of essential elements for humans derived after the Usa and the UK guidance documents are summarized in table 1.1.
1.1.2. Toxicity of elementsaccording to the definition stated by the international Union of pure and applied
chemistry (iUpac), a substance can be estimated as toxic if it has ‘capacity to cause in-jury to a living organism defined with reference to the quantity of substance administered or absorbed, the way in which the substance is administered and distributed in time (single or repeated doses), the type and severity of injury, the time needed to produce the injury, the nature of the organism(s) affected and other relevant conditions’ (duffus et al., 2007). toxic substances can cause cumulative and non cumulative effects. cumulative effects are adverse effects that occur after repeated exposure by a toxic substance, while non cumu-lative effects may be caused by rapidly absorbable and rapidly eliminated toxic substances (duffus et al., 2007). cumulative effects usually are associated with accumulation of a substance in tissues or organs of living organisms or in elements of ecosystems.
16
Table 1.1The requirements of intake of essential elements for adult human organism
(after fnic, s.a.; fsa, 2006; iom, s.a.; schrauzer, 2002; White and Broadley, 2005)
elementafter the Usa guidance after the UK guidance
recommended daily allowance (rda)
tolerable upper intake level (UL)
daily reference nutrient intake (rni)
safe upper levels (sUL)
macroelements, mg/dayca 1000-1200 2500 700 1500*cl 750-3400 n. 2500 n.K 1600-3500 n. 3500 3700*
mg 310-420 350* 300 400*na 500-2400 <2400 1600 n.p 700 4000 550 250*s n. n. n. n.
microelements, mg/dayB n. 20.0 n. 9.6
cu 0.9 10.0 1.2 10.0f 3.0-4.0 10.0 n. n.fe 8.0-18.0 45.0 11.4 17.0*
mn 1.8-2.3 11.0 >1.4 4.0*si n. n. n. 1500Zn 8.0-11.0 40.0 9.5 25.0*
microelements, μg/dayco 2.4** - - -cr 25-35 n. >25 n.i 150 1100 140 500*
Li 1000 (suggested) - - -mo 45 2000 50-400 n.ni n. 1000 n. 260se 55 400 75 450v n. 1800 n. n.
n. - not specified.* - including non-food sources.** - for vitamin B12 which contains 0.1 μg of Co
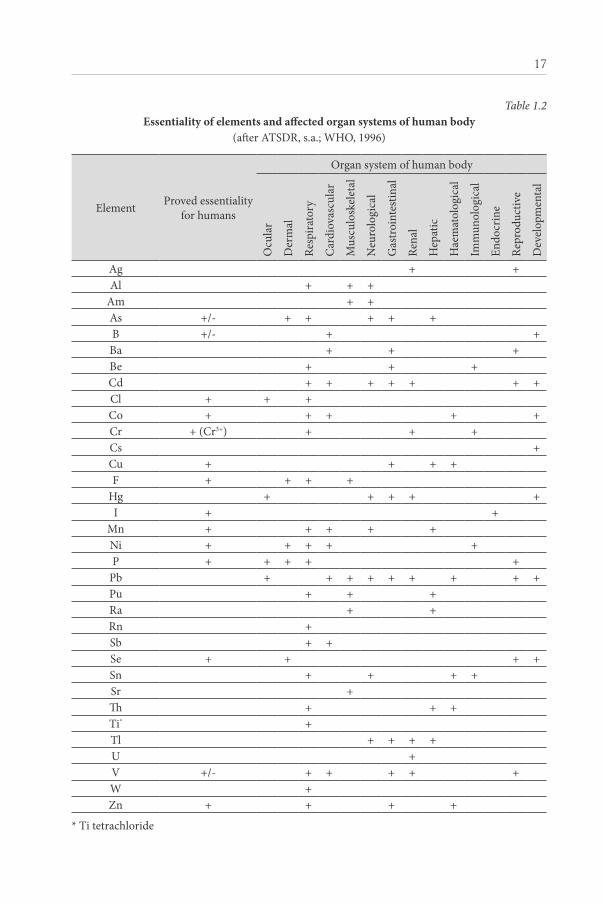
adverse effects can be initiated by excess or deficiency of elements in human body, including essential elements, but the exposure of toxic elements to human organism can be caused by very small concentration and may result in serious adverse health problems (abrahams, 2002). The ability of elements to affect the organ systems of humans in gen-eral is summarized in table 1.2.
17
Table 1.2essentiality of elements and affected organ systems of human body
(after atsdr, s.a.; Who, 1996)
element proved essentiality for humans
organ system of human body
ocu
lar
der
mal
resp
irato
ry
car
diov
ascu
lar
mus
culo
skel
etal
neu
rolo
gica
l
Gas
troi
ntes
tinal
rena
l
hep
atic
hae
mat
olog
ical
imm
unol
ogic
al
endo
crin
e
repr
oduc
tive
dev
elop
men
tal
ag + +al + + +
am + +as +/- + + + + +B +/- + +Ba + + +Be + + +cd + + + + + + +cl + + +co + + + + +cr + (cr3+) + + +cs +cu + + + +f + + + +
hg + + + + +i + +
mn + + + + +ni + + + + +p + + + + +
pb + + + + + + + + +pu + + +ra + +rn +sb + +se + + + +sn + + + +sr +Th + + +ti* +tl + + + +U +v +/- + + + + +W +Zn + + + +
* ti tetrachloride

18
special attention should be focused on elements and substances with revealed or sus-pected carcinogenity as the adverse effects caused by them are cumulative, more destruc-tive and irreversible (table 1.3).
Table 1.3 Known information of carcinogenity of compounds containing certain elements
(after acs, 2011; atsdr, s.a.; echa, 2013; iris, s.a.; ntp, 2011)
element radio-nuclide
evidence of human
carcinogensubstances of carcinogenic concern
al +/-am + (241am)
as + as acid; ca arsenate; diarsenic pentaoxide; diarsenic trioxide; triethyl arsenate
Be +/-cd +/-
co + (60co) +/- co dichloride; co (ii) carbonate; co (ii) diacetate, co (ii) dinitrate; co (ii) sulphate; co-W carbide
cr +/-
cr (vi) and its compounds; acids generated from chromium trioxide and their oligomers; ammonium dichromate; cr trioxide; dichromium tris(chromate);
pentazinc chromate octahydroxide; K chromate, K dichromate; K hydroxyoctaoxodizincate dichromate;
na chromate; na dichromatecs + (137cs)hg +/- hg chloridei + (129i, 131i) +/-
ni + ni carbonyl; ni refinery dust; ni subsulphide; metallic nickel
p +/-
pb +pb and its compounds; pb chromate; pb chromate
molybdate sulphate red; pb hydrogen arsenate; pb sulphochromate yellow; trilead diarsenate
pu + +ra + +rn + +se +/- se sulphidesr + (90sr) +/- sr chromateTh + + Th dioxideU +
adverse effects induced by the deficiency of elements or excessive intake of elements are summarized in appendix ii.
toxicity is dependent on the characteristics of an action of a substance, intensity and time of exposure. toxicity of substances can be subdivided: a) acute toxicity – expressed

19
as Ld50 or lethal dose that induces death of 50 % of representatives of an exposed indi-vidual – Ld50 <1 mg/kg: extremely toxic substances, 1 <Ld50 <50 mg/kg: very toxic sub-stances, 50 <Ld50 <500 mg/kg: medium toxic substances, 500 <Ld50 <5000 mg/kg: slightly toxic substances; b) chronic toxicity – continuous and reiterative exposure of non lethal doses of a substance that causes cumulative damage for organism (eXtoXnet, s.a.; Liguts, 2001). however, in the assessment of food contamination it is more correct to deal with minimal risk levels (mrL) derived by the agency for toxic substances and disease registry in the Usa. ‘An MRL is an estimate of the daily human exposure to a hazardous substance that is likely to be without appreciable risk of adverse or non-cancer health effects over a specified duration of exposure’. minimal risk levels are derived from acute-dura-tion (1-14 days), intermediate-duration (>14-364 days) and chronic-duration (≥365 days) oral exposure studies (atsdr, s.a.). oral mrLs as well as estimated oral intake levels for several elements are summarized in appendix iii. The abbreviation MRL discussed here should not be confused with maximum residue levels set by european institutions for contaminants such as pesticides.
as it was mentioned previously, highly toxic elements for humans are Be, Bi, cd, hg, pb and tl. predominant exposure as well as acute and chronic adverse effects caused by highly toxic elements for humans are summarized in table 1.4.
1.1.3. Transfer routes of elements in human nutritionfood and drinking water are the main sources that supply human body with nutrients
including micro- and macroelements; slight amounts of elements can be inhaled from air. nowadays industrial food production has been developed rapidly and is steady restricted by laws and regulations that set down limitations for composition of food. however, food products derived from plant or animal origin and produced by small farms or individual households still are exposed to the influence of regional or site-specific environmental conditions. although element circulation in ecosystems is a process without cease in-be-tween the main constituents of biosphere, soil, water and air; vegetation is the primary recipient of elements from environment, mainly taking up micro- and macroelements by roots and foliage (Kabata-pendias, 2011; Kabata-pendias and mukherjee, 2007; voutsa et al., 1996). element transfer into the food chain continues from plants to animals, finally reaching food of plant origin and food of animal origin and human nutrition (figure 1.1).
if compared with animals, plants can be assessed as the major components of ecosys-tem involved in element transfer from environment to food due to their capacity to take up, store chemical elements, synthesize or resynthesize chemical compounds containing certain elements available in soil and water. as soil is the main environmental provider of elements, the research of element transfer into food and mineral nutrition can be assessed as well to geological issues (Bowman et al., 2003; combs, 2005). plants can take up and accumulate from the environment where they grow not only essential elements needed for plant nutrition but also toxic elements, thus successive element transfer into the food chain can appear and may cause potential risks for both, plant and human or animal health (voutsa et al., 1996).
different plant species in distinctive growth conditions may be affected various-ly, but after the toxicological experiments it has been revealed that most toxic elements
20
Table 1.4 exposure assessment and observed adverse effects after oral exposure caused by highly toxic
elements for humans (after atsdr, s.a.; Baltes, 1998; Kabata-pendias and mukherjee, 2007; Liguts, 2001;
Who, 1996; Who, s.a.)
element exposure of general population
observed adverse effects after oral exposureacute chronic
Be
� inhalation: predominant
� ingestion: possible � dermal: rare
Berylliosischronic beryllium disease, anorexia, blueness of hands
and feet, dna damage
Bi
� inhalation: predominant
� ingestion: possible � dermal: rare
nausea, loss of appetite and weight, malaise, albuminuria,
diarrhoea, skin reactions, stomatitis, headache,
fever, sleeplessness, vague feeling, bodily discomfort,
depression, rheumatic pain, black line on gums
(deposition of Bi sulphide), skin irritation, eye irritation
Kidney damage, liver disfunction, anaemia, ulcerative stomatitis,
exodermitis
cd
� inhalation: significant from smoking
� ingestion: predominant
� dermal: rare
diarrhoea, stomach pains, vomiting, bone
fracture, cardiomyopathy, psychological disorders
accumulation in kidneys with subsequent kidney damage,
damage of liver, reproductive failure, potentially teratogenic,
dna damage, cancer
hg
� inhalation: possible, especially from smoking
� ingestion: predominant
� dermal: rare
disruption of nervous system, brain function damage with subsequent personality changes, tremors, vision
changes, deafness, muscle discoordination, memory loss), allergic reactions (skin rushes, tiredness, headaches), dna and chromosomal damage (causes mongolism),
negative reproductive effects (sperm damage, birth effects, miscarriages)
pb
� inhalation: significant (15 %)
� ingestion: predominant (dietary intake 65 %; water intake 20 %)
� dermal: possible (organic pb compounds)
haematologic effects, anaemia, neurological effects, kidney damage, brain damage, emphysema and lung cancer,
reproductive disorders (declined fertility, miscarriages, subtle abortions), can cross placenta barrier, behavioural disruptions
for children
tl
� inhalation: rare � ingestion:
predominant (mainly caused by ingestion of rat poison containing tl sulphate)
� dermal: rare
stomach aches, damage of nervous system
disturbance of nervous system, tremor, tiredness, headaches, depression, lack of appetite,
hair loss, vision changes, nerve pains, joint pains
21
for higher plants and also for several microorganisms are such elements as ag, Be, cd, co, cu, hg, ni, pb and sn. There are plant species that are tolerable to toxic elements in excessive concentration, while other species are more sensitive to certain elements (Kabata-pendias, 2011; Kabata-pendias and mukherjee, 2007). element transfer from soil to plants is a natural process of element circulation in the environment. it is a cluster of complicated biochemical reactions that can be affected by natural as well as anthropo-genic influence. Therefore, estimation of plant uptake of elements should be assessed not only based on the soil properties, where plants were grown, but within the complex of biotic and abiotic factors (Kabata-pendias, 2011). element transfer into the food chain can be realized through different pathways as shown in figure 1.2.
Figure 1.2. Routes of element transfer from soil to human nutrition by the food chain (author’s work out; after Kabata-pendias and mukherjee, 2007)
Figure 1.1. Schematic overview of element transfer from environment to human nutrition (author’s work out)
Vegetation / Plants
Food of plant origin
Food of animal origin
AIR
SOIL
WATER UZTURSHUMAN NUTRITION
– –
Animals
direct route of element transferindirect route of element transfer

22
element transfer from environment to food chain via atmospheric deposition is de-pendent on the size of particulate matter; also chemical composition of particles is im-portant. particulate matter containing toxic substances may deposit on the surface of soil, water and plants. as smaller particles are, as easier they can be absorbed by plants and in-haled by animals and humans bringing subsequent effects on nutrition and human health (allen et al., 2001).
some authors mention also direct route of element transfer to human nutrition from soil. small soil particles may be digested with consumption of unwashed vegetables and fruits thus increasing the possibility also of airborne particle deposition and admission into food chain. rarely observed direct route of element transfer from soil to nutri-tion is called geophagia or soil eating that can be intentional or in most cases unwitting, and might be joint with specific cultural traditions or folk-medicine where soil compo-nents (such as kaolin) are ingested (abrahams, 2002; combs, 2005; Kabata-pendias and mukherjee, 2007).
1.2. Contamination sources and natural occurrence of elements in food
consumer safety is the main reason why food contamination is a question of high im-portance. soil contamination and possible subsequent site-specific and vegetation pollu-tion with potentially toxic elements may occur due to the natural environmental process-es and anthropogenic activities. respectively, volcanic releases, atmospheric depositions, mining and use of chemicals in agricultural practices can be mentioned as well recog-nized examples. Geochemical anomalies, variable site-specific content of elements in soil, agrochemical applications, and pollution influence element content and concentration in plants consumed by humans as foodstuffs resulting in dietary intake of micro- and macroelements (hao et al., 2009; Kabata-pendias, 2004; Kabata-pendias and mukherjee, 2007). Background element content of soil is not constant but influenced by natural pro-cesses in soil and affected also by human impact or anthropogenic factors which mainly bring moderate diffuse inputs of chemicals into the soil, therefore, concentration of ele-ments can vary in time (diez et al., 2009; Kabata-pendias and mukherjee, 2007).
contamination with microelements may be caused by influence of natural environ-mental impact, environmental pollution, applied agricultural practice in food plant culti-vation and animal breeding, food manufacturing, processing, packaging and storage that is discussed in this chapter.
1.2.1. Impact of natural environmental background on the concentration of elements in food
micro- and macroelements naturally occur in the all phases of environmental sys-tems: lithosphere, hydrosphere and atmosphere, but the ambient element concentration and forms of speciations are very variable and may influence biology and physiology of plants, animals and humans (Bowman et al., 2003). it is not possible to estimate uni-tary environmental backgrounds of elements in any of environmental systems all over the earth, but, by estimating regional or site-specific environmental background of
23
micro- and macroelements it is possible to indicate potential risks for populations in se-lected areas (Garrett, 2005).
scientific discipline that investigates impact of environmental conditions on plant, animal and human health is medical geology (Bowman et al., 2003). c.a. Bowman with colleagues (2003) stated that in this field of research there can be selected two main in-vestigation trends that are based on the variability of element sources in the environment: a) natural occurrence of elements in the environment – mostly connected with investi-gation of regional or site-specific geological background that can influence local popula-tions via food chain; b) occurrence of elements by impact of environmental hazards, e.g., influence of volcanic eruptions, flooding, landslides.
naturally occurring micro- and macroelements in the soil-plant transfer generally are originated from mineral material of soil that become available for plants after weathering of soil or other processes in the soil system. element behaviour can differ: some elements circulate from deeper layers of soil, while other elements are concentrated in the soil sur-face (steinnes, 2009).
The majority of elements are naturally occurring in the environment. soil erosion and volcanic eruptions can be mentioned as the main release sources of elements globally. however, soil can be assessed as the basic matrix of elements from where it can reach food via food chain and water. although almost all elements are detectable in soils of different regions of the world, several elements can be brought forward. The main at-tention should be paid to the absence or excessive presence of essential elements (e.g., i, se) in soil and, consequently, in plants and food of the certain area. another very im-portant group involves the presence of toxic and potentially toxic elements (e.g., as) in soil. among the elements that have been recognized worldwide as potential food chain affectors as, f, fe, i and se can be listed (abrahams, 2002).
occurrence of several essential elements is tightly connected with the geological back-ground. for example, mn is predominant element of silicate rocks, Zn and se is found in silicates and sulphides; cu and mo are constituents of sulphides or can be found as basic elements together with fe, while fe can be found as well as in sulphides and silicates, as na-tive metal, and it is one of the most abundant elements in the earth’s crust (combs, 2005).
elements in soils can be located in various ways: a) lithogenic – natural occurrence from parent material of lithosphere; b) pedogenic – depending from lithogenic sources but influ-enced by soil forming processes; c) anthropogenic – element settling in soils or on their sur-face after the anthropogenic activities (Gilucis, 2007; Kabata-pendias and mukherjee, 2007).
a. Kabata-pendias and a.B. mukherjee (2007) stated that mutual interactions exist within micro- and macroelements in soil, and elements can be characterized by antag-onistic and synergistic nature. The main element relationships in soils can be assessed in-between elements as follows:
� ca and B, Ba, cd, co, cr, cs, Li, mn, ni, pb, sr, Zn; � p and as, cr, hg, mo, mn, ni, pb, rb, se, Zn; � mg and cr, mn, Zn, ni, co, cu; � fe and co, ni, mn, mo, cr, Zn; � mn and as, cr, cu, mo, ni, v, Zn; � cu and mo; � cd and Zn.

24
These interactions of elements are closely connected with sorption processes by soil particles and are giving important impact for system of plant root nutrition. however, influence of soil constituents should be assessed within the interconnections in whole environment: soil-atmosphere, soil-hydrosphere, soil-biosphere (abrahams, 2002).
element occurrence in soil is dependent on character of element mobility, e.g., some elements in soils are more mobile while others are immobile. it differs by the composition of soil layers vertically, i.e., element concentration in deeper soil layers is not equal with the top soil layers and several elements are tended to be transferred from deeper soil lay-ers to the top. plant growth with its function to uptake elements from deeper soil layers to the top layers works as natural plant pump of elements. That can result in the rise of certain element concentration in the surface layers of soil, if compared with deeper layers. This is particularly evident for plant nutrients such as K, ca, mn, and Zn, but may also explain surface enrichment of other elements readily absorbed by some plants such as Ba, cd, cs and rb (steinnes, 2009).
it is important to assess the natural environment as the unitary system soil-water-air. Within the almost all processes of living systems water takes the role of a fundamental solvent and the most important bearer of micro- and macroelements. however, chemi-cal composition of water cannot be estimated just by itself due to the tight environmen-tal system soil-water-air. hydrosphere consist of surface waters of the earth, including oceans and seas, rivers and streams, lakes and ponds, where oceans and seas compose about 98 % of all the water mass. in case of waters, instead of the term micro- and macro-elements, the expression micro- and macroconstituents should be used. natural waters contain dissolved ions of such elements as na+, K+, mg+, ca+, cl-, so4
2-, hco3- which can
be adsorbed by organic or inorganic colloidal particles (Kabata-pendias and mukherjee, 2007).
all established sources of dispersion of micro- and macroelements in the air or, on a larger scale, in the atmosphere, can be split in two to globally important sets: natural sources of elements and anthropogenic sources of elements. such environmental process-es as terrestrial, volcanic, meteoric outflows as well as soil erosion dusts spread by surface winds, forest fires or marine water aerosols are assessed as natural sources of elements, while anthropogenic sources of elements in atmosphere involve exhaustion of fumes from fuel and coal combustion, outflows from industry and agriculture. although, anthropo-genic influence on air composition is undoubted, also natural element input is estimated as noteworthy, e.g., more than 50 % of cr, mn and v and more than 20 % of cu, mo, ni, pb, sb, Zn in air comes from natural sources. volcanic outflows may contribute up to 20 % from as, cd, cr, cu, hg, ni, pb and sb in air, but wave influence in the world ocean may release about 10 % from total emissions of metallic elements in atmosphere (allen et al., 2001; Kabata-pendias and mukherjee, 2007).
typical element condition in the atmosphere is their connection with particulate mat-ter, except for hg which mostly appears in gaseous form. in the air micro- and macroele-ments are absorbed by particles of solid matter suspended in a gas or liquid with average size of 0.01-100 μm. particle size largely is liable for the element distribution on a global scale in the atmosphere – as particles are smaller as they may stay in the atmosphere for longer time, and they can be spread further from the point of source (Kabata-pendias and mukherjee, 2007). chemical composition of particulate matter and size of individual

25
particles plays significant role in potential impacts on human health as well as on over-all conditions in the environment and vegetation where they are deposited (allen et al., 2001). atmospheric aerosols, that are suspensions of liquid or solid particles in gas, also can have variable chemical composition due to their generation mode: direct inflows of particles in the atmosphere originate primary aerosols but transformation of inorgan-ic or organic gaseous substances in the atmosphere originate secondary aerosols; both types of them can be transported into troposphere and stratosphere for a long distances. investigation of the content of atmospheric aerosols discovers the highest concentration of elements close to ground level that verifies the assumption that the main sources of air pollution comes from the earth surface. concentration of almost all elements diminishes rapidly at altitude of 1 km, thereby indicating borders for vertical distribution of elements in the atmosphere (Braziewitzs et al., 2004).
however, elements dispersed in the air are exposed to the global circulation with the tendency to return to the earth surface ecosystems by depositing on the soil and vegetation. deposition of the atmosphere is the main pathway of metal circulation in the environment, even in areas with slight or none industrial activities (allen et al., 2001).
as geological structure, particularly, soil is the main source of minerals, it can be assessed that geographically local element availability for humans and animals is de-pendent on the element concentration available in soil for plants and released in water which is used for drinking and cooking that can influence geographical distribution of element excess or absence in nutrition. insufficient presence of elements in soils can occur due to naturally low mineral contents in soil (e.g., for i, se), inefficient element uptake by crops (e.g., in case of Zn deficiency in areas with calcareous soils), exces-sive element uptake by plants (e.g., for mo promoted by neutral-alkaline conditions in poorly drained soils) or excessive leaching of elements (e.g., for i, Zn). anyway, there are still recognized certain regions with element deficiency in nutrition for such ele-ments as B, cu, co f, fe, i, mo, mn, se, Zn (abrahams, 2002; combs, 2005). for sev-eral elements the risk areas worldwide are well recognized, e.g., mo enriched regions in are in armenia, but mo deficiency is detected in south africa that has influenced element concentration in locally cultivated crops such as maize, beans, pumpkins. But deficiency of Zn due to its limited uptake can be expected in areas with calcareous soils and leached arenaceous soils with naturally low Zn concentration (abrahams, 2002). north europe, including the territory of Latvia, is known as se deficient area while in several regions in china naturally excessive se concentration in soils and crops is discovered (navarro-alarcon and cabrera-vique, 2008; Zegnere and alsina, 2008). nowadays, along with the globalisation processes, in many societies food has not been derived (cultivated, bred, produced) at the habitation area, thus decreasing the regional or site-specific impact of element content on human nutrition.
The quality of human health, welfare and life in a great extent is dependent on the quality of food consumed daily as well as influenced by conditions of the surrounding environment. soil, water and air are the essential units of the unitary global ecosystem and are the basic matters of the life on the earth. chemical content of soil, water and air is not constant and varies widely due to the different global and regional factors, e.g., climate zone and seasonal conditions, geochemical background, hydrological cycles, pollution rate.

26
1.2.2. Agricultural impact on the concentration of elements in foodagroecosystem is the environment changed by human activities through the agri-
cultural practice. Widely applied soil fertilizers and ameliorants usually contain impu-rity of microelements and may affect concentration of elements in soil in a great extent. continuous use of these substances may lead to significant changes of soil chemical, physical and biological character that can be irreversible or reversible in long time period only. it is common that agriculture intensifies the weathering of soil that can result in the changes of the quantitative concentration of elements involved in mobile chemical forms that can intensify biogeochemical processes. This is assessed positively due to the increase of bioavailability of essential elements for crops; however, accumulation of potentially toxic elements also may occur (Карпова, 2005).
soil always has been estimated as a valuable resource for humans with one of its main function – food and feed producing and supply for living organisms. Therefore, it can be assessed that soil is also the main source of micro- and macroelements for plants, animals and humans and at the same time soil can be a transmitter of hazardous pollutants, i.e., toxic or possibly toxic elements (Kabata-pendias and mukherjee, 2007). nowadays, with the fast increase of the world’s population the serious future problems may arise in con-nection with over-exploitation of soil in agriculture that can result in exhaustion of soil resources. as soil is the main source of nutrient elements for plants subsequently used as human food or animal feed, the impact of agricultural practice on element content and concentration in food is of high concern.
elements that are basic microelements in agricultural and crop sciences are B, cu, co, i, mn, mo, and Zn (Карпова, 2005). in agricultural areas as well as in areas used for agriculture in the past, natural soil composition can be transformed by frequent applica-tions of fertilizers and other agrochemicals. Use of mineral fertilizers may lead to higher concentration of sr and f in soils, but application of organic fertilizers conveys significant amounts of as, cu, ni and Zn into the soils. phosphorous fertilizers are the ones that substantially may affect soil element concentration by input of such elements as as, cd, cr, f, ni, pb, sr and Zn (Карпова, 2005).
apart from the food chain contamination that may occur as a consequences of exces-sive transfer of metallic elements or metalloids from soils to edible plants, environmental effects such as extinction of vegetation cover induced by plant intoxication can also occur (Kabata-pendias, 2004; Кабата-Пендиас, 2005).
transfer of metallic elements and metalloids from use of agrochemicals, fertilizers and sewage sludge in agriculture can be detected. for example, fungicides containing cu applied in grape plantations may lead to wine contamination, use of some antifungal seed dressings may result in food contamination by organic hg, but lead arsenate used as insecticide in orchards can contaminate fruits and their products with as in high lev-els. sewage sludge can be applied as soil fertilizer, but in many cases they contain high concentration of cd, cu, fe, pb, Zn that can be transferred from soil to plants and food (reilly, 2007). application of fertilizers on agricultural soils is one of the main sources of nutrient element input in soils with subsequent transfer into biota. Long-term use of fertilizers should be deliberated due to prospective soil contamination with such element as as, cd and pb from phosphorous fertilizers (Jiao et al., 2012).
27
among mineral based fertilizers phosphorous fertilizers are the richest in microele-ments. potassium and nitrogen fertilizers contain low amounts of impurities – the highest amount is attributed to mn, but low concentration of ni and pb can be detected, while as, cd and co are in negligible concentration. phosphorous fertilizers contain significant amount of f and sr as well as may contain such elements as as, cd, cr, ni, pb, and Zn. microelement concentration in organic fertilizers varies widely, but it can influence input of as, cd, cu, mn, ni, pb (Карпова, 2005).
development of agriculture can increase the microelement concentration in grown food crops that is mainly attributed to cereal grains and edible seeds cultivated by dif-ferent approaches (Welch and Graham, 2005). The main of them are summarized in table 1.5.
Table 1.5Influence of agricultural approach on food composition
(after Welch and Graham, 2005)
approach objective effect on food composition
crop field selection
identification of soil type, element content and
concentration in soil, and element bioavailability
assessment
� increased uptake of essential elements (e.g., se, Zn) by food crops
agricultural practice
application of macronutrient fertilizers
� impact on levels of macroelements (e.g., ca, K, mg, na, n, p, s)
� input of potentially toxic elements (e.g., cd, hg, pb)
application method of micronutrient fertilizers
� impact on levels of microelements � effective for cl, i, Li, mo, ni, se, Zn � Limited effectiveness for B, cu, cr, fe, mn, v
diversity of cropping system � selection of micronutrient-dense varietiesUtilization of
micronutrient-rich food crops � microelement recycling
Genetic crop modification
� improvement of micronutrient concentration and bioavailability in food crops by breeding for increased levels of promoter substances
� improvement of micronutrient concentration and bioavailability in food crops by breeding for decreased levels of inhibitor substances
element variability differs in both, vertical and horizontal scaling and, as it was al-ready mentioned before, is influenced not only by natural soil geochemical circulation but also is seriously affected by other factors. soil fertilization, that is a common agricul-tural practice, may cause enrichment of soils with elements in excessive concentration that can reach exaggerated amounts of certain elements, e.g., from 700 to >10 000 mg/kg of al, 100-320 000 mg/kg of ca, <0.1-2.5 mg/kg of Ge and <0.1-4.3 mg/kg of se (reilly,

28
2007). however, some authors do not equitable the terms soil pollution and soil contam-ination and propose definition that soil contaminated with microelements may not be deemed as polluted soil unless a threshold concentration can be estimated that negatively affects biochemical and biological processes (Kabata-pendias and mukherjee, 2007).
significant inputs of elements in soils can be achieved with applications of alternative soil fertilizing compounds such as sewage sludge or fly ash. The use of fly ash in agricul-ture fields due its alkaline nature can decrease plant uptake of metallic elements such as cd, cu, cr, fe, mn and Zn. high concentration of such elements as ca, fe, K, mg na, Zn in fly ash composition may increase the yield of agricultural crops. however, tendency of unweathered fly ash to accumulate several elements (e.g., al, B, mo, se) may lead to plant toxicity; subsequent food contamination is recognized to occur and this is the reason of the limited use of fly ash in agriculture (Basu et al., 2009).
nowadays the problem of possible health hazards caused by consumption of con-taminated food plants has been recognized not only for agricultural production but also concerning allotment or community gardens. increasing urbanization constrains the for-mation of family gardens or domestic farms at sites that have been polluted by industry in the past or that are under the influence of daily urban contamination such as construc-tion dust or traffic exhaust (alexander et al., 2006; Wunderlich et al., 2011). vegetables and fruits grown in such conditions mostly are consumed long term by small groups of people and therefore potential health impacts still are not considered important within the communities.
1.2.3. Environmental pollution as a source of potentially toxic elements in foodThe main environmental pollution sources of trace inorganic pollutants are industry,
mining and smelting, brick, pipe, cement, ceramic, glass manufacture, chemical plants, power generation, combustion of fossil fuels and municipal wastes, nuclear reactions, ag-ricultural activities, transport and urban pollution. it has been estimated that the most hazardous elements for the biosphere are ag, au, cd, cr, cu, hg, pb, sb, tl and Zn, while among the least hazardous elements Ga, La, nb, sr, ta and Zr are ranked (Kabata-pendias and mukherjee, 2007).
however, pollution induced by industry, traffic or other anthropogenic activities recently is significant source of elements that revert to ecosystems. elements with nat-ural origination as well as elements from anthropogenic sources are circulating in the biosphere and are involved in biogeochemical cycles apart from the site of their origin (voutsa et al., 1996).
it is verified by experiments that dust outflows from industrial or urban areas influ-ence the concentration of chemical elements on foliage surface significantly. dust may contain high amounts of al, Ba, fe, mn and pb, revealing that accumulation of ele-ments is dependent on the intensity of traffic and the air quality in urban areas (simon et al., 2011). on the contrary, investigating roots of plants grown in an industrial area it was detected that most element concentration detected in vegetables was not above the admissible levels. Just some elements, such as cr, mn, pb and Zn appeared in high lev-els in vegetable leaves that was also verified by analysis of particulate matter. There are wide distinctions between the composition of vegetables, soil and air. The concentration

29
of elements in vegetable roots and vegetable leaves was found to be related solely to a soil or an atmospheric input of each element, except for cu and mn in roots that ap-peared to receive additive contributions from both sources. The best relationships were found between cd in vegetable roots and soil cd as well as between cd in vegetable leaves and atmospheric cd. highest accumulation due to atmospheric deposition was found for pb in lettuce, and for cr and cd in the leafy vegetables. root vegetables were found to accumulate soil cd much more efficiently than other microelements (voutsa et al., 1996).
such elements as as, Be, co, cr, cu, hg, mo, mn, ni, sb, se, v and Zn principally enter the atmosphere from fossil fuel combustion processes but largest worldwide emitter of as, cd, cu, ni and Zn is metallurgical industry. Gasoline and diesel that are the most popular fuels used by motor vehicles make regular emissions of cd, cu, fe, ni, pb and Zn into air in various amounts (allen et al., 2001).
Quantitative analysis of particulate matter can be used not only for the assessment of air pollution but also for estimation of the risks that may arise from possible element contamination for humans, animals and plants. There are several microelements, e.g., cd, hg, pb, that are toxic for living organisms even in very low concentration therefore par-ticulate matter containing traces of these elements can be hazardous within environmen-tal systems. it has been discovered that ultra small particles (<100 nm) has significantly higher value of toxicity than particles of larger size, and toxicological effects extends if particles are smaller (meresova et al., 2008).
dispersion of elements in the air has a seasonal fluctuation, for example, for such elements as al, ca, ti, mn, Ba and U, considered as originated from soil, seasonality can be observed if analyzing atmospheric particulate matter. it was detected that higher con-centration of these elements appears in spring and summer season that can be influenced by the vertical mixing of the troposphere when warmer layers of air are rising from the surface of earth inducing resuspension processes. on the contrary, elements disposed by coal combustion, such as as, se, v, cd, appear in the atmosphere in higher concentration during winter season (meresova et al., 2008).
food contamination is important issue within the assessment of food safety. several pollutants entering food chain via environmental pollution are found in food, for ex-ample, pesticides, organochlorine compounds such as polychlorinated biphenyls (pcBs), potentially toxic metals (e.g., as, cd, hg, pb) are among the most concerning compounds (Khan et al., 2008; Koplik et al., 2004; sharma et al., 2008; villalobos et al., 2009).
environmental pollution impact on the concentration of elements in food has been studied in industrial and urban areas where locally grown or breed food has obvious contact with potential contaminants. release of metallic elements and metalloids from outflows of manufactures and mining areas as well as transport exhausts, are well known sources of environmental pollutants.
in relation to environmental research, food analysis can be a useful tool for the po-tential environmental impact assessment. for example, there have been extensive studies conducted on industrial pollution that can be spread widely around the pollution source via air, water or soil. The impact of anthropogenic activities can result in an increased risk of allotment garden contamination, mainly by potentially toxic metals, such as pb, cd, cu, and by organic chemicals. The pollutants can easily enter the food chain, and animals

30
or humans can be exposed to potential impacts of contamination, e.g., by consumption of vegetables and fruits that are home-grown in allotment gardens close to roadsides or in urban areas (eggen et al., 2011; samsoe-petersen et al., 2002; Wunderlich et al., 2011).
f.-s. Zhang with colleagues (2001) has investigated the impact of applications of dif-ferent waste ashes on rare element concentration in agricultural soils. The study revealed that sewage sludge ashes and incinerator bottom ashes may lead to eu, sc and sm accu-mulation in soils with subsequent plant phytotoxicity.
industrial pollution is well known contamination source with potentially toxic met-als. The soils and waters in areas near industrial sites or ores are under the highest risk. several cases has shown food crop contamination with such elements as cd, pb, Zn from leaching wastewaters as well from use of wastewater in irrigation of agricultural fields. high levels of cd has been found in rice in Japan and in vegetables in UK, hg in tissues of domestic animals in Brazil, as in vegetables in Urals, in russia that have been grown near industrially active areas (reilly, 2007).
nowadays the problem of possible human health hazards by consumption of contam-inated food crops has been recognized not only for agricultural production but also con-cerning allotment or community gardens. increase of urbanization constrains the set up of family gardens at sites that have been polluted by industry in the past or those under the influence of daily urban contamination such as construction dust or traffic exhausts (alexander et al., 2006; Wunderlich et al., 2011).
1.2.4. Impact of food processing on element concentration in foodimpact of food processing on food quality and composition has been established con-
cerning several nutritional constituents as vitamins, antioxidants, proteins or in favour of organoleptic values such as taste, colour or smell (e.g., awuah et al., 2007; dewettinck et al., 2008; odriozola-serrano et al., 2013; pingret et al., 2013). however, impact of pro-cessing on the element content and concentration in food has been studied quite frag-mentary mainly due to the fact that assessment of processing is complicated issue affected by many factors. food is not homogeneous and therefore has to be brought under dif-ferent processing conditions that are specific for various product groups, starting from cutting and milling of vegetables and cereals up to cooking and fermentation of meat and milk products.
harvesting of food crops and processing of food of animal or plant origin can induce food contamination through contact with equipment or substances used. for example, fish and meat products can become exposed to painted or varnished surfaces. processing of food can be done in various ways, e.g., fermentation, sterilisation, drying, chemical preservation depending on the hygiene and processing requirements. The most common material of food contact surfaces is stainless steel; however, other contacting surface ma-terials can come into contact with food, such as acryl-based coatings on the walls, polyes-ter or epoxy-based powder coating products on metal substrates, epoxy or polyurethane coatings on the floors, polytetrafluoroethylene (ptfe) coated standard conveyor systems (forrest, 2009). transfer of metallic elements and metalloids from processing equipment during food and beverages canning (pb), from using cooking utensils (cu, pb) and ce-ramic ware (mainly pb) as well from plastics and other wrapping materials (cd, co, cr,

31
hg, pb) has been detected. even use of certain detergents in cleaning of food processing equipment may lead to leaching of as, cd, hg and pb from utensils made from stainless steel (reilly, 2007).
mineral content is inherent in natural foodstuffs. apart being an substantial part of many enzymes, micro- and macroelement presence play important role in food pro-cessing, for example, in fermentation producing alcoholic beverages, fermented dairy products and meat aging. processing as well may decrease element concentration in food and therefore food fortification with certain elements (e.g., ca, fe, mg, se) is practised frequently. compounds used as dietary supplements or food additives with antimicro-bial, sequestrant, antioxidant, flavour enhancing and leavening, texturizing, and buffer-ing properties contain metallic cations that can change natural element balance in food (Karley and White, 2009; nabrzyski, 2007).
K. dewettinck and colleagues (2008) has investigated the impact of processing on food nutrient content. it was found that production of bread during the grain transforma-tion processes involving milling, mixing, fermentation and temperature influence leads to loss of vitamins. however, use of different techniques of processing may result in decrease or increase of the levels of bioactive compounds as well as their bioavailability can be modified.
another study done by f. cheli with colleagues (2010) affirmed the influence of in-dustrial milling of cereals such as wheat on cd and pb distribution in derived milling fractions. distinctions were detected, for example, the fraction of cereals remaining for use in animal feed (shorts (middlings) and wheat-flour short) contained higher concen-tration of cd and pb, while fractions supposed for food production contained lower lev-els of these metals. it was also detected that debranning milling lead to significantly high-er levels of contaminants than application of conventional milling, especially, in derived wheat by-products.
also domestic food processing can influence element concentration in food. for ex-ample, milling of grains can reduce concentration of ca, fe, p and Zn, but fermentation of grain product increases bioavailability of ca, fe, p and Zn; cooking and storage over 6 months of fortified blended food reduces microelement concentration (callanan, 2000).
although historical facts confirm possibility of extremely high food pollution by pb in the past from ceramic kitchen ware with lead enamel, dishes from zinc containing high impurity of lead, also nowadays there still certain risks remain of possible food contami-nation with potentially toxic elements (Baltes, 1998).
1.2.5. Food contamination from storage and packaging materialsThe metals predominantly used in food packaging are aluminium and steel. al is used
to make cans, foil, for lamination of paper and plastics. mg or mn are often added to aluminium to improve its properties. al is highly resistant to most forms of corrosion, its natural coating of al oxide provides highly effective barrier to the effects of air, odours, temperature, light, moisture, microorganisms and chemical attack. another metal wide-ly used in food packaging materials is tinplate is produced from low-carbon steel coat-ed with thin layers of sn from both sides. depending on manufacturing process, there are hot-dipped tinplate and electrolytic tinplate. tin provides steel with some corrosion

32
resistance, but for more protection tinplate containers are often lacquered to provide inert barrier between metal and the food. commonly used lacquers are materials in the epoxy phenolic and oleoresinous groups and vinyl resins. also tin-free steel known as electro-lytic chromium or chrome oxide coated steel is used in food packaging materials (forrest, 2009; rial-otero et al., 2009).
food storage and packaging materials can influence not only food organoleptic and nutritional values but also may lead to food contamination if inappropriate materials are used and may lead to long term adverse health effects. for example, al and sn are widely used in cans for food storage as metals of low impact on human health. however, recent research studies suggest correlations between ingested al and alzheimer’s disease devel-opment. it is detected that despite high al resistance it can leach from the material of cans, cookware or other kitchen utensils to food (Joshi et al., 2003).
tin-lined cans used to package food constitute the most important contribution to tin transfer into human nutrition. organotin compounds exposure may occur by the inges-tion of seafood and contact with consumer products that contain organotin compounds. household commodities made from polyurethane, plastic polymers, and silicon contains butyltin concentration in ppm range. mono- and dimethyltin and mono- and dibutyltin compounds have been detected in drinking water where pvc polyvinyl chloride pipes are used in the distribution of drinking water (atsdr, s.a.).
apart from the use of metals, other traditionally used materials for food packaging are glass, wide variety of plastics and paper with different coatings. paper and paperboard are sheet materials made from an interlaced network of cellulose fibres derived from wood by using sulphate and sulphite with possible application of chemical bleaching. commonly used in corrugated boxes, milk cartons, folding cartons, bags and sacks and wrapping paper. packaging materials and systems for food storage contain many substances which can migrate to food during processing and storage. however, the major concern regard-ing safety of food-contact materials is that the effects of prolonged exposure in humans are still poorly known (rial-otero et al., 2009).
information of food packaging materials and possible leaching of elements is summa-rized in table 1.6.
1.3. Bioavailability of elements
Bioavailability is the amount of a nutrient that is potentially available for absorption from a matrix (e.g., from soil for crops or from food for humans) and when absorbed, utilizable for metabolic processes in the organism (Welch and Graham, 2005). total content of elements is value that can characterise certain matrix, e.g., soil, plant or pro-cessed food, in general. detailed information about the bioavailability of elements can be achieved if it is known in what chemical compounds they are involved. The investigation of element bioavailability is complicated interdisciplinary issue dependent on chemical, environmental, nutritional, physiological and epidemiological impacts that in many cases is still in the level of suggestions and assumptions even it has been investigated for dec-ades. This chapter discusses the most relevant viewpoints of element bioavailability in food chain soil-plant-human.

33
1.3.1. Element bioavailability in soil-plant systemmicroelements can be taken up by plants if they are present in the soil as soluble
ions in the forms of organic or inorganic complexes. in addition, not only concentra-tion of ions but also type and chemical character of complexes formed are important in case of plant ability to accumulate potentially toxic elements (inaba and takenaka, 2005). depending on plant capacity to transfer and accumulate elements in a higher or lower extent, a relative classification can be applied as follows: a) hyperaccumulators: plants that can accumulate high concentration of elements in their vegetative parts; b) accumulators: plants that tend to accumulate elements in their vegetative parts; c) indicators: plants that are able to take up elements and to reflect the ambient environmental content of these elements; d) excluders: plants that do not tend to take up and accumulate elements from contaminated environments (Gardea-torresdey et al., 2005; peralta-videa et al., 2009). however, such properties of plants are widely studied for phytoremediation purposes at contaminated sites with polluted soil but less has been attributed to the investigation of capacity of metals’ accumulation in food crops.
Bioavailability of elements for plants in a great extent is dependent not only on chem-ical properties of elements but also on soil composition and properties, among them ph, organic matter content can be mentioned.
Table 1.6Food packaging materials and possible element leaching into food (after conti, 2007; conti, 1997; forrest, 2009; rial-otero et al., 2009)
material properties leading to food contamination
elements of concern Use in contact with food
Glass
� Low risk of contamination only if raw material contain metals
� rare impact by food chemical character (e.g., ph)
pb, BBottles, jars mainly used for liquid food, kitchen
utensils, dishes
metals � corrosion � migration from coatings
al, cr, cu, fe, ni, sn, Zn
cans, laminates, metalizes films used for liquid food
and powdered food, kitchen utensils
plastics � migration of components
to food, especially due poor thermal stability
cd, pb
epoxy/phenolic resins, polypropylene,
polystyrole, polyethilene, polyvinilchloride etc. used
for miscellaneous food, kitchen utensils, disposable
dishes
paper
� very hygroscopic � poor barrier properties lead
to food contamination from environment
� not usable for liquid contact
cd, cr, pb
paper and paperboard boxes, wrappings used
predominantly for dry food and for short term storage
34
1.3.2. Bioavailability of elements from food to human organismmicro- and macroelements reaching human body can be absorbed by three pathways:
a) gastrointestinal tract – element absorption from food, water, food supplements, drugs, soil, particular matter, atmospheric aerosols; b) respiratory system – element absorp-tion from particular matter, atmospheric aerosols, gases; c) skin – element absorption from soil, water, atmospheric aerosols, gases, chemical substances (Kabata-pendias and mukherjee, 2007).
depending on the mechanism of intake, ingestion, inhalation or dermal absorption, elements must pass through a series of organs before entering the blood stream. ingested particles pass through the gastrointestinal tract, inhaled particles pass through the res-piratory system and dermally absorbed elements enter directly into the blood stream. The intake of an element also dictates how much the body will absorb, for example only 6 % of ingested cd is absorbed in contrast to 50 % of inhaled cd. it accumulates in adrenal pericarp possibly binding with proteins. elimination half-life period for cadmium is very long – 10 to 30 years, therefore contamination by high doses of cadmium can result in chronic intoxication (Baltes, 1998; Bowman et al., 2003). absorption of ingested metallic mercury is very minimal (about 0.01 %), while organic mercury is absorbed from gastro-intestinal tract up to 90 % of uptaken dose. absorption of inorganic mercury is medium, 7-15 % (Liguts, 2001). human body can absorb 5-10 % of uptaken amount of lead which is tended to accumulate in bone tissues and viscera. accumulation of lead for humans is very dangerous due to the possible release of element in human body (Baltes, 1998).
Low element concentration in environment (soil and water) is not the only one rea-son for element deficiency in human nutrition. important issue is the chemical form of element. for example, nowadays the Zn deficiency has been recognized in developing countries where local food contains Zn of low bioavailability. other element, such as fe, bioavailability can be affected by presence of phytate that is a plant substance and also by antagonist elements such as co, cu, Zn and mn. Bioavailability of Zn also can be reduced by antagonism with phytates, ca, cu, fe, ni and p (abrahams, 2002).
Bioavailability of elements is dependent on element chemical form, the composition of diet and health situation of the individuals. The data of concentration of micro- and macroelements in food can give important information about dietary habits of special group, health situation of individuals and origin of elements. Therefore, it is important to determine the daily dietary intake of microelements, their concentration and sourc-es. functions of microelements – as structural material, e.g., fe is part of haemoglobin, ca, p and other elements constitute a significant part of mass of teeth and bones, na, K, phosphate, sulphate, chloride – constituents of fluids inside and outside body cells. other function – regulation of biological activities – ca for normal blood clotting, mg stimu-lates activity of many enzymes etc. (aras and ataman, 2006).
determination of total content of elements in a matrix is a tool to assess the overall understanding about the element amounts but deeper investigation is needed for the as-sessment of bioavailability of elements. The investigation of bioavailability is a complex set of mutual factors; schematic overview of a model of the complexity of element bio-availability from food of plant origin is shown in figure 1.3.
The research of element bioavailability has been performed on staple food crops such as rice, wheat, maize, beans and cassava (Welch and Graham, 2005). it is too complicated

35
to do complex investigation of the bioavailability of various elements at the same time; therefore, the basic target is to understand the overall principles and to create example models. more deep studies of element bioavailability from food crops have been studied concerning ca and fe on an in vitro caco-2 cell model (viadel et al., 2006). This model has been adopted also for determination of Zn bioavailability from food crops using such protein as metallothionein (Welch and Graham, 2005).
Zn absorption is lower for vegetarians than for those eating non-vegetarian diet. Therefore, it has been suggested that the zinc requirement for vegetarians is approximate-ly 2-fold greater than for those consuming a non-vegetarian diet (iom, s.a.).
poor bioavailability is one of the reasons of dietary deficiency in humans. it can be attributed to such element as Zn and can be connected with phytate presence in food of plant origin such as unrefined cereals and legumes. it is also connected with mg and K salts. phytate tends to make strong chelated with metal ions, especially Zn, but also fe and ca and as a result insoluble complex compounds are derived that cannot be absorbed through gastro-intestinal tract of humans due to absence of intestinal phytate enzymes. high concentration of ca may lead to even more insoluble complex formation such as ca-Zn-phytate complex. Where Zn deficiency has been observed, also fe deficiency is common, because these metals have similar distribution in nutritional sources and their bioavailability can be affected similarly (abebe et al., 2007).
several metallic elements (e.g., ca, cu, fe, K, mg, mn, na, Zn) function in cationic forms that allow them to be involved in chelation processes in contact with proteins or small organic molecules. Besides insoluble chelates (with phytic acid or oxalic acid) that cannot be assimilated in human organism, there are several chelates that are of high im-portance in metabolism. here can be mentioned haemoglobin and myoglobin where fe is chelated. other chelates, such as amino acids, edta promote transportation, absorp-tion and storage of mineral ions (combs, 2005).
Figure 1.3. Model of the impacts on element bioavailability from food of plant origin (author’s work out, after Welch and Graham, 2005)
Bioavailable content of elements
Genetic selection and
production practices
Processing and
preparation
Other metal components
Individual specific factors
Total element content
Ingestion
Absorption
Utilization
UZTURSHUMAN NUTRITION
36
for such metallic element cations as cu2+ and Zn2+ enteric absorption is very im-portant. for mineral elements that tend to be highly absorbed (e.g., se, B), homeostasis is achieved by control at the level of excretion, i.e., through the urine, bile, sweat, and breath. in the case of iron, access to active forms is regulated by altering the storage of the element in an inactive form, e.g., ferritin (combs, 2005).
for several nutrients only a portion of the ingested amount is absorbed and utilized metabolically. Therefore, it is necessary to consider this when evaluating the nutritional adequacy of foods and diets. This concept, bioavailability, is particularly important in mineral nutrition, because some foods are less useful sources of essential minerals than might be expected from their absolute mineral content (combs, 2005).
micro- and macroelement bioavailability depends on both physiological and exoge-nous factors. physiological determinants of element bioavailability include: a) age-related declines in the efficiency of enteric absorption of cu and Zn; b) early postnatal lack of reg-ulation of absorption of cr, fe, Zn; c) adaptive increases in the absorptive efficiencies of cu, cr, fe mn and Zn by receptor upregulation during periods of deficiency; d) dependence on other nutrients for the physiological functions of se and i in thyroid hormone metabolism, and cu and fe in catecholamine metabolism; e) anabolic effects on tissue sequestration of Zn and se; f) catabolic effects on cr, se and Zn losses (atsdr, s.a.; combs, 2005).
The ability of human body to absorb and utilize certain micro- and macroelement from food depends on several factors: i) the form of the element in food, e.g., fe from meat (haem iron) can be more easily absorbed than fe contained in plant foods (non-haem iron); ii) other components of the nutrition, which either enhance or inhibit ele-ment absorption, e.g., the absorption of fe from plant foods is enhanced by eating food with high concentration of vitamin c like oranges or tomatoes, but inhibited by com-pounds such as tannin (present in tea) and phytate (present in cereals); iii) human health or specific diseases, i.e., several diseases adversely affect the ability of organism to absorb nutrients; e.g., persistent diarrhoea prohibits absorption of both micro- and macronutri-ents, including chemical elements; iv) food preparation or processing methods that can enhance the availability of micronutrients (callanan, 2000).
element bioavailability from oral intake and related factors for humans are summa-rized in appendix iv.
1.4. Recent studies in Latvia – micro- and macroelement analysis
The assessment of recent research studies of element concentration investigation in Latvia was based on the information available in the main international scientific data-bases Scopus, Science Direct, Springer Link and ISI Web of Knowledge for the time period 2000-2013.
element content in environmental and biological samples has been studied by G. Čekstere with colleagues who analysed chemical composition of riga street green-ery, particularly, leaves of lime trees and environmental impacts on element content (Čekstere, 2011; cekstere and osvalde, 2013; cekstere and osvalde, 2010a; cekstere and osvalde, 2010b; cekstere et al., 2008). air pollution and element content interactions in mosses in Latvia have been studied under the guidance of professor o. nikodemus and
37
G. tabors (nikodemus et al., 2004; tabors et al., 2004). finnish scientist r. salminen with colleagues (2011) also investigated element distribution in terrestrial mosses and organic soil layer in the eastern Baltic region. soil element content has been investigated in de-tails by a. Gilucis (2007) that is described in his doctoral thesis, but metal deposition in forest soils of Latvia and the influencing environmental factors has been studied by other scientists of Latvia (Brumelis et al., 2002; Kasparinskis and nikodemus, 2012).
another group of research widely studied involves the analysis of inland surface wa-ters with the aim to detect element and nutrient content (aldahan et al., 2006; Klavins et al., 2001; Klavins et al., 2000; Kokorite et al., 2010; stalnacke et al., 2003) and element content of lake sediment investigation (Klavins et al., 2011; Klavins and vircavs, 2001). But latest studies are tended to bog investigation (Klavins et al., 2009b; Klavins et al., 2003; silamikele et al., 2011). prof. m. Kļaviņš with colleagues (2009a) also has investigat-ed heavy metal content in fish from lakes in Latvia.
analytical approach of the analysis of elements by X-ray fluorescence techniques has been investigated under the supervision of professor a. vīksna (viksna et al., 2004; viksna et al., 2001), while p. sudmalis (2013) in his doctoral thesis was dealing with prob-lems connected with possibilities to detect persistent organic pollutants in environment and biological samples.
trace metal analysis in water samples from Gulf of riga and daugava river estuary have been done (pohl et al., 2006; poikane et al., 2005; yurkovskis, 2004; yurkovskis and poikane, 2008). The studies on metal pollution in environment also have been done in Latvia (Kulikova et al., 2003; muller-Karulis et al., 2003).
only few studies in Latvia are related to food composition investigations. The infor-mation can be found about the studies of nutrient composition of american cranberries in Latvia (osvalde and Karlsons, 2010) and potatoes (murniece et al., 2011). f. dimiņš (2006) in his doctoral thesis investigated composition of honey, including analysis of some element concentration.
some studies revealing food consumption specifics in Latvia have been done (melece, 2009; melece et al., 2008; pomerleau et al., 2001a; pomerleau et al., 2001b). however, in these studies only economic aspects were taken into account in the description of food consumption habits in Latvia. The studies of nutrition regarding health issues and inter-connection with environmental impacts have been done (Luse et al., 2000; muceniece et al., 2007; richardson et al., 2013), but these are specific investigations in the field of environmental and occupational medicine where biosamples such as human blood and hair were analyzed.
research in the field of agriculture in Latvia concerning food quality improvement are represented by some studies done by i. alsina with colleagues who have investigated se-lenium impact on yield quality of lettuce (alsina et al., 2012; Zegnere and alsina, 2008).
however, survey of recent studies in Latvia of analysis of micro- and macroelements revealed that there is lack of information about the analysis of the content and concen-tration of elements in food consumed and produced in Latvia. Therefore, the importance of current research is highly valuable within the interdisciplinary fields of environmental science, chemistry, food science and health sciences.

38
2. MAteRIALS AnD MetHoDS
There are two main targets of the current research: quantitative analysis of selected food available for consumers in Latvia and investigation of element bioavailability. With the aim to investigate the bioavailability of elements in food chain soil-plant-human five different soils were collected and subsequently contaminated with metallic elements. contaminated and control soil samples were used for experimental growth of selected food crop species. another main target of the research included collection of food sam-ples of different kind over all the territory of Latvia with the aim to perform the quan-titative analysis of micro- and macroelements. in this chapter the details of sampling, analytical methodology and data analysis are described.
2.1. Food sampling, sample preparation and pretreatment
2.1.1. Collection of food samplesLocally available food samples were collected over the territory of Latvia in the time
period 2009-2013. food for sampling was selected as follows: (i) unprocessed vegeta-ble products (apples, carrots, onions, potatoes) and processed vegetable products (cereal meals and cereal mixtures for porridge preparation); (ii) unprocessed animal products (bee products such as honey, pollen and bee bread; hen eggs) and processed animal prod-ucts (cottage cheese); (iii) unprocessed beverages (apple juice, birch sap) and processed beverages (apple wine). selection of food samples collected for analysis was based on the length of element transfer from the environment to foodstuff as well as possible impact of environmental conditions such as seasonality, agricultural praxis or processing were tak-en into account (aras and ataman, 2006). suggestions from similar studies (e.g., ekholm et al., 2007) and also the significance of the selected foodstuffs into common diet of in-habitants of nordic countries and Latvia (melece, 2009; melece et al., 2008) were taken into consideration as well. primary the food samples of local origin (grown, bred or pro-duced in Latvia) were collected; only within the group of cereal meals available samples were of different origin that was identified after the information on packaging indicated by the producer. special attention was attributed to the food labelled as organic (biologi-cal). in total more than 500 food samples were analysed within the research.
Sampling of food of plant origin. fresh samples of root vegetables, carrot roots, onion bulbs, potatoes and apple fruits were collected over the territory of Latvia in harvesting season of 2010. samples were obtained at markets or directly from farms and individual households. samples were confirmed as locally grown products at the purchase as well as it was clarified whereas the vegetables were grown in farmlands or allotment gardens. additionally to lettuce samples (ns=7)1 collected by purchasing them at the market or directly from the farms also lettuce samples (ns=3) experimentally grown in contami-nated soil were analysed. sampling was carried out by selecting 3-5 pieces of vegetables or fruits within every single sample subsequently making mixed samples. edible parts of
1 here and further ns – number of samples

39
vegetables (fruit flesh) were prepared for analysis as well as some peel samples were pre-pared. carrot roots, onion bulbs, potatoes and apple fruits were cleaned, washed, peeled and crushed. crushed samples were dried in drying oven at temperature 80-105 °c for 20 hours and at temperature 105 °c for extra 5-6 hours, if needed, depending on the moisture of sample type. amount of moisture content was calculated. after drying every sample was triturated until the consistence of powder. Until analysis samples were stored in closed disposable plastic bags in dry and dark place. at the development of analyti-cal procedures and pretreatment thoroughly suggestions from similar studies has been considered (aras and ataman, 2006; ekholm et al., 2007; Luykx and van ruth, 2008 mohamed et al., 2003; samsoe-petersen et al., 2002).
samples of cereal meals, i.e., cereal mixtures for porridge preparation were collected in spring of 2013 (ns=43) purchasing them at supermarkets in commercially available packaging. samples were of different origin that was identified after the information on packaging indicated by the producer cereal meals as selected products represent part of infant nutrition common in Latvia (melece et al., 2008; Zariņš un neimane, 2009). cereal meals were collected in 4 groups: mixed cereals, rice, wheat and buckwheat products, selecting at least 10 samples per group. Until analysis samples were stored in dry and dark place in disposable hermetically closed polyethylene bags.
Sampling of food of animal origin. The strategy for honey sampling was elaborated considering suggestions in other studies (dimiņš, 2006; Joudisius ir simoneliene, 2009; Lachman et al., 2007). Within a period of two seasons (2009 and 2010) honey samples (ns=80) were collected over the territory of Latvia. collected honey samples were grouped in sets based on the botanical origin. Botanical and also geographical origin of honey samples was identified taking into account the available information at the purchase. honey samples were derived directly from bee-keepers or at food shops and markets with identifiable sources. all the equipment used for honey sample collection and storage ex-cluded any metal tools. honey samples mostly were poured into plastic containers with tight plastic covers. if honey was obtained in glass vessels, the samples were taken from the middle of the vessel to avoid contamination. Until analysis all collected honey sam-ples were stored in a cool and dark place. for the comparison of element content within the bee products also pollen (ns=5) and bee bread (ns=5) samples were obtained in addi-tion to honey samples from the same places of origination. pollen and bee bread samples were stored in closed disposable plastic bags in dry and dark place.
The strategy for hen egg sampling was elaborated considering suggestions in other studies (Waegeneers et al., 2009a; Waegeneers et al., 2009b, Waheed et al., 1985). in total 33 hen egg samples were collected from different housing types of poultry farms in 2011-2012 over the territory of Latvia: from organic farms (ns=9) (organic farming was con-firmed by certificate), domestic farms (ns=15) and large-scale poultry farms (ns=9). hen egg samples were purchased at the markets or obtained directly at the farms. conditions of the hens’ breeding type were identified and recorded at the moment of sample pur-chasing. in addition, 24 hen egg samples (2 samples every month) were collected from april of 2011 to march of 2012 in a domestic courtyard farm at aizkraukle, Latvia, with known poultry breeding conditions. Within one sample 3-5 eggs were selected. egg sam-ples were kept in refrigerator (+4 °c) until delivery to the laboratory where sample prepa-ration was done. eggs were cleaned and egg yolk carefully was separated from albumen.

40
also whole egg samples (egg yolk and albumen mixtures) were prepared. to avoid possi-ble sample contamination no metal tools were used; egg sample preparation was done by using chemically stable plastic, polypropylene or glass equipment. all the samples were homogenized and were filled in disposable polyethylene bags, subsequently storing them frozen at -20 °c until sample pretreatment was applied directly prior analytical procedure.
The strategy for cottage cheese (in Latvian biezpiens) sampling was elaborated consid-ering suggestions in other studies (cashman, 2006; mendil, 2006). cottage cheese sam-ples (ns=27) were purchased from randomly selected individual dairy farms and super-markets in Latvia over two seasons (summer of 2009 and winter of 2010). all samples chosen were labelled as cottage cheese derived from whole milk, i.e., cottage cheese with content of fat not lower than 9 %. for the reason to evaluate the impact of environmental conditions on cottage cheese manufacturing, only products of local origin were obtained. all samples were packed into disposable plastic bags and stored frozen at temperature -20 °c. prior sample pretreatment cottage cheese samples were dried in drying oven at temperature 60 °c and subsequently triturated until the consistence of powder.
Sampling of beverages. The strategy for beverage sampling was elaborated consider-ing suggestions in other studies (farid and enani, 2010; magdas et al., 2012). Beverage samples of local origin derived in Latvia such as apple juice (ns=9), birch sap (ns=10) and apple wine (ns=5). Beverage samples were kept in closed polypropylene tubes in refrigera-tor (+4 °c) and were analysed immediately after delivering to the laboratory.
2.1.2. Pretreatment of food samples prior quantitative analysismineralization process is important step for sample pretreatment before analytical de-
termination can be performed. it should be applied not only for cleavage of organic ma-trix of biological samples but also helps to prevent analytical techniques from unwanted residues that can settle on the burner head and in spray chamber, and can affect spectral interferences that can result in inaccuracy of measurements (soceanu et al., 2007). sample pretreatment can be done by several methods such as dry ashing, wet ashing, wet diges-tion that may be forced by heat, microwave or ultrasound influence (alvarez et al., 2003). carbohydrates, proteins and fats are the main matrix components of food samples that can influence quantitative micro- and macroelement detection. Wet digestion of organic matter, is widely applied for samples of biological origin, including food (e.g., ekholm et al., 2007; soceanu et al., 2007).
Pretreatment of samples of plant origin. fruit and vegetables samples were wet digest-ed as follows: a) 0.5000±0.0020 g of dry sample were weighed on analytical balance in 100 mL glass beaker; b) 10 mL of concentrated hno3 and 5 mL of concentrated h2o2 (analyt-ically pure reagents) were added; c) after holding overnight sample solutions were digested by heating at 160 °c on heating block; d) after complete digestion and cooling sample solutions were filled up to 50 mL with ultra pure deionised water in polypropylene tubes.
cereal products were wet digested in microwave digestion system as follows (Lawgali, 2010): a) 0.4000±0.0020 g of dry sample were weighed on analytical balance in ptfe/tfm tube; b) 4 mL of concentrated hno3 and 4 mL of concentrated h2o2 (analytical-ly pure reagents) were added; c) after holding overnight sample solutions were digest-ed in microwave digestion system (10 min at t1=55 °c, 10 min at t2=75 °c, 30 min at
41
t3=95 °c, e=1500 W); d) after cooling sample solutions were filled up to 40 mL with ultra pure deionised water in polypropylene tubes.
samples of lettuce, radish and dill were mineralized by wet digestion as follows: a) 0.1000±0.0020 g of dry sample were weighed on analytical balance in 50 mL glass beaker; b) 5 mL of concentrated hno3 and 2 mL of concentrated h2o2 (analytically pure reagents) were added; c) after holding overnight, sample solutions were digested by heat-ing at 160 °c on a heating block; d) after complete digestion and cooling sample solutions were filled up to 10 mL with ultra pure deionised water in polypropylene tubes.
Pretreatment of samples of animal origin. for the assessment of differences between the pretreatment procedures one honey sample was treated in four different modes:
1) Wet digestion (after tuzen et al., 2007): 1.0000±0.0020 g of sample were weighed on analytical balance in 50 mL glass beaker; then 8 mL of concentrated hno3 and 4 mL of concentrated h2o2 were added. after holding overnight sample solution was digested by heating at 160°c on heating block until the evaporation of nitrous gases. after cooling, sample solution was quantitatively poured into the polypro-pylene tube and filled up to 20 mL with ultra pure deionised water.
2) dry ashing (after tuzen et al., 2007): 1.0000±0.0020 g of sample were weighed precisely on analytical balances into the porcelain melting pot. dry ashing was performed in the muffle furnace at the temperature 450 °c for 8 hours. ashes were dissolved in 5 mL 25 % hno3 by heating slightly on heating block. after cooling, solution was quantitatively poured into the polypropylene tube and filled up to 20 mL with ultra pure deionised water.
3) dissolution in deionised water under the influence of ultrasound (after Kropf et al., 2010): 1.0000±0.0020 g of sample were weighed on analytical balance in poly-propylene tube, 2 mL of gallium solution (10 mg/L) were added as an internal standard and warm deionised water was added up to 20 mL. sample solution was homogenised in the ultrasonic bath for 1 hour.
4) dissolution in deionised acidified water (after staniskiene ir kt., 2006): 0.5000±0.0020 g of sample were weighed on analytical balance in polypropylene tube and 50 mL of warmed-up deionised water was added. solution was homoge-nized on vibro-homogeniser and acidified by 0.2 mL of concentrated hno3.
pretreatment of pollen and bee bread samples was done as described above for honey wet digestion.
prior analysis frozen samples of cottage cheese were desiccated at 60 °c in drying for 12 hours in an oven and triturated subsequently. sample decomposition was done by wet digestion as follows: a) 0.1000±0.0020 g of sample were weighed on analytical balance in glass 50 mL beaker; b) 25 mL of concentrated hno3 and 5 mL of concentrated h2o2 (analytically pure reagents) were added; c) after holding overnight, sample solutions were digested by heating at 160 °c on heating block; d) after complete digestion and cooling sample solutions were filled up to 10 mL with deionised water in polypropylene tubes.
egg sample pretreatment procedure was performed taking into account the require-ments of the exploited analytical techniques (hoefler et al., 2006; Kubala-Kukus et al., 2004; szoboszlai et al., 2009). While total reflection X-ray (tXrf) spectrometry allows direct sample analysis, detection of elements in biological or environmental samples by atomic absorption spectrometry (aas) requires more complicated sample pretreatment. Therefore

42
egg samples were wet digested similarly as described in literature (e.g., Kilic et al., 2002): a) 3.0000±0.0020 g of frozen egg sample were weighed on analytical balance in 50 mL glass beaker and left to attain the ambient temperature; b) 20 mL of concentrated hno3 and 10 mL of concentrated h2o2 (analytically pure reagents) were added; c) after holding over-night, sample solutions were digested by heating at 160 °c on heating block; d) after com-plete digestion and cooling sample solutions were filled up to 50 mL with deionised water in polypropylene tubes. in case of sample solution analysis by tXrf spectrometry gallium solution (0.01 g/L) was added as internal standard immediately prior analysis.
Pretreatment of beverage samples. samples of beverages were analysed without pre-treatment procedure as well as after wet digestion that was applied as follows: a) 10 mL of sample was poured into 50 mL glass beaker; b) 8 mL of concentrated hno3 and 4 mL of concentrated h2o2 (analytically pure reagents) were added; c) after holding overnight, sample solutions were digested by heating at 160 °c on heating block; d) after complete digestion and cooling sample solutions were filled up to 20 mL with deionised water in polypropylene tubes. in case of sample solution analysis by tXrf spectrometry gallium solution (0.01 g/L) was added as internal standard immediately prior analysis.
2.2. experimental setup of element transfer study2.2.1. Soil sampling and the crop growth experiment
in spring of 2011 five soil samples (each 7-10 kg) were collected in Latvia, the south-west of vidzeme Upland (vecpiebalga region, taurene rural municipality, vicinity of Lode manor), considering their representativeness for soils in Latvia (Kārkliņš u.c., 2009; Kasparinskis, 2011; nikodemus, 2011). soil samples were collected from upper layer (h or ap horizon, depth 0-20 cm). at the beginning soil type and texture were identified in the field conditions as follows: 1 sample of fen peat soil and 4 samples of sod-podzolic soil (with higher or lower content of organic matter and clay content) (Kārkliņš u.c., 2009; nikodemus, 2011), but precise soil type was identified at the laboratory: s1 – fen peat soil; s2 – sod-podzolic soil / sandy loam; s3 – sod-podzolic soil / sand; s4 – sod-podzolic soil / loamy sand; s5 – sod-podzolic soil / sandy clay loam (fao, 2006; Kārkliņš u.c., 2009; regulation 804, 2005). other characteristic properties of soil samples were defined precise-ly in laboratory using standard methodology (fao, 2006; pansu and Gautheyrou, 2006).
Bioavailability of metallic elements and metalloids in food chain soil-plant-human is complicated process influenced by different factors including soil chemical and physical characteristics. Therefore, it is necessary to determine such soil characteristic param-eters as ph, content of organic matter or humic substances, cation exchange capacity (cec) or cation base saturation and granulometric composition or soil texture (salazar et al., 2012; Wang et al., 2004; Xu et al., 2013). prior the analysis soil samples were dried in drying oven at 40°c, subsequently crashed with rubber pestle, sieved using 2 mm sieve for mineral soils and 4 mm sieve for peat soil with subsequent homogenization.
Qualitative analysis of soils was done based on standard methods applied widely in soil science (fao, 2006; pansu and Gautheyrou, 2006):
� soil ph was detected in 1 m Kcl / h2o extract by using ph meter; � soil organic matter expressed as content of humic substances in soil samples was
detected by tiurin’s method;

43
� cation base saturation was detected in 0.1 m Bacl2 extract by atomic absorption spectrometry;
� soil type and texture was identified by wet-sieving method and using pipetting technique.
soil samples were divided into the equal subsamples (each 1-2 kg) by weighing on tech-nical balance. to model metal transfer from soil to plants, except for control samples, soil contamination was applied, treating soil subsamples with corresponding metal salt solutions:
a) soil monocontamination with copper was achieved by using copper sulphate pen-tahydrate cuso4×5h2o solution at certain target cu concentration (40, 70, 100, 130 and 200 mg/kg);
b) soil multielement contamination with the mixture of metallic elements was achieved by using such soluble salts of metals as cadmium acetate dihydrate cd(ch3coo)2×2h2o, copper sulphate pentahydrate cuso4×5h2o, lead (ii) nitrate pb(no3)2 and zinc sulphate heptahydrate Znso4×7h2o at certain target concentration of elements (6 mg/kg cd, 130 mg/kg cu, 750 mg/kg pb and 300 mg/kg Zn). The target concentration of elements was selected taking into account the regulation no 804 of 25 october 2005 issued by the cabinet of ministers of Latvia Requirements for quali-ty normative of top and bottom soils. These requirements provide the allowable metal-lic element concentration in soils depending on soil texture and category of pollutant, e.g., range of allowable concentration of elements in soils are 13-500 mg/kg for pb, 16-700 mg/kg for Zn, 4-150 mg/kg for cu and 0.08-10.00 mg/kg for cd (regulation 804, 2005). soil contamination target values were selected also considering metal concen-tration values found in contaminated soils in Latvia and elsewhere (Gilucis, 2007). soil contamination procedure was applied as described in literature, i.e., calculated amount of certain contaminant was diluted in water and sprayed over the soil piles followed by complete soil homogenization (mechanical mixing) (alexander et al., 2006; inaba and takenaka, 2005). in addition, the half of each portion of contaminated soils and also control soil samples were saturated with the solution of humic substances (3 g/kg). for this treatment peat humic substances, isolated from ombrotrophic bog peat with certain characteristics (c 54.35 %, h 2.36 %, n 1.26 %, mw 4 500 – 12 000 dal) were used. after the treatment with metal salt solutions the soil samples were incubated for 2 weeks to reach metal binding common for polluted soils as well as repeated homogenization was done before the filling of soils into the pots.
contaminated and control soil samples were used for experimental cultivation of selected food crop species. seeds of radish Raphanus sativus L. ‘saxa 2’, leafy lettuce Lactuca sativa L. ‘Grand rapids’ and dill Anethum graveolens L. ‘mammut’ were directly sown into the pots filled with soil. for every contamination of every soil and vegetable type there were four pots filled and in every pot 5 seeds of the crop were put. food crops used in this research were chosen due to the relatively rapid growth and moder-ate requirements for growth conditions as well as common their use in similar studies (alexander et al., 2006; Wang et al., 2004; Xu et al., 2013). crops were grown under the open-air conditions; however, when it was necessary the pots were covered with a plastic shed to protect them from the wind, heavy rainfall or excessive sunlight. The study was done during the summer season of 2011 in the central part of Latvia, in a field area at aizkraukle, Latvia.

44
2.2.2. Pretreatment of soil samplessoil samples used in the crop growth experiment were mineralized for quantitative
detection of metallic elements and metalloids. prior mineralization soil samples were sieved through 2 or 4 mm sieve and dried in drying oven for 120 min at 105 °c. to detect total element content in soil complete sample mineralization is required usually done by using aqua regis (hno3/hcl solution) (fao, 2006; Gilucis, 2007; pansu and Gautheyrou, 2006). Aqua regis containing strong acids is very corrosive and may negatively affect the analytical equipment. Therefore, sample mineralization was done by using concentrated hno3 as the results of measurements of element concentration by both methodologies are comparable (rudoviča, 2012). Thus soil sample pretreatment was done as follows: control soil samples and contaminated soil samples were weighed in glass 50 mL beakers on analytical balance (1.0000±0.0020 g or 0.5000±0.0020 g), and 25 or 15 mL of concen-trated hno3 and 5 or 3 mL of concentrated h2o2 (analytically pure reagents) were add-ed, respectively. after holding overnight, samples were heated on heating block at 160 °c until 10 or 5 mL of solution were left. additionally 15 or 10 mL of concentrated hno3 were added and heating was continued until the complete mineralization of samples. sample solutions were filtrated into polypropylene tubes and filled up to 50 or 25 mL with deionised ultra pure water, respectively.
2.2.3. Sampling of experimentally grown vegetablesafter the experimental cultivation of selected vegetables, samples of radish, leafy
lettuce and dills grown in different soil were obtained. since the growth of plants were affected by several factors, for instance, climate conditions, high concentration of metals in soil and unexpected presence of insects, it was not possible to collect all crop samples from all the pots; however, the failure to get grown plants was less than 10 %. crop samples which were evolved enough and not damaged were harvested 35-45 days after the sowing, taking into account the maturity of grown plant species. vegetables were carefully cleaned, rinsed thoroughly with deionised water and then edible parts of vegetables were separated for further analysis. samples were air dried (lettuce leaves, dills) or dried in drying oven at 40 °c (radish) and well crashed by us-ing ceramic knife as described in literature (Wang et al., 2006) to avoid contamination with metals. Until analysis samples were stored in closed disposable plastic bags in a dry and dark place.
2.2.4. Element speciation analysistransfer and bioavailability of elements in food chain soil-plant-human is strongly
dependent on element speciation. metallic elements and metalloids in environment can be found in form of hydrated ions, insoluble compounds such as carbonates, as well as can be bound with fe and mn oxides, organic complexes or other chemical compounds. speciation analysis developed by a. tessier in 1979 and modified by many other scientists (e.g., favas, 2013; malandrino et al., 2011; okoro et al., 2012) is used as the basis for the detection of element speciation in soils and sediments. Within the current research, speciation analysis of studied soil samples was performed. prior
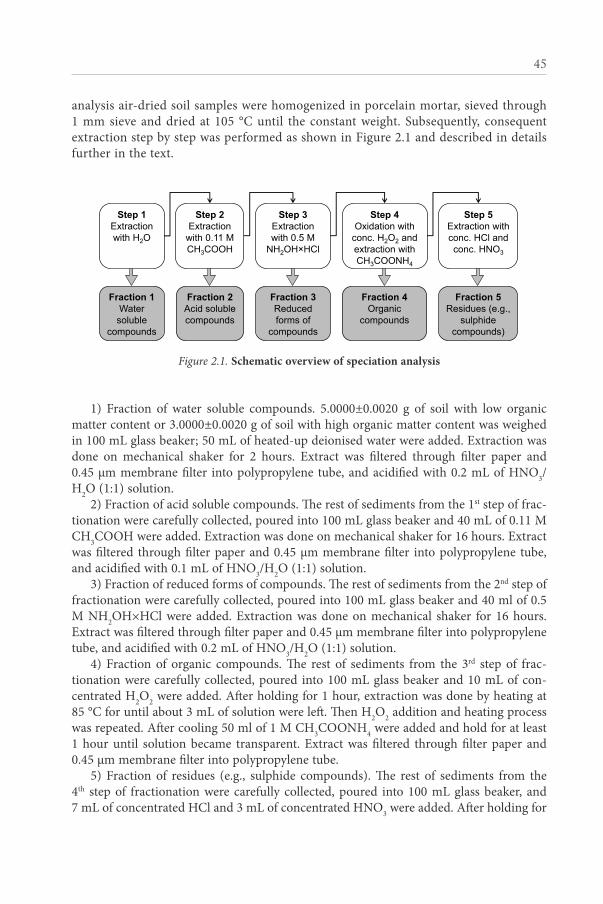
45
analysis air-dried soil samples were homogenized in porcelain mortar, sieved through 1 mm sieve and dried at 105 °c until the constant weight. subsequently, consequent extraction step by step was performed as shown in figure 2.1 and described in details further in the text.
Figure 2.1.
Step 1 Extraction with H2O
Step 2 Extraction
with 0.11 M CH3COOH
Step 3 Extraction with 0.5 M
NH2OH×HCl
Step 4 Oxidation with
conc. H2O2 and extraction with CH3COONH4
Step 5 Extraction with conc. HCl and conc. HNO3
Fraction 1 Water soluble
compounds
Fraction 2 Acid soluble compounds
Fraction 3 Reduced forms of
compounds
Fraction 4 Organic
compounds
Fraction 5 Residues (e.g.,
sulphide compounds)
ENG Kopsavilkumā - Figure 2.9.
LV Kopsavilkumā - Attēls 2.9.
1. solis Ekstrakcija
ar H2O
2. solis Ekstrakcija ar 0,11 M
CH3COOH
3. solis Ekstrakcija ar
0,5 M NH2OH×HCl
4. solis Oksidācija ar konc. H2O2 un ekstrakcija ar CH3COONH4
5. solis Ekstrakcija ar konc. HCl un konc. HNO3
1. frakcija Ūdenī
šķīstošie savienojumi
2. frakcija Skābē
šķīstošie savienojumi
3. frakcija Reducētie
savienojumi
4. frakcija Organiski
savienojumi
5. frakcija Atlikumi
(piem., sulfīdu savienojumi)
Figure 2.1. Schematic overview of speciation analysis
1) fraction of water soluble compounds. 5.0000±0.0020 g of soil with low organic matter content or 3.0000±0.0020 g of soil with high organic matter content was weighed in 100 mL glass beaker; 50 mL of heated-up deionised water were added. extraction was done on mechanical shaker for 2 hours. extract was filtered through filter paper and 0.45 µm membrane filter into polypropylene tube, and acidified with 0.2 mL of hno3/h2o (1:1) solution.
2) fraction of acid soluble compounds. The rest of sediments from the 1st step of frac-tionation were carefully collected, poured into 100 mL glass beaker and 40 mL of 0.11 m ch3cooh were added. extraction was done on mechanical shaker for 16 hours. extract was filtered through filter paper and 0.45 µm membrane filter into polypropylene tube, and acidified with 0.1 mL of hno3/h2o (1:1) solution.
3) fraction of reduced forms of compounds. The rest of sediments from the 2nd step of fractionation were carefully collected, poured into 100 mL glass beaker and 40 ml of 0.5 m nh2oh×hcl were added. extraction was done on mechanical shaker for 16 hours. extract was filtered through filter paper and 0.45 µm membrane filter into polypropylene tube, and acidified with 0.2 mL of hno3/h2o (1:1) solution.
4) fraction of organic compounds. The rest of sediments from the 3rd step of frac-tionation were carefully collected, poured into 100 mL glass beaker and 10 mL of con-centrated h2o2 were added. after holding for 1 hour, extraction was done by heating at 85 °c for until about 3 mL of solution were left. Then h2o2 addition and heating process was repeated. after cooling 50 ml of 1 m ch3coonh4 were added and hold for at least 1 hour until solution became transparent. extract was filtered through filter paper and 0.45 µm membrane filter into polypropylene tube.
5) fraction of residues (e.g., sulphide compounds). The rest of sediments from the 4th step of fractionation were carefully collected, poured into 100 mL glass beaker, and 7 mL of concentrated hcl and 3 mL of concentrated hno3 were added. after holding for

46
16 hours at room temperature, heating was started gradually and continued for 2 hours. cooled extract was filtered through filter paper into polypropylene tube. filter was rinsed with 0.5 m hno3 and filled up to 50 mL.
similar speciation analysis approach was applied for detection of element bioavailabil-ity from food crops (extraction was done for lettuce samples):
1) fraction of water soluble forms of metals. 0.5000±0.0020 g of lettuce sample were weighed in polypropylene tube; 20 mL of heated-up deionised water were added. extraction was done on mechanical shaker for 2 hours. extract was filtered through filter paper and 0.45 µm membrane filter into polypropylene tube, and acidified with 0.2 mL of hno3/h2o (1:1) solution.
2) fraction of acid soluble forms of metals. The rest of sediments from the 1st step of fractionation were carefully collected, poured into 100 mL glass beaker and 20 mL of 0.11 m ch3cooh were added. extraction was done on mechanical shaker for 16 hours. extract was filtered through filter paper and 0.45 µm membrane filter into polypropylene tube, and acidified with 0.1 mL of hno3/h2o (1:1) solution.
3) fraction of reduced forms of metals. The rest of sediments from the 2nd step of fractionation were carefully collected, poured into 100 mL glass beaker and 20 ml of 0.5 m nh2oh×hcl were added. extraction was done on mechanical shaker for 16 hours. extract was filtered through filter paper and 0.45 µm membrane filter into polypropylene tube, and acidified with 0.2 mL of hno3/h2o (1:1) solution.
2.3. Quantitative analysis of elements
2.3.1. Analytical methodsseveral approaches of contemporary analytical techniques can be used for element
quantification of miscellaneous biological and environmental samples, including food samples. The main demands for choice of analytical techniques are sensitivity and se-lectivity which can be achieved by such methods as atomic absorption spectrometry (aas), inductively coupled plasma mass spectrometry (icp-ms), atomic emission or optical spectrometry (icp-aes, icp-oes), total reflection X-ray fluorescence spectrom-etry (tXrf) or neutron activation analysis. aas based methods are widely applied for analysis of samples with different matrix properties, e.g., flame atomic absorption spec-trometry (faas) can be used for comparatively simple and fast quantitative detection of micro- and macroelements or atomic absorption spectrometry on graphite furnace (Gfaas) that is considered as highly sensitive and selective method (hashmi et al., 2007; Kazi et al., 2009; Kilic et al., 2002; Lante et al., 2006; samsoe-petersen et al., 2002; soceanu et al., 2007). icp-ms or inductively coupled plasma atomic emission spectro-metry (icp-aes) are among the highly sensitive techniques and can be used for detec-tion of quantitative concentration of microelements in trace amounts. icp-ms has many advantages, including high selectivity, wide linear range and relatively low limit of quan-tification. in order to use icp or aas methodologies, it is necessary to do sample miner-alization. however, this method is expensive and it can be applied for analysis of sample solution with certain properties such as acidity. By icp-ms techniques it is preferable to

47
detect elements in acidic media (ekholm et al., 2007; Gonzalvez et al., 2008; nisianakis et al., 2009; samsoe-petersen et al., 2002).
total reflection X-ray fluorescence spectrometry (tXrf) is a relatively simple and cheap method for element quantification due to the possibility to analyse samples di-rectly without complicated digestion procedure but only with addition of internal stand-ard (alvarez et al., 2003; hoefler et al., 2006; Klockenkamper, 1997). tXrf spectrometry is a well-suited analytical technique for the studies of several micro- and macroelement concentration. The organic material has to be mixed with an internal standard, and method allows fast and accurate analysis of all microelements heavier than aluminium (Kubala-Kukus et al., 2004). tXrf spectrometry has several advantages: it is a rapid and non-destructive method and shows good sensitivity when analyzing organic samples. The sample can be measured directly, just diluted with deionised water, and therefore pos-sible sample contamination at sample pretreatment can be avoided (Golob et al., 2005). The X-ray fluorescence spectrometry is a widely used multi-element analytical technique due to its simple application and it plays an important role in environmental monitoring (szoboszlai et al., 2009).
in the current study aas was applied for macroelement (ca, fe, K, mg, na) and some microelement (cu, mn, Zn) quantification. depending on element to be detected, sample solutions were analysed by flame atomic absorption spectrometry (faas), elec-tro-thermal atomic absorption spectrometry (etaas) or flame atomic emission spec-trometry (faes) depending on element. content of K and na was detected by faes; content of ca, mg, fe, mn, cu and Zn – by faas, but content of co and cr was detected by etaas. measurements were done by atomic absorption spectrometer AANALYST 200 (perkin elmer).
icp-ms was applied for analysis of sample solutions as more sensitive method for quantitative detection of microelements (ag, as, Ba, cd, co, cr, ni, pb, rb, se, sr, v) in trace amounts. inductively coupled plasma mass spectrometer ELAN DRC-e (perkin elmer) was exploited.
aas and icp-ms were applied for the quantitative analysis of mineralized food and soil samples, as well as for acidified honey solutions.
tXrf was applied for analysis of beverages and egg samples. The range of elements (Ba, ca, cu, fe, K, mn, ni, p, pb, rb, s, se, sr, v and Zn) were quantitatively detected by using total reflection X-ray fluorescence spectrometer Röntec PicoTAX (röntec Gmbh) equipped with X-ray tube (50 kv; mo anode), ni/c reflector (17.5 kev; level of reflec-tion 80 %), Be detector (area 10 mm2; thickness 7.5 μm), and applied exposition time 1000 seconds. The main limitations for use of wide range of analytical techniques are mostly connected with relatively high expenses.
2.3.2. Quality assurance of analytical methodsQuality assurance of applied analytical methods was achieved by preparation of blank
samples and analysis of certified reference material samples. subtraction of blank sample signal resulted in elimination of background corrections of measurements, as well as lim-it of detection, level of quantification and standard deviation were determined by using blank samples. Blank samples were prepared for every sample batch in the same mode

48
as food or soil samples. furthermore, each sample solution was made in triplicate, but certified reference sample solutions were made in fivefold. mean characteristic values for metal detection with aas are summarized in table 2.1. detection of such element as as, cd, cr and pb quantity by aas was limited due to the technical capability of apparatus; therefore the measurements done by icp-ms were taken into account for further data statistical analysis.
Table 2.1Characteristic values for quantitative metal detection by atomic absorption spectrometer
AANALYST 200 (Perkin elmer)
element Limit of detection, mg/kg Level of quantification, mg/kgca 6.65 21.94cd 0.01 0.04cu 0.15 0.50fe 0.41 1.35K 14.22 46.94
mg 3.49 11.55mn 0.51 1.67na 3.29 10.84pb 0.18 0.59Zn 0.32 1.06
performance of the applied analytical methods was verified by comparative analysis of certified reference samples. such reference materials were used as CS-CR-2 Carrot root powder, NCS ZC73017 Apple powder, IAEA-336 Lichen, BCR-063R Skim milk powder and PT Red wine Chilian. certified values of element concentration of reference materials are summarized in tables 2.2., 2.3., 2.4. and 2.5.
Table 2.2Certified values and uncertainty of element concentration of reference material
BCR-063R Skim milk powder (IRMM)
element concentration (x̄±s)1, mg/kg element concentration (x̄±s),
mg/kgca 13490±100 mg 1263±24cl 9940±300 n 62300±800cu 0.602±0.019 na 4370±31fe 2.32±0.23 p 11100±130i 0.81±0.05 pb 18.5±2.7K 17680±190 Zn 49.0±0.6
1 here and further x̄ – mean value, s – standard deviation
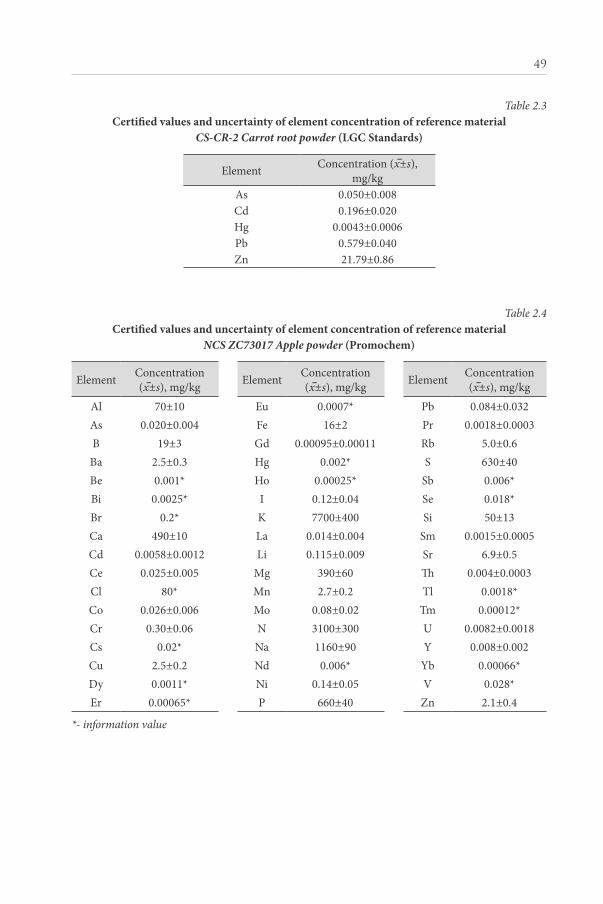
49
Table 2.3Certified values and uncertainty of element concentration of reference material
CS-CR-2 Carrot root powder (LGC Standards)
element concentration (x̄±s),mg/kg
as 0.050±0.008cd 0.196±0.020hg 0.0043±0.0006pb 0.579±0.040Zn 21.79±0.86
Table 2.4 Certified values and uncertainty of element concentration of reference material
NCS ZC73017 Apple powder (Promochem)
element concentration (x̄±s), mg/kg element concentration
(x̄±s), mg/kg element concentration (x̄±s), mg/kg
al 70±10 eu 0.0007* pb 0.084±0.032as 0.020±0.004 fe 16±2 pr 0.0018±0.0003B 19±3 Gd 0.00095±0.00011 rb 5.0±0.6Ba 2.5±0.3 hg 0.002* s 630±40Be 0.001* ho 0.00025* sb 0.006*Bi 0.0025* i 0.12±0.04 se 0.018*Br 0.2* K 7700±400 si 50±13ca 490±10 La 0.014±0.004 sm 0.0015±0.0005cd 0.0058±0.0012 Li 0.115±0.009 sr 6.9±0.5ce 0.025±0.005 mg 390±60 Th 0.004±0.0003cl 80* mn 2.7±0.2 tl 0.0018*co 0.026±0.006 mo 0.08±0.02 tm 0.00012*cr 0.30±0.06 n 3100±300 U 0.0082±0.0018cs 0.02* na 1160±90 y 0.008±0.002cu 2.5±0.2 nd 0.006* yb 0.00066*dy 0.0011* ni 0.14±0.05 v 0.028*er 0.00065* p 660±40 Zn 2.1±0.4
*- information value

50
Table 2.5Certified values and uncertainty of element concentration of reference material
IAEA-336 Lichen (IAeA)
element concentration (x̄±s), mg/kg element concentration
(x̄±s), mg/kg element concentration (x̄±s), mg/kg
al 680±110 eu 0.023±0.004 rb 1.76±0.22as 0.63±0.08 fe 430±50 sb 0.073±0.010Ba 6.4±1.1 hg 0.20±0.04 sc 0.17±0.02Br 12.9±1.7 K 1840±200 se 9.22±0.04cd 0.117±0.017 La 0.66±0.10 sm 0.106±0.014ce 1.28±0.17 Lu 0.0066±0.0024 sr 9.3±1.9cl 1900±300 mn 63±7 tb 0.014±0.002co 0.29±0.05 na 320±40 Th 0.14±0.02cr 1.06±0.17 nd 0.60±0.18 yb 0.037±0.012cs 0.110±0.013 p 610±120 v 1.47±0.22cu 3.6±0.5 pb 4.9±0.6 Zn 30.4±3.4
2.4. Reagents and laboratory equipment
Reagents used within the research: � concentrated analytically pure nitric acid (65 % w/v, suprapur grade, scharlau, penta
or merck). � concentrated analytically pure hydrogen peroxide (30 % w/v, suprapur grade, merck). � deionised distilled water (<0.1 μs/cm, 18 mΩ/cm, millipore elix-3, millipore co). � certified reference material samples: CS-CR-2 Carrot root powder (LGc standards);
NCS ZC73017 Apple powder (promochem); BCR-063R Skim milk powder (irmm); IAEA-336 Lichen (iaea); PT Red wine Chilian (LGc standards).
� standard solutions for element detection with icp-ms: in 1 % hno3 (perkinelmer); in 2 % hno3 (high-purity standards); in 3 % hno3 (inorganic ventures); in 7 % hno3 (inorganic ventures).
� other reagents: hydrochloric acid; orthophosphoric acid; acetic acid; gallium solution (1 g/L Ga in 2 % hno3); potassium chloride; barium chloride; sodium hydroxide; potassium dichromate; ammonium ferrous sulphate; hydroxylamine hydrochloride; copper sulphate pentahydrate; cadmium acetate dihydrate; lead (ii) nitrate; zinc sul-phate heptahydrate; diphenylamine; silicone solution in isopropanole; solution of hu-mic substances (30 g/L).all used chemicals were of analytical grade or higher, provided for analysis of ele-
ments in trace levels.
Laboratory equipment exploited within the research: � inductively coupled plasma mass spectrometer ELAN DRC-e (perkin elmer): � atomic absorption spectrometer AANALYST 200 (perkin elmer). � total reflection X-ray fluorescence spectrometer Röntec PicoTAX (röntec Gmbh). � Water deionisator Millipore Elix 3 (millipore).
51
� microwave digestion system ETHOS One (milestone). � heating block Thermoblock (Biosan). � drying oven Plus II Oven (Labassco). � muffle furnace (tmax=1100 °c; omron). � analytical balance aLJ 220-4 (mmax=220 g, d=0.1 mg; Kern). � technical balance (Kern). � vibro-homogeniser (Labassco). � mechanical shaker Tachometer (RPM) PSU-20 (Biosan). � vacuum liophyliser FreeZone (Labconco). � Ultrasonic bath (70 W, 42 hz; cole-parmer). � ph meter ph 213 (hanna). � other laboratory equipment: membrane filters (0.45 µm); filter paper; glass, porcelain
and polypropylene laboratory vessels such as beakers, flasks, cylinders, funnels and tubes; ptfe/tfm (polytetrafluoroethylene/tfm) tubes for microwave digestion; glass petri plates; porcelain melting pots; porcelain mortar; glass pipettes; mechanical pipettes and mi-cropipettes with disposable polypropylene thimbles; sieves of different size; ceramic knife.for microelement analysis it is important to avoid any contact of samples with any
contaminants, particularly metals. Therefore cutting, peeling and crushing of samples were done by using ceramic knife and ceramic mill but sample solutions were kept in polypropylene tubes. only heating was performed in chemically persistent glass beakers.
Preparation of laboratory vessels. Quantitative analysis requires use of ultra clean vessels. preparation of laboratory vessels was done as follows: 1) washing in hot water with use of detergent; 2) rinsing with a tap water; 3) demineralisation of vessels with concentrated hno3 holding for 20 minutes (or holding overnight, if 0.1 n hno3 were used); 4) accurate rinsing with tap water (not less than 4-5 times); 5) drying at room temperature avoiding contact with airborne particles; 6) clean and dry vessels were kept in hermetically closed disposable polyethylene bags.
all analysis were performed in the laboratories of the department of environmental science and the department of analytical chemistry of the University of Latvia.
2.5. Data statistical analysis
statistical analysis of micro- and macroelement concentration analytical data was per-formed by using extended ms excel data analysis tool Qi macros (Qi macros, 2013). for every data set the range of statistical parameters were calculated (e.g., standard deviation, mean, median, correlation, t-tests etc.). if applicable, pearson correlation was applied as follows: r<0.5 – slight correlation, 0.5<r<0.8 – medium correlation, r>0.8 – strong cor-relation. for the comparison of data sets student’s tests were performed (t-test: two-sample assuming equal variance; t-test: two sample assuming Unequal variances) as well as other tests were performed of necessity.
in some cases box-whisker plotting was chosen as appropriate descriptive statistical ap-proach for the comparative assessment of element measurement data sets. This approach of data analysis allows easy determination not only of the routine statistical values within the data range but also allows detection of outliers. Box-plots show maximum, minimum and mean values of certain data sets as well as range between 25th and 75th percentiles.
52
3. ReSULtS AnD DISCUSSIon
3.1. Assessment of the performance of analytical methods
3.1.1. Verification of analytical methods by analysis of certified reference samplessamples of certified reference materials such as BCR-063R Skim milk powder, CS-CR-2
Carrot root powder, NCS ZC73017 Apple powder, IAEA-336 Lichen and PT Red wine Chilian were used for verification of applied analytical methods (tXrf, aas/aes and icp-ms).
While carrot root reference sample has been designed for measurements of five ele-ments only, the analysis of apple reference sample supported characterization of accuracy and precision of measurements for more than fifteen elements. obtained data revealed methodological distinctions, e.g., performance in respect to accuracy of measurements by tXrf was in range 65-105 %, aas 36-101 % and icp-ms 79-117 % (table 3.1). technical characteristics of used equipment did not allow equal detection of elements, for example, it was not possible to quantify concentration of cd, co, mg, na and pb by tXrf, but quantification of such elements as ca, fe, K, mg, na and p was not possible by icp-ms due to technical capability of exploited analytical equipment. in general, the highest accuracy and concentration compatibility with certified values were observed for measurements done by icp-ms.
Table 3.1 Accuracy of applied analytical methods (tXRF, AAS and ICP-MS) detected by the analysis of
certified reference sample NCS ZC73017 Apple powder
elementcertified value
of concentration (x̄±s), mg/kg
concentration (x̄±s; nm=5)1 detected by corresponding analytical technique, mg/kg (accuracy, %)
tXrf aas icp-msca 490±10 316±9 (65) 480±44 (91) -cd 0.0058±0.0012 - <0.0100 (-) 0.0051±0.0002 (88)co 0.026±0.006 - 0.020±0.010 (94) 0.023±0.001 (89)cr 0.30±0.06 <0.76 (-) 0.11±0.02 (36) 0.35±0.03 (117)cu 2.50±0.20 2.41±0.15 (96) 2.35±0.24 (94) 2.46±0.10 (98)fe 16.0±2.0 14.0±0.5 (88) 9.1±0.6 (57) -K 7700±400 5806±173 (75) 7578±49 (98) -
mg 390±60 - 322±2 (83) -mn 2.70±0.20 2.54±0.43 (94) 2.60±0.25 (96) 2.65±0.07 (98)na 1160±90 - 1173±44 (101) -ni 0.14±0.05 <0.25 (-) <0.40 (-) 0.11±0.02 (79)p 660±40 518±57 (79) - -
pb 0.084±0.032 - 0.054±0.011 (64) 0.081±0.037 (96)rb 5.00±0.60 4.84±0.18 (97) - 4.96±0.10 (99)sr 6.90±0.50 7.26±0.37 (105) - 7.04±0.05 (102)Zn 2.10±0.40 2.04±0.12 (98) 2.08±0.05 (99) 1.97±0.08 (94)
1 here and further nm – number of measurements

53
analysis of lichen reference sample revealed similar values of accuracy and addition-ally there were quantified such elements as as, Ba, se and v (table 3.2).
Table 3.2 Accuracy of applied analytical methods (tXRF, AAS and ICP-MS) detected by the analysis of
certified reference sample IAEA-336 Lichen
element certified value (x̄±s), mg/kg
concentration (x̄±s; nm=5) detected by corresponding analytical technique, mg/kg (accuracy, %)
tXrf aas icp-msas 0.63±0.08 0.72±0.15 (115) - 0.62±0.13 (98)Ba 6.4±1.1 5.31±1.15 (83) - -cd 0.117±0.017 - 0.112±0.003 (94) 0.115±0.002 (98)co 0.290±0.050 - 0.201±0.002 (69) 0.253±0.011 (87)cr 1.06±0.17 <0.76 (-) 0.42±0.01 (40) 0.98±0.03 (93)cu 3.60±0.50 2.85±0.14 (79) 3.05±0.03 (85) 3.22±0.41 (90)fe 430±50 278±31 (65) 342±8 (80) -K 1840±200 1184±31 (64) 1544±57 (84) -
mn 63.0±7.0 52.9±0.8 (82) 56.98±0.52 (91) -na 320±40 - 317±21 (99) -p 610±120 668±39 (113) - -
pb 4.90±0.60 3.13±0.26 (64) 4.30±0.07 (88) 4.67±0.07 (95)se 9.22±0.04 <0.16 (-) - 8.42±0.16 (91)sr 9.30±1.90 7.76±0.24 (83) - 8.93±0.98 (96)v 1.47±0.22 1.42±0.16 (97) - 1.45±0.31 (99)
Zn 30.4±3.4 26.3±0.3 (87) 28.1±0.2 (92) 28.76±2.45 (95)
By analysis of skim milk powder reference sample it was possible to detect accuracy and precision for such elements as ca, fe, K, mg, na and Zn (table 3.3). Wider range of data measurements was observed for tXrf (61-103 %) depending on certain ele-ment, but aas performance (92-104 %) is quite comparable with icp-ms measurements (88-98 %).
The main requirements for application of analytical methods include their sensitivity, selectivity and a high level of reliability. in case of analysis of food and beverage samples the most important limiting factor is the level of Lod (limit of detection) because several elements of interest (e.g., cd, co, cr, ni, pb) in samples commonly are present in very low concentration, i.e., below the limit of detection (aras and ataman, 2006).
according to known certified values, analysis of red wine reference sample al-lowed to detect accuracy and precision of measurements only for two elements, cu and fe. element content in red wine sample was analysed by tXrf with and without sample pretreatment, while analysis by aas was applicable only for mineralized sam-ples. measured concentration of elements was in acceptable compliance with certified values (table 3.4).
54
Table 3.3 Accuracy of applied analytical methods (tXRF, AAS and ICP-MS) detected by the analysis of
certified reference sample BCR-063R Skim milk powder
element certified value (x̄±s), mg/kg
concentration (x̄±s; nm=5) detected by corresponding analytical technique, mg/kg (accuracy, %)
tXrf aas icp-msca 13490±100 8165±345 (61) 13350±250 (92) 13328±350 (98)fe 2.32±0.23 2.40±1.51 (103) 2.39±0.23 (103) 2.14±0.32 (92)K 17680±190 13590±585 (77) 18400±220 (104) 16500±260 (93)
mg 1263±24 - 1255±53 (99) 1170±65 (92)na 4370±31 - 4390±45 (100) 3870±200 (88)Zn 49.0±0.6 34.6±11.3 (71) 48.1±2.2 (98) 46.2±3.1 (93)
Table 3.4 Accuracy of applied analytical methods (tXRF and AAS) detected by the analysis of certified
reference sample PT Red wine Chilian, analysing directly or after mineralization
element certified value (x̄±s), mg/kg
concentration (x̄±s; nm=5) detected by tXrf, mg/kg (accuracy, %)
concentration (x̄±s; nm=5) detected
by aas after mineralization,
mg/kg (recovery, %)direct analysis analysis after
mineralization
cu 0.12±0.06 0.08±0.01 (68) 0.11±0.02 (88) 0.083±0.006 (69)fe 3.38±0.33 3.24±0.15 (96) 3.64±0.06 (108) 3.43±0.02 (101)
measurement of elements of low L lines (na and mg) by tXrf is problematic because signal of fluorescence is absorbed before it can be registered on spectra. technical spec-ifications of tXrf do not allow reliable measurements of cd due to the parallel overlap of low energy Lα-lines with Kα-lines of mo, ca and K. also precise na detection is dif-ficult as Kα-lines of na may overlap with Lα-lines of Br and Zn. if co concentration in analysed sample is low, but fe concentration is high, it might influence accuracy of co detection (Gruber et al., 2006; Klockenkamper, 1997; stosnach and Gross, s.a.). however, many aspects of tXrf application (possibility to measure liquid samples without pre-treatment) supports application of this method. in addition, although common methods such as aas and icp-ms have proved high sensitivity, the disadvantages of these meth-ods involve time-consuming sample pretreatment steps with use of hazardous chemicals such as strong acids as well as high costs of exploitation of analytical equipment; there-fore, tXrf can be assessed as eligible methodology for express analysis of environmental and biological samples.

55
3.1.2. Comparison of food sample analysis done by different analytical techniques
apart from the analysis of certified reference samples, quality assessment of applied quantitative methodologies can be carried out with comparison of food sample analysis done by different methods. for example, analysis of a randomly selected cottage cheese sample revealed quite good compatibility between values obtained by aas and tXrf (figure 3.1).
Figure 3.1.
0
500
1000
1500
2000
2500
3000
3500
4000
K Ca
Con
cent
ratio
n (K
, Ca)
, mg/
kg
0
5
10
15
20
25
30
Zn Fe Mn Cu
Con
cent
ratio
n (Z
n, F
e, M
n, C
u), m
g/kg
Measured by AAS Measured by TXRF
K Ca Zn Fe Mn Cu Element
Figure 3.1.
0
500
1000
1500
2000
2500
3000
3500
4000
K Ca
Con
cent
ratio
n (K
, Ca)
, mg/
kg
0
5
10
15
20
25
30
Zn Fe Mn Cu
Con
cent
ratio
n (Z
n, F
e, M
n, C
u), m
g/kg
Measured by AAS Measured by TXRF
K Ca Zn Fe Mn Cu Element
Figure 3.1. Compatibility between measurements (x–±s; nm=5) of element concentration done by AAS and tXRF for a randomly selected cottage cheese sample
analysis of fifteen randomly selected hen egg samples by aas and tXrf revealed higher compatibility between measurements for macroelements, e.g., K and ca, while greater deviation between the measurements were observed for microelements, e.g., Zn (figure 3.2).
Figure 3.2.
1
10
100
1000
10000
1 2 4 5 6 8 9 10 11 13 16 18 19 22 23
Con
cent
ratio
n, m
g/kg
Number of sample
Zn-AAS
Zn-TXRF
K Ca
Zn
Measured by AAS Measured by TXRF
K
Ca
Zn
Figure 3.2. Compatibility between measurements (x–; nm=3) of K, Ca and Zn concentration done by AAS and tXRF for randomly selected hen egg samples (ns=15)
56
it was possible to compare obtained measurement data for solid consistency food samples and for liquid consistency samples. measurements obtained from analysis of samples with solid consistency (honey, pollen, bee bread) by aas/aes and tXrf re-vealed strong correlation for several elements. for instance, according to pearson cor-relation coefficients, strong correlation between the applied methods can be attributed to such elements as ca, cu, fe, K, mn and Zn (figure 3.3). Thus there are no many differences in the reliability of the applied analytical approach and the application quality yields rather good results.
Figure 3.3.
R² = 0.932
0
500
1000
1500
2000
2500
3000
0 1000 2000 3000
Con
cent
ratio
n by
TX
RF,
mg/
kg
Concentration by FAAS, mg/kg
R² = 0.976
0
1000
2000
3000
4000
5000
6000
7000
8000
9000
0 1000 2000 3000 4000 5000 6000 7000 8000 9000
Con
cent
ratio
n by
TX
RF,
mg/
kg
Concentration by FAES, mg/kg
Ca K
R² = 0.943
0
10
20
30
40
50
60
70
80
90
0 10 20 30 40 50 60 70 80
Con
cent
ratio
n by
TX
RF,
mg/
kg
Concentration by FAAS, mg/kg
R² = 0.981
0
2
4
6
8
10
12
14
0 2 4 6 8 10 12
Con
cent
ratio
n by
TX
RF,
mg/
kg
Concentration by FAAS, mg/kg
Mn Cu
R² = 0.991
0
20
40
60
80
100
120
0 20 40 60 80 100 120
Con
cent
ratio
n by
TX
RF,
mg/
kg
Concentration by FAAS, mg/kg
R² = 0.988
0
10
20
30
40
50
60
70
0 10 20 30 40 50 60 70
Con
cent
ratio
n by
TX
RF,
mg/
kg
Concentration by FAAS, mg/kg
Fe Zn
Figure 3.3. Correlation between the element concentration values measured by tXRF and AAS in solid consistency food samples (honey, bee bread, pollen) for Ca, Cu, Fe, K, Mn and Zn

57
for liquid consistency samples (e.g., apple wine and apple juice) assessment of meas-ured values revealed no strong correlation for cu, Zn, fe and mn (figure 3.4.) while values detected for ca and K correlated weakly. in the last case use of comparability with the values found for analysis of reference samples can be used to made decision about selection of best suitable analytical method. in case of some elements (e.g., ni, pb) inter-pretation of results was limited due to their low concentration in analysed samples.
Figure 3.4.
R² = 0.879
0.00
0.05
0.10
0.15
0.20
0.25
0.00 0.02 0.04 0.06 0.08 0.10 0.12 0.14
Con
cent
ratio
n by
TX
RF,
mg/
l
Concentration by FAAS, mg/l
R² = 0.852
0.00
0.20
0.40
0.60
0.80
1.00
1.20
0.00 0.10 0.20 0.30 0.40 0.50 0.60
Con
cent
ratio
n by
TX
RF,
mg/
l
Concentration by FAAS, mg/l
R² = 0.712
0.00
0.50
1.00
1.50
2.00
2.50
3.00
0.00 0.50 1.00 1.50 2.00 2.50
Con
cent
ratio
n by
TX
RF,
mg/
l
Concentration by FAAS, mg/l
R² = 0.676
0.00
0.10
0.20
0.30
0.40
0.50
0.00 0.10 0.20 0.30 0.40
Con
cent
ratio
n by
TX
RF,
mg/
l
Concentration by FAAS, mg/l
Zn Cu
Fe Mn
Figure 3.4. Correlation between the element concentration values measured by tXRF and AAS in liquid consistency food samples (apple wine and apple juice)
for Cu, K, Fe, Zn after direct analysis
slightly stronger correlation was detected for the analytical measurements of mineral-ised samples than for sample analysis without any pretreatment, e.g., pearson correlation coefficients for cu, Zn, fe and mn in solid consistency samples after mineralization were 0.922, 0.948, 0.714 and 0.606, respectively.
statistical analysis of data showed that for several elements (e.g., cu, fe, mn, Zn) ob-tained results are well comparable among the applied analytical methods; however, in case of elements with low concentration in samples methodological distinctions are of a greater impact. in the study in each case optimal analytical method was used.
3.1.3. Comparative evaluation of food sample pretreatment procedures sample pretreatment such as wet digestion or dry ashing has to be applied to destroy
organic matrix of the biological and environmental samples that can influence the pre-cision of measurements of micro- and macroelement quantitative detection by analytical
58
techniques (Welna et al., 2011). as it was described in chapter Materials and Methods, one honey sample was treated in several treatment ways to assess the possible influence of sample matrix and the treatment procedures. in this case, high content of carbohy-drates can influence the accuracy of detection of micro- and macroelement concentra-tion. comparative measurements were done by aas and tXrf. measurements done by tXrf showed that dry ashing helps to destroy sample matrix more efficiently as spectral intensity was detected in higher rate and background fluctuations of signal were at mini-mum; that allows more effective quantitative measurements of elements. on the contrary, analysis of honey sample water solution by tXrf revealed the disturbances caused by background influence. it can seriously affect quantitative detection of element content, especially, if concentration of elements is expected to be very low. results revealed that wet digestion allows elimination of background influence caused by such organic matrix elements as c, n, o, h, s. spectral analysis revealed that background influence is signifi-cantly lower after sample wet digestion than in case of samples in water solution. results of analysis for several elements are summarized in table 3.5.
Table 3.5Influence of pretreatment procedure on precision of element concentration measurements in a
randomly selected honey sample detected by tXRF and AAS
elementconcentration (x–±s; nm=5), mg/kg (coefficient of variation, %)
Wet digestion Water solution dry ashingtXrf aas tXrf aas tXrf aas
ca 48.9±5.5(11)
74.7±2.3(3)
69.8±9.2(13)
57.7±1.9(3)
92.5±11.3(12)
161.2±3.7(2)
co - <0.004 - 0.005±0.001(23) - 0.005±0.001
(20)
cr <0.26 <0.01 <1.59 <0.01 - 0.020±0.005(20)
cu 0.42±0.05(12)
0.17±0.01(6)
0.34±0.05(15)
0.13±0.02(15)
0.95±0.14(15)
1.47±0.28(19)
K 905±69(8)
1342±56(4)
1356±209(15)
1600±378(24)
677±65(10)
963±77(8)
mn 2.17±0.09(4)
1.93±0.02(1)
3.97±0.71(18)
1.85±0.22(12)
1.19±0.11(9)
1.89±0.09(5)
na - 5.75±0.59(10) - 8.67±1.19
(14) - 123.32±22.16(18)
ni 0.32±0.05(16) <0.04 <0.43 0.11±0.01
(6)0.04±0.01
(23)0.10±0.02
(18)
rb 1.94±0.05(3) - 0.83±0.09
(11) - 0.84±0.08(9) -
sr <0.13 - - - 0.53±0.05(9) -
Zn 0.64±0.04(6) <0.47 0.74±0.09
(12)0.35±0.03
(8)0.43±0.05
(12)0.63±0.11
(17)

59
dry ashing and wet digestion can be assessed as more efficient sample pretreatment methods than sample dissolution in water which can result in more precise quantitative results. although sample analysis after dry ashing revealed higher levels of elements, it cannot be assessed as the best method due to several limitations such as higher risk of sample contamination and losses of volatile elements. Therefore wet digestion can be esti-mated as the most optimal pretreatment procedure that also is affirmed by lower disper-sion values of obtained results such as standard deviation and coefficient of variation than it was observed for other sample pretreatment procedures. however, values or coefficient of variation can be negatively affected by the fact that for some elements measured ele-ment concentration was close to the limit of detection of applied analytical methods.
3.2. Concentration of elements in studied food samples
3.2.1. Concentration of elements in food of plant originRoot vegetables. samples of onions Allium cepa (ns=98), carrots Daucus carota (ns=81)
and potato tubers Solanum tuberosum (ns=55) as well as samples of potato peel (ns=6) were collected over the territory of Latvia as shown in schematic maps (figures 3.5, 3.6 and 3.7).
Figure 3.5. origin of onion (Allium cepa) samples1
1 here und further number of a sample is indicated on the map

60
Figure 3.6. origin of carrot (Daucus carota) samples
Figure 3.7. origin of potato (Solanum tuberosum) samples
61
nine microelements (as, cd, co, cr, cu, ni, pb, se and Zn) were quantified, concen-tration is expressed as mg/kg of dry weight (dW), if not stated otherwise. mean moisture content of samples was determined to be 90 % for onion bulbs, 91 % for carrot roots and 78 % for potatoes.
The sequence of analyzed microelements in edible parts of root vegetables grown in Latvia was detected as follows: Zn >cu >ni >pb >cr >cd >co >as >se (based on mean values). Zn was the element detected in the highest concentration. The widest range of Zn concentration was discovered for onion bulbs and carrot roots, 8.11-24.38 mg/kg (mean 14.80 mg/kg) and 2.88-21.01 mg/kg (mean 9.02 mg/kg), respectively (figure 3.8). however, one outlier appeared among the samples of onion bulbs up to 40.66 mg/kg. potato tubers contained the lowest content of Zn (mean 6.35 mg/kg), while values for potato peel were at medium level (mean 8.36 mg/kg). Figure 3.8.
0
5
10
15
20
25
Onionbulbs
Carrotroots
Potatotubers
Potatopeel
Con
cent
ratio
n, m
g/kg
Vegetable sample
Zn
012345678
Onionbulbs
Carrotroots
Potatotubers
Potatopeel
Con
cent
ratio
n, m
g/kg
Vegetable sample
Cu
0.0
0.2
0.4
0.6
0.8
1.0
1.2
Onionbulbs
Carrotroots
Potatotubers
Potatopeel
Con
cent
ratio
n, m
g/kg
Vegetable sample
Pb
0.0
0.2
0.4
0.6
0.8
1.0
Onionbulbs
Carrotroots
Potatotubers
Potatopeel
Con
cent
ratio
n, m
g/kg
Vegetable sample
Cr
0.0
0.1
0.2
0.3
0.4
0.5
0.6
0.7
0.8
Onionbulbs
Carrotroots
Potatotubers
Potatopeel
Con
cent
ratio
n, m
g/kg
Vegetable sample
Ni
0.00
0.05
0.10
0.15
0.20
0.25
0.30
0.35
0.40
Onionbulbs
Carrotroots
Potatotubers
Potatopeel
Con
cent
ratio
n, m
g/kg
Vegetable sample
Co
Figure 3.8. Concentration of Zn, Cu, Pb, Cr, ni and Co detected in samples of root vegetables

62
Literature data show that in root vegetables collected in finland comparable Zn con-centration has been detected: in onion bulbs 13-22 mg/kg, in carrot roots 21-23 mg/kg and in potato tubers 10 mg/kg (ekholm et al., 2007). also data from study of vegetables in egypt were similar: mean concentration of Zn detected in onions was 11.4 mg/kg, in carrots 7.69 mg/kg and in potatoes 7.16 mg/kg (radwan and salama, 2006).
cu concentration in root vegetables grown in Latvia varied in similar range (range of mean values 2.01-3.04 mg/kg), while potato peel contained the highest levels of copper (mean 5.14 mg/kg). pb is one of the toxic elements that may cause significant adverse effects for human health (hashmi et al., 2007; Kumar et al., 2007). Lowest concentration of pb was detected in onion bulbs. carrot roots and potato tubers con-tained similar concentration of pb (from 0.02 to 0.47 mg/kg), but potato peel sam-ples contained about 10 times higher concentration (range 0.62-1.06 mg/kg and mean 0.81 mg/kg) of pb than any mean values for edible parts of analyzed root vegetables (figure 3.8). also a study in denmark revealed that vegetables with peel contained much higher concentration of pb than without peel. if vegetables were grown in con-taminated soil, i.e., pb content in potatoes with peel reached up to 0.226 mg/kg WW (wet weight), while concentration of pb in potatoes without peel was only 0.013 mg/kg WW (samsoe-petersen et al., 2002). potato tubers of different cultivars grown in spain contained 1.76-5.60 mg/kg of Zn and 0.23-2.29 mg/kg of cu (rivero et al., 2003), but in a study of organically grown potatoes in denmark the content of Zn was 1.98-7.50 mg/kg WW, cu 0.37-1.51 mg/kg WW and pb 0.0025-0.024 mg/kg WW (Bibak et al., 1998). finnish scientists comparing microelement content in vegetables grown in finland between 1970s and 2000s found that concentration of such elements as co, cu, ni and also Zn has a tendency to decrease by 25 %, while concentration of se and pb in 2000s was detected higher (ekholm et al., 2007).
Wide range of ni concentration was observed for all analyzed root vegetables (from 0.034 mg/kg in potato tubers up to 0.594 mg/kg in onion bulbs). cr and co were detected in comparably low amounts in edible parts of root vegetables. in comparison with edi-ble parts of vegetables potato peel contained the exaggeratedly high values of ni (mean 0.60 mg/kg), cr (mean 0.65 mg/kg) and co (mean 0.35 mg/kg) (figure 3.8). a finnish study showed that carrots grown in finland contained similar amounts of ni and co with the current study, respectively, 0.48-0.60 mg/kg and 0.03-0.04 mg/kg, (ekholm et al., 2007). The data from a study with carrots grown in industrial area of Greece showed that carrot roots can contain very high levels of elements, e.g., cr up to 8.62 mg/kg and co up to 3.29 mg/kg (voutsa and samara, 1998), while other study from agricultural areas of Greece revealed that carrots contain cr 0.062-0.160 mg/kg WW and co 0.009-0.023 mg/kg WW (stalikas et al., 1997).
results regarding as were similar to those obtained for ni, cr and co where edible parts of vegetables contained significantly lower concentration than potato peel. cd con-tent in the widest range was detected in carrot roots (0.030-0.324 mg/kg), but the highest average value referred to potato peel (mean 0.147 mg/kg) (figure 3.9).
other studies revealed different ranges of cd concentration in vegetables. for example, vegetables grown in egypt contained 0.012-0.029 mg/kg, 0.006-0.018 mg/kg and 0.015-0.026 mg/kg of cd, respectively, onions, carrots and potatoes (radwan and salama, 2006); but results from finnish study showed the following mean values of cd concentration: in

63
onions 0.03-0.15 mg/kg, in carrots 0.12-0.28 mg/kg and in potatoes 0.07 mg/kg (ekholm et al., 2007). other study in romania revealed that carrot roots may contain cd up to 3.39 mg/kg (soceanu et al., 2007), but cd content in carrot roots grown near zinc plant in china reached up to 9 mg/kg (Zheng et al., 2007). Thus, the impacts of the basic soil composition, soil contamination level in each study site as well as agricultural practices (for example, compostion and application of fertilizers) may have major impact on the metal accumulation. organically grown potatoes contained very low concentration of cd (0.006-0.040 mg/kg WW) (Bibak et al., 1998).
different results were detected for se. onion bulbs were richest in se (range 0.001-0.051 mg/kg), followed by carrot roots (a range from less than Lod to 0.027 mg/kg) and potato tubers (a range from less than Lod to 0.013 mg/kg), but potato peel contained the lowest concentration of se (<0.003 mg/kg) (figure 3.9.), thus indicating the element behaviour and speciation form importance on its accumulation.
it has been reported in the past that soil in Latvia contained se 0.054-0.340 mg/kg and was estimated as selenium deficient soil. There are some plant species such as Allium sp. that are tended to accumulate selenium (duma et al., 2011; Zegnere and alsina, 2008). current study also revealed that the highest concentration of se was detected in onion samples. se enrichment of soils nowadays is applied in agriculture practice worldwide (ekholm et al., 2007; hawkesford and Zhao, 2007); however, there were no information available of possible se enrichment of soils in Latvia.
Figure 3.9. Concentration of As, Cd, Se and Ag detected in samples of root vegetables
Figure 3.9.
0.000.020.040.060.080.100.120.140.16
Onionbulbs
Carrotroots
Potatotubers
Potatopeel
Con
cent
ratio
n, m
g/kg
Vegetable sample
As
0.00
0.01
0.02
0.03
0.04
0.05
0.06
Onionbulbs
Carrotroots
Potatotubers
Potatopeel
Con
cent
ratio
n, m
g/kg
Vegetable sample
Se
0.00
0.05
0.10
0.15
0.20
0.25
0.30
0.35
Onionbulbs
Carrotroots
Potatotubers
Potatopeel
Con
cent
ratio
n, m
g/kg
Vegetable sample
Cd
0.000
0.005
0.010
0.015
0.020
0.025
0.030
0.035
Onionbulbs
Carrotroots
Potatotubers
Potatopeel
Con
cent
ratio
n, m
g/kg
Vegetable sample
Ag
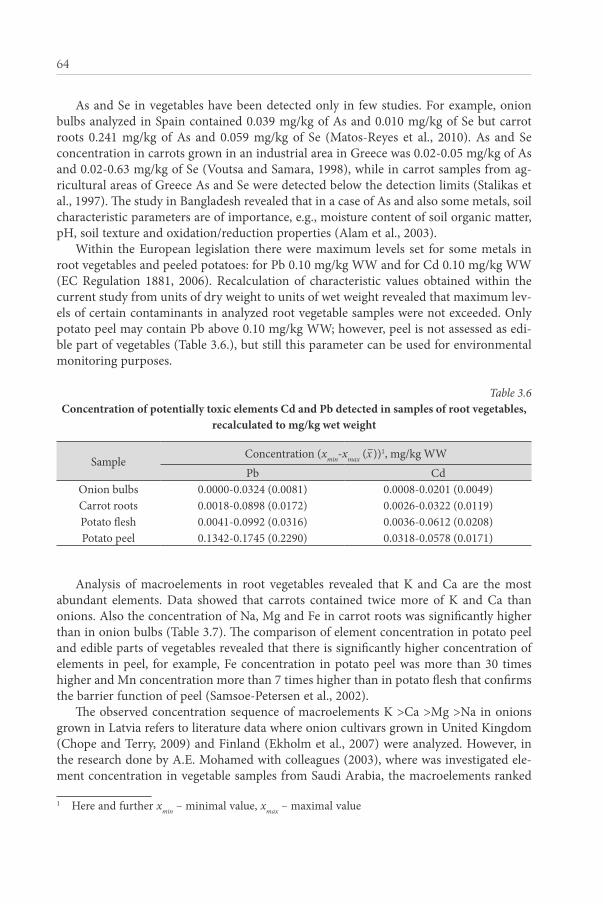
64
as and se in vegetables have been detected only in few studies. for example, onion bulbs analyzed in spain contained 0.039 mg/kg of as and 0.010 mg/kg of se but carrot roots 0.241 mg/kg of as and 0.059 mg/kg of se (matos-reyes et al., 2010). as and se concentration in carrots grown in an industrial area in Greece was 0.02-0.05 mg/kg of as and 0.02-0.63 mg/kg of se (voutsa and samara, 1998), while in carrot samples from ag-ricultural areas of Greece as and se were detected below the detection limits (stalikas et al., 1997). The study in Bangladesh revealed that in a case of as and also some metals, soil characteristic parameters are of importance, e.g., moisture content of soil organic matter, ph, soil texture and oxidation/reduction properties (alam et al., 2003).
Within the european legislation there were maximum levels set for some metals in root vegetables and peeled potatoes: for pb 0.10 mg/kg WW and for cd 0.10 mg/kg WW (ec regulation 1881, 2006). recalculation of characteristic values obtained within the current study from units of dry weight to units of wet weight revealed that maximum lev-els of certain contaminants in analyzed root vegetable samples were not exceeded. only potato peel may contain pb above 0.10 mg/kg WW; however, peel is not assessed as edi-ble part of vegetables (table 3.6.), but still this parameter can be used for environmental monitoring purposes.
Table 3.6Concentration of potentially toxic elements Cd and Pb detected in samples of root vegetables,
recalculated to mg/kg wet weight
sampleconcentration (xmin-xmax (x
–))1, mg/kg WWpb cd
onion bulbs 0.0000-0.0324 (0.0081) 0.0008-0.0201 (0.0049)carrot roots 0.0018-0.0898 (0.0172) 0.0026-0.0322 (0.0119)potato flesh 0.0041-0.0992 (0.0316) 0.0036-0.0612 (0.0208)potato peel 0.1342-0.1745 (0.2290) 0.0318-0.0578 (0.0171)
analysis of macroelements in root vegetables revealed that K and ca are the most abundant elements. data showed that carrots contained twice more of K and ca than onions. also the concentration of na, mg and fe in carrot roots was significantly higher than in onion bulbs (table 3.7). The comparison of element concentration in potato peel and edible parts of vegetables revealed that there is significantly higher concentration of elements in peel, for example, fe concentration in potato peel was more than 30 times higher and mn concentration more than 7 times higher than in potato flesh that confirms the barrier function of peel (samsoe-petersen et al., 2002).
The observed concentration sequence of macroelements K >ca >mg >na in onions grown in Latvia refers to literature data where onion cultivars grown in United Kingdom (chope and terry, 2009) and finland (ekholm et al., 2007) were analyzed. however, in the research done by a.e. mohamed with colleagues (2003), where was investigated ele-ment concentration in vegetable samples from saudi arabia, the macroelements ranked
1 here and further xmin – minimal value, xmax – maximal value

65
in a different sequence, i.e., ca >K >mg >na. conditions in saudi arabia differ much from those in Latvia, therefore, the detected differences obviously confirm that vegetable and plant composition is dependent on site specific conditions as climate regime and soil composition.
in general, the macroelement content of root vegetables grown in Latvia was compa-rable with results from other countries with similar climatic conditions, e.g., carrots in finland contained K 23300-26500 mg/kg, ca 2140-2250 mg/kg, mg 1210-1500 mg/kg and fe 30-34 mg/kg (ekholm et al., 2007).
Leafy vegetables. Lettuce Lactuca sativa samples, randomly selected samples grown in Latvia (ns=7) and samples grown in contaminated soil (ns=3) were analysed to detect quantitative concentration of elements (figure 3.10).
concentration of elements detected in lettuce samples grown in contaminated soil is not included in overall assessment, but it is discussed in the next chapter in the context of impact of pollution on element concentration in food.
twelve microelements (as, Ba, cd, co, cu, mn, ni, pb, rb, se, sr, Zn) and five macro-elements (ca, fe, K, mg, na) were quantified. in higher concentration there were detect-ed such elements as mn, Zn, cu, sr of which mean concentration was near or above 20 mg/kg (figure 3.11.), while the concentration of other microelements varied but in average were in lower concentration.
in comparison with other studies currently detected concentration of such microele-ments as Zn and rb was in good compatibility, but concentration of mn, cu and sr in other studies of lettuce was detected lower. for example, in a study done by d. Kelly and a.s. Bateman (2010) in the UK concentration of mn in lettuce samples was detected about 7-27 mg/kg, Zn 20-43 mg/kg, cu 4-11 mg/kg, sr 1.8-16.0 mg/kg and rb 0.1-35.0 mg/kg.
among the macroelements the highest concentration in analysed lettuce samples was detected for K and ca, followed by mg, na and fe, based on the mean values (table 3.8).
Table 3.7Concentration of macroelements detected in samples of root vegetables
elementconcentration (xmin-xmax (x
–)), mg/kg
onion bulbs(ns=98)
carrot roots(ns=81)
potato bulbs(ns=55)
potato peel(ns=6)
ca 543.98-2850.18(1344.39)
2042.76-5154.75(3327.41)
83.64-458.72(186.70)
597.03-1383.89(861.67)
fe 8.77-45.66(17.98)
9.71-460.43(30.86)
5.96-22.89(15.87)
462.79-850.64(593.20)
K 9598.32-28417.55(17457.06)
7906.00-63475.66(29499.53)
13780.49-27600.68(20878.39)
31725.69-42023.05(38093.00)
mg 455.19-1458.50(791.92)
461.65-3097.23(1407.51)
587.47-1458.94(1047.67)
1412.30-2063.95(1631.66)
mn 4.52-33.56(10.89)
2.35-47.54(9.06)
2.68-15.43(5.50)
28.34-46.49(37.42)
na 8.70-1204.41(153.59)
150.40-13928.48(2082.48)
0.56-46.46(11.48)
16.14-76.55(53.04)

66
Figure 3.10. origin of collected lettuce (Lactuca sativa) samples (s) and samples grown in contaminated soil (x); origin of apple (Malus domestica) fruit samples (a)
Figure 3.11.
0
5
10
15
20
25
30
Ba Cu Sr
Con
cent
ratio
n, m
g/kg
Element
0
20
40
60
80
100
120
140
Mn Rb Zn
Con
cent
ratio
n, m
g/kg
Element
0.00
0.20
0.40
0.60
0.80
1.00
1.20
1.40
1.60
As Ni Pb
Con
cent
ratio
n, m
g/kg
Element
0.00
0.05
0.10
0.15
0.20
0.25
0.30
Cd Co Se
Con
cent
ratio
n, m
g/kg
Element
Figure 3.11. Concentration of microelements detected in samples of lettuce

67
Table 3.8Concentration of macroelements detected in samples of lettuce
element concentration (xmin-xmax (x–); ns=7), mg/kg
ca 7163.32-13 232.29 (10 291.54)fe 35.67-53.20 (43.86)K 59 513.35-103 944.14 (75 368.14)
mg 2405.17-4896.56 (3650.26)na 613.14-4228.94 (1545.67)
concentration of macroelements detected in the current study was higher in compar-ison to other studies, but the tendencies of element distribution were similar. in the study done in the UK concentration of macroelements in lettuce samples was measured in fol-lowing ranges: about 10-1600 mg/kg na, 1500-2500 mg/kg mg, 26 000-42 000 mg/kg K, 500-3700 mg/kg ca and 25-77 mg/kg fe (Kelly and Bateman, 2010).
Fruits. apple tree Malus domestica fruit samples (ns=21) collected over the territory of Latvia (figure 3.10) were analysed. fifteen microelements (ag, as, Ba, cd, co, cr, cu, mn, ni, pb, rb, se, sr, v, Zn) and five macroelements (ca, fe, K, mg, na) were quantita-tively detected in peeled apple fruit flesh and in peel samples (ns=3).
in apple fruit flesh the highest concentration was detected for such elements as rb, cu, mn, Zn, sr and Ba which mean concentration was near or above 1 mg/kg (figure 3.12.), while the concentration of other microelements was lower.
in the study of apple fruit analysis done in croatia concentration of microelements in apple fruit flesh was detected as follows: 0.84-7.79 mg/kg Zn, 0.29-1.27 mg/kg sr, but mn and cd concentration was below the limit of detection (cindric et al., 2012). concentration of these elements detected in the current study are quite similar for Zn and sr (0.56-2.16 mg/kg and 0.29-2.54 mg/kg, respectively), but mn and cd concen-tration was in range 1.20-4.50 mg/kg and <Lod-0.003 mg/kg, respectively. i.J. cindric with colleagues (2012) detected that mn concentration in peel (4-6 mg/kg) was 2-3 times higher compared to whole apple (0.7-1.7 mg/kg), but cd was found only in peel, in the concentration range of 0.4-1.1 mg/kg. in samples of apple fruit peel from Latvia higher concentration was detected for several elements, if compared with apple fruit flesh. mean concentration of these microelements in apple fruit peel/flesh was following: 1.72/1.04 mg/kg for sr, 1.84/0.91 mg/kg for Ba, 0.47/0.18 mg/kg for ni, 0.30/0.16 mg/kg for cr, 0.027/0.010 mg/kg for v, 0.009/0.007 mg/kg for co and 0.006/0.002 mg/kg for as.
among the macroelements the highest concentration in analysed apple fruit flesh samples was detected for K, ca and mg, followed by na and fe, based on the mean val-ues. concentration of na was in range from 8.18 mg/kg up to 480.28 mg/kg, but concen-tration of other macroelements was not so variable (table 3.9).
mean macroelement concentration in apple fruit flesh samples from other study done in croatia was 38 400 mg/kg for K, 8430 mg/kg for na, 4040 mg/kg for ca and 2710 mg/kg for mg (cindric et al., 2012) which can be assessed as much higher values than detect-ed in average for apple fruit flesh samples in Latvia. macroelement concentration quan-tified in apple fruit peel in average was slightly higher than in fruit flesh, respectively,

68
Figure 3.12. Concentration of microelements detected in samples of apple fruits
Table 3.9Concentration of macroelements detected in samples of apple fruits
element concentration(xmin-xmax (x
–±s); ns=21), mg/kg
ca 158.38-608.33 (332.29±95.67)fe 2.80-8.53 (4.86±1.41)K 7142.86-12 111.31 (9323.55±1392.00)
mg 256.97-408.04 (315.29±47.23)na 8.18-480.28 (39.86±101.16)

69
544.52 mg/kg for ca, 6.38 mg/kg for fe, 10 469.83 mg/kg for K, 321.06 mg/kg for mg and 31.89 mg/kg for na.
Cereal products. samples of cereal meals, i.e., cereal mixtures for porridge prepara-tion were collected within the current study. it should be remarked that due to product specifics only some of the samples were produced in Latvia; however, overall comparison of element concentration in products available for consumption for consumers in Latvia is important issue within the food safety field. collected products were divided in four subgroups: a) mixed cereal meals (ns=10) containing two or more types of cereals; b) rice meals (ns=10); c) wheat meals (ns=12); d) buckwheat meals (ns=11).
The highest concentration of microelements were detected for mn, Zn, cu and rb. ranges of concentration varied widely, for example, the highest variation of measured con-centration of mn, Zn and cu were observed for wheat meal samples (2.31-70.60 mg/kg, 2.54-45.00 mg/kg, and 1.13-9.97 mg/kg, respectively) while the narrowest variation range of mn, Zn and cu in average can be attributed to rice meal samples (6.82-13.26 mg/kg, 8.44-13.78 mg/kg, 1.02-4.08 mg/kg, respectively). at the same time some outlier values were detected for rice meal samples, e.g., in two samples mn concentration was detected up to 58 mg/kg, in one sample 59 mg/kg of Zn and 9 mg/kg of cu. amongst mean values the highest were detected in mixed cereal meal samples for mn and Zn, and in buckwheat meal samples for cu and rb (figure 3.13).
Figure 3.13.
0
10
20
30
40
50
60
70
80
Mixedcereals
Rice Wheat Buckwheat
Con
cent
ratio
n, m
g/kg
Sample
Mn
05
101520253035404550
Mixedcereals
Rice Wheat Buckwheat
Con
cent
ratio
n, m
g/kg
Sample
Zn
0
2
4
6
8
10
12
Mixedcereals
Rice Wheat Buckwheat
Con
cent
ratio
n, m
g/kg
Sample
Cu
0
2
4
6
8
10
12
14
16
Mixedcereals
Rice Wheat Buckwheat
Con
cent
ratio
n, m
g/kg
Sample
Rb
Figure 3.13. Concentration of Mn, Zn, Cu and Rb detected in samples of cereal meals
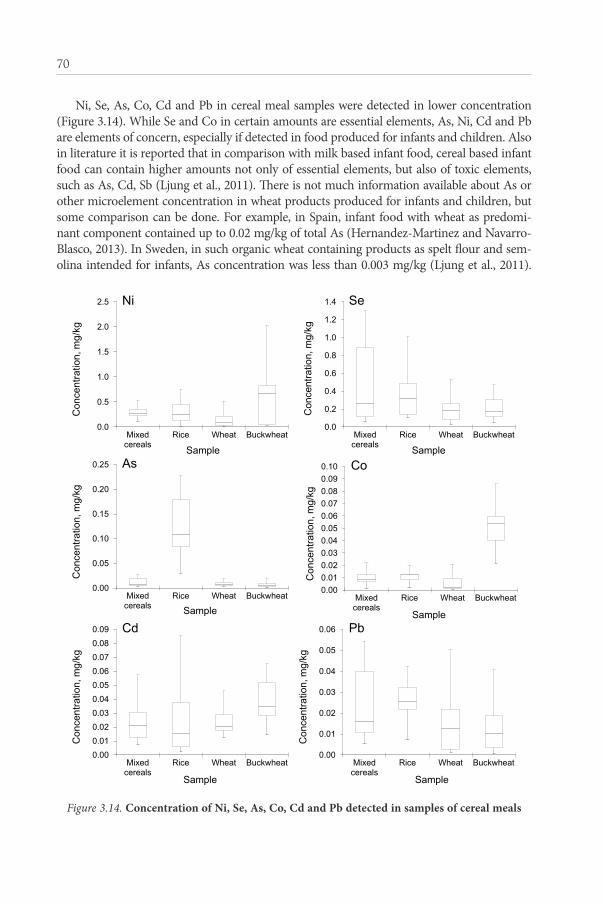
70
ni, se, as, co, cd and pb in cereal meal samples were detected in lower concentration (figure 3.14). While se and co in certain amounts are essential elements, as, ni, cd and pb are elements of concern, especially if detected in food produced for infants and children. also in literature it is reported that in comparison with milk based infant food, cereal based infant food can contain higher amounts not only of essential elements, but also of toxic elements, such as as, cd, sb (Ljung et al., 2011). There is not much information available about as or other microelement concentration in wheat products produced for infants and children, but some comparison can be done. for example, in spain, infant food with wheat as predomi-nant component contained up to 0.02 mg/kg of total as (hernandez-martinez and navarro-Blasco, 2013). in sweden, in such organic wheat containing products as spelt flour and sem-olina intended for infants, as concentration was less than 0.003 mg/kg (Ljung et al., 2011).
Figure 3.14.
0.0
0.5
1.0
1.5
2.0
2.5
Mixedcereals
Rice Wheat Buckwheat
Con
cent
ratio
n, m
g/kg
Sample
Ni
0.0
0.2
0.4
0.6
0.8
1.0
1.2
1.4
Mixedcereals
Rice Wheat Buckwheat
Con
cent
ratio
n, m
g/kg
Sample
Se
0.00
0.05
0.10
0.15
0.20
0.25
Mixedcereals
Rice Wheat Buckwheat
Con
cent
ratio
n, m
g/kg
Sample
As
0.000.010.020.030.040.050.060.070.080.090.10
Mixedcereals
Rice Wheat Buckwheat
Con
cent
ratio
n, m
g/kg
Sample
Co
0.000.010.020.030.040.050.060.070.080.09
Mixedcereals
Rice Wheat Buckwheat
Con
cent
ratio
n, m
g/kg
Sample
Cd
0.00
0.01
0.02
0.03
0.04
0.05
0.06
Mixedcereals
Rice Wheat Buckwheat
Con
cent
ratio
n, m
g/kg
Sample
Pb
Figure 3.14. Concentration of ni, Se, As, Co, Cd and Pb detected in samples of cereal meals

71
for the comparison with other food analysis results from a study done in canada, it can be mentioned that the highest levels of total arsenic were detected in fish (>1 mg/kg), while meat, bakery products and cereals contained lower content of as (0.02-0.03 mg/kg) (dabeka et al., 1993).
regular intake of essential elements, minerals and vitamins is very important for hu-man organism, especially, in childhood when growth and development is rapid. Therefore the element entity in diet should be balanced and it is important to avoid the presence of potentially toxic elements in food (carbonell-Barrachina et al., 2012; melo et al., 2008).
among the macroelements the highest concentration was detected for K, mg and ca, followed by na and fe (table 3.10).
Table 3.10 Concentration of macroelements detected in samples of cereal meals
elementconcentration (xmin-xmax (x
–)), mg/kgmixed cereals
(ns=10) rice (ns=10) Wheat (ns=12) Buckwheat (ns=11)
ca 91.86-3487.72(842.82)
1.00-2849.67(509.06)
5.90-2102.65(386.09)
27.40-2418.26(553.05)
fe 23.99-90.41(36.15)
1.85-104.01(26.10)
3.61-394.40(54.92)
18.81-102.52(37.59)
K 3453.75-8654.74(4555.37)
699.20-5283.40(2247.83)
1019.89-4972.37(3065.96)
3078.26-6372.72(4296.42)
mg 403.22-994.05(781.50)
109.31-1656.66(466.37)
113.65-1755.80(731.68)
909.33-2403.27(1659.66)
na 1.93-2151.79(457.17)
0.80-1464.52(261.30)
0.94-1119.16(178.67)
0.84-1081.62(189.03)
mixed cereal meal samples contained higher concentration of ca, K and na in aver-age, but wheat cereal meal samples contained significantly higher concentration of fe. mg concentration was detected the highest for buckwheat meal samples. rice meal sam-ples contained lowest mean concentration of mg and fe.
3.2.2. Concentration of elements in food of animal originCottage cheese. samples of cottage cheese (ns=27) were purchased from randomly se-
lected individual dairy farms and supermarkets in Latvia (figure 3.15).all samples chosen were labelled as cottage cheese derived from whole milk, i.e., cot-
tage cheese with content of fat not lower than 9 %. in total it was possible to determine quantitatively seven microelements (cr, cu, fe, mn, ni, pb, Zn) and four macroelements (ca, K, mg, na) in analyzed cottage cheese samples.
The highest concentration was detected for Zn and fe, 15.34-95.32 mg/kg and 0.51-23.16 mg/kg, respectively; followed by cu, mn, pb, ni and cr (table 3.11).

72
Table 3.11Concentration of microelements detected in samples of cottage cheese
element concentration(xmin-xmax (x
–±s); ns=27), mg/kg
cr 0.023-0.251 (0.086±0.066)cu 0.13-1.69 (0.87±0.42)fe 0.51-23.16 (5.88±4.75)
mn 0.15-1.31 (0.56±0.25)ni 0.017-0.710 (0.177±0.164)pb 0.013-1.065 (0.409±0.333)Zn 15.34-95.32 (30.52±15.17)
too high amount of possibly toxic microelements (pb, ni, cr) in cottage cheese arise qualms of potential risk for consumer safety while these elements can bring harmful ef-fects for human health especially after long term intake. There are no maximum contami-nation levels set for heavy metals in milk products except for pb. taking into account the legal regulations of european commission, the limit for concentration of pb in raw milk, heat-treated milk and milk for manufacture of milk-based products is set 0.02 mg/kg WW (ec regulation 1881, 2006).
most abundant macroelements quantified in cottage cheese samples were ca and K followed by na and mg (table 3.12).
Figure 3.15. origin of cottage cheese samples collected over summer season (v) and winter season (z)

73
Table 3.12Concentration of macroelements detected in samples of cottage cheese
element concentration (xmin-xmax (x–±s); ns=27), mg/kg
ca 1379.37-12291.22 (4124.44±2016.00)K 752.98-8865.97 (4512.09±1559.65)
mg 129.63-533.08 (326.88±89.68)na 233.67-1777.05 (970.35±335.11)
as it was not possible to find any previous studies about element content in cottage cheese due to the regional specifics of this foodstuff, obtained results were compared with average content of micro- and macroelements in milk. numerical outcomes discovered about threefold distinctions among average macroelement content for ca, K and mg in favour of cottage cheese. for example, concentration of macroelements in milk are 1120 mg/L for ca, 1360 mg/L for K, 110 mg/L for mg and 530 mg/L for na (cashman, 2006). in general, content of elements in dairy products mostly is dependent on the com-position of elements dairy animal feed (ayar et al., 2009; Lante et al., 2006) as well and can reveal the content of elements in soil, water and vegetation.
Hen eggs. samples of hen eggs (ns=33) were collected from different housing types of poultry farms over the territory of Latvia as well as 24 samples over a year were collected for detection of seasonality impact on element concentration in eggs (figure 3.16).
Figure 3.16. origin of hen eggs from domestic farms (a), organic farms (b), large-scale poultry farms (c) and samples for seasonality detection (s)
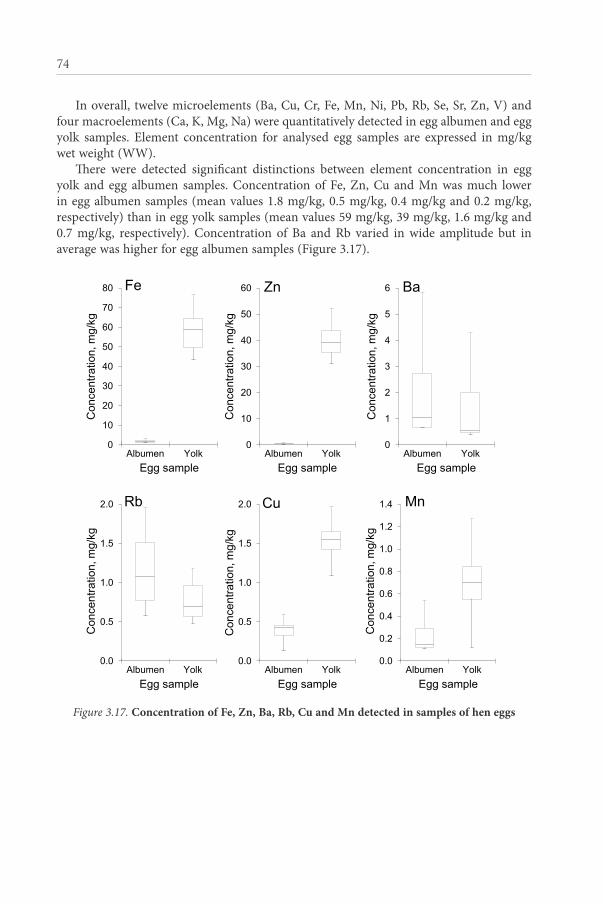
74
in overall, twelve microelements (Ba, cu, cr, fe, mn, ni, pb, rb, se, sr, Zn, v) and four macroelements (ca, K, mg, na) were quantitatively detected in egg albumen and egg yolk samples. element concentration for analysed egg samples are expressed in mg/kg wet weight (WW).
There were detected significant distinctions between element concentration in egg yolk and egg albumen samples. concentration of fe, Zn, cu and mn was much lower in egg albumen samples (mean values 1.8 mg/kg, 0.5 mg/kg, 0.4 mg/kg and 0.2 mg/kg, respectively) than in egg yolk samples (mean values 59 mg/kg, 39 mg/kg, 1.6 mg/kg and 0.7 mg/kg, respectively). concentration of Ba and rb varied in wide amplitude but in average was higher for egg albumen samples (figure 3.17).
Figure 3.17.
0
10
20
30
40
50
60
70
80
Albumen Yolk
Con
cent
ratio
n, m
g/kg
Egg sample
Fe
0
10
20
30
40
50
60
Albumen Yolk
Con
cent
ratio
n, m
g/kg
Egg sample
Zn
0
1
2
3
4
5
6
Albumen Yolk
Con
cent
ratio
n, m
g/kg
Egg sample
Ba
0.0
0.5
1.0
1.5
2.0
Albumen Yolk
Con
cent
ratio
n, m
g/kg
Egg sample
Rb
0.0
0.2
0.4
0.6
0.8
1.0
1.2
1.4
Albumen Yolk
Con
cent
ratio
n, m
g/kg
Egg sample
Mn
0.0
0.5
1.0
1.5
2.0
Albumen Yolk
Con
cent
ratio
n, m
g/kg
Egg sample
Cu
Salikt blakus pa 2, trīs rindās: Fe & Zn Ba & Rb Cu & Mn
Figure 3.17. Concentration of Fe, Zn, Ba, Rb, Cu and Mn detected in samples of hen eggs

75
detected concentration of sr, cr, ni, se, v and pb also varied according to analysed sample type. While concentration of sr and se was significantly lower in egg albumen, concentration of cr and pb was comparable in both groups of samples. But such elements as ni and v were not detected in egg yolk and only quantified in egg albumen samples (figure 3.18).
Figure 3.18.
0.0
0.2
0.4
0.6
0.8
1.0
1.2
1.4
1.6
Albumen Yolk
Con
cent
ratio
n, m
g/kg
Egg sample
Sr
0.0
0.1
0.2
0.3
0.4
0.5
Albumen Yolk
Con
cent
ratio
n, m
g/kg
Egg sample
Se
0.00
0.02
0.04
0.06
0.08
0.10
0.12
0.14
0.16
0.18
Albumen Yolk
Con
cent
ratio
n, m
g/kg
Egg sample
V
0.00
0.01
0.02
0.03
0.04
0.05
0.06
0.07
Albumen Yolk
Con
cent
ratio
n, m
g/kg
Egg sample
Pb
0.0
0.1
0.2
0.3
0.4
0.5
0.6
0.7
0.8
Albumen Yolk
Con
cent
ratio
n, m
g/kg
Egg sample
Cr
0.0
0.1
0.2
0.3
0.4
0.5
Albumen Yolk
Con
cent
ratio
n, m
g/kg
Egg sample
Ni
Salikt blakus pa 2, trīs rindās: Sr & Se Pb & Cr Ni & V
Figure 3.18. Concentration of Sr, Cr, ni, Se, V and Pb detected in samples of hen eggs
in comparison with values from other studies it was observed that obtained data are in good compliance with overall tendencies. higher concentration of cr was detected in egg samples from Belgium, pb in samples from italy, but fe concentration was similar in egg samples from countries with southern climatic conditions such as Brazil, italy and turkey (table 3.13).

76
Table 3.13Average concentration of several microelements in samples of hen eggs from different countries
(after Briggs and Wahlqvist, 1998; Waegeneers et al., 2009b)
country sample typeconcentration, mg/kg
co cr cu fe mn pb se ZnBelgium Whole egg - 0.485 - - - 0.099 - 19.8
Brazil Whole egg - - - 110.9 - - - 68.6
Greeceegg albumen 0.0011 0.068 0.25 - 0.035 - 0.066 1.4
egg yolk 0.0049 0.090 1.28 - 0.705 - 0.217 21.2italy egg yolk - - - 119.1 - 0.260 - 77.6
Latvia*egg albumen - 0.152 0.39 1.9 0.121 0.006 0.004 0.7
egg yolk - 0.071 1.54 58.7 0.588 0.076 0.272 40.0Whole egg - 0.052 0.95 26.5 0.278 0.072 0.113 14.6
polandegg albumen 0.0016 0.022 0.24 0.2 0.047 - 0.087 0.2
egg yolk 0.0044 0.235 1.65 70.3 0.648 - 0.327 43.0turkey Whole egg - - 2.70 112.0 - 0.061 - 67.5
* Current research
The highest macroelement concentration was detected in egg albumen for na, while egg yolk contains more ca. such elements as mg and K in average were distributed roughly equally in egg yolk and egg albumen samples (table 3.14).
Table 3.14Detected concentration of macroelements in egg samples
elementconcentration (xmin-xmax (x
–); ns=33), mg/kg
egg albumen egg yolkca 36.83-60.97 (49.72) 814.37-1461.14 (1063.27)K 839.85-1255.12 (1098.30) 704.57-1495.86 (973.92)
mg 81.39-179.26 (114.77) 47.14-129.24 (108.20)na 1053.08-2677.95 (1621.20) 211.71-706.76 (546.32)
in comparison with the data found in food fact sheets (Usda, s.a.) it can be observed that element distribution in egg yolk and albumen is similar (figure 3.19.)
in general, egg yolk samples are richer in micro- and macroelement than egg albumen samples.
Bee products. Within the group of bee products honey (ns=80), pollen (ns=5) and bee bread (ns=5) samples were collected over the territory of Latvia (figure 3.20).
Quantitative analysis of bee products allowed detection of concentration for ten mi-croelements (cd, co, cr, cu, mn, ni, pb, rb, sr, Zn) and seven macroelements (ca, fe, K, mg, na, p, s). concentration of elements for analysed bee product samples is expressed in mg/kg wet weight (WW).

77Figure 3.19.
0
20
40
60
80
100
Ca Mg P Na K Fe
Con
cten
t, %
Element
0
20
40
60
80
100
Ca Mg P Na K Fe
Con
cten
t, %
Element
YolkAlbumen
a) b)
Figure 3.19. Comparison of distribution of some elements in egg yolk and albumen: a) after data from literature (USDA, s.a.); b) current research
Figure 3.20. origin of bee products: pollen and bee bread (p), and honey, including samples from organic farms (b)
Con
tent
, %
Con
tent
, %

78
in general, pollen and bee bread samples contained significantly higher element con-centration than honey samples. for example, cd concentration in pollen was 33 times higher, cu – 29 times higher, ni – 8 times higher and pb – 15 times higher than detected in honey samples (table 3.15). presence of such elements as cd and pb in the samples of bee products suggests the important influence of environmental conditions. studies done in other countries reveal that content of cd may vary from concentration near the limit of detection in honey samples, e.g., from hungary, poland, Lithuania, switzerland and czech republic from (<Lod-1.55 μg/kg) up to 270-350 μg/kg in samples from macedonia and italy, respectively (Buldini et al., 2001; stankovska et al., 2008; vincēviča-Gaile, 2010). The lowest concentration of pb was detected in honey samples from poland, Lithuania and switzerland (<Lod-3 μg/kg), but significantly higher concentration of pb was detected in samples from slovenia – up to 79.1 mg/kg (vincēviča-Gaile, 2010), while pb and cd concentration in honey samples from Latvia are tended to be very low (mean 0.03 mg/kg and 0.008 mg/kg, respectively).
Table 3.15Concentration of microelements in analysed bee products
elementconcentration (xmin-xmax (x
–)), mg/kg
honey (ns=80) pollen (ns=5) Bee bread (ns=5)cd 0.002-0.150 (0.008) 0.09-0.62 (0.27) 0.02-0.12 (0.06)co 0.005-0.122 (0.011) 0.03-0.10 (0.05) 0.01-0.03 (0.02)cr 0.015-0.314 (0.175) 0.06-0.08 (0.07) 0.08-0.75 (0.22)cu 0.06-1.43 (0.28) 5.92-12.92 (8.19) 2.57-11.17 (7.86)mn 0.08-13.58 (2.44) 22.01-79.88 (39.43) 11.01-53.12 (32.01)ni 0.03-0.51 (0.06) 0.18-0.96 (0.47) 0.22-1.16 (0.71)pb 0.01-0.15 (0.03) 0.11-1.24 (0.46) 0.12-1.96 (0.50)rb 0.17-9.43 (1.34) 4.76-17.65 (9.69) 1.89-11.27 (6.25)sr 0.03-1.22 (0.12) 0.90-2.09 (1.31) 1.03-2.21 (1.48)Zn 0.15-18.89 (1.56) 37.57-61.93 (48.82) 8.14-51.16 (33.61)
The legislation of european Union indicates maximum allowable limits for some po-tentially toxic metals in several foodstuffs. for example, limits for pb are 0.02-1.50 mg/kg in certain food of animal origin and 0.05-0.30 mg/kg in certain food of plant origin and for cd 0.05-1.00 mg/kg and 0.05-0.20 mg/kg, respectively. Limits for hg and sn are set for certain types of food (ec regulation 629, 2008; ec regulation 1881, 2006). however, within the lists of contaminants or products regulated there is no honey or other bee products included. Before the joining of Latvia in the eU there were restrictions for some heavy metal content (e.g., for pb and cd) in honey set by the cabinet of ministers (dimiņš, 2006).
similarly as observed for microelements also the highest macroelement concentration was detected in pollen and bee bread samples (table 3.16).

79
Table 3.16Concentration of macroelements in analysed bee products
elementconcentration (xmin-xmax (x
–)), mg/kg
honey (ns=80) pollen (ns=5) Bee bread (ns=5)ca 17-272 (63) 1565-2205 (1836) 669-2606 (1668)fe 0.2-21.6 (4.0) 32.9-55.9 (43.8) 46.3-104.0 (73.4)K 161-2314 (772) 5058-7715 (6417) 438-7592 (4608)
mg 7-95 (23) 618-830 (756) 296-979 (700)na 4-285 (25) 40-54 (47) 113-223 (159)p Not analysed 13 125-15602 (14 447) 657-12 535 (7402)s Not analysed 7310-9418 (8116) 509-7844 (4691)
range of ca concentration was observed from <Lod in honey samples from poland up to 409 mg/kg in honey from italy. concentration of na in different honey samples is similar and not much dependent on botanical origin, while concentration of mg, ca, mn and Zn are variable due to the botanical origin (chudzinska and Baralkiewicz, 2010; fernandez-torres et al., 2005; silva et al., 2009).
3.2.3. Element concentration in beveragessamples of beverages collected in Latvia and analysed within this study were apple
juice (ns=9), apple wine (ns=5) and birch sap (ns=10); all samples were of local origin (figure 3.21).
Figure 3.21. origin of beverage samples: apple juice (s), birch sap (b) and apple wine (v)
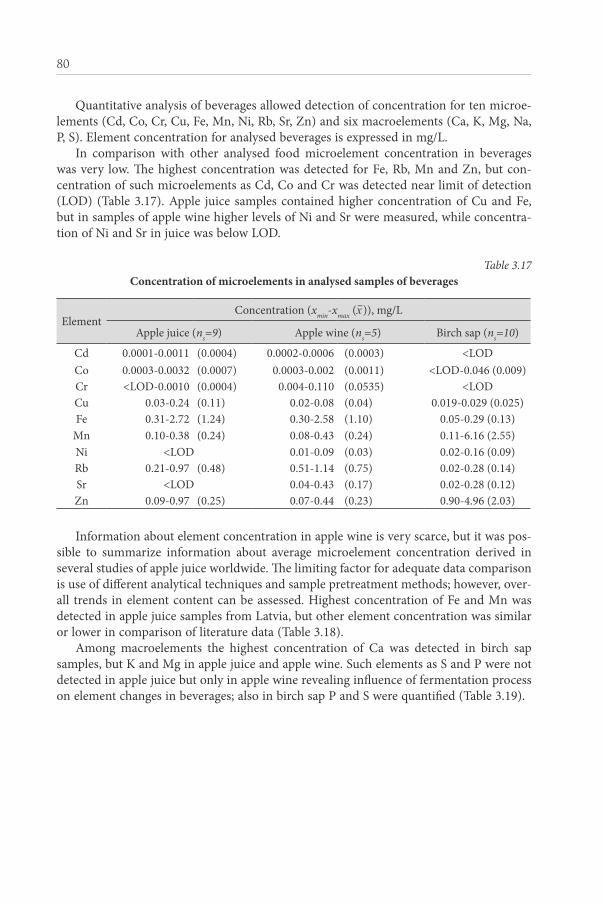
80
Quantitative analysis of beverages allowed detection of concentration for ten microe-lements (cd, co, cr, cu, fe, mn, ni, rb, sr, Zn) and six macroelements (ca, K, mg, na, p, s). element concentration for analysed beverages is expressed in mg/L.
in comparison with other analysed food microelement concentration in beverages was very low. The highest concentration was detected for fe, rb, mn and Zn, but con-centration of such microelements as cd, co and cr was detected near limit of detection (Lod) (table 3.17). apple juice samples contained higher concentration of cu and fe, but in samples of apple wine higher levels of ni and sr were measured, while concentra-tion of ni and sr in juice was below Lod.
Table 3.17 Concentration of microelements in analysed samples of beverages
elementconcentration (xmin-xmax (x
–)), mg/L
apple juice (ns=9) apple wine (ns=5) Birch sap (ns=10)
cd 0.0001-0.0011 (0.0004) 0.0002-0.0006 (0.0003) <Lodco 0.0003-0.0032 (0.0007) 0.0003-0.002 (0.0011) <Lod-0.046 (0.009)cr <Lod-0.0010 (0.0004) 0.004-0.110 (0.0535) <Lodcu 0.03-0.24 (0.11) 0.02-0.08 (0.04) 0.019-0.029 (0.025)fe 0.31-2.72 (1.24) 0.30-2.58 (1.10) 0.05-0.29 (0.13)
mn 0.10-0.38 (0.24) 0.08-0.43 (0.24) 0.11-6.16 (2.55)ni <Lod 0.01-0.09 (0.03) 0.02-0.16 (0.09)rb 0.21-0.97 (0.48) 0.51-1.14 (0.75) 0.02-0.28 (0.14)sr <Lod 0.04-0.43 (0.17) 0.02-0.28 (0.12)Zn 0.09-0.97 (0.25) 0.07-0.44 (0.23) 0.90-4.96 (2.03)
information about element concentration in apple wine is very scarce, but it was pos-sible to summarize information about average microelement concentration derived in several studies of apple juice worldwide. The limiting factor for adequate data comparison is use of different analytical techniques and sample pretreatment methods; however, over-all trends in element content can be assessed. highest concentration of fe and mn was detected in apple juice samples from Latvia, but other element concentration was similar or lower in comparison of literature data (table 3.18).
among macroelements the highest concentration of ca was detected in birch sap samples, but K and mg in apple juice and apple wine. such elements as s and p were not detected in apple juice but only in apple wine revealing influence of fermentation process on element changes in beverages; also in birch sap p and s were quantified (table 3.19).
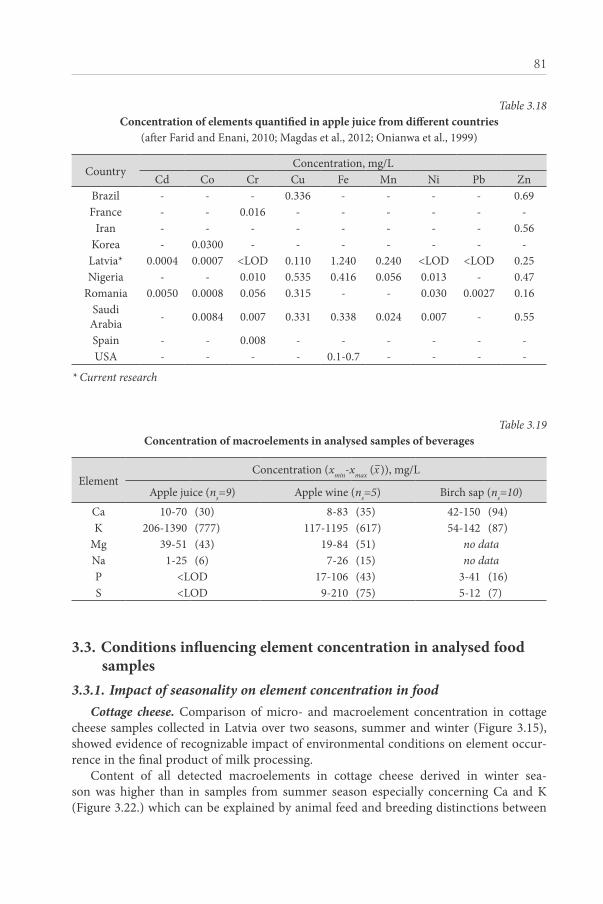
81
Table 3.19 Concentration of macroelements in analysed samples of beverages
elementconcentration (xmin-xmax (x
–)), mg/L
apple juice (ns=9) apple wine (ns=5) Birch sap (ns=10)ca 10-70 (30) 8-83 (35) 42-150 (94)K 206-1390 (777) 117-1195 (617) 54-142 (87)
mg 39-51 (43) 19-84 (51) no datana 1-25 (6) 7-26 (15) no datap <Lod 17-106 (43) 3-41 (16)s <Lod 9-210 (75) 5-12 (7)
3.3. Conditions influencing element concentration in analysed food samples
3.3.1. Impact of seasonality on element concentration in foodCottage cheese. comparison of micro- and macroelement concentration in cottage
cheese samples collected in Latvia over two seasons, summer and winter (figure 3.15), showed evidence of recognizable impact of environmental conditions on element occur-rence in the final product of milk processing.
content of all detected macroelements in cottage cheese derived in winter sea-son was higher than in samples from summer season especially concerning ca and K (figure 3.22.) which can be explained by animal feed and breeding distinctions between
Table 3.18Concentration of elements quantified in apple juice from different countries
(after farid and enani, 2010; magdas et al., 2012; onianwa et al., 1999)
countryconcentration, mg/L
cd co cr cu fe mn ni pb ZnBrazil - - - 0.336 - - - - 0.69france - - 0.016 - - - - - -
iran - - - - - - - - 0.56Korea - 0.0300 - - - - - - -
Latvia* 0.0004 0.0007 <Lod 0.110 1.240 0.240 <Lod <Lod 0.25nigeria - - 0.010 0.535 0.416 0.056 0.013 - 0.47
romania 0.0050 0.0008 0.056 0.315 - - 0.030 0.0027 0.16saudi
arabia - 0.0084 0.007 0.331 0.338 0.024 0.007 - 0.55
spain - - 0.008 - - - - - -Usa - - - - 0.1-0.7 - - - -
* Current research
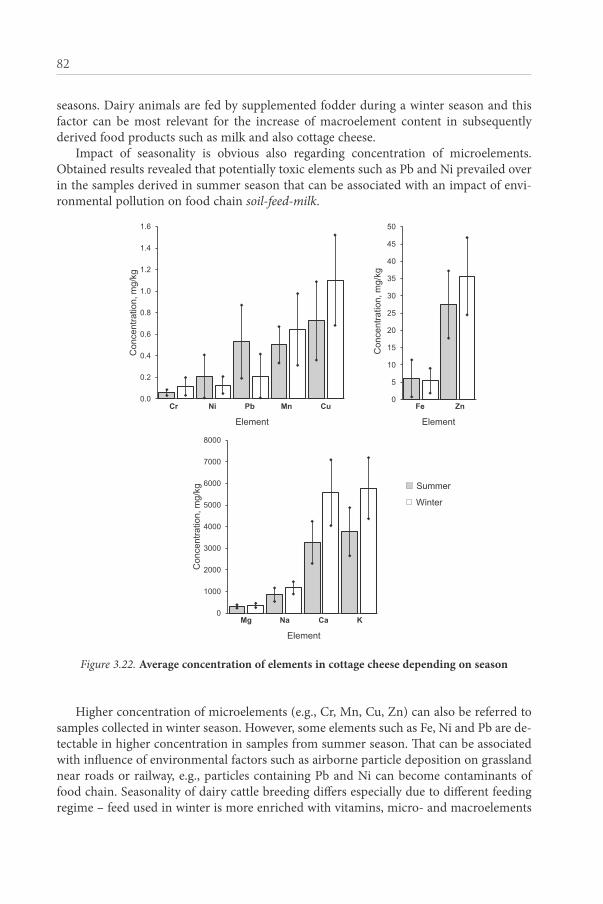
82
seasons. dairy animals are fed by supplemented fodder during a winter season and this factor can be most relevant for the increase of macroelement content in subsequently derived food products such as milk and also cottage cheese.
impact of seasonality is obvious also regarding concentration of microelements. obtained results revealed that potentially toxic elements such as pb and ni prevailed over in the samples derived in summer season that can be associated with an impact of envi-ronmental pollution on food chain soil-feed-milk.
Element
Cr Ni Pb Mn Cu Fe Zn
Element
0.0
0.2
0.4
0.6
0.8
1.0
1.2
1.4
1.6
Cr Ni Pb Mn Cu
Con
cent
ratio
n, m
g/kg
0
5
10
15
20
25
30
35
40
45
50
Fe Zn
Con
cent
ratio
n, m
g/kg
Summer
Winter
Mg Na Ca K
Element
0
1000
2000
3000
4000
5000
6000
7000
8000
Mg Na Ca K
Figure 3.22. Average concentration of elements in cottage cheese depending on season
higher concentration of microelements (e.g., cr, mn, cu, Zn) can also be referred to samples collected in winter season. however, some elements such as fe, ni and pb are de-tectable in higher concentration in samples from summer season. That can be associated with influence of environmental factors such as airborne particle deposition on grassland near roads or railway, e.g., particles containing pb and ni can become contaminants of food chain. seasonality of dairy cattle breeding differs especially due to different feeding regime – feed used in winter is more enriched with vitamins, micro- and macroelements

83
but in summer cattle can be fed on grassland and is likely exposed to possible environ-mental pollution impact.
Hen eggs. hen egg samples (ns=24) were collected each month from april, 2011 to march, 2012 in a courtyard farm at aizkraukle, Latvia (figure 3.16.) with known poultry breeding conditions: in spring and summer season birds were kept in free-range condi-tions outdoors with possibility to find feed and as additional feed grass, vegetables and grains were fed; in autumn and winter season birds were kept in a shelter and fed with ready-to-use combined poultry feed and grains. determination of seasonal impact was done within four seasons: winter, spring, summer and autumn. in overall, differences in concentration of micro- and macroelements in hen egg samples affected by seasonality were observed. transfer and concentration of elements can be influenced by several fac-tors associated with seasonality: specific climatic conditions, morphological and hydro-logical conditions, environmental pollution (Brekken and steinnes, 2004).
The highest mean concentration of microelements fe, Zn and mn was observed in the egg yolk samples collected in summer, while in egg albumen element concentration seasonaly varied unevenly (figure 3.23). considering the detected concentration of mi-croelements in the current study in comparison to studies in Greece and Belgium, the mean concentration of Zn in egg yolk was obtained higher in our study, but egg albumen contained lower concentration of Zn (Giannenas et al., 2009; Waegeneers et al., 2009a; Waegeneers et al., 2009b). The research in Belgium revealed seasonal Zn and cu differ-ences in whole egg samples between samples from spring and autumn seasons: Zn con-centration varied from 19.2 mg/kg in spring to 20.3 mg/kg in autumn and from 0.52 mg/kg to 0.43 mg/kg for cu, respectively (Waegeneers et al., 2009a). in natural environment the essential element Zn can be strongly enriched by precipitation and is uptaken in food chain by plants and birds (Brekken and steinnes, 2004).
The lowest concentration of se in egg yolk was detected in samples from autumn (0.08 mg/kg) but the highest in winter (0.13 mg/kg). se mostly was detectable in sam-ples of egg yolk, while in egg albumen se was detected only in samples collected during winter season (0.02 mg/kg). These differences can be related to poultry feeding specif-ics as inclusion of nutritionally enriched complex food in winter. concentration of se in egg yolk samples in detected in studies from Greece and turkey was higher as it is reported in the current study (nisianakis et al., 2009; Uluozlu et al., 2009). The highest concentration of mn in egg yolk samples was detected in spring and summer season (0.35 mg/kg). in egg albumen concentration of mn increased in spring-summer sea-sons (mean 0.30 mg/kg) but lowered in autumn-winter (mean 0.03 mg/kg). also ni concentration higher was detected in summer season in egg albumen samples (mean 0.20 mg/kg) (figure 3.24). in addition, ni dominated in egg albumen samples, except samples from spring season, when ni was detected also in egg yolk. similar tendencies of ni distribution in egg yolk and egg albumen were observed in the study done in Greece (nisianakis et al., 2009).
concentration of pb in both, egg yolk and albumen, was significantly higher in sum-mer season (mean 0.13 mg/kg for yolk and 0.17 mg/kg for albumen) in comparison with spring period (mean 0.03 mg/kg for yolk and 0.10 mg/kg for albumen). in samples from winter and autumn seasons pb was not detected.
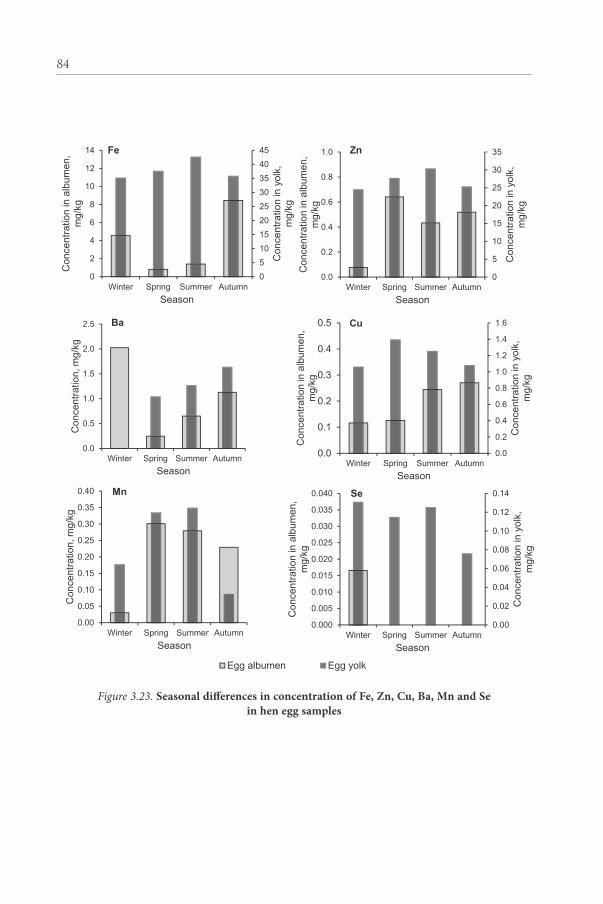
84
051015202530354045
0
2
4
6
8
10
12
14
Winter Spring Summer AutumnC
once
ntra
tion
inyo
lk,
mg/
kg
Con
cent
ratio
nin
albu
men
,m
g/kg
Season
Fe
0
5
10
15
20
25
30
35
0.0
0.2
0.4
0.6
0.8
1.0
Winter Spring Summer Autumn
Con
cent
ratio
nin
yolk
,m
g/kg
Con
cent
ratio
nin
albu
men
,m
g/kg
Season
Zn
0.0
0.5
1.0
1.5
2.0
2.5
Winter Spring Summer Autumn
Con
cent
ratio
n, m
g/kg
Season
Ba
0.0
0.2
0.4
0.6
0.8
1.0
1.2
1.4
1.6
0.0
0.1
0.2
0.3
0.4
0.5
Winter Spring Summer Autumn
Con
cent
ratio
nin
yolk
,m
g/kg
Con
cent
ratio
nin
albu
men
,m
g/kg
Season
Cu
0.00
0.05
0.10
0.15
0.20
0.25
0.30
0.35
0.40
Winter Spring Summer Autumn
Con
cent
ratio
n, m
g/kg
Season
Mn
Egg albumen Egg yolk
0.00
0.02
0.04
0.06
0.08
0.10
0.12
0.14
0.000
0.005
0.010
0.015
0.020
0.025
0.030
0.035
0.040
Winter Spring Summer Autumn
Con
cent
ratio
nin
yolk
,m
g/kg
Con
cent
ratio
nin
albu
men
,m
g/kg
Season
Se
051015202530354045
0
2
4
6
8
10
12
14
Winter Spring Summer Autumn
Con
cent
ratio
nin
yolk
,m
g/kg
Con
cent
ratio
nin
albu
men
,m
g/kg
Season
Fe
0
5
10
15
20
25
30
35
0.0
0.2
0.4
0.6
0.8
1.0
Winter Spring Summer Autumn
Con
cent
ratio
nin
yolk
,m
g/kg
Con
cent
ratio
nin
albu
men
,m
g/kg
Season
Zn
0.0
0.5
1.0
1.5
2.0
2.5
Winter Spring Summer Autumn
Con
cent
ratio
n, m
g/kg
Season
Ba
0.0
0.2
0.4
0.6
0.8
1.0
1.2
1.4
1.6
0.0
0.1
0.2
0.3
0.4
0.5
Winter Spring Summer Autumn
Con
cent
ratio
nin
yolk
,m
g/kg
Con
cent
ratio
nin
albu
men
,m
g/kg
Season
Cu
0.00
0.05
0.10
0.15
0.20
0.25
0.30
0.35
0.40
Winter Spring Summer Autumn
Con
cent
ratio
n, m
g/kg
Season
Mn
Egg albumen Egg yolk
0.00
0.02
0.04
0.06
0.08
0.10
0.12
0.14
0.000
0.005
0.010
0.015
0.020
0.025
0.030
0.035
0.040
Winter Spring Summer Autumn
Con
cent
ratio
nin
yolk
,m
g/kg
Con
cent
ratio
nin
albu
men
,m
g/kg
Season
Se
Figure 3.23. Seasonal diff erences in concentration of Fe, Zn, Cu, Ba, Mn and Se in hen egg samples
051015202530354045
0
2
4
6
8
10
12
14
Winter Spring Summer Autumn
Con
cent
ratio
nin
yolk
,m
g/kg
Con
cent
ratio
nin
albu
men
,m
g/kg
Season
Fe
0
5
10
15
20
25
30
35
0.0
0.2
0.4
0.6
0.8
1.0
Winter Spring Summer Autumn
Con
cent
ratio
nin
yolk
,m
g/kg
Con
cent
ratio
nin
albu
men
,m
g/kg
Season
Zn
0.0
0.5
1.0
1.5
2.0
2.5
Winter Spring Summer Autumn
Con
cent
ratio
n, m
g/kg
Season
Ba
0.0
0.2
0.4
0.6
0.8
1.0
1.2
1.4
1.6
0.0
0.1
0.2
0.3
0.4
0.5
Winter Spring Summer Autumn
Con
cent
ratio
nin
yolk
,m
g/kg
Con
cent
ratio
nin
albu
men
,m
g/kg
Season
Cu
0.00
0.05
0.10
0.15
0.20
0.25
0.30
0.35
0.40
Winter Spring Summer Autumn
Con
cent
ratio
n, m
g/kg
Season
Mn
Egg albumen Egg yolk
0.00
0.02
0.04
0.06
0.08
0.10
0.12
0.14
0.000
0.005
0.010
0.015
0.020
0.025
0.030
0.035
0.040
Winter Spring Summer AutumnC
once
ntra
tion
inyo
lk,
mg/
kg
Con
cent
ratio
nin
albu
men
,m
g/kg
Season
Se
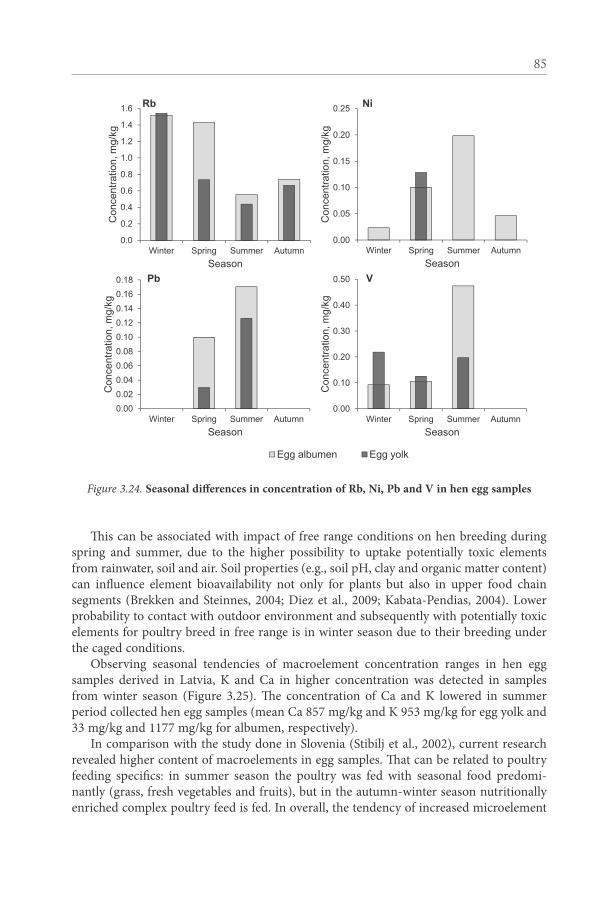
85
Th is can be associated with impact of free range conditions on hen breeding during spring and summer, due to the higher possibility to uptake potentially toxic elements from rainwater, soil and air. soil properties (e.g., soil ph, clay and organic matter content) can infl uence element bioavailability not only for plants but also in upper food chain segments (Brekken and steinnes, 2004; diez et al., 2009; Kabata-pendias, 2004). Lower probability to contact with outdoor environment and subsequently with potentially toxic elements for poultry breed in free range is in winter season due to their breeding under the caged conditions.
observing seasonal tendencies of macroelement concentration ranges in hen egg samples derived in Latvia, K and ca in higher concentration was detected in samples from winter season (figure 3.25). Th e concentration of ca and K lowered in summer period collected hen egg samples (mean ca 857 mg/kg and K 953 mg/kg for egg yolk and 33 mg/kg and 1177 mg/kg for albumen, respectively).
in comparison with the study done in slovenia (stibilj et al., 2002), current research revealed higher content of macroelements in egg samples. Th at can be related to poultry feeding specifi cs: in summer season the poultry was fed with seasonal food predomi-nantly (grass, fresh vegetables and fruits), but in the autumn-winter season nutritionally enriched complex poultry feed is fed. in overall, the tendency of increased microelement
Figure 3.24.
0.0
0.2
0.4
0.6
0.8
1.0
1.2
1.4
1.6
Winter Spring Summer Autumn
Con
cent
ratio
n, m
g/kg
Season
Rb
0.00
0.05
0.10
0.15
0.20
0.25
Winter Spring Summer Autumn
Con
cent
ratio
n, m
g/kg
Season
Ni
0.000.020.040.060.080.100.120.140.160.18
Winter Spring Summer Autumn
Con
cent
ratio
n, m
g/kg
Season
Pb
Egg albumen Egg yolk
0.00
0.10
0.20
0.30
0.40
0.50
Winter Spring Summer Autumn
Con
cent
ratio
n, m
g/kg
Season
V
Figure 3.24. Seasonal diff erences in concentration of Rb, ni, Pb and V in hen egg samples

86
concentration in summer season was detected in contrary to concentration of macroele-ments, revealing the relation with poultry feeding and free range conditions (Kucukyilmaz et al., 2012).
3.3.2. Impact of site-specifi c conditions on the concentration of elements in foodHoney. for the assessment of site-specifi c conditions and geographical distribution of
elements in honey the samples were divided into sets based on the regional geological in-formation of Latvia (Juškevičs, 2000; nikodemus, 2004). arrangement of sample sets was also tightly associated with historical regions of Latvia, i.e., Kurzeme, Zemgale, vidzeme and Latgale. Geochemical background of Latvia in details have been studied by a. Gilucis (2007) who states that in Latgale region geochemical background of pb, cd, sb, ag, se, as and s concentration is lower than in other areas of Latvia, but concentration of ni, co, fe, La, K and Ga in Latgale and east of vidzeme is heightened. comparison of micro- and macroelement content of honey in-between selected sets revealed that only for cu, fe, mg and v there are no substantial diff erences. taking into account the known geochem-ical distribution of elements, the interconnections of element content in honey detected in current research cannot be unambiguously linked to the geochemical background re-gionally. more infl uence on element content of honey can be attributed to site-specifi c
Figure 3.25.
0
500
1000
1500
2000
2500
Winter Spring Summer Autumn
Con
cent
ratio
n, m
g/kg
Season
K
01002003004005006007008009001000
0
20
40
60
80
100
120
140
Winter Spring Summer Autumn
Con
cent
ratio
n in
yol
k,
mg/
kg
Con
cent
ratio
n in
alb
umen
, m
g/kg
Season
Ca
0
1000
2000
3000
4000
5000
6000
Winter Spring Summer Autumn
Con
cent
ratio
n, m
g/kg
Season
S
Egg albumen Egg yolk
010002000300040005000600070008000900010000
050
100150200250300350400450500
Winter Spring Summer Autumn
Con
cent
ratio
n in
yol
k,
mg/
kg
Con
cent
ratio
n in
alb
umen
, m
g/kg
Season
P
Figure 3.25. Seasonal diff erences in concentration of K, Ca, S and P in hen egg samples

87
anthropogenic activities, such as traffic intensity, agricultural and agrochemical actions or other ways of environmental pollution. deeper and more specific studies taking into account site-specific impacts should be carried out.
Birch sap. Birch sap is a specific beverage derived in early spring from birch trees Betula sp. it is consumed widely in the northern countries, including Latvia directly af-ter collection from trees or after fermentation as well as used for preparation of syrup. after the literature data the most abundant elements in birch sap are ca, mg, p, mn and Zn detectable in concentration usually above 1 mg/L. it has been detected that element composition of birch sap can reflect geochemical background of such elements as ag, cd, pb and Zn, therefore, the analysis of samples with known origin can be used as a tool for biogeochemical prospecting (harju and hulden, 1990).
as the origin of birch sap samples was known it was possible to compare detected concentration of micro- and macroelements mutually and also with available data from other studies done in Latvia and Lithuania (table 3.20 and 3.21).
Table 3.20 Concentration of macroelements in birch sap
(data from current research and after Kuka et al., 2013; viskelis ir rubinskiene, 2011)
origin of sample
concentration of element, mg/Lca cl K mg na p s
Jelgava 53 - 41 - - 2.1 (as po4)3- 36 (as so4)
2-
ozolpils 41 9 66 - - 2.4 (as po4)3- 34 (as so4)
2-
azkraukle* 42 6 61 - - 7 <Lodiecava* 50 16 54 - - 3 7preiļi* 150 8 87 - - 6 5sēļi* 86 6 92 - - 25 6
stende* 142 7 142 - - 41 12Lithuania 57 - 115 22 15 - -
* Current research
Table 3.21Concentration of microelements in birch sap
(data from current research and after Kuka et al., 2013; viskelis ir rubinskiene, 2011)
origin of sample
concentration of element, mg/Las Ba co cr cu fe mn ni rb sr Zn
Jelgava - - - - 0.04 0.10 0.50 - - - -ozolpils - - - - - - 0.52 0.03 - - -
azkraukle* - - - - 0.02 0.10 0.11 - 0.03 0.02 1.70iecava* - 0.07 - - 0.03 0.11 0.14 0.08 0.02 0.07 0.90preiļi* - 0.67 - - 0.03 0.29 1.77 0.16 0.18 0.12 1.69sēļi* - 0.26 - - - 0.05 6.16 0.02 0.19 0.11 0.90
stende* 0.01 0.48 0.05 - 0.03 0.08 4.57 - 0.28 0.28 4.96Lithuania - - - 0.02 0.09 0.67 1.17 - - - 1.49
* Current research

88
observed differences among the values element concentration can be assessed as quite notable, but it is very complicated to make unified conclusions on impacts influencing element content. according to data it is obvious that for example birch sap collected in preiļi and stende contain higher concentration of elements but further studies are needed to detect site-specific impacts influencing element content in food.
3.3.3. Impact of botanical origin on element concentration in foodHoney. for the statistical data analysis with the aim to detect impact of botanical or-
igin on the concentration of elements in honey samples they were divided in 7 groups according to their botanical origin: 1) polyfloral not defined honey (ns=33); 2) heather and forest blossom honey (ns=16); 3) rape and spring blossom honey (ns=5); 4) buck-wheat and clover species honey (ns=9); 5) linden honey (ns=6); 6) meadows blossom hon-ey (ns=8) and 7) commercially manufactured honey mixtures with unknown botanical origin (ns=3).
to detect also impact of pollution attention was paid in detection of potentially toxic elements. The analysis of honey samples collected in Latvia revealed that in overall po-tentially toxic elements can be quantified in the following sequence: Zn >al >cu >ni >cr >pb >co >cd >as (based on mean results, ns=80). honey is known as the easily contam-inable product if stored or processed by inappropriate, mostly metal alloys, equipment (Joudisius ir simoneliene, 2009) as well as a biological product that can reflect environ-mental pollution or geochemical specifics of area where bees collect nectar (fodor and molnar, 1993; pohl, 2009). The overall list of metals detected leads to think of possible contamination at storage and processing as, e.g., al, cu, ni and Zn are the ordinary con-stituents of metallic household and kitchen equipment.
taking into account the botanical origin of honey collected in Latvia several differenc-es in concentration of potentially toxic metals were detected among the species. The high-est variability of zinc concentration was observed for commercially manufactured honey mixtures (0.28-11.60 mg/kg), followed by heather / forest blossom honey and polyfloral honey samples, while rape / spring blossom honey contained the lowest concentration of this element (figure 3.26). some outliers appeared in the group of polyfloral honey samples, i.e., one sample contained 18.89 mg/kg of Zn. honey analysis in the neighbour country Lithuania revealed obvious honey contamination with Zn up to 41.25 mg/kg in a case when honey sample were kept in a vessel covered with zinc (Joudisius ir simoneliene, 2009). That approves the importance of equipment materials used for honey storage and processing. although the widest spread of aluminium concentration was detected for polyfloral honey (0.09-1.15 mg/kg), the highest mean concentration refer to the honey mixtures (0.62 mg/kg) and heather / forest blossom honey (0.49 mg/kg). for comparison, nectar honey samples collected in czech republic contained al in higher levels (0.61-5.49 mg/kg) (Lachman et al., 2007). other studies showed that rape honey in poland may contain al up to 11 mg/kg but buckwheat honey in less levels (up to 2.27 mg/kg) (chudzinska and Baralkiewicz, 2010).
The highest ranges of variability as well as the highest mean concentration of cu was detected for heather / forest honey samples (0.35 mg/kg) and buckwheat / clover honey samples (0.25 mg/kg). regarding the botanical origin in the study by spanish

89
scientists it has been found out that orange blossom honey may contain much high-er values of cu (42.59-90.90 mg/kg) than other honey types (fernandez-torres et al., 2005), while mean (and maximum) values for rape and buckwheat honey in poland were 0.17 mg/kg (1.69 mg/kg) and 0.91 mg/kg (1.55 mg/kg), respectively (chudzinska and Baralkiewicz, 2010).
range of ni concentration within the groups of honey samples was not as variable as for other elements. The highest mean content of nickel was detected in heather / forest blossom honey (0.054 mg/kg). however, detected values of ni are much lower than de-tected in Lithuanian honey samples 0.206-0.350 mg/kg (Joudisius ir simoneliene, 2009) and in nectar honey from czech republic 0.06-0.40 mg/kg (Lachman et al., 2007).
different results were gained for lead. The highest levels of pb were detected in linden honey (mean 0.014 mg/kg) (figure 3.27.) as well as in this group was detected one outlier with pb concentration of 0.147 mg/kg.
contamination of linden honey with pb might be connected with the possible impact of pollution because linden trees widely grow in urban areas or near the roadways. in hungarian study pb concentration was detected 0.024-0.163 mg/kg for polyfloral honey and 0.017-0.144 mg/kg for acacia honey (ajtony et al., 2007). But in italian study lead was detected 0.047-0.053 mg/kg for clover honey and 0.028-0.304 mg/kg for polyfloral honey
0
2
4
6
8
10
12
Con
cent
ratio
n, m
g/kg
Type of honey
Zn
0.0
0.2
0.4
0.6
0.8
1.0
1.2
1.4
Con
cent
ratio
n, m
g/kg
Type of honey
Al
0.0
0.2
0.4
0.6
0.8
1.0
1.2
Con
cent
ratio
n, m
g/kg
Type of honey
Cu
0.00
0.02
0.04
0.06
0.08
0.10
0.12
Con
cent
ratio
n, m
g/kg
Type of honey
Ni
1 – Polyfloral2 – Heather / forest blossom3 – Rape / spring blossom4 – Buckwheat / clover
1 2 3 4 5 6 7 1 2 3 4 5 6 7
1 2 3 4 5 6 7 1 2 3 4 5 6 7
5 – Linden6 – Meadows blossom7 – Honey mixtures
Figure 3.26. Concentration of Zn, Al, Cu and ni in honey samples of different botanical origin

90
(pisani et al., 2008). Lead is an element which in long term can easily accumulate in living organisms and may cause serious adverse effects (Kabata-pendias and mukherjee, 2007), therefore, its presence in foodstuffs should be kept under regular control.
in many samples chromium was detected below the detection limit (<0.02 mg/kg) therefore it was not possible to make a box-whisker plot for this element. however, in ones sample of meadows blossom honey cr was found 0.31 mg/kg and in one linden hon-ey sample 0.18 mg/kg, that might be resulted from traffic pollution taking into account the site-specific conditions or geographical origin of these samples. other studies reveal that cr might be found up to 0.09 mg/kg in polyfloral honey and up to 0.11 mg/kg in acacia honey in hungary (ajtony et al., 2007) as well as 0.005-0.093 mg/kg in rape honey in poland (chudzinska and Baralkiewicz, 2010). cr contamination can be connected with pollution created by anthropogenic activities.
The lowest concentration of co was detected in linden honey but the highest varia-bility for the heather / forest blossom (0.005-0.013 mg/kg) honey and meadows blossom honey (0.006-0.013 mg/kg) while the highest mean was detected for manufactured honey mixtures.
The widest range of cd concentration was observed for polyfloral honey while the highest mean value refers to commercially manufactured honey mixtures (0.006 mg/kg). in the group of polyfloral honey some outlier values were detected with concentration of
Figure 3.27. Concentration of Pb, Co, Cd and As in honey samples of different botanical origin
0.00
0.02
0.04
0.06
0.08
0.10
0.12
Con
cent
ratio
n, m
g/kg
Type of honey
Pb
0.0000.0010.0020.0030.0040.0050.0060.0070.0080.0090.010
Con
cent
ratio
n, m
g/kg
Type of honey
Cd
0.000
0.002
0.004
0.006
0.008
0.010
0.012
0.014
0.016
Con
cent
ratio
n, m
g/kg
Type of honey
Co
0
0.001
0.002
0.003
0.004
0.005
0.006
0.007
Con
cent
ratio
n, m
g/kg
Type of honey
As
1 – Polyfloral2 – Heather / forest blossom3 – Rape / spring blossom4 – Buckwheat / clover
5 – Linden6 – Meadows blossom7 – Honey mixtures
1 2 3 4 5 6 7
1 2 3 4 5 6 7 1 2 3 4 5 6 7
1 2 3 4 5 6 7

91
cd 0.027 mg/kg and 0.012 mg/kg. other studies show that concentration of cd in honey can be detected in higher levels, e.g., for rape honey up to 0.082 mg/kg and for buckwheat honey 0.003-0.030 mg/kg in poland (chudzinska and Baralkiewicz, 2010).
Wide variability of arsenic concentration was detected for heather / forest blossom honey, followed by linden and polyfloral honey groups. The highest mean concentration refer to linden honey and heather / forest blossom honey (0.003 mg/kg). arsenic has been quantified in acacia honey up to 0.013 mg/kg and up to 0.006 mg/kg in polyfloral honey in hungary (ajtony et al., 2007) and 0.0046-0.0055 mg/kg in clover honey and 0.0028-0.0111 mg/kg in polyfloral honey in italy (pisani et al., 2008).
impact of botanical origin on the content of potentially toxic metals in honey is obvi-ous. overall average concentration was detected lower than in similar studies worldwide; however, due to appearance of outliers significant contamination risks remain in some cases. taking into account mean values of quantified potentially toxic metals possible honey contamination by honey type can be ranged as follows (from higher to lower ele-ment content): commercially manufactured honey mixtures with unknown botanical or-igin >heather / forest blossom honey >polyfloral honey >meadows blossom honey >lin-den honey >buckwheat / clover honey >rape / spring blossom honey.
according to detected variability between the groups of honey samples and quanti-fied elements, impact of botanical origin on element content in honey can be connected with the growing conditions of the floral plant species. for example, some elements were detected in higher levels in linden honey (pb and as) and it is known that linden trees are widely grown in urban areas or near the traffic lines that can be a source of element contamination. agricultural activities and use of agrochemicals and fertilizers also can become a source of contaminants for some types of honey such as rape honey or buck-wheat honey.
honey storage and processing equipment can be assessed as one of the honey contam-ination ways, especially for such elements as al, cu and Zn. This fact can be attributed to commercially manufactured honey mixtures that might be processes with inappropriate equipment.
3.3.4. Impact of processing or agricultural practice on the concentration of elements in food
Root vegetables. Knowing origin and applied agricultural practice in growth of root vegetable samples onions and carrots, it was possible to detect differences in element concentration for vegetables grown under the different agricultural conditions. statistical analysis of the data by using fisher’s criteria and appropriate t-tests allowed comparison of vegetable samples grown in different agricultural conditions, i.e., divided by subgroups of samples grown in farmlands versus samples grown in allotment gardens.
regarding the analysis of onion bulbs, significant differences between the mentioned subgroups were detected for several microelements. sr, ni, cd, se and co were the el-ements the amounts of which were significantly higher in onions grown in farmlands, while rb was the only single element which was detected in higher amounts in onions grown in allotment gardens. But the analysis of subgroups of carrots revealed a significant difference only for the three microelements: carrot samples grown in allotment gardens

92
were significantly richer in Zn, mn and rb. These coherences support the fact that farm-lands are more likely influenced by possible contamination sources, mainly such as agro-chemical impact that can result in increased amounts of potentially toxic metals in vege-tables, but the microelement analysis of vegetables grown in rural allotment gardens may reveal possible influence of geochemical background.
an assessment of major element content in root vegetables was performed to draw a comparison between the samples of species grown in allotment gardens versus the sam-ples of species grown in farmlands. taking into account the comparison of variances by fisher’s criteria and the results of performed appropriate t-tests for samples of onion bulbs, only the content of sodium was significantly different in selected subgroups. The mean score for the subgroup of samples grown in farmlands (M=186.59, ns=17) was sig-nificantly higher than the scores for the subgroup of samples grown in allotment gardens (M=87.55, ns=13) using the two-sample t-test for unequal variances (p=0.04). The data of the major element content of carrot roots revealed significant differences for two ma-jor elements between subgroups: content of K (M=1641.64, ns=12) and mg (M=31643.9, ns=12) in the subgroup of samples grown in allotment gardens was significantly high-er than in the subgroup of samples grown in farmlands where the mean scores for mg (M=1180.9, ns=18) and for K were M=25302.9, ns=18 detected by t-tests for unequal variances and t-test for equal variances, respectively. results of statistical data analysis confirm the hypothesis that element uptake during plant development is to a great ex-tent dependent on botanical properties of species as it is also revealed in related stud-ies (Kabata-pendias, 2004).
in overall, comparison of selected subgroups of vegetable samples grown in farmlands versus samples grown in allotment gardens revealed that amounts of several elements (cd, co, na, ni, se, sr) were significantly higher in the subgroup of onion samples grown in farmlands while the same samples contain significantly less amount of rb. for carrots significantly higher amounts of some elements (K, mg, mn, rb, Zn) are contained in samples from allotment gardens. farmlands can be affected by agricultural activities such as the use of fertilizers and pesticides much more intensively than allotment gardens, while private allotment gardens most frequently are small and located close to the road-sides and urban areas as well as can be situated within cities and towns near industrial territories or on recultivated contaminated lands that can negatively influence air, soil and water conditions in gardens. subsequently, a risk of food plant contamination by potentially harmful chemicals, e.g., potentially toxic metals can be posed in both cases. however, onion and carrot samples within the current study were collected mainly in rural areas. Therefore, the influence of industry or heavy traffic on vegetables grown in al-lotment gardens cannot be reliably assessed. differences between selected subgroups may arise as well as entailed by natural geochemical background peculiarities as from use of soil fertilizers that can influence content of major elements or use of pesticides regarding some trace elements. Therefore further studies are needed and certain regional geochem-ical background of the origin place of samples should be taken into account within the assessment.
Cottage cheese. as the provenance of the cottage cheese samples was established at the moment of purchasing it was enough easy to compare content of micro- and macro-elements in cottage cheese produced by individual dairy farms with those obtained from
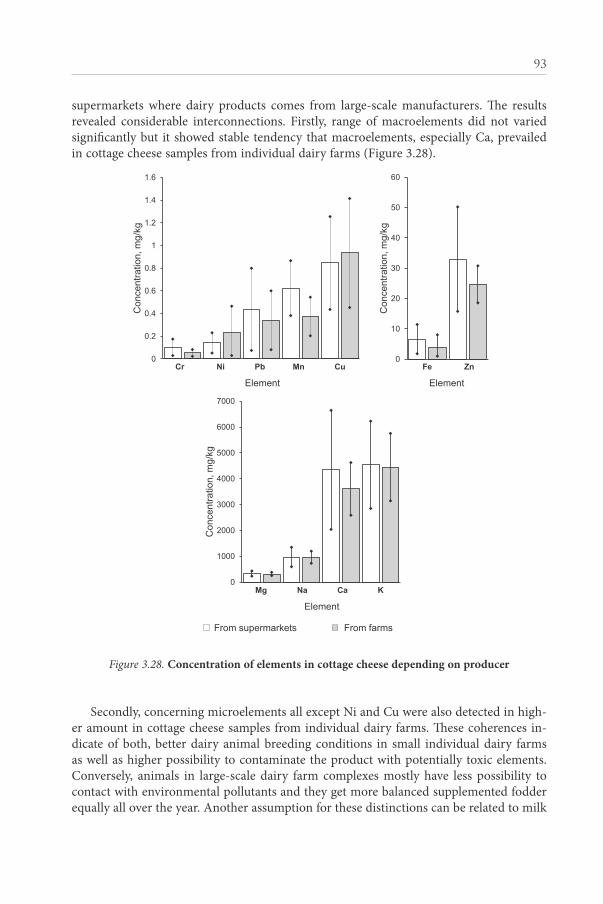
93
supermarkets where dairy products comes from large-scale manufacturers. The results revealed considerable interconnections. firstly, range of macroelements did not varied significantly but it showed stable tendency that macroelements, especially ca, prevailed in cottage cheese samples from individual dairy farms (figure 3.28).
0
0.2
0.4
0.6
0.8
1
1.2
1.4
1.6
Cr Ni Pb Mn Cu
Con
cent
ratio
n, m
g/kg
0
10
20
30
40
50
60
Fe Zn
Con
cent
ratio
n, m
g/kg
Element
Cr Ni Pb Mn Cu Fe Zn
Element
From supermarkets From farms
0
1000
2000
3000
4000
5000
6000
7000
Mg Na Ca K
Con
cent
ratio
n, m
g/kg
Mg Na Ca K
Element
Figure 3.28. Concentration of elements in cottage cheese depending on producer
secondly, concerning microelements all except ni and cu were also detected in high-er amount in cottage cheese samples from individual dairy farms. These coherences in-dicate of both, better dairy animal breeding conditions in small individual dairy farms as well as higher possibility to contaminate the product with potentially toxic elements. conversely, animals in large-scale dairy farm complexes mostly have less possibility to contact with environmental pollutants and they get more balanced supplemented fodder equally all over the year. another assumption for these distinctions can be related to milk
94
processing equipment and manufacturing practice asset while in large-scale farms cottage cheese production process is organized in more closed processing chains by applying au-tomation which allows to avoid an unexpected contamination.
comparison between element concentration in milk and cottage cheese (table 3.22.) revealed impact of processing.
Table 3.22Comparison of average concentration of micro- and macroelements in milk
(after cashman, 2006) and cottage cheese (data from current study)
elementconcentration, mg/kg* or mg/L**cottage cheese* milk**
ca 4120 1120cr 0.090 0.002cu 0.87 0.09fe 5.88 0.50K 4510 1360
mg 330 110mn 0.56 0.03na 970 530ni 0.180 0.026pb 0.41 -Zn 30.52 3.90
data discovered about threefold distinctions between average macroelement content for ca, K and mg in favour of cottage cheese. such differences can be associated mostly with the impact of milk fermentation and cottage cheese manufacturing peculiarities. But this assumption could be verified only if the whole process of cottage cheese making would be investigated step by step according to quantitative analysis of intermediate products. Unlike the determined content of macroelements elevated levels of microelements in cottage cheese can be explained by possible contamination during milk collection and transport, and contamination during production by technical equipment used which may contain details made from heavy metals and their alloys. it can be assumed that also impact of site-specif-ic environmental conditions is of a great importance for microelement appearance in final product. dairy animal breeding under outdoor conditions, as it is typical for small individ-ual dairy farms, can result in excess of contamination with heavy metals.
Hen eggs. Quantitative analysis of hen egg samples from different poultry housing types in Latvia (figure 3.16.) was done to reveal the impact of agricultural practice on element concentration in eggs. The highest content was detected for fe, Zn, cu and mn in egg samples from organic farms (figure 3.29). also pb concentration was detected the highest in egg samples from organic farms. other elements were detected in lower concentration. in addition, pb was not detected in any of egg samples derived from large-scale poultry farms.
in all cases the highest mean values of elements were determined for egg samples de-rived from organic farms, while element content of eggs from domestic farms and poultry

95
farms was lower and relatively similar. as it is known that organic farming is strictly con-trolled and use of chemicals is restricted within this agricultural practice (ec regulation 889, 2008), the results detected in the present study could not be associated with possible avian feed pollution of agricultural or veterinary chemicals, but might be connected with the impact of environmental conditions on element content of egg samples, likely in rela-tion to potential environmental contaminants (e.g., cu, pb, Zn).
although organic farming is known as more clean and healthy food production than conventional farming, obtained results within the present study regarding microelement concentration in hen eggs were not in favour with this common assumption.
The differences among the hen eggs derived in different housing systems have been detected also in previous studies. for example, it has been discovered that hen eggs de-rived from poultry farms equipped with cage systems may have lower nutritional val-ue and inferior taste compared to eggs from domestic farms and organic farms. feed, mineral supplements and water composition as well as impact of environmental condi-tions such as indoor and outdoor conditions are assessed as the main influencing factors (dobrzanski et al., 2007; Giannenas et al., 2009; Kucukyilmaz et al., 2012) that may lead
Figure 3.29.
0
10
20
30
40
50
60
70
80
Organicfarms
Domesticfarms
Poultryfarms
Con
cent
ratio
n, m
g/kg
Sample origin
Fe
0
10
20
30
40
50
60
Organicfarms
Domesticfarms
Poultryfarms
Con
cent
ratio
n, m
g/kg
Sample origin
Zn
0
1
2
3
4
5
6
7
8
9
Organicfarms
Domesticfarms
Poultryfarms
Con
cent
ratio
n, m
g/kg
Sample origin
Cu
0.0
0.5
1.0
1.5
2.0
2.5
3.0
Organicfarms
Domesticfarms
Poultryfarms
Con
cent
ratio
n, m
g/kg
Sample origin
Mn
0.0
0.1
0.2
0.3
0.4
0.5
0.6
Organicfarms
Domesticfarms
Poultryfarms
Con
cent
ratio
n, m
g/kg
Sample origin
Pb
0.000.050.100.150.200.250.300.350.400.450.50
Organicfarms
Domesticfarms
Poultryfarms
Con
cent
ratio
n, m
g/kg
Sample origin
Se
Kopsavilkumā - Figure 3.4.
Salikt blakus pa 2, trīs rindās: Fe & Zn Cu & Mn Pb & Se
Figure 3.29. Concentration of Fe, Zn, Cu, Mn, Pb and Se detected in hen egg samples from different poultry housing types
Figure 3.29.
0
10
20
30
40
50
60
70
80
Organicfarms
Domesticfarms
Poultryfarms
Con
cent
ratio
n, m
g/kg
Sample origin
Fe
0
10
20
30
40
50
60
Organicfarms
Domesticfarms
Poultryfarms
Con
cent
ratio
n, m
g/kg
Sample origin
Zn
0
1
2
3
4
5
6
7
8
9
Organicfarms
Domesticfarms
Poultryfarms
Con
cent
ratio
n, m
g/kg
Sample origin
Cu
0.0
0.5
1.0
1.5
2.0
2.5
3.0
Organicfarms
Domesticfarms
Poultryfarms
Con
cent
ratio
n, m
g/kg
Sample origin
Mn
0.0
0.1
0.2
0.3
0.4
0.5
0.6
Organicfarms
Domesticfarms
Poultryfarms
Con
cent
ratio
n, m
g/kg
Sample origin
Pb
0.000.050.100.150.200.250.300.350.400.450.50
Organicfarms
Domesticfarms
Poultryfarms
Con
cent
ratio
n, m
g/kg
Sample origin
Se
Kopsavilkumā - Figure 3.4.
Salikt blakus pa 2, trīs rindās: Fe & Zn Cu & Mn Pb & Se

96
to food chain contamination with potentially toxic elements. p.s. holt with colleagues (2011) mentioned that hen eggs of free-range housing systems may become contaminat-ed also through veterinary medicine that is given to protect hens against diseases and parasites.
comparison of macroelement concentration revealed tendency that higher concen-tration are detectable in egg samples from organic farms (figure 3.30). only for na and mg mean values were higher for samples from poultry farms that can be associated in lower quality feed containing higher content of common salt.
0
5000
10000
15000
20000
25000
30000
Organicfarms
Domesticfarms
Poultryfarms
Con
cent
ratio
n, m
g/kg
Sample origin
S
0
2000
4000
6000
8000
10000
12000
14000
16000
18000
Organicfarms
Domesticfarms
Poultryfarms
Con
cent
ratio
n, m
g/kg
Sample origin
P
0200400600800
100012001400160018002000
Organicfarms
Domesticfarms
Poultryfarms
Con
cent
ratio
n, m
g/kg
Sample origin
Ca
1000
1100
1200
1300
1400
1500
1600
1700
Organicfarms
Domesticfarms
Poultryfarms
Con
cent
ratio
n, m
g/kg
Sample origin
Na
1000
1100
1200
1300
1400
1500
1600
1700
Organicfarms
Domesticfarms
Poultryfarms
Con
cent
ratio
n, m
g/kg
Sample origin
Mg
0500
100015002000250030003500400045005000
Organicfarms
Domesticfarms
Poultryfarms
Con
cent
ratio
n, m
g/kg
Sample origin
K
0
5000
10000
15000
20000
25000
30000
Organicfarms
Domesticfarms
Poultryfarms
Con
cent
ratio
n, m
g/kg
Sample origin
S
0
2000
4000
6000
8000
10000
12000
14000
16000
18000
Organicfarms
Domesticfarms
Poultryfarms
Con
cent
ratio
n, m
g/kg
Sample origin
P
0200400600800
100012001400160018002000
Organicfarms
Domesticfarms
Poultryfarms
Con
cent
ratio
n, m
g/kg
Sample origin
Ca
1000
1100
1200
1300
1400
1500
1600
1700
Organicfarms
Domesticfarms
Poultryfarms
Con
cent
ratio
n, m
g/kg
Sample origin
Na
1000
1100
1200
1300
1400
1500
1600
1700
Organicfarms
Domesticfarms
Poultryfarms
Con
cent
ratio
n, m
g/kg
Sample origin
Mg
0500
100015002000250030003500400045005000
Organicfarms
Domesticfarms
Poultryfarms
Con
cent
ratio
n, m
g/kg
Sample origin
K
Figure 3.30. Concentration of S, P, K, Ca, na and Mg detected in hen egg samples from different poultry housing types
The highest values and most variable range of concentration of microelements were determined for egg samples derived from organic farms, while egg samples from domes-tic farms and large-scale poultry farms mostly contained lower content of elements. That can be attributed not only to poultry feed specifics within different housing types but also to the impact of environmental conditions such as indoor and outdoor conditions. such environmental contaminant as pb was not detected in egg samples from large-scale poultry farms where hen breeding is not affected by outdoor conditions. in general, the

97
results confirmed the importance of the analysis of food composition that should be im-plemented by taking into account specific conditions of food production and applied agricultural practice.
3.4. Assessment of element bioavailability
Bioavailability of elements in food chain segments soil-plant and plant-human from food of plant origin is a complex system involving complicated biochemical processes and transfer reactions that are dependent on biogeochemical behaviour of corresponding element, plant physiology and soil properties as well as are influenced by environmen-tal conditions. sequestration, soil weathering, ph, oxidation-reduction potential are just some attributes that are of importance (alexander et al., 2006; chojancka et al., 2005; Kabata-pendias, 2004). in this chapter the results of experimental growing of food crops in contaminated soil and speciation analysis of soil and lettuce samples are discussed.
3.4.1. Characteristics of soil samplesaccumulation of metallic elements and metalloids in plants can be affected by soil
properties such as ph, cation exchange capacity, content of organic matter and the tex-ture of soil (malandrino et al., 2011; salazar et al., 2012; Walker et al., 2003; Xu et al., 2013; Zheng et al., 2007). Within the present study five soil samples were used to evaluate soil contamination effect. soil contamination, analysis and the experiment of food crop growth was done in a way described in details under the chapter Materials and Methods. The analysis of soil samples involved determination of soil type and texture, ph (phh2o and phKcl), content of humic substances, cation base saturation, total element content in soil prior contamination, and detection of element concentration in soil samples after spiking.
a) Soil type and texture of mineral soil samples was primary detected in field condi-tions (fao, 2006; pansu and Gautheyrou, 2006) and then approved by laboratory meth-ods as pipetting and wet sieving (van reeuwijk, 1995). at the beginning soil type and texture was identified in the field conditions as follows: 1 sample of fen peat soil and 4 samples of sod-podzolic soil (with higher or lower content of organic matter and clay content) (Kārkliņš u.c., 2009; nikodemus, 2011), but precise soil type was identified at the laboratory: s1 – fen peat soil; s2 – sod-podzolic soil / sandy loam; s3 – sod-podzolic soil / sand; s4 – sod-podzolic soil / loamy sand; s5 – sod-podzolic soil / sandy clay loam (fao, 2006; Kārkliņš u.c., 2009; regulation 804, 2005). characteristic soil texture of ana-lysed mineral soil samples is shown in figure 3.31).
b) Soil pH value can be considered as one of the most significant influencing factors affecting element mobility and total bioavailability (alloway et al., 2004). The highest ph value was detected for fen peat soil s1, but the lowest value for sod-podzolic / sandy clay loam soil s5, respectively, phh2o 5.31 and 4.61 in water solution and phKcl 5.06 and 4.11 in Kcl solution (table 3.23).
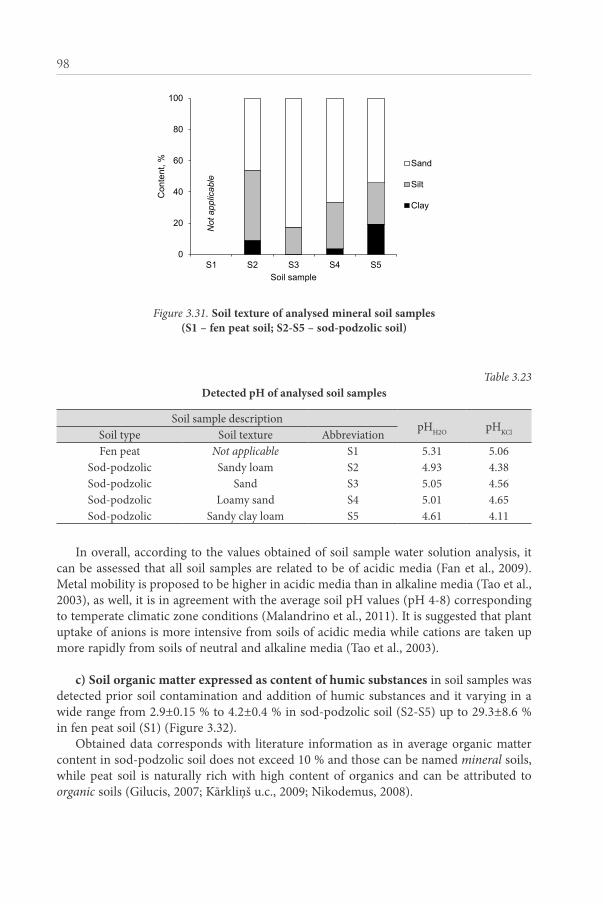
98
Table 3.23 Detected pH of analysed soil samples
soil sample descriptionphh2o phKclsoil type soil texture abbreviation
fen peat Not applicable s1 5.31 5.06sod-podzolic sandy loam s2 4.93 4.38sod-podzolic sand s3 5.05 4.56sod-podzolic Loamy sand s4 5.01 4.65sod-podzolic sandy clay loam s5 4.61 4.11
in overall, according to the values obtained of soil sample water solution analysis, it can be assessed that all soil samples are related to be of acidic media (fan et al., 2009). metal mobility is proposed to be higher in acidic media than in alkaline media (tao et al., 2003), as well, it is in agreement with the average soil ph values (ph 4-8) corresponding to temperate climatic zone conditions (malandrino et al., 2011). it is suggested that plant uptake of anions is more intensive from soils of acidic media while cations are taken up more rapidly from soils of neutral and alkaline media (tao et al., 2003).
c) Soil organic matter expressed as content of humic substances in soil samples was detected prior soil contamination and addition of humic substances and it varying in a wide range from 2.9±0.15 % to 4.2±0.4 % in sod-podzolic soil (s2-s5) up to 29.3±8.6 % in fen peat soil (s1) (figure 3.32).
obtained data corresponds with literature information as in average organic matter content in sod-podzolic soil does not exceed 10 % and those can be named mineral soils, while peat soil is naturally rich with high content of organics and can be attributed to organic soils (Gilucis, 2007; Kārkliņš u.c., 2009; nikodemus, 2008).
Figure 3.31.
Not
app
licab
le
0
20
40
60
80
100
S1 S2 S3 S4 S5
Con
tent
, %
Soil sample
Sand
Silt
Clay
Figure 3.31. Soil texture of analysed mineral soil samples (S1 – fen peat soil; S2-S5 – sod-podzolic soil)
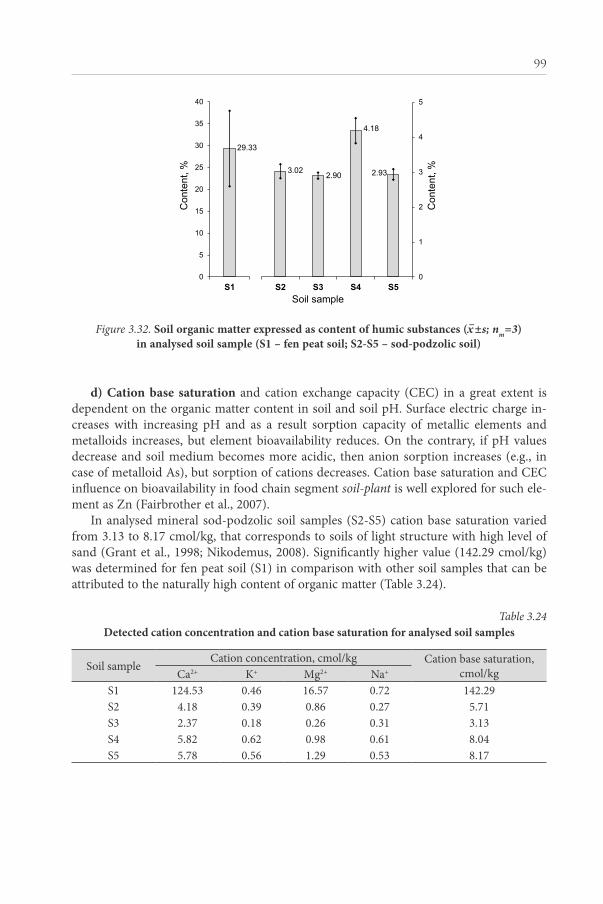
99
d) Cation base saturation and cation exchange capacity (cec) in a great extent is dependent on the organic matter content in soil and soil ph. surface electric charge in-creases with increasing ph and as a result sorption capacity of metallic elements and metalloids increases, but element bioavailability reduces. on the contrary, if ph values decrease and soil medium becomes more acidic, then anion sorption increases (e.g., in case of metalloid as), but sorption of cations decreases. cation base saturation and cec influence on bioavailability in food chain segment soil-plant is well explored for such ele-ment as Zn (fairbrother et al., 2007).
in analysed mineral sod-podzolic soil samples (s2-s5) cation base saturation varied from 3.13 to 8.17 cmol/kg, that corresponds to soils of light structure with high level of sand (Grant et al., 1998; nikodemus, 2008). significantly higher value (142.29 cmol/kg) was determined for fen peat soil (s1) in comparison with other soil samples that can be attributed to the naturally high content of organic matter (table 3.24).
Table 3.24Detected cation concentration and cation base saturation for analysed soil samples
soil samplecation concentration, cmol/kg cation base saturation,
cmol/kgca2+ K+ mg2+ na+
s1 124.53 0.46 16.57 0.72 142.29s2 4.18 0.39 0.86 0.27 5.71s3 2.37 0.18 0.26 0.31 3.13s4 5.82 0.62 0.98 0.61 8.04s5 5.78 0.56 1.29 0.53 8.17
Figure 3.32. Soil organic matter expressed as content of humic substances (x–±s; nm=3) in analysed soil sample (S1 – fen peat soil; S2-S5 – sod-podzolic soil)
Figure 3.32.
0
5
10
15
20
25
30
35
40
S1
3.02 2.90
4.18
2.93
0
1
2
3
4
5
S2 S3 S4 S5
Con
tent
, %
Con
tent
, %
Soil sample
29.33

100
although it is known that ph influences cation base saturation values, in the current study weak correlation (r<0.5) between these parameters was detected.
The value of cation base saturation and cec can be used for soil fertility description, as it is stated that soils with high fertility contain calcium 60-80 % from total cec and other cations 20-50 % (hodges, s.a.). detected values revealed that ca2+ content varies from 71 % of cation base saturation for sod-podzolic soil / sandy clay loam s5 to 88 % of cation base saturation for fen peat soil s1 (figure 3.33).
Figure 3.33.
12
27 24 28 29
88 73 76 72 71
0
20
40
60
80
100
S1 S2 S3 S4 S5
Con
tent
, %
Soil sample
Ca2+
Na2+,Mg2+,K2+
K+ Mg2+ Na+
Ca2+
Figure 3.33. Ratio of cation content (Ca2+ versus sum of K+, Mg2+ and na+) in analysed soil samples (S1 – fen peat soil; S2-S5 – sod-podzolic soil)
Thereof it can be assessed that selected soil samples belong to soils of high fertility and are applicable for crop cultivation, including experimental growth of crops.
e) total element content of soil samples was measured prior the soil contamina-tion procedure with the aim to detect natural geochemical background levels of elements. results revealed that in fen peat soil s1 the highest concentration of such elements as ca, cd, cu, fe, ni and pb were detectable (table 3.25.) that corresponds to assumption that some element associations in soil are tightly connected with the organic matter content (Gilucis, 2007). highest concentration of mn and Zn was detected for sod-podzolic soils s4 and s5.
sod-podzolic soil / sandy clay loam s5 contained significantly higher concentration of cr, ni and pb that can be associated with stronger sorption of elements on clay parti-cles, as this soil sample was most rich in clay (Gilucis, 2007). strong positive correlation (r>0.8) was detected for such element pairs as Zn with ca, co, cr, fe, K, ni, mg; K with cu, pb; ca with co, mn.
f) element concentration in soil samples after contamination procedure. Before crop growing experiment soils were contaminated with substances containing metallic elements as it was described in details previously in chapter Materials and Methods.

101
measurements of actual concentration of cu in soil samples after the contamination with copper sulphate pentahydrate cuso4×5h2o solution at target contamination con-centration of cu 40, 70, 100, 130 and 200 mg/kg revealed tendency of hyperaccumulation in case of fen peat soil s1 (table 3.26.) at all cu target concentrations. slight hyperaccu-mulation of cu was observed also for sod-podzolic soil / sandy clay loam s5 that contains higher amount of clay.
Table 3.26Concentration of Cu in soil samples after contamination with CuSo4 at different target
Cu concentration
elementtarget
concentration of cu, mg/kg
actual concentration (x–±s; nm=3) of cu in soil sample, mg/kg
s1 s2 s3 s4 s5
cu
40 138±1 49±3 44±2 53±2 60±270 220±12 70±2 71±4 86±8 77±1
100 298 ±3 95±1 100±8 116±5 118±5130 408±24 137±4 126±4 150±12 243±50200 654±1 195±1 205±3 218±1 224±2
also after soil sample contamination with mixture of compounds containing metallic elements cd, cu, pb and Zn, hyperaccumulation was obvious for fen peat soil s1. on the contrary, lowest concentration of elements was detected in sod-podzolic soil / sandy loam s2 and sod-podzolic soil / sand s3 (table 3.27).
Table 3.25 Concentration of elements in studied soil samples prior contamination
elementsoil sample
s1 s2 s3 s4 s5element concentration (x–±s; nm=3), g/kg
ca 24.88±0.24 0.98±0.03 0.60±0.03 1.18±0.09 1.03±0.07fe 20.60±0.22 10.94±0.62 3.50±0.24 5.25±0.17 14.21±0.54K 0.89±0.02 1.87±0.09 0.52±0.06 0.84±0.02 2.12±0.15
mg 1.93±0.08 1.83±0.08 0.61±0.02 0.97±0.03 2.36±0.11element concentration (x–±s; nm=3), mg/kg
cd 0.45±0.05 0.10±0.01 0.11±0.10 0.17±0.08 0.08±0.02co 3.49±0.75 4.45±0.15 1.58±0.03 2.60±0.20 6.74±0.65cr 15.79±0.89 15.32±0.11 5.10±0.14 6.46±0.23 19.45±1.07cu 13.96±2.27 6.77±0.25 2.32±0.21 10.30±0.56 8.24±0.32na 66.1±13.2 61.0±34.6 38.3±18.7 57.0±15.6 56.9±15.1ni 10.42±2.16 8.20±0.39 2.81±0.27 4.07±0.35 10.66±0.44mn 241.7±16.6 194.1±7.0 117.8±10.7 395.7±26.1 401.0±31.6pb 14.66±3.16 6.29±1.35 3.22±1.70 5.86±1.49 8.73±0.78Zn 28.67±6.39 27.57±2.61 16.46±0.55 60.50±2.97 35.36±0.84
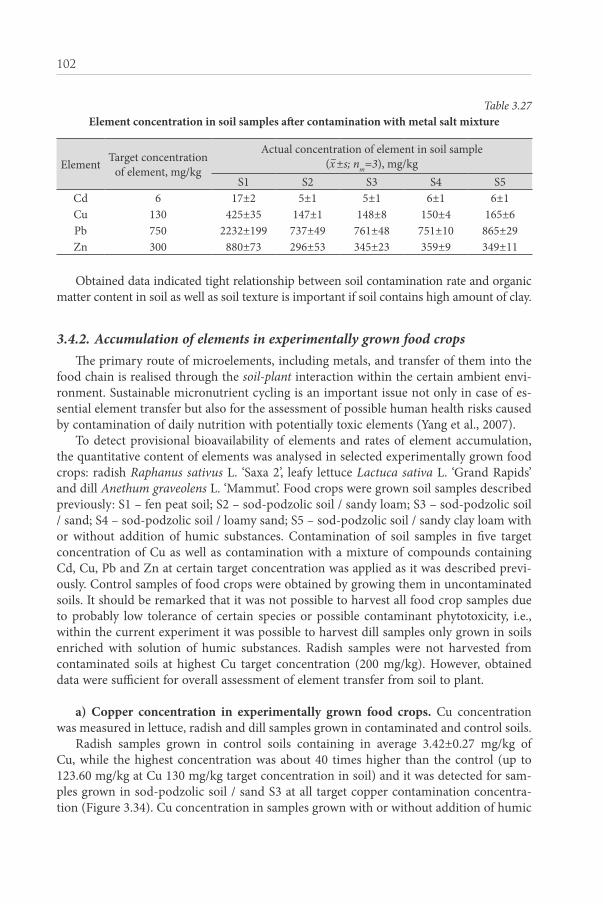
102
Table 3.27element concentration in soil samples after contamination with metal salt mixture
element target concentration of element, mg/kg
actual concentration of element in soil sample (x–±s; nm=3), mg/kg
s1 s2 s3 s4 s5cd 6 17±2 5±1 5±1 6±1 6±1cu 130 425±35 147±1 148±8 150±4 165±6pb 750 2232±199 737±49 761±48 751±10 865±29Zn 300 880±73 296±53 345±23 359±9 349±11
obtained data indicated tight relationship between soil contamination rate and organic matter content in soil as well as soil texture is important if soil contains high amount of clay.
3.4.2. Accumulation of elements in experimentally grown food cropsThe primary route of microelements, including metals, and transfer of them into the
food chain is realised through the soil-plant interaction within the certain ambient envi-ronment. sustainable micronutrient cycling is an important issue not only in case of es-sential element transfer but also for the assessment of possible human health risks caused by contamination of daily nutrition with potentially toxic elements (yang et al., 2007).
to detect provisional bioavailability of elements and rates of element accumulation, the quantitative content of elements was analysed in selected experimentally grown food crops: radish Raphanus sativus L. ‘saxa 2’, leafy lettuce Lactuca sativa L. ‘Grand rapids’ and dill Anethum graveolens L. ‘mammut’. food crops were grown soil samples described previously: s1 – fen peat soil; s2 – sod-podzolic soil / sandy loam; s3 – sod-podzolic soil / sand; s4 – sod-podzolic soil / loamy sand; s5 – sod-podzolic soil / sandy clay loam with or without addition of humic substances. contamination of soil samples in five target concentration of cu as well as contamination with a mixture of compounds containing cd, cu, pb and Zn at certain target concentration was applied as it was described previ-ously. control samples of food crops were obtained by growing them in uncontaminated soils. it should be remarked that it was not possible to harvest all food crop samples due to probably low tolerance of certain species or possible contaminant phytotoxicity, i.e., within the current experiment it was possible to harvest dill samples only grown in soils enriched with solution of humic substances. radish samples were not harvested from contaminated soils at highest cu target concentration (200 mg/kg). however, obtained data were sufficient for overall assessment of element transfer from soil to plant.
a) Copper concentration in experimentally grown food crops. cu concentration was measured in lettuce, radish and dill samples grown in contaminated and control soils.
radish samples grown in control soils containing in average 3.42±0.27 mg/kg of cu, while the highest concentration was about 40 times higher than the control (up to 123.60 mg/kg at cu 130 mg/kg target concentration in soil) and it was detected for sam-ples grown in sod-podzolic soil / sand s3 at all target copper contamination concentra-tion (figure 3.34). cu concentration in samples grown with or without addition of humic

103
1
10
100
1000
S1 S2 S3 S4 S5
Con
cent
ratio
n, m
g/kg
Soil sample
1
10
100
1000
S1 S2 S3 S4 S5
Con
cent
ratio
n, m
g/kg
Soil sample
1
10
100
1000
S1 S2 S3 S4 S5
Con
cent
ratio
n, m
g/kg
Soil sample
Target
Real
Cu 100
Cu 100 H
Control
1
10
100
1000
S1 S2 S3 S4 S5
Con
cent
ratio
n, m
g/kg
Soil sample
Cu 40 mg/kg
Cu 70 mg/kg
Cu 100 mg/kg
Cu 130 mg/kg
Cu 200 mg/kg
Target contamination concentration ofCu in soil
Achieved concentration of Cu in soilafter contamination
Concentration of Cu in radish samplesgrown in contaminated soil
Concentration of Cu in radish samplesgrown in contaminated soil withaddition of humic substances
Concentration of Cu in radish samplesgrown in uncontaminated control soil
1
10
100
1000
S1 S2 S3 S4 S5
Con
cent
ratio
n, m
g/kg
Soil sample
Figure 3.34. Concentration of Cu in radish samples grown in control and contaminated soils with different target concentration with or without addition of humic substances (S1 – fen
peat soil; S2 – sod-podzolic soil / sandy loam; S3 – sod-podzolic soil / sand; S4 – sod-podzolic soil / loamy sand; S5 – sod-podzolic soil / sandy clay loam)
104
substances differed significantly. if in some cases there were detected cu hyperaccumula-tion in radish samples grown in contaminated soils then in samples grown in soils with enrichment of humic substances cu concentration was detected up to 4 times lower. hyperaccumulation of metals in edible parts of plants can be linked to possible risks for consumers, e.g., high doses of cu in daily nutrition may lead to acute toxicity of human organism (atsdr, s.a.; fraga, 2005). regarding consumers, obtained results of element content in food crops can be considered as worst case as concentration of elements are expressed on dry weight (dW).
The lowest concentration of cu was detected for radish samples grown in fen peat soil s1. it has been described that natural complex forming substances (e.g., humic acids or humic substances) and synthetic solvents (e.g., ethylenediamine tetraacetic acid edta or diethylenetriamine pentaacetic acid dtpa) used as chelators may influence metal ac-cumulation in plants and can be used for metal removal from polluted soils (inaba and takenaka, 2005). however, treatments by humic acids, if compared with synthetic che-lators, in case of copper contamination showed higher potential to reduce copper toxic-ity by involving metal ions in complex compounds in plants (heemsbergen et al., 2010; inaba and takenaka, 2005).
it was not possible to harvest radish samples from soils contaminated with cu at tar-get concentration 200 mg/kg. Burden growth of radish at high contamination of soil can be associated with possible phytotoxic effects as copper is among the metals that induces plant phytotoxicity as 20-100 mg/kg of cu is excessive or toxic concentration for plants depending on species (Kabata-penidas and mukherjee, 2007). phytotoxic effects of cu excess in soils especially affect roots inducing defects in root system, reduced root growth or damage of epidermal cells of plant roots (chojnacka et al., 2005; Guala et al., 2010; Lin et al., 2003).
although lettuce samples grown in control soils contained in average 5.07±0.45 mg/kg that is higher level than detected in radish control samples, in general cu concentra-tion in lettuce samples (figure 3.35) was detected lower than for radish thus approving that element accumulation in roots generally is more intensive than in leaves (alloway et al., 2004). Leafy vegetables such as spinach or lettuce are among the food crops with tendency to accumulate higher amounts of elements than other vegetables (alexander et al., 2006). in a study done by p.d. alexander with colleagues (2006) quite similar re-sults has been obtained for lettuce as in the current research. Lettuce samples of different varieties were grown in soil contaminated with target concentration 130 mg/kg of cu.
copper concentration in lettuce was detected in range 6.73-12.55 mg/kg (control values 4.19-7.07 mg/kg) but no significant differences were statistically detected among different lettuce cultivars.
The lowest copper concentration was found in lettuce samples grown in fen peat soil s1 and sod-podzolic soil / loamy sand s4, soils with naturally higher content of organic matter. The tendency of humic substances to reduce metal content in plants was clearly detectable, e.g., for lettuce samples grown in sod-podzolic soil / sandy loam s2 with target cu 200 mg/kg concentration copper content was about 11 times lower in samples grown in soil enriched with humic substances than without.
as it is reflected in figures, excess of cu uptake by lettuce was observed for samples grown in sod-podzolic soils s2 and s5, which contain higher amounts of clay particles.

105
1
10
100
1000
S1 S2 S3 S4 S5
Con
cent
ratio
n, m
g/kg
Soil sample
Target
Real
Cu 100
Cu 100 H
Kontrole
1
10
100
1000
S1 S2 S3 S4 S5
Con
cent
ratio
n, m
g/kg
Soil sample
1
10
100
1000
S1 S2 S3 S4 S5
Con
cent
ratio
n, m
g/kg
Soil sample
1
10
100
1000
S1 S2 S3 S4 S5
Con
cent
ratio
n, m
g/kg
Soil sample
Cu 40 mg/kg
Cu 70 mg/kg
Cu 100 mg/kg
1
10
100
1000
S1 S2 S3 S4 S5
Con
cent
ratio
n, m
g/kg
Soil sample
Cu 130 mg/kg
Cu 200 mg/kg
Target contamination concentration ofCu in soil
Achieved concentration of Cu in soilafter contamination
Concentration of Cu in lettuce samplesgrown in contaminated soil
Concentration of Cu in lettuce samplesgrown in contaminated soil withaddition of humic substances
Concentration of Cu in lettuce samplesgrown in uncontaminated control soil
Figure 3.35. Concentration of Cu in lettuce samples grown in control and contaminated soils with different target concentration of Cu with or without addition of humic substances
(S1 – fen peat soil; S2 – sod-podzolic soil / sandy loam; S3 – sod-podzolic soil / sand; S4 – sod-podzolic soil / loamy sand; S5 – sod-podzolic soil / sandy clay loam)

106
major part of cu in soils can be found in such chemical compounds that are tended tightly to bind organic substances and other soil colloids, and therefore are not easily accessible for plants (Lin et al., 2003); therefore more active accumulation in soils s2 and s5 in this case is not linked to soil texture of the samples as these soils had higher content of clay which can be a basis for colloid aggregation with trace metals. it is possible that in this case plant uptake of elements from soil is affected by ph because sod-podzolic soils s2 and s5 have slightly lower ph values than other soils.
analysis of dill samples revealed that this is the crop with the lowest tolerance to metal contaminants, especially due to the fact that it was not possible to harvest samples from contaminated soils without addition of humic substances (figure 3.36). dill samples grown in control soils contained in average 4.28±0.35 mg/kg of cu. The highest concen-tration of cu in dill samples was detected mostly for sod-podzolic soil / sand s3, but the lowest for fen peat soil s1, similarly as observed for radish samples. at high contamina-tion levels in soil the uptake of cu by dill plants was more extensive as, for example, in dill samples grown in soils with cu 200 mg/kg target contamination detected cu con-centration was 13-25 times higher than in control dill samples from the same soil types.
b) Cd, Cu, Pb and Zn concentration in experimentally grown food crops. after soil contamination with mixture of compounds containing cd, cu, pb and Zn at different target concentration (respectively, cd 6 mg/kg, cu 130 mg/kg, pb 750 mg/kg and Zn 300 mg/kg) several food crop samples were obtained. multielement contamination nega-tively affected plant growth as not all crop samples were possible to harvest. for example, radish samples were harvested only from contaminated soils with addition of humic sub-stance, but dill sample was obtained only one (from fen peat soil s1). toxic effects in plants can be observed at such concentration of elements: cd 5-30 mg/kg, cu 20-100 mg/kg, pb 30-300 mg/kg and Zn 100-300 mg/kg depending on species tolerance (Kabata-pendias, 2011; Kabata-pendias and mukherjee, 2007), therefore, burdensome growth of crops can be related with possible phytotoxicity of studied microelements. only lettuce samples were resistant to pollution and thus harvesting in all contaminated soil types at all target contaminations was possible.
obtained results revealed different tendencies. it is known that not only cu, as mentioned before, but also such elements as co, cr, hg, ni, pb, sb, se and Zn may be soil contaminants and subsequently may be hyperaccumulated in plant leaves (Wuana and okieimen, 2011). Within the present study, in lettuce samples grown in soils con-taminated with the element salt mixture and with addition of solution of humic sub-stances, obvious hyperaccumulation of Zn, cd and cu was detected for several samples (figure 3.37). for example, in sod-podzolic soil / sand s3 Zn concentration in lettuce reached 4125.43 mg/kg and in sod-podzolic soil / loamy sand s4 4091.06 mg/kg while control samples of lettuce grown in uncontaminated soils contained only 62.50 mg/kg and 79.35 mg/kg, respectively. addition of humic substances into these soils resulted in lower Zn concentration in lettuce 654.48 mg/kg and 597.78 mg/kg, respectively; however, anyway exceeding true Zn concentration detected in soil.
taking into account different target concentration of contaminants, the sequences of analysed metals in plants were detected as follows: Zn >cd >cu >pb, based on mean results.
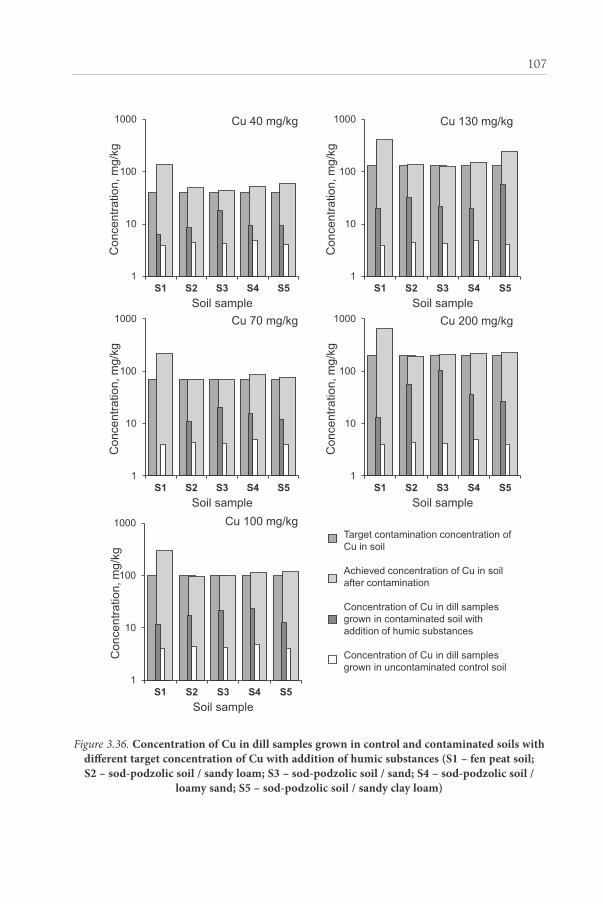
107
Figure 3.36. Concentration of Cu in dill samples grown in control and contaminated soils with different target concentration of Cu with addition of humic substances (S1 – fen peat soil; S2 – sod-podzolic soil / sandy loam; S3 – sod-podzolic soil / sand; S4 – sod-podzolic soil /
loamy sand; S5 – sod-podzolic soil / sandy clay loam)
1
10
100
1000
S1 S2 S3 S4 S5
Con
cent
ratio
n, m
g/kg
Soil sample
1
10
100
1000
S1 S2 S3 S4 S5
Con
cent
ratio
n, m
g/kg
Soil sample
1
10
100
1000
S1 S2 S3 S4 S5
Con
cent
ratio
n, m
g/kg
Soil sample
Target
Real
Cu 100 H
Kontrole
1
10
100
1000
S1 S2 S3 S4 S5
Con
cent
ratio
n, m
g/kg
Soil sample
Cu 40 mg/kg
Cu 70 mg/kg
Cu 100 mg/kg
Cu 130 mg/kg
Cu 200 mg/kg
1
10
100
1000
S1 S2 S3 S4 S5
Con
cent
ratio
n, m
g/kg
Soil sample
Target contamination concentration ofCu in soil
Achieved concentration of Cu in soilafter contamination
Concentration of Cu in dill samplesgrown in contaminated soil withaddition of humic substances
Concentration of Cu in dill samplesgrown in uncontaminated control soil

108
such metals as cd, cu and pb are well known pollutants of environment and agricul-tural soils. element uptake in large amounts can lead to toxic effects in plants and subse-quently in animals and humans. at the same time cu and Zn are essential micronutrients for plants but pb and cd are not involved in biological functions, but can be taken up by plants in different intensity depending on element content in soils and plant species (Zheljazkov et al., 2006).
1
10
100
1000
S1 S2 S3 S4 S5
Con
cent
ratio
n, m
g/kg
Soil sample
1
10
100
1000
10000
S1 S2 S3 S4 S5
Con
cent
ratio
n, m
g/kg
Soil sample
Cu
Zn
1
10
100
S1 S2 S3 S4 S5
Con
cent
ratio
n, m
g/kg
Soil sample
1
10
100
1000
10000
S1 S2 S3 S4 S5
Con
cent
ratio
n, m
g/kg
Soil sample
Pb
Cd
Targetcontaminationconcentration ofelement in soil
Achievedconcentration ofelement in soil aftercontamination
Concentration ofelement in lettucesamples grown incontaminated soil
Concentration ofelement in lettucesamples grown incontaminated soilwith addition ofhumic substances
Figure 3.37. Concentration of Cd, Cu, Pb and Zn in lettuce samples grown in soils contaminated with element salt mixture, with or without addition of humic substances (S1 – fen peat soil; S2 – sod-podzolic soil / sandy loam; S3 – sod-podzolic soil / sand;
S4 – sod-podzolic soil / loamy sand; S5 – sod-podzolic soil / sandy clay loam)

109
radish sample analysis also revealed Zn hyperaccumulation tendency (figure 3.38). highest content of contaminants mostly was detected for radish samples grown in sod-podzolic soils s3 and s5 while samples grown in soils with higher content of organic matter contained relatively lower concentration of elements, e.g., for fen peat soil s1 and sod-podzolic soil / loamy sand s4.
average natural concentration of elements in plants, as it was mentioned in literature, has been estimated as follows: cd 0.01-0.2 mg/kg, cu 5-30 mg/kg, pb 5-10 mg/kg and Zn 25-150 mg/kg (Kabata-pendias, 2011; Kabata-pendias and pendias, 2007). That is in agreement with element concentration in crop samples grown in uncontaminated control soils, e.g., concentration of elements in radish samples was: cd 0.06-0.15 mg/kg, cu 4.54-5.87 mg/kg, pb <1 mg/kg and Zn 4.54-5.78 mg/kg.
1
10
100
1000
S1 S2 S3 S4 S5
Con
cent
ratio
n, m
g/kg
Soil sample
1
10
100
1000
10000
S1 S2 S3 S4 S5
Con
cent
ratio
n, m
g/kg
Soil sample
Cu
Zn
1
10
100
S1 S2 S3 S4 S5
Con
cent
ratio
n, m
g/kg
Soil sample
1
10
100
1000
10000
S1 S2 S3 S4 S5
Con
cent
ratio
n, m
g/kg
Soil sample
Pb
Cd
Targetcontaminationconcentration ofelement in soil
Achievedconcentration ofelement in soil aftercontamination
of element in radishsamples grown in contaminated soilwith addition of humic substances
Concentration
Figure 3.38. Concentration of Cd, Cu, Pb and Zn in radish samples grown in soils contaminated with element salt mixture, with addition of humic substances. (S1 – fen peat
soil; S2 – sod-podzolic soil / sandy loam; S3 – sod-podzolic soil / sand; S4 – sod-podzolic soil / loamy sand; S5 – sod-podzolic soil / sandy clay loam)

110
metal transfer from soil to plants is dependent on various chemical processes such as chelation, absorption and desorption, precipitation and dissolution. Z.L. he with col-leagues (2005) defined that ‘chelation is the process during which trace elements form sta-ble complexes with organic or inorganic ligands’. it is supposed that chelation is the main factor that affects copper accumulation in lettuce grown in soils added with solutions of humic substances. in several studies it was described that characterization of quantitative transfer of metals from soil to plants can be estimated by so called transfer factor (tf) or soil-plant partition coefficient. transfer factor reveals the ratio of contaminant concentra-tion cplant in plants versus contaminant concentration csoil in soil (alexander et al., 2006; chojancka et al., 2005). higher values of transfer factor reflect greater ability of plants to accumulate metal whereas lower values of transfer factor show the intensity of sorption of metal ions to soil colloidal particles (hao et al., 2009). transfer factor can be variable due to several influencing factors; however, a. Kloke with colleagues (1984) have suggested mean transfer factor values for some metals, e.g., 0.01-1.00 for cu and pb, 1-10 for Zn, to be used for the assessment of metal transfer from soil to food and feed plants. calculated values for theoretical transfer factor in this study fall within the suggested mean bound-aries. such soil properties as low ph and low content of organic matter as well as met-al depositions from atmosphere and anthropogenic activities can lead to high values of transfer factor in case of cu in ambient environment (hao et al., 2009; Kloke et al., 1984).
transfer factor calculation was performed for lettuce and radish samples grown in se-lected soils contaminated with compound mixture containing cd, cu, pb and Zn. results revealed the highest tf values for Zn (>10) for lettuce grown in some sod-podzolic soils (s2-s4) without enrichment of humic substances, while significantly lower tf values were detected for lettuce and radish grown in soils with addition of humic substanc-es thus highlighting organic matter importance in element transfer from soil to plants (table 3.28).
Table 3.28transfer factors (tF) for lettuce and radish samples grown in soils contaminated with salt
mixture containing Cd, Cu, Pb and Zn
element food crop
tf in corresponding soil sample without (s) or with (sh) addition of humic substances
s1 s2 s3 s4 s5 s1h s2h s3h s4h s5h
cdLettuce 0.11 1.84 1.52 1.06 0.63 0.09 0.41 0.53 0.35 0.50radish - - - - - 0.06 0.43 0.31 0.18 0.35
cuLettuce 0.02 0.49 1.55 0.82 0.04 0.02 0.11 0.07 0.07 0.08radish - - - - - 0.02 0.18 0.33 0.16 0.06
pbLettuce 0.005 0.28 0.64 0.59 0.03 0.003 0.09 0.07 0.02 0.04radish - - - - - 0.005 0.09 0.16 0.04 0.09
ZnLettuce 0.48 10.47 11.95 11.43 1.51 0.38 1.29 1.90 1.67 1.21radish - - - - - 0.28 3.48 3.31 2.21 2.12
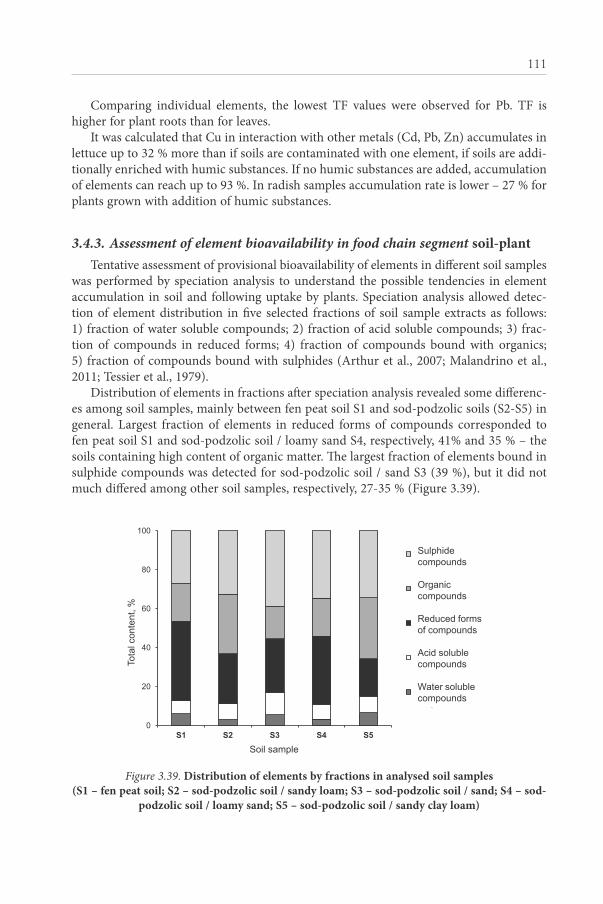
111
comparing individual elements, the lowest tf values were observed for pb. tf is higher for plant roots than for leaves.
it was calculated that cu in interaction with other metals (cd, pb, Zn) accumulates in lettuce up to 32 % more than if soils are contaminated with one element, if soils are addi-tionally enriched with humic substances. if no humic substances are added, accumulation of elements can reach up to 93 %. in radish samples accumulation rate is lower – 27 % for plants grown with addition of humic substances.
3.4.3. Assessment of element bioavailability in food chain segment soil-planttentative assessment of provisional bioavailability of elements in different soil samples
was performed by speciation analysis to understand the possible tendencies in element accumulation in soil and following uptake by plants. speciation analysis allowed detec-tion of element distribution in five selected fractions of soil sample extracts as follows: 1) fraction of water soluble compounds; 2) fraction of acid soluble compounds; 3) frac-tion of compounds in reduced forms; 4) fraction of compounds bound with organics; 5) fraction of compounds bound with sulphides (arthur et al., 2007; malandrino et al., 2011; tessier et al., 1979).
distribution of elements in fractions after speciation analysis revealed some differenc-es among soil samples, mainly between fen peat soil s1 and sod-podzolic soils (s2-s5) in general. Largest fraction of elements in reduced forms of compounds corresponded to fen peat soil s1 and sod-podzolic soil / loamy sand s4, respectively, 41% and 35 % – the soils containing high content of organic matter. The largest fraction of elements bound in sulphide compounds was detected for sod-podzolic soil / sand s3 (39 %), but it did not much differed among other soil samples, respectively, 27-35 % (figure 3.39).
0
20
40
60
80
100
S1 S2 S3 S4 S5
Tota
l con
tent
, %
Soil sample
Sulphidecompounds
Organiccompounds
Reduced forms ofcompounds
Acid solubilecompounds
Water solubilecompounds
Sulphidecompounds
Organiccompounds
Reduced formsof compounds
Acid solublecompounds
Water solublecompounds
Figure 3.39. Distribution of elements by fractions in analysed soil samples (S1 – fen peat soil; S2 – sod-podzolic soil / sandy loam; S3 – sod-podzolic soil / sand; S4 – sod-
podzolic soil / loamy sand; S5 – sod-podzolic soil / sandy clay loam)

112
fraction of water soluble compounds was the smallest (3-7 %) followed by fraction of acid soluble compounds (7-12 %). it suggests that only small amount of total content of elements in soils can be taken up by plants and used in biochemical processes, while the major part of elements are bound in fractions of compounds with significantly lower bioavailability.
it was possible to detect 10 elements (as, cd, co, cu, ni, pb, rb, sr, v and Zn) in soils samples by fractions. distribution of individual elements by fractions among soil samples differed widely. for fen peat soil s1 in fraction of water soluble compounds the highest content was detected for cu, followed by sr, ni and Zn (figure 3.40).
0
20
40
60
80
100
As Cd Co Cu Ni Pb Rb Sr V Zn
Con
tent
, % in
soi
l S1
Element
Sulphidecompounds
Organiccompounds
Reduced forms ofcompounds
Acid solubilecompounds
Water solubilecompounds
Sulphidecompounds
Organiccompounds
Reduced formsof compounds
Acid solublecompounds
Water solublecompounds
Figure 3.40. element distribution by fractions in fen peat soil (S1)
in fraction of acid soluble compounds sr, Zn, ni and co was found in considerable concentration, while such elements as as, pb, rb and v mostly were bound in other frac-tions suggesting their lower bioavailability.
also in sod-podzolic soils (s2-s5) in fraction of water soluble compounds cu was the only element found in considerable concentration. however, for soil s5 (sandy clay loam) also Zn was found in relatively high concentration in form of water soluble compound (figure 3.41).
in sod-podzolic soils (s2-s5) cd and sr were the most abundant elements of the frac-tion of acid soluble compounds, while the greatest part of elements (e.g., as, ni, pb, rb, v, Zn) mostly were bound with sulphides suggesting their low solubility and, respectively, expecting lower rate of bioavailability.
in fraction of water soluble compounds highest rates were attributed to such elements as cu, cr and Zn. d.a. heemsbergen with colleagues (2010) have outlined that cu avai-lability for plants is dependent on speciation of substance applied, i.e., is it salt or not; however, copper solubility can be increased by complex formation with dissolved organic matter but bioavailability in this case can be not changed or even can be reduced.

113
0
20
40
60
80
100
As Cd Co Cu Ni Pb Rb Sr V Zn
Con
tent
, % in
soi
l S2
Element
0
20
40
60
80
100
As Cd Co Cu Ni Pb Rb Sr V Zn
Con
tent
, % in
soi
l S4
Element
0
20
40
60
80
100
As Cd Co Cu Ni Pb Rb Sr V Zn
Con
tent
, % in
soi
l S5
Element
0
20
40
60
80
100
As Cd Co Cu Ni Pb Rb Sr V Zn
Con
tent
, % in
soi
l S3
Element
Sulphidecompounds
Organiccompounds
Reduced formsof compounds
Acid solubilecompounds
Water solubilecompounds
Sulphidecompounds
Organiccompounds
Reduced formsof compounds
Acid solublecompounds
Water solublecompounds
Figure 3.41. element distribution by fractions in sod-podzolic soils (S2-S5)
taking into account values of cd, cu, pb and Zn content, as these there were ele-ments exploited in the soil contamination and crop growing experiment, it can be as-sessed that cu is the element most of all detectable in the fraction of water soluble com-pounds. among these elements, pb can be assessed as the least bioavailable element, as it was found more bound in compounds with low solubility. in the fraction of acid soluble

114
compounds dominant elements were cu and Zn, but bound with organics they were less bioavailable. it suggests that in general Zn and cu are elements which are more bioavaila-ble for plants than cd and pb. This conclusion is well related with the existing knowledge of Zn and cu physiological functions as much as these elements are essential micronutri-ents, while physiological functions of cd and pb are nearly insignificant and their abun-dance naturally is low.
highest levels of elements in grown crops were detected mostly in sod-podzolic soil / sand s3. in comparison with other soils, sod-podzolic soil / sand s3 contained cd in acid soluble forms which bioavailability is dependent on ph. as well in this soil type there was the highest concentration of cu (51 %) that was bound in fraction of water soluble com-pounds. That can explain higher cu uptake by plants from sod-podzolic soil / sand a3.
obtained results reveal that organic matter content in soil can significantly influence element uptake by plants. The lowest element concentration in food crops almost in all cases was detected for plant samples grown in fen peat soil s1. for example, cu content bound in fraction of water soluble compounds in fen peat soil s1, and also in sod-podzol-ic soil / loamy sand a4, where there was naturally higher content of organic substances, was much greater than in the same fraction of sod-podzolic soil / sand s3 with low con-tent of organics.
in overall, it was detected that in soils elements were in the lowest content in fraction of water soluble compounds, but in highest content bound in low soluble compounds that suggests that majority of elements in soils would not be bioavailable for plants.
3.4.4. Assessment of element bioavailability in food chain segment plant-human; the case study with lettuce
element bioavailability in food chain segment plant-human is complicated and affect-ed by different factors including environmental conditions such as natural background of elements in soil and drinking water, chemical characteristics of substance and biochemi-cal conversions within the individual organism. tentative assessment of element bioavail-ability from plants was done by speciation analysis of lettuce samples with the aim to un-derstand the fundamentals of element transfer from environment to food. extraction of elements was done in three fractions: 1) fraction of water soluble compounds; 2) fraction of acid soluble compounds; 3) fraction of compounds in reduced forms. it was possible to detect 12 elements (as, Ba, cd, co, cu, mn, ni, pb, rb, se, sr and Zn).
distribution of elements into selected fractions revealed that greatest part of elements can be found in fraction of water soluble compounds (47 %), following by fraction of re-duced forms of compounds (37 %) and fraction of acid soluble compounds (15 %) which quite differs of element distribution by fractions in soil. also for individual elements, except as, distribution by fractions is similar. arsenic was the element mostly found in fraction of reduced forms of compounds 93 % (figure 3.42), thus suggesting its low bio-availability in food chain.
analysis revealed that in the fraction of water soluble compounds in higher concen-tration (>50 %) were elements such as co, cu, ni, pb, rb and se and this tendency in fa-vour of essential elements, but can lead to increased toxicity of potentially toxic elements. such elements as as, Ba, cd, sr were found in higher concentration in the fraction of
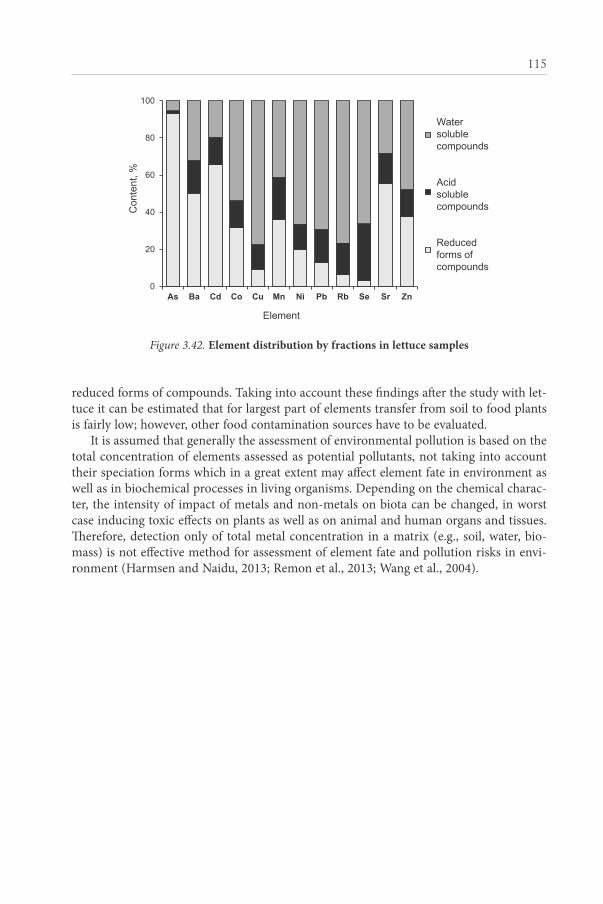
115
reduced forms of compounds. taking into account these findings after the study with let-tuce it can be estimated that for largest part of elements transfer from soil to food plants is fairly low; however, other food contamination sources have to be evaluated.
it is assumed that generally the assessment of environmental pollution is based on the total concentration of elements assessed as potential pollutants, not taking into account their speciation forms which in a great extent may affect element fate in environment as well as in biochemical processes in living organisms. depending on the chemical charac-ter, the intensity of impact of metals and non-metals on biota can be changed, in worst case inducing toxic effects on plants as well as on animal and human organs and tissues. Therefore, detection only of total metal concentration in a matrix (e.g., soil, water, bio-mass) is not effective method for assessment of element fate and pollution risks in envi-ronment (harmsen and naidu, 2013; remon et al., 2013; Wang et al., 2004).
Figure 3.42. element distribution by fractions in lettuce samples
0
20
40
60
80
100
As Ba Cd Co Cu Mn Ni Pb Rb Se Sr Zn
Con
tent
, %
Element
Watersolubilecompounds
Acidsolubilecompounds
Reducedforms ofcompounds
Watersolublecompounds
Acidsolublecompounds
Reducedforms ofcompounds

116
ConCLUSIonS
� obtained results revealed recognizable influence of several factors (impact of sea-sonal, site-specific, botanical origin, applied agricultural practice, processing) on the concentration of elements in analysed food samples but pattern of element transfer is not uniformed and depends on composition of foodstuff or foodstuff group in asso-ciation with environmental conditions within the formation or production process of foodstuff.
� assessment of natural environmental conditions such as seasonality revealed differ-ences in element concentration for analysed food samples of animal origin indicating tight linkage with the agricultural practice applied in production of food. indirectly this impact can be associated also with influence of environmental pollution.
� assessment of anthropogenic impact factors such as applied agricultural practice re-vealed distinctions in the element (e.g., cd, co, na, ni, se) composition among the species of vegetables grown under different agricultural conditions that is linked to various tendencies and intensity in use of agrochemicals and fertilizers; however, it is strongly dependent on the crop species.
� it is important to emphasize detected differences between organically and conven-tionally derived foodstuffs that indicate the impact of element composition from envi-ronment as well as of natural origin such as geochemical background and of anthro-pogenic origin as environmental pollution. conditions of organic food production should be explored for the recognition of possible impact of environmental condi-tions that can affect food composition.
� comparison of element content in edible and non-edible parts of vegetables revealed that several microelements, including potentially toxic elements (e.g., as, co, cr, pb) are tended to remain in peel while other elements (e.g., cd, se, Zn) are taken up by crop tissues and therefore may become food chain contaminants more easily.
� site-specific impact on concentration of elements in food cannot be assessed unam-biguously as detected distribution of elements, e.g., in honey samples, revealed some geographical differences, but strong correlation with characteristic environmental conditions was not identified. The impact of site-specific factors taking into account the environmental specifics of Latvia could be assessed as more relevant; however, further more specific studies should be implemented.
� experiment of element transfer and bioavailability assessment in food chain segment soil-plant ascertained that the uptake and accumulation of metals and metalloids by food crops is significantly affected by soil organic matter content among the other soil properties. soil texture can be assessed as another important factor that can af-fect element transfer from soil to plants as well as the selective ability of plant species to accumulate some chemical elements can be accented. The properties of organic substances to bind heavy metals in stable complexes can be developed as a prospec-tive trend for practical use of application of humic substances on metal contaminated soils, e.g., in agricultural lands.
� assessment of element bioavailability data in food chain revealed that only a small part of elements can be available up the food chain from soil to upper segments soil-plant-human. however, cumulative accumulation can occur if element concentration

117
in the environment is high. it can lead to subsequent risk for humans as consumers on the highest segment of food chain. detected tendencies of element bioavailability dependent on soil composition can be useful tool for risk analysis.
� influence of both natural and anthropogenic environmental conditions may cause food contamination with potentially toxic elements that is the issue of high impor-tance regarding consumers’ safety. Therefore, regional monitoring of food composi-tion is preferable, especially regarding domestic production. in overall, quantitative analysis of food samples revealed the significance of food research within the context of environmental science, chemistry and health sciences, and this investigation has to be developed in the future in larger scale.

118
ACKnoWLeDGeMentS
The research for doctoral thesis was carried out with the financial support of european social fund within the project “support for doctoral studies at University of Latvia”, no. 2009/0138/1dp/1.1.2.1.2./09/ipia/viaa/004.
i would like to express my deep gratitude to professor Dr. habil. chem. maris Klavins, my scientific supervisor, for a given chance to take part in the doctoral studies as well as for his professional guidance and valuable support. my special thanks are extended to all colleagues, students and staff of the faculty of Geography and earth sciences and the faculty of chemistry at the University of Latvia who have contributed to my work on the doctoral thesis. finally, i wish to thank my family for the support and encouragement throughout the time of my studies and research work.

119
ReFeRenCeS
1. abebe, y., Bogale, a., hambidge, K.m., stoecker, B.J., Bailey, K., Gibson, r.s. (2007) phytate, zinc, iron and calcium content of selected raw and prepared foods consumed in rural sidama, southern ethiopia, and implications for bioavailability. Journal of Food Composition & Analysis 20: 161-168.
2. aberoumand, a., deokule, s.s. (2010) elements evaluation of some edible vegetables and fruits of iran and india. Asian Journal of Agricultural Sciences 2(1): 35-37.
3. abrahams, p.W. (2002) soils: Their implications to human health. The Science of the Total Environment 291(1-3): 1-32.
4. acs (2011) Known and probable human carcinogens. american cancer society (acs). accessed at http://www.cancer.org/cancer/cancercauses/othercarcinogens/generalinformation-aboutcarcinogens/known-and-probable-carcinogens on 15.12.2012.
5. ajtony, Z., Bencs, L., haraszi, r., szigeti, J., szoboszlai, n. (2007) study on the simultaneous determination of some essential and toxic trace elements in honey by multi-element graphite furnace atomic absorption spectrometry. Talanta 71: 683-690.
6. alam, m.G.m., snow, e.t., tanaka, a. (2003) arsenic and heavy metal contamination of veg-etables grown in samta village, Bangladesh. The Science of the Total Environment 308: 83-96.
7. aldahan, a., Kekli, a., possnert, G. (2006) distribution and sources of 129i in rivers of the Baltic region. Journal of Environmental Radioactivity 88(1): 49-73.
8. alexander, p.d., alloway, B.J., dourado, a.m. (2006) Genotypic variations in the accumu-lation of cd, cu, pb and Zn exhibited by six commonly grown vegetables. Environmental Pollution 144(3): 736-745.
9. allen, a.G., nemitz, e., shi, J.p., harrison, r.m., Greenwood, J.c. (2001) size distributions of trace metals in atmospheric aerosols in the United Kingdom. Atmospheric Environment 35: 4581-4591.
10. alloway, J., centeno, a., finkelman, B., fuge, r. (2004) Essentials of Medical Geology. Impact of the Natural Environment on Public Health. elsevier academic press: amsterdam, 832 p.
11. alsina, i., dubova, L., smiltina, Z., stroksa, L., duma, m. (2012) The effect of selenium on yield quality of lettuce. Acta Horticulturae 939: 269-276.
12. alvarez, J., marco, L.m., arroyo, J., Greaves, e.d., rivas, r. (2003) determination of calci-um, potassium, manganese, iron, copper and zinc levels in representative samples of two on-ion cultivars using total reflection X-ray fluorescence and ultrasound extraction procedure. Spectrochimica Acta, Part B: Atomic Spectroscopy 58(12): 2183-2189.
13. aras, n.K., ataman, o.y. (2006) Trace Element Analysis of Food and Diet. rsc publishing: cambridge, 344 p.
14. arthur, J.d., fischler, c., dabous, a.a., Budd, d.a., Katz, B.G. (2007) Geochemical and mineralogical characterization of potential aquifer storage and recovery storage zones in the floridan aquifer system, comprehensive everglades restoration plan. Final report. no page numbering.
15. atsdr (s.a.) Toxic substances portal. agency for toxic substances and disease registry (atsdr), United states department of health and human services. accessed at http://www.atsdr.cdc.gov/toxprofiles/index.asp on 16.09.2013.
16. awuah, G.B., ramaswamy, h.s., economides, a. (2007) Thermal processing and quality: principles and overview. Chemical Engineering & Processing: Process Intensification 46(6): 584-602.
17. ayar, a., sert, d., akin, n. (2009) The trace metal levels in milk and dairy products consumed in middle anatolia - turkey. Environmental Monitoring & Assessment 152: 1-12.
120
18. Baltes, v. (1998) Pārtikas ķīmija / Lebensmittelchemie. (4th ed.) [in Latvian] Latvijas Universitāte: rīga, 478 lpp.
19. Basu, m., pande, m., Bhadoria, p.B.s., mahapatra, s.c. (2009) potential fly-ash utilization in agriculture: a global review. Progress in Natural Science 19: 1173-1186.
20. Berdanier, c.d., dwyer, J.t., feldman, e.B. (2007) Handbook of Nutrition and Food. (2nd ed.) crc press: Boca raton, 1288 p.
21. Bibak, a., sturup, s., Gundersen, v. (1998) Levels of 44 Elements in Organically Grown Potatoes (Solanum tuberosum, Sava). riso national Laboratory: roskilde, 15 p.
22. Bowman, c.a., Bobrowsky, p.t., selinus, o. (2003) medical geology: new relevance in the earth sciences. Episodes 24(6): 270-278.
23. Braziewitzs, J., Kownacka, L., majweska, U., Korman, a. (2004) elemental concentrations in tropospheric and lower stratospheric air in a northeastern region of poland. Atmospheric Environment 38: 1989-1996.
24. Brekken, a., steinnes, e., (2004) seasonal concentrations of cadmium and zinc in native pas-ture plants: consequences for grazing animals. Science of the Total Environment 326: 181-195.
25. Briggs, d., Wahlqvist, m. (1998) Food Facts. penguin Books: melbourne, 264 p.26. Brumelis, G., Lapina, L., nikodemus, o., tabors, G. (2002) Use of the o horizon of forest soils
in monitoring metal deposition in Latvia. Water, Air & Soil Pollution 135(1-4): 291-309.27. Buldini, p.L., cavalli, s., mevoli, a., sharma, J.L. (2001) ion chromatographic and voltammet-
ric determination of heavy and transition metals in honey. Food Chemistry 73: 487-495.28. callanan, a. (ed.) (2000) Food and Nutrition Handbook. World food programme: rome, 124 p.29. carbonell-Barrachina, a.a., Wu, X., ramirez-Gandolfo, a., norton, G. J., Burlo, f., deacon,
c., meharg, a.a. (2012) inorganic arsenic contents in rice-based infant foods from spain, UK, china and Usa. Environmental Pollution 163: 77-83.
30. cashman, K.d. (2006) milk minerals (including trace elements) and bone health. International Dairy Journal 16: 1389-1398.
31. Čekstere, G. (2011) Vides faktoru ietekme uz Holandes liepu (Tilia x vulgaris) vitalitāti Rīgas ielu apstādījumos / Impact of Environmental Factors on Vitality of Common Lime (Tilia x vul-garis) in the Street Greenery of Riga. doctoral thesis. [in Latvian] LU akadēmiskais apgāds: rīga, 225 lpp.
32. cekstere, G., nikodemus, o., osvalde, a. (2008) toxic impact of the de-icing material to street greenery in riga, Latvia. Urban Forestry & Urban Greening 7(3):207-217.
33. cekstere, G., osvalde, a. (2013) a study of chemical characteristics of soil in relation to street trees status in riga (Latvia). Urban Forestry & Urban Greening 12(1): 69-78.
34. cekstere, G., osvalde, a. (2010a) macronutrient status in the different-aged lime trees (Tilia x vulgaris h.) in riga streets. Baltic Forestry 16(1): 16-22.
35. cekstere, G., osvalde, a. (2010b) young street greenery supply with nutrients in riga, Latvia. Acta Horticulturae 881: 573-576.
36. cheli, f., campagnoli, a., ventura, v., Brera, c., Berdini, c., palmaccio, e., dell’orto, v. (2010) effects of industrial processing on the distributions of deoxynivalenol, cadmium and lead in durum wheat milling fractions. LWT - Food Science & Technology 43: 1050-1057.
37. chojancka, K., chojancki, a., Gorecka, h., Gorecki, h. (2005) Bioavailability of heavy metals from polluted soils to plants. Science of the Total Environment 337: 175-182.
38. chope, G.a., terry, L.a. (2009) Use of canonical variate analysis to differentiate onion culti-vars by mineral content as measured by icpaes. Food Chemistry 115(3): 1108-1113.
39. chudzinska, m., Baralkiewicz, d. (2010) estimation of honey authenticity by multielements characteristics using inductively coupled plasma-mass spectrometry (icp-ms) combined with chemometrics. Food & Chemical Toxicology 48(1): 284-290.

121
40. cindric, i.J., Krizman, i., Zeiner, m., Kampic, s., medunic, G., stingeder, G. (2012) icp-aes determination of minor- and major elements in apples after microwave assisted digestion. Food Chemistry 135(4): 2675-2680.
41. combs, G.f. (2005) Geological impacts of nutrition. in: selinus, o. (ed.-in-chief) Essentials of Medical Geology. elsevier academic press: amsterdam, 812 p., 161-177.
42. conti, m.e. (1997) The content of heavy metals in food packaging paper boards: an atomic absorption spectroscopy investigation. Food Research International 30(5): 343-348.
43. conti, m.e. (2007) heavy metals in food packagings. in: szefer, p., nriagu, J.o. (eds.) Mineral Components in Food. crc press: Boca raton, 446 p., 339-362.
44. dabeka, r.W., mcKenzie, a.d., Lacroix, G.m., cleroux, c., Bowe, s., Graham, r.a., conacher, h.B., verdier, p. (1993) survey of arsenic in total diet food composites and estimation of the dietary intake of arsenic by canadian adults and children. Journal of AOAC International 76(1): 14-25.
45. dewettinck, K., van Bockstaele, f., Kuhne, B., van de Walle, d., courtens, t.m., Gellynck, X. (2008) nutritional value of bread: influence of processing, food interaction and consumer perception. Journal of Cereal Science 48: 243-257.
46. diez, m., simon, m., martin, f., dorronsoro, c., Garcia, i., van Gestel, c.a.m. (2009) ambient trace element background concentrations in soils and their use in risk assessment. Science of the Total Environment 407(16): 4622-4632.
47. dimiņš, f. (2006) Medus kvalitātes novērtēšanas rādītāji / Assessment Parameters of Honey Quality. doctoral thesis. [in Latvian] LLU: Jelgava, 85 lpp.
48. disilvestro, r.a. (2005) Handbook of Minerals as Nutritional Supplements. crc press: Boca raton, 272 p.
49. dobrzanski, Z., Gorecki, h., chojnacka, K., Gorecka, h., synoviec, m. (2007) effect of dietary humic preparations on the content of the trace elements in the hens’ eggs. American Journal of Agricultural & Biological Sciences 2: 234-240.
50. duffus, J.h., nordberg, m., templeton, d.m. (2007) iUpac glossary of terms used in toxicol-ogy (2nd ed.). Pure Applied Chemistry 79(7):1153-1344.
51. duma, m., alsina, i., dubova, L., stroksa, L., smiltina, Z. (2011) The effect of sodium selenite and selenate on the quality of lettuce. FOODBALT 2011: 39-44.
52. echa (2013) Candidate list of substances of very high concern for authorisation. european chemicals agency (echa). accessed at http://echa.europa.ei/candidate-list-table on 03.08.2013.
53. ec regulation 889 (2008) commission regulation (ec) no 889/2008 of 5 september 2008 laying down detailed rules for the implementation of council regulation (ec) no 834/2007 on organic production and labelling of organic products with regard to organic production, labelling and control. Official Journal of the European Union L250: 1-84.
54. ec regulation 629 (2008) commission regulation (ec) no 629/2008 of 2 July 2008 amend-ing regulation (ec) no 1881/2006 setting maximum levels for certain contaminants in food-stuffs. Official Journal of the European Union L173: 6-9.
55. ec regulation 1881 (2006) commission regulation (ec) no 1881/2006 of 19 december 2006 setting maximum levels for certain contaminants in foodstuffs. Official Journal of the European Union L364: 5-24.
56. eggen, t., moder, m., arukwe, a. (2011) emerging contaminants in consumer products: en-vironmental fate and transfer to human foodchain. in: popov, v., Brebbia, c.a. (eds.) Food and Environment. Wit press: southampton, 225 p., 89-94.
57. ekholm, p., reinivuo, h., mattila, p., pakkala, h., Koponen, J., happonen, a., hellistrom, J., ovaskainen, m.-L. (2007) changes in the mineral and trace element contents of cereals, fruits and vegetables in finland. Journal of Food Composition & Analysis 20(6): 487-495.

122
58. eXtoXnet (s.a.) Toxicology information briefs. extension toxicology network (eXtoXnet). accessed at http://pmep.cce.cornell.edu/profiles/extoxnet/TIB/index.html on 19.04.2012.
59. favas, p. (2013) environmental risk associated with heavy metal pollution in soils based on geochemical fractionation. SGEM 2013 GeoConference Proceedings on Ecology, Economics, Education & Legislation 1, 417-422.
60. fairbrother, a., Wenstel, r., sappington, K., Wood, W. (2007) framework for metals risk as-sessment. Ecotoxicology & Environmental Safety 68(2): 145-227.
61. fan, J.-L., Ziadi, n., Belanger, G., parent, L.e., cambouris, a., hu, Z.-L. (2009) cadmium accumulation in potato tubers produced in Quebec. Canadian Journal of Soil Science 89(4): 435-443.
62. fao (2006) Guidelines for Soil Description. (4th ed.) food and agriculture organisation (fao): rome, 97 p.
63. fao (2001) Human Vitamin and Mineral Requirements. food and agriculture organisation (fao): rome, 303 p.
64. farid, s.m., enani, m.a. (2010) Levels of trace elements in commercial fruit juices in Jeddah, saudi arabia. The Medicinal Journal of the Islamic World Academy of Sciences 18(1): 31-38.
65. fernandez-torres, r., perez-Bernal, J.L., Bello-Lopez, m.a., callejon-mochon, m., Jimenez-sanchez, J.c., Guiraum-perez, a. (2005) mineral content and botanical origin of spanish hon-eys. Talanta 65(3): 686-691.
66. ferre-huguet, n., marti-cid, r., schuhmacher, m., domingo, J.L. (2008) risk assessment of metals from consuming vegetables, fruits and rice grown in soils irrigated with waters of the ebro river in catalonia, spain. Biological Trace Element Research 123(1-3): 66-79.
67. fnic (s.a.) Dietary reference intakes. food and nutrition information center (fnic). accessed at http://fnic.nal.usda.gov/dietary-guidance/dietary-reference-intakes on 17.09.2013.
68. fodor, p., molnar, e. (1993) honey as an environmental indicator: effect of sample prepara-tion on trace element determination by icp-aes. Microchimica Acta 112(1-4): 113-118.
69. forrest, m.J. (2009) Food Contact Materials: Rubbers, Silicones, Coatings and Inks. ismithers: shawbury, 362 p.
70. fraga, c.G. (2005) relevance, essentiality and toxicity of trace elements in human health. Molecular Aspects of Medicine 26(4-5): 235-244.
71. fsa (2006) FSA Nutrient and Food Based Guidelines for UK Institutions. food standards agency (fsa): London, 7 p.
72. Gardea-torresdey, J.L., peralta-videa, J.r., de la rosa, G., parsons, J.G. (2005) phytoremediation of heavy metals and study of the metal coordination by X-ray absorption spectroscopy. Coordination Chemistry Reviews 249(17-18): 1797-1810.
73. Garrett, r.G. (2005) natural distribution and abundance of elements. in: selinus, o. (ed.-in-chief) Essentials of Medical Geology. elsevier academic press: amsterdam, 812 p., 17-41.
74. Giannenas, i., nisianakis, p., Gavriil, a., Kontopidis, G., Kyriazakis, i. (2009) trace mineral content of conventional, organic and courtyard eggs analysed by inductively coupled plasma mass spectrometry (icp-ms). Food Chemistry 114(2): 706-711.
75. Gilucis, a. (2007) Mikro- un makroelementu satura un izplatības likumsakarības Latvijas augšņu virsējos horizontos / Relevancies of Content and Distribution of Trace and Major Elements in the Latvian Topsoils. doctoral thesis. [in Latvian] LU: rīga, 88 lpp.
76. Goldhaber, s.B. (2003) trace element risk assessment: essentiality vs. toxicity. Regulatory Toxicology & Pharmacology 38(2): 232-242.
77. Golob, t., dobersek, U., Kump, p., necemer, m. (2005) determination of trace and minor ele-ments in slovenian honey by total reflection X-ray fluorescence spectroscopy. Food Chemistry 91: 593-600.

123
78. Gonzalvez, a., armenta, s., cervera, m.L., de la Guardia, m. (2008) elemental composition of seasoning products. Talanta 74(5): 1085-1095.
79. Grant, c., Buckley, W., Bailey, L., selles, f. (1998) cadmium accumulation in crops. Canadian Journal of Plant Science 78(1): 1-17.
80. Gruber, X., Kregsamer, p., Wobrauschek, p., streli, c. (2006) total-reflection X-ray flu-orescence analysis of austrian wine. Spectrochimica Acta Part B: Atomic Spectroscopy 61(10-11): 1214-1218.
81. Guala, s.d., vega, f.a., covelo, e.f. (2010) The dynamics of heavy metals in plant-soil interac-tions. Ecological Modelling 221: 1148-1152.
82. hao, X.-Z., Zhou, d.-m., huang, d.-Q., cang, L., Zhang, h.-L., Wang, h. (2009) heavy metal transfer from soil to vegetable in southern Jiangsu province, china. Pedosphere 19(3): 305-311.
83. harju, L., hulden, s.-G. (1990) Birch sap as a tool for biogeochemical prospecting. Journal of Geochemical Exploration 37(3), 351-365.
84. harmsen, J., naidu, r. (2013) Bioavailability as a tool in site management. Journal of Hazardous Materials 12: 1-7.
85. hashmi, d.r., ismail, s., shaikh, G.h. (2007) assessment of the level of trace metals in com-monly edible vegetables locally available in the markets of Karachi city. Pakistan Journal of Botany 39(3): 747-751.
86. hawkesford, m.J., Zhao, f.-J. (2007) strategies for increasing the selenium content of wheat. Journal of Cereal Science 46: 282-292.
87. he, Z.L., yang, X.e., stoffella, p.J. (2005) trace elements in agroecosystems and impacts on the environment. Journal of Trace Elements in Medicine & Biology 19: 125-140.
88. heemsbergen, d.a., mcLaughlin, m.J., Whatmuff, m., Warne, m.s., Broos, K., Bell, m., nash, d., Barry, G., pritchard, d., penney, n. (2010) Bioavailability of zinc and copper in biosolids compared to their soluble salts. Environmental Pollution 158: 1907-1915.
89. hernandez-martinez, r., navarro-Blasco, i. (2013) survey of total mercury and arsenic con-tent in infant cereals marketed in spain and estimated dietary intake. Food Control 30(2): 423-432.
90. hodges, s.c. (s.a.) Soil Fertility Basics. north carolina state University (ncsU): raleigh, 75 p.91. hoefler, h., streli, c., Wobrauschek, p., ovari, m., Zaray, G. (2006) analysis of low Z elements
in various environmental samples with total reflection X-ray fluorescence (tXrf) spectrome-try. Spectrochimica Acta Part B: Atomic Spectroscopy 61(10-11): 1135-1140.
92. holt, p.s., davies, r.h., dewulf, J., Gast, r.K., huwe, J.K,. Jones, d.r., Waltman, d., Willian, K.r. (2011) The impact of different housing systems on egg safety and quality. Poultry Science 90: 251-262.
93. inaba, s., takenaka, c. (2005) effects of dissolved organic matter on toxicity and bioavailabil-ity of copper for lettuce sprouts. Environment International 31(4): 603-608.
94. iom (s.a.) Dietary reference intake reports. The institute of medicine (iom) of the national academies. accessed at http://www.iom.edu/Reports.aspx?Board1={32E1607 C-3E87-4E73-B9D4-7C96E29EB9A5}&page=1&Series={508F5CFF-EE88-4FF6-92BF-8D6CAB46F52E} on 16.09.2013.
95. iris (s.a.) Integrated Risk Information System (IRIS). United stated environmental protection agency. accessed at http://www.epa.gov/iris/search_human.htm on 09.09.2013.
96. Jiao, W., chen, W., chang, a.c., page, a.L. (2012) environmental risks of trace elements as-sociated with long-term phosphate fertilizers applications: a review. Environmental Pollution 168: 44-53.
97. Joshi, s.p., toma, r.B., medora, n., o’connor, K. (2003) detection of aluminium residue in sauces packaged in aluminium pouches. Food Chemistry 83: 383-386.

124
98. Joudisius, e., simoneliene, a. (2009) Lietuvoje parduodamo medaus užterštumas sunkiaisiais metalais ir pesticidais / trace metals and pesticide residues in honey on the Lithuanian mar-ket. [in Lithuanian] Veterinarija & Zootechnika 45(67): 27-32.
99. Juškevičs, v. (2000) Kvartāra nogulumu karte / Map of Quaternary Sediments (1:200 000). Jāņa sēta: rīga.
100. Kabata-pendias, a. (2011) Trace Elements in Soils and Plants. (4th ed.) crc press: Boca raton, 505 p.
101. Kabata-pendias, a. (2004) soil-plant transfer of trace elements – an environmental issue. Geoderma 122(2-4): 143-149.
102. Кабата-Пендиас, А. (2005) Проблемы современной биогеохимии микроелементов. Российский Химический Журнал XLiX(3): 15-19.
103. Kabata-pendias, a., mukherjee, a.B. (2007) Trace Elements from Soil to Human. springer-verlag: Berlin, 550 p.
104. Kārkliņš, a., Gemste, i., mežals, h., nikodemus, o., skujāns, r. (2009) Latvijas augšņu no-teicējs / Soil Key-Book of Latvia. [in Latvian] LLU: Jelgava, 235 lpp.
105. Karley, a.J., White, p.J. (2009) moving cationic minerals to edible tissues: potassium, magne-sium, calcium. Current Opinion in Plant Biology 12: 291-298.
106. Карпова, Е.А. (2005) Роль удобрений в циклах микроэлементов в агроэкосистемах. Российский Химический Журнал XLiX(3): 20-25.
107. Kasparinskis, r., (2011) Personal information.108. Kasparinskis, r., nikodemus, o. (2012) influence of environmental factors on the spatial dis-
tribution and diversity of forest soil in Latvia. Estonian Journal of Earth Sciences 61(1): 48-64.109. Kazi, t.G., Jalbani, n., Baig, J.a., Kandhro, G.a., afridi, h.i., arain, m.B., Jamali, m.K., shah,
a.Q. (2009) assessment of toxic metals in raw and processed milk samples using electrother-mal atomic absorption spectrophotometer. Food & Chemical Toxicology 47: 2163-2169.
110. Kelly, d., Bateman, a.s. (2010) comparison of mineral concentrations in commercially grown organic and conventional crops – tomatoes (Lycopersicon esculentum) and lettuces (Lactuca sativa). Food Chemistry 119: 738-745.
111. Khan, s., cao, Q., Zheng, y.m., huang, y.Z., Zhu, y.G. (2008) health risks of heavy metals in contaminated soils and food crops irrigated with wastewater in Beijing, china. Environmental Pollution 152(3): 686-692.
112. Kilic, Z., acar, o., Ulasan, m., ilim, m. (2002) determination of lead, copper, zinc, magne-sium, calcium and iron in fresh eggs by atomic absorption spectrometry. Food Chemistry 76(1): 107-116.
113. Klavins, m., Briede, a., rodinov, v., Kokorite, i., parele, e., Klavina, i. (2000) heavy metals in rivers of Latvia. Science of the Total Environment 262(1-2): 175-184.
114. Klavins, m., Kokorite, i., Jankevica, m., mazeika, J., rodinov, v. (2011) trace elements in sediments of lakes in Latvia. in: mastorakis, n. (ed.-in-chief) Recent Researches in Geography, Geology, Energy, Environment and Biomedicine. Wseas press: corfu, 518 p., 43-47.
115. Klavins, m., potapovics, o., rodinov, v. (2009a) heavy metals in fish from lakes in Latvia: concentrations and trends of changes. Bulletin of Environmental Contamination & Toxicology 82(1): 96-100.
116. Klavins, m., rodinov, v., druvietis, i. (2003) aquatic chemistry and humic substances in bog lakes in Latvia. Boreal Environment Research 8(2): 113-123.
117. Klavins, m., rodinov, v., Kokorite, i., Klavina, i., apsite, e. (2001) Long-term and seasonal changes in chemical composition of surface waters in Latvia. Environmental Monitoring & Assessment 66(3): 233-254.

125
118. Klavins, m., silamikele, i., nikodemus, o., Kalnina, L., Kuske, e., rodinov, v., purmalis, o. (2009b) peat properties, major and trace element accumulation in bog peat in Latvia. Baltica 22(1): 37-50.
119. Klavins, m., vircavs, m. (2001) metals in sediments of inland waters of Latvia. Boreal Environment Research 6(4): 297-306.
120. Klockenkamper, r. (1997) Total-Reflection X-Ray Fluorescence Analysis. John Wiley & sons: new york, 245 p.
121. Kloke, a., sauerbeck, d.r., vetter, h. (1984) The contamination of plants and soils with heavy metals and the transport of metals in terrestrial food chain. in: nriagu, J.o. (ed.) Changing Metal Cycles and Human Health. springer-verlag: Berlin, 446 p., 113-141.
122. Kokorite, i., Klavins, m., rodinov, v. (2010) impact of catchment properties on aquatic chem-istry in the rivers of Latvia. Hydrology Research 41(3-4): 320-329.
123. Koplik, r., Kominkova, J., Borkova, m., mestek, o., Kvasnicka, f., suchanek, m. (2004) effect of technological processing and maturity stage of seeds on the content and speciation of phos-phorus and trace elements in peas. Food Chemistry 87(3): 423-432.
124. Kropf, U., Korosec, m., Bertoncelj, J., ogrinc, n., necemer, m., Kump, p., Golob, t. (2010) determination of the geographical origin of slovenian black locust, lime and chestnut honey. Food Chemistry 121(3): 839-846.
125. Kubala-Kukus, a., Braziewicz, J., pajek, m. (2004) total reflection X-ray fluorescence stud-ies of trace elements in biomedical samples. Spectrochimica Acta Part B: Atomic Spectroscopy 59(8): 1283-1289.
126. Kucukyilmaz, K., Bozkurt, m., yamaner, c., cinar, m., catli, a.U., Konak, r. (2012) effect of an organic and conventional rearing system on the mineral content of hen eggs. Food Chemistry 132: 989-992.
127. Kuka, m., cakste, i., Gersebeka, e. (2013) determination of bioactive compounds and miner-al substances in Latvian birch and maple saps. Proceedings of the Latvian Academy of Sciences. Section B 67(4/5): 437-441.
128. Kulikova, i., seisuma, Z., Jansons, m. (2003) an assessment of metal pollution in the Liepaja harbour (Baltic sea). Fresenius Environmental Bulletin 12(8): 906-913.
129. Kumar, n.J.i., soni, h., Kumar, r.n. (2007) characterization of heavy metals in vegetables using inductive coupled plasma analyzer (icpa). Journal of Applied Science & Environmental Management 11(3): 75-79.
130. Lachman, J., Kolihova, d., miholova, d., Kosata, J., titera, d., Kult, K. (2007) analysis of minority honey components: possible use for the evaluation of honey quality. Food Chemistry 101: 973-979.
131. Lante, a., Lomolino, G., cagnin, m., spettoli, p. (2006) content and characterisation of min-erals in milk and in crescenza and squacquerone italian fresh cheeses by icp-oes. Food Control 17: 229-233.
132. Lawgali, y.f. (2010) Trace Element Levels in Mediterranean Grains. doctoral thesis. University of aberdeen: aberdeen, 204 p.
133. Liguts, v. (2001) Toksikoloģijas rokasgrāmata / Handbook of Toxicology. [in Latvian] nacionālais medicīnas apgāds: rīga, 1070 lpp.
134. Lin, J., Jiang, W., Liu, d. (2003) accumulation of copper by roots, hypocotyls, cotyledons and leaves of sunflower (Helianthus annuus L.). Bioresource Technology 86: 151-155.
135. Ljung, K., palm, B., Grander, m., vahter, m. (2011) high concentrations of essential and toxic elements in infant formula and infant foods - a matter of concern. Food Chemistry 127(3): 943-951.
136. Luse, i., Bake, m.-a., Bergmanis, G., podniece, Z. (2000) risk assessment of manganese. Central European Journal of Public Health 8(suppl.): 51.

126
137. Luykx, d.m.a.m., van ruth, s.m. (2008) an overview of analytical methods for determining the geographical origin of food products. Food Chemistry 107(2): 897-911.
138. magdas, d.a., dehelean, a., puscas., r. (2012) isotopic and elemental determination in some romanian apple fruit juices. The Scientific World Journal 2012: 1-7.
139. malandrino, m., aballino, o., Buoso, s., Giacomino, a., La Gioia, c., mentasti, e. (2011) accumulation of heavy metals from contaminated soil to plants and evaluation of soil reme-diation by vermiculite. Chemosphere 82: 169-178.
140. matos-reyes, m.n., cervera, m.L., campos, r.c., de la Guardia, m. (2010) total content of as, sb, se, te and Bi in spanish vegetables, cereals and pulses and estimation of the contri-bution of these foods to the mediterranean daily intake of trace elements. Food Chemistry 122(1): 188-194.
141. melece, L. (2009) issues of food consumption in Latvia. Economic Science for Rural Development 20: 103-111.
142. melece, L., romanova, d., Golovcenko, a. (2008) food consumption trends and its influenc-ing factors in Latvia. Economic Science for Rural Development 16: 115-122.
143. mendil, d. (2006) mineral and trace metal levels in some cheese collected from turkey. Food Chemistry 96: 532-537.
144. melo, r., Gellein, K., evje, L., syversen, t. (2008) minerals and trace elements in commercial infant food. Food & Chemical Toxicology 46(10): 3339-3342.
145. meresova, J., florek, m., holy, K., Jeskovsky, m., sykora, i., frontasyeva, m.v., pavlov, s.s., Bujdos, m. (2008) evaluation of elemental content in air-borne particulate matter in low-level atmosphere of Bratislava. Atmospheric Environment 42: 8079-8085.
146. mohamed, a.e., rashed, m.n., mofty, a. (2003) assessment of essential and toxic elements in some kinds of vegetables. Ecotoxicology & Environmental Safety 55(3): 251-260.
147. muceniece, m., muszynska, m., otto, G., rozentale, Z., rudkowski, B., skerliene, K., slotova, L., suurorg, i., tur, K.e., von muhlendahl, K.e. (2007) pediatric environmental medicine in eastern central europe. International Journal of Hygiene & Environmental Health 210(5): 509-513s.
148. muller-Karulis, B., poikane, r., seglins, v. (2003) heavy metals in the ventspils harbour: normalization based on a multi-parameter dataset. Environmental Geology 43(4): 445-456.
149. murniece, i., Karklina, d., Galoburda, r., santare, d., skrabule, i., costa, h. s. (2011) nutritional composition of freshly harvested and stored Latvian potato (Solanum tubero-sum L.) varieties depending on traditional cooking methods. Journal of Food Composition & Analysis, 24(4-5): 699-710.
150. nabrzyski, m. (2007) functional role of some minerals in foods. in: szefer, p., nriagu, J.o. (eds.) Mineral Components in Food. crc press: Boca raton, 446 p., 123-162.
151. navarro-alarcon, m., cabrera-vique, c. (2008) selenium in food and the human body: a re-view. Science of the Total Environment 400: 115-141.
152. nikodemus, o., (2011) Personal information.153. nikodemus, o. (2004) Latvijas augšņu karte / Map of Soils in Latvia (1:2 250 000). Jāņa sēta:
rīga.154. nikodemus, o. (red.) (2008) Augsnes ilgtspējīga izmantošana un aizsardzība / Soil Protection
and Sustainable Use. [in Latvian] LU akadēmiskais apgāds: rīga, 256 lpp.155. nikodemus, o., Brumelis, G., tabors, G., Lapina, L., pope s. (2004) monitoring of air pol-
lution in Latvia between 1990 and 2000 using moss. Journal of Atmospheric Chemistry 49: 521-531.
156. nisianakis, p., Giannenas, i., Gavriil, a., Kontopidis, G., Kyriazakis, i. (2009) variation in trace element contents among chickens, turkey, duck, goose and pigeon eggs, analyzed by inductively coupled plazma mass spectrometry (icp-ms). Biological Trace Element Research 128: 62-71.

127
157. ntp (2011) Report on Carcinogens. (12th ed.) national toxicology program (ntp): north carolina, 499 p.
158. odriozola-serrano, i., aguilo-aguayo, i., soliva-fortuny, r., martin-Belloso, o. (2013) pulsed electric fields processing effects on quality and health-related constituents of plant-based foods. Trends in Food Science & Technology 29(2): 98-107.
159. okoro, h.K., fatoki, o.s., adekola, f.a., Ximba, B.J., snyman, r.G. (2012) a review of se-quential extraction procedures for heavy metals speciation in soils and sediments. Open Access Scientific Reports 1(3): 181, doi:10.4172/scientificreports.181.
160. onianwa, p.c., adeltola, i.G., iwegbue, c.m.a., ojo, m.f., tella, o.o. (1999) trace heavy met-al composition of some nigerian beverages and food drinks. Food Chemistry 66(3): 275-279.
161. osvalde, a., Karlsons, a. (2010) evaluation of the nutrient status of american cranberry in Latvia during 2001-2007. Acta Horticulturae 868: 213-218.
162. pansu, m., Gautheyrou, J. (2006) Handbook of Soil Analysis: Mineralogical, Organic and Inorganic methods. springer verlag: Berlin, 993 p.
163. peralta-videa, J.r., Lopez, m.L., narayan, m., saupe, G., Gardea-torresdey, J. (2009) The bi-ochemistry of environmental heavy metal uptake by plants: implications for the food chain. The International Journal of Biochemistry & Cell Biology 41(8-9): 1665-1677.
164. pingret, d., fabiano-tixier, a.-s., chemat, f. (2013) degradation during application of ultra-sound in food processing: a review. Food Control 31(2): 593-606.
165. pisani, a., protano, G., riccobono, f. (2008) minor and trace elements in different honey types produced in siena county (italy). Food Chemistry 107: 1553-1560.
166. pohl, c., Loffler, a., schmidt, m., seifert, t. (2006) a trace metal (pb, cd, Zn, cu) balance for surface waters in the eastern Gotland Basin, Baltic sea. Journal of Marine Systems 60(3-4): 381-395.
167. pohl, p. (2009) determination of metal content in honey by atomic absorption and emission spectrometries. Trends in Analytical Chemistry 28(1): 117-128.
168. poikane, r., carstensen, J., dahllof, i., aigars, J. (2005) distribution patterns of particulate trace metals in the water column and nepheloid layer of the Gulf of riga. Chemosphere 60(2): 216-225.
169. pomerleau, J., mcKee, m., robertson, a., Kadziauskiene, K., abaravicius, a., Bartkeviciute, r., vaask, s., pudule, i., Grinberga, d. (2001a) dietary beliefs in the Baltic republics. Public Health Nutrition 4(2): 217-225.
170. pomerleau, J., mcKee, m., robertson, a., Kadziauskiene, K., abaravicius, a., vaask, s., pudule, i., Grinberga, d. (2001b) macronutrient and food intake in the Baltic republics. European Journal of Clinical Nutrition 55(3): 200-207.
171. Qi macros (2013) QI Macros for Excel. KnowWare international inc. accessed at http://www.qimacros.com/ on 12.05.2013.
172. radwan, m.a., salama, a.K. (2006) market basket surveys for some heavy metals in egyptian fruits and vegetables. Food & Chemical Toxicology 44(8): 1273-1278.
173. regulation 804 (2005) ministru Kabineta noteikumi nr. 804 (25.10.2005.) Noteikumi par augsnes un grunts kvalitātes normatīviem / Requirements for quality normative of top and bot-tom soils. [in Latvian] Latvijas Vēstnesis, 172(3330).
174. reilly, c. (2007) pollutants in food – metals and metalloids. in: szefer, p., nriagu, J.o. (eds.) Mineral Components in Food. crc press: Boca raton, 446 p., 363-388.
175. remon, e., Bouchardon, J.L., Le Guedard, m., Bessoule, J.J., conord, c., faure, o. (2013) are plants useful as accumulation indicators of metal bioavailability? Environmental Pollution 175: 1-7.
176. rial-otero, r., Gonzalez-Barreiro, e., martinez-carballo, e., perez-Guerra, n., pastrana-castro, L., simal-Gandara, J. (2009) suitability of packaging for food based on interaction

128
studies. in: Bellinghouse, v.c. (ed.) Food Processing: Methods, Techniques and Trends. nova science publisher: new york, 640 p., 439-462.
177. richardson, e.a., pearce, J., tunstall, h., mitchell, r., shortt, n.K. (2013) particulate air pol-lution and health inequalities: a europe-wide ecological analysis. International Journal of Health Geographics 12: 34, doi:10.1186/1476-072X-12-34.
178. rivero, r.c., hernandez, p.s., rodriguez, e.m.r., martin, J.d., romero, c.d. (2003) mineral concentrations in cultivars of potatoes. Food Chemistry 83(2): 247-253.
179. rudoviča, v. (2012) Analītisko metožu izveide arheoloģisko izrakumu antropoloģiskā materiāla izpētē / Establishment of Analytical Methods for the Investigation of Anthropological Material in Archaeological Excavations. doctoral thesis. [in Latvian] LU akadēmiskais apgāds: rīga, 104 lpp.
180. salazar, m.J., rodriguez, J.h., nieto, G.L., pignata, m.L. (2012) effects of heavy metal con-centrations (cd, Zn and pb) in agricultural soils near different emission sources on quality, accumulation and food safety in soybean. Journal of Hazardous Materials 233-234: 244-253.
181. salminen, r., chekushin, v., Gilucis, a., Gregorauskiene, v., petersell, v., tomilina, o. (2011) distribution of elements in terrestrial mosses and the organic soil layer in the eastern Baltic region. Special Paper of the Geological Survey of Finland 50: 1-116.
182. samsoe-petersen, L., Larsen, e.h., Larsen, p.B., Bruun, p. (2002) Uptake of trace elements and pahs by fruit and vegetables from contaminated soils. Environmental Science & Technology 36(14): 3057-3063.
183. schrauzer, G.n. (2002) Lithium: occurrence, dietary intakes, nutritional essentiality. Journal of the American College of Nutrition 21(1): 14-21.
184. sharma, r.K., agrawal, m., marshall, f.m. (2008) heavy metal (cu, Zn, cd and pb) contami-nation of vegetables in urban india: a case study in varanasi. Environmental Pollution 154(2): 254-263.
185. silamikele, i., Klavins, m., nikodemus, o. (2011) major and trace element distribution in the peat from ombrotrophic bogs in Latvia. Journal of Environmental Science & Health – Part A Toxic/Hazardous Substances & Environmental Engineering 46(7): 805-812.
186. silva, L.r., videira, r., monteiro, a.p., valentao, p., andrade, p.B. (2009) honey from Luso re-gion (portugal): physicochemical characteristics and mineral contents. Microchemical Journal 93: 73-77.
187. simon, e., Braun, m., vidic, a., Bogyo, d., fabian, i., tothmeresz, B. (2011) air pollution assessment based on elemental concentration of leaves tissue and foliage dust along an urban-ization gradient in vienna. Environmental Pollution 159: 1229-1233.
188. soceanu, a., dobrinas, s., popescu, v., Birghila, s., magearu, v. (2007) comparative study of some essential elements in different types of vegetables and fruits. Environmental Engineering & Management Journal 6(6): 593-596.
189. stalikas, c.d., mantalovas, a.c., pilidis, G.a. (1997) multielement concentrations in vegetable species grown in two typical agricultural areas of Greece. The Science of the Total Environment 206(1): 17-24.
190. stalnacke, p., Grimvall, a., Libiseller, c., Laznik, m., Kokorite, i. (2003) trends in nutrient concentrations in Latvian rivers and the response to the dramatic change in agriculture. Journal of Hydrology 283(1-4): 184-205.
191. staniskiene, B., matusevicius, p., Budreckiene, r. (2006) medus – aplinkos taršos indikatorius / honey as an indicator of environmental pollution. [in Lithuanian] Environmental Research, Engineering & Management (LT) 2(36): 53-58.
192. stankovska, e., stafilov, t., sajn, r. (2008) monitoring of trace elements in honey from the republic of macedonia by atomic absorption spectrometry. Environmental Monitoring & Assessment 142: 117-126.

129
193. steinnes, e. (2009) soils and geomedicine. Environmental Geochemistry & Health 31: 523-535.194. stibilj, v., tercic, d., holcman, a., (2002) content of some mineral elements in eggs from
farms and free range. Acta Agraria Kaposvariensis 6: 139-145.195. stosnach, h., Gross, a. (s.a.) analysis of mercury in tap water and orange juice by tXrf
spectrometry. Lab Report XRF 430, S2 PICOFOX. Bruker nano Gmbh: Berlin, accessed at www.brucker.com on 16.09.2013.
196. sudmalis, p. (2013) Noturīgo organisko piesārņotāju noteikšanas iespējas biovidēs un vides paraugos / Possibilities of Persistent Organic Pollutants Detection and Determination in Environment and Biological Samples. doctoral thesis. [in Latvian] rsU: rīga, 89 lpp.
197. szefer, p., Grembecka, m. (2007) mineral components in food crops, beverages, luxury food, spices, and dietary food. in: szefer, p., nriagu, J.o. (eds.) Mineral Components in Food. crc press: Boca raton, 446 p., 231-322.
198. szoboszlai, n., polgari, Z., mihucz, v.G., Zaray, G. (2009) recent trends in total reflec-tion X-ray fluorescence spectrometry for biological applications. Analytica Chimica Acta 633(1): 1-18.
199. tabors, G., Brumelis, G., Lapina, L., pospelova, G., nikodemus, o. (2004) changes in element concentrations in moss segments after cross-transplanting between a polluted and non-pol-luted site. Journal of Atmospheric Chemistry 49: 191-197.
200. tao, s., chen, y.J., Xu, f.L., cao, J., Li, B.G. (2003) changes of copper speciation in maize rhizosphere soil. Environmental Pollution 122: 447-454.
201. tessier, a., campbell, p.G.c., Bisson, m. (1979) sequential extraction procedure for the speci-ation of particulate trace metals. Analytical Chemistry 51(7): 1-8.
202. tuzen, m., silici, s., mendil, d., soylak, m. (2007) trace element levels in honeys from differ-ent regions of turkey. Food Chemistry 103: 325-330.
203. Uluozlu, o.d., tuzen, m., mendil, d., soylak, m. (2009) assessment of trace element contents of chicken products from turkey. Journal of Hazardous Materials 163: 982-987.
204. Usda (s.a.) National nutrient database for standard reference. agricultural research service, United states department of agriculture (Usda). accessed at http://ndb.nal.usda.gov/ndb/nutrients/index on 16.09.2013.
205. van reeuwijk, L.p. (ed.) (1995) Procedures for Soil Analysis. (5th ed.) international soil reference and information centre (isric): Wageningen, 92 p.
206. viadel, B., Barbera, r., farre, r. (2006) effect of cooking and legume species upon calci-um, iron and zinc uptake by caco-2 cells. Journal of Trace Elements in Medicine & Biology 20: 115-120.
207. viksna, a., Lindgren, e.s., standzenieks, p., Jacobsson, J. (2004) edXrf and tXrf analysis of elemental size distributions and environmental mobility of airborne particles in the city of riga, Latvia. X-Ray Spectrometry 33(6): 414-420.
208. viksna, a., Lindgren, e.s., standzenieks, p. (2001) analysis of pine needles by Xrf scanning techniques. X-Ray Spectrometry 30(4): 260-266.
209. villalobos, m., merino-sanchez, c., hall, c., Grieshop, J., Gutierrez-ruiz, m.e., handley, m.a. (2009) Lead (ii) detection and contamination routes in environmental sources, cookware and home-prepared foods from Zimatlan, oaxaca, mexico. Science of the Total Environment 407(8): 2836-2844.
210. vincēviča-Gaile, Z. (2010) makro- un mikroelementu saturs medū / macro- and trace ele-ments in honey. [in Latvian] Proceedings of the Latvia University of Agriculture 25(320): 54-66.
211. viskelis, p., rubinskiene, m. (2011) Beržų sulos cheminė sudėtis / chemical composition of birch sap. [in Lithuanian] Lietuvos Agrarinių & Miškų Mokslų Centro Filialo Sodininkystės & Daržininkystės Instituto & Lietuvos Žemės Ūkio Universiteto Mokslo Darbai. Sodininkystė & Daržininkystė 30(3-4): 75-81.

130
212. voutsa, d., Grimanis, a., samara, c. (1996) trace elements in vegetables grown in an indus-trial area in relation to soil and air particulate matter. Environmental Pollution 94(3): 325-335.
213. voutsa, d., samara, c. (1998) dietary intake of trace elements and polycyclic aromatic hydro-carbons via vegetables grown in an industrial Greek area. The Science of the Total Environment 218: 203-216.
214. Waegeneers, n., de steur, h., de temmerman, L., van steenwinkel, s., Gellynck, X., viaene, J. (2009a) transfer of soil contaminants to home-produced eggs and preventive measures to reduce contamination. Science of the Total Environment 407(15): 4438-4446.
215. Waegeneers, n., hoenig, m., Goeyens, L., de temmerman, L. (2009b) trace elements in home-produced eggs in Belgium: levels and spatiotemporal distribution. Science of the Total Environment 407: 4397-4402.
216. Waheed, s., fatima, i., mannan, a., chaudhary, m.s., Qureshi, i.h. (1985) trace element con-centration in egg-yolk and egg-white of farm and domestic chicken eggs. International Journal of Environmental Analytical Chemistry 21: 333-344.
217. Walker, d.J., clemente, r., roig, a., Bernal, m.p. (2003) The effects of soil amendments on heavy metal bioavailability in two contaminated mediterranean soils. Environmental Pollution 122: 303-312.
218. Wang, X., shan, X., Zhang, s., Wen, B. (2004) a model for evaluation of the phytoavailability of trace elements to vegetables under the field conditions. Chemosphere 55(6): 811-822.
219. Wang, G., su, m.-y., chen, y.-h., Lin, f.-f., Luo, d., Gao, s.-f. (2006) transfer characteristics of cadmium and lead from soil to the edible parts of six vegetable species in southeastern china. Environmental Pollution 144: 127-135.
220. Welch, r.m., Graham, r.d. (2005) agriculture: The real nexus for enhancing bioavailable mi-cronutrients in food crops. Journal of Trace Elements in Medicine & Biology 18: 299-307.
221. Welna, m., szymczycha-madeja, a., pohl, p. (2011) Quality of the trace element analysis: sample preparation steps. in: akyar, i. (ed.) Wide Spectra of Quality Control. (4th ed.) intech: rijeka, 532 p., 54-70.
222. White, p.J., Broadley, m.r. (2005) Biofortifying crops with essential mineral elements. Trends in Plant Science 10(12): 586-593.
223. Who (1996) Trace Elements in Human Nutrition and Health. World health organisation (Who): Geneva, 343 p.
224. Who (s.a.) Concise international chemical assessment documents. international programme on chemical safety, World health organisation (Who). accessed at http://www.who.int/ipcs/publications/cicad/cicads_alphabetical/en/index.html on 25.07.2013.
225. Wuana, r.a., okieimen, f.e. (2011) heavy metals in contaminated soils: a review of sources, chemistry, risks and best available strategies for remediation. ISRN Ecology 2011: 1-20.
226. Wunderlich, s., feldman, c., Latif, K., punamiya, p. (2011) soil composition of community gardens: are there quality concerns? in: popov, v., Brebbia, c.a. (eds.) Food and Environment. Wit press: southampton, 225 p., 95-101.
227. Xu, d., Zhou, p., Zhan, J., Gao, y., dou, c., sun, Q. (2013) assessment of trace metal bio-availability in garden soils and health risks via consumption of vegetables in the vicinity of tongling mining area, china. Ecotoxicology & Environmental Safety 90: 103-11.
228. yang, X.-e., chen W.-r., feng, y. (2007) improving human micronutrient nutrition through biofortification in the soil–plant system: china as a case study. Environmental Geochemistry & Health, 29(5): 413-428.
229. yurkovskis, a. (2004) dynamics of particulate major and trace elements in the lower reaches of the daugava river and adjacent area of the Gulf of riga (Baltic sea). Marine Pollution Bulletin 49(3): 249-263.

131
230. yurkovskis, a., poikane, r. (2008) Biogeochemical, physical and anthropogenic transforma-tions in the daugava river estuary and plume, and the open Gulf of riga (Baltic sea) indicat-ed by major and trace elements. Journal of Marine Systems 70(1-2): 77-96.
231. Zariņš, Z., neimane, L. (2009) Uztura mācība / Nutrition Studies. (5th ed.) [in Latvian] LU akadēmiskais apgāds: rīga, 464 lpp.
232. Zegnere, L., alsina, i. (2008) The effect of selenite on growth and storage of onions. Latvian Journal of Agronomy 10: 235-240.
233. Zhang, f.-s., yamasaki, s., Kimura, K. (2001) rare earth element content in various waste ashes and the potential risk to Japanese soils. Environment International 27(5): 393-398.
234. Zheljazkov, v.d., craker, L.e., Xing, B. (2006) effects of cd, pb, and cu on growth and essen-tial oil contents in dill, peppermint, and basil. Environmental & Experimental Botany 58: 9-16.
235. Zheng, n., Wang, Q., Zheng, d. (2007) health risk of hg, pb, cd, Zn, and cu to the inhabit-ants around huludao Zinc plant in china via consumption of vegetables. Science of the Total Environment 383: 81-89.
236. Zimmermann, m.B. (2001) Burgerstein’s Handbook of Nutrition: Micronutrients in the Prevention and Therapy of Disease. Georg Thieme verlag: stuttgart, 288 p.

132
APPenDICeS
Appendix I
The main food sources of essential and possibly essential elements and their functions in human organism
(after aras and ataman, 2006; atsdr, s.a.; Berdanier et al., 2007; Briggs and Wahlqvist, 1998; comb, 2005; disilvestro, 2005; Kabata-pendias and mukherjee, 2007; schrauzer, 2002; White and
Broadley, 2005; Who, s.a.; Who, 1996)
element The main food sources functions in human organism
alfood packed, stored or stored cooked
in al containing dishes and vessels, tea, pharmaceuticals
Unclear biological function in humans;although animal studies suggest that
al may stimulate certain enzymes, may stimulate growth
as dairy products, meat, poultry, fish, grains and cereals
Unclear biological function in humans;although animal data indicate a
requirement; involved in metabolism of methyl-compounds
B fruit-based products and beverages, potatoes, legumes, milk, avocado, peanuts
Unclear biological function in humans;although animal data indicate a functional role: B is involved in
the control of membrane function, biosynthesis of nucleic acid and lignin
ca
dairy products (milk, cheese), fortified juices, kale, collards, mustard greens, broccoli, chinese cabbage, sardines,
oysters, clams, canned salmon
Basic constituent of bones and teeth, essential role in blood clotting and
regulation of blood pressure, muscle contraction and relaxation, nervous
system functioning
cl
table salt, sea salt, vegetables (rye, tomatoes, lettuce, celery, olives),
seaweeds, seafood, dairy products, meat, eggs
constituent of stomach acid and tissue fluids, essential for proper digestion as
hcl
co fish, nuts, green leafy vegetables (broccoli and spinach), cereals (oats)
constituent of vitamin B12 which is involved in nerve function and blood
formation
cr3+ some cereals, meats, poultry, fish, beer associated with insulin, required for energy release from glucose cleavage
cu
organ meat, seafood oysters, crabs, nuts, seeds, wheat bran, cereals, whole grain
products, beans, peas, lentils, cocoa products, mushrooms
component of enzymes in iron metabolism
f fluoridated water, tea, marine fish; non-food source: fluoridated dental products
important for formation, strengtheness and resistancy of bones and teeth,
prevents bones of mineral loss, inhibits the initiation and progression of dental
caries and stimulates new bone formation

133
element The main food sources functions in human organism
fe
fruits, vegetables, fortified bread and grain products such as cereal (non-haeme iron sources), meat and poultry (haeme
iron sources)
involved in haemoglobin formation, cell energy utilization, component of myoglobin and numerous enzymes, prevents of microcytic hypochromic
anaemia
i marine origin food, kelp, processed food, iodized salt
component of thyroid hormones, involved in metabolism processes
Kfruits (bananas), vegetables, pulses, nuts, seeds, cereals, milk, fish, shellfish, meat
(beef, chicken, turkey), bread
supports many reactions, such as protein synthesis, nerve transmission and
contraction of muscles
Li Grains, vegetables, some natural mineral waters, sugarcane, seaweeds, tobacco
Unclear biological function in humans;may stabilize serotonin transmission in nervous system, influence sodium transport, may increase lymphocytic
proliferation and depress the suppressor cell activity
mgGreen leafy and dark green vegetables, beans, peas, unpolished grains, nuts,
seeds, meat, starches, milk
cofactor for enzyme system, involved in bone mineralization, protein synthesis,
enzyme activation, contraction of muscles, nerve transmission
mn nuts, legumes, tea, whole grains
involved in many cell processes and enzyme functions; involved in formation of bones as well as in enzymes involved in amino acid, cholesterol, and carbohydrate
metabolism
mo Legumes, dark green leafy vegetables, organ meat, grain products, nuts
involved in many cell processes and enzyme functions, cofactor for enzymes involved in catabolism of sulphur amino
acids, purines and pyridines
natable salt, seafood, dairy products, ready
meals, meat products (beacon), eggs, cheese, tinned vegetables, savoury snacks
involved in the upkeep of ionic strength of body fluids
ni nuts, legumes, cereals, sweeteners, chocolate
Unclear biological function in humans;may serve as a cofactor of
metalloenzymes and facilitate iron absorption or metabolism in
microorganisms, constituent of urease, reduce haemopoiesis
pdairy products (yogurt, ice-cream,
cheese), meat, eggs, fish, peas, beans. lentils, nuts, some cereals and bread
constituent of every cell; maintenance of ph, storage and transfer of energy and
nucleotide synthesis
s in all food in many different forms
constituent of certain aminoacids, biotin, thiamin and insulin; involved in many
processes, e.g., essential in cartilage formation

134
element The main food sources functions in human organism
se
organ meat, seafood, nuts, plants (depending on soil selenium content), e.g., garlic, broccoli grown on high-se
soils
defence against oxidative stress and regulation of thyroid hormone action, and the reduction and oxidation status
of vitamin c and other molecules, antioxidant, prevents cells from untimely
ageing
si plant-based food relevant for structural connective in tissues and osteogenic cells
sn canned food, sn(ii) chloride used as food additive involved in interactions with riboflavin
v mushrooms, shellfish, black pepper, parsley, dill seeds
Unclear biological function in humans;may be involved in the control of
sodium pump, inhibition of atpase, p-transferases
Znfortified cereals, whole grains, red meat, organ meat, certain seafood (shellfish),
nuts, beans, peas, lentils
component of multiple enzymes and proteins, present in insulin, involved in genetic material and protein formation,
essential for immunity function, transport of vitamin a, taste, wound
healing, development of spermatozoids and normal fetal development

135
Appendix II
The main adverse effects of element deficiency or excessive intake (after aras and ataman, 2006; atsdr, s.a.; comb, 2005; disilvestro, 2005; fao, 2001; iris, s.a.;
Kabata-pendias and mukherjee, 2007; schrauzer, 2002; White and Broadley, 2005; Who, s.a.; Who, 1996)
elementadverse effects at
excessive intake deficiency
al osteomalacia, neurotoxicity, dementia, possible accelerator of alzheimer’s disease no data
as
no data about organic as compounds; inorganic as is a known toxic substance, induces variable disorders: failure of nervous system, liver and
kidney functions, intestine tract distress, anaemia, skin cancer
no data
B reproductive and developmental effects as observed in animal studies no data
ca Kidney stones, hypercalcemia, milk alkali syndrome, renal insufficiency
childhood rickets, osteoporosis, hyperparathyroidism,
hypertension, blood lipids alterations, possible connection
with colon cancer
cl increased body pressure, build-up of fluid in people with congestive heart failure or kidney diseases no data
co heart diseases, cardiomiopathy, marrow defects, excess of red blood cells, decrease of fertility in men anaemia, anorexia
cr3+ chronic renal failure, lesions in skin, intestinal mucosa, pulmonary oedema, lung cancer
defective glucose metabolism, hyperlipidemia
cu Gastrointestinal distress, liver damage, necrotic hepatitis, haemolysis, hyperglycemia anaemia and tissue defects
f enamel and skeletal fluorosis (variable effects, mottling of teeth enamel) teeth decay, growth retardation
fe Gastrointestinal distress, siderosis, haemachromamtosis, cardiac failure
anaemia, premature or low birth weight infants
i elevated thyroid stimulating hormone (ths) concentration, hyperthyroidism
Goiter, impaired neurological function
K stomach pain, nausea, diarrhoea
hypertension, athletic/exercise performance enhancement,
kidney stones, muscle cramps, risk of strokes, osteoporosis
Li impaired central nervous system, cardiovascular and renal effete
deficiency is not known, but low intakes of Li are associated with depression and increased
rates of suicide

136
elementadverse effects at
excessive intake deficiency
mgno data of adverse effects from the consumption of naturally occurring mg in food; mg containing
dietary supplements may induce osmotic diarrhoea
anorexia, nausea, vomiting, lethargy, weakness, personality change, tetany, tremor, muscle
fasciculations
mn elevated blood concentration and neurotoxicity, manganism, neurological disorders, liver cirrhosis skeletal and cartilage deformitis
moreproductive effects as observed in animal studies,
molybdenosis, defects in copper metabolism, diarrhoea
defects in keratosis, growth retardation
na hypertension, risk of stroke and heart attack no data
nidecreased body weight as observed in animal
studies, gastritic, liver and kidney defects, neurological effects, emphysema and lung cancer
no data
p metastatic calcification, skeletal porosity, interference with calcium absorption no data
s no data no data
se hair and nail brittleness and loss, selenosis, liver and kidney damage, fetal toxicity, cancer
cardiomyopathy, osteoarthropathy, membrane
malfunction
si no data of adverse effects from consumption of naturally occurred si in food and water no data
v renal lesions as observed in animal studies, nervous disturbances teeth defects
Zn reduced copper status, anaemia, tissue lesions anorexia, anaemia, impaired keratosis, teratogenic effects

137
Appendix III
estimated daily oral intake of elements (for adult human with body mass of 70 kg) and values of oral minimal risk level (after AtSDR, s.a.)
elementpredominant source of oral
intake
estimated average daily oral intake oral minimal risk level (mrL)
ag drinking water and food
� 70-88 μg/day � With food: ~4.5 μg/day � With drinking water: 20-
100 μg/day
no oral mrLs
alfood, pharma-
ceuticals, used as food additive
� 0.10-0.12 mg/kg/day � With pharmaceuticals at
recommended dosages: 12-71 mg/kg/day (with antacid/anti-ulcer products); 2-10 mg/kg/day (with buffered analgestics)
aluminium: � 1 mg/kg/day (intermediate) � 1 mg/kg/day (chronic)
asfood, drinking
water, some pharmaceuticals
� 50.6 μg/day ♀ � 58.5 μg/day ♂ � With grains: 20 μg/day
inorganic arsenic: � 0.005 mg/kg/day (acute) � 0.0003 mg/kg/day (chronic)
organic arsenic compounds: � 0.1 mg mma/kg/day
(intermediate) � 0.01 mg mma/kg/day (chronic) � 0.02 mg dma/kg/day (chronic)
Bfood, beverages, drinking water, pharmaceuticals
� 1.0 mg/day ♀ � 1.28 mg/day ♂
Boron and its compounds: � 0.2 mg/kg/day (acute) � 0.2 mg/kg/day (intermediate)
Ba food and drin-king water
� With drinking water: 0.86 μg/kg/day
� With food: 9.30-25.30 μg/kg/day
Barium and its soluble salts: � 0.2 mg/kg/day (intermediate) � 0.2 mg/kg/day (chronic)
cd food � 0.30 mg/kg/day ♀ � 0.35 mg/kg/day ♂
cadmium: � 0.0005 mg/kg/day (intermediate) � 0.0001 mg/kg/day (chronic)
cr food and drink-ing water
� 52-943 μg/day � With selected diets (25 and
43 % of fat): 25-224 (mean 76) μg/day
chromium (vi): � 0.005 mg/kg/day (intermediate) � 0.0009 mg/kg/day (chronic)
co food and drinking water
� 12-15 μg/day ♀ � 9-10 μg/day ♂
cobalt: � 0.01 mg/kg/day (intermediate)
cu food and drinking water
� 1.0-1.3 mg/day (0.014-0.019 mg/kg/day)
copper: � 0.01 mg/kg/day (acute) � 0.01 mg/kg/day (intermediate)
ffood, drinking
water, beverages, dental products
� 0.35-3.03 (mean 1.76) mg/day
fluoride: � 0.05 mg/kg/day (chronic)

138
elementpredominant source of oral
intake
estimated average daily oral intake oral minimal risk level (mrL)
hgfood (fish and fish products),
dental amalgams
� for methylmercury compounds with food 2.3-2.4 μg/day with fish, 0 μg/day with non-fish and 0 μg/day with water
� elemental hg vapour daily intake (only from dental amalgams): 3-21 μg/day
mercury (ii) chloride: � 0.007 mg/kg/day (acute) � 0.002 mg/kg/day (intermediate) � methylmercury: � 0.0003 mg/kg/day (chronic)
i food and drinking water � 0.064-0.379 mg/day
iodide: � 0.01 mg/kg/day (acute) � 0.01 mg/kg/day (chronic)
Li food, certain pharmaceuticals � 0.65-3.10 mg/day no oral mrLs
mn food �0.7-10.9 mg/day (higher for vegetarians) no oral mrLs
nifood and
drinking water, cigarette smoke
� With food: 69-162 μg/day � With water: 8 μg/day no oral mrLs
pb food and drinking water � 24-56.5 μg/day no oral mrLs
se food and drinking water � 1-2 μg/kg/day selenium:
� 0.005 mg/kg/day (chronic)
sn food, dental products
� 1-38 mg/day (higher from canned food)
tin, dibutyl-, dichloride: � 0.005 mg/kg/day (intermediate)
inorganic tin: � 0.3 mg/kg/day (intermediate)
tin, tributyl-, oxide: � 0.0003 mg/kg/day (intermediate) � 0.0003 mg/kg/day (chronic)
srfood, drinking water, cigarette
smoke � 3.3 mg/day (46 μg/kg/day) strontium:
� 2 mg/kg/day (intermediate)
tl food (especially, green vegetables)
� With food: 5 μg/day � With water: 2 μg/day no oral mrLs
U
food (especially, root vegetables)
and drinking water
� With food: 0.9-1.5 μg/day � With water: 0.9-1.5 μg/day
Uranium soluble salts: � 0.002 mg/kg/day (acute) � 0.0002 mg/kg/day (intermediate)
v food, dietary supplements
� 10-20 μg/day � With dietary supplements:
9 μg/day
vanadium: � 0.01 mg/kg/day (intermediate)
Zn
food and drinking water, cigarette smoke,
polluted air
� With food: 5.2-16.2 mg/day � With water: <0.14 mg/kg/
day
Zinc: � 0.3 mg/kg/day (intermediate) � 0.3 mg/kg/day (chronic)

139
Appendix IV
estimated element bioavailability from oral intake associated with gastrointestinal (GIt) absorption in human body (after AtSDR, s.a.; WHo, s.a.)
element Bioavailability (Ba), % remarks
ag � 21 % (ag acetate)
� apart from Git absorption, ag compounds, including ag salts and ag-protein colloids, are absorbed across mouth and nasal mucous membranes
� high intake of se may lead to increased deposition of insoluble ag salts in body tissues in the form of ag selenide
al
� 0.1-0.4 % � 0.5-5 % (Ba
forms, e.g., al citrate)
� ≤0.01 % (al hydroxide which is widely used as antacide)
� absorption of al varies depending mainly on type of anion and the concurrent exposure to dietary chelators such as citric acid, ascorbic acid, lactic acid
� al lactate has higher Ba than other al compounds found in water and food
am � <0.1 % � Up to 0.5 % (in
infants)
� absorption increases with duration of exposure � absorption, distribution and excretion from organism is
dependent on age
as
� >95 % (inorganic as)
� 75-85 % (organic as compounds such as mma and dma)
� inorganic as(v) compounds are readily reduced to inorganic as(iii) compounds which are taken up by the cell
� if highly insoluble forms are ingested, Ba and absorption will be much lower
� studies of Ba suggest that absorptions of inorganic as in ingested dust or soil is likely to be considerably less than absorption of as from ingested salts
� absorption of inorganic as from soil is reduced by low solubility and inaccessibility due to the presence of secondary reaction products or insoluble matrix components
B � 81-92 % � 93.9 % (boric
acid)
� apart from high Ba, essentiality of B is established for plants and some animals, but not for humans
Ba
� <5-30 % � With food:
1-15 % (mean 6 %)
� 20 % (in adults) � 30 % (in
children) � 60 % (in infants)
� Ba of Ba is significantly compound dependent � absorption of Ba sulphate is very low, higher Ba has acid-
soluble Ba compounds (Ba chloride, Ba carbonate) � absorption of Ba compounds is influenced by age
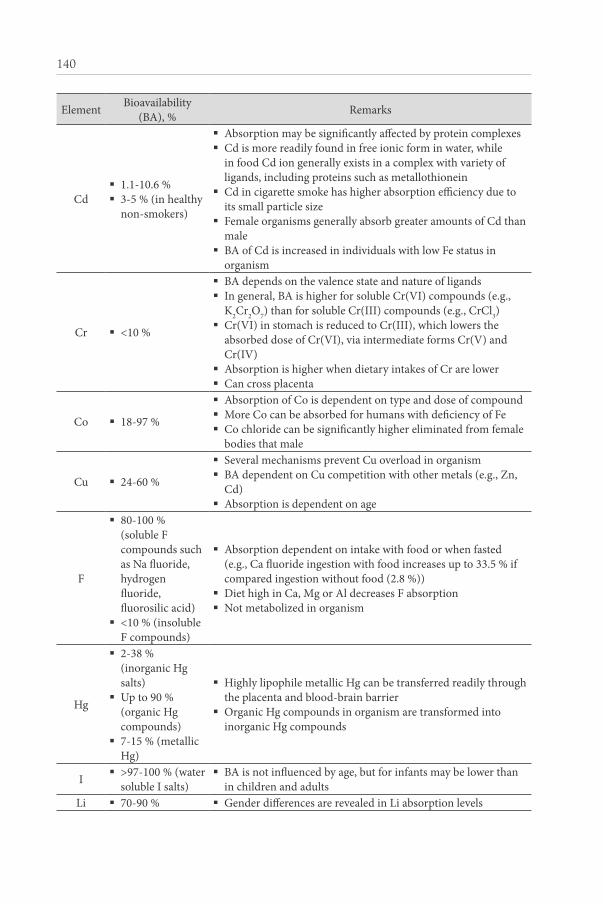
140
element Bioavailability (Ba), % remarks
cd � 1.1-10.6 % � 3-5 % (in healthy
non-smokers)
� absorption may be significantly affected by protein complexes � cd is more readily found in free ionic form in water, while
in food cd ion generally exists in a complex with variety of ligands, including proteins such as metallothionein
� cd in cigarette smoke has higher absorption efficiency due to its small particle size
� female organisms generally absorb greater amounts of cd than male
� Ba of cd is increased in individuals with low fe status in organism
cr � <10 %
� Ba depends on the valence state and nature of ligands � in general, Ba is higher for soluble cr(vi) compounds (e.g.,
K2cr2o7) than for soluble cr(iii) compounds (e.g., crcl3) � cr(vi) in stomach is reduced to cr(iii), which lowers the
absorbed dose of cr(vi), via intermediate forms cr(v) and cr(iv)
� absorption is higher when dietary intakes of cr are lower � can cross placenta
co � 18-97 %
� absorption of co is dependent on type and dose of compound � more co can be absorbed for humans with deficiency of fe � co chloride can be significantly higher eliminated from female
bodies that male
cu � 24-60 %
� several mechanisms prevent cu overload in organism � Ba dependent on cu competition with other metals (e.g., Zn,
cd) � absorption is dependent on age
f
� 80-100 % (soluble f compounds such as na fluoride, hydrogen fluoride, fluorosilic acid)
� <10 % (insoluble f compounds)
� absorption dependent on intake with food or when fasted (e.g., ca fluoride ingestion with food increases up to 33.5 % if compared ingestion without food (2.8 %))
� diet high in ca, mg or al decreases f absorption � not metabolized in organism
hg
� 2-38 % (inorganic hg salts)
� Up to 90 % (organic hg compounds)
� 7-15 % (metallic hg)
� highly lipophile metallic hg can be transferred readily through the placenta and blood-brain barrier
� organic hg compounds in organism are transformed into inorganic hg compounds
i � >97-100 % (water soluble i salts)
� Ba is not influenced by age, but for infants may be lower than in children and adults
Li � 70-90 % � Gender differences are revealed in Li absorption levels

141
element Bioavailability (Ba), % remarks
mn � 3-5 % � absorption dependent on age and dietary fe and mn intake levels
ni � With drinking
water: 27 % � With food: 1 %
� more soluble ni compounds have higher absorption efficiencies � not metabolized
pb
� 40-50 % (in children)
� 3-15 % (in adults)
� 26 % (if ingested when fasted)
� 2.5 % (if ingested with meals)
� extent and rate of Ba of inorganic pb compounds are influenced by the physiological state of the exposed individual and species of pb compound
� presence of food in Git decreases pb absorption � coadministration of ca with pb decreases pb absorption � absorption from soil, if ingested, is less than of dissolved pb,
but similarly is depressed by meals
pu � <0.1 % (pu
citrate and pu nitrate)
� pu citrate is better absorbed than pu nitrate, but puo2 has the lowest absorption levels
� fasting tends to increase pu absorption � absorption in infants is 10-1000 times greater than in adults � not metabolized in organism
se � >80 % � Ba is independent of the exposure concentration; however, absorption efficiency can increase when there is se deficiency
sn
� 3 % (sn (ii) compounds)
� 1 % (sn (iv) compounds)
� Ba is lower for inorganic sn compounds, while organotin compounds are more readily absorbed
� absorption of sn compounds is dose dependent � high amounts of sn in diet may reduce Zn and cu absorption
sr � 11-28 % (mean 20 %)
� Because sr is similar to ca, it is taken up by vegetables and fruits
Th � 0.1-1 %
� studies on rats show that in neonatal rats absorption of Th is 40-fold higher than for adult rats, thus suggesting that infants may be a susceptible population for exposure
� Th-edta absorption from Gi tract is 60 times higher, Th nitrate 4 times, Th chloride 10-20 times (depending on dose) greater than Th dioxide, that is attributed to different solubility
tl � 85 % � acute oral exposure results in deathv � 3-17 % � Ba significantly dependent on compound
W � 55-93 % (mean 60 %) � not metabolized in organism
Zn � 8-81 % (mean 20-30 %)
� Zn deficiency increase its absorption rates � dietary phytate reduces Zn absorption � presence of other metals (e.g., hg, cd, cu) may diminish Zn
absorption


LatviJas UniversitāteĢeoGrāfiJas Un Zemes ZinātņU faKULtāte
vides Zinātnes nodaļa
Zane Vincēviča-Gaile
VIDES APSTĀKĻU IETEKME UZ MIKro- UnMAKroElEMEnTU SATUrU
PĀrTIKAS ProDUKToS lATVIjĀ
promociJas darBa KopsaviLKUms
doktora grāda iegūšanai ķīmijā, vides zinātnes nozarēapakšnozare: vides ķīmija un ekotoksikoloģija
rīga, 2014

promocijas darbs izstrādāts Latvijas Universitātes Ģeogrāfijas un Zemes zinātņu fakultātes vides zinātnes nodaļā laika posmā no 2009. gada līdz 2013. gadam.
Šis darbs izstrādāts ar eiropas sociālā fonda atbalstu projektā “atbalsts doktora studijām Latvijas Universitātē”, nr.2009/0138/ 1dp/1.1.2.1.2./ 09/ipia/ viaa/004.
darbs sastāv no ievada, 3 nodaļām, secinājumiem, literatūras saraksta, 4 pielikumiem.
darba forma: ķīmijas doktora disertācija vides zinātnes nozarē, vides ķīmijas un ekotoksikoloģijas apakšnozarē.
darba zinātniskais vadītājs: profesors, Dr. habil. chem. Māris Kļaviņš
darba recenzenti:profesors, Dr. habil. chem. Andris Zicmanis, Latvijas Universitāte;profesors, Dr. Stanley Lutts, Lēvenes Katoļu universitāte, Beļģija;Dr. chem. Vadims Bartkevičs, pārtikas drošības, dzīvnieku veselības un vides zināt-niskais institūts Bior.
promocijas darba aizstāvēšana notiks Latvijas Universitātes vides zinātnes nozares promocijas padomes atklātā sēdē 2014. gada 24. aprīlī plkst. 10:00 Latvijas Universitātes Ģeogrāfijas un Zemes zinātņu fakultātē (alberta ielā 10, rīgā).
ar promocijas darbu un tā kopsavilkumu var iepazīties Latvijas Universitātes Bibliotēkā rīgā, raiņa bulvārī 19.
LU vides zinātņu nozares promocijas padomes priekšsēdētājs: prof., Dr. biol. Viesturs Melecis
promocijas padomes sekretāreasoc. prof., Dr. biol. Gunta Spriņģe
© Zane vincēviča-Gaile, 2014© Latvijas Universitāte, 2014
IEGULDĪJUMS TAVĀ NĀKOTNĒ

145
AnotĀCIJA
Bez vitāli svarīgo mikro- un makroelementu ieneses pārtikā no vides (augsnes, ūdens un gaisa) ir iespējams arī barības ķēdes, t. sk., pārtikas piesārņojums ar toksiskiem vai potenciāli toksiskiem elementiem, piemēram, as, cd, hg, pb. promocijas darba mērķa ietvaros tika veikta Latvijā iegūtu pārtikas produktu paraugu mikro- un makroelementu sastāva kvantitatīvā analīze, lai noskaidrotu vides apstākļu ietekmi uz elementu koncen-trāciju un ieneses ceļiem pārtikā. papildus, lai vērtētu elementu biopieejamību barības ķēdē, tika veikta eksperimentāla pārtikas kultūraugu audzēšana mākslīgi piesārņotā aug-snē. iegūtie dati liecina par vairāku dabiskas un antropogēnas izcelsmes vides apstākļu, piemēram, sezonalitātes, botāniskās izcelsmes, vietas specifisku apstākļu, lauksaimniecī-bas prakses, pārtikas pārstrādes ietekmi uz elementu koncentrāciju pārtikā.
Atslēgvārdi: mikro- un makroelementi, kvantitatīvā analīze, elementu pārnese, pārti-kas sastāvs, vide, Latvija.

146
SAtURSVispārīgs darba raksturojums .................................................................................. 147
1. teorētiskais pamatojums ...................................................................................... 1531.1. Mikro-unmakroelementunozīmeunienesesceļipārtikā ................................... 1531.2. Elementubiopieejamībabarībasķēdē................................................................... 1541.3. Jaunākiemikro-unmakroelementusaturapētījumiLatvijā ................................ 155
2. Materiāli un metodes ............................................................................................ 1562.1. Pārtikasparauguievākšanaunsagatavošanaanalīzei .......................................... 156
2.1.1. Pārtikasparauguievākšana ........................................................................ 1562.1.2. Pārtikasparaugusagatavošanapirmskvantitatīvāsanalīzes ..................... 1602.1.3. Kvantitatīvāsanalīzesmetodes .................................................................. 161
2.2. Eksperimentālapārtikaskultūrauguaudzēšana .................................................... 1622.2.1. Augsnesparauguanalīzeunsagatavošana ................................................. 1622.2.2. Augsnesunauguparaugufrakcionēšanasanalīze ..................................... 163
3. Rezultāti un diskusija ............................................................................................ 1643.1. Videsapstākļuietekmjuuzelementusaturupārtikāizvērtējums ......................... 164
3.1.1. Sezonalitātesietekmeuzelementukoncentrāciju ...................................... 1643.1.2.Botāniskāsizcelsmesietekmeuzelementukoncentrācijupārtikā ............. 1653.1.3. Lauksaimniecībaspraksesietekmeuzelementukoncentrācijupārtikā ..... 167
3.2. Elementubiopieejamībasnovērtējums ................................................................. 1693.2.1. Augsnes paraugu raksturojums .................................................................. 1693.2.2. Elementuakumulācijaeksperimentāliaudzētajospārtikaskultūraugos .... 1703.2.3. Elementubiopieejamībabarībasķēdessegmentāaugsne-augs ................. 1713.2.4. Elementubiopieejamībasaspektibarībasķēdessegmentā
augs-cilvēks–pētījumsarlapusalātiem .................................................... 172
Secinājumi ................................................................................................................. 174
Izmantotā literatūra .................................................................................................. 176

147
VISPĀRīGS DARBA RAKStURoJUMS
Ievadspārtika un dzeramais ūdens ir galvenie avoti, lai nodrošinātu cilvēka organismu ar
barības vielām. Bez pamata uzturvielām, taukiem, ogļhidrātiem un olbaltumvielām, nor-mālai funkcionēšanai cilvēka organismam nepieciešami vitamīni, aminoskābes, fermenti, šķiedrvielas, kā arī mikro- un makroelementi. makroelementi (ca, K, mg, na) un mik-roelementi (piemēram, co, cr, cu, fe, mn, mo, se, v, Zn) ir vitāli nepieciešami normā-lai cilvēka organisma attīstībai un funkcionēšanai, nodrošinot organisma audos neitrālu reakciju un noteiktu osmotisko spiedienu, piedaloties šūnu kairinājuma-uzbudinājuma procesos, veicinot vai kavējot fermentu darbību un tādējādi ietekmējot organisma viel-maiņas procesus (aras and ataman, 2006; fraga, 2005). tomēr dažādu dabīgu vai antro-pogēnu vides apstākļu ietekmē uzturā var nonākt arī potenciāli kaitīgi elementi, piemē-ram, as, cd, hg, pb, tāpēc svarīgi novērtēt iespējamos elementu ieneses ceļus pārtikā un potenciālos riskus patērētājam.
Lai gan ir plaši pieejama informācija par pārtikas ķīmisko sastāvu un uzturvērtību, kas apkopota rokasgrāmatās, piemēram, Burgerstein’s handbook of nutrition (Zimmermann, 2001), Handbook of nutrition and food (Berdanier et al., 2007), Uztura mācība (Zariņš un neimane, 2009) vai datu bāzes (piemēram, Usda, s.a.), ko veidojušas lauksaimnie-cības un uztura pētniecības un uzraudzības iestādes, mikro- un makroelementu saturs reģionāli iegūtos pārtikas produktos ir mainīgs, par ko liecina daudzi zinātniskie pētī-jumi (aberoumand and deokule, 2010; ekholm et al., 2007; ferre-huguet et al., 2008; hashmi et al., 2007). specifiski vides apstākļi mijiedarbībā ar antropogēnām ietekmēm var ietekmēt elementu ienesi un koncentrāciju pārtikā. piemēram, elementu saturs aug-snē var ietekmēt veģetācijas sastāvu, ko patērē dzīvnieki vai kas tiek izmantota cilvēka uzturā, tādējādi elementi no vides nonāk barības ķēdē. pārtikas piesārņojums ar toksis-kiem un potenciāli toksiskiem elementiem var ietekmēt cilvēka veselību, ilgmūžību un dzīves kvalitāti kopumā (combs, 2005; fraga, 2005; nabrzyski, 2007). tādējādi reģionāla vai izcelsmes vietas specifiska pārtikas analīze ir svarīgs faktors tās vērtības un drošības novērtēšanā.
informācija par mikro- un makroelementu koncentrāciju reģionāli ražotā pārtikā var būt kā rādītājs reģionālai elementu fona koncentrācijai vidē. Kvantitatīvie dati par mikro- un makroelementu saturu pārtikā ir nozīmīgs rādītājs, izmantojams riska no-vērtējuma analīzē, lai noskaidrotu elementu deficītu vai pretēji, pārmērīgu saturu uztu-rā (Goldhaber, 2003). tādējādi mikro- un makroelementu satura pārtikā analīze var būt kā objekts starpdisciplināriem pētījumiem, kas ietver vides, ķīmijas, uztura un veselības zinātnes.
Promocijas darba mērķisizpētīt mikro- un makroelementu kvantitatīvo sastāvu izvēlētos pārtikas produktos
Latvijā, lai raksturotu vides un antropogēno apstākļu ietekmi uz elementu saturu un kon-centrāciju, kā arī ieneses intensitāti pārtikā no vides un iespējamo biopieejamību barības ķēdē augsne-augs-cilvēks.

148
Promocijas darba uzdevumi � metodikas pielāgošana un pilnveidošana pārtikas paraugu ievākšanai, sagatavoša-
nai, priekšapstrādei un kvantitatīvai analīzei, ņemot vērā kvalitātes nodrošinājuma prasības.
� izvēlēties pārtikas paraugu veidus un ievākt paraugus Latvijas teritorijā; veikt pa-raugu sagatavošanu, priekšapstrādi un kvantitatīvo analīzi mikro- un makroele-mentu satura noteikšanai; izstrādāt shematisku pārskatu iespējamo vides apstākļu un antropogēno ietekmju novērtējumu uz elementu koncentrāciju analizētajos pārtikas paraugos.
� izpētīt mikro- un makroelementu iespējamos ieneses ceļus pārtikā no vides (aug-snes, ūdens, gaisa) un antropogēniem avotiem, kā arī novērtēt elementu biopieeja-mību barības ķēdes segmentos augsne-augs un augs-cilvēks.
� novērtēt potenciālos riskus patērētājam attiecībā uz elementu ienesi uzturā, kā arī veikt iegūto datu salīdzinājumu starptautiskā mērogā.
pētījuma galvenais ietvars – izvēlēto pārtikas produktu Latvijā skrīninga analīze, lai novērtētu mikro- un makroelementu koncentrācijas maiņu tendences iespējamo vides apstākļu ietekmē.
Hipotēzemikro- un makroelementu kvantitatīvā analīze Latvijā pieejamos pārtikas produktos
ir viens no pārtikas kvalitātes, drošības un uzturvērtības rādītājiem, kas var mainīties da-bīgu un antropogēnu vides apstākļu ietekmē.
Izvirzītās tēzes1. mikro- un makroelementu kvantitatīvā sastāva noteikšana pārtikas produktu
paraugos izmantojot analītiskās ķīmijas analīzes metodes – izaicinājums pārtikas analīzes metodoloģijas pilnveidošanai un skrīninga metožu attīstības izstrādei.
2. mikro- un makroelementu kvantitatīvā sastāva analīze pārtikā ir būtisks pārtikas drošības un kvalitātes novērtējuma rādītājs, ko var pētīt apzinot specifisku pārtikas ieguves apstākļu kopumu.
3. sezonalitāte, vietas specifiskie, botāniskie faktori, lauksaimniecības prakse, pārti-kas pārstrādes procesi – apstākļi, kas ietekmē pārtikas sastāvu attiecībā uz mikro- un makroelementu saturu un koncentrāciju.
4. elementu biopieejamības izpēte barības ķēdes posmos – nozīmīgs iespējamā piesārņojuma apjoma ieneses ar pārtiku uzturā novērtējuma aspekts.
5. pārtikas kvantitatīva analīze ir perspektīvs pētījumu virziens vides, ķīmijas un ve-selības zinātņu nozarēs, kas potenciāli jāattīsta plašākā mērogā.
149
Promocijas darba novitāte � analītiskās metodoloģijas pielietojums pārtikas un vides paraugu analīzē ar iespē-
jamu virzību uz racionālāku metožu izvēli, ekspresmetožu attīstīšanu pārtikas kva-litātes novērtēšanā, ko var ieviest pārtikas kvalitātes uzraudzības procedūrā.
� starpnozaru pētnieciskās pieejas attīstība vides apstākļu un antropogēno ietekmju uz pārtikas sastāvu novērtēšanai ar mērķi saistīt tādas nozares kā vides zinātne, pārtikas zinātne un veselības zinātnes.
� salīdzinošs ietekmējošo faktoru izvērtējums uz elementu akumulāciju barības ķēdē un atsevišķos tās posmos, kā arī dažādu apstākļu ietekmes izpēte uz elementu koncentrāciju pārtikā, piemēram, pārtikas ieguves intensīvā lauksaimniecībā salī-dzinājums ar bioloģisko lauksaimniecību u.tml.
� mikro- un makroelementu analīzes pirkstu nospieduma koncepcijas attīstīšana kā līdzeklis reģionāli iegūtas pārtikas un vides saiknes identificēšanai, kas piemēroja-ma pārtikas izcelsmes un autentiskuma noteikšanā.
Promocijas darba praktiskā nozīmepirmo reizi veikta plaša mēroga pārtikas produktu mikro- un makroelementu satura
kvantitatīva analīze Latvijā, kas izvērtēta starpdisciplināri, lai izpētītu vides apstākļu un antropogēnās ietekmes uz elementu koncentrāciju. iegūti nozīmīgi dati, kas izmantojami turpmākos elementu biopieejamības pētījumos, kā arī ilgtspējīgas lauksaimniecības stra-tēģiju izstrādē.
iegūtie dati izmantojami pārtikas drošības un riska analīzē, kā arī sabiedrības vese-lības un vides faktoru ietekmju integrētā analīzē. iegūtos datus iespējams salīdzināt ar citu valstu pētījumiem, tādējādi iegūstot Latvijas izcelsmes pārtikas produktu kvalitātes vērtējumu starptautiskā mērogā.
Promocijas darba rezultātu aprobācijapromocijas darba rezultāti ir apspriesti un atspoguļoti 12 zinātniskās publikācijās,
15 ziņojumos starptautiskās zinātniskās konferencēs un 10 referātos vietēja mēroga kon-ferencēs Latvijā.
promocijas darba izstrādes ietvaros autore vadījusi 4 bakalaura darbus un sniegusi konsultācijas 3 maģistra darbu izstrādē.
Zinātniskās publikācijas:1. Vincevica-Gaile, Z., Klavins, m. (2013) concentration of elements in food: how can
it reflect impact of environmental and other influencing factors? Scientific Journal of Riga Technical University, Series: Environmental & Climate Technologies 12: 15-19.
2. stapkevica, m., Vincevica-Gaile, Z., Klavins, m. (2013) metal uptake from contami-nated soils by some plant species – radish, lettuce, dill. Research for Rural Development 1: 43-49.
3. Vincevica-Gaile, Z., Klavins, m., rudovica, v., viksna, a. (2013) research review trends of food analysis in Latvia: major and trace element content. Environmental Geochemistry & Health 35: 693-703.
150
4. Vincevica-Gaile, Z., rudovica, v., Burlakovs, J., Klavins, m., priedite, e. (2013) analysis of major and trace elements in food: aspects of methodological applica-tions. SGEM 2013 GeoConference Proceedings on Ecology, Economics, Education and Legislation 1: 49-56.
5. Vincevica-Gaile, Z., Gaga, K., Klavins, m. (2013) food and environment: trace ele-ment content of hen eggs from different housing types. APCBEE Procedia 5: 221-226.
6. Vincevica-Gaile, Z., Klavins, m. (2012) transfer of metals in food chain: an exam-ple with copper and lettuce. Scientific Journal of Riga Technical University, Series: Environmental & Climate Technologies 10: 21-24.
7. Vincevica-Gaile, Z., Klavins, m. (2012) root vegetables from Latvia: Quantitative analysis of potentially toxic elements. Research for Rural Development 1: 131-136.
8. Vincevica-Gaile, Z., Klavins, m., rudovica, v., viksna, a. (2012) potentially toxic metals in honey from Latvia: is there connection with botanical origin? in: ramos, r.a.r., straupe, i., panagopoulos, t. (eds.) Recent Researches in Environment, Energy Systems and Sustainability. Wseas press: faro, 297 p., 158-163.
9. Vincevica-Gaile, Z., Klavins, m., rudovica, v., viksna, a. (2011) trace and major elements in food articles in Latvia: root vegetables. Scientific Journal of Riga Technical University, Series: Environmental and Climate Technologies 13(7): 119-124.
10. Vincevica-Gaile, Z., Klavins, m., rudovica, v., viksna, a. (2011) Geographical disse-mination of trace and major elements in honey. in: Brebbia, c.a. (ed.) Sustainability Today. Wit press: southampton, 488 p., 211-220.
11. Vincevica-Gaile, Z., Klavins, m., Zilgalve, L. (2011) trace and major element con-centration in cottage cheese from Latvia. in: mastorakis, n., mladenov, v., savkovic-stevanovic, J. (eds.) Recent Researches in Sociology, Financing, Environment and Health Sciences. Wseas press: meloneras, 356 p., 169-173.
12. Vincēviča-Gaile, Z. (2010) makro- un mikroelementu saturs medū. Latvijas Lauksaimniecības Universitātes Raksti 25(320): 54-66.
Ziņojumi starptautiskajās konferencēs:1. rīgas tehniskās universitātes 54. starptautiskā zinātniskā konference. Latvija, rīga,
2013. gada 14.-16. oktobrī. referāts “Quantitative content of elements in food: how can it reflect impact of environmental and other influencing factors?” (Vincēviča-Gaile, Z., Kļaviņš, m.)
2. iUpac (International Union of Pure and Applied Chemistry) 44. pasaules ķīmijas kon-gress. turcija, stambula, 2013. gada 8.-16. augustā. referāts “metal uptake and bio-availability: from soil to food through crops” (Vincēviča-Gaile, Z., stapkēviča, m., dūdare, d., Kļaviņš, m.)
3. 13. starptautiskā multidisciplinārā ģeokonference SGEM 2013. Bulgārija, albena, 2013. gada 16.-22. jūnijā. referāts “analysis of major and trace elements in food: aspects of methodological applications” (Vincēviča-Gaile, Z., rudoviča, v., Burlakovs, J., Kļaviņš, m.)
4. 19. ikgadējā starptautiskā zinātniskā konference Research for Rural Development 2013. Latvija, Jelgava, 2013. gada 15.-17. maijā. referāts “metal uptake from contamina-ted soils by some plant species (radish, lettuce, dill)” (stapkēviča, m., Vincēviča-Gaile, Z., Kļaviņš, m.)
151
5. starptautiskā zinātniskā konference Environmental Health 2013, Science and Policy to Protect Future Generations. asv, Bostona, 2013. gada 3.-6. martā. referāts “presence of arsenic in baby food: is it the issue of concern?” (Vincēviča-Gaile, Z., Lawgali, y.f., meharg, a.a., Kļaviņš, m.)
6. 14. starptautiska zinātniskā konference Environmental Science and Development. aae, dubaija, 2013. gada 19.-20. janvārī. referāts “food and environment: trace element content of hen eggs from different housing types” (Vincēviča-Gaile, Z., Gāga, K., Kļaviņš, m.)
7. rīgas tehniskās universitātes 53. starptautiskā zinātniskā konference. Latvija, rīga, 2012. gada 11.-12. oktobrī. referāts “transfer of metals in food chain: an example with copper and lettuce” (Vincēviča-Gaile, Z., Kļaviņš, m.)
8. Ķīnas-eiropas simpozijs Environment and Health, SESEH 2012. Īrija, Golveja, 2012. gada 20.-25. augustā. referāts “research of food from Latvia: analysis of es-sential elements and possible contaminants” (Vincēviča-Gaile, Z., Kļaviņš, m., rudoviča, v., vīksna, a.)
9. 18. ikgadējā starptautiskā zinātniskā konference Research for Rural Development 2012. Latvija, Jelgava, 2012. gada 16.-18. maijā. referāts “root vegetables from Latvia: Background levels and risks of contamination with toxic elements” (Vincēviča-Gaile, Z., Kļaviņš, m.)
10. 8. iasme/Wseas (International Association of Mechanical Engineering / World Scientific and Engineering Academy and Society) starptautiskā zinātniskā konferen-ce Energy, Environment, Ecosystems and Sustainable Development, EEESD 2012. portugāle, faro, 2012. gada 2.-4. maijā. referāts “potentially toxic metals in ho-ney from Latvia: is there connection with botanical origin?” (Vincēviča-Gaile, Z., Kļaviņš, m., rudoviča, v., vīksna, a.)
11. 12. eirāzijas ķīmijas zinātņu konference EuAsC2S 2012. Grieķija, Korfu, dāsija, 2012. gada 16.-21. aprīlī. referāts “trace and major elements in root vegetables: a study in Latvia” (Vincēviča-Gaile, Z., Kļaviņš, m., rudoviča, v., vīksna, a.)
12. apvienotais pasaules latviešu zinātnieku 3. kongress un Letonikas 4. kongress (pLZK), sekcija Vides kvalitāte Latvijā: esošais stāvoklis, izaicinājumi, risinājumi. Latvija, rīga, 2011. gada 24.-27. oktobrī. referāts “mikro- un makroelementu analīze dārzeņos vi-des zinātnes kontekstā” (Vincēviča-Gaile, Z., Kļaviņš, m., rudoviča, v., vīksna, a.)
13. 4. starptautiskā zinātniskā konference Medical Geology, GEOMED 2011. itālija, Bari, 2011. gada 20.-25. septembrī. referāts “risk and benefit assessment of trace and ma-jor elements detected in honey of different origins” (Vincēviča-Gaile, Z., Kļaviņš, m., rudoviča, v., vīksna, a.)
14. 1. starptautiskā zinātniskā konference Food and Environment, FENV 2011. apvienotā Karaliste, ņūforesta, Lindhērsta, 2011. gada 21.-23. jūnijā. referāts “Geographical dis-semination of trace and major elements in honey” (Vincēviča-Gaile, Z., Kļaviņš, m., rudoviča, v., vīksna, a.)
15. 2. Wseas (World Scientific and Engineering Academy and Society) starptautiskā zināt-niskā konference Environment, Medicine and Health Sciences, EMEH 2011. spānija, Grankanārija, meloneras, 2011. gada 24.-26. martā. referāts “trace and major ele-ment concentration in cottage cheese from Latvia” (Vincēviča-Gaile, Z., Zilgalve, L., Kļaviņš, m.)
152
Ziņojumi vietēja mēroga konferencēs:1. LU 72. zinātniskā konference. rīga, 2014. gada 27. janvārī. referāts “vides ietekme uz
mikroelementu sastāvu pārtikā: graudaugu produktu analīze” (Vincēviča-Gaile, Z., Gāga, K., rudoviča, v., Kļaviņš, m.) Kopsavilkums publicēts: Ģeogrāfija. Ģeoloģija. Vides zinātne: Referātu tēzes, 67-69.
2. LU 71. zinātniskā konference. rīga, 2013. gada 29. janvārī. referāts “smago metālu ienese barības ķēdē augsne-augs” (stapkēviča, m., Vincēviča-Gaile, Z., Kļaviņš, m.) Kopsavilkums publicēts: Ģeogrāfija. Ģeoloģija. Vides zinātne: Referātu tēzes, 215-216.
3. LU 70. zinātniskā konference. rīga, 2012. gada 31. janvārī. referāts “mikro- un makroelementu saturs sakņu dārzeņos Latvijā” (Vincēviča-Gaile, Z., Kļaviņš, m., rudoviča, v., vīksna, a.) Kopsavilkums publicēts: Ģeogrāfija. Ģeoloģija. Vides zinātne: Referātu tēzes, 398-399.
4. LU 70. zinātniskā konference. rīga, 2012. gada 31. janvārī. referāts “metālu (cu2+
piemērā) pārnese barības ķēdē: augsne-augs” (Vincēviča-Gaile, Z., Kļaviņš, m.) Kopsavilkums publicēts: Ģeogrāfija. Ģeoloģija. Vides zinātne: Referātu tēzes, 397-398.
5. LU 70. zinātniskā konference. rīga, 2012. gada 31. janvārī. referāts “pilnīgas atsta-rošanas rentgenfluorescences spektrometrijas pielietojums šķidru paraugu tiešai analīzei” (Vincēviča-Gaile, Z., purmalis, o., Kļaviņš, m.) Kopsavilkums publicēts: Ģeogrāfija. Ģeoloģija. Vides zinātne: Referātu tēzes, 400-401.
6. LU 70. zinātniskā konference. rīga, 2012. gada 31. janvārī. referāts “sezonālā iete-kme uz mikro- un makroelementu saturu vistu olās” (Gāga, K., Vincēviča-Gaile, Z., Kļaviņš, m.) Kopsavilkums publicēts: Ģeogrāfija. Ģeoloģija. Vides zinātne: Referātu tēzes, 291-292.
7. LU 70. zinātniskā konference. rīga, 2012. gada 31. janvārī. referāts “Botāniskās izcels-mes ietekme uz elementu saturu medū Latvijā” (priedīte, e., Vincēviča-Gaile, Z., Kļaviņš, m., rudoviča, v., vīksna, a.) Kopsavilkums publicēts: Ģeogrāfija. Ģeoloģija. Vides zinātne: Referātu tēzes, 356-357.
8. LU 69. zinātniskā konference. rīga, 2011. gada februārī. referāts “Ķīmisko ele-mentu satura biezpienā mainību ietekmējošie vides faktori” (Vincēviča-Gaile, Z., Zilgalve, L., Kļaviņš, m.) Kopsavilkums publicēts: Ģeogrāfija. Ģeoloģija. Vides zinātne: Referātu tēzes, 501-504.
9. LU 69. zinātniskā konference. rīga, 2011. gada februārī. referāts “mikro- un ma-kroelementu satura medū nozīme vides zinātnes skatījumā” (Vincēviča-Gaile, Z., Bula, r., Kļaviņš, m.) Kopsavilkums publicēts: Ģeogrāfija. Ģeoloģija. Vides zinātne: Referātu tēzes, 499-501.
10. LU 68. zinātniskā konference. rīga, 2010. gada februārī. referāts “selēna bioģeoķīmiskā nozīmība” (Vincēviča-Gaile, Z.) Kopsavilkums publicēts: Ģeogrāfija. Ģeoloģija. Vides zinātne: Referātu tēzes, 440-442.

153
1. teoRētISKAIS PAMAtoJUMS
1.1. Mikro- un makroelementu nozīme un ieneses ceļi pārtikā
Bez pamatelementiem (c, h, n un o), kas veido līdz pat 97 % no dzīvās matērijas, ķīmiskie elementi tiek iedalīti makroelementos un mikroelementos, atkarībā no to vidē-jās koncentrācijas organismā, kā arī ņemot vērā nepieciešamo ikdienas nodrošinājumu. makroelementi (ca, cl, K, mg na, p, s) organisma normālai attīstībai un funkcionēšanai nepieciešami salīdzinoši lielā daudzumā; katrs no tiem veido aptuveni 0,03-1,4 % no cil-vēka ķermeņa masas. savukārt, mikroelementu grupa ietver tādus elementus kā piemē-ram ag, al, as, au, B, Ba, co, cr, cu, f, fe, i, mn, mo, ni, rb, se, sn, sr, v, Zn un to koncentrācija organismā ir mainīga – no mazāk par 0,1 mg/kg līdz vairāk nekā 100 mg/kg. nepieciešamā mikroelementu dienas deva parasti nepārsniedz 100 mg/dienā, bet makroelemenus parasti jāuzņem no 100 līdz >1000 mg/dienā (abrahams, 2002; aras and ataman, 2006; fraga, 2005). no visiem zināmajiem ķīmiskajiem elementiem aptuveni 50 elementus var atrast dzīvo organismu, tostarp augu, dzīvnieku un cilvēku audos un šū-nās, bet tikai 23 elementiem ir pierādīta fizioloģiskā nozīmība cilvēka organismā (combs, 2005; fraga, 2005; Goldhaber, 2003). a. Kabata-pendias un a.B. mukherjē (2007) ķīmis-kos elementos pēc to nepieciešamības dzīviem organismiem sarindo šādi: a) vitāli nepie-ciešamie elementi – as, B, Br, cl, co, cr, cu, f, fe, i, Li, mn, mo, p, s, se, si, v un Zn; b) iespējams nepieciešamie elementi – al, Ba, Ge, ni, rb, sn, sr un ti; c) elementi, kas nav nepieciešami – ag, au, cs, hf, in, ir, sb, ta, te, U, y, Zr un retzemju elementi; d) ele-menti, kas nav nepieciešami un toksiski – Be, Bi, cd, hg, pb un tl. tomēr šis iedalījums var mainīties balstoties uz jaunākajiem atklājumiem zinātnē.
pārtika ir nozīmīgākais elementu avots cilvēka organismam, tāpēc svarīgi ir apzināt elementu ieneses ceļus pārtikas produktos no vides – augsnes, ūdens un gaisa – jo iespē-jama ne tikai vitāli nepieciešamo elementu pārnese, bet arī pārtikas piesārņojums ar tok-siskiem un potenciāli toksiskiem elementiem. mūsdienās rūpnieciska pārtikas ražošana ir strauji attīstījusies, un ir stingri ierobežota ar likumiem un noteikumiem, kas nosaka gan pārtikas enerģētisko vērtību, gan pieļaujamo potenciāli toksisko elementu klātbūtni, tomēr augu un dzīvnieku izcelsmes pārtika, ko ražo zemnieku saimniecības, kā arī māj-saimniecības joprojām ir pakļauta reģionālai vides faktoru ietekmei. taču šīs ietekmes vietējā mērogā ir maz pētītas.
elementu aprite vidē notiek nemitīgi, un to ienese barības ķēdē un cilvēka uzturā var notikt tiešā un netiešā veidā (1.1. attēls).
ņemot vērā spēju uzņemt elementus tieši no augsnes, ūdens un gaisa, augus var vērtēt kā galvenos ekosistēmas komponentus, kas iesaistīti elementu pārnesē no vides pārtikā. Barības ķēdē notiek ne tikai elementu biokoncentrēšanās, bet arī augsnē un ūdenī esošo savienojumu resintezēšana, lai tie kļūtu biopieejami ķēdes augstākos posmos. tā kā aug-sne ir galvenais minerālvielu avots, tad elementu pārnese no vides pārtikā var tikt apskatī-ta arī ģeoloģiskās izpētes aspektā (Bowman et al., 2003; combs, 2005). tādējādi elementu saturs pārtikā ar zināmu izcelsmes vietu var būt atkarīgs no elementu satura augsnē un ūdenī. elementu ienese pārtikā no atmosfēras parasti notiek mazākā mērā un vairāk at-karīga no gaisā esošo daļiņu daudzuma, izmēra un ķīmiskā sastāva – jo mazāks ir daļiņu
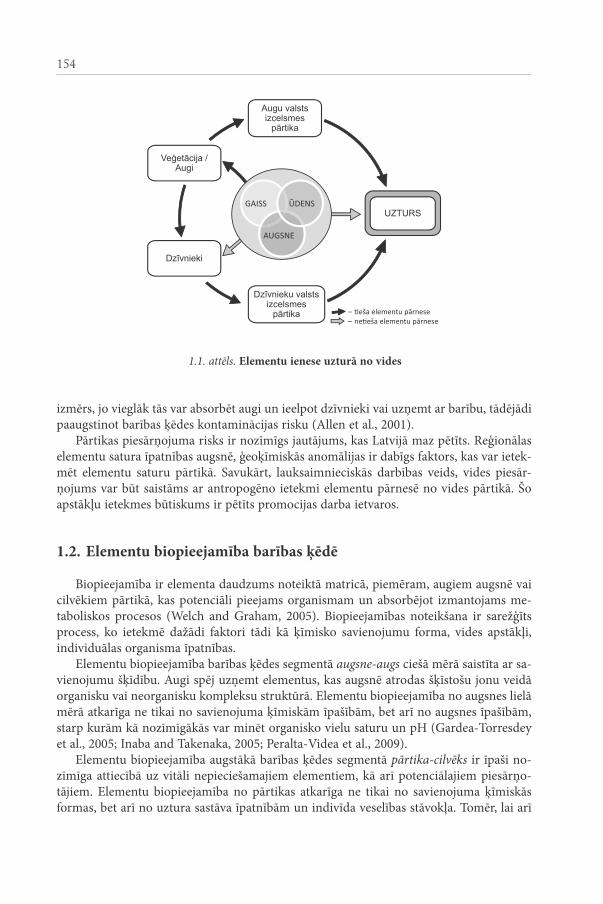
154
izmērs, jo vieglāk tās var absorbēt augi un ieelpot dzīvnieki vai uzņemt ar barību, tādējādi paaugstinot barības ķēdes kontaminācijas risku (allen et al., 2001).
pārtikas piesārņojuma risks ir nozīmīgs jautājums, kas Latvijā maz pētīts. reģionālas elementu satura īpatnības augsnē, ģeoķīmiskās anomālijas ir dabīgs faktors, kas var ietek-mēt elementu saturu pārtikā. savukārt, lauksaimnieciskās darbības veids, vides piesār-ņojums var būt saistāms ar antropogēno ietekmi elementu pārnesē no vides pārtikā. Šo apstākļu ietekmes būtiskums ir pētīts promocijas darba ietvaros.
1.2. elementu biopieejamība barības ķēdē
Biopieejamība ir elementa daudzums noteiktā matricā, piemēram, augiem augsnē vai cilvēkiem pārtikā, kas potenciāli pieejams organismam un absorbējot izmantojams me-taboliskos procesos (Welch and Graham, 2005). Biopieejamības noteikšana ir sarežģīts process, ko ietekmē dažādi faktori tādi kā ķīmisko savienojumu forma, vides apstākļi, individuālas organisma īpatnības.
elementu biopieejamība barības ķēdes segmentā augsne-augs ciešā mērā saistīta ar sa-vienojumu šķīdību. augi spēj uzņemt elementus, kas augsnē atrodas šķīstošu jonu veidā organisku vai neorganisku kompleksu struktūrā. elementu biopieejamība no augsnes lielā mērā atkarīga ne tikai no savienojuma ķīmiskām īpašībām, bet arī no augsnes īpašībām, starp kurām kā nozīmīgākās var minēt organisko vielu saturu un ph (Gardea-torresdey et al., 2005; inaba and takenaka, 2005; peralta-videa et al., 2009).
elementu biopieejamība augstākā barības ķēdes segmentā pārtika-cilvēks ir īpaši no-zīmīga attiecībā uz vitāli nepieciešamajiem elementiem, kā arī potenciālajiem piesārņo-tājiem. elementu biopieejamība no pārtikas atkarīga ne tikai no savienojuma ķīmiskās formas, bet arī no uztura sastāva īpatnībām un indivīda veselības stāvokļa. tomēr, lai arī
Veģetācija / Augi
Augu valsts izcelsmes
pārtika
Dzīvnieku valsts izcelsmes
pārtika
GAISS
AUGSNE
ŪDENS UZTURSUZTURS
– �eša elementu pārnese – ne�eša elementu pārnese
Dzīvnieki
1.1. attēls. elementu ienese uzturā no vides
155
kopējais elementu saturs pārtikā neatspoguļo elementu biopieejamību, pētījumos in vivo un in vitro daudziem elementiem ir aprēķināta biopieejamības pakāpe (parasti izteikta %) (atsdr, s.a.), ko var izmantot pārtikas uzturvērtības, kā arī drošības izvērtēšanā, zinot elementu kvantitatīvo sastāvu.
1.3. Jaunākie mikro- un makroelementu satura pētījumi Latvijā
ar elementu analīzi saistītie pētījumi Latvijā izvērtēti balstoties uz starptautiskajās zi-nātniskajās datu bāzēs (Scopus, Science Direct, Springer Link un ISI Web of Knowledge) pieejamajiem zinātniskajiem rakstiem, kas publicēti laikā no 2000. gada līdz 2013. gadam.
ir pieejams plašs informācijas klāsts par elementu pētījumiem vides objektos. piemēram, detalizētu pētījumu, lai noteiktu vides faktoru ietekmi uz elementu saturu rīgas ielu apstādījumos, ir veikusi G. Čekstere ar kolēģiem (Čekstere, 2011; cekstere and osvalde, 2013; cekstere and osvalde, 2010a; cekstere and osvalde, 2010b; cekstere et al., 2008). savukārt, gaisa piesārņojuma un elementu satura sūnās mijiedarbība pētīta prof. o. nikodemus vadībā (nikodemus et al., 2004; tabors et al., 2004). arī somijas zinātnieki r. salminena (2011) vadībā pētījuši elementu sadalījumu sūnās un organiskajā augsnes slānī austrumbaltijas reģionā. elementu saturu Latvijas augsnēs sava promocijas darba ietvaros analizējis a. Gilucis (2007), kā arī pieejami dati par metālisko elementu izgulsnēšanos meža augsnēs (Brumelis et al., 2002; Kasparinskis and nikodemus, 2012).
plaši pētījumi veikti analizējot elementu un barības vielu saturu iekšzemes ūdeņos (aldahan et al., 2006; Klavins et al., 2001; Klavins et al., 2000; Kokorite et al., 2010; stalnacke et al., 2003) un ezeru nogulumos (Klavins et al., 2011; Klavins and vircavs, 2001), kā arī daudz pētīti ir purvi (Klavins et al., 2009b; Klavins et al., 2003; silamikele et al., 2011).
ņemot vērā nelielo publikāciju skaitu, var secināt, ka vides faktoru ietekme uz ele-mentu saturu pārtikā Latvijā ir maz pētīts jautājums. Kā piemēru var minēt smago metālu satura izpēti zivīs no ezeriem Latvijā (Klavins et al., 2009a), elementu satura noteikšanu medū Latvijā (dimiņš, 2006) un dažus pētījumus, kas vairāk saistīti ar uzturvielu sastāva novērtēšanu (murniece et al., 2011; osvalde and Karlsons, 2010).
Kopumā var rezumēt, ka promocijas darba ietvaros veiktā mikro- un makroelementu kvantitatiīvā satura pārtikā izpēte ir nozīmīgs starpdisciplinārs pētījums vides, ķīmijas, uztura un veselības zinātņu ietvaros.

156
2. MAteRIĀLI Un MetoDeS
2.1. Pārtikas paraugu ievākšana un sagatavošana analīzei
2.1.1. Pārtikas paraugu ievākšanapārtikas paraugi tika ievākti laikā no 2009. līdz 2013. gadam Latvijas teritorijā.
ievāktie pārtikas paraugi pētījumam (metodoloģija pēc aras and ataman, 2006; ekholm et al., 2007): (i) augu valsts produkti – neapstrādāti, piemēram, augļi un dārzeņi (āboli, burkāni, sīpoli, kartupeļi, salāti) un pēc pārstrādes (graudaugu produkti biezputrām un graudaugu maisījumi bērnu uzturam); (ii) dzīvnieku valsts produkti – neapstrādāti, pie-mēram, bišu produkti (medus, ziedputekšņi, bišu maize), vistu olas, un pēc pārstrādes (biezpiens); (iii) dzērieni - neapstrādāti (ābolu sula, bērzu sula) un pēc pārstrādes (ābolu vīns). ievācot paraugus īpaša vērība tika attiecināta uz pārtikas izcelsmi un sezonalitāti. Kopumā analizēti 510 pārtikas paraugi.
augu valsts izcelsmes pārtikas paraugi: � sakņu dārzeņi – sīpoli Allium cepa (ns
1=98), burkāni Daucus carota (ns=81), kar-tupeļi Solanum tuberosum (ns=55) un kartupeļu miza (ns=6) (2.1., 2.2., 2.3. attēls);
� lapu dārzeņi – lapu salāti Lactuca sativa (ievākti Latvijas teritorijā (ns=7) un au-dzēti piesārņotā augsnē (ns=3) (2.4. attēls);
� augļi – āboli Malus domestica (ns=21) un ābolu miza (ns=3) (2.4. attēls); � graudaugu produkti biezputrām un graudaugu maisījumi bērnu uzturam – graud-
augu produktu maisījumi (ns=10), piemēram, trīsgraudu pārslas, rīsu produkti (ns=10), kviešu produkti (ns=12) un griķu produkti (ns=11).
augu valsts pārtikas paraugi iespēju robežās tika ievākti Latvijas teritorijā, un, ievā-cot paraugus, tika noteikta to izcelsme. paraugi tikai ievākti svaigā veidā tirdzniecības vietās vai tieši no audzētāja. izņemot graudaugu produktus, kuri tika ievākti pieejamos komerciepakojumos, viens paraugs ietvēra 3–5 dārzeņus vai augļus, kas tika nomazgāti, nomizoti, sasmalcināti ar keramikas nazi (Kiocera) un izžāvēti žāvskapī (Labassco) pie temperatūras 80-105 °c atkarībā no mitruma daudzuma paraugā. pēc žāvēšanas paraugi tika saberzti piestā līdz pulvera konsistencei un uzglabāti hermētiski noslēdzamos polieti-lēna maisiņos tumšā un sausā vietā istabas temperatūrā (aras and ataman, 2006).
dzīvnieku valsts izcelsmes pārtikas paraugi: � bišu produkti – medus (ns=80), ziedputekšņi (ns=5) un bišu maize (ns=5)
(2.5. attēls); � biezpiens (ns=27) ar atšķirīgu izcelsmi (zemnieku saimniecības un piena pārstrā-
des uzņēmumi) ievākts vasaras un ziemas sezonās (2.6. attēls); � vistu olas (ns=33) ar atšķirīgu izcelsmi (no bioloģiskām saimniecībām, piemājas
saimniecībām un putnu fermām), kā arī paraugi (ns=24) sezonalitātes ietekmes novērtēšanai, kas ievākti gada garumā piemājas saimniecībā aizkrauklē ar zinā-miem mājputnu turēšanas apstākļiem (2.7. attēls).
1 Šeit un turpmāk ns – paraugu skaits
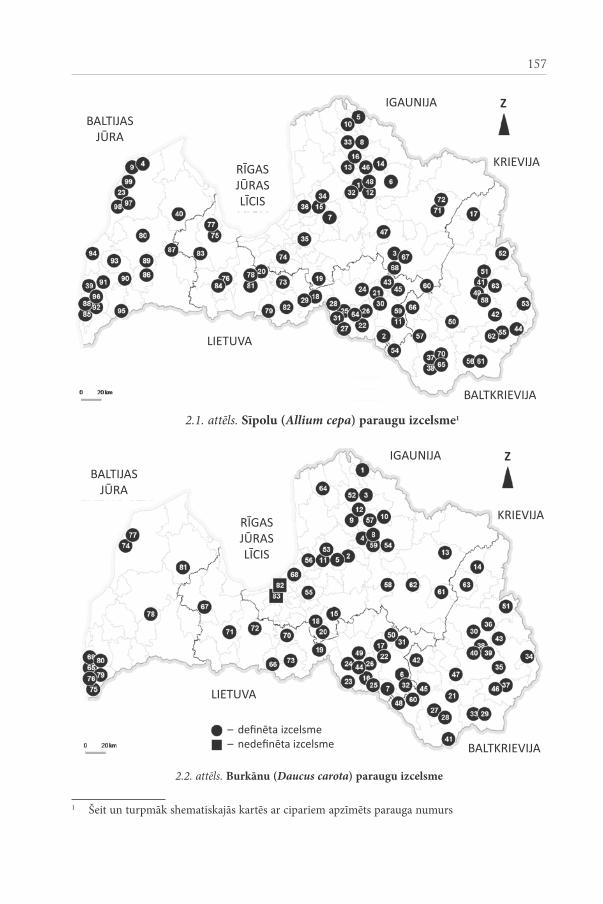
157
BALTIJAS JŪRA
RĪGAS JŪRAS LĪCIS
IGAUNIJA
KRIEVIJA
LIETUVA
BALTKRIEVIJA
Z
2.1. attēls. Sīpolu (Allium cepa) paraugu izcelsme1
1 Šeit un turpmāk shematiskajās kartēs ar cipariem apzīmēts parauga numurs
2.2. attēls. Burkānu (Daucus carota) paraugu izcelsme
BALTIJAS JŪRA
RĪGAS JŪRAS LĪCIS
IGAUNIJA
KRIEVIJA
LIETUVA
BALTKRIEVIJA
Z
– definēta izcelsme– nedefinēta izcelsme

158
BALTIJAS JŪRA
RĪGAS JŪRAS LĪCIS
IGAUNIJA
KRIEVIJA
LIETUVA
BALTKRIEVIJA
Z
2.3. attēls. Kartupeļu (Solanum tuberosum) paraugu izcelsme
2.4. attēls. Salātu (Lactuca sativa) paraugu izcelsme (s) un paraugi, kas audzēti piesārņotā augsnē (x); ābolu (Malus domestica) paraugu izcelsme (a)
BALTIJAS JŪRA
RĪGAS JŪRAS LĪCIS
IGAUNIJA
KRIEVIJA
LIETUVA
BALTKRIEVIJA
Z
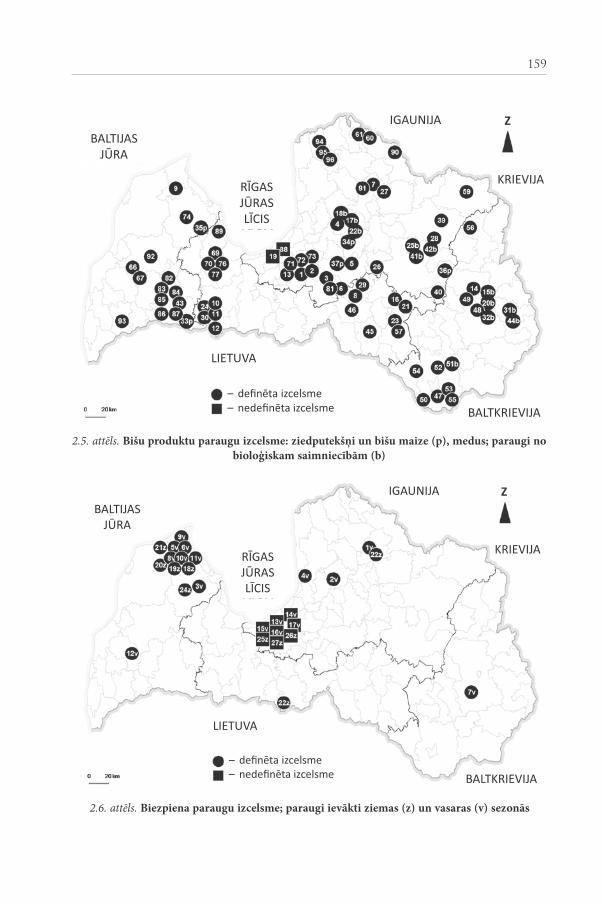
159
BALTIJAS JŪRA
RĪGAS JŪRAS LĪCIS
IGAUNIJA
KRIEVIJA
LIETUVA
BALTKRIEVIJA
Z
– definēta izcelsme– nedefinēta izcelsme
BALTIJAS JŪRA
RĪGAS JŪRAS LĪCIS
IGAUNIJA
KRIEVIJA
BALTKRIEVIJA
Z
LIETUVA
– definēta izcelsme– nedefinēta izcelsme
2.6. attēls. Biezpiena paraugu izcelsme; paraugi ievākti ziemas (z) un vasaras (v) sezonās
2.5. attēls. Bišu produktu paraugu izcelsme: ziedputekšņi un bišu maize (p), medus; paraugi no bioloģiskam saimniecībām (b)
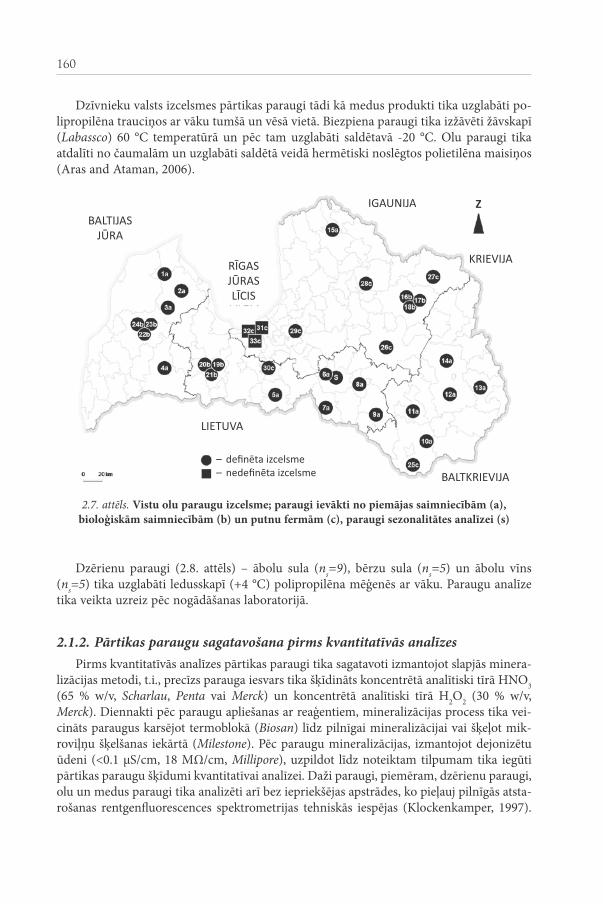
160
dzīvnieku valsts izcelsmes pārtikas paraugi tādi kā medus produkti tika uzglabāti po-lipropilēna trauciņos ar vāku tumšā un vēsā vietā. Biezpiena paraugi tika izžāvēti žāvskapī (Labassco) 60 °c temperatūrā un pēc tam uzglabāti saldētavā -20 °c. olu paraugi tika atdalīti no čaumalām un uzglabāti saldētā veidā hermētiski noslēgtos polietilēna maisiņos (aras and ataman, 2006).
BALTIJAS JŪRA
RĪGAS JŪRAS LĪCIS
IGAUNIJA
KRIEVIJA
LIETUVA
BALTKRIEVIJA
Z
– definēta izcelsme– nedefinēta izcelsme
2.7. attēls. Vistu olu paraugu izcelsme; paraugi ievākti no piemājas saimniecībām (a), bioloģiskām saimniecībām (b) un putnu fermām (c), paraugi sezonalitātes analīzei (s)
dzērienu paraugi (2.8. attēls) – ābolu sula (ns=9), bērzu sula (ns=5) un ābolu vīns (ns=5) tika uzglabāti ledusskapī (+4 °c) polipropilēna mēģenēs ar vāku. paraugu analīze tika veikta uzreiz pēc nogādāšanas laboratorijā.
2.1.2. Pārtikas paraugu sagatavošana pirms kvantitatīvās analīzespirms kvantitatīvās analīzes pārtikas paraugi tika sagatavoti izmantojot slapjās minera-
lizācijas metodi, t.i., precīzs parauga iesvars tika šķīdināts koncentrētā analītiski tīrā hno3 (65 % w/v, Scharlau, Penta vai Merck) un koncentrētā analītiski tīrā h2o2 (30 % w/v, Merck). diennakti pēc paraugu apliešanas ar reaģentiem, mineralizācijas process tika vei-cināts paraugus karsējot termoblokā (Biosan) līdz pilnīgai mineralizācijai vai šķeļot mik-roviļņu šķelšanas iekārtā (Milestone). pēc paraugu mineralizācijas, izmantojot dejonizētu ūdeni (<0.1 μs/cm, 18 mΩ/cm, Millipore), uzpildot līdz noteiktam tilpumam tika iegūti pārtikas paraugu šķīdumi kvantitatīvai analīzei. daži paraugi, piemēram, dzērienu paraugi, olu un medus paraugi tika analizēti arī bez iepriekšējas apstrādes, ko pieļauj pilnīgās atsta-rošanas rentgenfluorescences spektrometrijas tehniskās iespējas (Klockenkamper, 1997).

161
2.1.3. Kvantitatīvās analīzes metodesLai noteiktu mikro- un makroelementu koncentrāciju, pārtikas paraugu šķīdumi tika
analizēti ar šādām kvantitatīvās analīzes metodēm: tXrf – pilnīgas atstarošanas rentgen-fluorescence spektrometrija (röntec picotaX, Röntec GmbH), aas – atomabsorbcijas spektrometrija (aanaLyst 200, Perkin Elmer) un icp-ms – induktīvi saistītas plazmas masas spektrometrija (eLan drc-e, Perkin Elmer). mērījumiem piemērotākā metode tika izvēlēta atkarībā no analizējamā parauga specifikas un nosakāmo elementu spektra. analītisko mērījumu verifikācijai un rezultātu ticamības novērtēšanai tika veikti kontrol-mērījumi izmantojot sertificētus references materiālu paraugus: burkānu sakņu pulveris CS-CR-2 Carrot root powder (LGC Standards), ābolu pulveris NCS ZC73017 Apple pow-der (Promochem), ķērpju pulveris IAEA-336 Lichen (IAEA), vājpiena pulveris BCR-063R Skim milk powder (IRMM) un sarkanā vīna standarta paraugs PT Red wine Chilian (LGC Standards), kas pirms analīzes tika sagatavoti līdzīgi kā analizējamie pārtikas paraugi, mi-neralizējot ar koncentrētu hno3.
analītisko metožu mērījumu precizitātes novērtējuma rādītāji pēc references parauga NCS ZC73017 Apple powder analīzes apkopoti 2.1. tabulā.
2.8. attēls. Dzērienu paraugu izcelsme: ābolu sula (s), bērzu sula (b), ābolu vīns (v)
BALTIJAS JŪRA
RĪGAS JŪRAS LĪCIS
IGAUNIJA
KRIEVIJA
LIETUVA
BALTKRIEVIJA
Z
– definēta izcelsme– nedefinēta izcelsme
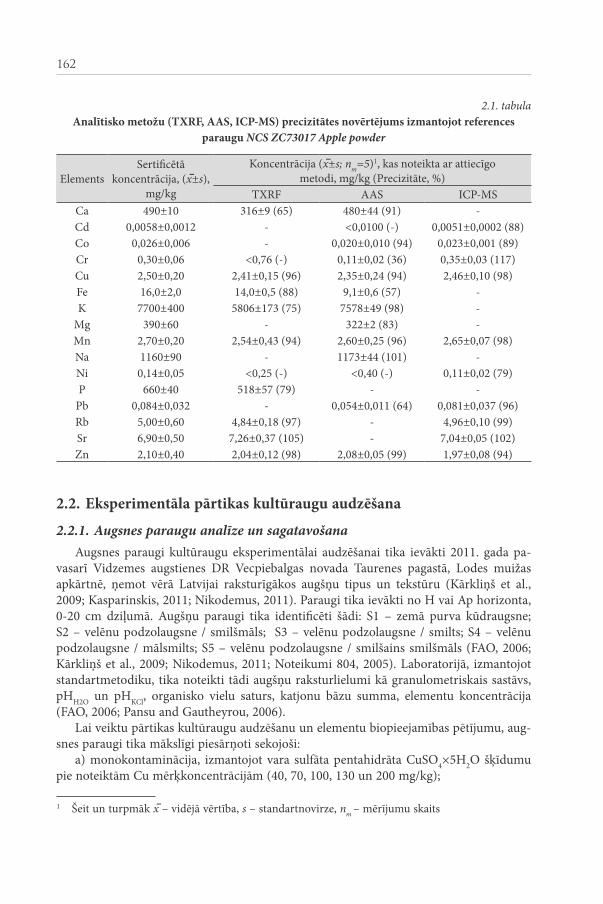
162
2.1. tabulaAnalītisko metožu (tXRF, AAS, ICP-MS) precizitātes novērtējums izmantojot references
paraugu NCS ZC73017 Apple powder
elementssertificētā
koncentrācija, (x̄±s), mg/kg
Koncentrācija (x̄±s; nm=5)1, kas noteikta ar attiecīgo metodi, mg/kg (precizitāte, %)
tXrf aas icp-msca 490±10 316±9 (65) 480±44 (91) -cd 0,0058±0,0012 - <0,0100 (-) 0,0051±0,0002 (88)co 0,026±0,006 - 0,020±0,010 (94) 0,023±0,001 (89)cr 0,30±0,06 <0,76 (-) 0,11±0,02 (36) 0,35±0,03 (117)cu 2,50±0,20 2,41±0,15 (96) 2,35±0,24 (94) 2,46±0,10 (98)fe 16,0±2,0 14,0±0,5 (88) 9,1±0,6 (57) -K 7700±400 5806±173 (75) 7578±49 (98) -
mg 390±60 - 322±2 (83) -mn 2,70±0,20 2,54±0,43 (94) 2,60±0,25 (96) 2,65±0,07 (98)na 1160±90 - 1173±44 (101) -ni 0,14±0,05 <0,25 (-) <0,40 (-) 0,11±0,02 (79)p 660±40 518±57 (79) - -
pb 0,084±0,032 - 0,054±0,011 (64) 0,081±0,037 (96)rb 5,00±0,60 4,84±0,18 (97) - 4,96±0,10 (99)sr 6,90±0,50 7,26±0,37 (105) - 7,04±0,05 (102)Zn 2,10±0,40 2,04±0,12 (98) 2,08±0,05 (99) 1,97±0,08 (94)
2.2. eksperimentāla pārtikas kultūraugu audzēšana
2.2.1. Augsnes paraugu analīze un sagatavošanaaugsnes paraugi kultūraugu eksperimentālai audzēšanai tika ievākti 2011. gada pa-
vasarī vidzemes augstienes dr vecpiebalgas novada taurenes pagastā, Lodes muižas apkārtnē, ņemot vērā Latvijai raksturīgākos augšņu tipus un tekstūru (Kārkliņš et al., 2009; Kasparinskis, 2011; nikodemus, 2011). paraugi tika ievākti no h vai ap horizonta, 0-20 cm dziļumā. augšņu paraugi tika identificēti šādi: s1 – zemā purva kūdraugsne; s2 – velēnu podzolaugsne / smilšmāls; s3 – velēnu podzolaugsne / smilts; s4 – velēnu podzolaugsne / mālsmilts; s5 – velēnu podzolaugsne / smilšains smilšmāls (fao, 2006; Kārkliņš et al., 2009; nikodemus, 2011; noteikumi 804, 2005). Laboratorijā, izmantojot standartmetodiku, tika noteikti tādi augšņu raksturlielumi kā granulometriskais sastāvs, phh2o un phKcl, organisko vielu saturs, katjonu bāzu summa, elementu koncentrācija (fao, 2006; pansu and Gautheyrou, 2006).
Lai veiktu pārtikas kultūraugu audzēšanu un elementu biopieejamības pētījumu, aug-snes paraugi tika mākslīgi piesārņoti sekojoši:
a) monokontaminācija, izmantojot vara sulfāta pentahidrāta cuso4×5h2o šķīdumu pie noteiktām cu mērķkoncentrācijām (40, 70, 100, 130 un 200 mg/kg);
1 Šeit un turpmāk x̄ – vidējā vērtība, s – standartnovirze, nm – mērījumu skaits

163
b) multielementu kontaminācija, izmantojot metālisko elementu (cd, cu, pb un Zn) sāļu šķīduma maisījumu pie noteiktām elementu mērķkoncentrācijām (6 mg/kg cd, 130 mg/kg cu, 750 mg/kg pb un 300 mg/kg Zn), pielietojot šādus reaģentus – kadmi-ja acetāta dihidrāts cd(ch3coo)2×2h2o, vara sulfāta pentahidrāts cuso4×5h2o, svina (ii) nitrāts pb(no3)2 un cinka sulfāta heptahidrāts Znso4×7h2o.
augsnes paraugi tika piesātināti ar aprēķināto reaģenta šķīduma daudzumu, mehā-niski maisot, kā tas aprakstīts literatūrā (alexander et al., 2006; inaba and takenaka, 2005). daļa augsnes paraugu tika atstāti nepiesārņoti kontrolei. daļa piesārņoto paraugu tikai piesātināti ar humusvielu šķīdumu (3 g/kg; augstā tipa purva kūdra ar c 54,35 %, h 2,36 %, n 1,26 %, mw 4 500 – 12 000 dal). pēc 2 nedēļām tika veikta atkārtota augsnes paraugu mehāniska homogenizācija, kam sekoja augsnes iepildīšana stādu kastēs ar mēr-ķi audzēt 3 kultūraugu sugas – redīsus Raphanus sativus L. ‘saxa 2’, lapu salātus Lactuca sativa L. ‘Grand rapids’ un dilles Anethum graveolens L. ‘mammut’. Kultūraugu audzēša-na tika veikta 2011. gada vasarā lauku teritorijā aizkraukles apkārtnē.
2.2.2. Augsnes un augu paraugu frakcionēšanas analīzeLai noteiktu elementu biopieejamību no augsnes augiem, tika veikta augsnes frakcio-
nēšanas analīze (attēls 2.9.), izdalot 5 frakcijas: 1) ūdenī šķīstošo savienojumu frakcija; 2) skābē šķīstošo savienojumu frakcija; 3) reducēto savienojumu frakcija; 4) organisko savienojumu frakcija; 5) ar sulfīdiem saistīto savienojumu frakcija (arthur et al., 2007; malandrino et al., 2011; tessier et al., 1979).
Figure 2.1.
Step 1 Extraction with H2O
Step 2 Extraction
with 0.11 M CH3COOH
Step 3 Extraction with 0.5 M
NH2OH×HCl
Step 4 Oxidation with
conc. H2O2 and extraction with CH3COONH4
Step 5 Extraction with conc. HCl and conc. HNO3
Fraction 1 Water soluble
compounds
Fraction 2 Acid soluble compounds
Fraction 3 Reduced forms of
compounds
Fraction 4 Organic
compounds
Fraction 5 Residues (e.g.,
sulphide compounds)
ENG Kopsavilkumā - Figure 2.9.
LV Kopsavilkumā - Attēls 2.9.
1. solis Ekstrakcija
ar H2O
2. solis Ekstrakcija ar 0,11 M
CH3COOH
3. solis Ekstrakcija ar
0,5 M NH2OH×HCl
4. solis Oksidācija ar konc. H2O2 un ekstrakcija ar CH3COONH4
5. solis Ekstrakcija ar konc. HCl un konc. HNO3
1. frakcija Ūdenī
šķīstošie savienojumi
2. frakcija Skābē
šķīstošie savienojumi
3. frakcija Reducētie
savienojumi
4. frakcija Organiski
savienojumi
5. frakcija Atlikumi
(piem., sulfīdu savienojumi)
2.9. attēls. Frakcionēšanas analīzes shēma
Lai vērtētu elementu biopieejamību barības ķēdes segmentā augs-cilvēks, tika veikta ievākto salātu paraugu frakcionēšanas analīze, izdalot 3 frakcijas: 1) ūdenī šķīstošo savie-nojumu frakcija; 2) skābē šķīstošo savienojumu frakcija; 3) reducēto savienojumu frakcija (arthur et al., 2007; malandrino et al., 2011; tessier et al., 1979).
iegūtajos paraugu frakciju šķīdumos tika noteikts kvantitatīvais elementu saturs iz-mantojot atomabsorbcijas spektrometrijas un induktīvi saistītas plazmas masas spektro-metrijas metodes.

164
3. ReZULtĀtI Un DISKUSIJA
3.1. Vides apstākļu ietekmju uz elementu saturu pārtikā izvērtējums
3.1.1. Sezonalitātes ietekme uz elementu koncentrācijusezonalitātes ietekme tika izvērtēta ņemot vērā konstatēto elementu koncentrāciju
biezpiena un vistu olu paraugos.Biezpiens. Biezpiena paraugi tika ievākti divu sezonu (pavasaris/vasara un rudens/
ziema) ietvaros. attiecībā uz makroelementu saturu ziemas sezonas laikā ievāktajos pa-raugos tika konstatēts augstāka elementu koncentrācija, īpaši ca un K (3.1. attēls), ko var saistīt ar dzīvnieku uzturēšanas atšķirībām sezonalitātes ietekmē.
0,0
0,2
0,4
0,6
0,8
1,0
1,2
1,4
1,6
Cr Ni Pb Mn Cu
Kon
cent
rāci
ja, m
g/kg
Elements
Cr Ni Pb Mn Cu Fe Zn
Elements
0
5
10
15
20
25
30
35
40
45
50
Fe Zn
Kon
cent
rāci
ja, m
g/kg
Vasara
Ziema
0
1000
2000
3000
4000
5000
6000
7000
8000
Mg Na Ca K
Kon
cent
rāci
ja, m
g/kg
Mg Na Ca K
Elements
3.1. attēls. Vidējā elementu koncentrācija biezpienā atkarībā no sezonas
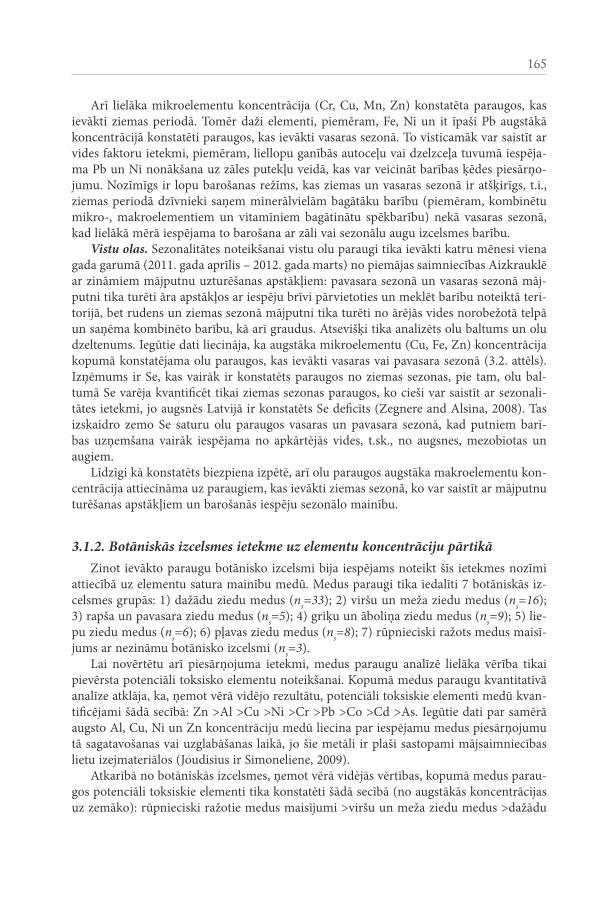
165
arī lielāka mikroelementu koncentrācija (cr, cu, mn, Zn) konstatēta paraugos, kas ievākti ziemas periodā. tomēr daži elementi, piemēram, fe, ni un it īpaši pb augstākā koncentrācijā konstatēti paraugos, kas ievākti vasaras sezonā. to visticamāk var saistīt ar vides faktoru ietekmi, piemēram, liellopu ganībās autoceļu vai dzelzceļa tuvumā iespēja-ma pb un ni nonākšana uz zāles putekļu veidā, kas var veicināt barības ķēdes piesārņo-jumu. nozīmīgs ir lopu barošanas režīms, kas ziemas un vasaras sezonā ir atšķirīgs, t.i., ziemas periodā dzīvnieki saņem minerālvielām bagātāku barību (piemēram, kombinētu mikro-, makroelementiem un vitamīniem bagātinātu spēkbarību) nekā vasaras sezonā, kad lielākā mērā iespējama to barošana ar zāli vai sezonālu augu izcelsmes barību.
Vistu olas. sezonalitātes noteikšanai vistu olu paraugi tika ievākti katru mēnesi viena gada garumā (2011. gada aprīlis – 2012. gada marts) no piemājas saimniecības aizkrauklē ar zināmiem mājputnu uzturēšanas apstākļiem: pavasara sezonā un vasaras sezonā māj-putni tika turēti āra apstākļos ar iespēju brīvi pārvietoties un meklēt barību noteiktā teri-torijā, bet rudens un ziemas sezonā mājputni tika turēti no ārējās vides norobežotā telpā un saņēma kombinēto barību, kā arī graudus. atsevišķi tika analizēts olu baltums un olu dzeltenums. iegūtie dati liecināja, ka augstāka mikroelementu (cu, fe, Zn) koncentrācija kopumā konstatējama olu paraugos, kas ievākti vasaras vai pavasara sezonā (3.2. attēls). izņēmums ir se, kas vairāk ir konstatēts paraugos no ziemas sezonas, pie tam, olu bal-tumā se varēja kvantificēt tikai ziemas sezonas paraugos, ko cieši var saistīt ar sezonali-tātes ietekmi, jo augsnēs Latvijā ir konstatēts se deficīts (Zegnere and alsina, 2008). tas izskaidro zemo se saturu olu paraugos vasaras un pavasara sezonā, kad putniem barī-bas uzņemšana vairāk iespējama no apkārtējās vides, t.sk., no augsnes, mezobiotas un augiem.
Līdzīgi kā konstatēts biezpiena izpētē, arī olu paraugos augstāka makroelementu kon-centrācija attiecināma uz paraugiem, kas ievākti ziemas sezonā, ko var saistīt ar mājputnu turēšanas apstākļiem un barošanās iespēju sezonālo mainību.
3.1.2. Botāniskās izcelsmes ietekme uz elementu koncentrāciju pārtikāZinot ievākto paraugu botānisko izcelsmi bija iespējams noteikt šīs ietekmes nozīmi
attiecībā uz elementu satura mainību medū. medus paraugi tika iedalīti 7 botāniskās iz-celsmes grupās: 1) dažādu ziedu medus (ns=33); 2) viršu un meža ziedu medus (ns=16); 3) rapša un pavasara ziedu medus (ns=5); 4) griķu un āboliņa ziedu medus (ns=9); 5) lie-pu ziedu medus (ns=6); 6) pļavas ziedu medus (ns=8); 7) rūpnieciski ražots medus maisī-jums ar nezināmu botānisko izcelsmi (ns=3).
Lai novērtētu arī piesārņojuma ietekmi, medus paraugu analīzē lielāka vērība tikai pievērsta potenciāli toksisko elementu noteikšanai. Kopumā medus paraugu kvantitatīvā analīze atklāja, ka, ņemot vērā vidējo rezultātu, potenciāli toksiskie elementi medū kvan-tificējami šādā secībā: Zn >al >cu >ni >cr >pb >co >cd >as. iegūtie dati par samērā augsto al, cu, ni un Zn koncentrāciju medū liecina par iespējamu medus piesārņojumu tā sagatavošanas vai uzglabāšanas laikā, jo šie metāli ir plaši sastopami mājsaimniecības lietu izejmateriālos (Joudisius ir simoneliene, 2009).
atkarībā no botāniskās izcelsmes, ņemot vērā vidējās vērtības, kopumā medus parau-gos potenciāli toksiskie elementi tika konstatēti šādā secībā (no augstākās koncentrācijas uz zemāko): rūpnieciski ražotie medus maisījumi >viršu un meža ziedu medus >dažādu

166
3.2. attēls. Sezonālā ietekme uz Fe, Zn, Cu, Ba, Mn un Se koncentrāciju vistu olu paraugos
051015202530354045
0
2
4
6
8
10
12
14
Winter Spring Summer Autumn
Kon
cent
rāci
ja d
zelte
num
ā,m
g/kg
Kon
cent
rāci
ja b
altu
mā,
mg/
kg
Sezona
Fe
0
5
10
15
20
25
30
35
0,0
0,2
0,4
0,6
0,8
1,0
Winter Spring Summer Autumn
Kon
cent
rāci
ja d
zelte
num
ā,m
g/kg
Kon
cent
rāci
ja b
altu
mā,
mg/
kg
Sezona
Zn
0,0
0,5
1,0
1,5
2,0
2,5
Winter Spring Summer Autumn
Kon
cent
rāci
ja, m
g/kg
Sezona
Ba
0,0
0,2
0,4
0,6
0,8
1,0
1,2
1,4
1,6
0,0
0,1
0,2
0,3
0,4
0,5
Winter Spring Summer Autumn
Kon
cent
rāci
ja d
zelte
num
ā,m
g/kg
Kon
cent
rāci
ja b
altu
mā,
mg/
kg
Sezona
Cu
0,00
0,05
0,10
0,15
0,20
0,25
0,30
0,35
0,40
Winter Spring Summer Autumn
Kon
cent
rāci
ja, m
g/kg
Sezona
Mn
Egg albumen Egg yolk
0,00
0,02
0,04
0,06
0,08
0,10
0,12
0,14
0,000
0,005
0,010
0,015
0,020
0,025
0,030
0,035
0,040
Winter Spring Summer Autumn
Kon
cent
rāci
ja d
zelte
num
ā,m
g/kg
Kon
cent
rāci
ja b
altu
mā,
mg/
kg
Sezona
Se
Olas baltums Olas dzeltenums
Ziema Pavasaris Vasara Rudens
Ziema Pavasaris Vasara Rudens Ziema Pavasaris Vasara Rudens Ziema Pavasaris Vasara Rudens
Ziema Pavasaris Vasara Rudens Ziema Pavasaris Vasara Rudens
ziedu medus >pļavas ziedu medus >liepu ziedu medus >griķu un āboliņa ziedu medus >rapšu un pavasara ziedu medus. Zn, al, pb un cd koncentrācija analizētajos medus paraugos pēc botāniskās izcelsmes apkopota 3.3. attēlā.
elementu satura botāniskās ietekmes īpatnības var saistīt arī ar vides faktoru ie-tekmēm. piemēram, tādi elementi kā as un pb augstākā koncentrācijā konstatēti lie-pu ziedu medū, kas liecina par iespējamu vides piesārņojuma ietekmi, jo liepas parasti
051015202530354045
0
2
4
6
8
10
12
14
Winter Spring Summer Autumn
Kon
cent
rāci
ja d
zelte
num
ā,m
g/kg
Kon
cent
rāci
ja b
altu
mā,
mg/
kg
Sezona
Fe
0
5
10
15
20
25
30
35
0,0
0,2
0,4
0,6
0,8
1,0
Winter Spring Summer Autumn
Kon
cent
rāci
ja d
zelte
num
ā,m
g/kg
Kon
cent
rāci
ja b
altu
mā,
mg/
kg
Sezona
Zn
0,0
0,5
1,0
1,5
2,0
2,5
Winter Spring Summer Autumn
Kon
cent
rāci
ja, m
g/kg
Sezona
Ba
0,0
0,2
0,4
0,6
0,8
1,0
1,2
1,4
1,6
0,0
0,1
0,2
0,3
0,4
0,5
Winter Spring Summer Autumn
Kon
cent
rāci
ja d
zelte
num
ā,m
g/kg
Kon
cent
rāci
ja b
altu
mā,
mg/
kg
Sezona
Cu
0,00
0,05
0,10
0,15
0,20
0,25
0,30
0,35
0,40
Winter Spring Summer Autumn
Kon
cent
rāci
ja, m
g/kg
Sezona
Mn
Egg albumen Egg yolk
0,00
0,02
0,04
0,06
0,08
0,10
0,12
0,14
0,000
0,005
0,010
0,015
0,020
0,025
0,030
0,035
0,040
Winter Spring Summer Autumn
Kon
cent
rāci
ja d
zelte
num
ā,m
g/kg
Kon
cent
rāci
ja b
altu
mā,
mg/
kg
Sezona
Se
Olas baltums Olas dzeltenums
Ziema Pavasaris Vasara Rudens
Ziema Pavasaris Vasara Rudens Ziema Pavasaris Vasara Rudens Ziema Pavasaris Vasara Rudens
Ziema Pavasaris Vasara Rudens Ziema Pavasaris Vasara Rudens
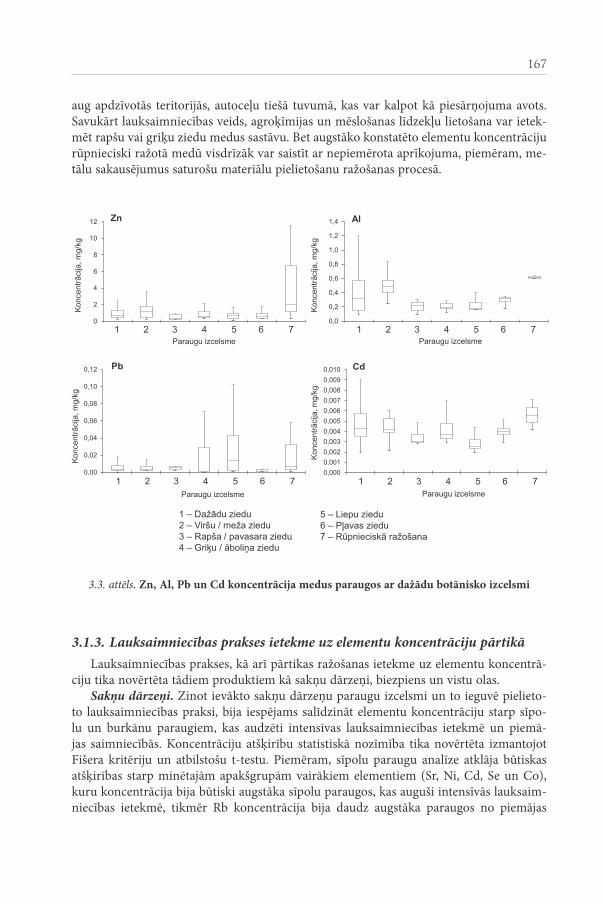
167
aug apdzīvotās teritorijās, autoceļu tiešā tuvumā, kas var kalpot kā piesārņojuma avots. savukārt lauksaimniecības veids, agroķīmijas un mēslošanas līdzekļu lietošana var ietek-mēt rapšu vai griķu ziedu medus sastāvu. Bet augstāko konstatēto elementu koncentrāciju rūpnieciski ražotā medū visdrīzāk var saistīt ar nepiemērota aprīkojuma, piemēram, me-tālu sakausējumus saturošu materiālu pielietošanu ražošanas procesā.
0
2
4
6
8
10
12
Polyfloral Heather /forest
blossom
Rape /spring
blossom
Buckwheat/ clover
Linden Meadowsblossom
Honeymixtures
Kon
cent
rāci
ja, m
g/kg
Paraugu izcelsme
Zn
0,0
0,2
0,4
0,6
0,8
1,0
1,2
1,4
Polyfloral Heather /forest
blossom
Rape /spring
blossom
Buckwheat/ clover
Linden Meadowsblossom
Honeymixtures
Kon
cent
rāci
ja, m
g/kg
Paraugu izcelsme
Al
0,00
0,02
0,04
0,06
0,08
0,10
0,12
Polyfloral Heather /forest
blossom
Rape /spring
blossom
Buckwheat/ clover
Linden Meadowsblossom
Honeymixtures
Kon
cent
rāci
ja, m
g/kg
Paraugu izcelsme
Pb
0,0000,0010,0020,0030,0040,0050,0060,0070,0080,0090,010
Polyfloral Heather /forest
blossom
Rape /spring
blossom
Buckwheat/ clover
Linden Meadowsblossom
Honeymixtures
Kon
cent
rāci
ja, m
g/kg
Paraugu izcelsme
Cd
1 – Dažādu ziedu2 – Viršu / meža ziedu3 – Rapša / pavasara ziedu4 – Griķu / āboliņa ziedu
1 2 3 4 5 6 7 1 2 3 4 5 6 7
1 2 3 4 5 6 7 1 2 3 4 5 6 7
5 – Liepu ziedu 6 – Pļavas ziedu7 – Rūpnieciskā ražošana
3.3. attēls. Zn, Al, Pb un Cd koncentrācija medus paraugos ar dažādu botānisko izcelsmi
3.1.3. Lauksaimniecības prakses ietekme uz elementu koncentrāciju pārtikāLauksaimniecības prakses, kā arī pārtikas ražošanas ietekme uz elementu koncentrā-
ciju tika novērtēta tādiem produktiem kā sakņu dārzeņi, biezpiens un vistu olas.Sakņu dārzeņi. Zinot ievākto sakņu dārzeņu paraugu izcelsmi un to ieguvē pielieto-
to lauksaimniecības praksi, bija iespējams salīdzināt elementu koncentrāciju starp sīpo-lu un burkānu paraugiem, kas audzēti intensīvas lauksaimniecības ietekmē un piemā-jas saimniecībās. Koncentrāciju atšķirību statistiskā nozīmība tika novērtēta izmantojot fišera kritēriju un atbilstošu t-testu. piemēram, sīpolu paraugu analīze atklāja būtiskas atšķirības starp minētajām apakšgrupām vairākiem elementiem (sr, ni, cd, se un co), kuru koncentrācija bija būtiski augstāka sīpolu paraugos, kas auguši intensīvās lauksaim-niecības ietekmē, tikmēr rb koncentrācija bija daudz augstāka paraugos no piemājas

168
saimniecībām. savukārt burkāni, kas auguši piemājas saimniecībās, saturēja vairāk Zn, mn un rb nekā burkānu paraugi, kas iegūti intensīvā lauksaimniecībā. Konstatētās saka-rības pamato lauksaimniecības prakses ietekmi uz elementu saturu pārtikas kultūraugos, liecinot, ka intensīvā lauksaimniecība var ietekmēt potenciāli toksisku elementu ienesi augos, bet piemājas saimniecībās audzētos augos uz elementu saturu, visticamāk, nozīmī-gāka būs ģeoķīmiskā fona ietekme. piemājas saimniecībās mazāka ietekme ir no pesticīdu vai mākslīgā mēslojuma izmantošanas, tomēr bieži vien mazdārziņi ģimenes vajadzībām tiek ierīkoti apdzīvotās vietās, intensīvas satiksmes piesārņojuma joslās, kā arī tuvu rūp-niecības teritorijām vai rekultivētās teritorijās, kas var būt piesārņotas. dotā pētījuma ie-tvaros paraugos no piemājas saimniecībām netika konstatēts paaugstināts piesārņojums ar potenciāli toksiskiem elementiem, ko var saistīt ar paraugu ievākšanu pārsvarā lauku teritorijās, kur piesārņojuma ietekme ir mazāk būtiska.
Vistu olas. analizējot vistu olu paraugus no dažāda veida ražotājiem (bioloģiskām saimniecībām, piemājas saimniecībām un vistu fermām), tika konstatētas būtiskas atšķi-rības. piemēram, paraugos no bioloģiskām saimniecībām tika konstatēta augstākā cu, fe, mn, pb un Zn koncentrācija (3.4. attēls). savukārt pb netika konstatēts nevienā no parau-giem, kas ievākti no putnu fermām.
0
10
20
30
40
50
60
70
80
Organicfarms
Domesticfarms
Poultryfarms
Kon
cent
rāci
ja, m
g/kg
Paraugu izcelsme
Fe
0
10
20
30
40
50
60
Organicfarms
Domesticfarms
Poultryfarms
Kon
cent
rāci
ja, m
g/kg
Paraugu izcelsme
Zn
0
1
2
3
4
5
6
7
8
9
Organicfarms
Domesticfarms
Poultryfarms
Kon
cent
rāci
ja, m
g/kg
Paraugu izcelsme
Cu
0,0
0,5
1,0
1,5
2,0
2,5
3,0
Organicfarms
Domesticfarms
Poultryfarms
Kon
cent
rāci
ja, m
g/kg
Paraugu izcelsme
Mn
0,0
0,1
0,2
0,3
0,4
0,5
0,6
Organicfarms
Domesticfarms
Poultryfarms
Kon
cent
rāci
ja, m
g/kg
Paraugu izcelsme
Pb
0,000,050,100,150,200,250,300,350,400,450,50
Organicfarms
Domesticfarms
Poultryfarms
Kon
cent
rāci
ja, m
g/kg
Paraugu izcelsme
Se
Bioloģ. saimn.
Piemājas saimn.
Putnu fermas
Bioloģ. saimn.
Piemājas saimn.
Putnu fermas
Bioloģ. saimn.
Piemājas saimn.
Putnu fermas
Bioloģ. saimn.
Piemājas saimn.
Putnu fermas
Bioloģ. saimn.
Piemājas saimn.
Putnu fermas
Bioloģ. saimn.
Piemājas saimn.
Putnu fermas
3.4. attēls. Fe, Zn, Cu, Mn, Pb un Se koncentrācija vistu olu paraugos atkarībā no izcelsmes

169
praktiski visiem elementiem augstākās vidējās koncentrāciju vērtības tika konstatētas olu paraugos, kas iegūti bioloģiskās saimniecībās, bet elementu koncentrācija piemājas saimniecību olās un vistu fermu olas bija zemāka un samērā līdzīga. tā kā bioloģisko saimniecību darbība tiek stingri reglamentēta (eK regula 889, 2008), tad būtībā var iz-slēgt iegūto datu interpretāciju saistībā ar piesārņojumu, kas varētu rasties no agroķīmi-jas, mākslīgā mēslojuma vai veterināro medikamentu izmantošanas mājputnu audzēšanā. Līdz ar to augstās elementu koncentrācijas saistāmas ar neatkarīgu vides faktoru ietekmi, ka vides piesārņojuma pārnese, uz ko norāda tādu elementu (piemēram, cu, pb, Zn) pa-augstinātā koncentrācija, kas ir labi zināmi kā vidi piesārņojošie elementi.
3.2. elementu biopieejamības novērtējums
3.2.1. Augsnes paraugu raksturojumsLai veiktu elementu biopieejamības izpēti, tika veikta eksperimentāla pārtikas kul-
tūraugu audzēšana, kam tika izmantoti 5 dažāda tipa un granulometriskā sastāva augsnes paraugi: s1 – zemā purva kūdraugsne; s2 – velēnu podzolaugsne / smilšmāls; s3 – velēnu podzolaugsne / smilts; s4 – velēnu podzolaugsne / mālsmilts; s5 – velēnu podzolaugsne / smilšains smilšmāls (fao, 2006; Kārkliņš et al., 2009; nikodemus, 2011; noteikumi 804, 2005).
augstākā ph vērtība tika konstatēta augsnei s1 (phh2o 5,31 / phKcl 5,06), bet zemākā augsnei s5 (phh2o 4,61 / phKcl 5,11). organisko vielu saturs mainījās no 2,9 % līdz 4,2 % minerālaugsnēm (s2-s5), bet zemā purva kūdraugsnei (s1) – 29,3 %. Katjonu bāzu sum-ma (cBs) lielā mērā ir atkarīga no organisko vielu satura augsnē un augsnes ph. cBs minerālaugsnēm (s2-s5) konstatēts 3,13-8,17 cmol/kg, bet 142,29 cmol/kg – zemā purva kūdraugsnei (s1). ca2+ jonu saturs tika konstatēts 70,9 % no cBs velēnu podzolaugsnei / smilšains smilšmāls (s5), bet zemā purva kūdraugsnei (s1) 87,5 % no cBs, kas liecina, ka izvēlētie augsnes paraugi ir ar augstu auglības pakāpi un ir piemērojami kultūraugu audzēšanai (hodges, s.a.).
Kopējais elementu saturs augšņu paraugos tika novērtēts pirms mākslīgas piesārņoša-nas (3.1. tabula).
velēnu podzolaugsne / smilšains smilšmāls (s5) saturēja ievērojami augstāku cr, ni un pb koncentrāciju nekā pārējās augsnes, kas varētu būt saistīts ar elementu adsorbciju uz māla daļiņām, jo šis augsnes paraugs vērtēts kā māliem bagāts. nozīmīga pozitīva ko-relācija (r>0,8) tika konstatēta šādu elementu pāriem: Zn ar ca, co, cr, fe, K, ni, mg; K ar cu, pb; ca ar co, mn.
pēc augsnes piesārņošanas gan ar cuso4×5h2o šķīdumu dažādās cu mērķkoncen-trācijās (40, 70, 100, 130 un 200 mg/kg), gan izmantojot cd, cu, pb un Zn sāļu maisī-jumu, tika konstatēta elementu hiperakumulācija, it īpaši zemā purva kūdraugsnē (s1) (3.2. tabula).

170
3.2. tabulaelementu koncentrācija augsnes paraugos pēc piesārņošanas ar Cd, Cu, Pb un Zn sāļu
maisījumu
elementselementa
mērķkoncentrācija, mg/kg
faktiskā elementa koncentrācija augsnē (x̄±s; nm=3), mg/kg
s1 s2 s3 s4 s5cd 6 17±2 5±1 5±1 6±1 6±1cu 130 425±35 147±1 148±8 150±4 165±6pb 750 2232±199 737±49 761±48 751±10 865±29Zn 300 880±73 296±53 345±23 359±9 349±11
iegūtie dati liecina par ciešu saikni starp augsnes piesārņojuma līmeni un organisko vielu saturu augsnē, kā arī augsnes granulometriskā sastāva nozīmību.
3.2.2. Elementu akumulācija eksperimentāli audzētajos pārtikas kultūraugosKontaminētajos augsnes paraugos tika audzēti tādi pārtikas kultūraugi kā lapu sa-
lāti Lactuca sativa, dilles Anethum graveolens un redīsi Raphanus sativus. Lai noteiktu elementu ienesi no augsnes un akumulācijas intensitāti, tika aprēķināts pārneses koefi-cients (tf – transfer factor). augstākās tf vērtības (>10) tika iegūtas attiecībā uz Zn pār-nesi salātu paraugos minerālaugsnēs (s2-s4), bet zemākās tf vērtības attiecināmas uz
3.1. tabulaelementu koncentrācija augsnes paraugos pirms piesārņošanas procedūras
elementsaugsnes paraugs
s1 s2 s3 s4 s5
elementa koncentrācija (x̄±s; nm=3), g/kgca 24,88±0,24 0,98±0,03 0,60±0,03 1,18±0,09 1,03±0,07fe 20,60±0,22 10,94±0,62 3,50±0,24 5,25±0,17 14,21±0,54K 0,89±0,02 1,87±0,09 0,52±0,06 0,84±0,02 2,12±0,15
mg 1,93±0,08 1,83±0,08 0,61±0,02 0,97±0,03 2,36±0,11
elementa koncentrācija (x̄±s; nm=3), mg/kgcd 0,45±0,05 0,10±0,01 0,11±0,10 0,17±0,08 0,08±0,02co 3,49±0,75 4,45±0,15 1,58±0,03 2,60±0,20 6,74±0,65cr 15,79±0,89 15,32±0,11 5,10±0,14 6,46±0,23 19,45±1,07cu 13,96±2,27 6,77±0,25 2,32±0,21 10,30±0,56 8,24±0,32na 66,1±13,2 61,0±34,6 38,3±18,7 57,0±15,6 56,9±15,1ni 10,42±2,16 8,20±0,39 2,81±0,27 4,07±0,35 10,66±0,44mn 241,7±16,6 194,1±7,0 117,8±10,7 395,7±26,1 401,0±31,6pb 14,66±3,16 6,29±1,35 3,22±1,70 5,86±1,49 8,73±0,78Zn 28,67±6,39 27,57±2,61 16,46±0,55 60,50±2,97 35,36±0,84
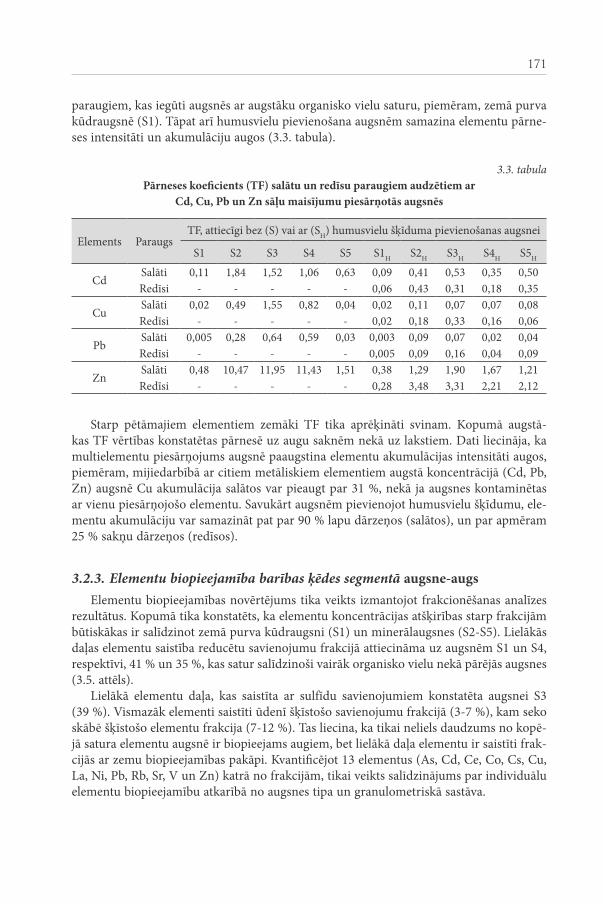
171
paraugiem, kas iegūti augsnēs ar augstāku organisko vielu saturu, piemēram, zemā purva kūdraugsnē (s1). tāpat arī humusvielu pievienošana augsnēm samazina elementu pārne-ses intensitāti un akumulāciju augos (3.3. tabula).
3.3. tabulaPārneses koeficients (tF) salātu un redīsu paraugiem audzētiem ar
Cd, Cu, Pb un Zn sāļu maisījumu piesārņotās augsnēs
elements paraugstf, attiecīgi bez (s) vai ar (sh) humusvielu šķīduma pievienošanas augsnei
s1 s2 s3 s4 s5 s1h s2h s3h s4h s5h
cdsalāti 0,11 1,84 1,52 1,06 0,63 0,09 0,41 0,53 0,35 0,50redīsi - - - - - 0,06 0,43 0,31 0,18 0,35
cusalāti 0,02 0,49 1,55 0,82 0,04 0,02 0,11 0,07 0,07 0,08redīsi - - - - - 0,02 0,18 0,33 0,16 0,06
pbsalāti 0,005 0,28 0,64 0,59 0,03 0,003 0,09 0,07 0,02 0,04redīsi - - - - - 0,005 0,09 0,16 0,04 0,09
Znsalāti 0,48 10,47 11,95 11,43 1,51 0,38 1,29 1,90 1,67 1,21redīsi - - - - - 0,28 3,48 3,31 2,21 2,12
starp pētāmajiem elementiem zemāki tf tika aprēķināti svinam. Kopumā augstā-kas tf vērtības konstatētas pārnesē uz augu saknēm nekā uz lakstiem. dati liecināja, ka multielementu piesārņojums augsnē paaugstina elementu akumulācijas intensitāti augos, piemēram, mijiedarbībā ar citiem metāliskiem elementiem augstā koncentrācijā (cd, pb, Zn) augsnē cu akumulācija salātos var pieaugt par 31 %, nekā ja augsnes kontaminētas ar vienu piesārņojošo elementu. savukārt augsnēm pievienojot humusvielu šķīdumu, ele-mentu akumulāciju var samazināt pat par 90 % lapu dārzeņos (salātos), un par apmēram 25 % sakņu dārzeņos (redīsos).
3.2.3. Elementu biopieejamība barības ķēdes segmentā augsne-augselementu biopieejamības novērtējums tika veikts izmantojot frakcionēšanas analīzes
rezultātus. Kopumā tika konstatēts, ka elementu koncentrācijas atšķirības starp frakcijām būtiskākas ir salīdzinot zemā purva kūdraugsni (s1) un minerālaugsnes (s2-s5). Lielākās daļas elementu saistība reducētu savienojumu frakcijā attiecināma uz augsnēm s1 un s4, respektīvi, 41 % un 35 %, kas satur salīdzinoši vairāk organisko vielu nekā pārējās augsnes (3.5. attēls).
Lielākā elementu daļa, kas saistīta ar sulfīdu savienojumiem konstatēta augsnei s3 (39 %). vismazāk elementi saistīti ūdenī šķīstošo savienojumu frakcijā (3-7 %), kam seko skābē šķīstošo elementu frakcija (7-12 %). tas liecina, ka tikai neliels daudzums no kopē-jā satura elementu augsnē ir biopieejams augiem, bet lielākā daļa elementu ir saistīti frak-cijās ar zemu biopieejamības pakāpi. Kvantificējot 13 elementus (as, cd, ce, co, cs, cu, La, ni, pb, rb, sr, v un Zn) katrā no frakcijām, tikai veikts salīdzinājums par individuālu elementu biopieejamību atkarībā no augsnes tipa un granulometriskā sastāva.

172
3.2.4. Elementu biopieejamības aspekti barības ķēdes segmentā augs-cilvēks –pētījums ar lapu salātiem
elementu biopieejamības barības ķēdes segmentā augs-cilvēks ir komplicēts izpētes jautājums, ko var ietekmēt gan vides faktori, savienojumu ķīmiskās īpašības un bioķī-misko procesu reakcijas, gan indivīda organisma īpatnības. tomēr provizorisku elementu biopieejamības vērtējumu var veikt, pielietojot frakcionēšanas analīzes principus un zi-not, ka lielā mērā elementu biopieejamība ir atkarīga no ķīmisko savienojumu šķīdības.
frakcionēšanas analīze tika veikta analizējot lapu salātu paraugu ekstraktus 3 frakci-jās: 1) ūdenī šķīstošo savienojumu frakcija; 2) skābē šķīstošo savienojumu frakcija; 3) re-ducēto savienojumu frakcija. Katrā frakcijā tika kvantificēti 12 elementi (as, Ba, cd, co, cu, mn, ni, pb, rb, se, sr un Zn). Kopumā elementu sadalījums pa frakcijām liecināja, ka lielākā mērā elementi saistīti ūdenī šķīstošo savienojumu frakcijā (47 %) un reducē-to savienojumu frakcijā (37 %), bet skābē šķīstošo savienojumu frakcijā tikai 15 %, kas ir krasi atšķirīgi nekā konstatētais elementu sadalījums pa frakcijām augsnēs. vērtējot individuālu elementu saistību frakcijās, var secināt, ka vismazāk biopieejamie elementi ir as, cd un sr, jo to saistība ūdenī šķīstošo savienojumu frakcijā konstatēta vismazākā (3.6. attēls).
Ūdenī šķīstošo savienojumu frakcijā vairāk saistīti (>50 %) tādi elementi kā co, cu, ni, pb, rb un se, kas var radīt iespējamu risku attiecībā un potenciāli toksiskiem elementiem.
ņemot vērā konstatētās īpatnības elementu pārnesē, var secināt, ka elementu ienese cilvēka uzturā no augsnes salīdzinoši ir neliela, tomēr jāņem vērā, ka pieaugot elementu
0
20
40
60
80
100
S1 S2 S3 S4 S5
Sat
urs,
%
Augsnes paraugs
Sulphidecompounds
Organiccompounds
Reduced forms ofcompounds
Acid solubilecompounds
Water solubilecompounds
Ar sulfīdiem saistīto savienojumu frakcija
Organisko savienojumu frakcija
Reducēto savienojumu frakcija
Skābē šķīstošo savienojumu frakcija
Ūdenī šķīstošo savienojumu frakcija
3.5. attēls. Kopējais elementu sadalījums pa frakcijām analizētajos augsnes paraugos (s1 – zemā purva kūdraugsne; s2 – velēnu podzolaugsne / smilšmāls; s3 – velēnu podzolaugsne /
smilts; s4 – velēnu podzolaugsne / mālsmilts; s5 – velēnu podzolaugsne / smilšains smilšmāls)

173
koncentrācijai augsnē, kur audzēti kultūraugi, arī augos elementu koncentrācija var pie-augt, un tas var radīt iespējamu risku patērētājam. veiktie elementu biopieejamības ana-līžu dati un aprēķini ļauj vienkāršoti izvērtēt provizorisko elementu biopieejamības ap-jomu zinot kopējo elementu koncentrāciju matricā, kas ļauj veikt ātru riska būtiskuma novērtējumu.
3.6. attēls. elementu sadalījums pa frakcijām lapu salātos
0
20
40
60
80
100
As Ba Cd Co Cu Mn Ni Pb Rb Se Sr Zn
Sta
urs,
%
Elements
Watersolubilecompounds
Acidsolubilecompounds
Reducedforms ofcompounds
Ūdenī šķīstošo savienojumu frakcija
Skābē šķīstošo savienojumu frakcija
Reducēto savienojumu frakcija

174
SeCInĀJUMI
� iegūtie rezultāti atklāja vairāku apstākļu (sezonalitātes, vietas specifisko, botāniskās izcelsmes, lauksaimniecības prakses, pārstrādes procesu) ietekmi uz elementu kon-centrāciju analizētajos pārtikas paraugos, tomēr elementu pārneses no vides pārtikā specifika nav vienota un ir atkarīga no individuālām katram pārtikas produktam vai līdzīgu pārtikas produktu grupai raksturīgam iezīmēm mijiedarbībā ar apkārtējās vi-des apstākļiem pārtikas ieguves un ražošanas procesā.
� dabisko vides ietekmes apstākļu, tādu kā sezonalitāte, novērtējums atklāja elementu koncentrācijas atšķirības dzīvnieku izcelsmes pārtikas produktos ciešā saistībā ar pie-lietoto lauksaimniecības praksi. sezonālo ietekmi uz elementu koncentrāciju pārtikā netieši var saistīt arī ar vides piesārņojuma ietekmi.
� antropogēna rakstura ietekmes apstākļu, tādu kā lauksaimniecības veida ietekmes izpēte atklāja atšķirības starp elementu (piemēram, cd, co, na, ni, se) sastāvu kul-tūraugos audzētos atšķirīgos apstākļos, ko var saistīt ar agroķīmijas un mēslojuma pie-lietošanas intensitāti. Liela nozīme elementu satura īpatnību noteikšanā ir auga sugai.
� Konstatētās atšķirības starp elementu koncentrāciju dzīvnieku izcelsmes pārtikas pro-duktos, kas iegūti no bioloģiskās un intensīvās lauksaimniecības, liecina par elementu satura vidē ietekmēm, kas var būt gan dabīgas izcelsmes, kā ģeoķīmiskais fons, gan antropogēnas izcelsmes, kā vides piesārņojums. Bioloģiskās saimniecībās būtu jāpie-vērš lielāka nozīme vides faktoru iespējamo ietekmju uz pārtikas sastāvu identificēša-nai un izpētei.
� salīdzinot elementu koncentrāciju starp kultūraugu pārtikā lietojamām daļām un mizu, konstatēts, ka vairākiem mikroelementiem (piemēram, as, co, cr, fe, pb) ir tendence uzkrāties mizā, kamēr citi elementi (piemēram, cd, se, Zn) tiek viegli asimi-lēti augā un tādējādi vieglāk var kļūt par potenciāliem pārtikas piesārņotājiem.
� vietas specifisko apstākļu ietekmi uz elementu koncentrāciju pārtikā nevar vērtēt viennozīmīgi, piemēram, medus paraugu analīze atklāja nelielas elementu koncentrā-ciju atšķirības, tomēr netika konstatēta nozīmīga korelācija ar reģionāliem apkārtējo vidi raksturojošiem faktoriem.
� dati par elementu pārneses intensitāti barības ķēdē augsne-augs apstiprināja augsnes īpašību, piemēram, organisko vielu satura un augsnes granulometriskā sastāva nozī-mību elementu pārnesē un akumulācijā augos. organisko vielu spēju saistīt smagos metālus nešķīstošos kompleksos savienojumos ir iespējams attīstīt kā perspektīvu praktiskai izmantošanai, pielietojot humusvielu piedevas elementu pārneses samazi-nāšanai piesārņotās augsnēs, piemēram, lauksaimniecības zemēs.
� elementu biopieejamības izpēte atklāja, ka tikai neliela daļa no elementa kopējā satura augsnē, atkarībā no elementa specifikas, ir pieejama augšup pa barības ķēdi augsne-augs-cilvēks. tomēr pārtikas piesārņojuma risks var kumulatīvi palielināties, ja ele-mentu koncentrācija vidē ir augsta. noteiktā elementu biopieejamības atkarība no augsnes īpašībām var tikt izmantota riska analīzē.

175
� Gan dabīgie, gan antropogēnie vides apstākļi var radīt pārtikas piesārņojuma risku ar potenciāli toksiskiem elementiem, kas ir svarīgs jautājums attiecībā uz patērētāju drošību, tāpēc būtu nepieciešams reģionāls pārtikas monitorings noteiktu ietekmes faktoru aspektā, it īpaši attiecībā uz mājražotāju produktiem. Kopumā var secināt, ka pārtikas paraugu kvantitatīva analīze ir nozīmīgs pētījumu virziens gan vides, gan ķī-mijas un veselības zinātņu nozarēs, kas jāattīsta plašākā mērogā.

176
IZMAntotĀ LIteRAtūRA
1. aberoumand, a., deokule, s.s. (2010) elements evaluation of some edible vegetables and fruits of iran and india. Asian Journal of Agricultural Sciences 2(1): 35-37.
2. abrahams, p.W. (2002) soils: Their implications to human health. The Science of the Total Environment 291(1-3): 1-32.
3. aldahan, a., Kekli, a., possnert, G. (2006) distribution and sources of 129i in rivers of the Baltic region. Journal of Environmental Radioactivity 88(1): 49-73.
4. allen, a.G., nemitz, e., shi, J.p., harrison, r.m., Greenwood, J.c. (2001) size distributions of trace metals in atmospheric aerosols in the United Kingdom. Atmospheric Environment 35: 4581-4591.
5. alexander, p.d., alloway, B.J., dourado, a.m. (2006) Genotypic variations in the accumu-lation of cd, cu, pb and Zn exhibited by six commonly grown vegetables. Environmental Pollution 144(3): 736-745.
6. aras, n.K., ataman, o.y. (2006) Trace Element Analysis of Food and Diet. rsc publishing: cambridge, 344 p.
7. arthur, J.d., fischler, c., dabous, a.a., Budd, d.a., Katz, B.G. (2007) Geochemical and mineralogical characterization of potential aquifer storage and recovery storage zones in the floridan aquifer system, comprehensive everglades restoration plan. Final report. no page numbering.
8. atsdr (s.a.) Toxic substances portal. agency for toxic substances and disease registry (atsdr), United states department of health and human services. pieejams: http://www.atsdr.cdc.gov/toxprofiles/index.asp [16.09.2013.]
9. Berdanier, c.d., dwyer, J.t., feldman, e.B. (2007) Handbook of Nutrition and Food. (2nd ed.) crc press: Boca raton, 1288 p.
10. Bowman, c.a., Bobrowsky, p.t., selinus, o. (2003) medical geology: new relevance in the earth sciences. Episodes 24(6): 270-278.
11. Brumelis, G., Lapina, L., nikodemus, o., tabors, G. (2002) Use of the o horizon of forest soils in monitoring metal deposition in Latvia. Water, Air & Soil Pollution 135(1-4): 291-309.
12. Čekstere, G. (2011) Vides faktoru ietekme uz Holandes liepu (Tilia x vulgaris) vitalitāti Rīgas ielu apstādījumos / Impact of Environmental Factors on Vitality of Common Lime (Tilia x vul-garis) in the Street Greenery of Riga. doctoral thesis. [in Latvian] LU akadēmiskais apgāds: rīga, 225 lpp.
13. cekstere, G., nikodemus, o., osvalde, a. (2008) toxic impact of the de-icing material to street greenery in riga, Latvia. Urban Forestry & Urban Greening 7(3):207-217.
14. cekstere, G., osvalde, a. (2013) a study of chemical characteristics of soil in relation to street trees status in riga (Latvia). Urban Forestry & Urban Greening 12(1): 69-78.
15. cekstere, G., osvalde, a. (2010a) macronutrient status in the different-aged lime trees (Tilia x vulgaris h.) in riga streets. Baltic Forestry 16(1): 16-22.
16. cekstere, G., osvalde, a. (2010b) young street greenery supply with nutrients in riga, Latvia. Acta Horticulturae 881: 573-576.
17. combs, G.f. (2005) Geological impacts of nutrition. in: selinus, o. (ed.-in-chief) Essentials of Medical Geology. elsevier academic press: amsterdam, 812 p., 161-177.
18. ekholm, p., reinivuo, h., mattila, p., pakkala, h., Koponen, J., happonen, a., hellistrom, J., ovaskainen, m.-L. (2007) changes in the mineral and trace element contents of cereals, fruits and vegetables in finland. Journal of Food Composition & Analysis 20(6): 487-495.
19. eK regula 889 (2008) commission regulation (ec) no 889/2008 of 5 september 2008 lay-ing down detailed rules for the implementation of council regulation (ec) no 834/2007 on

177
organic production and labelling of organic products with regard to organic production, la-belling and control. Official Journal of the European Union L250: 1-84.
20. fao (2006) Guidelines for soil description. (4th ed.) food and agriculture organisation (fao): rome, 97 p.
21. ferre-huguet, n., marti-cid, r., schuhmacher, m., domingo, J.L. (2008) risk assessment of metals from consuming vegetables, fruits and rice grown in soils irrigated with waters of the ebro river in catalonia, spain. Biological Trace Element Research 123(1-3): 66-79.
22. fraga, c.G. (2005) relevance, essentiality and toxicity of trace elements in human health. Molecular Aspects of Medicine 26(4-5): 235-244.
23. Gardea-torresdey, J.L., peralta-videa, J.r., de la rosa, G., parsons, J.G. (2005) phytoremediation of heavy metals and study of the metal coordination by X-ray absorption spectroscopy. Coordination Chemistry Reviews 249(17-18): 1797-1810.
24. Goldhaber, s.B. (2003) trace element risk assessment: essentiality vs. toxicity. Regulatory Toxicology & Pharmacology 38(2): 232-242.
25. hashmi, d.r., ismail, s., shaikh, G.h. (2007) assessment of the level of trace metals in com-monly edible vegetables locally available in the markets of Karachi city. Pakistan Journal of Botany 39(3): 747-751.
26. hodges, s.c. (s.a.) Soil fertility basics. raleigh: north carolina state University (ncsU), 75 p.27. inaba, s., takenaka, c. (2005) effects of dissolved organic matter on toxicity and bioavailabil-
ity of copper for lettuce sprouts. Environment International 31(4): 603-608.28. Joudisius, e., simoneliene, a. (2009) Lietuvoje parduodamo medaus užterštumas sunkiaisiais
metalais ir pesticidais / trace metals and pesticide residues in honey on the Lithuanian mar-ket. [in Lithuanian] Veterinarija & Zootechnika 45(67): 27-32.
29. Juškevičs, v. (2000) Kvartāra nogulumu karte / Map of Quaternary Sediments (1:200 000). Jāņa sēta: rīga.
30. Kabata-pendias, a., mukherjee, a.B. (2007) Trace Elements from Soil to Human. springer-verlag: Berlin, 550 p.
31. Kārkliņš, a., Gemste, i., mežals, h., nikodemus, o., skujāns, r. (2009) Latvijas augšņu no-teicējs / Soil Key-Book of Latvia. [in Latvian] LLU: Jelgava, 235 lpp.
32. Kasparinskis, r., (2011) Personīgā informācija.33. Kasparinskis, r., nikodemus, o. (2012) influence of environmental factors on the spatial dis-
tribution and diversity of forest soil in Latvia. Estonian Journal of Earth Sciences 61(1): 48-64.34. Klavins, m., Briede, a., rodinov, v., Kokorite, i., parele, e., Klavina, i. (2000) heavy metals in
rivers of Latvia. Science of the Total Environment 262(1-2): 175-184.35. Klavins, m., Kokorite, i., Jankevica, m., mazeika, J., rodinov, v. (2011) trace elements in
sediments of lakes in Latvia. in: mastorakis, n. (ed.-in-chief) Recent Researches in Geography, Geology, Energy, Environment and Biomedicine. Wseas press: corfu, 518 p., 43-47.
36. Klavins, m., potapovics, o., rodinov, v. (2009a) heavy metals in fish from lakes in Latvia: concentrations and trends of changes. Bulletin of Environmental Contamination & Toxicology 82(1): 96-100.
37. Klavins, m., rodinov, v., druvietis, i. (2003) aquatic chemistry and humic substances in bog lakes in Latvia. Boreal Environment Research 8(2): 113-123.
38. Klavins, m., rodinov, v., Kokorite, i., Klavina, i., apsite, e. (2001) Long-term and seasonal changes in chemical composition of surface waters in Latvia. Environmental Monitoring & Assessment 66(3): 233-254.
39. Klavins, m., silamikele, i., nikodemus, o., Kalnina, L., Kuske, e., rodinov, v., purmalis, o. (2009b) peat properties, major and trace element accumulation in bog peat in Latvia. Baltica 22(1): 37-50.
178
40. Klavins, m., vircavs, m. (2001) metals in sediments of inland waters of Latvia. Boreal Environment Research 6(4): 297-306.
41. Klockenkamper, r. (1997) Total-Reflection X-Ray Fluorescence Analysis. John Wiley & sons: new york, 245 p.
42. Kokorite, i., Klavins, m., rodinov, v. (2010) impact of catchment properties on aquatic chem-istry in the rivers of Latvia. Hydrology Research 41(3-4): 320-329.
43. malandrino, m., aballino, o., Buoso, s., Giacomino, a., La Gioia, c., mentasti, e. (2011) accumulation of heavy metals from contaminated soil to plants and evaluation of soil reme-diation by vermiculite. Chemosphere 82: 169-178.
44. murniece, i., Karklina, d., Galoburda, r., santare, d., skrabule, i., costa, h. s. (2011) nutritional composition of freshly harvested and stored Latvian potato (Solanum tubero-sum L.) varieties depending on traditional cooking methods. Journal of Food Composition & Analysis, 24(4-5): 699-710.
45. nabrzyski, m. (2007) functional role of some minerals in foods. in: szefer, p., nriagu, J.o. (eds.) Mineral Components in Food. crc press: Boca raton, 446 p., 123-162.
46. nikodemus, o. (2011) Personīgā informācija.47. nikodemus, o. (2004) Latvijas augšņu karte / Map of Soils in Latvia (1:2 250 000). Jāņa sēta:
rīga.48. nikodemus, o. (red.) (2008) Augsnes ilgtspējīga izmantošana un aizsardzība / Soil Protection
and Sustainable Use. [in Latvian] LU akadēmiskais apgāds: rīga, 256 lpp.49. nikodemus, o., Brumelis, G., tabors, G., Lapina, L., pope s. (2004) monitoring of air pol-
lution in Latvia between 1990 and 2000 using moss. Journal of Atmospheric Chemistry 49: 521-531.
50. noteikumi 804 (2005) ministru Kabineta noteikumi nr. 804 (25.10.2005.) par augsnes un grunts kvalitātes normatīviem. Latvijas Vēstnesis, 172(3330).
51. osvalde, a., Karlsons, a. (2010) evaluation of the nutrient status of american cranberry in Latvia during 2001-2007. Acta Horticulturae 868: 213-218.
52. pansu, m., Gautheyrou, J. (2006) Handbook of Soil Analysis: Mineralogical, Organic and Inorganic Methods. springer verlag: Berlin, 993 p.
53. peralta-videa, J.r., Lopez, m.L., narayan, m., saupe, G., Gardea-torresdey, J. (2009) The bi-ochemistry of environmental heavy metal uptake by plants: implications for the food chain. The International Journal of Biochemistry & Cell Biology 41(8-9): 1665-1677.
54. poikane, r., carstensen, J., dahllof, i., aigars, J. (2005) distribution patterns of particulate trace metals in the water column and nepheloid layer of the Gulf of riga. Chemosphere 60(2): 216-225.
55. salminen, r., chekushin, v., Gilucis, a., Gregorauskiene, v., petersell, v., tomilina, o. (2011) distribution of elements in terrestrial mosses and the organic soil Layer in the eastern Baltic region. Special Paper of the Geological Survey of Finland 50: 1-116.
56. silamikele, i., Klavins, m., nikodemus, o. (2011) major and trace element distribution in the peat from ombrotrophic bogs in Latvia. Journal of Environmental Science & Health – Part A Toxic/Hazardous Substances & Environmental Engineering 46(7): 805-812.
57. stalnacke, p., Grimvall, a., Libiseller, c., Laznik, m., Kokorite, i. (2003) trends in nutrient concentrations in Latvian rivers and the response to the dramatic change in agriculture. Journal of Hydrology 283(1-4): 184-205.
58. tabors, G., Brumelis, G., Lapina, L., pospelova, G., nikodemus, o. (2004) changes in element concentrations in moss segments after cross-transplanting between a polluted and non-pol-luted site. Journal of Atmospheric Chemistry 49: 191-197.
59. tessier, a., campbell, p.G.c., Bisson, m. (1979) sequential extraction procedure for the speci-ation of particulate trace metals. Analytical Chemistry 51(7): 1-8.
179
60. Usda (s.a.) National nutrient database for standard reference. agricultural research service, United states department of agriculture (Usda). pieejams: http://ndb.nal.usda.gov/ndb/nu-trients/index [16.09.2013.]
61. Welch, r.m., Graham, r.d. (2005) agriculture: The real nexus for enhancing bioavailable mi-cronutrients in food crops. Journal of Trace Elements in Medicine & Biology 18: 299-307.
62. Zariņš, Z., neimane, L. (2009) Uztura mācība / Nutrition Studies. (5th ed.) [in Latvian] LU akadēmiskais apgāds: rīga, 464 lpp.
63. Zegnere, L., alsina, i. (2008) The effect of selenite on growth and storage of onions. Latvian Journal of Agronomy 10: 235-240.
64. Zimmermann, m.B. (2001) Burgerstein’s Handbook of Nutrition: Micronutrients in the Prevention and Therapy of Disease. Georg Thieme verlag: stuttgart, 288 p.

Latvijas Universitātes Akadēmiskais apgādsBaznīcas ielā 5, Rīgā, LV-1010
Tālr. 67034535
Iespiests SIA “Latgales druka”Baznīcas ielā 28, Rēzeknē, LV-4601
Tālr.: 64607176, fakss: 64625938

182
Rīga, 2014
UNIVERSITY OF LATVIAFACULTY OF GEOGRAPHY AND EARTH SCIENCES
DEPARTMENT OF ENVIRONMENTAL SCIENCE
Zane Vincēviča-Gaile
IMPACT OF ENVIRONMENTAL CONDITIONS ON MICRO- AND MACROELEMENT
CONTENT IN SELECTED FOOD FROM LATVIA
VIDES APSTĀKĻU IETEKME UZ MIKRO- UN MAKROELEMENTU SATURU
PĀRTIKAS PRODUKTOS LATVIJĀ
Doctoral Thesis
ISBN 978-9984-45-829-8
Zane Vincēviča-Gaile Im
pact of Environmental Conditions on M
icro- and Macroelem
ent Content in Selected Food from Latvia