Embed Size (px)
Citation preview

Management Review Vol. 36 (Jul 2017), 137-161
Yu-Hsiang Lin Socialnomics: The Relationships between Mobile Social
Advertising, Word-of-Mouth (WOM) Order, and Emotion
(Received Sep 30, 2016; First Revision Jan 16, 2017; Second Revision Mar 25, 2017; Accepted Jun 5, 2017)
Abstract
Mobile social media has become an indispensable tool for Internet+ businesses. However, consumers are often ex-posed to the environment of mobile social media through advertisements that are full of positive and negative word-of-mouth (WOM) content. The influence of advertising combined with a positive–negative WOM order (or vice versa) on consumer emotions is poorly explained by the current “impact of a single message” argument through the hierarchy-of-effects model. Therefore, this study utilized the primacy–recency effect theory to examine the interactive effects of social advertising and different WOM orders on consumer emotions in mobile social media. Our main findings revealed that consumers who view empathetic content social advertising are mainly affected by the primacy effect, indicating that early positive or negative WOM content has a higher effect on consumer emotions. This effect also allows for a positive–negative WOM order to have a larger impact on the positive emotions of consumers. By contrast, consumers who view stimulating content social advertising are mainly affected by the recency effect, indi-cating that the later positive or negative WOM content has a larger impact on consumer emotions; this effect also allows for a positive–negative WOM order to have a larger impact on the negative emotions of consumers. Further examination revealed that consumers’ positive emotions have an inverted-U effect on purchasing intention.
Keywords: Internet+, socialnomics, Mobile Social Advertising, Word-of-Mouth Order, Emotion
1. Introduction*
Internet+ is the collective term for the integrated ap-plication of various Internet technologies including mobile Internet, cloud computing, big data, and In-ternet of Things (IoT) (Xiong, Zhao, and Fang 2016). The utilization of Internet+ can lead to successful en-terprise transformation (Xiong, Zhao, and Fang 2016) and increase competitive advantage (Porter and Hep-pelmann 2014), as well as create innovative business models such as fan economy and socialnomics (Lu and Na 2016). In other words, the interaction, values created and shared via social media platforms such as Twitter, Foursquare, Facebook, YouTube or LinkedIn (Qualman 2009), together with dissemination through social word-of-mouth (sWOM), can induce positive
Yu-Hsiang Lin is an Associate Professor of the Depart-ment of International Business Administration at Chinese Culture University in Taiwan DOI:10.6656/MR.2017.36.3.ENG.137
affect1 among fans and increase their purchasing in-tention (Kong 2015).
In reality, emotional contagion and behavioral changes as the results of sWOM are common. It is therefore essential for businesses to know how to effec-tively leverage sWOM marketing. Many past studies discussed sWOM from a number of perspectives, for instance the motivation to engage in sWOM (Ha et al. 2015; Lin et al. 2017; Okazaki 2008; 2009; Palka, Pousttchi, and Wiedemann 2009), communication ef-fectiveness (Kaplan 2012; Lin et al. 2017), the moti-vation for location-based social networking (Luarn, Yang, and Chiu 2015) and perceived value (Yu et al. 2013), however rarely have past studies considered
1In general, the term affect encompasses mood and emo-tion (Forgas 1995). Whilst mood and emotion are de-fined differently, they share approximately 60% of their characteristics (Beedie, Terry, and Lane 2005). Therefore, despite the focus of this study being on emotion, some studies related to affect and mood are worthy literature reference, and when citing the literature these three terms may be mentioned simultaneously.
Management Review, July 2017 138
the effect of sWOM order. In mobile social media, consumers are exposed to an environment filled with both positive and negative sWOM, but the effect of these messages on consumer emotions has not yet to be examined.
Emotion is a critical antecedent variable that affects WOM dissemination and purchasing intention amongst members of social media communities (Bo-tha and Reyneke 2013; Hollebeek, Glynnb, and Bro-die 2014; Kramera, Guillory, and Hancock 2014; Lee, Xiong, and Hu 2013; Stieglitz and Linh 2013). In advertising-related studies, the hierarchy-of-effects (HOE) model is commonly cited and used to point out that cognitive effect of advertising influence consum-ers’ affect and behavioral intention (Ling and Liu 2008; Lavidge and Steiner 1961). The same concept also applies to the online environment (Brajnik and Gabrielli 2010). However, due to the instantaneous and convenient features of mobile media (Wei and Lu 2014), the dissemination of advertising and subse-quent WOM may accelerate, and the emotional con-tagion effect on consumers may also be amplified. In light of this, a comprehensive discussion of the inter-active effect between mobile social advertising and sWOM on consumer emotions can act as a supple-ment to the HOE model, and also has value in terms of practical application.
Botha and Reyneke (2013) pointed out that so-cial media messages containing stimulation (for in-stance, elements of fun or entertainment) can lead to stronger emotional connection with the browers. In their study, Chakrabarti and Berthon (2012) argued that social media messages showing empathy will amplify people’s feelings. Because messages evoking strong emotional feelings are highly likely to be spread further, people who design advertising content need to focus on analyzing sentiments that will trigger emotions (Stieglitz and Linh 2013). Nevertheless, the current state of knowledge regarding advertising that triggers emotions is still limited. Given the argument that perceived product characteristics are influenced by advertisements (Schlinger 1979), using text min-ing—a big data analytical method used to explore the product characteristics perceived by consumers—can help us understand what sentiments in advertising will trigger consumer emotions. This will in turn have great value in practical applications. This study uses the different advertisement response profiles proposed by Schlinger (1979) as its basis, and incorporates text mining and further experiments to propose a holistic discussion on the effect of social advertisement on consumers. The viewer response profile (VRP) pro-posed by Schlinger (1979) has already been verified by many other scholars and is commonly adopted in academia (Chen and Wells 1999; Hyun, Kim, and Lee
2011; Strasheim, Pitt, and Caruana 2007). It is there-fore suitable for our discussion on the effect that dif-ferent social advertisements have on consumers in the context of branded mobile applications (apps).
Moreover, viewers receive the sentiments con-tained in WOM messages, and when they do, they further transform this into a concordant emotion (Söderlund and Rosengren 2007). This explains the phenomenon we have seen when positive or negative emotional content often evokes huge subsequent in-fluence and responses in social media (Kramera, Guillory, and Hancock 2014). However, the afore-mentioned studies all focused on the discussion of product message effects on emotion from singular perspectives. Despite being able to help us understand the effect of social advertising on emotions, these studies cannot explain, in practical scenarios such as branded mobile apps where consumers are exposed to and bombarded by positive and negative posts in var-ious orders, the kind of effects positive-negative sWOM can have on consumer emotions.
WOM order effect has generated a great deal of interest in both academics and practitioners (Lin, Huang, and Yang 2007). When a person encounters two opposing opinions and forms the same opinion as the information encountered first, the primacy effect occurs; on the contrary, recency effect occurs if the person’s final judgment conforms to the information later received (Garnefeld and Steinhoff 2013). To understand the emotional effect of sWOM order (pos-itive-negative sWOM order, or negative-positive sWOM order) experienced on a branded mobile app, it is imperative to discuss which of the primacy or recency effects is more likely to occur. However, sWOM on branded mobile apps from advertisements. When consumers are exposed to the interactive effect between social advertising and different positive- negative sWOM orders, the effect with consumer emotions requires further examination. Therefore, the research objectives in this study include (1) To exam-ine the effect of different social advertisements on consumer emotions, and (2) To examine how, the relationship between social advertisement and differ-ent positive-negative sWOM orders, affect consumers’ positive/negative emotions.
2. Literature Review
2.1 Socialnomics and Mobile Social Me-dia
With the integration of mobile Internet, cloud computing, big data and IoT, the Internet+ era was
Socialnomics and Mobile Social Media 139
born (Xiong, Zhao, and Fang 2016). Mobile social media holds big data with information on consumers, which in turn allows individual consumer needs be fulfilled (Chen 2014) and customer relationship ma-nament (CRM) be engaged in (Lu and Na 2016). Thus, socialnomics has given rise to innovative business models and is now a phenomenon and a trend (Kong 2015). Mobile social media refers to a mobile app that allows collective content creation and sharing (Kaplan 2012). Mobile social media users tend to consist of a network of people who have friendships or partner-ships (Pietilainen et al. 2009). This media boasts inte-grated marketing and communication features (Pur-cell 2011; Yu et al. 2013), as well as other advantages including being mobile, portable, convenient, and not constrained by time and space (Wei and Lu 2014). Some of the most well-known mobile social media platforms currently include Facebook, Line and Twit-ter. Of these three platforms, Facebook enjoys the highest number of users (comScore 2013). In Taiwan (Republic of China, ROC), of the 14 million Face-book users, 10 million also use the Facebook mobile app, making Taiwan the country with the highest mo-bile app penetration rate in Asia (He 2013). With the huge potential business opportunities presented by the Facebook app (Tan et al. 2012), a rapid growth in the number of managers adopting this app as their mobile commerce platform is expected (Ozok and Wei 2010). Therefore, there is an urgent need for businesses to learn how to effectively utilize the Facebook app to engage in sWOM.
2.2 The Effect of Mobile Social Adver-tising on Consumer Emotions
Emotion is a short-lived, highly intense state of mind induced by certain events, leading to the ex-pression of states such as anger and happiness (Forgas 1995). Other scholars have pointed out that personal emotions are aroused by certain events or message contents, and will be expressed within a short space of time (from a few seconds to a few hours) without being consciously processed. There are obvious rea-sons and values for emotion to exist (Lahikainen et al. 2003; LeDoux 2000). Similarly, on the Internet, peo-ple view advertisements with entertaining and novel characteristics to fulfill their emotional needs (Online Publisher Association 2007), and in turn they experi-ence emotional responses and subjective perceptions (Holbrook and Batra 1987). In other words, advertis-ers intend to influence consumer attitudes via adver-tisements processed through the peripheral route (Fa-seur and Geuens 2006), and this is an important ante-cedent variable that shapes the formation of consumer attitudes.
The HOE model points out that consumers’ cognitive perception of advertisements influences af-fect and behavioral intention. This concept has been proven in many Internet advertisement-related studies before (Brajnik and Gabrielli 2010). In many related studies, scholars have proposed various constructs and methods for measuring advertisement evaluation (Leavitt 1970; Schlinger 1979; Wells 1964; Wells, Leavitt, and McConville 1971). Among these, the viewer re-sponse profile (VRP) proposed by Schlinger (1979) is the most well-received by academics in the field of advertising. Schlinger (1979) categorized the different emotional responses consumers expressed after watch-ing advertisements into profile categories such as: ‘relevant news’, ‘brand reinforcement’, ‘stimulation’, ‘empathy’, ‘familiarity’ and ‘confusion’. Many of these profiles have been subsequently tested by other scholars (Hyun, Kim, and Lee 2011; Lipstein and Nee- lankavil 1982; Stout and Rust 1993; Strasheim, Pitt, and Caruana 2007) and are widely adopted by both aca-demics and practices (Chen and Wells 1999; Strasheim, Pitt, and Caruana 2007). Of the listed profiles, stimu-lation and empathy are the most commonly targeted profiles in mobile social advertising (Lee and Hong 2016; Xie, Zhao, and Xie 2013).
Advertisements with stimulation show ele-ments of stimulation such as pleasure, entertainment and fun (Hyun, Kim, and Lee 2011; Schlinger 1979). Not only can this stimulation bring feelings of en-joyment (Hyun, Kim, and Lee 2011) and other posi-tive emotional responses (Chang 2006; Duncan and Nelson 1985; Geuens and De Pelsmacker 1998), it may also alter the consumers’ emotional state (Chang 2006). Similar findings have been made in mobile social advertisements. For instance, Okazaki and Ya-güe (2012) found that if advertisements with enter-taining values are provided in a brand’s mobile com-munities, the consumers’ brand preference increases. Okazaki (2008) also pointed out that marketing cam-paigns involving entertainment tactics have a positive effect on mobile users’ attitudes toward the campaign. Furthermore, as mentioned, scholars including Botha and Reyneke (2013), pointed out that social media, video or text messages containing stimulation (for instance, elements of fun or entertainment) can lead to stronger emotional connection with the browsers. In the People’s Republic of China (PRC, China), enter-tainment messages make up a large proportion of social media content, and this promotes positive mood among adolescents (Apaolaza, He, and Hart-mann 2014). In light of the above, this study makes a hypothesis with the assumption that when brand fan pages are viewed on mobile apps, stimulation in mo-bile social advertisement (SMSA) may increase con-sumers’ positive emotions.

Management Review, July 2017 140
H1a: SMSA is positively correlated to consumers’ positive emotions.
In addition, Schlinger (1979) indicated that empathy in advertising is the degree to which viewers participate vicariously in events, feelings and behav-iors. Abrams (1988) explained empathy in advertising as the emotional connection the viewer makes with him or herself to the person, goal, or events portrayed in the advertisement. Therefore, when a viewer dis-plays empathy, they will imagine themselves as a character in the advertisement and this will produce a higher level of engagement with the portrayed scene. In other words, empathy leads to the viewer immers-ing themselves into the scene and context of the ad-vertisement, and this in turn creates positive percep-tions (Mooradian, Matzler, and Szykman 2008) as well as induces feelings of pleasure or other emotion-al responses (Murry and Dacin 1996). Other related studies also argue that empathy in advertising (for example, by using narrations or personal background stories in commercials) is likely to induce viewer empathy, and viewers will subsequently respond to the advertisement with empathy and positive attitudes (Escalas and Stern 2003).
In the social media context, empathy in social advertising can generate effects similar to those that it generates in traditional advertising. For instance, Chakrabarti and Berthon (2012) pointed out that if social media administrators can arouse empathy among their members, they can in turn catalyze pro-active behaviors, create shared emotion amongst group members, and increase the overall value of the community. For instance, social media messages about helping others (such as raising awareness of the poor and others in need in society), or advertisements that are heartwarming or moving, can all arouse consumer empathy and therefore lead to emotional resonance or increased purchasing intention (Botha and Reyneke 2013; Kiráľová and Pavlíčeka 2015; Lee and Hong 2016). Similarly, in branded mobile apps, advertise-ments that appeal to personal values will generate consumer empathy and increase brand attachment (Yang 2016). Consequently, this study derived the following hypothesis with the assumption that on branded mobile app, empathy in mobile social adver-tisement (EMSA) may increase consumers’ positive emotions.
H1b: EMSA is positively correlated to consumers’ positive emotions.
2.3 The Effect of the Relationship be-tween Mobile Social Advertising and sWOM Order on Consumer Emo-tions
In reality, sWOM for a business or brand, as seen on its fan pages, is not all positive or all negative, but a mixture of both (Tsang and Prendergast 2009). For this reason, it is necessary to discuss further the ef-fects of different positive-negative sWOM ordering on consumer emotions. Relevant studies have shown that presentation order affects how the viewers recall the message and also affects their decision-making process (Buda and Zhang 2000). Similarly, Lichten-stein and Srull (1987) found that WOM order affected overall consumer rating on a product. In the context of the online environment, the study by Lin, Huang, and Yang (2007) shows that the order of posi-tive-negative ratings on books affected readers’ pur-chasing intention. The conclusions of these studies prove that positive-negative message order affects consumer attitude, which is an important indicator of emotion. For instance, negative attitudes can lead to anger or fear, and positive attitudes can lead to hap-piness or passion (Eid and Diener 2001; Harmon- Jones et al. 2011). Based on the evidence presented here, this study assumes that on branded mobile apps, the positive-negative sWOM order affects consumer emotions.
However, the aforementioned research findings confirm that positive-negative message order affects consumer attitude, but how are consumer attitudes affected? For instance, how do we know whether, in the context of a branded mobile app, sWOM in the positive-negative order will lead to positive or nega-tive emotion (and vice versa)? The theory of prima-cy-recency effect may provide some explanations and insight. When presented with two opposing types of opinions, people form the same opinion as the earlier information, this is referred to as the primacy effect. On the contrary, if the judgment conforms to the later information received then this is known as the recen-cy effect (Garnefeld and Steinhoff 2013). Kardes and Herr (1990) conducted research on this theory and discussed how the order of product information pre- sentation affects the way consumers recall, judge, and make selections. In their research, they engaged in manipulation by developing 14 positive and negative comments on the attributes on two brands of TV sets, and they also manipulated the order in which these comments were presented. Their findings show that even with the lower quality brand, if associated posi-tive comments are presented first, then consumers would engage in higher level of recall, judgment and

Socialnomics and Mobile Social Media 141
selection process for the brand; in this case the pri-macy effect is more evident. Other studies have also proven that primacy effect is more likely to occur if consumers face situations such as product familiarity, preference, high level of involvement, or prior knowl- edge (Hovland and Mandell 1957; Lana 1961).
On the other hand, the recency effect tends to occur when consumers are not familiar with the issues encountered (Hovland and Mandell 1957), or when they show lower levels of preference or engagement for a product (Haugtvedt and Wegener 1994). In other words, when consumers have a lower product in-volvement or message elaborating level, then their atti- tudes are more likely to be affected or swayed; thus when they are exposed to varied opinions, the recency effect is likely to occur and these consumers are more likely to be affected by the later information (Haugtvedt and Wegener 1994). Given these findings, it is be-lieved that primacy-recency effects can explain how mixed WOM orders in mobile social media affect user emotions.
However, on branded mobile apps, advertise-ments and sWOM coexist. Therefore, by simultane-ously examining the interactive effects between the advertisement and different positive-negative sWOM orders on consumer emotions, the findings will pro-vide useful information to supplement the HOE mod-el proposed by Lavidge and Steiner (1961) (in the context of advertising, includes cognitive, affective, and behavior intention), or for the model proposed by Brajnik and Gabrielli (2010) (in the context of online advertising, the HOE model involves cognition, af-fection, and behavior). This way, the findings will have greater value for practical applications. Consid-ering this, the interactive effects of social advertising and different sWOM order on consumer emotions require further investigation.
Another study also argues that the carryover effect is likely to create higher levels of involvement in advertising (Liu 2006), which will lead to the pri-macy effect dominating (Hovland and Mandell 1957; Lana 1961). This means that consumers exposed to differing opinions are more likely to be influenced by the information presented earlier (Haugtvedt and Wegener 1994). Past studies on advertising show that empathy is the factor that evokes the highest level of involvement from consumers (Murry and Dacin 1996; Stern 1992), and it is empathy that will further rein-force the relationship between online advertising and consumer attitudes (Miller et al. 2009). Based on the above, it is believed that when consumers see adver-tising with empathy, then are exposed to differing opinions, they are more likely to be influenced by the
earlier messages. When they process the earlir emo-tion messages (a mixture of positive or negative emo-tions), they will transform into a consistent shared emotion (Söderlund and Rosengren 2007; Derks, Fischer, and Bos 2008; Hatfield, Cacioppo, and Rap-son 1992; Hsee et al. 1990; Kramera, Guillory, and Hancock 2014). This study therefore makes the in-ference that the primacy effect is likely to occur when consumers are exposed to EMSA. This means that in such situations, consumers are more likely to be in-fluenced by the information encountered earlier rather than later information. Therefore, when EMSA is followed by sWOM in the positive-negative order, consumers are more likely to be persuaded by the positive sWOM and display positive emotions. Con-versely, if EMSA is followed by sWOM in the nega-tive-positive order they are more likely to be persuaded by the negative sWOM and show negative emotions.
Consumers are exposed to hundreds of adver-tisements every day, but most are not retained in their memories, as ad fatigue becomes an increasingly common issue (Hyun, Kim, and Lee 2011). To attract viewer attention, advertisers often adopt stimulation tactics (Spotts, Weinberger, and Parsons 1997) by in- corporating fun or entertaining elements to try to in-crease consumers’ level of enjoyment (Chang 2006). This phenomenon is particularly evident in social media (Apaolaza, He, and Hartmann 2014). Another explanation for this observed fact is that consumers tend to have a lower level of product involvement on fast moving consumer goods (FMCG); in order to generate the desired response, businesses often try to influence consumer attitude via advertisements pro-cessed through peripheral routes, such as advertising with stimulation (Faseur and Geuens 2006), which is able to generate attention within a short space of time (increase level of involvement) and can lead to posi-tive affect (Schlinger 1979). However, compared with advertising with empathy, this study believes that the effect of stimulation on consumer involvement is relatively limited, and that consumers with low levels of involvement are more likely to be influenced by the recency effect (Haugtvedt and Wegener 1994). Therefore, this study deducts that the recency effect is likely to dominate when consumers are exposed to SMSA. This means that in such situations, consumers are more likely to be influenced by information en-countered later rather than information encountered earlier. Therefore, when SMSA is followed by sWOM in the positive-negative order, consumers are more likely to be persuaded by the negative sWOM and display negative emotions. Similarly, if SMSA is fol-lowed by sWOM in the negative-positive order, con-sumers are more likely to be persuaded by the posi-tive sWOM and show positive emotions. This study

Management Review, July 2017 142
proposes the following hypotheses based on the above inferences.
H2a: EMSA is more likely to evoke the primacy effect, resulting in the information encountered earlier having a greater effect on consumer emotions. EMSA followed by positive-negative sWOM order will lead to positive consumer emotions. EMSA followed by negative-positive sWOM order will lead to negative consumer emotions.
H2b: SMSA is more likely to evoke the recency effect, resulting in the information encountered later having a greater effect on consumer emotions. SMSA followed by positive-negative sWOM order will lead to negative consumer emotions. SMSA followed by negative-positive sWOM order will lead to positive consumer emotions.
3. Research Methodology
This study adopted both qualitative and quantitative methods to examine and provide a discussion on the interactive effects between social advertising and dif-ferent positive-negative sWOM order on consumer emotions in the context of branded mobile apps. To begin with, this study used text mining to analyze social media content and consumers’ opinions on certain products. This provided us with an under-standing of the correlation between the product char-acteristics perceived by social media users and their positive and negative emotional responses. Then, through the processes detailed in the experimental design section, this study further investigated the in-teractive effects between SMSA/EMSA and different positive-negative sWOM order on consumer posi-tive/negative emotions. The methodology is detailed in the following sections.
3.1 Text Mining
Using the social media monitoring tool OpView, developed by eLan Cloud Services, this study searched and collected social media big data. This tool can conduct semantic analysis on Mandarin Chinese and mines from text content on a variety of subject topics. OpView offers visual presentation of the collected data with graphs and tables so that users can under-stand the relationship between public opinions, trends, and social media users’ positive and negative emo-tional responses (Liu, Li, and Wang 2016). Given these features, Op-iew is suitable to use for this study to understand public opinions on specific brands,
sWOM on brand and product characteristics, and con-sumers’ positive and negative comments. To collect data on this exercise this study sets criteria on OpView search fields including ‘subject’, ‘dimen-sions’ and ‘keywords’. These search fields contain the relevant words social media users enter on a particu-lar topic, descriptions relating to the subject discussed and other possible relevant keywords. This study also adopted Boolean algebra for further data analysis (for instance, the requirement to enter the symbols ‘&’ for AND, ‘|’ for OR, and ‘!’ for NO in the search condi-tions).
For the ‘topic’ field, based on the 100 Top Fa-cebook Fan Page ranking conducted by Business Next magazine in March 2013, this study selected from the list five well-known brands, including Coldstone, Mc- Donald’s, Starbucks, Nike and Apple. Next, this study conducted a survey on 40 university students (includ-ing 22 female students, with an average age of 20.2 years) to find out their involvement with the selected brands and the brand involvement difference between gender. In the survey, the brands were mentioned in random order. Based on the involvement scale pro-posed by Zaichkowsky (1994), this study adopted the semantic scale and asked the subjects to describe their feelings toward the selected brands (1=unimportant, boring, irrelevant, unexciting, means nothing, unap-pealing, mundane, woethless, uninvolving, not needed; 5=important, interesting, relevant, exciting, meansa lot to me, appealing, fascinating, valuable, involving, needed; Cronbach’s alpha=.893). The one-sample t-test result on the brand involvement for ‘McDon-ald’s’ showed no significant difference to the median 3 (M= 3.07, p > .05), which means consumers’ brand involvement will not moderate with the effect it has on the relationship between social advertising and emotions. The independent-ample t-test on brand involvement between gender also produced results showing no significant difference (MMale=3.18, MFe-
male=3.15, p > .05). Based on these outcomes, ‘Mc- Donald’s’ was selected as the brand for our research. However, due to the many different product ranges and combination offers, not every McDonald’s prod-uct receives substantial attention and enjoys populari-ty. In order to select suitable products for evaluation, this study first collected big data through OpView on WOM posts and ratings consumers had given on McDonald’s products. The time period was set be-tween 1st March 2015 and 31st August 2015, and OpView mined data from social media such as Face-book, forums, blogs, and news forums. This exercise showed that of the many McDonald’s products avail-able, people made the most posts on the ‘Sharing Meals’ and ‘Prosperity Burgers’ products (see Figure 1 for the distribution of number of comments). There

Socialnomics and Mobile Social Media 143
Figure 1 Distribution of sWOM Volume from Social Big Data Source: This study
were 2,502 total posts about the ‘Sharing Meals’ products, of which 2,419 comments were positive and 1,424 were negative. There were 536 total posts about ‘Prosperity Burgers’ products, of which 468 com-ments were positive and 208 were negative. This study then divided the number of positive emotional responses by the number of negative emotional response to obtain the positive-negative ratio (P/N Ratio) to give an overall indication of social media users’ emotional response to the products. This can tell us about the brand favorability of social media users (Yang and Shao 2016). The P/N Ratios for ‘Prosperity Burgers’ and ‘Sharing Meals’ were 2.25 and 1.70, respectively, indicating that both these products enjoy positive emo-tional responses. In other words, social media users have brand favorability for these products. Based on these outcomes, ‘Prosperity Burgers’ and ‘Sharing Meals’ were chosen as the search subjects. The key-words set for the ‘Prosperity Burgers’ products in-cluded: Prosperity Burger|Egg McMuffin|Egg McMuf-fin Meal|McMuffin|Beef and Egg McMuffin|Sausage and Egg McMuffin|Hash Brown Beef Burger|Hash Brown Chicken Burger. The keywords set for McDon-ald’s ‘Sharing Meals’ products included: Sharing Meals|Meal for Two|Breakfast Sharing Meals|Happy Sharing Meals|McDonald’s Sharing Meals|New Year Breakfast Sharing Meals|.
For the ‘dimensions’ field, three design dimen-sions were selected for this study. First, because em-pathy and stimulation in advertising are very common for the catering industry (Hyun, Kim, and Lee 2011), this study designed the dimensions by referencing the operational definitions and measurement scales in related past studies. For example, Hyun, Kim, and Lee (2011) defined advertising with stimulation as advertisements that contain sensory stimulation, en-
tertainment, or messages about prize draws, with the goal to heighten consumer feeling through strong visual contrast. On the other hand, Shang, Chen, and Chen (2009) gave an operational definition of adver-tisement with empathy as containing emotion-packed elements such as family values, the elderly, innocence and kindness. Therefore, for the ‘dimensions’ field, this study first selected keywords such as: ‘sensory experience’, ‘entertainment’, ‘interesting’, ‘prize draw and offers’, ‘leaves a strong impression’, ‘gets atten-tion’, ‘excites you’, ‘full of emotions’, ‘family stories’ and ‘actual dining habits’. Second, using the keyword analysis feature of OpView, specific keywords based on the aforementioned definitions were set on ‘Pros-perity Burger’ and ‘Sharing Meals’ as the text mining criteria. The keywords for ‘Prosperity Burgers’ with corresponding importance attached include: ‘break-fast’ (high), ‘toast’ (low), ‘soft egg’ (low), ‘ham’ (low), and ‘burger’ (low). For ‘Sharing Meals’ the set key-words and importance include: ‘delicious food’ (ex-tremely high), ‘price’ (extremely high), and ‘set meals’ (medium). Third, this study also directly collected user posts from Taiwan McDonald’s Fanpage2 with the keywords used in the aforementioned operational definitions and descriptions. Summarizing the above, for this study the words selected for the ‘dimensions’ and ‘keywords’ fields included: 1. Price related words: Price|Selling Price|Cost|NT Dollars|Cheap|Expensive; 2. Promotion related words: Prize Draw|Offers|Vouch- ers|Buy One Get One Free; 3. Sensory related words: Experience|Exciting|Pleasurable|Exciting; 4. Entertain- ment related words: Entertaining|Interesting|Fun; 5. Product characteristics: Hamburger Characteristics |Set
2Taiwan McDonald’s Fanpage website: https://www.face book.com/mcdonalds.tw/?fref=ts
Management Review, July 2017 144
Meal Characteristics |Delicious Food|Hamburgers|Set Meals|Ham|Egg|Toast|Breakfast; 6. Emotion related words: Emotion|Mood|Tender feeling|Heartwarming| Power|Warm; 7. Attraction related words: Attention| Strong impression|Want to eat|Texture|Wanna eat|Wanna munch; 8.Actual dining habits: Habits|Real|Everyday living|Eat often|Eat every day. By using the specific methods detailed above, this study used OpView with the set characteristics, dimensions, and keywords to re-search into the posts—both positive and negative—on McDonald’s ‘Prosperity Burgers’ and ‘Sharing Meals’ product ranges.
3.2 Research Design
By incorporating manipulation of the antecedent variables into the experimental design, this study sought to investigate how the interactive effects be-tween social advertising and different positive-negative sWOM order on consumers’ positive/negative emo-tions in the context of branded mobile apps. This study conducts a 4 (high/low SMSA and high/low EMSA) 5(positive/negative/positive-negative/negative-positive/neutral WOM) between-subjects experiment.
3.2.1 Mobile Social Advertising Manipulation
In this study, SMSA and EMSA are used as the antecedent variables for consumer emotions. The advertisement design criteria set are based on the operational definitions of SMSA and EMSA provided by Hyun, Kim, and Lee (2011) and Shang, Chen, and Chen (2009). This study also used the actual adver-tisements presented on the Taiwan McDonald’s Fan Page as source material and manipulated them to de-sign the advertisements for our experiment. This study designed four advertisements in total to post on a branded mobile app: Advertisement with high stim-ulation – ‘Get a Red Envelope with a Prosperity Burger Meal’ (Time of post: 13th January 2014; re-ceived 1500 Likes, 39 Posts, and 62 Shares); Adver-tisement with high empathy – ‘Good Morning, Shar-ing Meals’ (Time of post: 3rd February 2014; received 998 Likes, 16 Comments, and 16 Shares); and two other dummy advertisements with low stimulation and low empathy to act as the control group. This study invited 58 university students (including 31 female students, with an average age of 20.4 years) to conduct a pretest. For each test subject, this study randomly selected one of the four advertisements this study designed, and asked them to answer some ques-tions relating to the stimulation and empathy qualities after seeing the advertisement. Based on Hyun, Kim, and Lee’s (2011) scale for measuring responses to stimulation in advertising (‘interesting’, ‘entertain-ing’, ‘leaves strong impression’, ‘excites me; Cron bach’s alpha=.964) and scale for measuring responses
to empathy in advertising (‘I felt as if I was in the advertisement and experiencing the same things.’; ‘This advertisement was very true to fact and reflects my actual dining habits.’; ‘I like this advertisement because it feels personalized and very relevant to me.’; Cronbach’s alpha=.936), this study developed a 5-point Likert scale for respondents to answer on their perceived attributes (1=strongly disagree; 5=strongly agree). The results showed that the stimulation mobile social advertisement (High SMSA) received relatively higher scores for SMSA-related questions (MHigh-
SMSA=3.497, S.D.=.602; MLowEMSA=1.571, S.D.=.654; F=48.033, p<0.001), and the high empathy mobile social advertisement (High EMSA) received relative-ly higher scores for EMSA-related questions (MHigh-
EMSA=3.583, S.D.=0.401; MLowEMSA=1.533, S.D.=.732; F=58.492, p < .001). The outcomes conformed to our expectations regarding advertising manipulation and selection.
3.2.2 sWOM Manipulation
To reduce possible source of variance and ex-perimental errors, this study took five steps in select-ing and arranging the sWOM types. These steps will increase the accuracy of the study’s conclusions. In previous studies concerning the effect of posi-tive-negative message order on consumer emotions, no specific information or suggestions were provided on how the message were manipulated and how many messages to show, especially in the context of com-munication on branded mobile apps. Furthermore, for this study also had to think about the suitable number of sWOM to manipulate considering the prima-cy-recency effect. To address these points, this study first conducted a survey on 40 university students (including 22 female students, with an average age of 20.2 years) and asked them the following questions: “When browsing through advertisement on a branded mobile app, do you also read the attached sWOM comments?” “On average, how many sWOM posts do you read?” “How many words do you think is the optimum number of words per sWOM comment?” Answers to these questions showed that 92% of re-spondents browse sWOM and on average they read 7.98 comments. They feel the optimum number of words per comment is 10.12 words. Based on these findings this study manipulated and used 8 sWOM posts with an average of 10 words per comment for our experiment. For the positive-negative sWOM order, the combination used was 4 positive posts fol-lowed by 4 negative posts, which was reversed for the negative-positive sWOM order.
The second step was designing the content of the positive sWOM, negative sWOM, and neutral social word-of-mouth (nesWOM). In order to be as

Socialnomics and Mobile Social Media 145
true to the real comments as possible, and ensure the number of words in the positive and negative com-ments fit the set criteria, this study lifted real posts made on the two-product range advertisements and edited them based on other corresponding sWOM posts. This study manipulated and produced 12 posi-tive, negative and neutral sWOM for the ‘Get a Red Envelope with a Prosperity Burger Meal’ advertise-ment, and also a set of 12 sWOM for the ‘Good Morning, Sharing Meals’ advertisement. This study then conducted a test of homogeneity by asking 50 volunteers (of which 28 were female, with an average age of 19.8 years) to answer based on 72 sWOM posts made on two social advertisements. This would allow us to understand their cognition on the sWOM valence. All measures were assessed on a 7-point semantic differential scale (1=negative sWOM; 7=positive sWOM), and the reason for conducting the test was to ensure there is no significant difference between the positive sWOM (negative or neutral sWOM) posts among the two advertisements, so ho-mogenous sWOM posts can be used across different experiment sets and be used as reference basis for our manipulation. The outcome shows that after deleting 6 specific sWOM posts for the two advertisements, the remaining positive sWOM (negative or neutral sWOM) displayed homogeneity (p > .05).
The third step was to ensure that the positivity and negativity levels show substantial difference among the positive, neutral and negative sWOM posts. From all the positive comments received on the two advertisements, this study selected the positive com-ments with the lowest average ratings, and the neutral comments with the highest ratings, and this study compared these comments. After omitting two posts and comparing the rest, the results were: tProsperity Burger
Meal=6.812, p < .001; tGood Morning, Sharing Meals=7.010, p < .001. The results show that there is a significant difference between positive and neutral sWOM. Sim-ilarly, this study took the negative comments with the lowest average ratings, and the neutral comments that scored the highest on negative attributes, and this study compared these comments. After omitting three posts and comparing the rest, the results were: tProsperi-
ty Burger Meal=-6.224, p < .001; tGood Morning Sharing Meals= -5.634, p < .001. This means there is also a significant difference between negative and neutral sWOM.
In the fourth step, this study ensured our ma-nipulation of the five types of sWOM, hence the var-iables, would generate significant effect. For positive sWOM (psWOM), from the positive posts received for the two advertisements, this study selected eight posts with the highest positive ratings. For negative sWOM (nsWOM), this study selected posts with the
highest negative ratings. For the positive-negative sWOM order (pnsWOM), among both positive and negative posts received for the two advertisements, this study selected five positive comments with me-dium ratings and three negative posts with medium ratings. The purpose of this was to avoid the situation in which different levels of positivity and negativity would affect the subjects’ emotions, and to encourage balance by adopting positive and negative posts both on medium-level ratings. Conversely, for the nega-tive-positive sWOM order (npsWOM), among both positive and negative comments received for the two advertisements, this study selected five negative comments with medium ratings, and three positive comments with medium ratings. For the control group, the neutral social word-of-mouth posts (nesWOM), this study selected eight posts with medium ratings from all neutral posts.
Finally, to test the effect of sWOM manipula-tion, this study invited 153 university students (in-cluding 86 females, with an average age of 19.3 years) to participate in a survey. By random selection, each subject was shown one of the five types of sWOM attached to either advertisement, and was asked to rate whether they perceived the comment shown to be negative or positive on a scale. To avoid other factors moderating the results, this study only provided the subjects with the positive or negative sWOM on McDonald’s products without disclosing the product advertisement, and this study also verbally explained to the subjects that the purpose of this survey is to understand their perception of the positive-negative sWOM on specific McDonald’s products. The meas-ure was assessed on a 7-point semantic differential scale from 1 (negative sWOM) to 7 (positive sWOM). The results showed that for EMSA, significant dif-ferences exist amongst the subjects’ perception of the five different types of sWOM (MpsWOM=6.250, S.D.= 0.856; MpnsWOM=4.467, S.D.=0.743; MnsWOM=3.250, S.D.=0.683; MnpsWOM=2.267, S.D.=0.704; MnsWOM= 1.333, S.D.=0.724; F=23.091, p < .001). The Scheffe test also showed significant differences among the five types of sWOM (mean difference equal to 0.934 between negative-positive and positive-negative sWOM orders is lowest, p = .026). For SMSA, subject per-ceptions of the positive and negative attributes of the five types of sWOM also displayed significant dif-ferences (MpsWOM=5.933, S.D.=0.961; MpnsWOM=4.800, S.D.=0.676; MnsWOM=3.125, S.D.=0.806; MnpsWOM=2.200, S.D.=0.862; MnsWOM=1.200, S.D.=0.561; F=39.352, p < .001). Again, the Scheffe test showed significant differences among the five types of sWOM (mean difference equal to -0.925 between negative-positive sWOM and neutral sWOM lowest, p = .038). These outcomes verified the manipulation of the five types

Management Review, July 2017 146
of sWOM for the two product advertisements meet expectations.
3.2.3 Procedures and Participants
This study conducted a laboratory group ex-periment in a closed environment where one from 20 scenarios was randomly selected to disclose to each subject. Before the experiment began, the administra-tor explained and demonstrated with an example of a branded mobile app and related sovial advertising and sWOM to make sure the test subjects understood the experiment and settled into the scenario. The admin-istrator also explained some key points, and then ad-ministered the survey questionnaires. Subjects were asked to view the social advertisements and sWOM content shown on the branded mobile app, and once they had read through all the content, to proceed to evaluate the emotions they experienced.
The convenience sampling method was em-ployed to select the subjects, and each subject was given a scenario randomly selected. The subjects are social media members who have followed or liked a branded mobile app. For this study a total of 700 sur-vey questionnaires were distributed. After omitting the invalid or incomplete responses, this study re-ceived a total of 688 valid questionnaires, which gave a 98.28% response rate. Our sample consists of 57.7% female respondents, 89.1% with a single status, 76.3% university graduates, 20.8% aged 25 and above, 77.3% students, and 62.2% Facebook app users who spend more than 31 minutes per day using the app.
3.2.4 Measures
The dependent variable of this study are con-sumers’ positive/negative emotions, specifically, the personal emotions they experience after seeing the advertisements and sWOM posts on branded mobile apps. For the measurement of consumer emotion, this study refered the Positive and Negative Affect Sched-ule (PANAS) scale proposed by Watson, Clark, and Tellegen (1988). PANAS had previously been adopted by Dubé and Morgan (1998) and Laros and Steenkamp (2005) in their discussions about consumer emotions. It is therefore regarded suitable to reference for this study. In addition to PANAS this study also referred the scale of mood short form, which was designed by Peterson and Sauber (1983) to measure consumers’ short-lived mood after viewing advertisements. With regard to measuring the primacy-recency effect, this study adopted the method used by Kardes and Herr (1990), and asked the subjects to think back, right after answering all the items, which of the sWOM comments made the strongest impression on them. If the respondent’s answer is one of the first four of the
eight total comments shown, they were said to have experienced the primacy effect; if the respondent’s answer was one of the later four of the eight com-ments shown, then they were said to have experienced the recency effect.
To avoid the situation of any unconsidered var-iables affecting the survey results, this study incorpo-rated into this research four control variables, namely brand preference, brand familiarity, theory of human goodness/evil nature, and sWOM message. Past stud-ies show that consumer brand preference is affected by their attitudes toward the brand and the brand’s image. Therefore, brand preference has a positive effect on consumers’ subsequent attitudes and behav-iors (Huang, Chou, and Lin 2010). Similarly, brand familiarity reflects consumers’ experience of and knowledge about certain brands (Alba and Hutchin- son 1987; Kent and Allen 1994). The higher their familiarity, the more comprehensive their brand knowledge, and the more positive and confident their judgments on products. This familiarity will in turn affect their behaviors and attitudes (Hardesty, Carlson, and Bearden 2002). Moreover, if a consumer displays preference to either the positive or negative attributes in the information shown, this may also affect their displayed attitude and decisions. According to the theory of human goodness or evil nature proposed by ancient Chinese philosophers Menzi and Xunzi, re-spectively, humans hold original goodness or evil in their nature, and this fundamentally affects the way they behave and the principles they hold. These theo-ries show similarity to McGregor’s (1967) Theory X and Theory Y. The former assumes that pessimistic individuals tend to hold negative outlooks, whereas the latter assumes that optimistic and motivated indi-viduals are, in general, more positive in their behav-iors. These positive or negative outlooks influence people’s attitudes and decisions (Kopelman, Prottas, and Davis 2008). Based on these studies and theories, this study assumes that people who tend to have a negative outlook will likely interpret messages in a negative way, and subsequently display negative emotions and decisions, and vice versa in the case of more positive people. In the design of our advertise-ment and sWOM scenarios for the survey, this study deliberately omitted the visual information on com-ment statistics (such as the number of Likes, Com-ments and Shares). The purpose of doing so is to avoid these factors influencing the subjects’ answers to the emotional response survey. For brand prefer-ence and familiarity measurement, this study used the scale designed by Mitchell and Olson (1981) for measuring brand preference and the scale designed by Casaló, Flavián, and Guinalíu (2008) for measuring brand familiarity. With regard to the theory of human
Socialnomics and Mobile Social Media 147
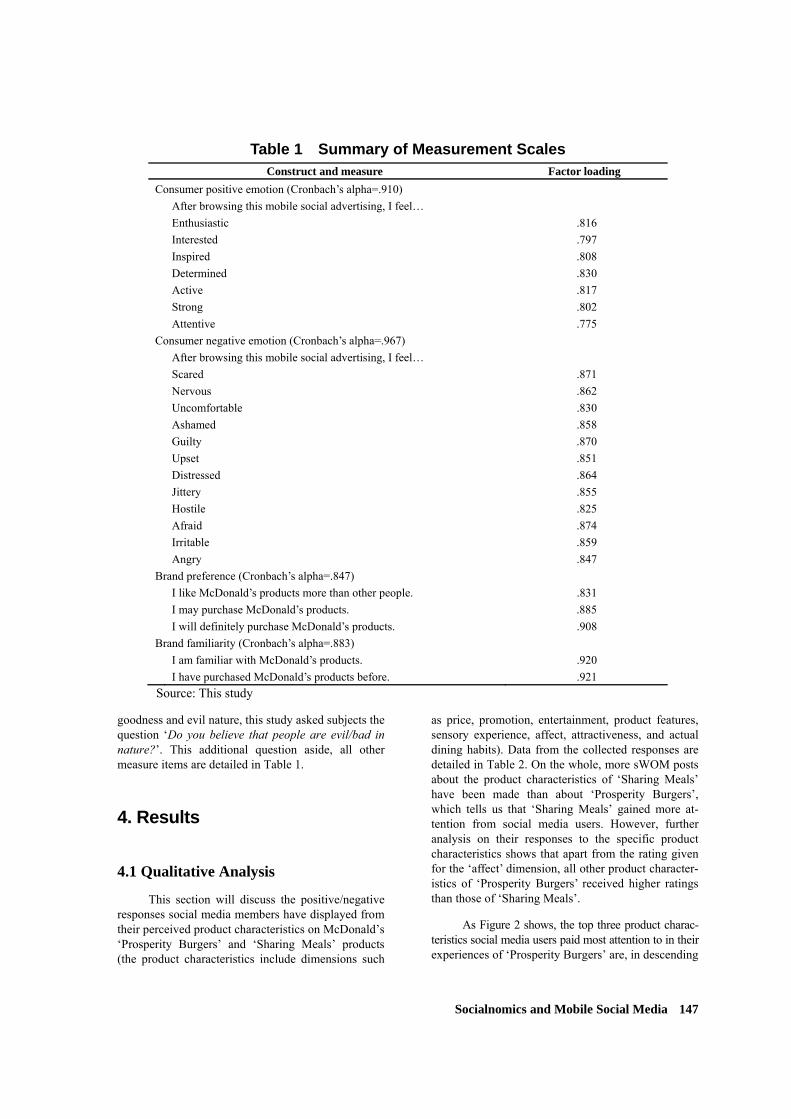
Table 1 Summary of Measurement Scales Construct and measure Factor loading
Consumer positive emotion (Cronbach’s alpha=.910)
After browsing this mobile social advertising, I feel…
Enthusiastic .816
Interested .797
Inspired .808
Determined .830
Active .817
Strong .802
Attentive .775
Consumer negative emotion (Cronbach’s alpha=.967)
After browsing this mobile social advertising, I feel…
Scared .871
Nervous .862
Uncomfortable .830
Ashamed .858
Guilty .870
Upset .851
Distressed .864
Jittery .855
Hostile .825
Afraid .874
Irritable .859
Angry .847
Brand preference (Cronbach’s alpha=.847)
I like McDonald’s products more than other people. .831
I may purchase McDonald’s products. .885
I will definitely purchase McDonald’s products. .908
Brand familiarity (Cronbach’s alpha=.883)
I am familiar with McDonald’s products. .920
I have purchased McDonald’s products before. .921
Source: This study
goodness and evil nature, this study asked subjects the question ‘Do you believe that people are evil/bad in nature?’. This additional question aside, all other measure items are detailed in Table 1.
4. Results
4.1 Qualitative Analysis
This section will discuss the positive/negative responses social media members have displayed from their perceived product characteristics on McDonald’s ‘Prosperity Burgers’ and ‘Sharing Meals’ products (the product characteristics include dimensions such
as price, promotion, entertainment, product features, sensory experience, affect, attractiveness, and actual dining habits). Data from the collected responses are detailed in Table 2. On the whole, more sWOM posts about the product characteristics of ‘Sharing Meals’ have been made than about ‘Prosperity Burgers’, which tells us that ‘Sharing Meals’ gained more at-tention from social media users. However, further analysis on their responses to the specific product characteristics shows that apart from the rating given for the ‘affect’ dimension, all other product character-istics of ‘Prosperity Burgers’ received higher ratings than those of ‘Sharing Meals’.
As Figure 2 shows, the top three product charac-teristics social media users paid most attention to in their experiences of ‘Prosperity Burgers’ are, in descending

Management Review, July 2017 148
Table 2 Analysis of sWOM Volume and Positive/Negative Emotions on McDonald’s Product Characteristics
Product characteris-tics (dimension)
Prosperity Burgers Sharing Meals
sWOM volume
Positive emotion
Negative emotion
P/N ratio
sWOM volume
Positive emotion
Negative emotion
P/N ratio
Price 304 296 147 2.01 2,277 2,231 1,327 1.68 Promotion 135 127 57 2.23 1,362 1,349 754 1.79 Entertainment 66 66 34 1.94 277 277 183 1.51 Product features 311 271 145 1.87 2,194 2,172 1,327 1.64 Sensory experience 96 95 48 1.98 1,223 1,217 765 1.59 Affect 83 81 54 1.50 948 944 581 1.62 Attractiveness 171 162 85 1.91 1,326 1,322 829 1.59
Actual dining habits 53 52 40 1.30 353 353 276 1.28
Source: This study
Figure 2 sWOM Volume and P/N Ratio on McDonald’s Products Characteristics Source: This study
order, product features, price, and attractiveness. However, the three product characteristics that re-ceived the most positive comments (reflecting the brand favorability) in descending order, are promo-tion (P/N Ratio=2.23), price (P/N Ratio=2.01), and sensory experience (P/N Ratio=1.98) (See Table 2). On the other hand, the top three product characteristics social media users paid most attention to in their ex-periences of ‘Sharing Meals’ are, in descending order, price, product features, and promotion. The three product characteristics that received the most positive comments in descending order, are promotion (P/N Ratio=1.79), price (P/N ratio=1.68) and product fea-tures (P/N ratio=1.64). These results verified the as-sumptions that perceived product characteris-tics—including promotion, price, product features and sensory experience—all affect positive/negative emo-tional evaluations. The emotional responses may be evoked by the perceptions of product characteristics
after viewing advertisements (Schlinger 1979). In other words, consumer emotional responses to prod-ucts such as restaurants may be the result of stimula-tion or empathy in advertising (Hyun, Kim, and Lee 2011). Nevertheless, these hypotheses are difficult to verify through pure text mining of social media posts, thus we proposed the experimental design in this study to verify them.
4.2 Quantitative Analysis
4.2.1 Reliability and Validity
For this study, Cronbach’s alpha was used to test the internal consistency of the dimensions listedin the measure items. As Table 1 shows, the Cronbach’s alpha was over 0.7 for all dimensions, which conforms with

Socialnomics and Mobile Social Media 149
Table 3 Descriptive Statistics, Correlation Matrix and Discriminant Validity
Construct AVEa CRb Construct
Consumers positive emotion
Consumers negative emotion
Brand preference
Brand familiarity
Consumers positive emotion
.591 .910 .768
Consumers negative emotion
.712 .967 -.363 .844
Brand preference .790 .882 .491 -.369 .889 Brand familiarity .658 .851 .221 -.173 .209 .811
Note: aAVE=Average variance extracted;bCR=Construct reliability Source: This study.
Nunnally’s rule of thumb of 0.7 or above (Nunnally 1978). Then, to verify the fit of the internal model, this study conducted a Confirmatory Factor Analysis (CFA) with LISREL 8, and used suitable indices to judge the degree of fit between the overall model and the observed data. The CFA results include NNFI=.92, CFI=.93, RMSEA=.068 (<.08), and 2 /df=3.73 (<5), indicating a good fit between the model and the ob-served data. The numbers conformed to the values suggested by Hair et al. (1995), and are therefore considered suitable to verify the fit of the internal model.
For validity, this study used convergent validity and discriminant validity for testing. In the conver-gent validity this study examined three indices in-cluding factor loading, average variance extracted (AVE), and construct reliability (CR). The results are detailed in Table 1, and the lowest factor loading from all the dimensions is .775. Table 3 shows the AVE ranges from .591 to .790, and CR ranges from .851 to .967, all reaching the standard values (factor load-ing > .5, AVE > .5, CR > .6) suggested by Fornell and Larcker (1981). All are well above the cutoff for ac-ceptable convergent validity. Regarding discriminant validity, the AVE for a construct should be greater than the squared correlations of the construct and other constructs in the model (Fornell and Larcker 1981). Table 3 shows the correlations between the constructs in this study. The diagonal elements in this table represent the square of the variance shared be-tween the constructs and their measures, and the off-diagonal elements represent the correlations among the constructs. The results showed that all diagonal elements are greater than their corresponding offdi- agonal elements, which means that the respective constructs exhibit acceptable discriminant validity. Moreover, this study examined the variance inflation factors (VIF) between all dimensions. The VIF values are all between 1 and 3.648, lower than the standard value (<10) suggested by Hair et al. (1995). This means that there is no issue of collinearity among the dimensions.
Table 4 Regression Analysis for Hypotheses
Variable Consumer positive emotion
Control variable Brand preference .360*** Brand familiarity .084* Evil/Bad in human nature -.090*
Independent variable High SMSA .393*** High EMSA .339*** Low EMSA .145***
Adjusted R2 .382 Note: SMSA=Stimulation in mobile social advertisement;
EMSA=Empathy in mobile social advertisement; ***p< .001; ** p < .01; * p < .05
Source: This study.
4.2.2 Hypothesis Testing
After testing the internal fitness, reliability and validity of the measurement model, this study used the regression model to test hypotheses. The ante-cedent variables are SMSA and EMSA, and the de-pendent variables is consumer positive emotion. As the antecedent variables are qualitative type variables, this study assigned codes to them and changed them into dummy variables. For instance, there are four social advertisements in the research, so this study designed three dummy variables, representing: adver-tisement with high empathy (1,0,0), advertisement with low empathy (0,1,0), and advertisement with high stimulation (0,0,1). If all three figures in the coding are 0 then it equals to advertisement with low stimulation (0,0,0). As shown in Table 4, after ex-cluding the effect of control variables, after consum-ers view advertisements with high stimulation and high empathy, they displayed greater positive emo-tions. After excluding for the influence of control variables, (H1a, βSMSA=.393, p < .001; H1b, βEMSA=.339, p < .001). Therefore, both hypotheses H1a and H1b were supported.

Management Review, July 2017 150
Table 5 Mean and Standard Deviation on Consumer Emotions
(Three-way ANOVA)
Construct
Consumer emotion
EMSA SMSA
Mean S.D. Mean S.D.
Total effect Positive-negative sWOM order 3.39 0.41 3.13 0.54
Negative-positive sWOM order 3.00 0.35 2.72 0.48
Primacy effect (a) Positive-negative sWOM order 3.52 0.35 3.32 0.29
(b) Negative-positive sWOM order 2.76 0.28 2.60 0.39
Recency effect (c) Positive-negative sWOM order 2.89 0.23 2.08 0.22
(d) Negative-positive sWOM order 3.13 0.31 3.49 0.27 Source: This study.
Figure 3 EMSA-The Interaction Between sWOM and Primacy-
Recency Effects and Its Impact on Fan’s Emotion
Source: This study.
Figure 4 SMSA-The Interaction Between sWOM and Primacy-
Recency Effects and Its Impact on Fan’s Emotion
Source: This study.
In order to find out how consumer emotions are affected by the relatiohships between social adver-tisement and sWOM orders and primacy-recency effects, this study conducted a three-way ANOVA and found that these factors have significant interactive effects on consumer emotions (F(15,265)=22.556, p = .000). In EMSA, sWOM order and primacy-recency effects have significant interactive effects on con-sumer emotions (F(3,78)=34.541, p = .000). Further analysis showed that of the consumers influenced by the primacy effect, those who viewed sWOM in the positive-negative order displayed significantly stronger emotions than those who viewed sWOM in the nega-tive-positive order (MpnsWOM=3.52 vs. MnpsWOM=2.77; F(1,41)=56.329, p = .000; see Table 5 and Figure 3).
On the other hand, of the consumers influenced by the recency effect, those who viewed sWOM in the posi-tive-negative order did not display significantly lower levels of emotion than those who viewed sWOM in the negative-positive order (MpnsWOM=2.89 vs. Mnps-
WOM=3.14; F(1,34)=3.42, p = .073). For the primacy effect, the effect of sWOM on consumer emotions is conditioned by different sWOM ordering, but for the recency effect, this conditioning effect is not apparent. In other words, EMSA evokes the primacy effect, leading to sWOM seen earlier having a relatively greater impact on consumer emotions. Therefore, the combination of EMSA and positive-negative sWOM order leads to positive emotions in consumers, and EMSA followed by negative-positive sWOM order
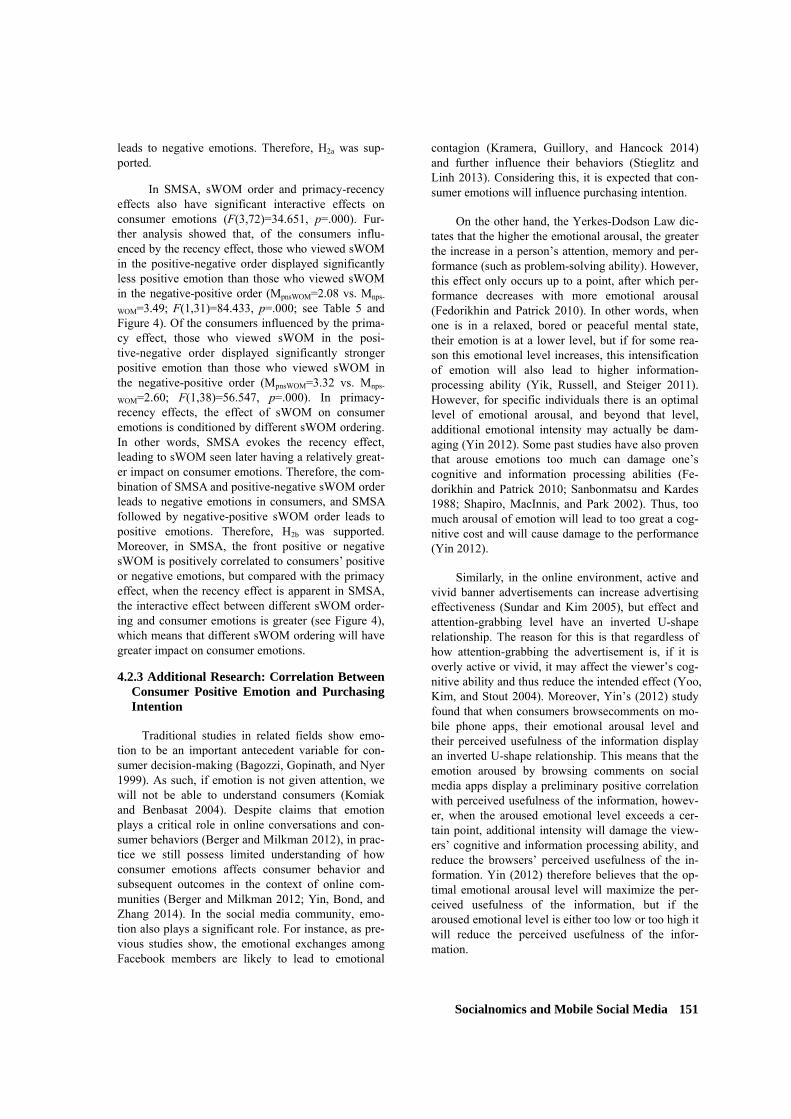
Socialnomics and Mobile Social Media 151
leads to negative emotions. Therefore, H2a was sup-ported.
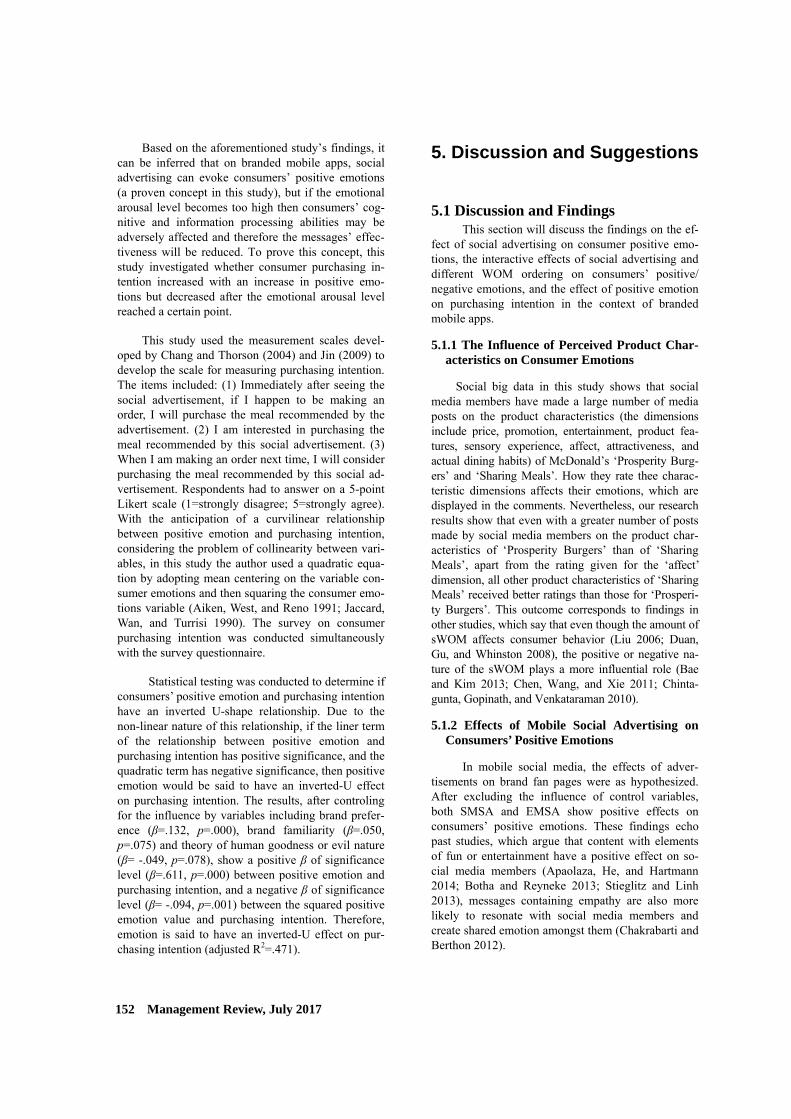
In SMSA, sWOM order and primacy-recency effects also have significant interactive effects on consumer emotions (F(3,72)=34.651, p=.000). Fur-ther analysis showed that, of the consumers influ-enced by the recency effect, those who viewed sWOM in the positive-negative order displayed significantly less positive emotion than those who viewed sWOM in the negative-positive order (MpnsWOM=2.08 vs. Mnps-
WOM=3.49; F(1,31)=84.433, p=.000; see Table 5 and Figure 4). Of the consumers influenced by the prima-cy effect, those who viewed sWOM in the posi-tive-negative order displayed significantly stronger positive emotion than those who viewed sWOM in the negative-positive order (MpnsWOM=3.32 vs. Mnps-
WOM=2.60; F(1,38)=56.547, p=.000). In primacy- recency effects, the effect of sWOM on consumer emotions is conditioned by different sWOM ordering. In other words, SMSA evokes the recency effect, leading to sWOM seen later having a relatively great-er impact on consumer emotions. Therefore, the com-bination of SMSA and positive-negative sWOM order leads to negative emotions in consumers, and SMSA followed by negative-positive sWOM order leads to positive emotions. Therefore, H2b was supported. Moreover, in SMSA, the front positive or negative sWOM is positively correlated to consumers’ positive or negative emotions, but compared with the primacy effect, when the recency effect is apparent in SMSA, the interactive effect between different sWOM order-ing and consumer emotions is greater (see Figure 4), which means that different sWOM ordering will have greater impact on consumer emotions.
4.2.3 Additional Research: Correlation Between Consumer Positive Emotion and Purchasing Intention
Traditional studies in related fields show emo-tion to be an important antecedent variable for con-sumer decision-making (Bagozzi, Gopinath, and Nyer 1999). As such, if emotion is not given attention, we will not be able to understand consumers (Komiak and Benbasat 2004). Despite claims that emotion plays a critical role in online conversations and con-sumer behaviors (Berger and Milkman 2012), in prac-tice we still possess limited understanding of how consumer emotions affects consumer behavior and subsequent outcomes in the context of online com-munities (Berger and Milkman 2012; Yin, Bond, and Zhang 2014). In the social media community, emo-tion also plays a significant role. For instance, as pre-vious studies show, the emotional exchanges among Facebook members are likely to lead to emotional
contagion (Kramera, Guillory, and Hancock 2014) and further influence their behaviors (Stieglitz and Linh 2013). Considering this, it is expected that con-sumer emotions will influence purchasing intention.
On the other hand, the Yerkes-Dodson Law dic-tates that the higher the emotional arousal, the greater the increase in a person’s attention, memory and per-formance (such as problem-solving ability). However, this effect only occurs up to a point, after which per-formance decreases with more emotional arousal (Fedorikhin and Patrick 2010). In other words, when one is in a relaxed, bored or peaceful mental state, their emotion is at a lower level, but if for some rea-son this emotional level increases, this intensification of emotion will also lead to higher information- processing ability (Yik, Russell, and Steiger 2011). However, for specific individuals there is an optimal level of emotional arousal, and beyond that level, additional emotional intensity may actually be dam-aging (Yin 2012). Some past studies have also proven that arouse emotions too much can damage one’s cognitive and information processing abilities (Fe-dorikhin and Patrick 2010; Sanbonmatsu and Kardes 1988; Shapiro, MacInnis, and Park 2002). Thus, too much arousal of emotion will lead to too great a cog-nitive cost and will cause damage to the performance (Yin 2012).
Similarly, in the online environment, active and vivid banner advertisements can increase advertising effectiveness (Sundar and Kim 2005), but effect and attention-grabbing level have an inverted U-shape relationship. The reason for this is that regardless of how attention-grabbing the advertisement is, if it is overly active or vivid, it may affect the viewer’s cog-nitive ability and thus reduce the intended effect (Yoo, Kim, and Stout 2004). Moreover, Yin’s (2012) study found that when consumers browsecomments on mo-bile phone apps, their emotional arousal level and their perceived usefulness of the information display an inverted U-shape relationship. This means that the emotion aroused by browsing comments on social media apps display a preliminary positive correlation with perceived usefulness of the information, howev-er, when the aroused emotional level exceeds a cer-tain point, additional intensity will damage the view-ers’ cognitive and information processing ability, and reduce the browsers’ perceived usefulness of the in-formation. Yin (2012) therefore believes that the op-timal emotional arousal level will maximize the per-ceived usefulness of the information, but if the aroused emotional level is either too low or too high it will reduce the perceived usefulness of the infor-mation.
Management Review, July 2017 152
Based on the aforementioned study’s findings, it can be inferred that on branded mobile apps, social advertising can evoke consumers’ positive emotions (a proven concept in this study), but if the emotional arousal level becomes too high then consumers’ cog-nitive and information processing abilities may be adversely affected and therefore the messages’ effec-tiveness will be reduced. To prove this concept, this study investigated whether consumer purchasing in-tention increased with an increase in positive emo-tions but decreased after the emotional arousal level reached a certain point.
This study used the measurement scales devel-oped by Chang and Thorson (2004) and Jin (2009) to develop the scale for measuring purchasing intention. The items included: (1) Immediately after seeing the social advertisement, if I happen to be making an order, I will purchase the meal recommended by the advertisement. (2) I am interested in purchasing the meal recommended by this social advertisement. (3) When I am making an order next time, I will consider purchasing the meal recommended by this social ad-vertisement. Respondents had to answer on a 5-point Likert scale (1=strongly disagree; 5=strongly agree). With the anticipation of a curvilinear relationship between positive emotion and purchasing intention, considering the problem of collinearity between vari-ables, in this study the author used a quadratic equa-tion by adopting mean centering on the variable con-sumer emotions and then squaring the consumer emo-tions variable (Aiken, West, and Reno 1991; Jaccard, Wan, and Turrisi 1990). The survey on consumer purchasing intention was conducted simultaneously with the survey questionnaire.
Statistical testing was conducted to determine if consumers’ positive emotion and purchasing intention have an inverted U-shape relationship. Due to the non-linear nature of this relationship, if the liner term of the relationship between positive emotion and purchasing intention has positive significance, and the quadratic term has negative significance, then positive emotion would be said to have an inverted-U effect on purchasing intention. The results, after controling for the influence by variables including brand prefer-ence (β=.132, p=.000), brand familiarity (β=.050, p=.075) and theory of human goodness or evil nature (β= -.049, p=.078), show a positive β of significance level (β=.611, p=.000) between positive emotion and purchasing intention, and a negative β of significance level (β= -.094, p=.001) between the squared positive emotion value and purchasing intention. Therefore, emotion is said to have an inverted-U effect on pur-chasing intention (adjusted R2=.471).
5. Discussion and Suggestions
5.1 Discussion and Findings This section will discuss the findings on the ef-
fect of social advertising on consumer positive emo-tions, the interactive effects of social advertising and different WOM ordering on consumers’ positive/ negative emotions, and the effect of positive emotion on purchasing intention in the context of branded mobile apps.
5.1.1 The Influence of Perceived Product Char-acteristics on Consumer Emotions
Social big data in this study shows that social media members have made a large number of media posts on the product characteristics (the dimensions include price, promotion, entertainment, product fea-tures, sensory experience, affect, attractiveness, and actual dining habits) of McDonald’s ‘Prosperity Burg-ers’ and ‘Sharing Meals’. How they rate thee charac-teristic dimensions affects their emotions, which are displayed in the comments. Nevertheless, our research results show that even with a greater number of posts made by social media members on the product char-acteristics of ‘Prosperity Burgers’ than of ‘Sharing Meals’, apart from the rating given for the ‘affect’ dimension, all other product characteristics of ‘Sharing Meals’ received better ratings than those for ‘Prosperi-ty Burgers’. This outcome corresponds to findings in other studies, which say that even though the amount of sWOM affects consumer behavior (Liu 2006; Duan, Gu, and Whinston 2008), the positive or negative na-ture of the sWOM plays a more influential role (Bae and Kim 2013; Chen, Wang, and Xie 2011; Chinta-gunta, Gopinath, and Venkataraman 2010).
5.1.2 Effects of Mobile Social Advertising on Consumers’ Positive Emotions
In mobile social media, the effects of adver-tisements on brand fan pages were as hypothesized. After excluding the influence of control variables, both SMSA and EMSA show positive effects on consumers’ positive emotions. These findings echo past studies, which argue that content with elements of fun or entertainment have a positive effect on so-cial media members (Apaolaza, He, and Hartmann 2014; Botha and Reyneke 2013; Stieglitz and Linh 2013), messages containing empathy are also more likely to resonate with social media members and create shared emotion amongst them (Chakrabarti and Berthon 2012).
Socialnomics and Mobile Social Media 153
5.1.3 The Interactive Effects between Mobile Social Advertising and sWOM Orders on Consumer Emotions
In the context of branded mobile apps, social ad-vertising and sWOM ordering affects consumer emo-tions in the way that this study expected. The results show that EMSA coupled with the positive-negative sWOM order led to consumers responding with posi-tive emotions. Moreover, SMSA followed by the pos-itive-negative sWOM order led to consumers re-sponding with negative emotions, but the opposite happened when SMSA was followed by the nega-tive-positive sWOM order; in this case consumers displayed positive emotion in their responses. These conclusions show that EMSA is more likely to lead to the primacy effect by which consumers are more likely to be affected by earlier messages (front mes-sages) and conversely, SAMA is more likely to bring about the recency effect by which consumers are more likely to be affected by later messages. This is similar to the findings from Hovland and Mandell (1957), Haugtvedt and Wegener (1994) and Lana (1961), which state that higher product involvement by consumers is more likely to result in the primacy effect and demonstrate stronger attitudes toward a product that are less likely to change in response to new external opinions. On the other end of the spec-trum, lower product involvement means their attitude is more likely to weaken or sway as the result of the recency effect. Therefore, when consumers view EMSA with high involvement level (Stern 1992), their deep-rooted feelings will increase and thus lead to the primacy effect, by which they are affected by front messages, and this will solidify their attitudes (Haugtvedt and Wegener 1994) and their secondary emotions (Harmon-Jones et al. 2011). On the other hand, when advertisers intend to influence consumers who have low involvement level via advertisements processed through the peripheral route (Faseur and Geuens 2006), despite SMSA being able to temporarily attract their attention (Spotts, Weinberger, and Parsons 1997), a low product involvement level means their attitudes will easily weaken or sway (Haugtvedt and Wegener 1994). As a result, the recency effect is more apparent and later information will shape consumer attitudes (Haugtvedt and Wegener 1994) and emo-tions (Harmon-Jones et al. 2011).
5.1.4 Effects of Consumer Positive Emotion on Purchasing Intention
The result on consumer positive emotions and their purchasing intention also conformed to our hy-pothesis because they displayed an inverted U-shape relationship. This outcome is in line with the concepts proposed by scholars including Forgas (1995) and
Söderlund and Rosengren (2007), who argued that affective information influences judgment, and that emotion is the main criterion on which consumers base their evaluation or judgment. The outcome also conforms to the Yerkes-Dodson Law, which dictates that too high an evoked emotional level will actually damage one’s cognitive and information processing abilities (Fedorikhin and Patrick 2010; Sanbonmatsu and Kardes 1988; Shapiro, MacInnis, and Park 2002), and thus reduce the effectiveness of online advertise-ments (Sundar and Kim 2005; Yoo, Kim, and Stout 2004) and social media posts (Yin 2012).
5.2 Theoretical Contributions
For this study, one of the most cited theories, the HOE model (Lavidge and Steiner 1961), was adopted to test the effect of social advertising on consumer intentions in the context of branded mobile apps. Due to the nature of social media, not only so-cial advertising, but the subsequent posts and com-ments (sWOM) that follow, also influence consumer emotions. Until now, very little research has discussed the interactive effects between social advertising and sWOM order on consumer emotions. The findings from this study will provide useful information to supplement the HOE model, and the specific theoret-ical contributions are explained below.
First, it has been pointed out that the content characteristics (Botha and Reyneke 2013; Chakrabarti and Berthon 2012) and valences being expressed (Kramera, Guillory, and Hancock 2014) affect the emotions of social media group members, but the specifics of those characteristics, and the effects when applied to social media marketing, have not received sufficient attention. In terms of content characteristics, this study offers an expanded perspective on the con-cepts proposed by scholars including Botha and Reyneke (2013) and Chakrabarti and Berthon (2012). This study also expanded on the concepts proposed by Apaolaza, He, and Hartmann (2014), Hyun, Kim, and Lee (2011), and Schlinger (1979) about the scope of effect of SMSA and EMSA, conducted experi-ments, and verified that in the context of branded mobile apps, SMSA and EMSA also display signifi-cant effects on consumer emotions. Second, past studies do not offer any discussion on how the inter-action between social advertising and different sWOM ordering affects consumer emotions. Our study proved that, in the context of mobile social media, the effects of advertising and sWOM on consumer emotions are conditioned by different sWOM ordering in accord-ance with the primacy and recency effects. Third, Oliver, Rust, and Varki (1997) showed that it is insuf-

Management Review, July 2017 154
ficient to merely satisfy customers; you need to de-light them. This concept has been proven in the mo-bile social media, and further justifies consumer posi-tive emotion’s non-linear effect on consumer pur-chasing intention (a U-shape relationship is found). This indicates that there is an optimal level of positive emotion, and excessively high or low levels of posi-tive emotion can reduce purchasing intention. Finally, even though the subjects studied are Facebook app users, the findings of this study should also be appli-cable to other mobile social media with similar func-tions and interpersonal ties, such as Twitter, Line, WhatsApp and WeChat (Lin et al. 2017).
5.3 Practical Contributions
The findings from this study offer important implications for socialnomics and social marketing on two dimensions: the application of findings, and the policy implications and suggestions.
5.3.1 Application of Research Findings
First, this study found that content with ele-ments of stimulation and empathy will increase con-sumer positive emotion and lead to greater purchasing intention. This shows that emotion has a significant impact on how consumers process information and how their attitudes are shaped (Yin 2012). This study therefore suggests that managers design messages, videos, photos or games with fun or entertaining ele-ments, or increase positive emotions by offering in-formation on prize draws, promotions or utilizing hashtag marketing. These methods will encourage member participation (Likes, Comments and Shares) (Shen 2013), and in turn achieve emotional contagion. Second, it has been proven that social advertising combined with different sWOM ordering influences consumer emotions differently. This study therefore suggests that when employing social advertising, the manager first determines the nature of the advertise-ment. Because EMSA is more likely to induce the primacy effect, if coupled with front positive com-ments, consumers will respond with positive emotions, and vice versa. On the other hand, because SMSA is likely to induce the recency effect, if the later mes-sages are negative then consumer emotions will tend to be negative, and vice versa. managers are faced with the challenge of how to appropriately deal with contingencies in the scenario of consumers displaying negative emotions. Third, an inverted U-shape rela-tionship exists between consumer positive emotion and consumer purchasing intention, and there is an optimal level of positive emotion. Thus, this study suggests managers determine that optimal level for
positive emotion to positively influence purchasing intention, and use this as basis for setting indicators on the suitability of brand fan page marketing tactics and campaigns. Managers should avoid fun or emo-tion-arousing comments or advertisement irrelevant to their brands or products for the sake of grabbing con-sumer attention or simply being fun. Also, while en-couraging people to provide positive sWOM, they should also ask members to refrain from overly emo-tional comments, as such comments may lead to the focus being lost due to excessive amounts of emo-tional contagion (Fedorikhin and Patrick 2010).
5.3.2 Policy Implications
Porter and Heppelmann (2014) pointed out that with the consolidation of various technologies in-cluding mobile Internet, cloud computing, big data and IoT, businesses are entering the third wave of modern competition, making the competitive advan- tage achieved by integrating industry supply chains appear obsolete. It is therefore important for busi-nesses in Taiwan to consider how to integrate these technologies and transform into Internet+ businesses and practice socialnomics. The greatest value of so-cialnomics lies in big data, and in order to succeed in this environment, businesses must encourage con-sumers to interact and create value. Further, they must build consumer positive emotions and purchasing intentions through the dissemination of sWOM (Kong 2015; Lu and Na 2016; Qualman 2009). This study offers two suggestions. First, when manipulating so-cial advertisements to build affect among group members, administrators must consider the effects of advertisement characteristics and the positive-negative sWOM ordering on consumers. Second, this study suggests that Internet+ businesses adopt a combina-tion of qualitative and quantitative methods to analyze large amounts of complex social media information. They can do this through big data text mining, and explore the feelings and comments consumers have regarding brand characteristics. Then, through an inte-grated experimental design they can conduct quantita-tive analysis on real, complex consumer behaviors. In other words, using a multi-dimensional approach to explore consumer behavior can lead to richer and more valuable conclusions, that will in turn innovate business approaches and strategies, and ultimately help socialnomics thrive and help introduce necessary business model transformation in Taiwanese enter-prises.
5.4 Limitations and Future Research
Despite adopting a rigorous approach in our re-search process, there are still several limitations based

Socialnomics and Mobile Social Media 155
on which this study can make suggestions for future research. First, the subjects in this study are mobile social media users in Taiwan, so it may be challeng-ing to use the findings of this study to reach conclu-sions for users in other geographical areas. This study suggests future studies use our findings as reference to discuss consumption behavior of mobile social media users in different geographical areas. Second, this study conducted our survey on the catering in-dustry only, so it is inappropriate to generalize the results to all other industries. This study suggests future studies focus their research on industries in different sectors (e.g., IT, automobile, insurance in-dustries), and conduct cross-sector or cross-industry comparisons. This will make the findings more valu-able in terms of theoretical and practical contributions. Third, the manipulation method this study adopted involves manipulating 8 sWOM posts with 4 positive followed by 4 negative comments for the positive- negative order, and vice versa. However, this manip-ulation method may be different to practical scenarios and these discrepancies may be reflected in the results. This study suggests that future studies create even more realistic scenarios by adjusting the number of comments and order combinations in the manipula-tion, which will offer insight into the effect of differ-ent sWOM order combinations on consumer emotions. Similarly, in reality, it is possible that a single adver-tisement contains multiple elements and dimensions including but not limited to stimulation and empathy. Therefore, future studies can discuss the effect of advertising with multiple dimensions on consumer emotions. Fourth, the difference between computer based social media (PC or laptops) and mobile social media (tablet, mobile phones or smart watch) is that the latter offers accessibility, mobility, portability, convenience, and is not constrained by space and time (Wei and Lu 2014;Wei and Lo 2006). If this study also takes into consideration screen size as another factor, these are all possible variables that will affect the emotional contagion effect among mobile social media members. Therefore, this study suggests that future studies further compare the perceived different features between computer and mobile devices, their relationship with social advertising, user posts, and their interactive effects with consumer emotions and purchasing intention. This will offer more insight on the differences between the effects of social media on different types of device and mediums. Fifth, in the context of branded mobile apps, in reality, consumers are often exposed simultaneously to multiple adver-tisements of different types, positive-negative, and negative-positive sWOM ordering. This may cause confusion on the cause-effect relationship between social advertising and sWOM. To understand how this might affect consumer emotions, this study suggests
that future studies incorporate a scenario with multi-ple advertisements and a mixture of both positive- negative and negative-positive sWOM ordering in their experimental design.

Management Review, July 2017 156
REFERENCES
Abrams, Meyer H. (1988), A Glossary of Literary Terms, 5th ed. New York: Holt, Rinehart and Winston, Inc.
Aiken, Leona S., Stephen G. West, and Raymond R. Reno (1991), Multiple Regression: Testing and Interpreting Interactions. Newbury Park, CA: Sage.
Alba, Joseph W. and John Wesley Hutchinson (1987), “Dimensions of Consumer Expertise,” Journal of Consumer Research, 13(3), 411-454.
Apaolaza, Vanessa, Jiaxun He, and Patrick Hartmann (2014), “The Effect of Gratifications Derived from Use of the Social Networking Site Qzone on Chinese Adolescents’ Positive Mood,” Com-puters in Human Behavior, 41(December), 203- 211.
Bae, Jungho and Byung D. Kim (2013), “Is the Elec-tronic Word of Mouth Effect always Positive on the Movie?” Academy of Marketing Studies Journal, 17(1), 61-78.
Bagozzi, Richard P., Mahesh Gopinath, and Prashanth U. Nyer (1999), “The Role of Emotions in Mar-keting,” Journal of the Academy of Marketing Science, 27(2), 184-206.
Beedie, Christopher J., Peter C. Terry, and Andrew M. Lane (2005), “Distinctions between Emotion and Mood,” Cognition and Emotion, 19(6), 847-878.
Berger, Jonah and Katherine L. Milkman (2012), “What Makes Online Content Viral?” Journal of Marketing Research, 49(2), 192-205.
Botha, Elsamari and Mignon Reyneke (2013), “To Share or not to Share: The Role of Content and Emotion in Viral Marketing,” Journal of Public Affairs, 13(2), 160-171.
Brajnik, Giorgio and Silvia Gabrielli (2010), “A Re-view of Online Advertising Effects on the User Experience,” International Journal of Human- Computer Interaction, 26(10), 971-997.
Buda, Richard and Yong Zhang (2000), “Consumer Product Evaluation: The Interactive Effect of Message Framing, Presentation Order, and Source Credibility,” Journal of Product and Brand Man-agement, 9(4), 229-242.
Casaló, Luis, Carlos Flavián, and Miguel Guinalíu (2008), “The Role of Perceived Usability, Repu-tation, Satisfaction and Consumer Familiarity on
the Website Loyalty Formation Process,” Com-puters in Human Behavior, 24(2), 325-345.
Chakrabarti, Ronika and Pierre Berthon (2012), “Gift Giving and Social Emotions: Experience as Content,” Journal of Public Affairs, 12(2), 154- 161.
Chang, Chingching (2006), “Beating the New Blues: Mood Repair Through Exposure to Advertising,” Journal of Communication, 56(1), 198-217.
Chang, Yuhmiin and Esther Thorson (2004), “Televi-sion and Web Advertising Synergies,” Journal of Advertising, 33(2), 75-84.
Chen, Kaige G. (2014), “Worry of WeChat E-commerce: O2O or Platform,” IT Time Weekly, 19(November), 37-38.
Chen, Qimei and William D. Wells (1999), “Attitude Toward the Site,” Journal of Advertising Re-search, 39(5), 27-37.
Chen, Yubo, Qi Wang, and Jinhong Xie (2011), “Online Social Interactions: A Natural Experi-ment on Word of Mouth Versus Observational Learning,” Journal of Marketing Research, 48(2), 238-254.
Chintagunta, Pradeep K., Shyam Gopinath, and Sri-ram Venkataraman (2010), “The Effects of Online User Reviews on Movie Box Office Per-formance: Accounting for Sequential Rollout and Aggregation Across Local Markets,” Mar-keting Science, 29(5), 944-957.
comScore (2013), “Mobile Future in Focus 2013,” (ac-cessed June 12, 2014), [available at http://www. comscore.com/Insights/Presentations_and_ Whitepapers/2013/2013_Mobile_Future_in_ Focus].
Derks, Daantje, Agneta H. Fischer, and Arjan E.R. Bos (2008), “The Role of Emotion in Comput-er-Mediated Communication: A Review,” Com-puters in Human Behavior, 24(3), 766-785.
Duan, Wenjing, Bin Gu, and Andrew B. Whinston (2008), “The Dynamics of Online Word-of- Mouth and Product Sales-An Empirical Investi-gation of the Movie Industry,” Journal of Re-tailing, 84(2), 233-242.
Dubé, Laurette and Michael S. Morgan (1998), “Capturing the Dynamics of in-Process Con-sumption Emotions and Satisfaction in Extended Service Transactions,” International of Journal Research Marketing, 15(4), 309-320.

Socialnomics and Mobile Social Media 157
Duncan, Calvin P. and James E. Nelson (1985), “Ef-fects of Humor in a Radio Advertising Experi-ment,” Journal of Advertising, 14(2), 33-64.
Eid, Michael and Ed Diener (2001), “Norms for Ex-periencing Emotions in Different Cultures: Inter- and International Differences,” Journal of Per-sonality and Social Psychology, 81(5), 869-885.
Escalas, Jennifer E. and Barbara B. Stern (2003), “Sympathy and Empathy: Emotional Responses to Advertising Dramas,” Journal of Consumer Research, 29(1), 566-578.
Faseur, Tine and Maggie Geuens (2006), “Different Positive Feelings Leading to Different Ad Eval-uations: The Case of Coziness, Excitement, and Romance,” Journal of Advertising, 35(4), 129- 142.
Fedorikhin, Alexander and Vanessa M. Patrick (2010), “Positive Mood and Resistance to Temptation: The Interfering Influence of Elevated Arousal,” Journal of Consumer Research, 37(4), 698-711.
Forgas, Joseph P. (1995), “Mood and Judgment: The Affect Infusion Model (AIM),” Psychological Bulletin, 117(1), 39-66.
Fornell, Claes and David F. Larcker (1981), “Evalu-ating Structural Equation Models with Unob-servable Variables and Measurement Error,” Journal of Marketing Research, 18(1), 39-50.
Garnefeld, Ina and Lena Steinhoff (2013), “Primacy Versus Recency Effects in Extended Service Encounters,” Journal of Service Management, 24(1), 64-81.
Geuens, Maggie and Patrick De Pelsmacker (1998), “Feelings Evoked by Warm, Erotic, Humorous or Non-Emotional Print Advertisements for Al-coholic Beverages,” Academy of Marketing Sci-ence Review, 2(2), 1-32.
Ha, Young W., Jimin Kim, Christian F. Libaque-Saenz, Younghoon Chang, and Myeong C. Park (2015), “Use and Gratifications of Mobile SNSs: Face-book and Kakaotalk in Korea,” Telematics and Informatics, 32 (3), 425-438.
Hair, Joseph F. Jr., Rolph E. Anderson, Ronald L. Tat-ham, and William Black (1995), Multivariate Da-ta Analysis with Reading. New York: Macmillan.
Hardesty, David M., Jay P. Carlson, and William O. Bearden (2002), “Brand Familiarity and Invoice Price Effects On Consumer Evaluations: The Moderating Role of Skepticism Toward Adver-tising,” Journal of Advertising, 31(2), 1-15.
Harmon-Jones, Eddie, Cindy H. Jones, David M. Amodio, and Philip A. Gable (2011), “Attitudes toward Emotion,” Journal of Personality and Social Psychology, 101(6), 1332-1350.
Hatfield, Elaine, John T. Cacioppo, and Richard L. Rapson (1992), “Primitive Emotional Contagion,” in Review of Personal and Social Psychology: Emotion and Social Behavior, Vol.14, Margaret S. Clark, ed. Newbury Park, CA: Sage, 151-177.
Haugtvedt, Curtis P. and Duane T. Wegener (1994), “Message Order Effects in Persuasion: An Atti-tude Strength Perspective,” Journal of Consumer Research, 21(1), 205-218.
He, Ying Wei (2013), “Taiwan Amongst Top Facebook Users,” (accessed December 20, 2013), [available at http://news.chinatimes.com/tech/171706/12201 3081900251.html].
Holbrook, Morris B. and Rajeev Batra (1987), “As-sessing the Role of Emotions as Mediators of Consumer Responses to Advertising,” Journal of Consumer Research, 14(3), 404-420.
Hollebeek, Linda D., Mark S. Glynnb, and Roderick J. Brodie (2014), “Consumer Brand Engagement in Social Media: Conceptualization, Scale Devel-opment and Validation,” Journal of Interactive Marketing, 28(2), 149-165.
Hovland, Carl I. and Wallace Mandell (1957), “Is There a ‘Law of Primacy’ in Persuasion?” in The Order of Presentation in Persuasion, Vol.1, Carl Iver Hovland, Wallace Mandell, Edward H. Campbell, Timothy Brock, Abraham S. Luchins, Arthur R. Cohen, Wil-liam J. McGuire, Irving L. Janis, Rosalind L. Feiera-bend, and Norman H. Anderson, eds. New Haven, CT: Yale University Press, 1-22.
Hsee, Christopher K., Elaine Hatfield, John G. Carl-son, and Claude Chemtob (1990), “The Effect of Power on Susceptibility to Emotional Contagion,” Cognition and Emotion, 4(4), 327-340.
Huang, Ching Y., Chia J. Chou, and Pei C. Lin (2010), “Involvement Theory in Constructing Bloggers’ Intention to Purchase Travel Products,” Tourism Management, 31(4), 513-526.
Hyun, Sunghyup S., Wansoo Kim, and Myong J. Lee (2011), “The Impact of Advertising on Patrons’ Emotional Responses, Perceived Value, and Be-havioral Intentions in the Chain Restaurant In-dustry: The Moderating Role of Advertising- Induced Arousal,” International Journal of Hos-pitality Management, 30(3), 689-700.
Jaccard, James, Choi K. Wan, and Robert Turrisi (1990), “The Detection and Interpretation of In-

Management Review, July 2017 158
teraction Effects Between Continuous Variables in Multiple Regression,” Multivariate Behavior-al Research, 25(4), 467-478.
Jin, Seung A. (2009), “Modality Effects in Second Lift: The Mediating Role of Social Presence and the Moderating Role of Product Involvement,” Cyberpsychology & Behavior, 12(6), 717-721.
Kaplan, Andreas M. (2012), “If You Love Something, Let it Go Mobile: Mobile Marketing and Mobile Social Media 4x4,” Business Horizons, 55(2), 129-139.
Kardes, Frank R. and Paul M. Herr (1990), “Order Effects in Consumer Judgment, Choice, and Me- mory: The Role of Initial Processing Goals,” Ad-vances in Consumer Research, 17(1), 541-546.
Kent, Robert J. and Chris T. Allen (1994), “Competi-tive Interference Effects on Consumer Memory for Advertising: The Role of Brand Familiarity,” Journal of Marketing, 58(3), 94-107.
Kiráľová, Alžbeta and Antonín Pavlíčeka (2015), “De-velopment of Social Media Strategies in Tourism Destination,” Procedia - Social and Behavioral Sciences, 175(12), 358-366.
Komiak, Sherrie X. and Izak Benbasat (2004), “Un-derstanding Customer Trust in Agent-Mediated Electronic Commerce, Web-Mediated Electronic Commerce, and Traditional Commerce,” Infor-mation Technology and Management, 5(1-2), 181- 207.
Kong, Jian Ping (2015), Socialnomics: Future Com-mercial Driving Force in the Mobile Internet Age. Beijing: China Machine Press.
Kopelman, Richard E., David J. Prottas, and Anne L. Davis (2008), “Douglas Mcgregor's Theory X and Y: Toward a Construct-Valid Measure,” Journal of Managerial Issues, 20(2), 255-271.
Kramera, Adam D. I., Jamie E. Guillory, and Jeffrey T. Hancock (2014), “Experimental Evidence of Massive-Scale Emotional Contagion Through Social Networks,” Proceedings of the National Academy of Sciences of the United States of America, 111(24), 8788-8790.
Lahikainen, Anja R., Tiina Kirmanen, Inger Kraav, and Merle Taimalu (2003), “Studying Fears in Young Children,” Childhood, 10(1), 83-104.
Lana, Robert E. (1961), “Familiarity and the Order of Presentation of Persuasive Communications,” Abnormal and Social Psychology, 62(April), 573-577.
Laros, Fleur J. M. and Jan-Benedict E. M. Steenkamp (2005), “Emotions in Consumer Behavior: A Hi-erarchical Approach,” Journal of Business Re-search, 58(10), 1437-1445.
Lavidge, Robert J. and Gary A. Steiner (1961), “A Model for Predictive Measurements of Advertis-ing Effectiveness,” Journal of Marketing, 25(6), 59-62.
Leavitt, Clark (1970), “A Multi-Dimensional Set of Rating Scales for Television Commercials,” Jour- nal of Applied Psychology, 54(5), 427-429.
LeDoux, Joseph E. (2000), “Emotion Circuits in the Brain,” Annual Review of Neuroscience, 23(1), 155-184.
Lee, Jieun and IIyoo B. Hong (2016), “Predicting Positive User Responses to Social Media Adver-tising: The Roles of Emotional Appeal, Informa-tiveness, and Creativity,” International Journal of Information Management, 36(3), 360-373.
Lee, Woojin, Lina Xiong, and Clark Hu (2013), “The Effect of Facebook Users’ Arousal and Valence on Intention to Go to The Festival: Applying an Extension of the Technology Acceptance Model,” International Journal of Hospitality Manage-ment, 31(3), 819-827.
Lichtenstein, Meryl and Thomas K Srull (1987), “Pro-cessing Objective as a Determinant of the Rela-tionship Between Recall and Judgment,” Journal of Experimental Social Psychology, 23(2), 93-118.
Lin, Tom M. Y., Yun K. Huang, and Wen I. Yang (2007), “An Experimental Design Approach to Investigating the Relationship between Internet Book Reviews and Purchase Intention,” Library and Information Science Research, 29(3), 397-415.
Lin, Yu H., Chia L. Hsu, Mei F. Chen, and Cheng H. Fang (2017), “New Gratifications for Social Word- of-Mouth Spread via Mobile SNSs: Uses and Gratifications Approach with a Perspective of Media Technology,” Telematics and Informatics, 34(4), 382-397.
Ling, I Ling and Yi Fen Liu (2008), “Comprehension and Persuasion on Advertising Message: Heuris-tic-Systematic Model Approach,” Journal of Management, 25(5), 487-503.
Lipstein, Benjamin and James P. Neelankavil (1982), Television Advertising Copy Research Practices among Major Advertisers and Advertising Agen-cies: An Advertising Research Foundation Sur-vey. New York: Advertising Research Founda-tion.
Socialnomics and Mobile Social Media 159
Liu, Jenn L.,Guan Lin Li, and Ching Feng Wang (2016), “Analysis of the Trends in the Use of In-stant Messaging of Taiwan Mobile Users Based on Social Big Data,” paper presented at the TA-NET2016 Taiwan Internet Symposium Proceed-ings, Hualien: National Donghua University, (October 19-21), 871-876.
Liu, Yong (2006), “Word of Mouth for Movies: Its Dynamics and Impact on Box Office Revenue,” Journal of Marketing, 70(3), 74-89.
Lu, Yan and Lan Na (2016), Social+: Internet+ Busi-ness Action Road Map. Beijing: China Machine Press.
Luarn, Pin, Jen C. Yang, and Tu P. Chiu (2015), “Why People Check-in: Motivation to Engage in Check-in Behavior,” International Journal of Electronic Commerce, 19(4), 21-46.
McGregor, Douglas (1967), The Professional Man-ager. New York: McGraw Hill.
Miller, Chip E., James Reardon, Laura Salciuviene, Vilte Auruskeviciene, Kelvin Lee, and Kenneth E. Miller (2009), “Need for Cognition as A Moderator of Affective and Cognitive Elements in Online Attitude Toward the Brand Formation,” Journal of Business and Economics Research,7(12), 65-72.
Mitchell, Andrew A. and Jerry C. Olson (1981), “Are Product Attribute Beliefs the only Mediator of Advertising Effects on Brand Attitude?” Journal of Marketing Research, 18(3), 318-332.
Mooradian, Todd A., Kurt Matzler, and Lisa Szyk-man (2008), “Empathetic Responses to Adver-tising: Testing a Network of Antecedents and Consequences,” Marketing Letter, 19(2), 79-92.
Murry, John P. Jr. and Peter A. Dacin (1996), “Cog-nitive Moderators of Negative-Emotion Effects: Implications for Understanding Media Context,” Journal of Consumer Research, 22(4), 439-448.
Nunnally, Jum C. (1978), Psychometric Theory, 2nd ed. New York: McGraw-Hill.
Okazaki, Shintaro (2008), “Determinant Factors of Mobile-Based Word-of-Mouth Campaign Re-ferral among Japanese Adolescents,” Psychology & Marketing, 25(8), 714-731.
---- (2009), “Social Influence Model and Electronic Word of Mouth,” International Journal of Ad-vertising, 28(3), 439-472.
---- and Maria J. Yagüe (2012), “Responses to an Advergaming Campaign on a Mobile Social
Networking Site: An Initial Research Report,” Computers in Human Behavior, 28(1), 78-86.
Oliver, Richard L., Roland T. Rust, and Sajeev Varki (1997), “Customer Delight: Foundations, Find-ings, and Managerial Insight,” Journal of Re-tailing, 73(3), 311-336.
Online Publisher Association (2007), “Opa Europe Internet Use at Work Media Consumption Study 2007,” (accessed June 15, 2014), [available at http://www.opa-europe.org].
Ozok, Asim A. and June Wei (2010), “An Empirical Comparison of Consumer Usability Preferences in Online Shopping Using Stationary and Mobile Devices: Results from A College Student Popu-lation,” Electronic Commerce Research, 10(2), 111-137.
Palka, Wolfgang, Key Pousttchi, and Dietmar G. Wiedemann (2009), “Mobile Word-of-Mouth - A Grounded Theory of Mobile Viral Marketing,” Journal of Information Technology, 24(2), 172- 185.
Peterson, Robert A. and Matthew H. Sauber (1983), “A Mood Scale for Survey Research,” in Amer-ican Marketing Association Educators’ Pro-ceedings, Patrick Murphy, ed. Chicago: Ameri-can Marketing Association, 409-414.
Pietilainen, Anna K., Earl Oliver, Jason LeBrun, George Varghese, and Christophe Diot (2009), “Mobiclique: Middleware for Mobile Social Networking,” paper presented at the WOSN’09, Barcelona, Spain (August 17).
Porter, Michael E. and James E. Heppelmann (2014), “How Smart, Connected Products are Trans-forming Competition,” Harvard Business Review, 92(11), 11-64.
Purcell, Kristen (2011), “Half of Adult Cell Phone Owners have Apps on Their Phones,” (accessed June 8, 2014), [available at http://pewinternet.org/~/media// Files/Reports/2011/PIP_Apps-Update-2011.pdf].
Qualman, Erik (2009), Socialnomics: How Social Me-dia Transforms the Way We Live and Do Business. Hoboken, New Jersey: John Wiley & Sons, Inc.
Sanbonmatsu, David M. and Frank R. Kardes (1988), “The Effects of Physiological Arousal on Infor-mation-Processing and Persuasion,” Journal of Consumer Research, 15(3), 379-385.
Schlinger, Mary J. (1979), “A Profile of Responses to Commercials,” Journal of Advertising Research, 19(2), 37-46.

Management Review, July 2017 160
Shang, Rong A., Yu C. Chen, and Shin Y. Chen (2009), “The Number of Alternative Products and the Information About it on the Online Shop,” paper presented at the 13th Pacific Asia Confer-ence on Information Systems, Hyderabad, India (July 10-12).
Shapiro, Stewart, Deborah J. MacInnis, and Choong Whan Park (2002), “Understanding Program- Induced Mood Effects: Decoupling Arousal from Valence,” Journal of Advertising, 31(4), 15-26.
Shen, Kai S. (2013), “Measuring the Sociocultural Appeal of SNS Games in Taiwan,” Internet Re-search, 23(3), 372-392.
Söderlund, Magnus and Sara Rosengren (2007), “Re-ceiving Word-of-Mouth from the Service Cus-tomer: An Emotion-Based Effectiveness As-sessment,” Journal of Retailing and Consumer Services, 14(2), 123-136.
Spotts, Harlan E., Marc G. Weinberger, and Amy L. Parsons (1997), “Assessing the Use and Impact of Humor on Advertising Effectiveness: A Contin-gency Approach,” Journal of Advertising, 26(3), 17-32.
Stern, Barbara B. (1992), “Historical and Personal Nostalgia in Advertising Text: The Fin de siecle Effect,” Journal of Advertising, 21(4), 11-22.
Stieglitz, Stefan and Dang X. Linh (2013), “Emotions and Information Diffusion in Social Media— Sentiment of Microblogs and Sharing Behavior,” Journal of Management Information Systems, 29(4), 217-247.
Stout, Patricia A. and Roland T. Rust (1993), “Emo-tional Feelings and Evaluative Dimensions of Advertising: Are They Related?” Journal of Ad-vertising, 22(1), 61-72.
Strasheim, Arien, Leyland Pitt, and Albert Caruana (2007), “Psychometric Properties of the Schlinger Viewer Response Profile (VRP),” Journal of Ad-vertising, 36(4), 101-114.
Sundar, S. Shyam and Jinhee Kim (2005), “Interac-tivity and Persuasion: Influencing Attitudes with Information and Involvement,” Journal of Inter-active Advertising, 5(2), 6-29.
Tan, Xin, Li Qin, Yongbeom Kim, and Jeffrey Hsu (2012), “Impact of Privacy Concern in Social Networking Web Sites,” Internet Research, 22(2), 211-233.
Tsang, Alex S. L. and Gerard Prendergast (2009), “Is a ‘Star’ Worth a Thousand Words?: The Inter-play between Product-Review Texts and Rating
Valences,” European Journal of Marketing, 43 (11/12), 1269-1280.
Watson, David, Lee A. Clark, and Auke Tellegen (1988), “Development and Validation of Brief Measures of Positive and Negative Affect: The PANAS Scale,” Journal of Personality and So-cial Psychology, 54(6), 1063-1070.
Wei, Pei S. and His P. Lu (2014), “Why do People Play Mobile Social Games? An Examination of Network Externalities and of Uses and Gratifica-tions,” Internet Research, 24(3), 313-331.
Wei, Ran and Ven H. Lo (2006), “Staying Connected While on the Move: Cell Phone Use and Social Connectedness,” New Media & Society, 8(1), 53-72.
Wells, William D. (1964), “EQ, Son of EQ, and the Reaction Profile,” Journal of Marketing, 28(4), 45-52.
----, Clark Leavitt, and Maureen McConville (1971), “A Reaction Profile for TV Commercials,” Journal of Advertising Research, 11(6), 11-17.
Xie, Wenjing, Yunze Zhao, and Wenya Xie (2013), “The Effects of Interface Design of Hand-Held Devices on Mobile Advertising Effectiveness among College Students in China,” International Journal of Mobile Marketing, 8(1), 46-61.
Xiong, Wei, Zhen Zhao, and Jingxuan Fang (2016), “Influence of Internet Plus to International Busi-ness Development,” American Journal of Indus-trial and Business Management, 6(4), 541-549.
Yang, Byunghwa (2016), “A Link between Consumer Empathy and Brand Attachment on Branded Mobile Apps: The Moderating Effect of Ideal Self-Congruence,” Indian Journal of Science and Technology, 9(25), 1-9.
Yang, Li W. and Kung H. Shao (2016), Soclal Big Data: Lisiing and Analytics. Taipei: Future Ca-reer Management Corporation.
Yik, Michelle, James A. Russell, and James H. Stei-ger (2011), “12-Point Circumplex Structure of Core Affect,” Emotion, 11(4), 705-731.
Yin, Dezhi (2012), “The Good, the Bad and the Con-tent: Beyond Negativity Bias in Online Word-of- Mouth,” doctoral dissertation, College of Man-agement, Georgia Institute of Technology.
----, Samuel D. Bond, and Han Zhang (2014), “Anx-ious or Angry? Effects of Discrete Emotions on the Perceived Helpfulness of Online Reviews,” MIS Quarterly, 38(2), 539-560.

Socialnomics and Mobile Social Media 161
Yoo, Chan Y., Kihan Kim, and Patricia A. Stout (2004), “Assessing the Effects of Animation in Online Banner Advertising: Hierarchy of Effects Model,” Journal of Interactive Advertising, 4(2), 49-60.
Yu, Jieun, Hangjung Zo, Mun K. Choi, and Andrew P. Ciganek (2013), “User Acceptance of Location- Based Social Networking Services: An Extended Perspective of Perceived Value,” Online Infor-mation Review, 37(5), 711-730.
Zaichkowsky, Judith L. (1994), “Research Notes: The Personal Involvement Inventory: Reduction, Re-vision, and Application to Advertising,” Journal of Advertising, 23(4), 59-70.


![Socialnomics - Downtown Boulder...Socialnomics is the value created and shared via social media and its efficient influence on outcomes [economic, political, relational, etc.]. Or,](https://img.dokumen.tips/doc/110x75/5ffb86af53b3800fd3637b7d/socialnomics-downtown-boulder-socialnomics-is-the-value-created-and-shared.jpg)


![Emily Socialnomics[1]](https://img.dokumen.tips/doc/110x75/554ed1d6b4c905de468b55f2/emily-socialnomics1.jpg)


