Embed Size (px)
Citation preview

TRANSPORT PROBLEMS 2008 PROBLEMY TRANSPORTU Tom 3 Zeszyt 2 Lucjan GUCMA Maritime University of Szczecin, Institute of Marine Traffic Engineering Waly Chrobrego str. 1-2, 70-500 Szczecin, Poland Corresponding author. E-mail: [email protected] YSTAD PORT MODERNISATION STUDY ON THE BASIS OF REAL TIME MANOEUVRING SIMULATION METHOD
Summary. The paper presents complex method of water areas optimisation with consideration of navigational safety. The real time simulation method was implemented in presented study. The results were used as design guidelines for Ystad port development.
OPRACOWANIE STUDIUM MODERNIZACJI PORTU YSTAD NA PODSTAWIE
SYMULACYJNYCH BADAŃ CZASU RZECZYWISTEGO
Streszczenie. W artykule przedstawiono kompleksową metodę projektowania i optymalizacji dróg wodnych z uwzględnieniem bezpieczeństwa nawigacji. Jako metodę badawczą zastosowano symulację czasu rzeczywistego. Rezultaty badań zostaną wdroŜone jako wytyczne do modernizacji portu Ystad w Szwecji.
1. INTRODUCTION
Marine Traffic Engineering (MTE) research team of Maritime University of Szczecin since the 70-ties is engaged in research works concerned with evaluation of navigation safety for port design and optimization of water areas. The researches described in this paper are focused on Ystad port modernisation which is one of the latest research studies of MTE team. The main aim of researches was concerned with [Computer simulation 2008]: 1. Determination of optimal parameters of:
− approach channels to reconstructed port of Ystad with respect to shape, width and depth, − inner and outer port breakwaters with respect to its shape with respect to waving in port, − turning places with respect to its shape and optimal depth, − two new berthing places in inner port in respect to its shape, length, depth, maximal energy of
ships contact, maximal speed of ships propeller and bowthruster streams on the bottom. 2. Determination of safety conditions of port operation in respect to:
− admissible meteorological conditions for given kind of ships and manoeuvres, − other navigational conditions and limitations such as presence of other ships on berths, use of
position fixing systems on approach, navigational markings, vessel traffic service. 3. Determination of manoeuvring procedures during berthing and unberthing for different kind of
ships and propulsion systems; 4. Determination of underkeel clearance by Monte Carlo method; 5. Determination of usage of main engine during entrance; 6. Determination of ferry distances to the most dangerous objects;

20 L. Gucma 7. Carrying out most typical emergency runs and describe necessary emergency action for the
captains.
Two characteristic Ro-Pax ship was chosen as typical for the development of Ystad port. M/f Wolin is a midi size ferry originally built as train ferry. The second ship m/f Piast is a newly designed ferry build for Unity Line by Stocznia Szczecinska Shipyard. Most important parameters of ferries are presented in the Table 1.
Tab. 1
Main parameters of Wolin and Piast as typical ferries operated on the Baltic Sea area Parameter PIAST WOLIN Operator (route) Unity Line
(Swinoujscie-Trellborg) Unity Line
Building year 1986 / 2002 rebuild expected 2009 Length - LOA 207 m 188.9 m Breadth 27 m 23.7 m Draft 6.3 m 5.9 m DWT 8000 t 5143 t Machinery total 21.600kW at 500rpm. total 13.200kW at 600 rpm. Propeller 2 variable pitch propellers turning
inside at 145 rpm 2 variable pitch propellers turning inside at 150 rpm
Speed approx. 21 kn. 18 kn. Rudder 2x70 deg. active 2x70 deg. active Bowthrusters 2x2.300kW 2x1100 kW Sternthruster 1x1.200kW 1x736 kW Lateral wind area approx. 3000m2 approx. 2700m2
Fig. 1. General arrangement of m/f Piast Rys. 1. Plan promu Piast
Fig. 2. Wolin ferry Rys. 2. Prom Wolin

Ystad port modernisation study… 21 2. MODERNISATION OF YSTAD PORT
The most important aim of Ystad port modernisation is to provide access to the port by ferries up to 210m length and enable future port development in the future to serve ships of 240m length [Computer simulation 2008]. Three most important changes are planned (Fig. 3): 1. building two instead of three ferry quays in inner port, 2. design of new turning place in outside port, 3. shortening of inner western breakwater, 4. lengthening of outer breakwater to provide shelter in western winds of turning place.
400m
B4
B3B1
Line of previous berths
Additionalbreakwater
Breakwaterto shorten
Fig. 3. Proposed changes in berths, turning place and breakwaters arrangements in Port of Ystad Rys. 3. Proponowane zmiany w układzie nabrzeŜy, obrotnicy i falochronów w Porcie Ystad 3. METHODS APPLIED
The real time simulation interactive method with captains and pilots engaged in ships manoeuvring trials was applied. This method is assumed as most reliable and suitable in this kind of research studies [Gucma 2005]. MTE research team possess several kinds of manoeuvring simulators: form limited task with 2D display to modern full mission simulator with 3D and real control systems.
3.1. Real time simulation method – limited task simulator
Two classes of hydrodynamic models in MTE team own limited tasks simulators are utilized. First class of models are used when only limited parameters are known (usually when non existing ships or general class of ships are modelled) the second class models are used when detailed and exact characteristics of hulls, propellers and steering devices are known. Additionally real manoeuvring

22 L. Gucma characteristics are used for validation of models. In present researches the second model was used (m/f Wolin exists and sea trials are available Piast trial parameters was extrapolated).
The model used in researches is based on modular methodology where all influences like hull hydrodynamic forces, propeller drag and steering equipment forces and given external influences are modelled as separate forces and at the end summed as perpendicular, parallel and rotational ones.
The model is operating in the loop where the input variables are calculated instantly (settings and disturbances) as the forces and moments acting on the hull and momentary accelerations are evaluated and speeds of movement surge, sway and yaw. The most important forces acting on the model are:
1. thrust of propellers, 2. side force of propellers, 3. sway and resistant force of propellers, 4. bow and stern thrusters forces, 5. current, 6. wind, 7. ice effects, 8. moment and force of bank effect, 9. shallow water forces, 10. mooring and anchor forces, 11. reaction of the fenders and friction between fender and ships hull, 12. tugs forces, 13. other depending of special characteristics of power and steering ships equipment.
The functional idea of the ship manoeuvring simulation model is presented in Fig. 4.
Fig. 4. The main diagram of simulation model Rys. 4. Schemat funkcjonalny modelu symulacyjnego

Ystad port modernisation study… 23
Interface of model is typical 2D chart interface (Fig.5). The interface covers information of ships state (position, course speed, yaw etc), quay and shore line location, navigational markings, soundings, external conditions, tug and line control and control elements of the model. The model is implemented in Object Pascal with use of Delphi™ environment and Visual C™ with use of C++ language.
Fig. 5. Interface of simulation model ferry Wolin turning at outer turning place of Ystad Port (limited task simulator) Rys. 5. Interfejs komputerowy modelu symulacyjnego. Prom Wolin obraca się na zewnętrznej obrotnicy w Porcie Ystad Limiting to the usual 3DOFs (the horizontal planar motion), the ship movement over the ground (thus the so-called dynamic effect of the water current is introduced) is given by [Artyszuk 2005]:
( ) ( ) ( )
( ) ( ) ( )
( ) ( )( )
+−−−−=ω
+
+ω−+ω+−=+
+ω−+ω+=+
zcy
gy
cx
gx
zz
yzcxz
gx
gy
xzcymz
gym
gx
Mvvvvmmdt
dmJ
Fvmmvmmdt
dvmm
Fvmcmvmcmdt
dvmm
)(
112266
22111122
22112211
(1)
z
gEW
gNS dt
dv
dt
dyv
dt
dxω=ψ== ,, 00
(2)
⋅
ψψψ−ψ
=
gy
gx
gEW
gNS
v
v
v
v
cossin
sincos
(3) where: vx
g, vyg, ωz – ship surge, sway and yaw velocity over the ground, x0, y0, ψ – position Cartesian
coordinates and heading, m – ship mass, m11, m22, m66 – added masses, cm – empirical factor, Fx, Fy, Mz – external excitations (resultant/total surge, sway force and yaw moment), generally consisting of the
24 L. Gucma following items (denoted by additional subscripts) and being generally the functions of ship speed through the water ('vw'):
( )( )( )
===
zwy
wxzz
zwy
wxyy
zwy
wxxx
vvMM
vvFF
vvFF
ωωω
,,
,,
,,
(4)
cy
gy
wy
cx
gx
wx vvvvvv −=−= ,
(5)
γγ
⋅
ψψ−ψψ
=
cc
cc
cy
cx
v
v
v
v
sin
cos
cossin
sincosr
r
(6)
where: c
v and γc represent the velocity and geographical direction of the water current (a uniform
current by default). 3.2. Real time simulation method – full mission simulator
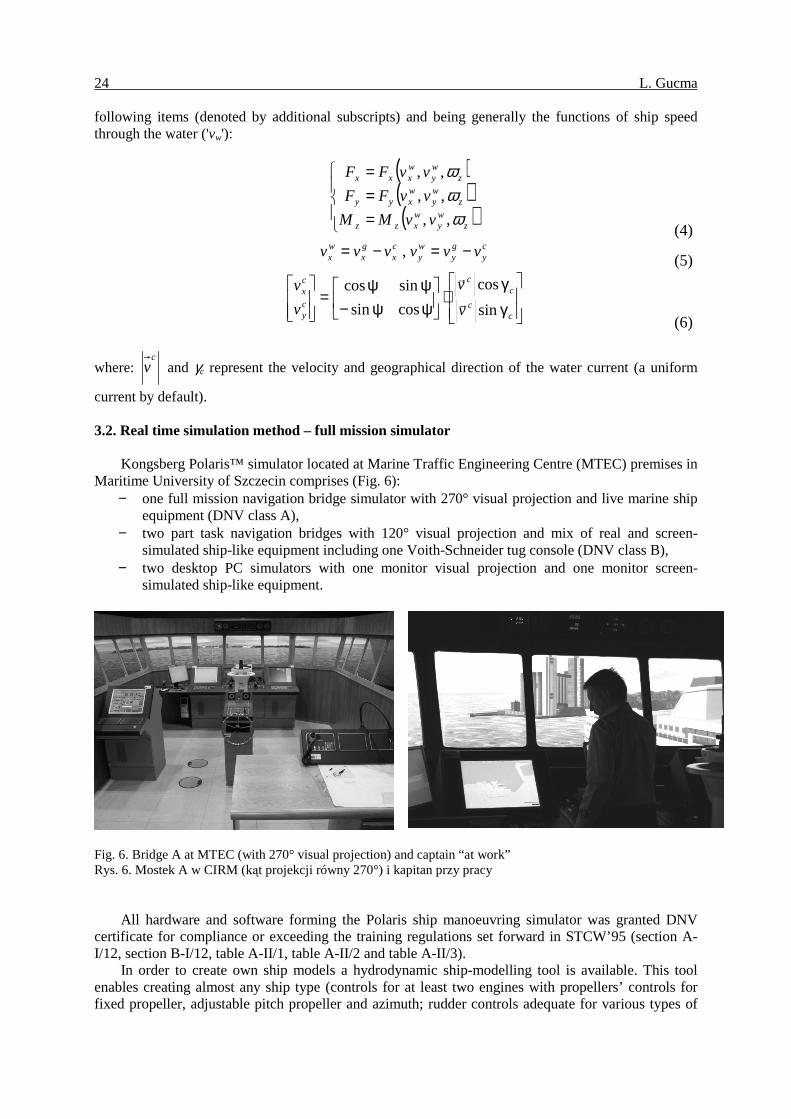
Kongsberg Polaris™ simulator located at Marine Traffic Engineering Centre (MTEC) premises in Maritime University of Szczecin comprises (Fig. 6):
− one full mission navigation bridge simulator with 270° visual projection and live marine ship equipment (DNV class A),
− two part task navigation bridges with 120° visual projection and mix of real and screen-simulated ship-like equipment including one Voith-Schneider tug console (DNV class B),
− two desktop PC simulators with one monitor visual projection and one monitor screen-simulated ship-like equipment.
Fig. 6. Bridge A at MTEC (with 270° visual projection) and captain “at work” Rys. 6. Mostek A w CIRM (kąt projekcji równy 270°) i kapitan przy pracy
All hardware and software forming the Polaris ship manoeuvring simulator was granted DNV certificate for compliance or exceeding the training regulations set forward in STCW’95 (section A-I/12, section B-I/12, table A-II/1, table A-II/2 and table A-II/3).
In order to create own ship models a hydrodynamic ship-modelling tool is available. This tool enables creating almost any ship type (controls for at least two engines with propellers’ controls for fixed propeller, adjustable pitch propeller and azimuth; rudder controls adequate for various types of

Ystad port modernisation study… 25 conventional rudders, active rudders, Z-drive/azimuth and thrusters) with very high fidelity hydrodynamics in 6 DOF (surge, sway, heave, yaw, roll, pitch). The hydrodynamics comprise all known to state of the art external effects like squat, bank and channel effects. 4. STATISTICAL METHODS OF DATA PROCESSING
Simulators are very widely used today. The hydrodynamic models are becoming more and more reliable. Without efficient statistical data processing it is not possible however to draw conclusions from the conducted experiments. Usually different kind of data processing analysis is applied in case when horizontal and vertical ships movement is considered. 4.1. Safe manoeuvring areas
The most important factor is safety horizontal area needed for navigators for performing manoeuvres [Gucma 2005, Irribaren 1999]. The assumption of such model is that the ship moves along predefined route x (Figure 7.a) with following probability of accident:
∫+∞
=≥=MAXy
ASAMAXASAAW dyyfPyYPPP )()( //
where: PSA/A–conditional probability of serious accident, f(y)–the distribution of ships position, yMAX–distance from to the centre of the waterway (route) to the waterway border.
Probability of serious accident PSA/A could be defined by the Heinrich ratio or more detailed consequence analysis. One of the most important stages of accident probability evaluation is statistical analysis of the results. The probabilistic concept of safety manoeuvring area is presented in Figure 7.a. The distributions are strongly dependant of waterway area arrangement and could be evaluated in simulations and validated in real experimentations.
a) b)
Fig. 7. Probabilistic concept of safe manoeuvring area determination on the waterway (a) and underkeel clearance of ships determination (b) Rys. 7. Probabilistyczna koncepcje określania bezpiecznego poziomego (a) i pionowego (b) obszaru manewrowego

26 L. Gucma 4.2. Model of underkeel clearance
The stochastic model of under keel clearance evaluation was presented in [Gucma and Schoeneich 2007]. It is based on Monte Carlo methodology where overall ships underkeel clearance is described by following mathematical model (Fig.7.b):
NSwiSwaTiHoi THUKC δδδδ ++∆++−+= ∑∑∑ )()()( 0
where: δHoi–the uncertainties concerned with depth and its determination, δTi–the uncertainties concerned with draught and its determination, δSwi–the uncertainties concerned with water level and its determination, δN –navigational and manoeuvring clearance.
The most important factor is squat. The special model of squat was used in the model of UKC. It was validated by means of real experiments with use of RTK system mounted in ferries [Gucma et al 2006]. 4.3. Propeller stream on the bottom
The model used for determination of propeller stream on the bottom was presented in [Gucma and Jankowski 2001]. The model assumes stream deflection according to the rudder’s position and presence of fixed structures (Fig. 8). The influence of propellers is calculated on the base of recorded simulation trails. Additionally the streams from side thrusters were calculated.
M ar i ne
e ng ine er i ng
s t ru ct u re s
Fig. 8. The distribution of the bottom’s streams when main propeller working ahead Rys. 8. Rozkład prędkości strumienia zaśrubowych przy dnie 4.4. Ships berthing energy
Ships berthing energy is calculated by Vasco Costa method [Vasco Costa 1969] which enables to consider of yaw movement of ship during first contact, ships movement during contact with fender and ships reflection speed.

Ystad port modernisation study… 27 5. RESEARCH PLAN
In researches maximum wind speed assumed as 20m/s (9°B). Experience from m/f Wolin ferry operated in Swinoujscie and Trelleborg showed that it could be maximum allowable side wind speed, that ferry can operate safely (i.e. enter and leave the port).
In researches two worst wind and current conditions were taken into consideration for entering the port: Easterly wind of 20m/s, and westerly wind with 20m/s.
Total number of series was as follows: Wolin ferry: 12 series and Piast ferry: 6 series (6 on limited task and 6 on full mission). Minimum 15 runs were performed in each series (it gives a total of 270 on limited task simulator and 90 runs on full mission). Turning was performed in inside the port (2 series only) and new turning place (rest of series). All manoeuvres were performed without tugs assistance. Each captain was engaged in 2-3 runs of given series. In researches 8 captains performed the simulations. 6. RESULTS OF RESEARCHES
Analysis of simulation results was made in basis of following criterions: − traffic lane widths (horizontal safe manoeuvring area), − under keel clearance (Monte Carlo method), − energy induced in contact point with berth structures, − velocities of propeller bottom stream, − engine and rudder settings, − probabilities of collision with given points, − time of manoeuvre, − emergency manoeuvres.
The safe manoeuvring areas on 95% level of confidence are widely used in analysis. The results
from one series with eastern wind of 20 m/s are presented in Fig. 9. Additionally maximum area as the area of all ferry passages in given simulation series is presented.
Fig. 9. Manoeuvring areas of Piast ferry during entrance with east 20m/s wind to berth no 3 on 95% confidence level (mean and maximal area are presented) Rys. 9. Obszary manewrowe na poziomie ufności 95% promu Piast przy wejściu do portu, wiatr 20m/s nabrzeŜe numer 3 (zaznaczono równieŜ średnie i maksymalne obszary)

28 L. Gucma
The most important places are marked as red shaded circles (number 1 and 2 in Fig.9). Those are western inner breakwater (1) and inner corner of cargo quay (2). The researches conclusion is to shorten the western breakwater of 90m minimum and to cut the corner of cargo quay at least of 15 meters. These results are used also for design of turning place.
The energies during berthing could be used for design of fender system. The histogram of berthing energies in 3 different series is presented in Fig. 10.a. Maximal energies are not exceeding 400kNm and mean are around 100kNm. The typical distribution used here is gamma distribution. The points of first impact of ferries (Fig. 10.b) could be used for guidelines of fender positioning.
a) b) Fig. 10. Histogram of induced energies (a) and distribution of contact points during mooring of m/f Wolin ferry to berth no.1 and 3. Rys. 10. Histogram energii pierwszego kontaktu (a) i rozkład punktów zderzeń z nabrzeŜem promu Wolin przy nabrzeŜu 1 i 3.
The maximum propeller streams locations are important as the guidelines for bottom protection (Fig. 11). The stream speed calculated on the bottom by presented model is not exceeding 6m/s in given trial.
16800 16900 17000 17100 17200 17300 17400 17500 17600
43700
43800
43900
44000
44100
0
0.5
1
1.5
2
2.5
3
3.5
4
4.5
5
5.5
6
6.5
7
7.5

Ystad port modernisation study… 29 Fig. 11. Propeller streams of m/f Wolin during entrance to no. 3 berth. Wind S20m/s Rys. 11. Strumienie zaśrubowe przy dnie promu Wolin przy podejściu do nabrzeŜa nr.3
The Monte Carlo method of UKC calculation is widely used today. The results in function of distance to outer breakwater entrance are presented in Fig. 12.b. The histogram of simulated UKC in the entrance calculated by means of presented method is presented in Fig 12.a. The confidence intervals could be used for uncertainty determination in risk analysis of hitting the bottom.
a)
2wej1W20_2
0
0.2
0.4
0.6
0.8
1
1.2
1.4
1.6
1.8
2
2.2
-150 -100 -50 0 50 100 150 200 250 300 350
UKC_95%
squat
breakwater [m]
[m]
b) Fig. 12. Histogram UKC and squat value at 130m behind heads (sea wave =0m). UKC of ferry in meters on approach with West 20m/s wind (x=0 at outer breakwater)

30 L. Gucma Rys. 12. Przykładowy histogram symulowanych zapasów pod stępką 130m przed główkami (wys. fali =0m) oraz Zapas wody pod stępka na poziomie 95% w funkcji odległości do główek przy wietrze zachodnim 20m/s (główki zewnętrzne przyjęto jako x=0) 7. CONCLUSIONS
Presented complex study could be used for guidelines for port modernisation, operational limitations and for risk assessment of selected water areas.
Conclusions related to conditions of safe manoeuvring ferry m/f Wolin and Piast in Ystad port might be stated as follows: 1. Entrance to port of Ystad is safe up to following extreme conditions:
a. wind from sector NE-SE, wind speed up to 18m/s, current 270°/0.3 kn, b. wind from sector NW-SW, wind speed up to 18m/s, current 90°/0.4 kn, c. other sectors and current combinations wind speed up to 20 m/s.
2. Turning of ferry in avanport at designed turning area might be performed as well as port and starboard side depending on wind direction and is safe to wind speed up to 20m/s regardless of its direction.
3. Entering to inner port (aft or bow first) depending on manoeuvre is safe under condition: a. shortening of western head of wavebreaker of minimum 90 m, b. shortening of corner of cargo quay of 15m, c. wind speed up to 20 m/s.
4. Mooring of ferry to new layout of berths 1, 3 and 4 (Wolin only) is safe under conditions: a. berths equipping in fender of admissible energy E = 400 kNm, b. wind speed up to 20m/s.
5. Unmooring and leaving of examined ferries from Ystad port is safe with wind speed up to 22m/s. 6. Turning in inside turning place is possible with southern wind up to force 20m/s. Bibliography 1. Artyszuk J.: Towards a Scaled Manoeuvring Mathematical Model for a Ship of Arbitrary Size.
Scientific Bulletin, Maritime University of Szczecin, 2005. 2. Computer simulation (2008) for port design and safe manoeuvring of ships. Stage I and II. Report.
Maritime University of Szczecin. 3. Gucma L.: Risk Modelling of Ship Collisions Factors with Fixed Port and Offshore Structures.
Maritime University of Szczecin, 2005. 4. Gucma L., Jankowski S.: Method of determining probabilistic models of propeller streams speed
at the bottom of manoeuvring ships. Proceedings of the IX International Scientific and Technical Conference on Marine Traffic Engineering, Szczecin, 2001.
5. Gucma L., Schoeneich M.: Probabilistic model of underkeel clearance in decision making process of port captain. Proc of Trans-Nav Conference Gdynia, 2007.
6. Gucma L., Gucma M., Tomczak A., Przywarty M.: Experimental determination of squat and trim of sea ferry Jan Śniedecki on approach to Swinoujscie port by means of RTK method (in polish) Proc. of XV Nav-Sup Conference. Gdynia, 2006.
7. Iribarren J.R.: Determining the horizontal dimensions of ship manoeuvring areas. PIANC Bulletin No 100, Bruxelles, 1999.
8. Vasco Costa F.: Berthing manoeuvres of large ships. The Dock and Harbour Authority. March 1969.
Received 28.04.2008; accepted in revised form 11.06.2008