Embed Size (px)
Citation preview

German-Iranian Research Project Young CitiesDeveloping Energy-Efficient Urban Fabric in the Tehran-Karaj Region
www.youngcities.org Water Demand ManagementWater End Use Measurements and Water Consumption Patterns in Tehran HouseholdsTamara Nuñez von Voigt, Shahrooz Mohajeri
Young Cities Research Briefs | 09
The volume before you results from the federal funded research project “Young Cities – Developing Urban Energy Efficiency”. It has been written by
inter 3 Institut für RessourcenmanagementOtto-Suhr-Allee 5910585 Berlin | Germany
www.inter3.de

1 Introduction . . . . . . . . . . . . . . . . 3
2 Water Demand Management . . . . . . . . . . . . 4
3 Water End Use Measurements . . . . . . . . . . . 6
4 Domestic Water Consumption . . . . . . . . . . . 9
5 Conclusion . . . . . . . . . . . . . . . . . 16
6 References . . . . . . . . . . . . . . . . . 17
Table of Contents
PublisherUniversitätsverlag der TU BerlinUniversitätsbibliothek Fasanenstr. 88 10623 Berlin | Germany
www.univerlag.tu-berlin.de
Imprint
All texts are based on scientific research performed within the Young Cities Project. All pictures, tables and graphics are courtesy of the respective article’s authors, unless otherwise mentioned.
© 2013 All rights reserved by the Technische Universität Berlin.
ISSN 2196-517X (Print)ISSN 2196-6583 (Online)ISBN 978-3-7983-2563-0 (Print)ISBN 978-3-7983-2564-7 (Online)
Simultaneously published online on the Digital Repository of the Technische Universität BerlinURL http://opus.kobv.de/tuberlin/volltexte/2013/4021/URN urn:nbn:de:kobv:83-opus-40218[http://nbn-resolving.de/urn:nbn:de:kobv:83-opus-40218]
Design/Typesetting büro-d | Communication Design Berlin

3
1 Introduction
Degradation and pollution of water resources and the consequent environ-mental destruction has been denounced for many years. At the 1992 summit in Rio de Janeiro, Agenda 21 was formulated and ratified by over 170 govern-ments. Agenda 21 is a global action plan with the goal to ensure the sustain-able use of natural resources for the 21st century. It applies especially to the quantitative as well as qualitative assurance of clean, potable drinking water.
Agenda 21 and its guidelines are dedicated to the integrative manage-ment of water, resource vital to life, and mark a break with the belief in a parallel expansion of economic development and exploitation of natural re-sources. The task of sustainable water management is to decouple economic growth from water consumption without impairing the basic provision of drinking water or the comfort demands of citizens.
The project “Young Cities — Developing Energy Efficient Urban Fabric in the Tehran-Karaj region” under the direction of the Technische Universität Berlin is part of the BMBF funded program: “Research for Sustainable Development of the Megacities of Tomorrow”. In the project exemplary solu-tions for the growing region Tehran-Karaj in Iran have been developed.
The inter 3 — Institute for Resource Management heads the dimension of action: “Water & Wastewater Management” and was in charge of the devel-opment of integrated and sustainable approaches for water supply and sani-tation in the region.
This document summarizes the results of the work package “Water Demand Management: Consumption Patterns and Efficiency of Water Saving Measures”.
The research was focused on possible ways of reducing domestic water consumption without cutbacks in quality of life. By reducing the amount of consumed drinking water and produced waste water, energy consumption is reduced as well.
The challenge was that water consumption behavior in Iranian house-hold was unknown. The project team has therefore decided to carry out wa-ter consumption measurements in some test households. This required the development of a non-intrusive measurement method which will meet the strong demand of Iranians to privacy.

Water Demand Management4
2 Water Demand Management
Initial site visits and meetings indicated considerable deficits in terms of planning, technical management and service execution within the structure of the local water supply and sewage disposal service providers. These in-stitutional problems combined with growing water scarcity in the region, which is exacerbated by climate change, are already limiting the develop-ment of residential areas and hindering industrial as well as commercial growth significantly. At the same time, existing water resources in the re-gion are seriously jeopardized due to above-average water consumption.
In order to promote regional development, particular consideration should be taken for the protection of water resources and the reduction of wa-ter consumption. Therefore, a political paradigm shift is needed — away from supply-driven water management and towards sustainable demand-oriented strategies [4].
First, it is necessary to clarify some terminology in order to avoid any misunderstandings in the following:.. Water supply refers to the total available amount of water, which can
be extracted for water supply... Water demand is the total amount of water, which has been extracted
or pumped by the water utilities. This amount is divided into water con-sumption and unaccounted-for water.
.. Water consumption is the amount of water that reach the consumer or end-user and could be measured (= sold water).
.. Unaccounted-for Water (UfW) is all water put into service, but not paid for by the consumers. UfW includes process and distribution losses, illegal connections, measurement or human errors, leakages etc.
In this sense supply-driven water management means if water demand in-creases, more resources will be made available.
Demand Management refers to all measures for controlling the amount and quality of consumed water. There are two main, crucial issues which de-mand management must solve: promoting a prudent water usage of each con-sumer group and reducing UfW. Both the water consumption and the UfW rate is a major problem in Tehran.
For example, the per-capita average water consumption in Tehran is about 250 l/p/d. In contrast, in Germany the per-capita average water con-

5
sumption is less than 130 l/p/d. The UfW-rate of Tehran is more than five times the UfW-rate of Berlin (see Table 1). Management strategies to reduce UfW-rate were developed in another work package. This document refers only to water consumption management.
Year Populationconnected to water supply
Pumped water [m³]
Sold water [m³]
Per-capita water cons.
[l/p/d]
UfW rate [ %]
2012 8,245,216 1,038,332,113 743,120,455 247 28.4
2011 8,143,863 1,064,474,337 753,568,783 254 29.2
2010 8,073,284 1,054,132,000 759,819,935 258 27.9
2009 8,002,832 1,034,986,176 770,902,216 264 25.5
Tab. 1: Tehran Statistics (Tehran Water & Wastewater Company, 2013)
2.1 Water Consumption ManagementThe goal of water consumption management is to reduce water consumption without a loss of comfort and hygiene.
Water consumption management is based on technical, economic and social measures. Technical measures for households include for example the use of modern, water efficient, sanitation equipment. Socio-economic mea-sures are footed on strategic tariff structures for drinking water and aware-ness rising and improved control on household water consumption for ex-ample by installation of water meters in each residential unit. Pure social measures are the development and implementation of environmental edu-cation and awareness-raising campaigns in public and among (future) res-idents.
In order to develop a catalogue of adequate measures, the characteris-tics of domestic water consumption patterns in the region and domestic wa-ter saving potentials have to be known.

Water Demand Management6
3 Water End Use Measurements
The apparent lack of detailed information on domestic water consumption patterns in Tehran-Karaj region made it necessary to conduct water end use measurements. Water end use measurements mean to monitor the specific use of the different appliances in a household like shower, washing machine or taps in bath and at kitchen sinks.
There are different methods for end-use measurement. The range is from manual measurement and reporting including house inspections, log books and questionnaires to more sophisticated, technological approaches involving smart meters and data loggers [1].
Previous tests of the Tehran Province water company have shown that visible installations of simple water meters at all appliances was hardly ac-cepted by the residents and beyond that have an influence on the consum-er’s behavior. Furthermore in Iranian culture people place great emphasis on privacy at home. Therefore method had to be chosen which permits to monitor water use without installations in the dwelling.
For these reason it was decided to develop a measurement concept ac-cording the method of Flow Trace Analysis (FTA). The FTA method consists of a single data logger attached to the residential water meter. The data log-ger yields continuously the flow trace which could be disaggregated into the distinct end uses. The idea is based on the fact that there is a consistency in
40
35
30
25
20
15
10
5
0L/min
19:12:00 19:26:24 19:40:48 19:55:12 20:09:36 20:24:00
Washing machine
Kitchen sink
Toilet flush
Shower Dish washer
Fig. 1: Flow trace patterns of the different water end uses (inter 3)

7
the flow patterns (flow rate, time etc.) of most residential water uses (show-er, toilet flush etc.) (see Figure 1) [2].
The FTA method was first noted 1993 by Dr. Benedykt Dziegielewski and was tested one year later in a study in Colorado and refined in subsequent studies by DeOreo and Mayer [2]. In the following years there were some big studies in USA, Australia and New Zealand. In 2009 a small pilot study in Jordan was conducted but besides this the method has not been tested in other countries similar to Iran.
3.1 Measurement and Data Transfer ConceptA FTA measurement concept adapted to the test conditions has been devel-oped including the selection of a suitable water meter with a pulse value of 0.1 liter and the construction of a special data logger.
The data logger is equipped with a GSM module in order to have access to the data online and to monitor the experimental procedure from Germany. Data packages were sent directly via FTP to our web server and stored there (see Figure 2).
The measurement and data transfer equipment were tested together with our Iranian partners.
Fig 2: Experimental setup (inter 3, pictograms from http://www.sclera.be )
Data Capture and Transfer
inter3
Data Logger

Water Demand Management8
3.2 Implementation and first measurementsTo test the method and get a first impression of water consumption pattern in Tehran a small measurement series was organized.
As a suitable test area a residential complex in the north-west of Tehran was identified. Smaller apartment buildings with five residential units are present in the settlements as well as high-rise buildings. It is a typical and representative residential complex, which corresponds to Iranian mid-dle-class standard.
For the first measurements an apartment building with five residential units was chosen. Particular advantage of the building is that the water me-ter for each residential unit is located outside of the house and that the water meters are directly next to each other so that all meters could be connected to one data logger (Figure 3).
The new water meters were installed in place of the old residential wa-ter meter and connected to the data logger. The data logger was stored in a safe. Each sample household was visited once for calibration. The water use of three sample households was monitored for five weeks from July till September 2011.
Consumption data were captured by the data logger and sent to the web server. A concept for data analysis was developed and data was analyzed.
Up to 80 % of the total amount of the household water consumption was identified and could be disaggregated in the different end uses.
Our first impression of domestic water consumption in Tehran will be described in the following chapter.
Fig. 3: Test building for first measurements (inter 3)
Fig. 4: Measuring equipment (inter 3)
9
4 Domestic Water Consumption
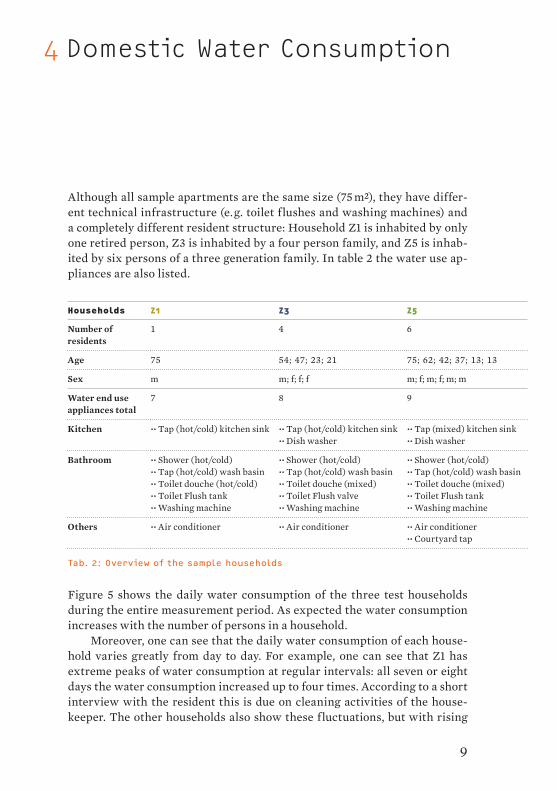
Although all sample apartments are the same size (75 m²), they have differ-ent technical infrastructure (e. g. toilet flushes and washing machines) and a completely different resident structure: Household Z1 is inhabited by only one retired person, Z3 is inhabited by a four person family, and Z5 is inhab-ited by six persons of a three generation family. In table 2 the water use ap-pliances are also listed.
Households Z1 Z3 Z5
Number of residents
1 4 6
Age 75 54; 47; 23; 21 75; 62; 42; 37; 13; 13
Sex m m; f; f; f m; f; m; f; m; m
Water end use appliances total
7 8 9
Kitchen .. Tap (hot/cold) kitchen sink .. Tap (hot/cold) kitchen sink.. Dish washer
.. Tap (mixed) kitchen sink
.. Dish washer
Bathroom .. Shower (hot/cold).. Tap (hot/cold) wash basin .. Toilet douche (hot/cold).. Toilet Flush tank.. Washing machine
.. Shower (hot/cold)
.. Tap (hot/cold) wash basin
.. Toilet douche (mixed)
.. Toilet Flush valve
.. Washing machine
.. Shower (hot/cold)
.. Tap (hot/cold) wash basin
.. Toilet douche (mixed)
.. Toilet Flush tank
.. Washing machine
Others .. Air conditioner .. Air conditioner .. Air conditioner.. Courtyard tap
Tab. 2: Overview of the sample households
Figure 5 shows the daily water consumption of the three test households during the entire measurement period. As expected the water consumption increases with the number of persons in a household.
Moreover, one can see that the daily water consumption of each house-hold varies greatly from day to day. For example, one can see that Z1 has extreme peaks of water consumption at regular intervals: all seven or eight days the water consumption increased up to four times. According to a short interview with the resident this is due on cleaning activities of the house-keeper. The other households also show these fluctuations, but with rising

Water Demand Management10
Fig. 5: Daily water consumption of the three households (inter 3)
Tab. 3: General overview of the water consumption of the test households (inter 3)
30.07.2011
31.07.2011
01.08.2011
02.08.2011
03.08.2011
04.08.2011
05.08.2011
06.08.2011
07.08.2011
08.08.2011
09.08.2011
10.08.2011
11.08.2011
12.08.2011
13.08.2011
14.08.2011
15.08.2011
16.08.2011
17.08.2011
18.08.2011
19.08.2011
20.08.2011
21.08.2011
22.08.2011
23.08.2011
24.08.2011
25.08.2011
26.08.2011
27.08.2011
28.08.2011
29.08.2011
30.08.2011
31.08.2011
01.09.2011
02.09.2011
03.09.2011
2,250
2,000
1,750
1,500
1,250
1,000
750
500
0L/Da
y
Z1 Z3 Z5
Households Z1 Z3 Z5
Total consumption of the household during the whole measurement period [m³]
11.4 19.7 33.9
Average daily consumption per household [l/d] 316 547 942
Minimum daily consumption [l/d] 84 174 477
Highest daily consumption [l/d] 1,093 1,154 2,066
Per-capita average daily consumption [l/p/d] 316 137 157
Water consumed by air conditioner during the whole measurement period [m³]
6.2 1.9 7.5
Per-capita average daily consumption [l/p/d] (without air conditioner)
143 124 122
number of residents these fluctuations become less extreme. The per capi-ta average daily consumption differs a lot and is between 137 and 316 liters/day/person. But if the consumption of air conditioner is removed we see that the per-capita consumption of all households is under 150 liters/day/person. This is significantly lower than the average value of 250 liters/day/person given by the Iranian partner (see Chapter 2).
Figure 6 shows the water consumption of the three households disag-gregated as far as possible into the different water end uses. Despite the incomplete disaggregation, the water use of these households made some trends clear which will be discussed in the following.
4.1 Air ConditionerOne of the biggest water consumers in the households are the air condition-er. The most common air conditioner in Iran is the evaporative cooler (see Figure 7). In Iran, there are about 10 million evaporative cooler in use [5].

11
Fig. 6: Disaggregated water consumption of the test households (inter 3)
35
30
25
20
15
10
5
0m3
Z1 Z3 Z5
Dish washer
Not identified (mainly wc, douche & taps)
Toilet flush & doucheWashing machineTaps (kitchen & bath)ShowerAir conditioner
Fig. 7: Evaporative cooler (inter 3) Fig. 8: Test households with evaporative coolers (inter 3)

Water Demand Management12
30.07.2011
31.07.2011
01.08.2011
02.08.2011
03.08.2011
04.08.2011
05.08.2011
06.08.2011
07.08.2011
08.08.2011
09.08.2011
10.08.2011
11.08.2011
12.08.2011
13.08.2011
14.08.2011
15.08.2011
16.08.2011
17.08.2011
18.08.2011
19.08.2011
20.08.2011
21.08.2011
22.08.2011
23.08.2011
24.08.2011
25.08.2011
26.08.2011
27.08.2011
28.08.2011
29.08.2011
30.08.2011
31.08.2011
01.09.2011
02.09.2011
03.09.2011
350
300
250
200
150
100
50
0L/Da
y45
40
35
30
25
20
15
10
5
0 Tempe
ratu
re in
°C
Z1: AC water consumptionZ3: AC water consumptionZ5: AC water consumption
MAX temperature TehranMIN temperature Tehran
Fig. 9: Daily water consumption of the air conditioners in the households and MIN/MAX temperature of Tehran [3] (inter 3)
All three households are equipped with an evaporative cooler, more or less the same type and between 5–10 years old (see Figure 8).
An evaporative cooler cools air through the evaporation of water: hot, dry air is sucked from the outside and cold, humid air is discharged into the interior. Its water consumption does not depend on number of residents but mainly on cooling demand, on outside temperature and humidity of air.
Although all three apartments have the same size the water consumption of air conditioners from each household differs a lot (see Table 3 and Figure 9).
The air conditioner alone consumes up to 300 l/d when working around the clock on a hot day. This water evaporates — it is not discharged in the sewage system and, therefore, cannot be reused. Replacing these popular de-vices with more water efficient air conditioners, would create huge water savings. Merely, turning off the air conditioner when leaving the apartment as practiced in household Z3 could save more than two-thirds of this water consumption (see Table 3) and naturally a lot of energy.

13
Fig. 10: Water consumption patterns of test households (inter 3)
4.2 Water Consumption PatternsSince the use of air conditioning is only seasonal, the water consumption of the evaporative cooler was withdrawn for further considerations.
Figure 10 shows the water consumption patterns of the test households without air conditioner.
The disaggregation of the total water consumption in different end us-es is based on slightly modified assumptions for each household regarding “taps” and “not identified” which will be pointed out in the following.
The water consumption pattern of Z1 shows that 16 % of the water con-sumptions are used for shower, 11 % for the washing machine and 7 % for toi-let flush & douche. In the category “taps” only short events less than or equal 10 seconds are considered.
The biggest part of Z1 water consumption, about 61 %, could not be iden-tified. For Z1 the category “Not identified” includes in addition to toilet douche especially major events with significantly higher duration.
Z1
62%
Z3
Z5
16%
11%
4%
7%
41%39%
1%
5%10%4%
27%
18%
3%
3%
25%
24%
Dish washerNot identified (mainly toilet douche & taps)
Toilet flush & doucheWashing machineTaps (kitchen & bath)Shower

Water Demand Management14
These major events correspond in general to cleaning activities of the house keeper, e. g. to wash dishes under running water or cleaning of bath-room or kitchen.
The water consumption pattern of Z3 shows that more than 75 % of wa-ter consumption comes from shower, toilet and taps.
The category “taps” account for all events with low flow rate but differ-ent duration. The category “not identified” includes all events which do not fit in the other categories, like water use events at taps with higher flow rate, short shower events or toilet douche.
In Z5 the biggest proportion of water use is with 39 % due to showers. The category “taps” counts only short water use events with a duration of less than or equal like 10 seconds.
In the apartment Z5, the category “not identified” includes toilet flush, toilet douche and taps due to missing example events for statistical evalua-tion of these uses.
4.3 ShowerThe shower shows a significant proportion of the total water consumption of all households. The proportions for showering are 16 %, 25 % and 39 % of water consumption.
In Z5, the per-capita consumption for showers is with 46.4 liter/person the highest. This shows that the differences in consumption are not due to the number of residents but due to different consumption behavior.
The different consumption behavior becomes visible when we have look on per-capita number of showers and the average time for a shower (Table 4). The residents of Z5 take a shower nearly twice as often and in average one minute longer than the residents of Z3.
Since flow rates are already low the biggest saving potential for showers lies in reducing shower times.
Showerhousehold
Per-capita consumption
[l/p/d]
Number of showers
per capita in 5 weeks
Average time for shower
[s]
Z1 22.5 16 426
Z3 30.6 11 679
Z5 46.4 19 726
Tab. 4: Shower comparisons (inter 3)

15
4.4 Toilet flushThe toilet flushes of Z1, Z3 and Z5 have different technologies. Z1 has a flush tank with push button, Z3 has a flush valve and Z5 has a flush tank with trac-tion device.
The flush tanks needs about 15 liter per flush, whereas Z3 with the flush valve use only about 5 liter per flush.
Fig. 12: Flush tank Z1, Flush valve Z3, Flush tank Z5 (inter 3)
Washing MachineThe percentage of water consumption from washing machines is between 3 and 11 %. The consumption per wash differs a lot. Z3 needs with 88–110 l per wash almost twice as much as Z1 (see Table 5). The large discrepancy of consumption per wash corresponds to the age of the machine: the machine of Z3 is about 30 years old, the one of Z1 only 10 years. But regarding total consumption the frequency of use makes a big difference, too. If the machine is not as frequently used, it can be assumed that the load is greater and there-fore, water is used more efficient.
Washing machinehousehold
Total frequency of use in
5 weeks
Total consumption of
washing machine[liter]
Percentage on total household
consumption (without AC) [ %]
Consumption per wash
[liter]
Z1 9 546 11 42-45
Z3 5 453 3 88-110
Z5 40 2,665 10 57-77
Tab. 5: Washing machines comparisons (inter 3)

Water Demand Management16
5 Conclusion
With the goal to improve the water management in Tehran-region, wa-ter consumption management was identified as one main pillar to achieve more efficient and sustainable water management. Detailed information on household water consumption is the base for the development of sound tech-nical, economic and social measures for water consumption management.
Limitations in available data on household water consumption and spe-cific difficulties of the local context could be overcome successfully by ap-plying the innovative monitoring method Flow Trace Analysis.
Three pilot households are presented in this report where the Flow Trace Analysis had been applied to distinguish different water end uses in the household. The Water end use measurements in the three sample house-holds proves the applicability of the monitoring method and gives us a first impression of water consumption patterns in Tehran and first ideas of water saving measures.
We have seen that the water consumption of the sample households dif-fers a lot. Per-capita average consumption was between 150 and 315 liters/person/day. Besides, one big water consumer in Tehran households is the water-cooled air conditioner. When working around the clock a hot and dry summer day, the air conditioners alone have consumed up to 300 liter/day.
Without considering the consumption of air conditioners the per-capita water consumption calculated as average of all three households was about 130 liters/person/day. In comparison with the average consumption of 250 liters/person/day (see Table 1), this value is very low and shows us that there must be households in Tehran which consumes significantly more. The sam-ple households were all middle-class. The biggest water consumers are sup-posed to be in the upper class of Tehran. For a sustainable water consump-tion management it is essential to investigate the differences between the consumption patterns.
Based on the realized pilot measurements the need for further mea-surements on a larger sample can be derived in order to create a sound data-base for the development of measures for water consumption management. Furthermore the need to refine the applied method to reduce the proportion of consumed water which cannot be classified to one distinct water use in the household is identified.

17
[1] Guirco/Carrard/McFallan/Nalbantoglu/Inmam/Thornton/White (2008): Residential end-use measurement Guidebook: a guide to study design, sampling, and technology. Prepared by the Institute for Sustainable Futures, UTS, and CSRIO for the Smart Water Fund, Victoria. (http://www.isf.uts.edu.au/publications/guircoetal/2008resenduse.pdf, Zugriff November 2010)
[2] Mayer/DeOreo/Towler/Martien/Lewis (2004): Tampa Water Department Residential Conservation Study.
[3] http://www.wetter.com/wetter_aktuell/rueckblick/?id=IR0TH0002, letzter Zugriff 15.02.2013
[4] Nuñez von Voigt/Mohajeri/Vocks (2013): Water Management, and Semi-Central Infrastructure for Efficient, and Sustainable Urban Water Cycles. In: Pahl-Weber/Seelig/Ohlenburg/Kuhla von Bergmann (Eds.): Urban Challenges, and Urban Design. Approaches for Resource-Efficient, and Climate-Sensitive Urban Design in the MENA Region.
[5] Statistical Center of Iran, 2012: http://www.amar.org.ir
6 References


1 Introduction . . . . . . . . . . . . . . . . 3
2 Water Demand Management . . . . . . . . . . . . 4
3 Water End Use Measurements . . . . . . . . . . . 6
4 Domestic Water Consumption . . . . . . . . . . . 9
5 Conclusion . . . . . . . . . . . . . . . . . 16
6 References . . . . . . . . . . . . . . . . . 17
Table of Contents
PublisherUniversitätsverlag der TU BerlinUniversitätsbibliothek Fasanenstr. 88 10623 Berlin | Germany
www.univerlag.tu-berlin.de
Imprint
All texts are based on scientific research performed within the Young Cities Project. All pictures, tables and graphics are courtesy of the respective article’s authors, unless otherwise mentioned.
© 2013 All rights reserved by the Technische Universität Berlin.
ISSN 2196-517X (Print)ISSN 2196-6583 (Online)ISBN 978-3-7983-2563-0 (Print)ISBN 978-3-7983-2564-7 (Online)
Simultaneously published online on the Digital Repository of the Technische Universität BerlinURL http://opus.kobv.de/tuberlin/volltexte/2013/4021/URN urn:nbn:de:kobv:83-opus-40218[http://nbn-resolving.de/urn:nbn:de:kobv:83-opus-40218]
Design/Typesetting büro-d | Communication Design Berlin

German-Iranian Research Project Young CitiesDeveloping Energy-Efficient Urban Fabric in the Tehran-Karaj Region
www.youngcities.org Water Demand ManagementWater End Use Measurements and Water Consumption Patterns in Tehran HouseholdsTamara Nuñez von Voigt, Shahrooz Mohajeri
Young Cities Research Briefs | 09
The volume before you results from the federal funded research project “Young Cities – Developing Urban Energy Efficiency”. It has been written by
inter 3 Institut für RessourcenmanagementOtto-Suhr-Allee 5910585 Berlin | Germany
www.inter3.de