Embed Size (px)
Citation preview

Year-End 2013 Chemical Industry Situation and Outlook
American Chemistry is Back in the Game
December 2013

American Chemistry Council, Economics & Statistics 1 December 2013
American chemistry expanded in 2013 despite weakness in key export markets,
cuts to government spending from the federal sequester, and periods of tense
uncertainty. In the U.S., strong gains in light vehicles and housing, two important markets
for chemistry producers, drove modest economic growth. Looking ahead to 2014, we
anticipate a sustained global expansion that will result in growing trade. We also
anticipate positive supply chain impacts from unconventional oil and gas development in
the U.S., through increased demand for equipment, chemicals, and services required for
energy production in addition to lower fuel prices for all consumers.
While there were only moderate gains in chemistry production volumes in 2013,
inventories remain balanced, so growing demand in 2014 will require new production.
During the past year, output gains were led by consumer chemistry and specialties.
Advances in manufacturing and exports during 2014 will drive demand for basic chemicals,
especially those segments in which the U.S. enjoys renewed competitive advantage.
Soft performance in 2013 came against the backdrop of a wave of announcements to build
new chemical capacity. These investments will capitalize on the profound and sustainable
competitive advantage enabled by shale gas development. The business of chemistry in
the U.S. may be experiencing its own tipping point. Following a decade of lost
competitiveness, American chemistry is reemerging as a growth industry. The trade
balance in chemistry has reversed from a deficit position to one of surplus. In addition,
the industry is adding high-paying American jobs after years of trimming payrolls.
Chemistry companies in the U.S. continue to innovate, focusing on improving efficiencies
as well as on new leading-edge product development.
Globally, growth fundamentals in Europe and many emerging markets will be stronger in
2014 and the fragile recovery will gain traction. World GDP growth and trade, which are
closely linked, will accelerate. Chemical production will continue to outpace global GDP
growth to enable higher living standards for the world’s growing population.
T. Kevin Swift Chief Economist American Chemistry Council

American Chemistry Council, Economics & Statistics 2 December 2013
U.S. and World Macroeconomic Situation & Outlook Strengthening fundamentals and the unconventional oil and gas advantage improve growth prospects in the U.S.
-4
-2
0
2
4
6
2006 2008 2010 2012 2014 2016 2018
World
U.S.
World GDP (market exchange basis), Real U.S. GDP
% change Y/Y
ACC’s CAB signals slow, tentative growth
in the U.S. through 2014.
U.S. GDP growth will be well below trend
in 2014, about 2.5%. Growth is expected
to accelerate to a 3.0% pace in 2015.
Long-term growth in the economy is
expected to be more muted due to
demographic, policy and other factors.
The U.S. chemical industry will provide
a bright light on this outlook as
improvement in its customer industries
and in emerging markets occurs and as
the effects of enhanced feedstock
competitiveness bolster growth.
For many, 2012 and 2013 may be two years to forget as austerity in developed nations, recession in
Europe, the China slowdown, and uncertainty all combined to hinder growth. The BRIC (Brazil, Russia,
India, China) economies have been weighed down (much like a brick) but it appears that China is now
improving. The European economies appear to be emerging out of a secondary recession but recovery is
tentative at best. Inflationary pressures have eased and monetary policy around the world is
accommodative.
The manufacturing sector, which represents the primary customer base for chemistry, entered a soft
period in 2012 with particular weakness in Europe and East Asia. The global industrial cycle, however, is
beginning to turn upwards, led by the U.S., the United Kingdom and other nations.
In the U.S., the economy is stuck in a slow growth mode as higher taxes, debt and regulatory burdens
combined with political uncertainty to take a toll on both business and consumer confidence. As a result,
businesses have been cautious and cut-back capital spending in 2013. Furthermore, overseas weakness
and a higher dollar dampened U.S. exports. Contractionary fiscal policy and these other burdens,
however, are being partially offset by a loose monetary stance. With household deleveraging largely over,
gradual improvements in the employment situation, a pick-up in the housing market and asset prices
moving higher, consumers are starting to spend again. Americans are shunning credit card debt but
increasing other kinds of debt (e.g., automobile loans, educational loans) and debt levels remain
historically high.
Overall, growth in the U.S. economy will persist – albeit slowly and tentatively – into 2014 and we can see
this by examining the trends in ACC’s Chemical Activity Barometer (CAB). The CAB is a composite
index of economic indicators that track the activity of the chemical industry. Due to its early position in
the supply chain, chemical industry activity leads that in the overall economy and thus, the CAB can be
used to anticipate potential turning points in the overall economy. The CAB is currently signaling slow
economic growth into 2014. Indeed, the consensus forecast for U.S. GDP is for continued but modest
growth, well below trend in 2014, about 2.5%. This will likely improve to 3.0% in 2015 and beyond.
Furthermore, the U.S. is in the midst of an unconventional oil and gas boom which is supportive of
economic growth and industrial activity. Long-term growth in the economy, however, will be more muted
due to demographic, policy and other factors.

American Chemistry Council, Economics & Statistics 3 December 2013
End-Use Markets Gains in key end-use markets driven by vehicles and housing. The outlook is buoyed by improvements in export
markets and supply chain impacts from unconventional oil and gas development.
Light vehicles represent an important
market for chemistry (nearly $3,550 in
chemistry per vehicle) and production
continues to improve. U.S. light vehicle
sales are expected to rise in 2014 as pent-
up demand, improving employment (and
income) prospects, and better availability
of credit foster growth.
Housing is the other large consumer of chemistry (about $15,000 in chemistry per start) and the outlook is
bright. Housing prices have begun to appreciate, credit conditions are easing, and favorable demographic
factors are reemerging as a driving force. A gain in housing starts is expected in 2014 and 2015. Activity will
remain well below the previous peak of 2.07 million units in 2005 but by the second half of the decade,
activity will approach the long-term underlying demand of 1.5 million units per year as suggested by
demographics and replacement needs.
Many key end-use markets for chemistry have recovered; however, several segments remain below their
pre-recession peaks. During 2013, manufacturing growth slowed significantly largely due to the
sequester and to weakness in major export markets. This followed a strong post-recession rebound.
Leaders included light vehicles, aircraft, construction materials, and some industries involved with
business investment. Elsewhere, however, several manufacturing industries have yet to regain traction
(appliances, textiles, paper, printing, etc.). Forward momentum for these segments depends upon
demand for consumer goods, which ultimately drives factory output. In addition, the surge in
unconventional oil and gas development is creating both demand side (e.g., pipe mills, oilfield
machinery) and supply-side (e.g., chemicals, fertilizers, direct iron reduction) opportunities.
0.00
0.50
1.00
1.50
2.00
2006 2008 2010 2012 2014 2016 2018
Housing Starts (mm)
0
5
10
15
20
2006 2008 2010 2012 2014 2016 2018
Light Vehicle Sales (mm)
Housing is making its way back to long-term
trends, a good sign for U.S. chemicals demand

American Chemistry Council, Economics & Statistics 4 December 2013
U.S. and World Chemistry Situation & Outlook The U.S. is back in the game
The slowdown in global manufacturing clearly affected U.S. chemistry, and volume gains have moderated. With
an improvement in customer industries and in emerging markets, however, the effects of an enhanced
competitive position with regard to feedstock costs will support U.S. chemical industry production going forward.
American Chemistry revenues projected to accelerate
$0
$200
$400
$600
$800
$1,000
2006 2008 2010 2012 2014 2016 2018
Chemical Industry Sales ($ billions)
$1 TRILLION In U.S. chemical industry
sales by 2018
Basic chemicals (inorganic chemicals, petrochemicals, plastic resins, synthetic
rubber, and man-made fibers) were the hardest hit from the recession in Europe and
manufacturing slowdown, despite improving demand from important customer
markets such as light vehicles and housing. Downstream customers remain cautious
about building inventories and improvements in final demand could necessitate
replenishing.
The consensus is that U.S. chemical output will improve during 2014 and into 2015. As
a result, for chemistry, following the 0.1% gain in volumes during in 2012 and 1.6%
gain in 2013, expectations are for a 2.5% production gain in 2014 before improving to
a 3.5% gain in 2015. Strong growth is expected in plastic resins and organic chemistry
as export markets revive. Production of specialty chemicals will be driven by strong
demand from end-use markets; most notably light vehicles and housing. Strong 2013
gains are expected in consumer products as well, but these gains will moderate in
2014 and 2015. Demand for agricultural chemicals (and their supply from the U.S.)
will revive. During the second half of the decade, U.S. chemistry growth is expected
to expand at a pace (over 4% per year on average) exceeding that of the overall U.S.
economy. Pharmaceuticals will eventually emerge as a growth segment in 2015.
Although projected year-on-year growth rates for most segments appear good over
the next few years, they must be considered in the context of the exceptionally sharp
declines seen in 2008 that continued into 2009. Moreover, it may take years for
activity to recover from these steep declines and broach past peaks.
Looking forward, the expected modest gains in chemical industry production volumes
and stable capacity suggests improving operating rates in 2013, and with
strengthening production volumes, capacity utilization could improve even further in
2014 and beyond.
In the U.S., growth improved across all regions during 2013. The highest growth was seen in the Ohio Valley
region, reflecting gains in specialties and consumer chemistry produced in that region. Production in 2014 will
be even higher in nearly all regions. Looking ahead to 2015 and beyond, significant shale-driven chemical
capacity will start to come online and generate faster growth, especially along the Gulf Coast. By 2018,
American chemistry revenues will exceed $1.0 trillion.
U.S. chemical output is
expected to rise 2.5% in
2014 and 3.5% in 2015.
IN THE LONG-TERM, the U.S. chemical
industry will grow faster
than the overall U.S.
economy.

American Chemistry Council, Economics & Statistics 5 December 2013
Strong Y/Y gains in chemicals
output growth in the developing
nations of Asia-Pacific, Africa &
the Middle East, and Latin
America.
Inventories are well-balanced
Effective inventory management since the end of the Great Recession has resulted in fairly well-
balanced inventories relative to shipments. For chemical manufacturers, inventories-to-shipments have
ranged between 0.98 and 1.05. In recent months, the ratio has been at the upper end of this range, still
within historical norms.
Along the value chain downstream, businesses have been reluctant to add to inventories and, as a
result, levels are low. Downstream customers have been drawing down inventories and in some cases a
lack of inventories may be slowing economic recovery and expansion. Inventories among chemical
wholesalers have moderated in recent months and at fairly lean levels portend increased needs for
product once orders accelerate.
Global chemistry set to expand – largest gains in developing nations
In global chemistry, the recession in Europe and the slowdown in China and other East Asian nations
clearly affected global chemistry volumes. Overall global production likely advanced only 2.4% in 2013,
down from 2.7% in 2012 and 4.2% in 2011. With improving economic prospects headline growth will
improve to 3.8% in 2014 and 4.1% in 2015. The most dynamic achievements will be found in the
developing nations of Asia-Pacific, Africa & the Middle East, and Latin America. Due to competitive
advantages from shale gas, growth will be strong in North America as well. Western Europe and Japan
will lag. With strengthening production volumes, global capacity utilization will improve in the years to
come.
Chemical industry adding good jobs
The industry’s expansion is also reversing a falling trend in
employment. Employment in the chemical industry is expected to
have grown by 1.3% in 2013 with continued additions through 2018.
This is in contrast to a continuous decline in employment from 1999-
2011. Because chemical industry workers are among the highest paid
in the manufacturing sector, growing payrolls will strengthen local
economies.
After more than a decade
of falling employment
levels, the U.S. chemical
industry is adding jobs.
-12
-8
-4
0
4
8
12
16
2006 2008 2010 2012 2014 2016 2018
World
U.S.
Developed
Developing
Global Business of Chemistry Output
% change Y/Y

American Chemistry Council, Economics & Statistics 6 December 2013
Capital/Infrastructure The U.S. is the venue for chemical investment
A new capital spending cycle began in 2010 as chemical manufacturers
recovered from the Great Recession. Initially in this cycle, it was sustaining
capital that drove investment in the U.S. with expenditures allocated towards
equipment upgrades and other efficiency investments. However, access to
vast, new supplies of natural gas has created an enormous competitive
advantage for American chemistry - petrochemical manufacturers in particular
– and the trend in capital investment has rapidly accelerated and changed as
significant expansion of existing petrochemical capacity has become the
driver. As a result, capital spending surged 14.9% and 16.9% in 2011 and 2012
and will have grown another 10.0% in in 2013 to $42.4 billion. Despite the
hindrance of slow global growth, uncertainty and U.S. tax policies that
discourage business investment, these strong gains in capital spending for
American chemistry are expected to continue. Capital spending is expected to
increase more than 8% per year on average through 2016 with only a minor
slowdown in growth after that. Expansions will continue and investments to
improve operating efficiencies will play a role as well. By 2018, U.S. capital
spending by the chemical industry will reach $61.2 billion - more than double
the level of spending at the start of this prolonged cycle in 2010.
With high profit margins, a low cost of capital and the opportunities afforded
by shale gas, prodigious increases in new plant and equipment investment in
the U.S. are forthcoming. The United States is being favorably re-evaluated as
an investment location and petrochemical producers are announcing
significant expansions of capacity in the U.S., reversing a decade-long decline.
It’s estimated that the gains to basic olefins capacity range from 35% to 40%.
Indeed, over 135 new chemical production projects (valued at over $90 billion
altogether) have been announced through early-December and the dynamics
for sustained capital investment are in place. It’s projected that cumulative
investments arising from renewed industry competitiveness could reach $115
billion by 2025.
Access to plentiful and affordable natural gas supplies has allowed the U.S. to
capture an increasing share of global chemical industry investment since 2011.
This trend will continue as the United States has become the location for
investment. By 2018, global chemical industry capital investment will reach
$618 billion, a level nearly two times higher than it was in 2010.
We need tax policies that will
drive innovation, increase
productivity and promote
manufacturing
competitiveness in the U.S.
$61 BILLION In U.S. Chemical Industry
Capital Spending by 2018
$618 BILLION In Global Chemical Industry
Capital Spending by 2018
Over 135 new chemical
production projects (valued at
over $90 billion altogether)
have been announced and the
dynamics for sustained capital
investment are in place.
Average annual gains of over
8% per year in capital
spending are expected
through 2016 with only a
minor slowdown in growth
after that.

American Chemistry Council, Economics & Statistics 7 December 2013
Innovation The chemical industry is one of the top private investors in R&D
Trade Renewed competitiveness from shale gas will boost U.S. chemicals exports
Chemistry is a science and technology, knowledge-based endeavor.
In 2012, the business of chemistry invested $56.6 billion in research
and development (R&D). With improved margins and prospects it is
likely that R&D spending increased 0.5% to $56.9 billion in 2013.
Companies continue to focus on improving efficiencies as well as on
new leading-edge product innovations and are strengthening R&D
activities. Looking forward, R&D spending is expected to increase
2.5% to $58.3 billion in 2014. Improving gains are expected
thereafter and by 2018, R&D spending will reach $68.7 billion.
Pharmaceutical R&D spending gains will continue to outpace non-
pharmaceutical segments although the latter will enjoy new
buoyancy. Computational advances and other innovations are
resulting in improved R&D effectiveness.
$0
$20
$40
$60
$80
$100
2006 2010 2014 2018
R&D Spending ($ billions)
For the business of chemistry in the United States, the softening of the manufacturing recovery
dampened domestic chemical demand and the recession in Europe and weakness elsewhere, hindered
export sales normally aided by a favorable oil-to-gas price ratio. The trade surplus in chemicals is
expected to grow for the second straight year in 2013, rising to $2.7 billion. During 2014 and 2015, trade
in chemicals will expand as global manufacturing activity improves. Exports of chemicals will grow 6.6%
in 2014 and 7.6% in 2015. The chemical industry will continue to post a trade surplus overall as deficits
in pharmaceuticals and agricultural chemicals are offset by large (and growing) surpluses in basic and
specialty chemicals.
Renewed competitiveness from shale gas (and the resulting disconnect between U.S. natural gas prices
and global oil prices) will boost U.S. exports in the years ahead. New investments to take advantage of
this competitive position will begin to supply export markets in the coming years. The large surplus in
basic chemicals trade will continue to expand as will the surplus in specialties and consumer chemistry.
Excluding pharmaceuticals, the surplus in chemicals trade will grow to $67.5 billion by 2018.

American Chemistry Council, Economics & Statistics 8 December 2013
Conclusion
As 2013 comes to a close, the business of chemistry is on an upswing. Continued recovery in end-use markets, a
growing global economy, and a shift in competitiveness will lift demand for American chemistry over the next
several years. Inventories remain balanced, so increasing demand for chemistry will come from new production
rather than stock drawdowns. ACC expects to see above-trend growth in basic chemicals over the forecast
horizon, in addition to solid demand in other segments.
Innovation will also continue to drive American chemistry, with growing investments in research and
development in new molecules, new applications, and new more efficient processing techniques. Research into
the safety of chemical products also continues to be a significant part of companies’ research programs.
With the development of shale gas and the surge in natural gas liquids supply, the U.S. has moved from being a
high-cost producer of key petrochemicals and resins to among the lowest-cost producers globally. This shift in
competitiveness is boosting export demand and driving significant flows of new capital investment toward the
U.S. We anticipate that recently announced new capacity for chemicals will significantly expand production
when those investments come online beginning in 2015. As a result, the recent pattern of trade deficits and
smaller payrolls is shifting course. By 2018, American chemistry will post record trade surpluses. In addition, the
industry is expected to add high-paying jobs through the end of the decade. In a stark reversal to the trends of
a decade ago, American chemistry is back in the game and poised for growth.

American Chemistry Council, Economics & Statistics 9 December 2013
TABLE 1
Macroeconomic Outlook
% Change Year-over-Year
unless otherwise noted 2010 2011 2012 2013 2014 2015 2016 2017 2018 Average 2019-23
Global Macroeconomic Indicators
GDP (Market Exchange Rate basis) 4.1 2.9 2.6 2.2 2.8 3.2 3.3 3.3 3.3 3.3
GDP (PPP basis) 5.2 3.9 3.2 3.0 3.6 3.8 4.0 4.0 4.0 4.3
World Trade 12.8 6.1 2.7 2.8 4.8 5.5 5.6 5.6 5.9 6.5
Industrial Production 10.0 5.4 3.4 2.1 4.1 4.4 4.0 3.9 3.7 3.4
Consumer Prices 3.6 4.8 4.0 3.2 3.5 3.5 3.3 3.2 3.1 3.0
U.S. Macroeconomic Indicators
GDP 2.5 1.8 2.8 1.7 2.5 3.0 3.0 2.9 2.7 2.5
Consumer Spending 2.0 2.5 2.2 1.9 2.5 2.6 2.6 2.6 2.6 2.4
Business Investment 2.5 7.6 7.3 2.5 4.6 6.0 5.9 5.6 4.1 3.4
Industrial Production 5.7 3.3 3.6 2.3 2.7 3.8 3.4 3.3 2.8 2.5
Light Vehicle Sales (mm) 11.6 12.7 14.4 15.5 16.0 16.0 16.4 16.3 16.3 16.1
Housing Starts (mm) 0.59 0.61 0.78 0.93 1.17 1.31 1.66 1.71 1.66 1.59
Consumer Prices 1.7 3.1 2.1 1.5 1.8 2.1 2.2 2.2 2.1 2.1
10-Year Treasury Notes (%) 3.21 2.79 1.80 2.59 3.23 3.45 4.02 4.64 4.76 4.94
Unemployment Rate (%) 9.6 9.0 8.1 7.5 7.0 6.8 6.3 5.9 5.4 5.3
Exchange Rate ($U.S./euro) 1.33 1.39 1.29 1.31 1.28 1.24 1.26 1.28 1.29 1.32
U.S. End-Use Market Output
Construction 3.9 5.5 5.2 3.5 7.4 7.8 6.4 4.1 3.6 3.2
Food, Beverages & Tobacco -0.1 1.7 2.9 1.2 1.2 1.1 1.1 0.7 0.6 0.3
Textile Mill Products 4.0 0.1 0.5 -1.8 -1.3 -0.7 -1.8 -2.5 -2.6 -2.5
Apparel -0.2 -2.4 -3.5 1.0 -2.6 -3.6 -3.6 -3.7 -4.1 -4.1
Structural Panels 2.2 0.4 4.3 6.7 12.3 12.1 4.4 0.6 1.6 1.4
Paper 2.1 -1.4 -2.4 0.3 1.1 1.5 1.7 0.9 0.8 0.7
Printing 0.1 -4.3 -1.4 -2.6 -1.7 -0.9 -0.7 -0.5 -0.3 0.3
Petroleum Refining -2.3 3.7 0.0 1.7 1.5 2.6 2.3 1.9 1.7 0.8
Rubber & Plastic Products 8.9 8.4 3.2 4.3 2.9 3.3 3.4 4.1 3.5 2.5
Iron & Steel 30.0 9.1 3.6 -1.3 5.0 5.5 5.2 3.4 2.8 2.2
Fabricated Metal Products 6.9 10.0 7.2 3.7 3.6 5.2 4.2 3.3 2.5 2.4
Computers 10.9 7.9 6.3 3.3 3.9 6.1 6.2 4.6 4.5 4.2
Semiconductors & Electronic
Components 32.7 12.0 5.3 5.0 9.6 9.3 8.9 8.6 8.3 8.3
Appliances -0.2 -1.7 -0.8 5.9 4.3 4.2 3.2 2.1 1.8 2.1
Motor Vehicles & Parts 32.5 11.8 17.4 6.0 3.0 4.1 4.2 2.6 2.3 2.0
Aerospace -2.3 8.9 6.9 0.9 9.2 11.9 8.9 7.4 6.0 4.4
Furniture -1.8 5.0 4.7 2.7 3.7 2.6 1.3 0.7 0.3 1.6

American Chemistry Council, Economics & Statistics 10 December 2013
TABLE 2
U.S. Chemistry Outlook: Production Volumes
% Change Year-over-Year 2010 2011 2012 2013 2014 2015 2016 2017 2018 Average 2019-23
Total Chemicals Production Volume 3.3 0.0 0.1 1.6 2.5 3.5 4.0 4.1 4.0 3.4
Production Volume by Segment
Pharmaceuticals -6.9 1.6 -3.2 -0.7 2.3 3.5 4.3 4.4 4.6 4.2
Chemicals, excl. Pharmaceuticals 10.0 -0.9 2.1 3.2 2.6 3.5 3.8 4.0 3.6 2.9
Consumer Products 1.5 5.1 5.2 5.5 2.0 2.2 2.3 2.3 2.2 2.3
Agricultural Chemicals 4.3 -5.9 -3.2 2.3 1.4 1.9 3.7 4.8 3.0 1.3
Fertilizers 12.2 -12.0 -9.5 2.0 1.4 2.2 4.9 5.9 3.8 1.8
Crop Protection -4.9 6.1 11.5 2.5 1.4 1.7 2.9 3.9 2.4 1.0
Specialties 10.4 -1.3 6.9 4.8 3.2 3.6 3.5 3.0 2.9 2.7
Coatings 9.9 0.4 9.0 7.2 3.3 3.3 3.6 3.2 3.2 3.3
Other Specialties 10.6 -1.9 6.0 3.8 3.2 3.7 3.4 3.0 2.7 2.5
Basic Chemicals 16.2 -2.3 0.6 1.2 2.4 4.2 4.5 4.4 3.9 3.1
Inorganic Chemicals 11.7 -3.0 4.7 -0.8 1.2 4.2 4.5 3.3 2.3 2.0
Bulk Petrochemicals & Organics 18.8 -1.2 -1.6 1.6 2.9 4.5 4.6 5.0 4.9 3.6
Plastic Resins 14.3 -6.1 1.6 2.5 2.7 4.2 4.7 4.8 4.0 3.4
Synthetic Rubber 14.5 4.6 7.1 1.3 2.6 4.2 4.2 3.6 3.4 2.7
Man-Made Fibers 33.6 5.2 4.3 0.7 0.1 0.4 0.1 0.9 1.6 0.0
Production Volume by Region
Gulf Coast 13.5 -2.1 0.7 1.4 2.3 4.0 4.3 4.2 3.9 2.9
Midwest 2.0 0.1 -0.2 1.4 2.4 3.5 4.0 4.0 3.9 3.4
Ohio Valley 9.8 -0.9 2.3 3.0 2.3 3.4 3.7 3.7 3.8 2.8
Mid-Atlantic -1.1 0.9 -0.9 1.0 2.3 3.4 4.0 4.0 4.1 3.6
Southeast 2.4 -0.2 -0.1 1.6 2.2 3.3 3.9 4.0 3.7 3.1
Northeast -1.9 1.4 0.0 1.4 2.4 3.3 3.8 3.8 3.8 3.4
West Coast -2.2 1.0 -1.2 1.0 2.3 3.4 4.0 4.0 4.0 3.6

American Chemistry Council, Economics & Statistics 11 December 2013
TABLE 3
U.S. Chemistry Outlook: Trade
TABLE 4
U.S. Chemistry Outlook: Other Indicators
2010 2011 2012 2013 2014 2015 2016 2017 2018
Exports (billions) $171.2 $187.3 $188.3 $192.7 $205.4 $220.9 $238.8 $258.2 $279.4
Imports (billions) $166.6 $191.1 $187.5 $190.0 $197.6 $208.0 $221.4 $234.9 $249.5
Trade Balance (billions) $4.6 -$3.7 $0.8 $2.7 $7.7 $12.9 $17.4 $23.3 $29.8
Pharmaceuticals -$40.1 -$47.2 -$40.4 -$39.1 -$38.4 -$38.3 -$39.1 -$39.6 -$40.2
Chemicals, excluding Pharma. $44.6 $43.5 $41.2 $42.7 $46.6 $51.1 $55.4 $60.9 $67.5
Consumer Products $2.8 $2.4 $2.3 $2.1 $2.1 $2.1 $1.8 $1.6 $1.3
Agricultural Chemicals -$3.2 -$5.0 -$5.0 -$4.8 -$4.2 -$3.9 -$3.7 -$3.6 -$3.5
Specialties $11.8 $11.4 $10.3 $9.7 $10.2 $10.9 $11.7 $12.6 $13.8
Basic Chemicals $33.2 $34.7 $33.5 $34.8 $38.0 $42.1 $46.6 $52.2 $58.4
2010 2011 2012 2013 2014 2015 2016 2017 2018 Average 2019-23
Capacity -5.6 -2.7 1.2 1.7 2.3 3.3 4.0 4.3 4.0 3.3
Capacity Utilization (%) 74.1% 76.1% 75.3% 75.2% 75.3% 75.4% 75.4% 75.3% 75.3% 75.6%
Shipments (billions) $697.8 $776.8 $769.4 $787.8 $812.0 $853.8 $908.2 $959.7 $1,011.7 n/a
% Change Year-over-Year 14.5 11.3 -1.0 2.4 3.1 5.1 6.4 5.7 5.4 n/a
R&D Spending (billions) $55.41 $56.07 $56.59 $56.88 $58.30 $60.65 $63.25 $66.00 $68.65 n/a
% Change Year-over-Year 12.1 1.2 0.9 0.5 2.5 4.0 4.3 4.3 4.0 n/a
Capital Spending (billions) $28.69 $32.96 $38.53 $42.40 $46.20 $50.28 $54.28 $57.80 $61.15 n/a
% Change Year-over-Year 8.4 14.9 16.9 10.0 9.0 8.8 8.0 6.5 5.8 n/a
Employment (thousands) 786.5 783.6 783.6 793.8 794.8 795.9 800.1 803.5 805.6 n/a
% Change Year-over-Year -2.2 -0.4 0.0 1.3 0.1 0.1 0.5 0.4 0.3 n/a
Hourly Wages ($/hour) $21.07 $21.45 $21.45 $21.42 $21.65 $21.90 $22.17 $22.46 $22.75 n/a
% Change Year-over-Year 3.8 1.8 0.0 -0.1 1.1 1.1 1.3 1.3 1.3 n/a

American Chemistry Council, Economics & Statistics 12 December 2013
TABLE 5
Global Business of Chemistry Production Outlook by Country and Region
% Change Year-over-Year 2010 2011 2012 2013 2014 2015 2016 2017 2018 Average 2019-23
United States 3.3 0.0 0.1 1.6 2.5 3.5 4.0 4.1 4.0 3.4
Canada 4.5 0.8 0.8 4.7 3.3 2.6 2.6 2.5 2.6 2.7
Mexico 0.2 -0.1 -0.5 1.3 4.9 4.7 4.3 3.9 3.8 3.5
North America 3.2 0.2 0.0 1.7 2.6 3.5 3.9 4.0 3.9 3.4
Brazil 8.1 -4.1 5.4 0.3 3.5 3.7 3.7 3.5 3.3 3.2
Other Latin America 5.4 3.4 -0.6 0.5 3.1 3.9 3.9 3.6 3.3 3.1
Latin America 6.8 -0.4 1.9 0.4 3.3 3.8 3.8 3.6 3.3 3.1
France 4.8 2.3 1.7 -0.2 1.3 1.8 2.1 2.4 2.0 1.8
Germany 10.8 2.5 -2.9 0.7 1.6 1.4 1.4 1.5 1.5 1.6
Italy 4.5 -0.9 -3.0 -1.2 0.2 1.1 1.4 1.2 0.9 0.7
United Kingdom -4.4 -3.8 -6.1 -3.2 1.0 1.6 1.8 1.8 1.5 1.3
Belgium 20.5 10.6 -4.9 7.7 1.9 2.5 3.0 2.8 2.7 2.5
Ireland 16.6 6.0 -1.7 0.5 3.5 2.6 3.4 3.6 3.8 4.0
Netherlands 12.3 0.3 3.7 -1.5 0.8 1.7 2.1 2.1 2.0 1.9
Spain 7.2 0.8 0.0 -3.3 -0.2 1.0 2.4 2.6 2.1 1.6
Sweden 4.4 11.7 2.9 1.8 3.0 3.2 3.4 3.1 3.0 2.8
Switzerland 10.3 -0.8 4.8 1.4 3.8 3.9 3.3 3.1 3.4 3.4
Other 8.7 3.9 -1.0 1.0 2.4 2.6 2.6 2.5 2.4 2.3
Western Europe 7.7 1.9 -1.4 -0.1 1.4 1.8 2.1 2.1 1.9 1.8
Russia 16.9 5.6 -9.3 1.9 4.5 4.3 4.2 4.2 4.4 4.5
Other Central/Eastern Europe 10.4 2.9 3.0 1.3 3.7 4.5 4.6 4.7 4.5 4.2
Central/Eastern Europe 13.6 4.3 -3.4 1.6 4.1 4.4 4.4 4.5 4.5 4.4
Africa & Middle East 11.5 2.2 3.6 3.6 4.8 4.9 4.9 4.8 5.0 4.6
Japan 7.4 -0.2 -3.2 0.8 4.0 4.3 2.8 2.3 2.0 1.8
Asia-Pacific excluding Japan 14.3 7.7 6.4 6.6 7.3 7.2 7.0 6.6 6.5 6.5
China 17.7 10.7 9.3 8.5 8.8 8.5 8.2 7.8 7.8 8.0
India 1.3 2.5 1.4 5.8 6.7 8.1 8.7 8.9 8.1 7.4
Australia 4.2 0.1 -0.7 1.8 1.8 1.9 2.0 2.0 1.8 1.7
South Korea 10.6 3.3 3.7 4.4 5.5 5.6 4.8 3.9 3.9 3.8
Singapore 13.3 7.4 -3.3 2.3 5.5 2.8 2.7 3.0 2.9 3.3
Taiwan 21.9 -0.9 -3.1 2.0 4.5 4.3 4.3 4.0 3.9 3.7
Other Asia/Pacific 8.8 8.1 5.8 6.9 6.7 6.5 5.9 5.5 5.4 5.2
Asia/Pacific 15.7 8.7 7.2 5.3 6.5 6.5 6.0 5.6 5.4 5.4
Total World 10.0 4.2 2.7 2.4 3.8 4.1 4.1 4.0 3.9 3.7
Developed 6.2 0.9 -1.1 0.9 2.4 3.0 3.1 3.1 2.9 2.6
Developing 13.0 5.6 4.3 5.0 6.3 6.3 6.1 5.8 5.7 5.7
American Chemistry Council, Economics & Statistics 13 December 2013
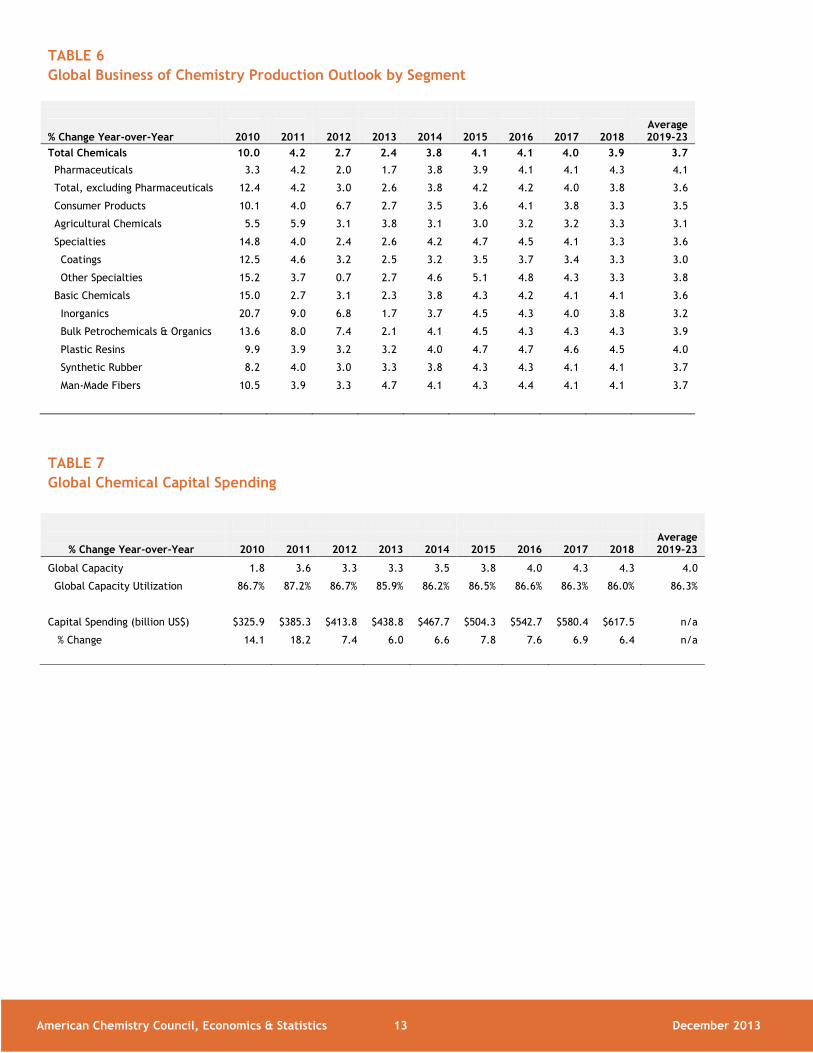
TABLE 6
Global Business of Chemistry Production Outlook by Segment
% Change Year-over-Year 2010 2011 2012 2013 2014 2015 2016 2017 2018 Average 2019-23
Total Chemicals 10.0 4.2 2.7 2.4 3.8 4.1 4.1 4.0 3.9 3.7
Pharmaceuticals 3.3 4.2 2.0 1.7 3.8 3.9 4.1 4.1 4.3 4.1
Total, excluding Pharmaceuticals 12.4 4.2 3.0 2.6 3.8 4.2 4.2 4.0 3.8 3.6
Consumer Products 10.1 4.0 6.7 2.7 3.5 3.6 4.1 3.8 3.3 3.5
Agricultural Chemicals 5.5 5.9 3.1 3.8 3.1 3.0 3.2 3.2 3.3 3.1
Specialties 14.8 4.0 2.4 2.6 4.2 4.7 4.5 4.1 3.3 3.6
Coatings 12.5 4.6 3.2 2.5 3.2 3.5 3.7 3.4 3.3 3.0
Other Specialties 15.2 3.7 0.7 2.7 4.6 5.1 4.8 4.3 3.3 3.8
Basic Chemicals 15.0 2.7 3.1 2.3 3.8 4.3 4.2 4.1 4.1 3.6
Inorganics 20.7 9.0 6.8 1.7 3.7 4.5 4.3 4.0 3.8 3.2
Bulk Petrochemicals & Organics 13.6 8.0 7.4 2.1 4.1 4.5 4.3 4.3 4.3 3.9
Plastic Resins 9.9 3.9 3.2 3.2 4.0 4.7 4.7 4.6 4.5 4.0
Synthetic Rubber 8.2 4.0 3.0 3.3 3.8 4.3 4.3 4.1 4.1 3.7
Man-Made Fibers 10.5 3.9 3.3 4.7 4.1 4.3 4.4 4.1 4.1 3.7
TABLE 7
Global Chemical Capital Spending
% Change Year-over-Year 2010 2011 2012 2013 2014 2015 2016 2017 2018 Average 2019-23
Global Capacity 1.8 3.6 3.3 3.3 3.5 3.8 4.0 4.3 4.3 4.0
Global Capacity Utilization 86.7% 87.2% 86.7% 85.9% 86.2% 86.5% 86.6% 86.3% 86.0% 86.3%
Capital Spending (billion US$) $325.9 $385.3 $413.8 $438.8 $467.7 $504.3 $542.7 $580.4 $617.5 n/a
% Change 14.1 18.2 7.4 6.0 6.6 7.8 7.6 6.9 6.4 n/a

American Chemistry Council, Economics & Statistics 14 December 2013
TABLE 8
Global Economic Environment: Real GDP
TABLE 9
Global Economic Environment: Industrial Production
% Change Year-over-Year 2010 2011 2012 2013 2014 2015 2016 2017 2018 Average 2019-23
Real GDP
United States 2.5 1.8 2.8 1.7 2.5 3.0 3.0 2.9 2.7 2.5
Canada 3.4 2.5 1.7 1.7 2.4 2.6 2.6 2.5 2.4 2.4
Mexico 5.1 4.0 3.6 1.6 3.5 3.8 4.0 3.8 3.8 3.6
Brazil 7.5 2.7 0.9 2.4 2.8 3.2 3.7 3.6 3.6 3.8
United Kingdom 1.7 1.1 0.2 1.4 2.2 2.3 2.2 2.2 2.2 2.3
Eurozone 2.0 1.5 -0.6 -0.3 0.9 1.5 1.6 1.7 1.7 1.7
France 1.7 2.0 0.0 0.1 0.8 1.3 1.5 1.7 1.5 1.8
Germany 3.9 3.4 0.9 0.6 1.6 1.7 1.5 1.5 1.4 1.5
Italy 1.7 0.4 -2.4 -1.8 0.3 0.9 1.3 1.1 1.0 1.1
Spain -0.2 0.1 -1.6 -1.4 0.2 0.7 1.1 1.6 1.7 1.9
Russia 4.5 4.3 3.4 1.8 2.9 3.6 3.8 3.7 3.5 3.4
Japan 4.7 -0.6 2.0 1.9 1.7 1.4 1.0 1.3 1.2 1.1
China 10.4 9.3 7.7 7.4 7.5 7.6 7.5 7.1 6.8 6.3
India 10.5 6.3 3.2 4.4 5.2 6.4 6.9 7.0 7.1 7.2
South Korea 6.3 3.7 2.0 2.6 3.4 3.9 3.9 3.8 3.6 3.2
World GDP (Market Exchange) 4.1 2.9 2.6 2.2 2.8 3.2 3.3 3.3 3.3 3.3
World GDP (PPP) 5.2 3.9 3.2 3.0 3.6 3.8 4.0 4.0 4.0 4.3
World Trade 12.8 6.1 2.7 2.8 4.8 5.5 5.6 5.6 5.9 6.5
% Change Year-over-Year 2010 2011 2012 2013 2014 2015 2016 2017 2018 Average 2019-23
Industrial Production
United States 5.7 3.3 3.6 2.3 2.7 3.8 3.4 3.3 2.8 2.5
Canada 4.9 3.8 1.0 1.2 2.4 2.7 2.8 2.8 2.6 2.4
Mexico 6.0 4.0 3.6 1.6 4.6 4.9 4.2 4.2 4.1 3.6
Brazil 10.5 0.3 -2.6 2.2 3.4 3.6 3.2 3.6 3.6 3.6
United Kingdom 2.1 -0.7 -2.3 -0.3 1.9 2.0 1.6 1.5 1.5 1.5
Eurozone 7.3 3.1 -2.3 -0.5 1.8 2.1 2.1 2.0 1.8 1.6
France 4.8 2.1 -2.8 -0.8 1.6 2.1 3.0 3.9 2.3 1.7
Germany 11.7 8.1 -0.6 0.2 3.2 2.0 1.5 1.6 1.5 1.8
Italy 7.0 -0.7 -6.2 -2.9 0.5 1.8 1.8 1.7 1.6 1.4
Spain 0.8 -1.4 -6.1 -2.0 0.3 1.6 2.3 2.6 2.3 1.9
Russia 8.3 4.7 2.5 2.0 3.8 4.4 4.0 3.8 3.7 3.6
Japan 16.0 -2.5 -0.3 -0.7 4.5 3.9 2.8 2.1 1.7 1.2
China 12.7 9.6 10.1 8.7 8.5 9.7 9.3 9.1 8.7 8.5
India 9.8 4.8 0.8 0.6 4.4 6.4 7.0 6.7 6.7 7.5
South Korea 16.3 5.9 0.9 0.0 5.7 6.9 5.9 5.1 4.5 4.1
World Industrial Production 10.0 5.4 3.4 2.1 4.1 4.4 4.0 3.9 3.7 3.4

American Chemistry Council, Economics & Statistics 15 December 2013
TABLE 10
Global Economic Environment: Inflation (Consumer)
% Change Year-over-Year 2010 2011 2012 2013 2014 2015 2016 2017 2018 Average 2019-23
Inflation (Consumer)
United States 1.7 3.1 2.1 1.5 1.8 2.1 2.2 2.2 2.1 2.1
Canada 1.8 2.9 1.5 1.1 1.8 2.0 2.0 2.0 2.0 2.0
Mexico 4.2 3.4 4.1 3.9 3.5 3.5 3.0 3.4 3.4 3.4
Brazil 5.0 6.6 5.4 6.0 5.5 5.4 4.9 4.7 4.6 4.1
United Kingdom 3.3 4.5 2.8 2.6 2.3 2.3 2.2 2.2 2.3 2.2
Eurozone 1.6 2.7 2.5 1.4 1.4 1.7 1.8 1.9 1.8 1.8
France 1.7 2.3 2.2 1.1 1.5 1.6 1.8 1.9 1.7 1.9
Germany 1.2 2.5 2.1 1.6 1.7 1.9 1.9 1.8 1.7 1.7
Italy 1.6 2.9 3.3 1.4 1.4 1.5 1.6 1.8 1.6 2.0
Spain 2.0 3.1 2.4 1.6 1.2 1.4 1.7 1.6 1.7 2.1
Russia 6.9 8.4 5.1 6.5 5.5 5.2 4.9 4.7 4.4 3.9
Japan -0.7 -0.3 0.0 0.3 2.1 1.7 1.9 1.6 1.7 1.4
China 3.3 5.4 2.7 2.6 3.1 3.1 3.2 3.3 3.0 3.0
India 10.4 8.4 10.4 10.3 8.3 7.7 6.9 6.6 6.4 5.7
South Korea 2.9 4.0 2.2 1.3 2.5 3.0 3.0 2.8 2.8 2.6
World Inflation 3.6 4.8 4.0 3.2 3.5 3.5 3.3 3.2 3.1 3.0

American Chemistry Council, Economics & Statistics 16 December 2013
Methodology
For More Information
Every effort has been made in the preparation of this publication to provide the best available information. However,
neither the American Chemistry Council, nor any of its employees, agents or other assigns makes any warranty,
expressed or implied, or assumes any liability or responsibility for any use, or the results of such use, of any
information or data disclosed in this material.
More details, historical data (back to 1994) and annual projections (to 2018 and beyond) for the tables in the report
are available in spreadsheet format. For more information or to access the detailed data, contact ACC’s Economics
Department: [email protected]
Economics & Statistics Department Contacts
Martha Gilchrist Moore
Senior Director- Policy Analysis and Economics
202 249-6182
Emily Sanchez
Director- Surveys & Statistics
202 249-6183
Heather R. Rose-Glowacki
Director, Chemical & Industry Dynamics
202 249-6184
Dr. Thomas Kevin Swift
Chief Economist & Managing Director
202 249-6180
This report presents an assessment of current conditions and expectations for the global business of chemistry, with
particular emphasis on the U.S. The analysis uses economic data and publicly available information through mid-
November 2013.
In looking ahead, several models of global output, trade, etc. for the business of chemistry are employed. Also
taken into account are the forecasts made by economists at the national chemical associations in Europe (whose
expertise ACC gratefully acknowledges) and from economic forecasting consultants and other institutions. Also
gratefully acknowledged is the macroeconomic and chemical industry expertise of IHS Global Insight and Oxford
Economics, leading providers of economic advice and consultancy services. The macroeconomic forecasts of the
Economist Intelligence Unit (EIU) were also important to our thinking as was the U.S. Industrial Outlook of the
Manufacturers Alliance/MAPI. These were supplemented by forecasts provided by the Asian Development Bank, IMF,
OECD, the WTO, and various banks.