Embed Size (px)
Citation preview
The U.S. soybean crop for 2013/14 is projected to increase 12 percent to a record large 3.39 billion bushels based on a recovery in the yield to 44.5 bushels per acre. Robust export competition may temper an increase in U.S. soybean exports to 1.45 billion bushels from 1.35 billion in 2012/13. Strong gains are also anticipated for the 2013/14 soybean crush, which is forecast up 60 million bushels to 1.695 billion. U.S. season-ending soybean stocks may more than double in 2013/14 to 265 million bushels. The wider gap between soybean supplies and use are seen reducing the U.S. average farm price in 2013/14 to $9.50-$11.50 per bushel compared to this year’s forecast of $14.30 per bushel. A strong rebound for the U.S. crop is expected to raise global soybean production in 2013/14 by 6 percent to 285.5 million metric tons. For Brazil, diminishing returns for soybeans could slow area gains for 2013/14 to only 2.7 percent (to 28.25 million hectares), which would limit growth in production to 85 million tons versus 83.5 million this year. The Argentine soybean crop could increase to 54.5 million tons in 2013/14 from 51 million this year assuming typical yields and a 3- percent increase in area. Soybean imports for China in 2013/14—with growth in crushing and a restoration of stock levels—are projected up to 69 million tons from a revised 2012/13 forecast of 59 million tons.
Oil Crops Outlook Mark Ash [email protected] Oilseed Production Gains for 2013/14 Could Outpace Global Consumption
Economic Research Service Situation and Outlook Report OCS-13e Release Date May 14, 2013
Oil Crops Chart Gallery will be updated on May 16, 2013 The next release is June 14, 2013 -------------- Approved by the World Agricultural Outlook Board.
Domestic Outlook
2 Oil Crops Outlook/OCS-13e/May 14, 2013
Economic Research Service, USDA
Yield Recovery in 2013/14 Likely To Produce a Record U.S. Soybean Crop U.S. soybean production this year is expected to rebound strongly—primarily associated with a likely recovery in crop yields to a long-term trend. Compared to the drought-reduced 2012 yield of 39.6 bushels per acre, the U.S. trend yield for 2013 is estimated at 44.5 bushels. The 2013 crop is projected at a record large 3.39 billion bushels—a 12-percent increase over last year’s harvest. Intended planting for soybeans this year is down slightly to 77.1 million acres. Yet, better weather could slightly improve the acreage harvested to 76.2 million acres from 76.1 million in 2012. The planting of soybeans this spring is off to one of the slowest starts ever, in contrast to last year's brisk pace. Farmers were exiled from fields by colder than normal temperatures and above-average precipitation in April. As of May 5, only 2 percent of U.S. soybean acreage had been sown, almost none of it in the main Midwestern growing region. By comparison, soybean planting was well behind last year’s progress at 22 percent and the 5-year average of 12 percent. Planting for corn and spring wheat is also running far behind the usual rate. If those delays persist, even more soybean acres could be sown, as they can be planted later than the other crops. On the other hand, the late development of the winter wheat crop could preclude some planting of double-cropped soybeans. Much Lower Soybean Prices Are Anticipated Along With Accumulating Stocks Despite prospects for a record crop in 2013/14, U.S. soybean demand is unlikely to surpass its all-time high. Soybean importing countries should still be loading up this fall on inexpensive South American stocks. That outlook is in stark contrast with last fall when sharply reduced soybean stocks in Brazil and Argentina gave U.S. shipments almost total dominance of the export market. Robust foreign competition will temper the increase in U.S. exports for 2013/14 to 100 million bushels for a total of 1.45 billion. Right now, domestic processors are having trouble acquiring enough soybeans to crush, as indicated by an unusually strong relationship between cash and futures prices. The start of the fall harvest will resolve this scarcity. Strong gains are anticipated for the 2013/14 soybean crush, which is forecast increasing by 60 million bushels to 1.695 billion. The drivers of soybean crushing in 2013/14 will increasingly shift toward the production of soybean oil. Supplies of soybean oil this fall will become increasingly tight. But even with a substantial upswing in crushing this fall, it could be difficult to significantly boost oil stocks again. Exports of soybean oil are unlikely to factor into that scarcity. In 2013/14, uncompetitive prices could slash U.S. soybean oil exports to 1.3 billion pounds from 2.2 billion in 2012/13. Despite expected stability for domestic soybean oil prices in 2013/14 (at 47-51 cents per pound), prices around the world for competing vegetable oils could get comparatively less expensive. It is domestic consumption of soybean oil—particularly for biodiesel—that should keep pace with the output gains. Higher use requirements in 2013 for advanced biofuels are projected to expand the use of soybean oil for biodiesel to 5.4 billion pounds in 2013/14 from a forecast 4.9 billion this year. Pending an extension of the
3 Oil Crops Outlook/OCS-13e/May 14, 2013
Economic Research Service, USDA
$1.00-per-gallon blending credit for biodiesel through next year, the last 3 months of 2013 could have a very high consumption of oils for feedstock. Total domestic use for 2013/14 would be limited to 18.55 billion pounds, from 18.35 billion this year by a small decline in the edible use of soybean oil. In contrast to soybean oil, U.S. exports of soybean meal should remain competitive next year. Soybean meal prices in 2013/14 may average $280-$320 per short ton, well below this year’s average of $425 per ton. The low prices would support the U.S. export share of global soybean meal trade. Meal shipments abroad are projected growing to 10.2 million short tons from a revised 2012/13 forecast of 9.9 million. Moderating feed costs are also likely to boost domestic livestock production next year and could expand 2013/14 domestic use of soybean meal by 2.7 percent to 30.2 million tons. Despite a higher use for soybeans, a succession of large international crops should end a 3-year decline in U.S. inventories. Season-ending soybean stocks may more than double in 2013/14 to 265 million bushels. Current prices do not yet reflect this outlook, as they are supported by a tight soybean inventory that will continue to shrink throughout the summer. Eventually, soybean prices should ease as the 2013 crop approaches maturity. The wider gap between supplies and use are seen reducing the U.S. average farm price in 2013/14 to $9.50-$11.50 per bushel compared to this year’s forecast of $14.30 per bushel. 2013/14 Supplies Seen Steady for Canola While a Small Decline Likely for Sunflowerseed U.S. canola production is expected to increase 1 percent in 2013/14 to 2.48 billion pounds. A recovery in canola yields (to 1,528 pounds per acre from last year's below-average 1,416 pounds) would offset a 6-percent reduction in sown acreage. Total supplies of canola would remain steady, though, as a limited supply in Canada could curtail U.S. imports of the oilseed to a 10-year low (800 million pounds). However, imports of canola oil and canola meal from Canadian processors should continue to grow strongly to 3.1 billion pounds and 3.35 million short tons, respectively. This year, the intended planting of sunflowerseed is down 12 percent to 1.7 million acres. In 2012, North Dakota sunflowerseed yields soared far above the trend, so output would also be curtailed this year if yields revert to a more typical level. The U.S. average sunflowerseed yield is projected to fall back to 1,471 pounds per acre in 2013/14, versus 1,513 pounds in 2012/13. Thus, the next sunflowerseed crop is projected 15 percent lower to 2.4 billion pounds. Total supplies for 2013/14 might fall only 5 percent, however, due to a large increase in carryover stocks. Beginning inventories of sunflowerseed are forecast surging to a 4-year high of 445 million pounds. If season-ending stocks can again be drawn down below 300 million pounds, a modest 5-percent increase in the 2013/14 sunflowerseed crush (to 1 billion pounds) could be supported.
4 Oil Crops Outlook/OCS-13e/May 14, 2013
Economic Research Service, USDA
Peanut Stocks Likely To Shrink With Smaller Crop, Continuing Demand Strength In April, the U.S. average farm price for peanuts had fallen to 26 cents per pound—down 26 percent compared to a year earlier. Thus, the incentive to grow peanuts this year is much diminished. Intentions for sown peanut acreage in 2013/14 are down 27 percent to 1.2 million acres, largely contributing to an expected 34-percent decline in production to 4.4 billion pounds. Peanut yields are also likely to revert back to a long-term trend in 2013 after soaring to a record 4,192 pounds per acre last year. But if U.S. peanut exports cannot keep up with this year’s banner trade, it might only modestly trim season-ending stocks next year—to 2.3 billion pounds from 2.4 billion in 2012/13. Exports are seen falling back to 650 million pounds in 2013/14 from 1.2 billion this season. Other peanut-exporting countries, such as Argentina and China, are expected to produce better crops that would strengthen their global market shares. Peanut prices could continue to tumble toward a 6-year low in 2013/14. This year, Southern farmers intend to plant 10 million acres of cotton—a 19-percent decline from 2012. However, a more moderate 10-percent reduction in harvested acreage could be seen with lower abandonment. It is assumed that growing conditions for cotton in 2013 will be better than in the last 2 years, when extreme heat and drought in the Southern Plains withered crops. Last year, farmers harvested only 76 percent of the acreage sown to cotton. Even so, U.S. cottonseed production for 2013/14 could fall to a 4-year low of 4.9 million short tons. A smaller supply would further reduce domestic use and exports of cottonseed. Cottonseed crushing is seen declining 10 percent in 2013/14 to 2.25 million tons while its consumption for feed would be rationed by 12 percent to 2.7 million tons. Similarly, U.S. cottonseed exports could decline to 150,000 tons from 175,000 in 2012/13. Tighter supplies would not support cottonseed prices, though, as a plunge in soybean meal prices would be a dominating factor. The range of farm prices received for cottonseed in 2013/14 could drop to $145-$185 per short ton versus this year's season average of $255 per ton.
International Outlook
5 Oil Crops Outlook/OCS-13e/May 14, 2013
Economic Research Service, USDA
U.S. Crop Recovery and High South American Carryover to Inflate Global Soybean Stocks Expected gains for global soybean production in 2013/14 may dwarf increases for all other oilseeds by increasing 6 percent to 285.5 million metric tons. A strong rebound for the U.S. crop would account for 62 percent of this increase, with smaller increases in South America. However, the production gains for soybeans are likely to far outstrip its consumption growth. USDA expects the worldwide crush of soybeans to climb 4 percent in 2013/14. That gap between production and use of soybeans could swell global ending stocks by 20 percent next year to 75 million tons. Soybean prices have already fallen in Brazil and could continue to do so over the next few months. Compared to a 10-percent increase in soybean area this season, diminishing returns could slow its growth in 2013/14 to only 2.7 percent for a total of 28.25 million hectares. Assuming a trend yield, Brazil's projected soybean crop for 2013/14 would edge up to 85 million tons versus 83.5 million this year. This year, Brazil’s huge crop and port congestion have combined to create major shipping delays for soybeans. As a result, there will be more soybean stocks carried over in Brazil this October for the start of the 2013/14 marketing year. Those supplies will set up a formidable competition this fall with U.S. new-crop soybean shipments. Brazilian soybean exports are projected rising to a record 41.5 million tons from 36.4 million this year. Higher supplies will also benefit Brazil's domestic processors and raise the soybean crush by 4 percent to 37 million tons. Although Argentine farmers will also see much lower soybean prices next fall when they plant, USDA projects they will raise 2013/14 soybean area by 3 percent to 20 million hectares. Producers would switch more cropland from corn because of the lower cost of raising soybeans. Cash outlays for growing corn in Argentina are about two-thirds higher than they are for soybeans. And some croplands that were too wet to plant last season should return to production in 2013/14. Argentina is not expected to significantly modify its restrictive policies on grain exports. The Argentine soybean crop could increase to 54.5 million tons in 2013/14 from 51 million this year, assuming typical yields. The new Argentine crop would add to an already abundant level of stocks expected to be carried over from the 2012/13 harvest. Although that harvest was two-thirds complete by early May, Argentine farmers have sold only as much as needed to pay expenses. The country’s plunging foreign currency reserves have persuaded many farmers that a devaluation of the Argentine peso is unavoidable. Some estimate the peso is overvalued by as much as 50-60 percent. Once it happened, devaluation could provide a major boost to the value of farmers’ stocks and prompt more sales. As in Brazil, the current delays in soybean marketing would concentrate even more of the Argentine shipments into the final months of 2013 and head-to-head with the prime period for U.S. exports. An increase is projected for 2013/14 Argentine soybean exports to 12 million tons from 9.1 million this year. Argentine soybean processors are also expected to reassert their dominance in international markets with a 10-percent increase in soybean meal exports to a record 28.7 million tons.
6 Oil Crops Outlook/OCS-13e/May 14, 2013
Economic Research Service, USDA
Indian farmers are seen responding to domestic soybean prices (which are currently up 15 percent from a year ago) by expanding sown area by 2 percent to 11 million hectares. Soybean planting in India should commence in June, provided a normal start to the summer monsoon. Indian soybean production for 2013/14—assuming normal yields—is projected to rise 4 percent to a record 12 million tons. Even with a larger harvest, heavy competition from other exporters of soybean meal, as well as rapidly growing consumption by the domestic livestock industry, is likely to curtail export demand. Indian soybean meal exports in 2013/14 could decline 7 percent to 3.95 million tons. In contrast to their impact on producers of soybeans, lower prices will greatly benefit the world’s importers. It would particularly aid soybean demand in China—the world’s top import market. Soybean imports for China in 2013/14 are projected up to 69 million tons from a revised 2012/13 forecast of 59 million tons. Most of the soybean imports are expected to supplement a smaller domestic crop and accommodate growth in crushing. Domestic soybean production is seen dipping to 12 million tons from 12.6 million in 2012/13. An expected 6-percent reduction in soybean area (to 6.6 million hectares) would be largely responsible for the smaller crop, as China’s farmers are likely finding grains to be a more profitable alternative. Moderate growth for soybean meal consumption in China is anticipated for 2013/14 at 4.8 percent to 52.4 million tons. Consumption of all protein meals (on a soybean meal-equivalent basis) in China is expected 3.5 percent higher to 69.4 million tons. Protein demand may be dampened indefinitely by weak consumption for poultry, which consumers have recently shunned over fears of avian influenza. However, some soybean imports for China will also be used to restore stock levels. Difficulties in sourcing imports this season have forced China’s processors to dip into domestic inventories. Season-ending soybean stocks in China are seen rising to 13.5 million tons in 2013/14 from 11.4 million this season. Import demand for soybeans by other countries continues to be dampened by weak economic growth. Projected growth in 2013/14 for EU-27 protein meal demand is just 1 percent higher, although that represents an improvement over a 0.4-percent decline for 2012/13. Low costs are likely to give a larger boost to EU imports of soybean meal, which are forecast rising 4 percent to 20.8 million tons. In contrast, EU imports of soybeans may rise by only 100,000 tons to 12.1 million. EU processors have become less competitive in recent years, leading them to convert more soybean processing capacity to rapeseed instead. Record Rapeseed Production Expected To Boost World Trade Global production of rapeseed in 2013/14 is projected to increase 4 percent to 63.4 million tons due to improved crops for the EU-27, Canada, Ukraine, Russia, and India. After declining in 2012/13, the growth in international trade of rapeseed could resume. However, low global stocks of rapeseed are likely to persist as consumption may outpace the increase in total supplies. Primarily based on a 5-percent increase in the 2013/14 area to 6.5 million hectares, EU-27 rapeseed production is projected rising to 20 million tons from 19.1 million last year. Some of the expected area increases stem from lower abandonment for Romania, Hungary, and Bulgaria, where extreme drought had slashed the area
7 Oil Crops Outlook/OCS-13e/May 14, 2013
Economic Research Service, USDA
harvested last year. Last winter's heavy snowcover protected crops from freezing temperatures, so winterkill for the 2013/14 crop is minimal. But temperatures in Europe stayed below average in March and April and have held back crops 3-4 weeks behind their usual development. An improved domestic harvest and greater availability of foreign supplies in 2013/14 are projected to increase the EU-27 rapeseed crush to 22.2 million tons. Even with a bigger crop, EU rapeseed imports for 2013/14 may stay level at 3.1 million tons. Additional imports would likely come from Ukraine. Based on a sharp increase in area (up 54 percent to 1 million hectares) and low winterkill, the Ukraine rapeseed crop is expected to swell 43 percent in 2013/14 to 2 million tons. Almost all of Ukraine’s additional rapeseed production would be used to expand exports to 1.9 million tons. In Canada, a favorably high price is expected to raise the area sown to wheat this year to its highest level since 2001. Wheat production is also encouraged by last year’s ending of the Canadian Wheat Board's monopoly on sales, which may liberalize acceptance of more varieties that can be grown and sold for export. The country's farmers intend to plant 12 percent more wheat area in 2013 than last year. These area increases for wheat are coming largely at the expense of canola. Despite good prices, some canola producers are convinced that more commonly seen problems with yield-reducing diseases (a common complaint in 2012) have developed from too short of a break between successive crops in their rotations. So, the 2013 canola planted area in Canada is expected down 11 percent to 8.1 million hectares. Getting even this much canola sown this spring could be a challenge. Until mid-April, much of southern Canada was still covered by snow. The cold and wet soil conditions in the Prairies may cause major planting delays, much like 2 years ago. Such circumstances could either compel the seeding of shorter maturing crops like barley and oats or raise the amount of fallow cropland. The 2013/14 canola crop in Canada is expected to recover despite a lower sown area. Improved yields could boost canola production to 14.5 million tons from 13.3 million in 2012/13. Yet, the increase for 2013/14 total supplies in Canada will be muted by minimal carryover stocks, which could be the lowest in 15 years. Moderately higher supplies for 2013/14 would aid a 5-percent increase in exports to 7.5 million tons. Similarly, domestic canola crushing could increase modestly to 6.9 million tons from 6.75 million this year. Exports of canola meal and canola oil from Canada could be nearly unchanged at 3.2 million and 2.5 million tons, respectively. For Australia, plantings of canola are expected to decline 10 percent in 2013/14 to 2.15 million hectares. Producers planted a record canola area last season, but this year they will cut back to maintain a regular crop rotation with grains. Worsening deficits of soil moisture in southeastern Australia are also delaying crop planting this year. USDA projects a 9-percent decline in 2013/14 canola production for Australia to 2.8 million tons. Exports of canola from the country are projected down 8 percent for 2013/14 to 2.2 million tons. The 2013 rapeseed crop in China is now being harvested and is reportedly in good condition. Continuing to lose area to wheat and other grains, this year’s rapeseed area in China would be the smallest since 2008/09. Rapeseed area is estimated down 3 percent this year to 7 million hectares. Crop production is expected to decline 4 percent to 13 million tons. Rapeseed imports for China are seen climbing 19 percent to 2.5 million tons, but growth beyond that will be constrained by a
8 Oil Crops Outlook/OCS-13e/May 14, 2013
Economic Research Service, USDA
limited availability of supplies from exporting countries—particularly Canada and Australia. A glut of wheat stocks is likely to emerge in India this year due to a bumper harvest. Thus, more cropland could be freed up in 2013/14 for the production of rapeseed, which competes for area with wheat in northern India. Even then, Indian rapeseed area may edge up only 1 percent to 6.8 million hectares. Indian rapeseed production for 2013/14 could then go 3 percent higher to 7 million tons. A larger crop would be used to raise domestic crushing and the production of rapeseed oil. Crushing Rates for Sunflowerseed in 2013/14 To Be Buoyed by Improved Crops Sunflowerseed producers in Ukraine, Russia, the EU-27, and Argentina are expected to raise global production by 10 percent to 40 million tons. Better crops for each of these countries would benefit global trade in sunflowerseed, although they may not be large enough to restore global stocks to former levels. Combined gains for exports of sunflowerseed meal and sunflowerseed oil in 2013/14 could be even greater than for the unprocessed sunflowerseed. Despite low stocks and high prices for grains in Russia, unused cropland is still available for an expansion of the country's sunflowerseed area. Russian farmers are expected to raise sunflowerseed area by 6 percent in 2013/14 to 6.5 million hectares. Coupled with an ever rising yield trend (associated with improved seed varieties and input use), Russian sunflowerseed production is projected to increase 7 percent to 8.5 million tons. Russian export taxes on sunflowerseed shipments are scheduled to be stepped down following the country's WTO accession last year. Despite the reduced support for domestic crushing, the industry is quite healthy—aided by new investment in modern plants. Although Russia's exports of sunflowerseed are seen doubling with the bigger harvest to 100,000 tons, that would be overshadowed by a 4-percent increase in the crush to 7.8 million tons. Sunflowerseed oil dominates domestic use of vegetable oils, but a production surplus will allow a 10-percent expansion in Russian exports to 1.1 million tons. In Ukraine, harvested area for sunflowerseed in 2013/14 is seen unchanged at 6 million hectares. Cultivation of sunflowerseed is being limited by the increasing popularity of growing corn, which has seen a noticeable improvement in yields with wider use of better imported seeds. And compared to last year, minimal winterkill losses for winter grains mean that there will be less replanting with sunflowerseed. However, sunflowerseed yields are expected to be considerably better this year, which would push up production by 17 percent to 10.5 million tons. The production gains would accrue mostly to the benefit of domestic processors, who are seen raising the 2013/14 sunflowerseed crush by 11 percent to nearly 10 million tons. After a severe drought slashed crop yields throughout Eastern Europe and Spain last year, EU sunflowerseed yields for 2013/14 are expected to rebound. EU harvested area for sunflowerseed could be about the same this year, but higher yields could improve production by 15 percent to 7.9 million tons.
9 Oil Crops Outlook/OCS-13e/May 14, 2013
Economic Research Service, USDA
Global Production of Cottonseed and Peanuts Are Seen Modestly Lower Worldwide cottonseed production for 2013/14 is projected to slip 1 percent to 44.8 million tons as cotton users are still working down a glut from 2011/12. Reduced crops for China (where cotton stocks are particularly high) and the United States are expected to offset larger harvests for India and Brazil. Cottonseed production in China—the world's top producer—is projected down 3 percent to 13.3 million tons. Cotton area, which has been generally declining in China for the last 6 years, is expected down 4 percent to 5.1 million hectares. Yields have slowly trended upward as a higher percentage of cotton area has shifted to better-yielding parts of the country. In contrast, Indian cotton area is expected up 2 percent for 2013/14 to 12 million hectares—the second-highest ever. And provided the summer monsoon does not arrive late like last year, Indian cotton yields this year would likely return to a higher average level. Both factors are expected to boost Indian cottonseed production by 2 percent for 2013/14 to 11.5 million tons. The Indian cottonseed crop represents more than one-quarter of the world’s total production. All of the country's harvest is used domestically, which will support its vegetable oil supply. For peanuts, global production in 2013/14 is projected to decline 2 percent to 36.4 million tons. The reduction would be concentrated in the United States, where peanut area and yields are expected well below their 2012/13 record. Output for other major producing countries, including China and Argentina, would be moderately higher. India’s 2013/14 peanut crop is projected at 5 million tons—the same as in 2012/13. The attractiveness of growing peanuts in India has been diminished by the success of cotton, against which it competes for cropland. Cotton's growing dominance in India is highly correlated with the widespread adoption of biotech varieties, which has made cotton considerably more profitable than peanuts. Thus, Indian peanut area has generally declined for more than a decade, particularly in the western part of the country. Although Indian peanut area for 2013/14 is expected to stabilize at 5 million hectares, minimal yield growth for the crop would preclude any production gains. Gains for Indonesian Palm Oil Production and Trade Will Dominate Global Market Global production of palm oil for 2013/14 is projected up 5 percent to 58.1 million tons. Almost all of the increase could arise from output growth in Indonesia, which is expected to rise to 31 million tons from 28.5 million in 2012/13. As a result, next season Indonesia is expected to expand its palm oil exports to 21 million tons from 20.1 million in 2012/13. Indonesia’s share of global palm oil exports could grow to nearly half. In contrast, no gains are anticipated for Malaysian palm oil production in 2013/14. The country’s output is expected to flatten out at 19 million tons due to a small reduction in harvested area. Malaysia’s Government has required small independent producers (who own about 14 percent of the country’s oil-palm area) to replant their
10 Oil Crops Outlook/OCS-13e/May 14, 2013
Economic Research Service, USDA
aging and less-productive trees. The replanting program is expected to remove 365,000 hectares from production—or about 7 percent of the country’s total oil palm area. To compensate for the lost output, the producers would receive subsidies for 3 years. New land for expanding palm oil production in Malaysia is now quite scarce. Labor shortages also continue to hamper Malaysian palm oil producers, who must rely on immigrants for much of their workforce. Low palm oil prices have made imports quite attractive, especially for India—the top import market. Despite implementation of policy measures to raise the cost of refined vegetable oil imports, the country has been unable to greatly raise domestic production of oilseeds and vegetable oils. India is still more dependent on vegetable oil imports than many other countries. For 2013/14, growth in domestic production of vegetable oils is projected to be negligible. At the same time, projected consumption of vegetable oils is seen rising 5 percent to 19.2 million tons. By increasing 6 percent to 9 million tons, palm oil would account for 81 percent of that consumption growth. In contrast, Indian soybean oil imports are projected to expand by only 75,000 tons in 2013/14 to 1.2 million. Similarly, many other countries—including China, the EU-27, and Pakistan—are anticipated to register record imports of palm oil in 2013/14.
Contacts and Links
11 Oil Crops Outlook/OCS-13e/May 14, 2013
Economic Research Service, USDA
Oil Crops Monthly Tables, (http://www.ers.usda.gov/publications/ocs-oil-crops-outlook/) Oil Crops Chart Gallery, (http://www.ers.usda.gov/data-products/chart-gallery.aspx) Data Monthly tables from Oil Crops Outlook are available in Excel (.xls) spreadsheets at http://www.ers.usda.gov/publications/ocs-oil-crops-outlook/. These tables contain the latest data on the production, use, imports, exports, prices, and textile trade of cotton and other fibers. Recent Report Estimating the Substitution of Distillers’ Grains for Corn and Soybean Meal in the U.S. Feed Complex http://www.ers.usda.gov/media/236568/fds11i01_2_.pdf. Corn-based dry-mill ethanol production and that of its coproducts—notably distillers’dried grains with soluble (DDGS)—has surged in the past several years. The U.S. feed industry has focused on the size of this new feed source and its impact on the U.S. feed market, particularly the degree that DDGS substitute for corn and soybean meal in livestock/poultry diets and reduce ethanol’s impact on the feed market. This study develops a method to estimate the potential use of U.S. DDGS and its substitutability for corn and soybean meal in U.S. feed rations. Related Websites Oil Crops Outlook, http://usda.mannlib.cornell.edu/MannUsda/viewDocumentInfo.do?documentID=1288 WASDE, http://usda.mannlib.cornell.edu/MannUsda/viewDocumentInfo.do?documentID=1194 Oilseed Circular, http://www.fas.usda.gov/oilseeds_arc.asp Soybeans and Oil Crops Topic, http://www.ers.usda.gov/topics/crops/soybeans-oil-crops.aspx
Contact Information Mark Ash, 202-694-5289, [email protected] Verna Daniels, (202) 694-5301, [email protected] Subscription Information Subscribe to ERS e-mail notification service at http://www.ers.usda.gov/subscribe-to-ers-e-newsletters.aspx to receive timely notification of newsletter availability. Printed copies can be purchased from the USDA Order Desk by calling 1-800-363-2068 (specify the issue number) To order printed copies of the five field crop newsletters—cotton and wool, feed, rice, oil crops, and wheat—as a series, specify series SUB-COR-4043
The U.S. Department of Agriculture (USDA) prohibits discrimination in all its programs and activities on the basis of race, color, national origin, age, disability, and, where applicable, sex, marital status, familial status, parental status, religion, sexual orientation, genetic information, political beliefs, reprisal, or because all or a part of an individual’s income is derived from any public assistance program. (Not all prohibited bases apply to all programs.) Persons with disabilities who require alternative means for communication of program information (Braille, large print, audiotape, etc.) should contact USDA’s TARGET Center at (202) 720-2600 (voice and TDD). To file a complaint of discrimination write to USDA, Director, Office of Civil Rights, 1400 Independence Avenue, S.W., Washington, D.C. 20250-9410 or call (800) 795-3272 (voice) or (202) 720-6382 (TDD). USDA is an equal opportunity provider and employer.
E mail Notification Readers of ERS outlook reports have two ways they can receive an e-mail notice about release of reports and associated data. • Receive timely notification (soon after the report is posted on the web) via USDA’s Economics, Statistics and Market Information System (which is housed at Cornell University’s Mann Library). Go to http://usda.mannlib.cornell.edu/MannUsda/aboutEmailService.do and follow the instructions to receive e-mail notices about ERS, Agricultural Marketing Service, National Agricultural Statistics Service, and World Agricultural Outlook Board products. • Receive weekly notification (on Friday afternoon) via the ERS website. Go to http://www.ers.usda.gov/subscribe-to-ers-e-newsletters.aspx and follow the instructions to receive notices about ERS outlook reports, Amber Waves magazine, and other reports and data products on specific topics. ERS also offers RSS (really simple syndication) feeds for all ERS products. Go to http://www.ers.usda.gov/rss/ to get started.
Tables
12 Oil Crops Outlook/OCS-13e/May 14, 2013
Economic Research Service, USDA
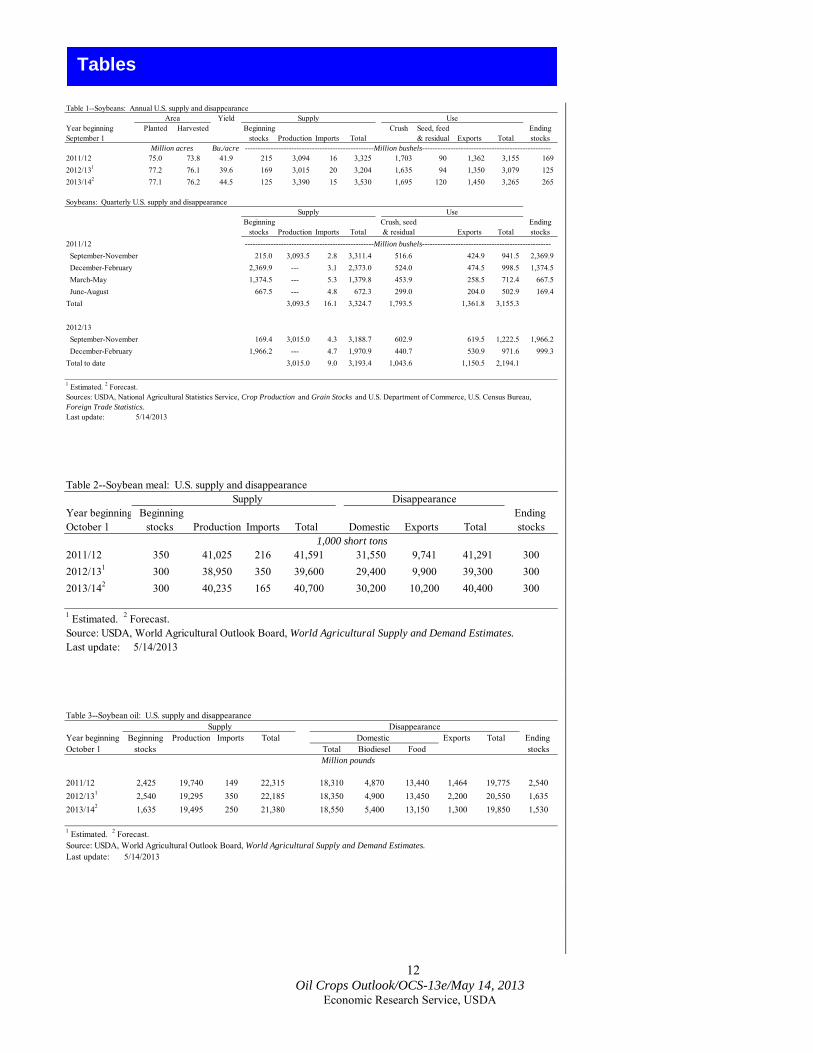
Table 1--Soybeans: Annual U.S. supply and disappearance
YieldYear beginning Planted Harvested Beginning Crush Seed, feed EndingSeptember 1 stocks Production Imports Total & residual Exports Total stocks
Bu./acre --------------------------------------------------Million bushels--------------------------------------------------2011/12 75.0 73.8 41.9 215 3,094 16 3,325 1,703 90 1,362 3,155 169 2012/131 77.2 76.1 39.6 169 3,015 20 3,204 1,635 94 1,350 3,079 125 2013/142 77.1 76.2 44.5 125 3,390 15 3,530 1,695 120 1,450 3,265 265
Soybeans: Quarterly U.S. supply and disappearance
Beginning Crush, seed Endingstocks Production Imports Total & residual Exports Total stocks
2011/12 --------------------------------------------------Million bushels-------------------------------------------------- September-November 215.0 3,093.5 2.8 3,311.4 516.6 424.9 941.5 2,369.9 December-February 2,369.9 --- 3.1 2,373.0 524.0 474.5 998.5 1,374.5 March-May 1,374.5 --- 5.3 1,379.8 453.9 258.5 712.4 667.5 June-August 667.5 --- 4.8 672.3 299.0 204.0 502.9 169.4 Total 3,093.5 16.1 3,324.7 1,793.5 1,361.8 3,155.3
2012/13 September-November 169.4 3,015.0 4.3 3,188.7 602.9 619.5 1,222.5 1,966.2 December-February 1,966.2 --- 4.7 1,970.9 440.7 530.9 971.6 999.3 Total to date 3,015.0 9.0 3,193.4 1,043.6 1,150.5 2,194.1
1 Estimated. 2 Forecast. Sources: USDA, National Agricultural Statistics Service, Crop Production and Grain Stocks and U.S. Department of Commerce, U.S. Census Bureau,Foreign Trade Statistics.Last update: 5/14/2013
Million acres
Area
Supply
Supply Use
Use
Table 2--Soybean meal: U.S. supply and disappearance
Year beginning Beginning Ending October 1 stocks Production Imports Total Domestic Exports Total stocks
2011/12 350 41,025 216 41,591 31,550 9,741 41,291 3002012/131 300 38,950 350 39,600 29,400 9,900 39,300 3002013/142 300 40,235 165 40,700 30,200 10,200 40,400 300
1 Estimated. 2 Forecast. Source: USDA, World Agricultural Outlook Board, World Agricultural Supply and Demand Estimates.Last update: 5/14/2013
Disappearance
1,000 short tons
Supply
Table 3--Soybean oil: U.S. supply and disappearance
Year beginning Beginning Production Imports Total Exports Total Ending October 1 stocks Total Biodiesel Food stocks
2011/12 2,425 19,740 149 22,315 18,310 4,870 13,440 1,464 19,775 2,5402012/131 2,540 19,295 350 22,185 18,350 4,900 13,450 2,200 20,550 1,6352013/142 1,635 19,495 250 21,380 18,550 5,400 13,150 1,300 19,850 1,530
1 Estimated. 2 Forecast.Source: USDA, World Agricultural Outlook Board, World Agricultural Supply and Demand Estimates.Last update: 5/14/2013
Million pounds
Supply DisappearanceDomestic
13 Oil Crops Outlook/OCS-13e/May 14, 2013
Economic Research Service, USDA
Table 4--Cottonseed: U.S. supply and disappearance
Year beginning Beginning Ending August 1 stocks Production Imports Total Crush Exports Other Total stocks
2011/12 618 5,370 72 6,059 2,400 133 3,097 5,629 4302012/131 430 5,666 100 6,196 2,500 175 3,029 5,704 4922013/142 492 4,870 100 5,462 2,250 150 2,662 5,062 4001 Estimated. 2 Forecast.Sources: USDA, National Agricultural Statistics Service, Crop Production and U.S. Department of Commerce,U.S. Census Bureau, Foreign Trade Statistics.
Table 5--Cottonseed meal: U.S. supply and disappearance
Year beginning Beginning Ending October 1 stocks Production Imports Total Domestic Exports Total stocks
2011/12 45 1,090 0 1,135 982 103 1,085 502012/131 50 1,125 0 1,175 1,000 125 1,125 502013/142 50 1,015 0 1,065 915 100 1,015 501 Estimated. 2 Forecast.Source: USDA, Foreign Agricultural Service, PS&D Online.
Table 6--Cottonseed oil: U.S. supply and disappearance
Year beginning Beginning Ending October 1 stocks Production Imports Total Domestic Exports Total stocks
2011/12 165 755 10 930 571 259 830 1002012/131 100 800 0 900 580 220 800 1002013/142 100 720 0 820 515 220 735 851 Estimated. 2 Forecast.Source: USDA, Foreign Agricultural Service, PS&D Online.
Table 7--Peanuts: U.S. supply and disappearanceYield
Year beginning Planted Harvested Beginning Domestic Seed & Ending August 1 stocks Production Imports Total food Crush residual Exports Total stocks
Pounds/acre
2011/12 1,141 1,081 3,386 1,516 3,659 254 5,429 2,805 604 472 545 4,425 1,0032012/131 1,638 1,608 4,192 1,003 6,741 70 7,815 2,904 665 604 1,200 5,373 2,4422013/142 1,191 1,167 3,800 2,442 4,435 65 6,942 2,985 577 460 650 4,672 2,2701 Estimated. 2 Forecast.Sources: USDA, National Agricultural Statistics Service, Crop Production and Peanut Stocks and Processing, and U.S. Department of Commerce,U.S. Census Bureau, Foreign Trade Statistics.Last update: 5/14/2013
Disappearance
Disappearance Supply
Supply
Supply Disappearance
1,000 short tons
Area
1,000 acres
Million pounds
1,000 short tons
Million pounds
Supply Disappearance

14 Oil Crops Outlook/OCS-13e/May 14, 2013
Economic Research Service, USDA
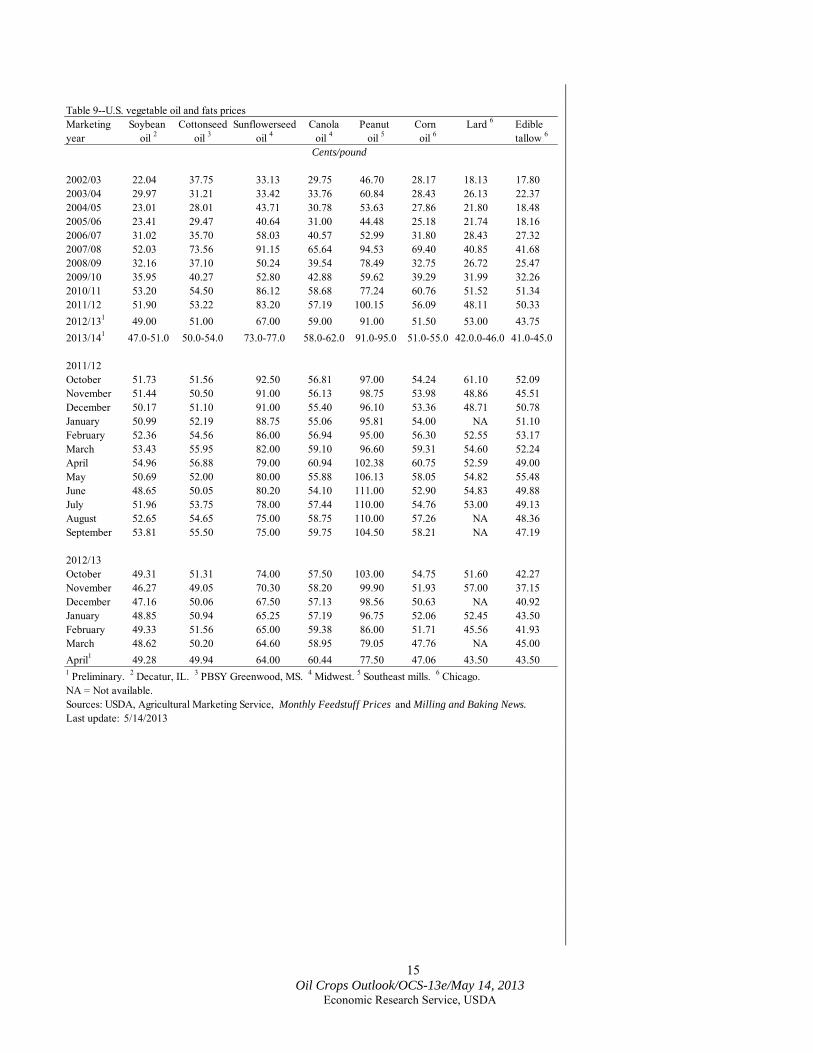
Table 8--Oilseed prices received by U.S. farmersMarketing Soybeans2 Cottonseed3 Sunflowerseed2 Canola4 Peanuts3 Flaxseed4
year$/bushel $/short ton $/cwt. $/cwt. Cents/pound $/bushel
2002/03 5.53 101.00 12.10 10.60 18.20 5.772003/04 7.34 117.00 12.10 10.60 19.30 5.882004/05 5.74 107.00 13.70 10.70 18.90 8.072005/06 5.66 96.00 12.10 9.62 17.30 5.942006/07 6.43 111.00 14.50 11.90 17.70 5.802007/08 10.10 162.00 21.70 18.30 20.50 13.002008/09 9.97 223.00 21.80 18.70 23.00 12.702009/10 9.59 158.00 15.10 16.20 21.70 8.152010/11 11.30 161.00 23.30 19.30 22.50 12.202011/12 12.50 260.00 29.10 24.00 31.80 13.902012/131 14.30 255.00 25.55 26.50 30.00 13.652013/141 9.50-11.50 145-185 22.90-26.20 21.15-25.45 19.35-22.65 12.00-14.00
2011/12 September 12.20 245.00 32.50 23.10 23.50 13.60 October 11.80 245.00 29.60 22.80 28.90 13.90 November 11.70 268.00 29.00 23.30 33.20 13.90 December 11.50 264.00 29.60 23.00 30.80 13.50 January 11.90 281.00 28.90 23.40 33.70 13.70 February 12.20 276.00 29.50 24.80 32.90 13.20 March 13.00 NA 28.80 27.10 34.80 13.30 April 13.80 NA 28.40 27.80 35.10 14.10 May 14.00 NA 27.80 27.70 33.80 14.80 June 13.90 NA 27.20 27.40 34.40 12.90 July 15.40 NA 27.00 26.60 34.50 13.30 August 16.20 235.00 28.80 25.30 30.40 13.30
2012/13 September 14.30 254.00 28.80 27.00 35.20 13.30 October 14.20 257.00 25.90 26.60 33.80 13.50 November 14.30 257.00 26.30 26.70 32.80 14.10 December 14.30 254.00 24.90 27.80 38.00 13.80 January 14.30 250.00 26.00 26.80 31.20 13.70 February 14.60 217.00 25.90 27.80 28.20 14.30 March 14.60 NA 24.60 27.30 27.70 14.40 April1 14.20 NA 25.00 27.40 26.00 14.801 Preliminary. 2 September-August. 3August-July. 4 July-June.NA = Not available. cwt.=hundredweight.Source: USDA, National Agricultural Statistics Service, Agricultural Prices. Last update: 5/14/2013
15 Oil Crops Outlook/OCS-13e/May 14, 2013
Economic Research Service, USDA
Table 9--U.S. vegetable oil and fats pricesMarketing Soybean Cottonseed Sunflowerseed Canola Peanut Corn Lard 6 Edible year oil 2 oil 3 oil 4 oil 4 oil 5 oil 6 tallow 6
2002/03 22.04 37.75 33.13 29.75 46.70 28.17 18.13 17.802003/04 29.97 31.21 33.42 33.76 60.84 28.43 26.13 22.372004/05 23.01 28.01 43.71 30.78 53.63 27.86 21.80 18.482005/06 23.41 29.47 40.64 31.00 44.48 25.18 21.74 18.162006/07 31.02 35.70 58.03 40.57 52.99 31.80 28.43 27.322007/08 52.03 73.56 91.15 65.64 94.53 69.40 40.85 41.682008/09 32.16 37.10 50.24 39.54 78.49 32.75 26.72 25.472009/10 35.95 40.27 52.80 42.88 59.62 39.29 31.99 32.262010/11 53.20 54.50 86.12 58.68 77.24 60.76 51.52 51.342011/12 51.90 53.22 83.20 57.19 100.15 56.09 48.11 50.332012/131 49.00 51.00 67.00 59.00 91.00 51.50 53.00 43.752013/141 47.0-51.0 50.0-54.0 73.0-77.0 58.0-62.0 91.0-95.0 51.0-55.0 42.0.0-46.0 41.0-45.0
2011/12October 51.73 51.56 92.50 56.81 97.00 54.24 61.10 52.09November 51.44 50.50 91.00 56.13 98.75 53.98 48.86 45.51December 50.17 51.10 91.00 55.40 96.10 53.36 48.71 50.78January 50.99 52.19 88.75 55.06 95.81 54.00 NA 51.10February 52.36 54.56 86.00 56.94 95.00 56.30 52.55 53.17March 53.43 55.95 82.00 59.10 96.60 59.31 54.60 52.24April 54.96 56.88 79.00 60.94 102.38 60.75 52.59 49.00May 50.69 52.00 80.00 55.88 106.13 58.05 54.82 55.48June 48.65 50.05 80.20 54.10 111.00 52.90 54.83 49.88July 51.96 53.75 78.00 57.44 110.00 54.76 53.00 49.13August 52.65 54.65 75.00 58.75 110.00 57.26 NA 48.36September 53.81 55.50 75.00 59.75 104.50 58.21 NA 47.19
2012/13October 49.31 51.31 74.00 57.50 103.00 54.75 51.60 42.27November 46.27 49.05 70.30 58.20 99.90 51.93 57.00 37.15December 47.16 50.06 67.50 57.13 98.56 50.63 NA 40.92January 48.85 50.94 65.25 57.19 96.75 52.06 52.45 43.50February 49.33 51.56 65.00 59.38 86.00 51.71 45.56 41.93March 48.62 50.20 64.60 58.95 79.05 47.76 NA 45.00April1 49.28 49.94 64.00 60.44 77.50 47.06 43.50 43.501 Preliminary. 2 Decatur, IL. 3 PBSY Greenwood, MS. 4 Midwest. 5 Southeast mills. 6 Chicago.NA = Not available.Sources: USDA, Agricultural Marketing Service, Monthly Feedstuff Prices and Milling and Baking News. Last update: 5/14/2013
Cents/pound
16 Oil Crops Outlook/OCS-13e/May 14, 2013
Economic Research Service, USDA
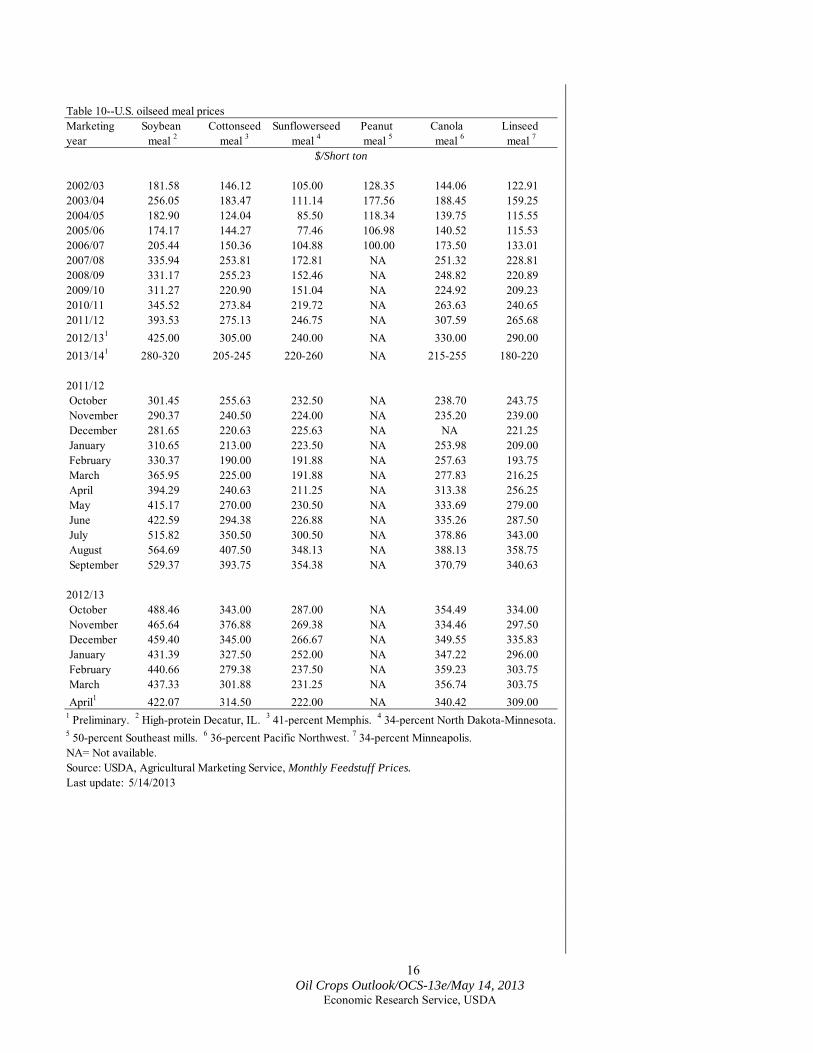
Table 10--U.S. oilseed meal prices Marketing Soybean Cottonseed Sunflowerseed Peanut Canola Linseed year meal 2 meal 3 meal 4 meal 5 meal 6 meal 7
2002/03 181.58 146.12 105.00 128.35 144.06 122.912003/04 256.05 183.47 111.14 177.56 188.45 159.252004/05 182.90 124.04 85.50 118.34 139.75 115.552005/06 174.17 144.27 77.46 106.98 140.52 115.532006/07 205.44 150.36 104.88 100.00 173.50 133.012007/08 335.94 253.81 172.81 NA 251.32 228.812008/09 331.17 255.23 152.46 NA 248.82 220.892009/10 311.27 220.90 151.04 NA 224.92 209.232010/11 345.52 273.84 219.72 NA 263.63 240.652011/12 393.53 275.13 246.75 NA 307.59 265.682012/131 425.00 305.00 240.00 NA 330.00 290.002013/141 280-320 205-245 220-260 NA 215-255 180-220
2011/12 October 301.45 255.63 232.50 NA 238.70 243.75 November 290.37 240.50 224.00 NA 235.20 239.00 December 281.65 220.63 225.63 NA NA 221.25 January 310.65 213.00 223.50 NA 253.98 209.00 February 330.37 190.00 191.88 NA 257.63 193.75 March 365.95 225.00 191.88 NA 277.83 216.25 April 394.29 240.63 211.25 NA 313.38 256.25 May 415.17 270.00 230.50 NA 333.69 279.00 June 422.59 294.38 226.88 NA 335.26 287.50 July 515.82 350.50 300.50 NA 378.86 343.00 August 564.69 407.50 348.13 NA 388.13 358.75 September 529.37 393.75 354.38 NA 370.79 340.63
2012/13 October 488.46 343.00 287.00 NA 354.49 334.00 November 465.64 376.88 269.38 NA 334.46 297.50 December 459.40 345.00 266.67 NA 349.55 335.83 January 431.39 327.50 252.00 NA 347.22 296.00 February 440.66 279.38 237.50 NA 359.23 303.75 March 437.33 301.88 231.25 NA 356.74 303.75 April1 422.07 314.50 222.00 NA 340.42 309.001 Preliminary. 2 High-protein Decatur, IL. 3 41-percent Memphis. 4 34-percent North Dakota-Minnesota.5 50-percent Southeast mills. 6 36-percent Pacific Northwest. 7 34-percent Minneapolis. NA= Not available.Source: USDA, Agricultural Marketing Service, Monthly Feedstuff Prices. Last update: 5/14/2013
$/Short ton