Embed Size (px)
Citation preview

Data Sheet
The Viavi Solutions leading Xgig product family for distributed protocol monitoring, analysis, and testing provides a unique platform offering advanced multi-protocol, multi-application, and multi-channel capabilities. Xgig is designed to help users overcome complex design challenges and accelerate development of today’s high-speed serial Storage Area Networks (SAN) and subsystems.
The Viavi Xgig Fibre Channel (FC) Analyzer and Traffic Generation products are best-of-class high-speed protocol testing tools designed specifically for storage and networking applications. The Xgig platform is a versatile and comprehensive solution for generating, testing, and analyzing live traffic across all major high-speed storage protocols. The Xgig chassis hosts up to four blades capable of testing and analyzing different protocols such as Fibre Channel, SAS/SATA, GigE, iSCSI and FCoE. Xgig is the only solution in the market that supports multiple protocols, multiple applications (analyzing, generation, and testing), and multiple data rates simultaneously on a single platform. This provides unparalleled flexibility while maximizing customer return on investment.
Xgig 8G Fibre Channel AnalyzerXgig is the industry’s first 8G Fibre Channel analyzer. Expanding upon the current Xgig FC analyzer’s capabilities, it is a critical tool for engineers developing and troubleshooting components and systems that involve FC and the Upper Layer Protocols(ULP) such as FCP, IPFC, FICON, SCSI and FC-AE.
Key Features
y Time-sync of up to 64 channels’ traffic
y Support 1.065, 2.125, 4.25, and 8.5 Gb/s Fibre Channel
y Scrambling on/off
y 4-port configuration
y Mutli-function blade: Analyzer, Jammer, BERT, Load Tester, Generator
y Deep 2GB trace memory buffer
Xgig® 8G Fibre Channel AnalyzerHigh-Performance Protocol Analysis for 1.065, 2.125, 4.25, and 8.5 Gb/s Fibre Channel
Cascading of multiple blade chassis allows high density time synchronous domains.
Modular blade technology allows quick reconfiguration of chassis.

2 Xgig 8G Fibre Channel Analyzer
Client software features include:
y Internal and external cross triggering
y Arm-sharing across all types of ports in a link
y Powerful trace filtering and searching
y Maximum number of time-synchronized channels
y Industry’s highest time stamp resolution (5 ns)
y Tx/Rx optical power reading
y Support for the most new specification on the 8G FC standard, such as ARB(ff) decode and Expert support
Key features on hardware include:
y Industry’s most powerful trace capture: 100% capturing at any line rate up to the maximum data rate of 8.5 Gb/s backed by the largest trace buffer in the industry with 2 GB per SFP port
y Backwards Compatibility: the new 8G FC mutli-function blade has the same form factor as the previous 4G FC blade and captures/analyzes 1.065, 2.125, and 4.25 Gb/s FC traffic as well
y Scrambling: Support for scrambling in hardware for 1.065, 2.125, 4.25 and 8.5 Gb/s data rates. To simplify comparisons, scrambling can be easily turned on or off with a single click
y SFP Support: The 4-port 8G FC blade is SFP+ plug-in ready. SPF+ is the MSA form factor for 8G FC transceivers
y Multiple Data Tapping Methods: Two data tapping methods provide options of nominal signal quality impact and data stream clean-up
y Multi-functional: Each blade can be served as a protocol analyzer, Jammer, BERT, and other traffic generation functions through simple software configuration, without changing hardware
y Cascadable: Multiple Xgig systems can be cascaded together to group up to 64 time-synchronized ports for comprehensive system analysis and testing
AnalysisThe Xgig analysis system streamlines resolution of events that cause performance impairments and enables users to design, implement, test, and evaluate FC components and subsystems.
This integrated suite of software includes TraceControl, Performance Monitor, TraceView, and Expert.
TraceControl
Comprehensive traffic library u with pre-defined and user-defined FC templates for frames, ordered sets, and errors (see Figure 1) determines the specific conditions and sequences under which trace capture occurs.
Choice of signal regeneration method determines impact on signal quality.
Multi-level trigger events enable users either to start capturing immediately or to wait for a specific network traffic condition to occur before beginning a capture based on operating conditions including timeouts, missing events, and specific memory conditions.
Figure 1: Xgig Trace Control
u
Figure 2: Xgig Performance Monitor
3 Xgig 8G Fibre Channel Analyzer
Arm-sharing covers all ports within a specific link and chassis. Arm and rollback signals are distributed between configurable ports within a link, and all ports in a domain share the arm state. Up to eight such links can be defined within a chassis.
Pre-filtering permits selective capture, enabling users to avoid verbose event capture and conserves buffer space
Manual link speed control is easily controlled .
Scrambling for 1.065, 2.125, 4.25 and 8.5 Gb/s traffic can also be turned on or off within the link speed control window.
The default setting for 1.065, 2.125, and 4.25 Gb/s FC traffic is scrambling off; the default for 8.5 Gb/s traffic is scrambling on.
SFP monitoring is a unique feature of the Xgig analyzer, providing instantaneous information on the status of the physical transmission layer. By utilizing digital diagnosis, TraceControl can show the live optical power reading of the SFP TX/RX inside the blade, as well as the SFP make and model number.
Domains (sets of port pairs) can be defined within a single chassis (intra-chassis) or across multiple, concatenated chassis (inter-chassis). 32 domains can be simultaneously capturing on a 64 port sync group. Multiple domains provide great flexibility in using Xgig ports, allowing for efficient support of multiple Xgig users.
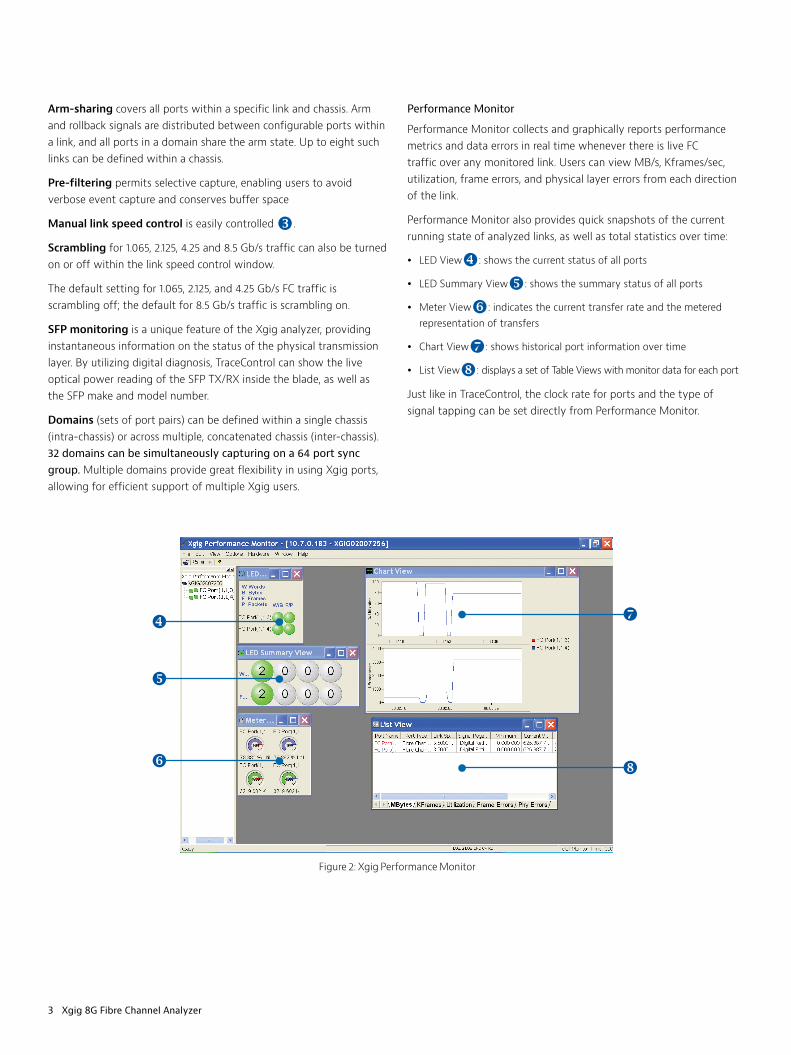
Performance Monitor
Performance Monitor collects and graphically reports performance metrics and data errors in real time whenever there is live FC traffic over any monitored link. Users can view MB/s, Kframes/sec, utilization, frame errors, and physical layer errors from each direction of the link.
Performance Monitor also provides quick snapshots of the current running state of analyzed links, as well as total statistics over time:
y LED View: shows the current status of all ports
y LED Summary View: shows the summary status of all ports
y Meter View: indicates the current transfer rate and the metered representation of transfers
y Chart View: shows historical port information over time
y List View: displays a set of Table Views with monitor data for each port
Just like in TraceControl, the clock rate for ports and the type of signal tapping can be set directly from Performance Monitor.
Figure 2: Xgig Performance Monitor

4 Xgig 8G Fibre Channel Analyzer
TraceView
TraceView (see Figure 3) is a powerful tool that provides a comprehensive display of FC data traffic. The default view resembles a spreadsheet, where each trace event is shown as a row and the interpretation of the captured data for each event is displayed in columns. Unlike the competition’s viewing software, TraceView’s spreadsheet is 100% configurable, allowing users to customize views by adding or removing any protocol field as a TraceView column.
Data Inspector, located below the spreadsheet display, offers a detailed interpretation of the raw data of events on the left side. A new event can be selected in the spreadsheet display to change the event displayed in the Data Inspector pane. The right side of the Data Inspector pane shows the hexadecimal values for the event and their ASCII or EBCDIC representations.
The hexadecimal area can be resized for a display of anywhere between four and 32 bytes of data per line.
Figure 3. TraceView
Three views of event data are available, including an 8/10 bit data view and a protocol tree view } .
Dword View allows the viewing of trace data in a Double Word format. This view is especially useful for Dword-oriented protocols such as SAS/SATA.
Built-in Histogram Capabilities ~ represent the entire trace from start to end. The trace can be expanded or collapsed to focus upon a detailed portion of the trace. Bookmarks allow locations to be marked for reference and quick access.
Patented Search and Filter Capabilities (see Figure 4), viewed by many as the best available in the industry, enables users to search and filter any field value or string in the entire capture with as few as 2 to 5 clicks.
Figure 4. TraceView power search/filter features
5 Xgig 8G Fibre Channel Analyzer
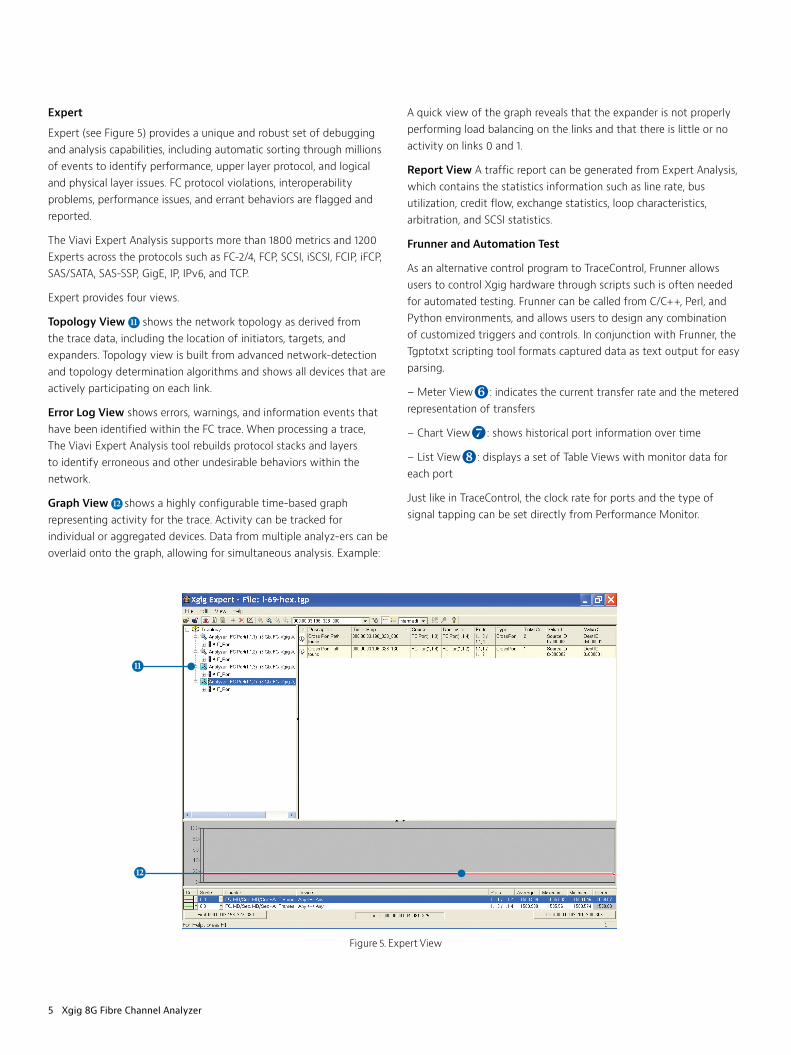
Expert
Expert (see Figure 5) provides a unique and robust set of debugging and analysis capabilities, including automatic sorting through millions of events to identify performance, upper layer protocol, and logical and physical layer issues. FC protocol violations, interoperability problems, performance issues, and errant behaviors are flagged and reported.
The Viavi Expert Analysis supports more than 1800 metrics and 1200 Experts across the protocols such as FC-2/4, FCP, SCSI, iSCSI, FCIP, iFCP, SAS/SATA, SAS-SSP, GigE, IP, IPv6, and TCP.
Expert provides four views.
Topology View shows the network topology as derived from the trace data, including the location of initiators, targets, and expanders. Topology view is built from advanced network-detection and topology determination algorithms and shows all devices that are actively participating on each link.
Error Log View shows errors, warnings, and information events that have been identified within the FC trace. When processing a trace, The Viavi Expert Analysis tool rebuilds protocol stacks and layers to identify erroneous and other undesirable behaviors within the network.
Graph View shows a highly configurable time-based graph representing activity for the trace. Activity can be tracked for individual or aggregated devices. Data from multiple analyz-ers can be overlaid onto the graph, allowing for simultaneous analysis. Example:
A quick view of the graph reveals that the expander is not properly performing load balancing on the links and that there is little or no activity on links 0 and 1.
Report View A traffic report can be generated from Expert Analysis, which contains the statistics information such as line rate, bus utilization, credit flow, exchange statistics, loop characteristics, arbitration, and SCSI statistics.
Frunner and Automation Test
As an alternative control program to TraceControl, Frunner allows users to control Xgig hardware through scripts such is often needed for automated testing. Frunner can be called from C/C++, Perl, and Python environments, and allows users to design any combination of customized triggers and controls. In conjunction with Frunner, the Tgptotxt scripting tool formats captured data as text output for easy parsing.
– Meter View: indicates the current transfer rate and the metered representation of transfers
– Chart View: shows historical port information over time
– List View: displays a set of Table Views with monitor data for each port
Just like in TraceControl, the clock rate for ports and the type of signal tapping can be set directly from Performance Monitor.
Figure 5. Expert View

© 2015 Viavi Solutions, Inc. Product specifications and descriptions in this document are subject to change without notice. xgig8gfcanalyzer-ds-san-tm-ae 30162790 900 0709
Contact Us +1 844 GO VIAVI (+1 844 468 4284)
To reach the Viavi office nearest you, visit viavisolutions.com/contacts.
viavisolutions.com
Specifications
Mechanical
Dimensions Length: 11.5 inches (292 mm)Width: 6.125 inches (156 mm)Weight: .9 lbs (.5 kg)
Indicators Indicators (Green, Yellow, Off)In Use, Link, LED x (application specific), LED y (application specific)
Connectors 4 SFP+ connectors
Minimum System Requirements
y Windows 2000, Windows 2003, Windows XP or Windows Vista Ultimate/Business (32-bit) operating systems
y Small Configuration (sync group of up to 16 ports): Pentium III 800 MHz; 512 MB RAM min/1 GB preferred, 40 GB disk space, 100/1000 Mb/s Ethernet
y Large Configuration (sync group of over 16 ports): Pentium 4 with 2 GHz or faster processor; 1 GB RAM min/2GB RAM supported; 60 GB disk space; 1000 Mb/s Ethernet
Trace Buffer Size
Maximum 2 GB per port/ 8 GB per blade
Protocol Support
1.0625, 2.125, 4.25, and 8.5 Gb/s Fibre Channel
Software Features
Trace Control y Most complete trigger library y Scrambling on/off at 1.065, 2.125, 4.25 and 8.5 Gb/s
y SFP Tx/Rx optical power reading y Automation support
Trace View y 100% configurable spreadsheet y Powerful trace filter/search schemes y Customizable graphic decode support
Performance Monitor
y Live traffic monitoring and statistics y Extensive views
Expert y More than 1800 metrics library and error conditions
y More than 100 protocol supports y Extensive views

![ACFrOgAStUpMFluPysB8FdDlkQUgMN6eW88dF5vliMy41EiBXLWIC ... · 8g]lhodqlhxf]qlrpqdelh * frlqirupdfml]zurwqhmgrw\f] fhmsrsudzqr fllfkz\srzlhg]l 8g]lhodqlhxf]qlrpqdelh * frlqirupdfml]zurwqhmgrw\f]](https://img.dokumen.tips/doc/110x75/606c76644e6b9b250a07c37a/acfrogastupmflupysb8fddlkqugmn6ew88df5vlimy41eibxlwic-8glhodqlhxfqlrpqdelh.jpg)