Embed Size (px)
Citation preview

XBRL J
www.pwc.com
XBRL Japan
Standardize to Enhance: Process & Standardize to Enhance: Process & Controls, Analytical Insights, Economics
October 1, 2013

Discussion Topicsp
Trends
- Around the World
- Implications
- Analytical Insights
- Lessons Learned
Standardize to Empower Reporting Professionals: - Enhancing Reporting Process & Controls Agility, Effectiveness, Economics
Next Steps
PwC 2

TrendsTrends
PwC 3

Examples of More Granular Transparency / Insightsp f p y / g
“A comparison of Income, Revenue, and Taxes of p , ,various companies”
“Visual template representation - a comparison of unremitted taxes based on earnings made overseas”
“XBRL Data in Use - Accumulated values of key items”
PwC 4

Open Analytics at ACRA in Singaporep y g pEnhancing Analysis of Business Reports
PwC 5

Adoption is accelerating around the Worldp g
PwC 6

XBRL Around the World: Latin America
Panama – Banking Supervision
Brazil National Treasury: PublicPeru – Banking
Columbia (in development)
Brazil National Treasury: Public Sector Accounting and Fiscal Information System - 2014
gSupervision and Securities Regulation
Chile – Corporate Reporting and Uruguay – Central BankInsurance Regulation
Uruguay Central Bank(in development
Argentina – Central Bank
PwC 7
(in development)

XBRL Around the World: Europe
Finland – SBR (2014)Norway – Oslo Stock Exchange
p
Sweden
Belgium
D k
Lithuania
UK HMRC
Ireland Customs
Netherlands - SBR
Germany
Denmark
House
France – Central Bank Ukraine – Corporate
(
Poland – National Bank
Reporting (in development)
Spain
Switzerland
PwC 8
Turkey – SBR (2014)ItalyLuxembourg
Spain

XBRL Around the World: EU
Solvency IISolvency II
Basel II
Business Registers
CRD IV
PwC 9

XBRL Around the World: Asia and Oceana
China
Japan
Singapore
ThailandUAE
Korea
Singapore
Australia
India Indonesia Malaysia
Saudi Arabia
PwC 10
India Indonesia

Trends
‘Big Data’Migration from unstructured to structured information accelerating; driven largely Migration from unstructured to structured information accelerating; driven largely by economics and transparency demandExpansion of existing programs (e.g. Australia, Japan, Singapore, etc.)New regulatory territory adoption (e.g. Brazil, Malaysia, Russia, Saudi Arabia, etc.)New egu ato y te to y adopt o (e.g. a , a ays a, uss a, Saud ab a, etc.)New disclosure areas (e.g. Solvency II, CDR, WICI, CSR/GRI, Corp Actions, etc.)Assurance mandates on XBRL reports increasing (e.g. Netherlands, India, etc.)Alignment with other relevant standards (e g LEI RIXML ISO etc )Alignment with other relevant standards (e.g. LEI, RIXML, ISO, etc.)Internal applications at GL and sub-ledgers (e.g. Data Act, Brazil, companies, etc.)Emergence of new enabling software
P d i / Di l M / M iProduction / Disclosure Management / MappingConsumption / analytical applications
Standardized analytics enable collaboration among analysts / persistent analysis
PwC 11
And then there is the next thing.

Corp Actions – closing gap between Issuer & Investorp g g p
INVESTOR
LAWYERS, ADVISORS, LEAD MANAGERS, REGISTRARS, TRANSFER/FILING/INFORMATION/PUBLICATION AGENTS
REGULATORS, SHARE REGISTER, ANALYTICS COMPANY
ISSUERINVESTOR
FUND MANAGERS, FUND ADVISORS, INVESTMENT
EXCHANGE, WIRE SERVICES,
REFERENCE & TRADING DATA SERVICES
PwC 12
CENTRAL DEPOSITORY, CUSTODIANS, SUB‐CUSTODIANS, GLOBAL
CUSTODIANS, BROKER‐DEALERS
MANAGER INSTITUTION,
OFFSHORE INVESTORS

Standardization enhances Analytics (Social Analytics)y ( y )
Standardized Data, Formulas/Models, Relationships, Presentations
Deeper levels of analysis and insights as more data is immediately ‘reusable’
Enables collaboration by analysts on models (‘YouTube’ for modeling)
Shift in Time / Resources applied to:Accessing dataAccessing dataInputting data into analytical Inputting data into analytical applicationsapplicationsp g yp g y ppppCorrecting validation and input errorsCorrecting validation and input errorsPerforming analyticsPerforming analyticsAnalyzing analytical resultsAsking followAsking follow up questionsup questions
Migration from manual data lifting to intellectual efforts
Asking followAsking follow--up questionsup questionsAnalyzing answers to questionsMaking decisions
PwC 13

US SEC’s Analytics have been Standardized & Improvedy p
Here are examples of how the SEC has used standardized data and standardized analytics to enhance their risk assessment capabilities.
PwC 14

Explicit Demand from Investorsp f
SIFMA Members
CFA Institute “The Irreversible Trend toward Greater Connectivity and Data in Financial Reporting”Recommendation: “The SEC should move forward with its 21st Century Disclosure
PwC 15
forward with its 21st Century Disclosure Project”

Examples of Poor Report Qualityp f p Q y
Examples of Report Quality Issues in Company Reports (2012 10ks):
Type XBRL Report CorrectFact Problem UFE $4 3B UFE $17 2B
"Quality means doing it right when no one is looking." – Henry Ford.
Fact Problem UFE $4.3B UFE $17.2BFact Problem Settlements -77910000 (dr) Settlements 77910000 (dr)Fact Problem Public Float $6.3 Quintillion
(17 zeros)Public Float $6.3B
(17 zeros)Fact Problem Accumulated
Amortization - $28.5B (cr)Accumulated Amortization $28.5B (cr)
Extension xxx Cash and Cash US GAAP Term: Cash andExtension Problem
xxx.Cash and Cash Equivalents
US GAAP Term: Cash and Cash Equivalents
Report Problem Net Cash Provided by Ops of $1 3B
Net Cash Provided by Opsof $1 0B
PwC 16
$1.3B of $1.0B

Learning’sg
Few like change / uncertaintyPerceptions drive reality – “No one is going to buy anything over the Internet”Perceptions drive reality No one is going to buy anything over the InternetRegulatory Mandate (Bad) …………… OR ……………. Supply Chain Standard (Good)Implementation approach dictates initial cost/benefit – perception
Bolt on adds cost/time OR Build in reduces cost/timeBolt-on adds cost/time………….OR ……………Build-in reduces cost/timeReview procedures need to address structures (not just presentation)
Process changes (and related benefits) follow the “Bell Curve”I d d fInvestor demand for
Structured disclosures is strongReport quality is high; however, actual report quality is poor
Enabling software Critical to benefit realization; most still early stage but maturingDevelopment based upon customer demand/request
PwC 17
There are many more supply chain applications (e.g. Corporate Actions, WICI, etc.) that are now emerging

Empowering Reporting ProfessionalsEmpowering Reporting Professionals
PwC 18

Perspective Question: What software application is p Q f ppmost commonly used by companies for reporting?
1 SAP1. SAP2. Oracle3. Hyperion4. Fujitsu5. BAAN6. IBM Cognos6. IBM Cognos7. JD Edwards8. Microsoft Dynamics
Offi9. Office
PwC 19

Common Report Assembly Manual Processesp y
While companies have significant investments in ERP and consolidation application, the ‘last mile’ of report assembly and review pp , p yprocesses and controls are highly manual. ‘Last Mile’ process steps that are commonly manual include:• Spreadsheet Aggregation p gg g• Report Assembly from disparate sources• Report Validation
N ti T t G ti• Narrative Text Generation• Review Processes via emailing of Office docs• Benchmarking / Peer & Best Practice Assessments• References from disclosures to relevant standards, regulations, key
accounting policies & memos• Tagging of completed reports with XBRL taxonomy elements
PwC 20
Tagging of completed reports with XBRL taxonomy elements
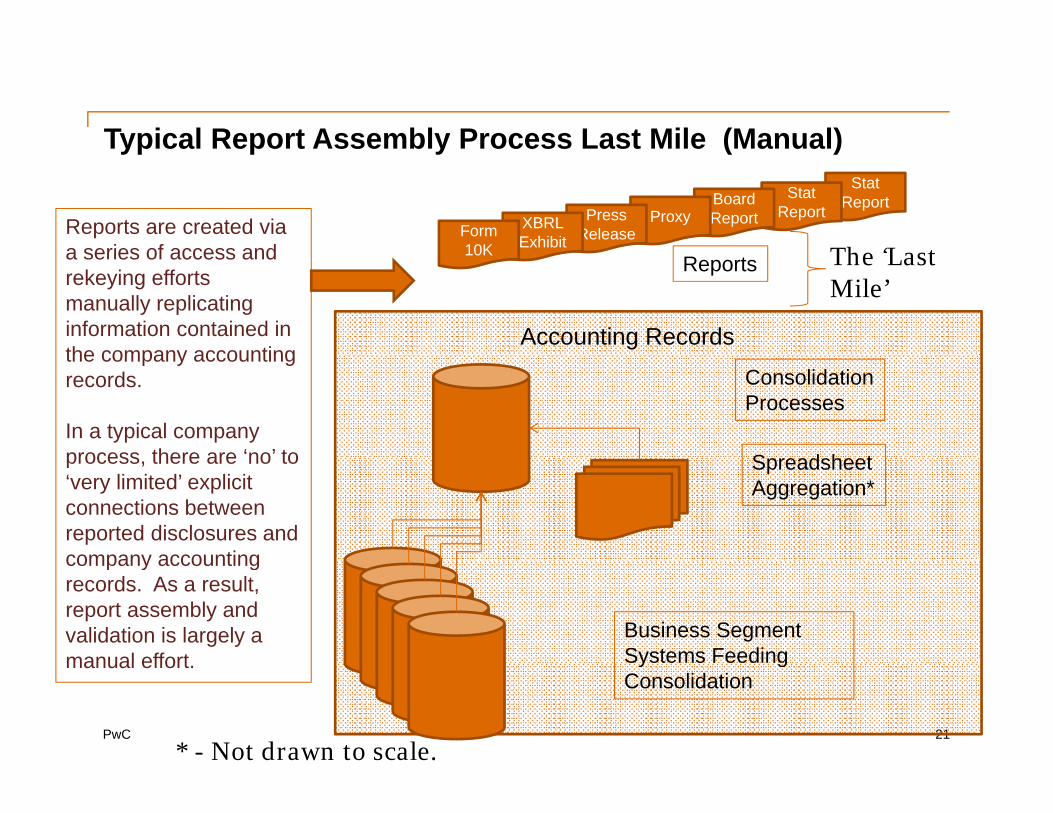
Typical Report Assembly Process Last Mile (Manual)Stat
ReportStat Report
Reports are created via a series of access and
Board ReportProxyPress
ReleaseXBRL Exhibit
Form 10K
yp p y ( )
The ‘Last Reports
Accounting Records
a series of access and rekeying efforts manually replicating information contained in the company accounting
10K The Last Mile’
ConsolidationProcesses
S d h t
the company accounting records.
In a typical company process there are ‘no’ to Spreadsheet
Aggregation*process, there are no to ‘very limited’ explicit connections between reported disclosures and company accounting
Business Segment Systems Feeding
company accounting records. As a result, report assembly and validation is largely a manual effort
PwC 21
y gConsolidation
manual effort.
* - Not drawn to scale.

Typical Report Assembly Process Last Mile (Manual)Stat
ReportStat Report
Reports are created via a series of access and
Board ReportProxyPress
ReleaseXBRL Exhibit
Form 10K
yp p y ( )
Reports
Accounting Records
a series of access and rekeying efforts manually replicating information contained in the company accounting
10K
ConsolidationProcesses
S d h t
the company accounting records.
In a typical company process there are ‘no’ to Spreadsheet
Aggregation*process, there are no to ‘very limited’ explicit connections between reported disclosures and company accounting
Business Segment Systems Feeding
company accounting records. As a result, report assembly and validation is largely a manual effort
PwC 22
y gConsolidation
manual effort.
* - Not drawn to scale.

スライド 22
RMW2 this is the same as the prior slide; just with the excel worksheets expanded for effect.R M Willis, 2013/09/27

Outsourcing may be common: But control is importantg y p
$19B$19B
"Earlier this morning RR Donnelley, the financial printer, informed us that they h d f l d d f h h hhad filed our draft 8K earnings statement without authorization. We have ceased trading on NASDAQ while we work to finalize the document. Once it's finalized we will release our earnings, resume trading on NASDAQ and hold our earnings call as normal at 1:30 PM PT," the company said.
PwC 23
earnings call as normal at 1:30 PM PT, the company said.

Many CFO’s Moving to Build – in XBRLy g
60 00%
70.00%
Bowne / RR DONNELLEYAnd the market share decline over the past 2 years for the major
40.00%
50.00%
60.00% years for the major outsourcing vendor reflects this transition.
20.00%
30.00% RR DONNELLEY
0.00%
10.00%
q1 q2 q3 q4 q1 q2 q3 q4
PwC 24
2011 2011 2011 2011 2012 2012 2012 2012

Transition to ‘built-in’ approach ppLowers Cost/time while enhancing control
There is a history lesson here for financial executives with respect to supply chain standardization: Almost 40 years ago, grocery store managers initially had inventory clerks apply the UPC/bar code to products when they stocked the shelves (at the very end of the supply h i ) Thi l ‘b l ’ d f h l h i h chain). This manual ‘bolt-on’ end of the supply chain approach gave
way to the automated application of the UPC/bar code at the very beginning of the supply chain; thereby enabling automation of inventory management sales processes and consumer buying pattern inventory management, sales processes, and consumer buying pattern insights and a $17B annual cost reductions. Financial Executives may follow a similar path via the adoption of XBRL initially bolting on to existing manual processes and XBRL initially bolting-on to existing manual processes and subsequently targeting the broad range of highly manual report assembly and review processes and controls outlined on the earlier slide
PwC 25
slide.

Disclosure Management – Streamlining the Last Mile
Stat ReportStat
ReportMapping relationships between company report writer systems
New Relationships
Board ReportProxyPress
ReleaseXBRL Form
g g
p y p yand the company report are explicit and access, reuse and some validation processes are automated within the built-in
Accounting Records
ReleaseExhibitForm 10K Reports
application. These explicit relationships now can exist between source system accounting records and
Disclosure Management Apps
ConsolidationProcesses
Spreadsheet
gcompany reports.
Disclosure Management process controls are critical and Spreadsheet
Aggregation
Business Segment
process controls are critical and may include: application access controls; control over mappings (both incoming and outgoing); log of changes; report
PwC 26
Business Segment Systems Feeding Consolidation
log of changes; report versioning controls and audit trail; and others.

Disclosure Management Process Enhancementsg
‘Last Mile’ process steps that are automated and streamlined via effective Disclosure Management application implementation include:
• Spreadsheet Assembly is automated ‘pulling’ data from disparate source systems
• Report Assembly (& updating) is automated pulling data from disparate tsystems
• Report Validation is built into the DM application• Some Narrative Text Generation is automated
25% to 50% cost and time enhancements
• Review Processes are collaborative and provide a ‘topical’ view• Benchmarking / Peer & Best Practice Assessments are automatically loaded in
context of the company disclosures (e.g. Income taxes)• References explicitly link from reporting concepts to standards, regulations,
key accounting memos, and company policies• Virtual Reporting Service Center useful across all reporting types
PwC 27
• XBRL Reports are a by-product of report assembly and review

Disclosure Management Articlesg
“Disclosure Management: Streamlining the Last Mile” -Outlines general process enhancements enabledg p
“How to Differentiate Disclosure Management Features”
“Grocery Store Managers & Financial Executives: Bolt-on or Built-in to Realize Process Benefits?”
PwC 28

Next StepsNext Steps
PwC 29

Next Steps for Producersp f
Enhance review of report structures to ensure report quality
Use Disclosure Management to Standardize Reporting Processes & Controls- Apply the standardized reporting processes & controls across all content silos
(e.g. Company reports, Corp Actions, IR, Internal, etc.)(e.g. Co pa y epo ts, Co p ct o s, , te a , etc.)- Migrate reporting content silos towards a Virtual Service Center- Use Disclosure Management to enable process effectiveness and
Prioritize internal ERP instances for Standardization to enhance internal transparency
‘Robocop’ for your internal GRC IA BI WICI etcRobocop for your internal GRC, IA, BI, WICI, etc.
PwC 30

Next Steps for Consumersp f
Communicate demand for high quality structured disclosures
Use freely available granular disclosures to enhance:- Timeliness / persistence of analysis
Insights from more granular analysis- Insights from more granular analysis- Number of companies analyzed- Cost of analysis
Standardize formulas / models to enhance: - Institutional management of analytical intellectual property- Institutional transparency of how, where and when analytics are applied
PwC 31

Thank youThank you
This publication has been prepared for general guidance on matters of interest only, and does i f i l d i Y h ld h i f i i d i hi not constitute professional advice. You should not act upon the information contained in this
publication without obtaining specific professional advice. No representation or warranty (express or implied) is given as to the accuracy or completeness of the information contained in this publication, and, to the extent permitted by law, PwC, its members, employees and agents do not accept or assume any liability, responsibility or duty of care for any consequences of you or anyone else acting, or refraining to act, in reliance on the information
t i d i thi bli ti f d i i b d it contained in this publication or for any decision based on it.
© 2013. All rights reserved. In this document, “PwC” refers to PricewaterhouseCoopers LLP which is a member firm of PricewaterhouseCoopers International Limited, each member firm of which is a separate legal entity.