Embed Size (px)
Citation preview
World Small HydropoWer development report 2013
www.smallhydroworld.org
EASTERN AFRICA

Published in 2013 by United Nations Industrial Development Organization (UNIDO) and International Center on Small Hydro Power (ICSHP).
2013 © UNIDO and ICSHP
All rights reserved
This report was jointly produced by United Nations Industrial Development Organization (UNIDO) and International Center on Small Hydro Power (ICSHP) to provide information about small hydropower. The document has been produced without formal United Nations editing. The designations employed and the presentations of the material in this document do not imply the expression of any opinion whatsoever on the part of the Secretariat of UNIDO and ICSHP concerning the legal status of any country, territory, city or area or of its authorities, or concerning the delimitation of its frontiers or boundaries, or its economic system or degree of development. Designations such as “developed”, “industrialized” and “developing” are intended for statistical convenience and do not necessarily express a judgement about the stage reached by a particular country or area in the development process: Mention of firm names or commercial products does not constitute an endorsement by UNIDO or its partners. The opinions, statistical data and estimates contained in the articles are the responsibility of the author(s) and should not necessarily be considered as reflecting the views or bearing the endorsement of UNIDO and its partners.
While every care has been taken to ensure that the content is useful and accurate, UNIDO and ICSHP and any contributing third parties shall have no legal liability or responsibility for the content or the accuracy of the information so provided, or for any loss or damage caused arising directly or indirectly in connection with reliance on the use of such information.
Copyright: Material in this publication may be freely quoted or reprinted, but acknowledgement is requested, together with a copy of the publication containing the quotation or reprint.
Recommended citation: Liu, H., Masera, D. and Esser, L., eds. (2013). World Small Hydropower Development Report 2013. United Nations Industrial Development Organization; International Center on Small Hydro Power. Available from www.smallhydroworld.org.
Disclaimer
14
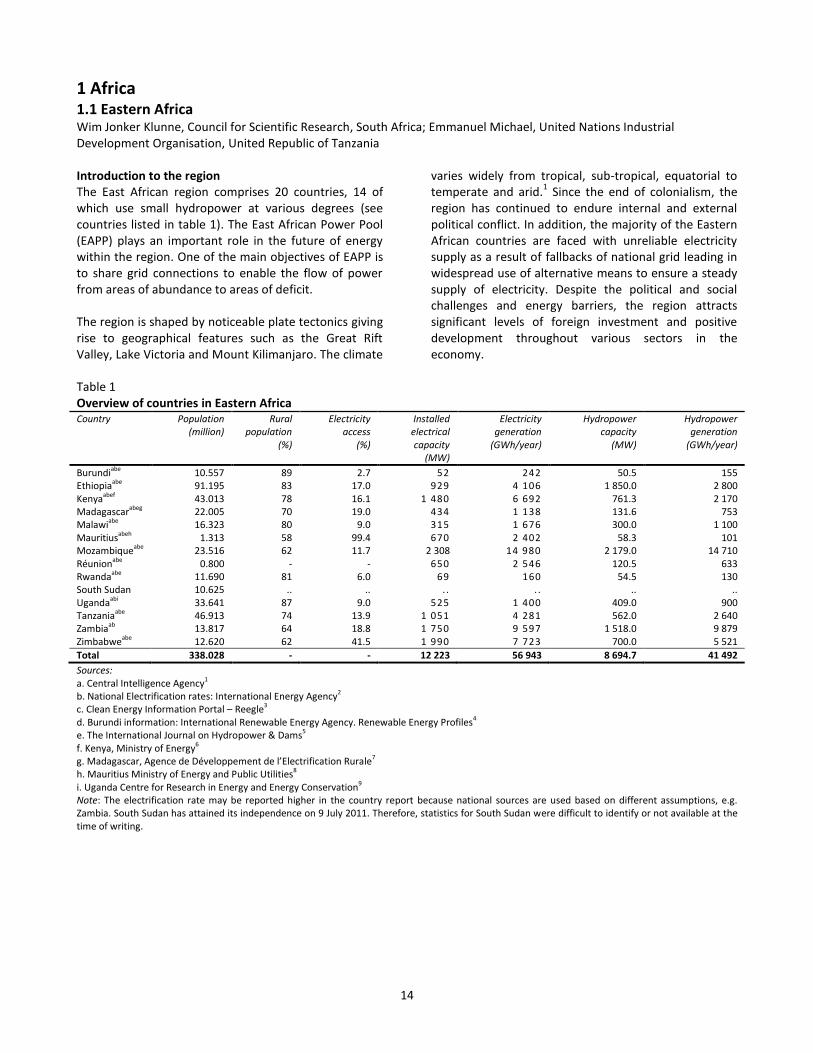
1 Africa 1.1 Eastern Africa Wim Jonker Klunne, Council for Scientific Research, South Africa; Emmanuel Michael, United Nations Industrial Development Organisation, United Republic of Tanzania Introduction to the region The East African region comprises 20 countries, 14 of which use small hydropower at various degrees (see countries listed in table 1). The East African Power Pool (EAPP) plays an important role in the future of energy within the region. One of the main objectives of EAPP is to share grid connections to enable the flow of power from areas of abundance to areas of deficit. The region is shaped by noticeable plate tectonics giving rise to geographical features such as the Great Rift Valley, Lake Victoria and Mount Kilimanjaro. The climate
varies widely from tropical, sub-tropical, equatorial to temperate and arid.
1 Since the end of colonialism, the
region has continued to endure internal and external political conflict. In addition, the majority of the Eastern African countries are faced with unreliable electricity supply as a result of fallbacks of national grid leading in widespread use of alternative means to ensure a steady supply of electricity. Despite the political and social challenges and energy barriers, the region attracts significant levels of foreign investment and positive development throughout various sectors in the economy.
Table 1 Overview of countries in Eastern Africa Country Population
(million) Rural
population (%)
Electricity access
(%)
Installed electrical capacity
(MW)
Electricity generation
(GWh/year)
Hydropower capacity
(MW)
Hydropower generation
(GWh/year)
Burundiabe 10.557 89 2.7 52 242 50.5 155 Ethiopiaabe 91.195 83 17.0 929 4 106 1 850.0 2 800 Kenyaabef 43.013 78 16.1 1 480 6 692 761.3 2 170 Madagascarabeg 22.005 70 19.0 434 1 138 131.6 753 Malawiabe 16.323 80 9.0 315 1 676 300.0 1 100 Mauritiusabeh 1.313 58 99.4 670 2 402 58.3 101 Mozambiqueabe 23.516 62 11.7 2 308 14 980 2 179.0 14 710 Réunionabe 0.800 - - 650 2 546 120.5 633 Rwandaabe 11.690 81 6.0 69 160 54.5 130 South Sudan 10.625 .. .. . . . . .. .. Ugandaabi 33.641 87 9.0 525 1 400 409.0 900 Tanzaniaabe 46.913 74 13.9 1 051 4 281 562.0 2 640 Zambiaab 13.817 64 18.8 1 750 9 597 1 518.0 9 879 Zimbabweabe 12.620 62 41.5 1 990 7 723 700.0 5 521
Total 338.028 - - 12 223 56 943 8 694.7 41 492
Sources: a. Central Intelligence Agency1 b. National Electrification rates: International Energy Agency2 c. Clean Energy Information Portal – Reegle3 d. Burundi information: International Renewable Energy Agency. Renewable Energy Profiles4 e. The International Journal on Hydropower & Dams5 f. Kenya, Ministry of Energy6 g. Madagascar, Agence de Développement de l’Electrification Rurale7 h. Mauritius Ministry of Energy and Public Utilities8 i. Uganda Centre for Research in Energy and Energy Conservation9 Note: The electrification rate may be reported higher in the country report because national sources are used based on different assumptions, e.g. Zambia. South Sudan has attained its independence on 9 July 2011. Therefore, statistics for South Sudan were difficult to identify or not available at the time of writing.
15
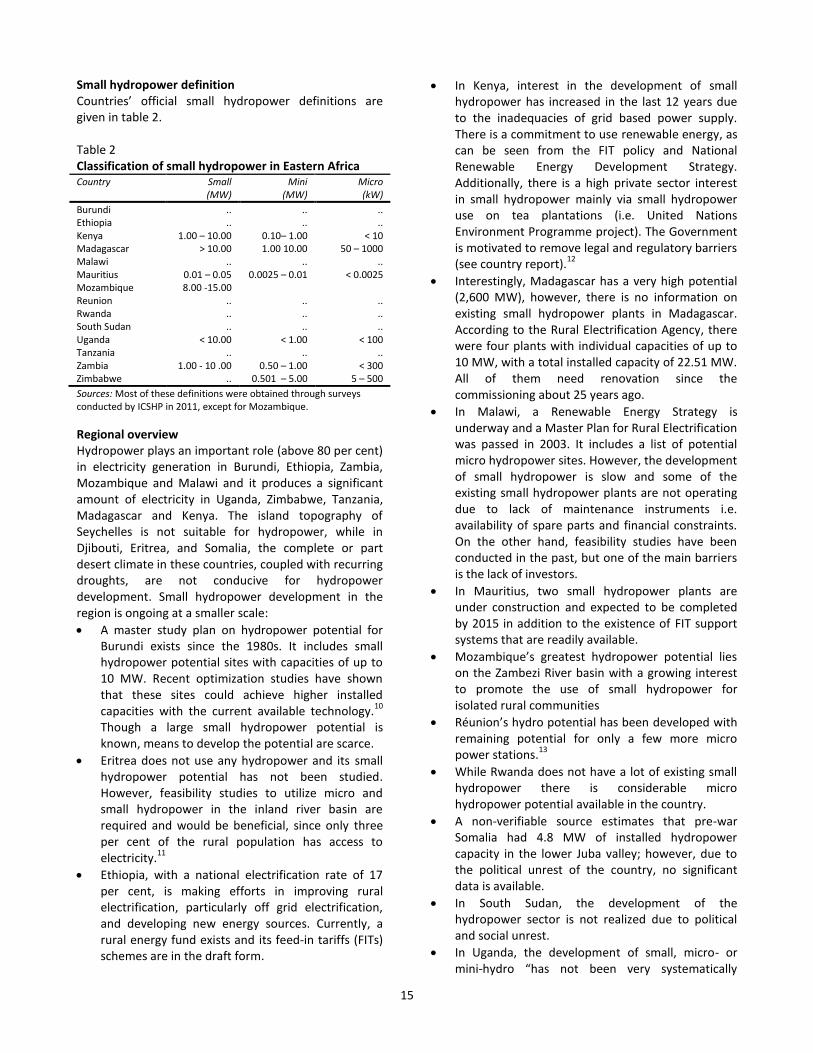
Small hydropower definition Countries’ official small hydropower definitions are given in table 2. Table 2 Classification of small hydropower in Eastern Africa Country Small
(MW) Mini
(MW) Micro (kW)
Burundi .. .. .. Ethiopia .. .. .. Kenya 1.00 – 10.00 0.10– 1.00 < 10 Madagascar > 10.00 1.00 10.00 50 – 1000 Malawi .. .. .. Mauritius 0.01 – 0.05 0.0025 – 0.01 < 0.0025 Mozambique 8.00 -15.00 Reunion .. .. .. Rwanda .. .. .. South Sudan .. .. .. Uganda < 10.00 < 1.00 < 100 Tanzania .. .. .. Zambia 1.00 - 10 .00 0.50 – 1.00 < 300 Zimbabwe .. 0.501 – 5.00 5 – 500
Sources: Most of these definitions were obtained through surveys conducted by ICSHP in 2011, except for Mozambique.
Regional overview Hydropower plays an important role (above 80 per cent) in electricity generation in Burundi, Ethiopia, Zambia, Mozambique and Malawi and it produces a significant amount of electricity in Uganda, Zimbabwe, Tanzania, Madagascar and Kenya. The island topography of Seychelles is not suitable for hydropower, while in Djibouti, Eritrea, and Somalia, the complete or part desert climate in these countries, coupled with recurring droughts, are not conducive for hydropower development. Small hydropower development in the region is ongoing at a smaller scale:
A master study plan on hydropower potential for Burundi exists since the 1980s. It includes small hydropower potential sites with capacities of up to 10 MW. Recent optimization studies have shown that these sites could achieve higher installed capacities with the current available technology.
10
Though a large small hydropower potential is known, means to develop the potential are scarce.
Eritrea does not use any hydropower and its small hydropower potential has not been studied. However, feasibility studies to utilize micro and small hydropower in the inland river basin are required and would be beneficial, since only three per cent of the rural population has access to electricity.
11
Ethiopia, with a national electrification rate of 17 per cent, is making efforts in improving rural electrification, particularly off grid electrification, and developing new energy sources. Currently, a rural energy fund exists and its feed-in tariffs (FITs) schemes are in the draft form.
In Kenya, interest in the development of small hydropower has increased in the last 12 years due to the inadequacies of grid based power supply. There is a commitment to use renewable energy, as can be seen from the FIT policy and National Renewable Energy Development Strategy. Additionally, there is a high private sector interest in small hydropower mainly via small hydropower use on tea plantations (i.e. United Nations Environment Programme project). The Government is motivated to remove legal and regulatory barriers (see country report).
12
Interestingly, Madagascar has a very high potential (2,600 MW), however, there is no information on existing small hydropower plants in Madagascar. According to the Rural Electrification Agency, there were four plants with individual capacities of up to 10 MW, with a total installed capacity of 22.51 MW. All of them need renovation since the commissioning about 25 years ago.
In Malawi, a Renewable Energy Strategy is underway and a Master Plan for Rural Electrification was passed in 2003. It includes a list of potential micro hydropower sites. However, the development of small hydropower is slow and some of the existing small hydropower plants are not operating due to lack of maintenance instruments i.e. availability of spare parts and financial constraints. On the other hand, feasibility studies have been conducted in the past, but one of the main barriers is the lack of investors.
In Mauritius, two small hydropower plants are under construction and expected to be completed by 2015 in addition to the existence of FIT support systems that are readily available.
Mozambique’s greatest hydropower potential lies on the Zambezi River basin with a growing interest to promote the use of small hydropower for isolated rural communities
Réunion’s hydro potential has been developed with remaining potential for only a few more micro power stations.
13
While Rwanda does not have a lot of existing small hydropower there is considerable micro hydropower potential available in the country.
A non-verifiable source estimates that pre-war Somalia had 4.8 MW of installed hydropower capacity in the lower Juba valley; however, due to the political unrest of the country, no significant data is available.
In South Sudan, the development of the hydropower sector is not realized due to political and social unrest.
In Uganda, the development of small, micro- or mini-hydro “has not been very systematically
16
conducted”. Seven projects with a total of 60 MW small hydropower capacities have been announced.
14 Based on the National Renewable
Energy Policy, a government programme with an ambitious target of 100 MW hydropower capacities, by 2017, is being anticipated, from mini- and micro- hydropower.
Tanzania has a substantial small hydropower potential with areas of high potential located in Southern and Western highlands. The Tanzania Electric Supply Company Limited (TANESCO) is currently in the process of developing the available resources.
The hydropower potential of Zambia is estimated at 6,000 MW, of which 1,858.5 MW has been developed. Development of small hydropower is usually conducted by the private sector.
The total installed small hydropower capacity in Zimbabwe is unknown. However, some information from certain small hydropower plants has been obtained from the private sector.
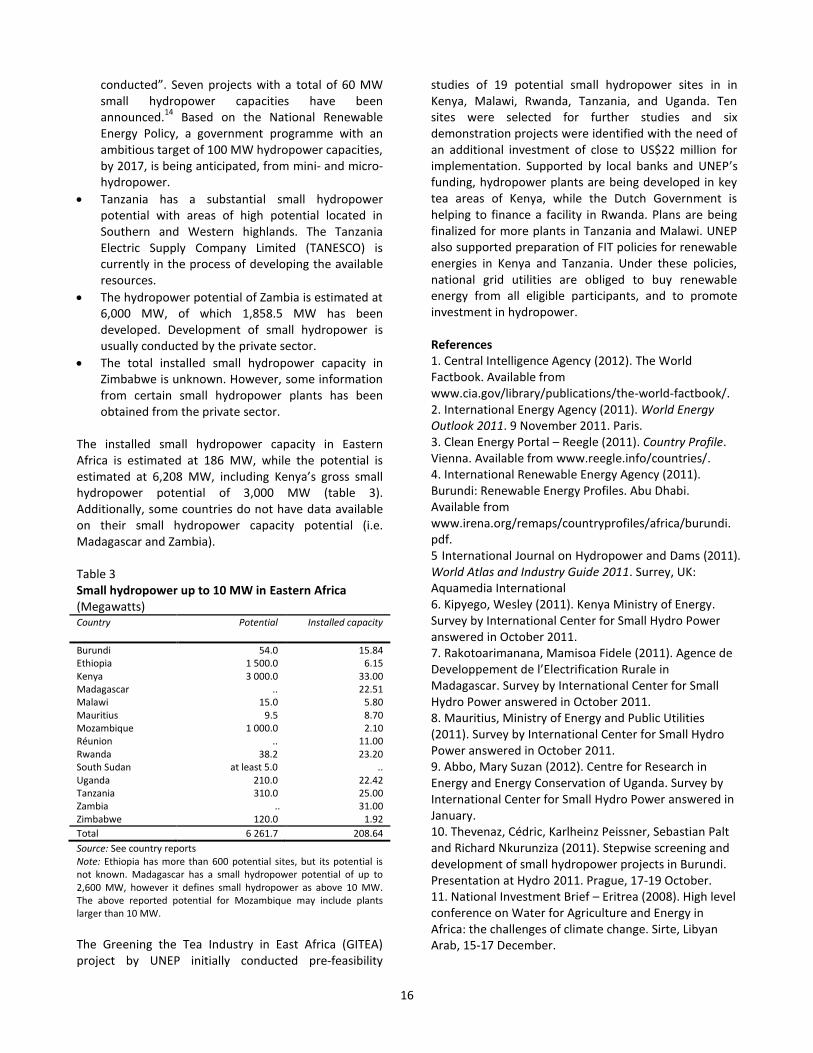
The installed small hydropower capacity in Eastern Africa is estimated at 186 MW, while the potential is estimated at 6,208 MW, including Kenya’s gross small hydropower potential of 3,000 MW (table 3). Additionally, some countries do not have data available on their small hydropower capacity potential (i.e. Madagascar and Zambia). Table 3 Small hydropower up to 10 MW in Eastern Africa (Megawatts) Country Potential
Installed capacity
Burundi 54.0 15.84 Ethiopia 1 500.0 6.15 Kenya 3 000.0 33.00 Madagascar .. 22.51 Malawi 15.0 5.80 Mauritius 9.5 8.70 Mozambique 1 000.0 2.10 Réunion .. 11.00 Rwanda 38.2 23.20 South Sudan at least 5.0 .. Uganda 210.0 22.42 Tanzania 310.0 25.00 Zambia .. 31.00 Zimbabwe 120.0 1.92
Total 6 261.7 208.64
Source: See country reports Note: Ethiopia has more than 600 potential sites, but its potential is not known. Madagascar has a small hydropower potential of up to 2,600 MW, however it defines small hydropower as above 10 MW. The above reported potential for Mozambique may include plants larger than 10 MW.
The Greening the Tea Industry in East Africa (GITEA) project by UNEP initially conducted pre-feasibility
studies of 19 potential small hydropower sites in in Kenya, Malawi, Rwanda, Tanzania, and Uganda. Ten sites were selected for further studies and six demonstration projects were identified with the need of an additional investment of close to US$22 million for implementation. Supported by local banks and UNEP’s funding, hydropower plants are being developed in key tea areas of Kenya, while the Dutch Government is helping to finance a facility in Rwanda. Plans are being finalized for more plants in Tanzania and Malawi. UNEP also supported preparation of FIT policies for renewable energies in Kenya and Tanzania. Under these policies, national grid utilities are obliged to buy renewable energy from all eligible participants, and to promote investment in hydropower. References 1. Central Intelligence Agency (2012). The World Factbook. Available from www.cia.gov/library/publications/the-world-factbook/. 2. International Energy Agency (2011). World Energy Outlook 2011. 9 November 2011. Paris. 3. Clean Energy Portal – Reegle (2011). Country Profile. Vienna. Available from www.reegle.info/countries/. 4. International Renewable Energy Agency (2011). Burundi: Renewable Energy Profiles. Abu Dhabi. Available from www.irena.org/remaps/countryprofiles/africa/burundi.pdf. 5 International Journal on Hydropower and Dams (2011). World Atlas and Industry Guide 2011. Surrey, UK: Aquamedia International 6. Kipyego, Wesley (2011). Kenya Ministry of Energy. Survey by International Center for Small Hydro Power answered in October 2011. 7. Rakotoarimanana, Mamisoa Fidele (2011). Agence de Developpement de l’Electrification Rurale in Madagascar. Survey by International Center for Small Hydro Power answered in October 2011. 8. Mauritius, Ministry of Energy and Public Utilities (2011). Survey by International Center for Small Hydro Power answered in October 2011. 9. Abbo, Mary Suzan (2012). Centre for Research in Energy and Energy Conservation of Uganda. Survey by International Center for Small Hydro Power answered in January. 10. Thevenaz, Cédric, Karlheinz Peissner, Sebastian Palt and Richard Nkurunziza (2011). Stepwise screening and development of small hydropower projects in Burundi. Presentation at Hydro 2011. Prague, 17-19 October. 11. National Investment Brief – Eritrea (2008). High level conference on Water for Agriculture and Energy in Africa: the challenges of climate change. Sirte, Libyan Arab, 15-17 December.

17
12. United Nations Environment Programme (n.d.). The power of a cup of tea - Greening the tea industry in East Africa. Available from www.unep.org/unite/30ways/story.aspx?storyID=19. 13. Forum for Energy and Development and Thomas Lynge Jensen (2000). Renewable Energy on Small Islands. Second Edition. Available from www.gdrc.org/oceans/Small-Islands-II.pdf. 14. Van der Plas, Robert J. & A. Kyezira (2009). Uganda’s Small Hydro Energy Market. Berlin. Available from www.giz.de/Themen/de/dokumente/gtz2009-en-targetmarketanalysis-hydro-uganda.pdf.

18
1.1.1 Burundi Lara Esser and Laxmi Aggarwal, International Center on Small Hydro Power Key facts
Population 10,557,2591
Area 27,830 km2
Climate Equatorial climate
Topography Hilly and mountainous terrain
Rain Pattern
Average annual rainfall is about 1,500 mm; two wet seasons (February to May, September to November), and two dry seasons (June to August, December to January)
1
Electricity sector overview The electrification access in Burundi is 10 per cent which can be considered low in comparison to other countries in the East African Community (EAC).
2 The transmission
network includes: high voltage lines (70-110 kV) and medium voltage lines (10-15 kV), whichall require rehabilitation, 110 kV transmission lines are in good condition and the 70 kV transmission lines are in an acceptable condition.
2 3 The Régie de Production et
Distribution d’Eau et d’Électricité (REGIDESO) has sole responsibility of the system. In 2010 the energy deficit was about 15 MW.
3
In 2008, REGIDESO produced 87 per cent of the domestic electricity, most of it was from hydropower. REGIDESO has a total installed capacity of 35.8 MW, of which 30.8 MW is hydropower and 5.5 MW thermal capacity.
2 There are very few biogas and solar energy
installations in the country becauseover 70 per cent of them are out of order either due to vandalism or lack of maintenance.
4 Figure 1 shows the electricity mix of
Burundi.
Figure 1 Electricity generation Burundi Source: African Development Bank
4
Note: Data from 2008. The Government’s strategy for the power sector has called for 20 per cent of its population to have access to electricity by 2020.
4 Burundi generates hydropower
from its large hydropower plant Rwegura, with an installed capacity of 18 MW. Additional capacity is available for Burundi from two regional hydro plants: 3
MW from Ruzizi I which has an installed capacity of 29.8 MW and 13.3 MW from Ruzizi II with an installed capacity of 43.8 MW.
2 5 These plants are shared
between the Democratic Republic of Congo, Rwanda and Burundi. Ruzizi I is owned by Société Nationale d’Electricité (SNEL), the national electricity company of the Democratic Republic of Congo, Ruzizi II is owned by the Société International d'Électricité des Pays des Grands Lacs (SINELAC), the intercommunity organization of Rwanda, Democratic Republic of Congo and Burundi.
6
Future plans show that import capacity of Burundi may increase with the installations of Ruzizi III (estimated capacity of 147 MW) and Ruzizi IV (estimated capacity of 287 MW).
2
Burundi’s electricity sector is expected to change with the implementation of the East African Power Pool (EAPP) plans for interconnectivity and a common market within the EAPP countries, as has been achieved by Europe. Most of the EAC countries have been connected while Burundi waits for the high voltage line of 220 kV from Kigoma-Butare-Ngozi-Gietga to be completed and a link from the United Republic of Tanzania to Burundi to be installed.
2
The country has already experienced changes in the electricity sector with the aid of World Bank. The payment system was altered to a prepayment system in 2011, resulting in 52 per cent of the clients paying in advance. This will in turn aid REGIDESO to ensure secure earnings, easier resource management and will contribute in diminishing the financial risk faced by REGIDESO.
2
In addition to the World Bank contributions, Burundi has in 2011 established the Control and Regulation Agency for the Water and Electricity Sectors under Decree No. 100/320. This entity is responsible to control, regulate and monitor the sectors to ensure compliance with contracts and clauses. The Burundian Agency for Rural Electrification (ABER) was also implemented at the same time under decree No. 100/318; however it is still under establishment. ABER is to be responsible for electrification projects including small-scale hydropower, solar and wind projects. Small hydropower sector overview and potential Burundi is a landlocked nation; it is however, equipped with vast river resources, namely the Malagarasi (475 km) and the Ruzizi (117 km). The hydropower capacity of Burundi is 33.84 MW, not including the international Ruzizi I and II plants.
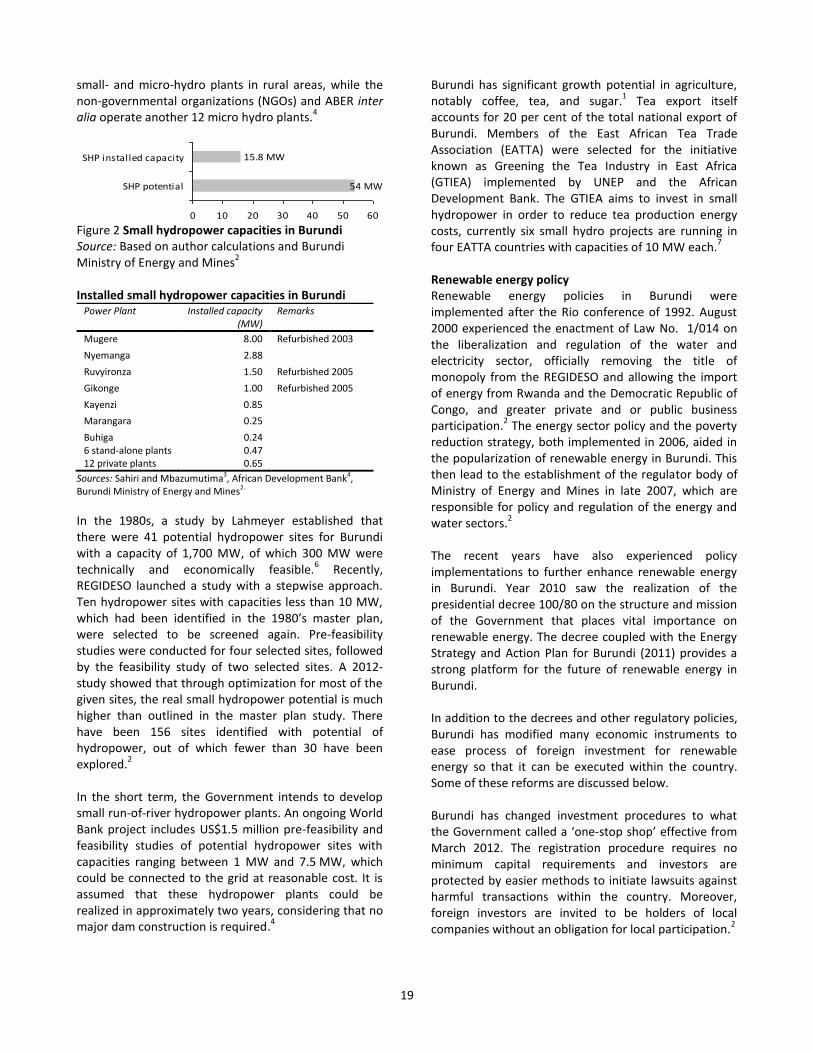
2 Burundi has 15.84 MW of installed
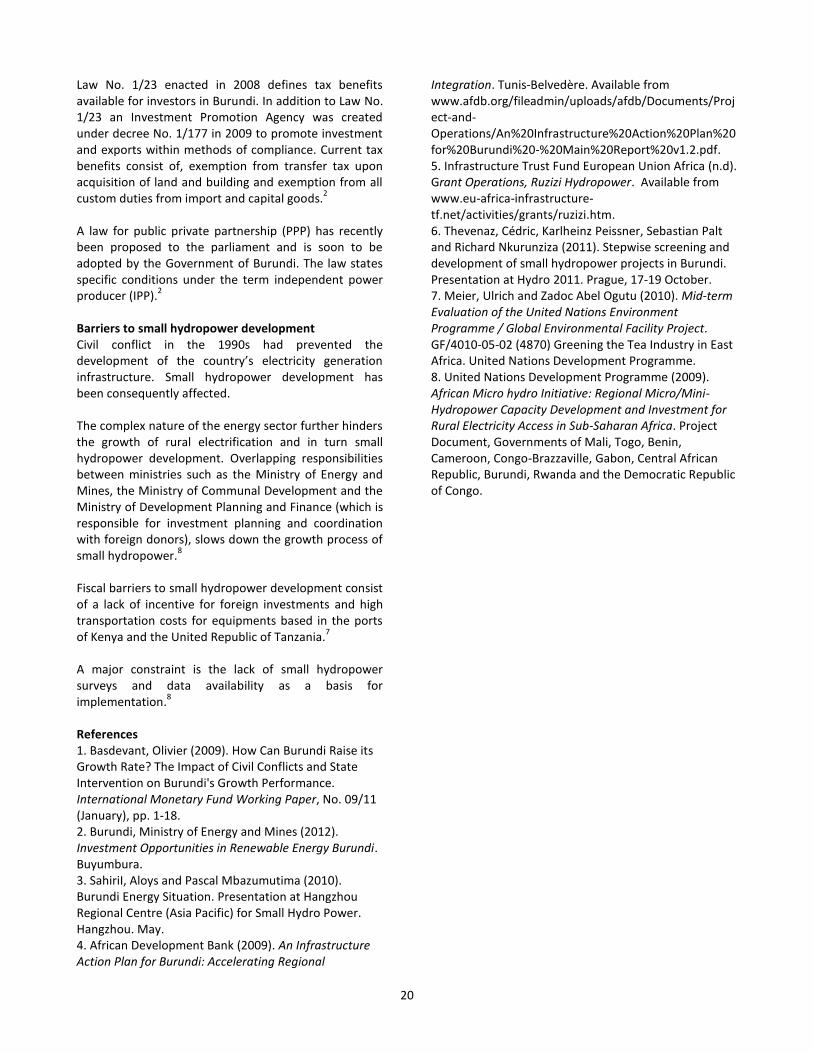
small hydropower capacity if the definition of 10 MW is applied (figure 2). Direction Dénérale de l'Hydraulique et de l’Életrification (DGHER), now ABER, operates eight
46.6%
48.2%
5.2%
0% 10% 20% 30% 40% 50%
Imported electricity
Hydropower
Other sources
19
small- and micro-hydro plants in rural areas, while the non-governmental organizations (NGOs) and ABER inter alia operate another 12 micro hydro plants.
4
Figure 2 Small hydropower capacities in Burundi Source: Based on author calculations and Burundi Ministry of Energy and Mines
2 Installed small hydropower capacities in Burundi
Power Plant Installed capacity (MW)
Remarks
Mugere 8.00 Refurbished 2003
Nyemanga 2.88
Ruvyironza 1.50 Refurbished 2005
Gikonge 1.00 Refurbished 2005
Kayenzi 0.85
Marangara 0.25
Buhiga 0.24 6 stand-alone plants 0.47 12 private plants 0.65
Sources: Sahiri and Mbazumutima3, African Development Bank4, Burundi Ministry of Energy and Mines2.
In the 1980s, a study by Lahmeyer established that there were 41 potential hydropower sites for Burundi with a capacity of 1,700 MW, of which 300 MW were technically and economically feasible.
6 Recently,
REGIDESO launched a study with a stepwise approach. Ten hydropower sites with capacities less than 10 MW, which had been identified in the 1980’s master plan, were selected to be screened again. Pre-feasibility studies were conducted for four selected sites, followed by the feasibility study of two selected sites. A 2012-study showed that through optimization for most of the given sites, the real small hydropower potential is much higher than outlined in the master plan study. There have been 156 sites identified with potential of hydropower, out of which fewer than 30 have been explored.
2
In the short term, the Government intends to develop small run-of-river hydropower plants. An ongoing World Bank project includes US$1.5 million pre-feasibility and feasibility studies of potential hydropower sites with capacities ranging between 1 MW and 7.5 MW, which could be connected to the grid at reasonable cost. It is assumed that these hydropower plants could be realized in approximately two years, considering that no major dam construction is required.
4
Burundi has significant growth potential in agriculture, notably coffee, tea, and sugar.
1 Tea export itself
accounts for 20 per cent of the total national export of Burundi. Members of the East African Tea Trade Association (EATTA) were selected for the initiative known as Greening the Tea Industry in East Africa (GTIEA) implemented by UNEP and the African Development Bank. The GTIEA aims to invest in small hydropower in order to reduce tea production energy costs, currently six small hydro projects are running in four EATTA countries with capacities of 10 MW each.
7
Renewable energy policy Renewable energy policies in Burundi were implemented after the Rio conference of 1992. August 2000 experienced the enactment of Law No. 1/014 on the liberalization and regulation of the water and electricity sector, officially removing the title of monopoly from the REGIDESO and allowing the import of energy from Rwanda and the Democratic Republic of Congo, and greater private and or public business participation.
2 The energy sector policy and the poverty
reduction strategy, both implemented in 2006, aided in the popularization of renewable energy in Burundi. This then lead to the establishment of the regulator body of Ministry of Energy and Mines in late 2007, which are responsible for policy and regulation of the energy and water sectors.
2
The recent years have also experienced policy implementations to further enhance renewable energy in Burundi. Year 2010 saw the realization of the presidential decree 100/80 on the structure and mission of the Government that places vital importance on renewable energy. The decree coupled with the Energy Strategy and Action Plan for Burundi (2011) provides a strong platform for the future of renewable energy in Burundi. In addition to the decrees and other regulatory policies, Burundi has modified many economic instruments to ease process of foreign investment for renewable energy so that it can be executed within the country. Some of these reforms are discussed below. Burundi has changed investment procedures to what the Government called a ‘one-stop shop’ effective from March 2012. The registration procedure requires no minimum capital requirements and investors are protected by easier methods to initiate lawsuits against harmful transactions within the country. Moreover, foreign investors are invited to be holders of local companies without an obligation for local participation.
2
54 MW
15.8 MW
0 10 20 30 40 50 60
SHP potential
SHP installed capacity
20
Law No. 1/23 enacted in 2008 defines tax benefits available for investors in Burundi. In addition to Law No. 1/23 an Investment Promotion Agency was created under decree No. 1/177 in 2009 to promote investment and exports within methods of compliance. Current tax benefits consist of, exemption from transfer tax upon acquisition of land and building and exemption from all custom duties from import and capital goods.
2
A law for public private partnership (PPP) has recently been proposed to the parliament and is soon to be adopted by the Government of Burundi. The law states specific conditions under the term independent power producer (IPP).
2
Barriers to small hydropower development Civil conflict in the 1990s had prevented the development of the country’s electricity generation infrastructure. Small hydropower development has been consequently affected. The complex nature of the energy sector further hinders the growth of rural electrification and in turn small hydropower development. Overlapping responsibilities between ministries such as the Ministry of Energy and Mines, the Ministry of Communal Development and the Ministry of Development Planning and Finance (which is responsible for investment planning and coordination with foreign donors), slows down the growth process of small hydropower.
8
Fiscal barriers to small hydropower development consist of a lack of incentive for foreign investments and high transportation costs for equipments based in the ports of Kenya and the United Republic of Tanzania.
7
A major constraint is the lack of small hydropower surveys and data availability as a basis for implementation.
8
References 1. Basdevant, Olivier (2009). How Can Burundi Raise its Growth Rate? The Impact of Civil Conflicts and State Intervention on Burundi's Growth Performance. International Monetary Fund Working Paper, No. 09/11 (January), pp. 1-18. 2. Burundi, Ministry of Energy and Mines (2012). Investment Opportunities in Renewable Energy Burundi. Buyumbura. 3. SahiriI, Aloys and Pascal Mbazumutima (2010). Burundi Energy Situation. Presentation at Hangzhou Regional Centre (Asia Pacific) for Small Hydro Power. Hangzhou. May. 4. African Development Bank (2009). An Infrastructure Action Plan for Burundi: Accelerating Regional
Integration. Tunis-Belvedère. Available from www.afdb.org/fileadmin/uploads/afdb/Documents/Project-and-Operations/An%20Infrastructure%20Action%20Plan%20for%20Burundi%20-%20Main%20Report%20v1.2.pdf. 5. Infrastructure Trust Fund European Union Africa (n.d). Grant Operations, Ruzizi Hydropower. Available from www.eu-africa-infrastructure-tf.net/activities/grants/ruzizi.htm. 6. Thevenaz, Cédric, Karlheinz Peissner, Sebastian Palt and Richard Nkurunziza (2011). Stepwise screening and development of small hydropower projects in Burundi. Presentation at Hydro 2011. Prague, 17-19 October. 7. Meier, Ulrich and Zadoc Abel Ogutu (2010). Mid-term Evaluation of the United Nations Environment Programme / Global Environmental Facility Project. GF/4010-05-02 (4870) Greening the Tea Industry in East Africa. United Nations Development Programme. 8. United Nations Development Programme (2009). African Micro hydro Initiative: Regional Micro/Mini-Hydropower Capacity Development and Investment for Rural Electricity Access in Sub-Saharan Africa. Project Document, Governments of Mali, Togo, Benin, Cameroon, Congo-Brazzaville, Gabon, Central African Republic, Burundi, Rwanda and the Democratic Republic of Congo.

21
1.1.2 Ethiopia Lara Esser, International Center on Small Hydro Power
Key facts
Population 91,195,6751
Area 1,104,300 km2
Climate Tropical monsoon with wide topographic-induced variation
1
Topography High plateau with central mountain range divided by Great Rift Valley
1
Rain Pattern
Mean annual rainfall ranges from 2,000 mm over some pocket areas in the southwest highlands, and less than 250 mm in the lowlands. In general, annual precipitation ranges from 800 to 2,200 mm in the highlands (altitude >1,500 m) and varies from less than 200-800 mm in the lowlands (altitude <1,500 m).
2
Parts of Ethiopia have uni-modal and others bimodal rainfall patterns.
Electricity sector overview In 2009, 89 per cent of Ethiopia’s population lived in rural areas and rural electrification was estimated at a mere 2-per cent.
3 The Government of Ethiopia launched
its Rural Electrification Strategy in 2002 as a large governmental programme for electrification, consisting of three parts: grid extension by the public utility, Ethiopian Electric Power Corporation (EEPCo), private sector led off-grid electrification and promotion of new energy sources. The Rural Electrification Fund (REF) with its loan programmes for diesel-based and renewable energy-based projects is the main implementing institution. With an initial budget of €29 million, REF has been supporting 180-200 rural micro-hydropower and photovoltaic (PV) mini-grids for educational and health care facilities.
4 The fund provides loans up to 95 per
cent of investment needs with a zero interest rate for renewable energy projects. Renewable energy technologies that receive support under this programme include solar PV, mini- and micro-hydro, and biomass co-generation.
3
According to EEPCo, the number of electrified towns and rural villages has increased significantly in the last five years of the strategic plan period. By July 2011 it had reached a total number of 5,866, bringing the country’s electricity access to 46 per cent.
5 In contrast,
World Energy Outlook 2011 reported Ethiopia’s 2009 national electrification access as 17 per cent.
6 This
difference is probably due to the different reference points and sources.
The EEPCo has two electricity supply systems: the Inter - Connected System (ICS) and the Self Contained System (SCS). The main energy source of ICS is hydropower plants and for the SCS the main sources are mini hydropower schemes and diesel power generators allocated in various areas across the country (figure 1).
5
Figure 1 Electricity generation in Ethiopia Source: Ministry of Energy and Mines
7
Small hydropower sector overview and potential According to a 2010-German Agency for Technical Cooperation Report, small- and micro-hydropower are not yet developed on a larger scale. Three small hydropower schemes exist in Yadot (0.35 MW), Dembi (0.8 MW) and Sor (5 MW) with a cumulative installed capacity of 6.15 MW (figure 2).
8
Figure 2 Small hydropower capacities in Ethiopia Source: Shanko
8
In February 2012, three micro hydropower plants with a cumulative capacity of 125 kW were inaugurated in the villages of Ererte, Gobecho and Hagara Sodicha in Sidama zone in the Southern Nations, Nationalities and the Peoples’ Regional State (SNNPR). The plants were implemented in partnership with Sidama Mines, Water and Energy Agency, the Sidama Development Association and local communities, and with the support of the Energy Coordination Office of Deutsche Gesellschaft für Internationale Zusammenarbeit (GIZ).
9
The Sor small hydropower plant has the potential to be expanded by an additional 5 MW. A feasibility study was undertaken in 1992 and another study conducted with the support of the United Nations Development Programme (UNDP) also calculated the same results.
10
The Supervisory Review and Evaluation Process (SREP) Strategic Draft Report plans to implement this development between 2012 and 2014 by updating the existing feasibility study; design and tender document preparation; installation of additional penstock and additional 5 MW third unit, construction of a rock-fill dam, construction of annexed hydraulic structures (spillway, bottom out late and connection structure at
17%
83%
0% 20% 40% 60% 80% 100%
Hydropower
Fuels
1500 MW
6.15 MW
0 500 1000 1500
SHP potential
SHP installed capacity
22
the headrace tunnel) and finally refurbishment of the existing two units.
10
The following sites in Oromia region have been approved for REF financing: Aleltu (300 kW), Bello (192 kW), Bote (160 kW), Dila (480 kW) and Sonkole (260 kW).
8
The theoretical potential of hydropower in Ethiopia is estimated to be 30,000–45,000 MW (160,000 GWh/year), with the estimated economically feasible hydropower potential ranging between 15,000 and 30,000 MW.
3 A large potential for mini hydro plants in
areas which are remote to the grid but close to consumers seems to exist. More than 600 traditional hydro mills that could be used for hydropower have been identified. A database of hydropower resources and potential sites is being set up by the Ethiopian Government. Non-governmental organizations and churches are also active in the sector, but no private sector company has so far been involved.
3
The potential for small- and micro-hydropower development is estimated to be 1,500-3,000 MW (10 per cent of the total hydropower potential in Ethiopia). It is limited by the seasonality of rainfall and reduced availability of water. Increased levels of small-scale irrigation farming, as a result of population growth, lead to increases in water needs.
9 In the early 1980s, over 70
micro hydropower potential sites were identified by the Ethiopian Rural Energy Development and Promotion Center (EREDPC) under the Ministry of Mines and Energy of Ethiopia, Ethiopian Evangelical Church Mekane Yesus and a team of experts from People’s Republic of China. These sites are however lacking in socio-economic studies.
8
Supported by GIZ, a south-south knowledge-transfer between Indonesia and Ethiopia started in 2008. Initial attempts have been made to set up local companies to produce micro-hydro equipment. However, most of the installed turbines and generators used are still being imported from abroad.
3
Renewable energy policy The Ministry of Mines and Energy (MME) is the leading ministry for national energy policy and expansion of electricity provision. The Ministry of Rural Development is involved in matters of rural electrification. The Ethiopian Energy Agency is the regulating agency for the electricity market and is responsible of price regulations, power purchase agreements, licensing of independent power producers and regulating access to the grid by private producers.
3
The EREDPC, under the MME, have the mandate to promote renewable energy technologies, including micro-hydropower for rural areas.
3 It is a donor-funded
institution.3 The REF, which operates as part of the
EREDPC of the Ethiopian Government, is an institutional focal point for the deployment of renewable energy technologies.
3
Furthermore, a feed-in tariff (FIT) for renewable energies (now in the fourth draft) is under preparation by the electricity regulatory agency.
3
The Government of Ethiopia has initiated the Climate-Resilient Green Economy (CRGE) initiative to protect the country against the adverse effects of climate change and to build a green economy that will help realize its ambition of reaching middle-income status before 2025. The CRGE foresees to develop up to 25,000 MW of Ethiopia’s generation potential by 2030 (hydro 22,000 MW, geothermal 1,000 MW and wind 2,000 MW).
10
Legislation on small hydropower An environmental impact assessment is needed for all hydropower plants, but it is not enforced by the regulator for micro-hydropower projects. If the micro hydropower project is supported by a loan from the rural electrification fund then such assessment and approval from all neighbouring upstream and downstream countries is required (regulation by World Bank). Other requirements for off-grid plants and those connected to mini-grids are a distribution licence, which can be obtained from the regulator. Although rules are not transparent, the regulator is supporting this procedure. An investment licence is also required (except for cooperatives) and water rights have been checked by the Ministry (if the owner is not the community which normally already possesses the water rights).
3
Barriers to small hydropower development In order to boost the small hydropower capacity in Ethiopia, improvements can be made in the following areas:
Despite a long history of micro hydropower in Ethiopia, local skills to manufacture, operate and maintain the plants are not well developed. The schemes built in the 1940s were fully controlled and managed by foreign experts.
8
Small- and micro-hydropower equipment and components are not available off-the-shelf in local market.
Relatively low return on investment is currently discouraging individual private investment in small hydropower, but cooperatives with members that will benefit from getting access to electricity may be

23
potential developers, since their primary motive is not return on investment.
8
Competitive water uses and demand may prevent small hydropower development. An increasing population could create more demand for water by upstream users.
8
References 1. Central Intelligence Agency (2012). The World Factbook. Available from www.cia.gov/library/publications/the-world-factbook/. 2. United States Department of Agriculture (2003). Production Estimates and Crop Assessment Division of Foreign Agricultural Service. Annual Rainfall and Three Major Rainfall Regimes. Available from www.fas.usda.gov/pecad2/highlights/2002/10/ethiopia
/baseline/eth_annual_rainfall.htm. 3. Gaul, Mirco, Fritz Kölling and Miriam Schröder (2010). Policy and regulatory framework conditions for small hydro power in Sub-Saharan Africa: Discussion paper. Eschborn. Available from www.giz.de/Themen/en/dokumente/gtz2010-en-HERA-EUEI-PDF-framework-conditions-hydropower.pdf. 4. Hakizimana, Godefroy, Emmanuel Kanigwa, Finias Magessa, Bernard Mutiso Osawa and Mackay A.E. Okure (2009). Regional Reports on Renewable Energies. Renewable Energies in East Africa Regional Report on Potentials and Marktes: 5 Country Analyses. Ethiopia, Eschborn. Available from www.giz.de/Themen/en/dokumente/gtz2009-en-regionalreport-eastafrica-introduction.pdf. 5. Ethiopia Electric Power Corporation (2012). Existing Power Plants Database. Available from www.eepco.gov.et/generation_op.php. Accessed
December 2012. 6. International Energy Agency (2011). World Energy Outlook 2011. 9 November 2011. Paris. 7. Japan International Cooperation Agency (2010). Country Paper: Energy Policy of Ethiopia. Presentation at Tokyo International Center, 10 May. 8. Shanko, Melessaw (2009). Target Market Analysis: Ethiopia’s Small Hydro Energy Market. Berlin. Available from www.giz.de/Themen/de/dokumente/gtz2009-en-targetmarketanalysis-hydro-ethiopia.pdf. 9. Yewondwossen, Muluken (2012). Three new micro hydropower plants in Southern Ethiopia, 28 February. Available from www.capitalethiopia.com/index.php?option=com_content&view=article&id=590:three-new-micro-hydropower-plants-in-southern-ethiopia-
&catid=54:news&Itemid=27. 10. Ethiopia, Ministry of Water and Energy (2012). Scaling-Up Renewable Energy Programme: Ethiopia Investment Plan (Draft Final). Addis Ababa. Available from
www.oecd.org/env/cc/TADELE_FDRE%20Ethiopia%20Scaling%20-%20Up%20Renewable%20Energy%20Program%202012.pdf.

24
1.1.3 Kenya Patrick Thaddayos Balla, Global Village Energy Partnership International, Kenya Key facts
Population 43,013,3411
Area 580 367 km2
Climate Varies from tropical along coast to arid in interior
1
Topography Low plains rise to central highlands bisected by Great Rift Valley; fertile plateau in west
1
Rain Pattern
Two rainy seasons: March to May and October to early December.
Electricity sector overview Electricity access in Kenya is estimated at 28.9 per cent.
i
Access in the Nairobi province is reported to be 53.47 per cent and in Central provinces 42.4 per cent.
2 These
are the top two provinces in terms of electricity access. The provinces with lowest access to electricity are North Eastern province at 14 per cent and Western province at 14.7 per cent.
2 According to the National Information
and Communication Technology Survey 2010, the grid is the main source of electricity with 25 per cent of households connected to it, while 15.3 per cent of the homes were connected to other types of electricity sources. Only 13 per cent of rural households are connected to the grid, compared to a 58-per cent of urban households that had their premises connected to the grid. A wide disparity was observed between urban and rural households not connected to any form of electricity.
3
Electricity generation in Kenya is liberalized with hydropower dominating the electricity mix (figure 1). The combined installed capacity was 1,533 MW as of December 2011, with an estimation of 76 per cent by main power generating company, six independent power producers (IPPs) account for the balance.
4
Figure 1 Electricity generation in Kenya Source: Kenya Ministry of Energy
4
Small hydropower sector overview and potential Small hydropower technology has been harnessed for over a century in Kenya, mainly for grinding food grains
and in a few cases for electricity. Until recently, there have been a few small-scale hydropower schemes mainly owned by missionaries and tea plantations, but the developers did not link this sector to local technical capacity development. Several small hydropower schemes are in operation by private entrepreneurs and communities for local consumption. Interest in the development of small hydropower in Kenya has revived in the last 12 years, partly due to the inadequacies in the grid-based power supply, the technological push and increased awareness on the role of small hydropower in the country’s electricity mix.
5 A
number of projects have been planned or constructed by communities and the private sector in this period. Since 2006, a new wave of small hydropower projects had been planned and commissioned, mostly by private tea companies (Unilever and James Finlay Tea) and Kenya Tea Development Agency (KTDA). Other private sector players and community NGOs are implementing a number of projects. With the introduction of the feed-in tariff (FIT) policy in 2008, small-scale candidate sites are likely to come up and serve well for the electricity supply of villages, small businesses or farms. Table 1 Small hydropower schemes in Kenya
Scheme Ownership Location (River)
Installed capacity
(MW)
Year
Tana 1 & 2 KenGen Upper Tana 4.0000 1952 Tana 3 KenGen Upper Tana 2.4000 1952
Tana 4 KenGen Upper Tana 4.0000 1954 Tana 5 KenGen Upper Tana 2.4000 1955
Tana 6 KenGen Upper Tana 2.0000 1956 Ndula KenGen Thika River 2.0000 1924 Wanjii KenGen Maragua 7.4000 1955 Gogo KenGen Migori 2.0000 1952 Sagana KenGen Upper Tana 1.5000 1952 Mesco KenGen Maragua 0.3800 1919 Sosiani KenGen Sosiani 0.4000 1955 Tenwek Tenwek
Missionary Hospital
Bomet 0.3200 1987
Unilever Unilever Tea Company
Kericho 2.2000 -
James Finlay
James Finlay Tea Company
Kericho 2.4000 1934-1999
Savani Eastern Produce
0.0950 1927
Imenti Tea Factory
KTDA Imenti river 0.9000 2009
Diguna Missionary - 0.4000 1997 Tungu Kabiru
Community River Tungu 0.0140 2000
Mujwa Missionary 0.0070 -
Thima Community Mukengeria 0.0020 2001
Kathamba Community Kathamba 0.0012 2001
Source: Republic of Kenya6, Balla5
46.9%
31.4%
19.9%
1.2%
0.4%
0.2%
0% 10% 20% 30% 40% 50%
Hydropower
Fossil fuels
Geothermal
Cogeneration (bagasse)
Imported electricity
Wind

25
Notes: Listed are only operational schemes. KenGen - Kenya Electricity Generating Company, KTDA – Kenya Tea Development Agency.
Small hydropower schemes operating in Kenya comprise small (1-10 MW), micro (<10 MW) and pico (0.1-1 MW), hydropower. These have been developed by the Government, private sector, communities and missionaries. Table 1 summarizes some of the documented small hydropower schemes implemented in Kenya, with a combined capacity of approximately 33 MW. The KTDA has plans to construct 10 mini-hydropower plants with a total capacity of 22 MW. KTDA formed a new unit known as KTDA Power Co (KPC) to implement the power projects. Imenti tea factory managed by KTDA is already producing 0.9 MW and supplies about 0.6 MW to the national grid through the power purchase agreement (PPA) signed in June 2009.
7
Tana River Development Authority (TARDA) is implementing seven mini hydro projects with 3.2 MW at a cost of €1.3 million, financed by the European Union.
8
German Agency for Technical Cooperation (GTZ), Kenya Industrial Research and Development Institute and the Nairobi-based NGO Green Power has been involved in mapping of mini-hydro electricity generation potential, and pre-feasibility studies of 14 potential sites in Western Kenya. Green Power has also been involved in the development of 17 micro hydropower plants in the
Kirinyaga district. The sites are at different stages of implementation.
Figure 2 Small hydropower capacities in Kenya Source: Balla
5, Government of Kenya
9
The overall hydropower potential of Kenya, estimated in 1991, amounts to approximately 30,000 GWh/year, representing 6,000 MW of installed capacity. It is also estimated that almost over half the potential is attributable to small rivers. The energy bill company estimates small hydropower potential to be 3,000 MW (figure 2).
9 The potential small hydropower sites are
mainly located in the south-west of Kenya (Lake Victoria drainage basin in Nyanza and Western Provinces and adjacent districts of Rift Valley Province); southwest of Mount Kenya – Aberdare Mountains (Central Province, Mt. Kenya adjoining districts of Eastern Province and Laikipia District of Rift Valley Province). The small hydropower potential is concentrated in districts with high population density and high energy demand thus providing favourable conditions for the deployment of small hydropower on a commercial basis.
8
Figure 3 Small Hydropower schemes in Kenya Source: Kenya, Ministry of Energy
4
Notes: Schemes include currently investigated and or implemented.
3000 MW
33 MW
0 500 1000 1500 2000 2500 3000
SHP potential
SHP installed
capacity
26
Renewable energy policy In Energy Act of 2006 and the FIT policy, there is a commitment to promote electricity generation from renewable energy sources. The Government intends to set up a Green Energy Fund Facility under the National Task Force on Accelerated Development of Green Energy with the purpose to lend funds to viable Renewable Energy projects at concessional rates.
6 The
National Renewable Energy Development Strategy, as set in the Least Cost Power Development Plan (LCPDP), Rural Electrification Master Plan, the Kenya National Climate Change Response Strategy and Kenya Vision 2030, reiterates the commitment to accelerate the use of renewable energy.
10
Legislation on small hydropower The Kenyan Government, through the Ministry of Energy, supports small hydropower by continuously collecting hydrological data, undertaking pre-feasibility and feasibility studies of viable sites, enabling dissemination of information on small hydropower. It is also creating investor and consumer awareness on the economic potential offered as an alternative source of energy and is implementing community-based pilot projects where feasible to promote acceptance. In 2008, a FIT policy (revised in January 2010) was developed to attract investment and development of small and mini hydropower plants.
11
Table 2 Small hydropower feed-in tariffs in Kenya
Plant capacity
(MW)
Maximum firm power tariff
(US$/kWh) at the interconnection
point
Maximum non-firm power tariff
(US$/kWh) at the interconnection point
Small hydro
0.50-0.99 0.12 0.10 1.00-5.00 0.10 0.08 5.10–100 0.08 0.06
Sources: Scaling up Renewable Energy Programme12, Republic of Kenya6, Kenya Institute for Public Policy Research and Analysis2
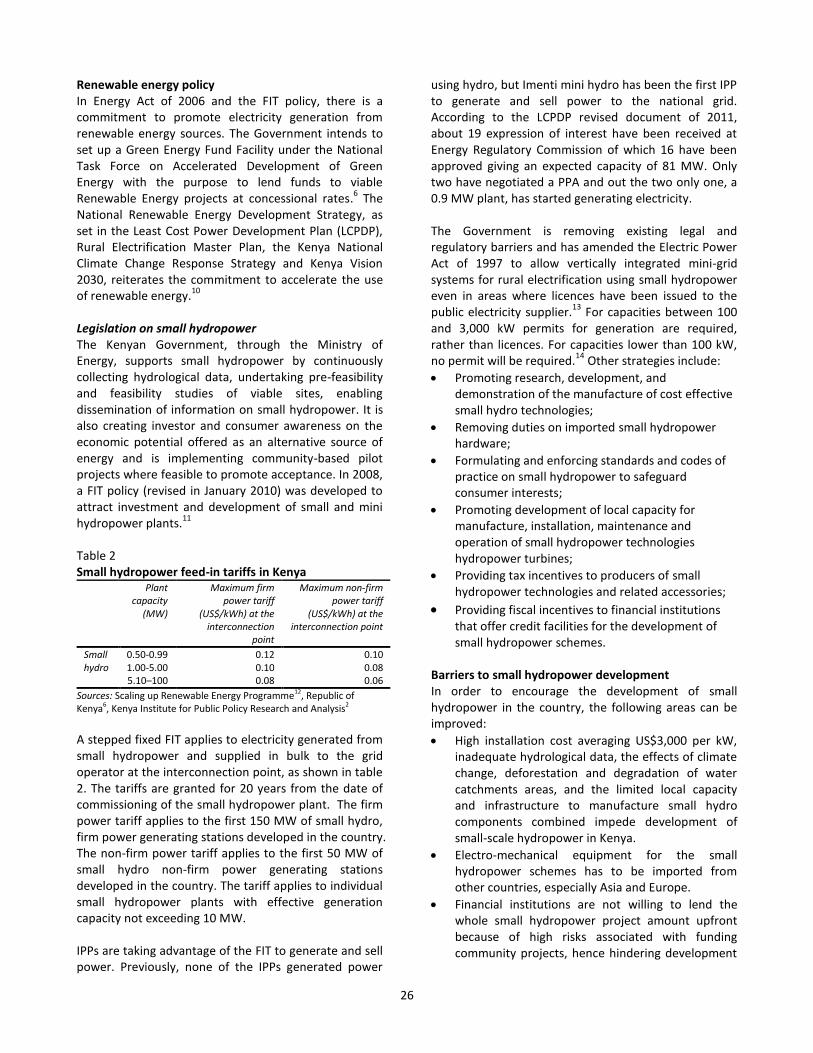
A stepped fixed FIT applies to electricity generated from small hydropower and supplied in bulk to the grid operator at the interconnection point, as shown in table 2. The tariffs are granted for 20 years from the date of commissioning of the small hydropower plant. The firm power tariff applies to the first 150 MW of small hydro, firm power generating stations developed in the country. The non-firm power tariff applies to the first 50 MW of small hydro non-firm power generating stations developed in the country. The tariff applies to individual small hydropower plants with effective generation capacity not exceeding 10 MW. IPPs are taking advantage of the FIT to generate and sell power. Previously, none of the IPPs generated power
using hydro, but Imenti mini hydro has been the first IPP to generate and sell power to the national grid. According to the LCPDP revised document of 2011, about 19 expression of interest have been received at Energy Regulatory Commission of which 16 have been approved giving an expected capacity of 81 MW. Only two have negotiated a PPA and out the two only one, a 0.9 MW plant, has started generating electricity. The Government is removing existing legal and regulatory barriers and has amended the Electric Power Act of 1997 to allow vertically integrated mini-grid systems for rural electrification using small hydropower even in areas where licences have been issued to the public electricity supplier.
13 For capacities between 100
and 3,000 kW permits for generation are required, rather than licences. For capacities lower than 100 kW, no permit will be required.
14 Other strategies include:
Promoting research, development, and demonstration of the manufacture of cost effective small hydro technologies;
Removing duties on imported small hydropower hardware;
Formulating and enforcing standards and codes of practice on small hydropower to safeguard consumer interests;
Promoting development of local capacity for manufacture, installation, maintenance and operation of small hydropower technologies hydropower turbines;
Providing tax incentives to producers of small hydropower technologies and related accessories;
Providing fiscal incentives to financial institutions that offer credit facilities for the development of small hydropower schemes.
Barriers to small hydropower development In order to encourage the development of small hydropower in the country, the following areas can be improved:
High installation cost averaging US$3,000 per kW, inadequate hydrological data, the effects of climate change, deforestation and degradation of water catchments areas, and the limited local capacity and infrastructure to manufacture small hydro components combined impede development of small-scale hydropower in Kenya.
Electro-mechanical equipment for the small hydropower schemes has to be imported from other countries, especially Asia and Europe.
Financial institutions are not willing to lend the whole small hydropower project amount upfront because of high risks associated with funding community projects, hence hindering development
27
at this level. Also, for community-managed small hydropower schemes, maintenance and management remains a challenge.
Note i. According to the World Energy Outlook 2011, electricity access for Kenya is reported to be 16.1 per cent. References 1. Central Intelligence Agency (2012). The World Factbook. Available from www.cia.gov/library/publications/the-world-factbook/. 2. Kenya Institute for Public Policy Research and Analysis (2010). A Comprehensive Study and Analysis on Energy Consumption Patterns in Kenya. Nairobi. Available from www.cofek.co.ke/ERCStudy_ExecSummary_02082010.pdf. 3. Kenya National Bureau of Statistics and Communications Commission of Kenya (2011). National ICT Survey Report 2010. Nairobi. Available from http://cck.go.ke/resc/downloads/REPORT_OF_THE_NAT
IONAL_ICT_SURVEY_2010.pdf. 4. Kenya, Ministry of Energy (2012). National Energy Policy. 3
rd Draft. Nairobi.
5. Balla, P. (2006). National Study on Small Hydro Power Development: Status and Potential of Small Hydro Power Development in the Tea Industry in Kenya. Draft report presented to AFREPREN. 6. Republic of Kenya (2011). Updated least cost power development plan study period 2011-2031. Nairobi. 7. Ombok, Eric (2010). Kenya Tea Development Agency Plans to Build 10 Mini-Hydropower Projects. Daily Nation, 24 September. 8. United Nations Industrial Development Organization (2010). Independent Thematic Review: UNIDO Projects for the Promotion of Small Hydro Power for Productive Use. January. Sales No. OSL/EVA/R.1. 9. Government of Kenya (2004). Sessional Paper No.4 of 2004 on Energy. Nairobi. 10. Kenya, Ministry of Environment and Mineral Resources (2010). National Climate Change Response Strategy. Nairobi. 11. Kenya, Ministry of Energy (2010). Feed-in-Tariffs Policy on Wind, Biomass, Small-hydro, Geothermal, Biogas and Solar Resource Generated Electricity. Nairobi 12. Kenya, Ministry of Energy (2011). Scaling Up Renewable Energy Programme. Nairobi. 13. Government of Kenya (1998). The Electric Power Act, 1997. Nairobi. 14. Mureithi, James (2006). Developing Small Hydropower Infrastructure in Kenya. Presentation at the 2
nd Small Hydropower for Today Conference INSHP.
Hangzhou, 22 -25 April.

28
1.1.4 Madagascar Lara Esser, International Center on Small Hydro Power
Key facts
Population 22,005,2221
Area 587,041 km2
Climate Tropical climate along the coast, temperate in the inland and arid in the south. The wet season is from the end of December to April. River discharge decreases gradually after April. The dry season starts in the middle of October and continues to the end of December, during which the output of most hydropower plants decreases.
1
Topography The island has a high plateau and mountains in its centre, with narrow coastal plains.
Rain Pattern
Most rain falls during summer (November to April), with rainfall during winter (May to October) restricted to the southern and eastern coasts. In the south rainfall may remain low (on average less than 800 mm each year), in contrast to regions in the northeast of the country which on average receive more than 3,500 mm of annual rainfall.
2
Electricity sector overview Information on the country’s electrification rate varies. According to the German Agency for Technical Cooperation-Poverty-Oriented Basic Energy Services-European Union Energy Initiative (GTZ-HERA-EUEI) - and as of 2010, the electrification rate in Madagascar was about 23 per cent with a large difference between urban areas (rate above 60 per cent) and rural areas (less than 10 per cent).
3 According to the Rural
Electrification Agency, the national electrification rate was 10.56 per cent in urban areas and 4.07 per cent in rural areas.
4 There are three grids in the country:
Antananarivo Grid, Toamasina Grid and Fianarantsoa Grid.
5 The majority of electricity is generated using
hydropower (figure 1).
Figure 1 Electricity generation in Madagascar Source: Jiro sy Rano Malagasy
6
Note: Data from 2010. Since 2004, the fully state-owned utility responsible for the provision of electricity and water services in the
country has ceded its electricity activities to the Rural Electrification Agency (REA). REA decided to promote private sector participation in rural electrification and developed local energy plans with the aim of providing electricity to the entire country by the end of 2010.
3 It
offers a maximum of 70 per cent of investment costs to private operators, who contribute the remainder and receive the concession to utilize the plant for 10-20 years.
3 Local commercial banks are also interested to
partially finance small hydropower projects and could provide approximately 30-60 per cent of the investment costs.
3
The Ministry of Energy and Mines (MEM) is the authority having jurisdiction over the energy sector, taking charge of the investment and the development strategy policy, including foreign assistance requests. MEM issues permits for plants larger than 1 MW. Smaller plants are handled by the REA.
3 The electricity
sector is regulated under the Office de Régulation de l'Electricité (ORE). JIRAMA (Jiro sy Rano Malagasy), the state-managed company that provides electricity and water services takes charge of the technical aspects of the power sector.
5 It operates and maintains power stations,
transmission and distribution lines in the comparatively widespread electrification region, and obtains its income from the sale of electricity.
7 In general, the
majority of electric power plants are operated by JIRAMA, and the rest by the private power utility companies. In the past years, about 50 small new electrification projects were realized by private companies.
7
Small hydropower sector overview and potential There is no database for the installed small hydropower plants in Madagascar. According to the REA, there are four plants with a total installed capacity of 22.51 MW (figure 2).
4 All of them need renovation, since they were
commissioned averagely 25 years ago.
Figure 2 Small hydropower capacities in Madagascar Source: Rakotoarimanana
4
In 2006, the REA as part of its objective to promote renewable energy projects sponsored seven small hydropower plants which are located in a radius of not more than 120 km of the capital Antananarivo.
4
55.95%
44.05%
< 0.01%
0% 10% 20% 30% 40% 50% 60%
Hydropower
Thermal
Solar
23 MW
unknown
2600 MW
101 MW
0 500 1000 1500 2000 2500 3000
SHP potential (> 10 MW)
SHP installed capacity (>10 MW)
SHP potential (up to 10 MW)
SHP installed capacity (up to 10 MW)

29
Table 1 Installed small hydropower capacity in Madagascar
Date Town/ Village District Region Operator Production mode
Installed capacity
THER (kVA)
RE (kW)
1986 Sahamadio Fandriana Amoroni Mania JIRAFI MHP + GE 275 160
1992 Milamaina Fandriana Amoroni Mania JIRAFI MHP + GE .. ..
2003 Antetezambato Ambositra Amoroni Mania ADITSARA MHP .. 53
2003 Mangamila Anjozorobe Analamanga ELEC /EAU MHP 15 85
2003 Ranotsara Nord Iakora Ihorombe VITASOA MHP .. 25
2005 Imerimandroso Ambatondrazaka Alaotra Mangoro SAEE GE + MHP 60 ..
2006 Ankililoaka Toliara II Atsimo Andrefana SM3E GE + MHP .. ..
2006 Morarano Amparafaravola Alaotra Mangoro MCH + GE .. ..
2006 Amparihints Ambatondrazaka Alaotra Mangoro SAEE GE + MHP 30 ..
2006 Andromba Ambatondrazaka Alaotra Mangoro SAEE GE + MHP 45 ..
2006 Andrebakely Ambatondrazaka Alaotra Mangoro SAEE GE + MHP 30 ..
2006 Vohimena Ambatondrazaka Alaotra Mangoro SAEE GE + MHP 40 ..
Source: United Nations Industrial Development Organisation8
Note: MHP – micro hydropower, GE – diesel generator. THER – thermal, kVA – kilovolt ampere, RE – renewable energy
Table 1 shows some of the installed small hydropower in the country. The theoretical overall hydropower potential of Madagascar has been estimated at 7,000 GW of installed capacity.
5 The economically feasible potential
has not yet been determined. According to a questionnaire sent to REA, the small hydropower potential was evaluated in 2010 and the gross potential was 5,600 MW, technical potential 3,200 MW and economically feasible potential was 2,600 MW. The definition used however to define small hydropower was >10 MW.
4 A desktop study by German Agency for
Technical Cooperation-Promotion of Rural Electrification by Renewable Energies (GTZ-PERER) assembled a data set of at least 700 potential sites, but the technical and economic potential can be expected to be far lower.
3
Table 2 Small hydropower potential in Madagascar
Study source Potential capacity (MW)
Range of sites
Number of plants
ADERa >150.00 19 kW – 10 MW 60 MEMb 48.19 40 kW - 6.5 MW 28
Source:
a. Leutwiler7
b. NewJec 5
Note: ADER - Agence pour le Développement de l'Electrification Rurale, MEM - Madagascar Ministry of Enyerg and Mines There are about 60 potential small hydropower sites ranging between 19 kW and 10 MW in capacity, with a total potential of more than 150 MW. According to the NewJec Report in 2009, 48.19 MW capacity of small
hydropower potential was available in Madagascar, with a potential electricity production of 398.28 GWh/year.
7
GTZ-PERER also supported a large project where 50 small hydropower feasibility studies were to be concluded by the end of 2010. The project activities are linked with the introduction of the software Geosim to establish regional energy investment plans and prioritize sites on the basis of demand and accessibility; however up-to-date information is not available.
3
In the Sava Region of North Eastern Madagascar, Electricité de Madagascar had finalized the feasibility study for a mini-hydropower plant and distribution networks to be implemented in the Lokoho river basin, in order to supply electricity to the two small towns of Andapa and Sambava and surrounding rural villages.
9
The project would have provided electrical power of up to 6 MW to the surrounding areas if the small hydropower generators had been replaced. However a political crisis in Madagascar occurred in 2009 during which Electricité de Madagascar planned to launch its tenders, since then the project has been frozen.
10
The hydropower development programme (Programme rivière 2008-2012) aimed to supply eight rural communities with a total of 14,000 inhabitants with electricity from micro-hydropower. The programme included the design and testing of mechanisms in the sector ‘small autonomous networks’ adapted to the rural world, with the active participation of local actors, e.g. Malagasy entrepreneurs involved in the manufacturing of turbines. These innovations in

30
different regions should then serve as benchmark demonstrations.
7
Some agricultural projects in Madagascar need large amounts of energy, mostly for pumping water for irrigation and feeding ponds for shrimp farming. The option to use hydropower instead of diesel engines is in discussion. Similar projects are being developed for mining sites.
7
There are currently two local turbine manufacturers in Madagascar: AIDER and Vitasoa, who manufacture Banki and Pelton turbines with a capacity of up to 30 kW. Because of limitations in technical expertise in the country, large turbines and all generators are imported.
3
Renewable energy policy The MEM has a policy to promote the development of the abundant renewable energy potentials for rural electrification to replace the existing diesel thermal power plants with renewable energy systems such as small or micro hydropower plants. In 2009, MEM was preparing a power source development plan in cooperation with the ORE.
5
Barriers to small hydropower development Lack of funding for private investments and lack of a transparent model for commercialization are important small hydropower development barriers. The fact that the country does not have an electricity network is another barrier to small hydropower development. At least in the coming decade, small hydropower projects will typically not feed into a grid, which is detrimental to the financial viability of these types of projects.
3
A feed-in tariff (FIT) is neither in place nor on the current policy agenda. JIRAMA has been reluctant to offer favourable FITs.
11 Only two operators of small
hydropower plants have managed to conclude individual feed-in contracts with JIRAMA on the basis of a 10-years tenure and a rather low FIT, of approximately €0.04 per kWh.
3
The other barriers to the development of small hydropower in rural areas are:
7
long distance between consumption points and potential sites;
low population density and low electricity demand;
low utilization factor;
prohibitive high capital costs;
lack of capital and liquidity by entrepreneurs.
Furthermore, economic potential sites for energy production with high heads, which are favourable for development, are located in isolated areas what
considerable increases transport costs.6 Easily accessible
sites tend to have low heads and therefore, they are technically and economically less attractive. Site selection among alternatives (i.e. high vs. low head, large vs. small sites) are ultimately political decisions, considering the social and economic synergies and ecological impacts, according to different sites in question, especially given a systemic development of the landscape. Low institutional capacity and experience to manage a strategic resource, such as water, is also a challenge.
6
References 1. The National Institute of Statistics (2011). Population and démographie. Effectif de la population de Madagascar. Available from www.instat.mg/index.php?option=com_content&view=article&id=33&Itemid=56. Accessed December 2012. 2. Tadross, Mark, Luc Randriamarolaza, Zo Rabefitia and Zheng Ki Yip (2008). Climate change in Madagascar: recent past and future. Madagascar. Available from www.gripweb.org/gripweb/sites/default/files/disaster_risk_profiles/Madagascar%20Climate%20Report.pdf. 3. Gaul Mirco, Fritz Kölling and Miriam Schröder (2010). Policy and regulatory framework conditions for small hydro power in Sub-Saharan Africa: Discussion paper. Eschborn. Available from www.giz.de/Themen/en/dokumente/gtz2010-en-HERA-EUEI-PDF-framework-conditions-hydropower.pdf. 4. Rakotoarimanana Mamisoa Fidele (2011). Agence de Developpement de l’Electrification Rurale in Madagascar. Survey by International Center for Small Hydro Power answered in October 2011. 5. NEWJEC In. Engineering and Consulting Firms Association (2009). Preliminary Study for Expansion of Manandona Hydroelectric Power Plant in Madagascar. Study Report. Tokyo. Available from www.ecfa.or.jp/japanese/act-pf_jka/H21/newjec/english.pdf. 6. Jiro sy rano malagasy (2012). Production Electricité 2011. Available from www.jirama.mg/index.php?w=scripts&f=Jirama-page.php&act=pdcelec . Accessed December 2012. 7. Hanspeter Leutwiler (2008). Valorisation des potentiels hydroélectriques pour l'électrification rurale à Madagascar. Final Report. Affoltern. 8. Beguerie, Victor and Kevin Blanchard (2010).The potential for renewable energies in rural areas of Madagascar. United Nations Industrial Development Organization. 9. Global Electricity (2007). Energy in Action e8. Montreal. Available from www.globalelectricity.org/upload/File/07293_brochure
_energyinaction-7_0_final.pdf.

31
10. Électricité de Madagascar (2012). Étude de faisabilité de la centrale hydroélectrique de Lokoho. Andraharo. Available from www.edm.mg/index.php/fr/etude-lokoho.html. 11. Energypedia (2011). Homepage. Available from
https://energypedia.info/wiki/Main_Page.
32
1.1.5 Malawi Diliza Wanyavinkhumbo Nyasulu, SunPower Technologies, Malawi Key facts
Population 16,323,0441
Area 118,484 km2
Climate Sub-tropical climate, relatively dry and strongly seasonal
Topography Narrow elongated plateau with rolling plains, rounded hills, some mountains
1
Rain Pattern
Rainy and dry season exist. The warm-wet season stretches from November to April, during which 95% of the annual precipitation takes place. Annual average rainfall varies from 725 mm to 2,500 mm.
2
Electricity sector overview Only an estimated seven per cent of the population in Malawi has access to electricity, even then it is often supplied in a shortage manner with frequent blackouts.
3
The country is experiencing an increased demand for energy which is often met by the use of biomass although Malawi is endowed with a considerable access to alternative energy resources. These include solar, wind, hydro and low yield geothermal resources.
3 Nearly
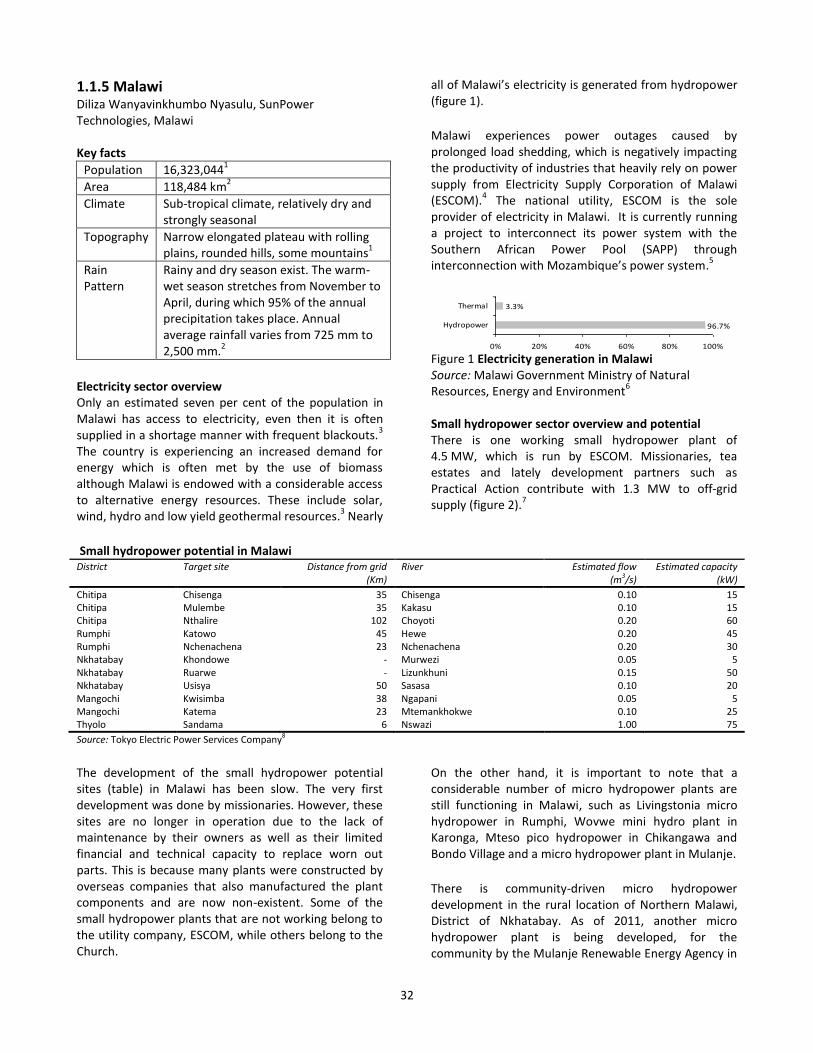
all of Malawi’s electricity is generated from hydropower (figure 1).
Malawi experiences power outages caused by prolonged load shedding, which is negatively impacting the productivity of industries that heavily rely on power supply from Electricity Supply Corporation of Malawi (ESCOM).
4 The national utility, ESCOM is the sole
provider of electricity in Malawi. It is currently running a project to interconnect its power system with the Southern African Power Pool (SAPP) through interconnection with Mozambique’s power system.
5
Figure 1 Electricity generation in Malawi Source: Malawi Government Ministry of Natural Resources, Energy and Environment
6
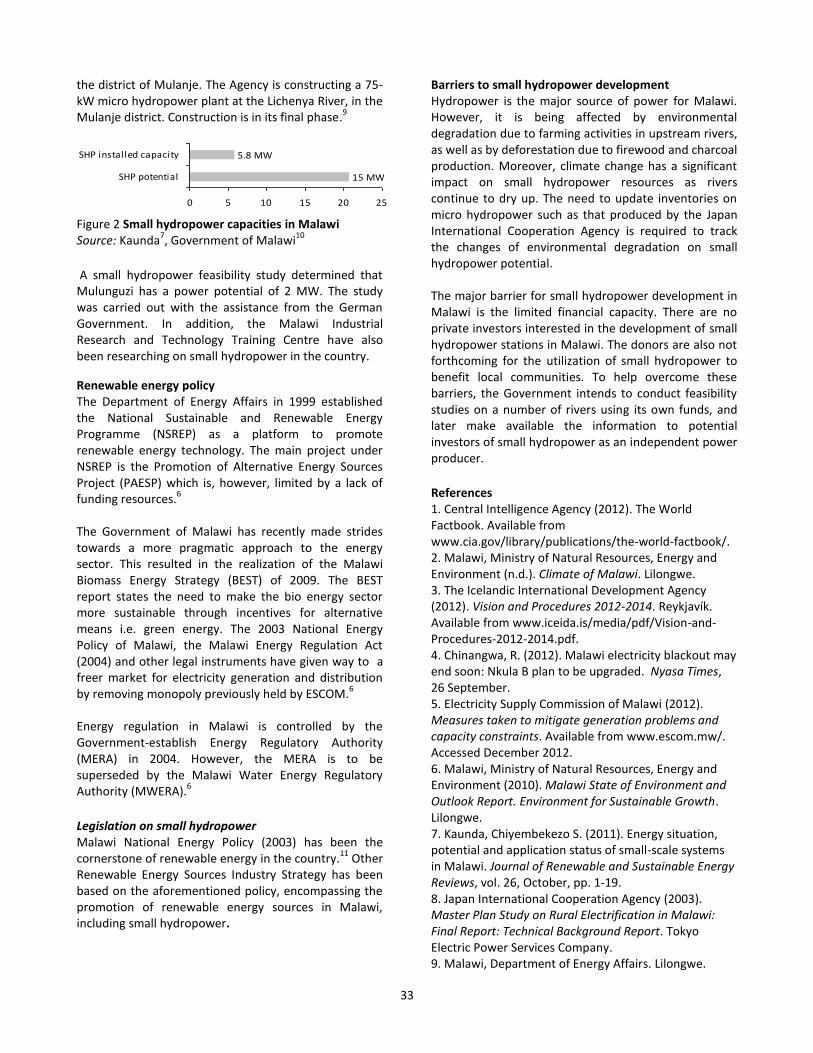
Small hydropower sector overview and potential There is one working small hydropower plant of 4.5 MW, which is run by ESCOM. Missionaries, tea estates and lately development partners such as Practical Action contribute with 1.3 MW to off-grid supply (figure 2).
7
Small hydropower potential in Malawi District Target site Distance from grid
(Km) River Estimated flow
(m3/s) Estimated capacity
(kW) Chitipa Chisenga 35 Chisenga 0.10 15 Chitipa Mulembe 35 Kakasu 0.10 15 Chitipa Nthalire 102 Choyoti 0.20 60 Rumphi Katowo 45 Hewe 0.20 45 Rumphi Nchenachena 23 Nchenachena 0.20 30 Nkhatabay Khondowe - Murwezi 0.05 5 Nkhatabay Ruarwe - Lizunkhuni 0.15 50 Nkhatabay Usisya 50 Sasasa 0.10 20 Mangochi Kwisimba 38 Ngapani 0.05 5 Mangochi Katema 23 Mtemankhokwe 0.10 25 Thyolo Sandama 6 Nswazi 1.00 75 Source: Tokyo Electric Power Services Company8 The development of the small hydropower potential sites (table) in Malawi has been slow. The very first development was done by missionaries. However, these sites are no longer in operation due to the lack of maintenance by their owners as well as their limited financial and technical capacity to replace worn out parts. This is because many plants were constructed by overseas companies that also manufactured the plant components and are now non-existent. Some of the small hydropower plants that are not working belong to the utility company, ESCOM, while others belong to the Church.
On the other hand, it is important to note that a considerable number of micro hydropower plants are still functioning in Malawi, such as Livingstonia micro hydropower in Rumphi, Wovwe mini hydro plant in Karonga, Mteso pico hydropower in Chikangawa and Bondo Village and a micro hydropower plant in Mulanje.
There is community-driven micro hydropower development in the rural location of Northern Malawi, District of Nkhatabay. As of 2011, another micro hydropower plant is being developed, for the community by the Mulanje Renewable Energy Agency in
3.3%
96.7%
0% 20% 40% 60% 80% 100%
Hydropower
Thermal
33
the district of Mulanje. The Agency is constructing a 75-kW micro hydropower plant at the Lichenya River, in the Mulanje district. Construction is in its final phase.
9
Figure 2 Small hydropower capacities in Malawi Source: Kaunda
7, Government of Malawi
10
A small hydropower feasibility study determined that Mulunguzi has a power potential of 2 MW. The study was carried out with the assistance from the German Government. In addition, the Malawi Industrial Research and Technology Training Centre have also been researching on small hydropower in the country.
Renewable energy policy The Department of Energy Affairs in 1999 established the National Sustainable and Renewable Energy Programme (NSREP) as a platform to promote renewable energy technology. The main project under NSREP is the Promotion of Alternative Energy Sources Project (PAESP) which is, however, limited by a lack of funding resources.
6
The Government of Malawi has recently made strides towards a more pragmatic approach to the energy sector. This resulted in the realization of the Malawi Biomass Energy Strategy (BEST) of 2009. The BEST report states the need to make the bio energy sector more sustainable through incentives for alternative means i.e. green energy. The 2003 National Energy Policy of Malawi, the Malawi Energy Regulation Act (2004) and other legal instruments have given way to a freer market for electricity generation and distribution by removing monopoly previously held by ESCOM.
6
Energy regulation in Malawi is controlled by the Government-establish Energy Regulatory Authority (MERA) in 2004. However, the MERA is to be superseded by the Malawi Water Energy Regulatory Authority (MWERA).
6
Legislation on small hydropower Malawi National Energy Policy (2003) has been the cornerstone of renewable energy in the country.
11 Other
Renewable Energy Sources Industry Strategy has been based on the aforementioned policy, encompassing the promotion of renewable energy sources in Malawi, including small hydropower.
Barriers to small hydropower development Hydropower is the major source of power for Malawi. However, it is being affected by environmental degradation due to farming activities in upstream rivers, as well as by deforestation due to firewood and charcoal production. Moreover, climate change has a significant impact on small hydropower resources as rivers continue to dry up. The need to update inventories on micro hydropower such as that produced by the Japan International Cooperation Agency is required to track the changes of environmental degradation on small hydropower potential. The major barrier for small hydropower development in Malawi is the limited financial capacity. There are no private investors interested in the development of small hydropower stations in Malawi. The donors are also not forthcoming for the utilization of small hydropower to benefit local communities. To help overcome these barriers, the Government intends to conduct feasibility studies on a number of rivers using its own funds, and later make available the information to potential investors of small hydropower as an independent power producer.
References 1. Central Intelligence Agency (2012). The World Factbook. Available from www.cia.gov/library/publications/the-world-factbook/. 2. Malawi, Ministry of Natural Resources, Energy and Environment (n.d.). Climate of Malawi. Lilongwe. 3. The Icelandic International Development Agency (2012). Vision and Procedures 2012-2014. Reykjavík. Available from www.iceida.is/media/pdf/Vision-and-Procedures-2012-2014.pdf. 4. Chinangwa, R. (2012). Malawi electricity blackout may end soon: Nkula B plan to be upgraded. Nyasa Times, 26 September. 5. Electricity Supply Commission of Malawi (2012). Measures taken to mitigate generation problems and capacity constraints. Available from www.escom.mw/. Accessed December 2012. 6. Malawi, Ministry of Natural Resources, Energy and Environment (2010). Malawi State of Environment and Outlook Report. Environment for Sustainable Growth. Lilongwe. 7. Kaunda, Chiyembekezo S. (2011). Energy situation, potential and application status of small-scale systems in Malawi. Journal of Renewable and Sustainable Energy Reviews, vol. 26, October, pp. 1-19. 8. Japan International Cooperation Agency (2003). Master Plan Study on Rural Electrification in Malawi: Final Report: Technical Background Report. Tokyo Electric Power Services Company. 9. Malawi, Department of Energy Affairs. Lilongwe.
15 MW
5.8 MW
0 5 10 15 20 25
SHP potential
SHP installed capacity

34
10. Malawi, Government (2009). Concept Paper for the Energy Sector 2011-2016: Millennium Challenge Account. Malawi Country Office. Lilongwe. 11. Malawi, Ministry of Energy and Mining (2003). National Energy Policy. January. Lilongwe.
35
1.1.6 Mauritius Lara Esser, International Center on Small Hydro Power Key facts
Population 1,313,0951
Area 2.040 km2.
Climate Tropical, with warm, dry winters (May to November) and hot, wet, humid summers (November to May)
Topography Small coastal plain rising to discontinuous mountains encircling central plateau
1
Rain Pattern
Long term mean annual rainfall (1971-2000) over the Island is 2,010 mm. Wettest months: February and March. Driest month: October. Mean summer rainfall is 1,344 mm, which is 67% of the annual amount over the Island. Mean winter rainfall is 666 mm. Although there is no marked rainy season, most of the rainfall occurs in summer months.
2
Electricity sector overview Electrification rate in Mauritius is 99.4 per cent: 100 per cent in urban areas and 99 per cent in rural areas.
3 Its
total installed electricity generation capacity was 740.2 MW in 2010 (annual generation 2688.7 GWh/ year).
3 The annual electricity generation from hydro-
power was 100.7 GWh/year.3 Installed hydropower
generation capacity is 59 MW (two large and six small hydropower plants).
3
Mauritius’s electricity is produced by the Central Electricity Board (CEB) and independent power producers (IPPs). In 2008, IPPs contributed 52.27 per cent of the electricity based on thermal sources (i.e. coal and bagasse) which dominate the Mauritian electricity generation (figure1).
4
Figure 1 Electricity generation in Mauritius Source: Central Electricity Board
4
Note: Data from 2008. Small hydropower sector overview and potential The classification of small hydropower in Mauritius is quite different from the generally accepted 10-MW capacity value, defining small hydropower up to 50 kW only.
In light of the 10-MW small hydropower definitions, there were only six small hydropower plants in Mauritius in 2010 with a combined capacity of 8.7 MW, which produced 15.2 GWh/year (figure 2). On average the small hydropower plants are over 45 years, in 2008 two of the plants were fully refurbished. One plant was commissioned in 2010 and five of the plants are more than 50 years old.
3
Figure 2 Small hydropower capacities in Mauritius Source: Mauritius, Ministry of Energy and Public Utilities
3
The large scale hydropower potential of the country has been almost fully tapped. Nevertheless, the Government’s long-term strategy encourages the set-up of mini hydropower schemes where economically viable. Additional small hydropower capacity is to be completed by 2015 including one unit at Midlands Dam (0.375 MW) and one unit at the Bagatelle Dam (0.375 MW).
3
Renewable energy policy The Mauritian Government aims to have a 24-per cent share of total electricity production from renewable energy sources by 2015, 28 per cent by 2020 and 35 per cent by 2025. Small hydropower should have a share of 3 per cent by 2020 and 2 per cent by 2025.
3
Legislation on small hydropower All power-generation projects are subject to an environmental impact assessment (EIA). However, for hydropower projects with capacity up to 50 kW, an EIA waiver may be sought in writing from the EIA department of the Ministry of Environment and Sustainable Development.
3
Feed-in tariffs (FIT) subsidized by the Government under the Small Scale Distributed Generation (SSDG) scheme support the development of small hydropower. The Small Scale Distributed Generation (SSDG) scheme was launched in December 2010 to provide an incentive for electricity generation for personal consumption via renewable resources for a total capacity of 2 MW. This target was met in May 2011 thus encouraging the second phase of the SSDG project under which FITs for a further 1 MW were allocated specifically in 2013:
5
54.03%
40.59%
5.38%
0% 10% 20% 30% 40% 50% 60%
Bagasse and coal
Thermal fuel oil and kerosene
Hydropower
9.5 MW
8.7 MW
8.2 8.4 8.6 8.8 9 9.2 9.4 9.6
SHP potential
SHP installed capacity

36
100 kW from PV’s in residential (50 kW), commercial and industrial (50 kW) sectors in Rodrigues.
900 kW from wind, solar and hydropower in Mauritius.
The FIT costs of various renewable sources are decrypted in the table below. Tariff for renewable resources in Mauritius, over a period of 15 years
Tariff for 15 years Wind (Rs/kWh)
Hydro (Rs/kWh)
Photovoltaic (Rs/kWh)
Micro (up to 2.5 kW) 20 15 25
Mini (2.5 - 10 kW) 15 15 20
Small (10 - 50 kW) 10 10 15
Source: Central Electricity Board5
However, from 6 May 2011 onwards no new applications for a FIT will be accepted as the target of 2 MW and thereafter 1 MW have been met. The CEB is currently examining the applications received to assess the compliance with the Grid Code provided.
6
Barriers to small hydropower development According to the Ministry of Energy and Public Utilities, the following are obstacles for small hydropower development: restricted catchment areas, lack of road access to sites, seasonal fluctuations in water flow, high installation costs, relatively flat island topography and very competitive use of water.
3
References 1. Central Intelligence Agency (2012). The World Factbook. Available from www.cia.gov/library/publications/the-world-factbook/. 2. Mauritius Meteorological Services (2010). Climate of Mauritius. Available from http://metservice.intnet.mu/?page_id=644. 3. Mauritius, Ministry of Energy and Public Utilities (2011). Survey by International Center for Small Hydro Power answered in October 2011. 4. Central Electricity Board (2012). Energy with Vision - Annual Report 2009. Curepipe. Available from http://ceb.intnet.mu/CorporateInfo/CorpInfo.asp. 5. Central Electricity Board (2012). Communiqué, Extension du project Small Scale Distributed Generation. Curepipe. Available from http://ceb.intnet.mu/grid_code/document/Communique%20SSDG-Dec%202011.pdf. 6. Central Electricity Board (2011). Notice 6 May 2011. Curepipe. Available from http://ceb.intnet.mu/grid_code/document/notice_may2011.pdf.

37
1.1.7 Mozambique Wim Jonker Klunne, Council for Scientific and Industrial Research, South Africa Key facts
Population 23,515,9341
Area 799,380 km2
Climate Tropical to subtropical
Topography Mostly coastal lowlands, uplands in center, high plateaus in northwest, mountains in west
1
Rain Pattern
Mean annual rainfall is between 800 to 1,000 mm at the coastal strip, it declines to less than 400 mm in the dry interior bordering Zimbabwe.
1
Electricity sector overview The total installed electricity capacity in Mozambique is 2.308 GW in 2009, nearly all generated exclusively from hydropower (99.7 per cent). Mozambique has large reserves of coal. There are utilizable reserves of natural gas that might be as high as 3 trillion cubic feet. Natural gas is exported to South Africa via a pipeline. The current electricity generation in Mozambique is dominated by hydropower which supplies 95 per cent of the electricity demand followed by 5 per cent supplied via various thermal alternatives (figure 1). Mozambique is a net exporter of electricity: 73.44 per cent of the 2,075 MW generated by the company, Hidroelectrica de Cahora Bassa (HCB) is exported to South Africa. The country’s electrification access is 14 per cent, estimated at 26 per cent in urban areas and 5 per cent in rural areas. In the latter, kerosene is the main fuel for lighting. The State-owned utility Electricidade de Mozambique (EDM) prepared a Master Plan for the expansion of the country’s national power grid and distribution networks with the goal of reaching 15 per cent of the population by 2020, a target that had been achieved in 2010.
2
In Mozambique’s Plan for the Reduction of Absolute Poverty II (PARPA II), the Government has affirmed the critical role of the energy sector in reducing poverty. The importance of the energy sector is also emphasized in the World Bank’s 2008–2011 Country Partnership Strategy (CPS), which identifies adequate access to energy resources and services as a key driver of economic growth and poverty alleviation. The CPS prioritizes the provision of energy services to rural schools, administrative posts, hospitals and clinics. At
present, energy-related goals set in PARPA II are being turned into strategies such as the Off-grid and Renewable Energy Strategy, Generation and Transmission Master Plan, North–South (Backbone) Transmission Least-Cost Study, and National Biofuels Strategy.
3
The major players in the supply of electricity in Mozambique are EDM, the state-owned power utility, HCB and MoTraCo.
4 EDM is involved in all parts of the
electricity supply chain, including some generation (although it is not the primary generator in the country), transmission, distribution, and consumer connection, supply and billing. HCB manages and operates the Cahora Bassa hydropower stations and their associated transmission networks that supply power to the Southern African Power Pool (SAPP). The installed capacity of 2,075 MW at the Cahora Bassa dam makes this the primary electricity source for both Mozambique and Southern Africa as a whole.
5
MoTraCo is the third major supplier of electricity in Mozambique and it’s a joint venture company formed by the state power companies in Mozambique, South Africa and Swaziland to transport power from South Africa to the Maputo-based Mozambique Aluminium Smelter (Mozal) plant. The company manages transmission lines in these three countries and was created in 1998 through an equity debt arrangement worth US$120 million.
Figure 1 Electricity generation in Mozambique Source: Electricidade de Mozambique
6
Small hydropower sector overview and potential Mozambique’s greatest hydropower potential lies in the Zambezi River basin at sites such as Cahora Bassa North and Mphanda Nkuwa. So far, about 2,200 MW of generating capacity have been developed. In addition, the potential for small hydropower projects of 190 MW, which includes 6 MW of micro hydropower (plant capacity lower than 2 MW), 18 MW of mini hydro (capacities between 2 MW and 6 MW) and 166 MW of small hydropower (capacities between 8 MW and 15 MW). Potential sites for these micro hydropower schemes are located in the mountainous terrain and perennial streams and rivers of Manica, Tete and Niassa provinces.
3
95%
5%
0% 20% 40% 60% 80% 100%
Hydropower
Thermal

38
A study on medium-sized and large plants reveals that the small hydropower potential is very high in the Central (Sofala, Manica and Zambézia provinces) and Northern (Nampula, Cabo Delgado and Niassa provinces) parts of the country. The South (Maputo, Gaza and Inhambane provinces) is relatively poor in hydropower resources for energy generation. The tea-producing areas, which are concentrated in the districts of Gurue, Ile, Milange and Lugela in Zambézia Province, also have high potential hydropower resources, according to an energy survey undertaken by the National Energy Fund (FUNAE) in 2004. An Intermediate Technology Development Group (ITDG) publication gives an overview of micro hydropower potential in Mozambique, especially in Manica Province, while a scoping study for micro hydropower investments in the provinces of Manica, Niassa and Tete undertaken by ITDG for the Energy Reform and Access Project of the World Bank, identifies the critical issues in developing the hydropower sector.
7 8
Figure 2 Small hydropower capacities in Mozambique Source: Hankins
4
Note: The potential may include plants larger than 10 MW and is different than other sources. In the Policy for Renewable Energy and Master Plan for Off-Grid Electrification, a list of 60 identified hydropower locations is provided.
9 The Department of
Energy estimates that over 60 potential micro- and mini-hydropower projects with a potential of up to 1,000 MW exist in the country. The central part of the country (Manica Province) has the best resources (table 1).
4
Table 1 Government hydropower projects in Mozambique
Project
Installed capacity (kW)
River Pre-feasibility
Distance to nearest village (km)
Location (District, province)
Mbahu 2 000 Lucheringo Yes 30.0 Lichinga, Niassa Majaua 1 000 Majaua Yes - Milange, Zambezia Kazula 30 Lazula Yes ~12.0 Chiuta, Tete Maue 280 Maue Yes ~1.0 Angonia, Tete Mavonde 30 Nhamukwarara - 3.0 Manica,Manica Rotanda 30 Rotanda Yes ~1.5 Sussundenga, Manica Sembezeia 30 Bonde - 2.0 Sussundenga, Manica Honde 75 Mussambizi Yes 4.0 Barue, Manica Choa 20 Nhamutsawa - ~2.5 Barue, Manica
Source: Hankins4
Currently six hydro stations are connected to the national grid (table 2), while a substantial number of off-grid systems do exist. Table 2 Grid connected hydropower stations in Mozambique
Name Province Capacity (MW)
Cahora Bassa Tete 2 075.00 Mavuzi Sofala 52.00 Chicamba Manica 38.40 Corrumana Maputo 16.60 Cuamba Niassa 1.10 Lichinga Niassa 0.75
Source: KPMG9
There is a growing interest in Mozambique to promote the use of small-scale hydropower schemes for isolated rural communities. One example of this is the Honde scheme, in the Province of Manica (Bárue District). The project started in 2005 and is able to electrify a 200-household village, a health centre, a school, two maize
mills and shops, all by a micro hydropower plant on the Muzambizi River. The total demand was determined to be 65 kW and the scheme was sized at 75 kW taking into account of the demand growth. The project is being implemented by the provincial government of Manica, with support from the German Agency for Technical Cooperation GTZ (now Deutsche Gesellschaft für Internationale Zusammenarbeit - GIZ) .
9
Besides the national Government of Mozambique, a number of NGOs and bi-lateral donors are active in the micro hydropower field. Practical Action and their Mozambican counterpart Kwaedza Sumukai Manica (KSM) are developing village electrification projects following what they called the ‘generator model’. This model is built around a private entrepreneur generating electricity for the community, while the local transmission and distribution infrastructure will be owned by the community.
10 The GIZ has also worked
with local entrepreneurs to extend their business from milling to local electricity distribution and has upgraded
1000 MW
2.1 MW
0 500 1000 1500
SHP potential
SHP installed
capacity
39
three systems, supporting local production of turbines. GIZ is currently assisting local education institutes in Chimoio, Manica province, to set up a local hydropower training and knowledge centre.
11 12 13
Renewable energy policy The reforms in the energy sector have created the necessary enabling environment for private investments in the sector. Particularly the 1997 Electricity Act foresees the granting of concessions for private energy production, distribution and sales. The private sector can operate its own generating system, provide electricity to surrounding communities and sell its energy surplus to the state power utility while buying energy from the utility when it is required. Furthermore, the Energy Fund Fundo de Energia (FUNAE), with its focus on rural electrification using renewable energy technologies, will provide good support for possible private investors, as some of the resources needed for the rehabilitation and/or construction of new hydropower schemes can be mobilized locally. However, it is important that the Government actively encourages private sector investment in renewable energy projects in Mozambique and creates clear incentives for investors, manufacturers and developers to utilize renewable energies when making investments in the country. Renewable energy support should not be targeted exclusively at off-grid initiatives and poverty alleviation, and renewables should be encouraged in economically active sectors, including tourism, telecommunications and commercial enterprises, as well as among middle-class households.
3
Legislation on small hydropower On the regulatory side, hydropower installations are required to have a water use concession which is regulated under the Water Policy. In fact, the Water Policy mentions the use of water resources for stand-alone and dam-connected hydropower purposes and states that small- and medium-scale hydropower facilities should be encouraged for off-grid electricity in remote areas, extension of the national electricity grid production and transmission capacity, as well as economic development in general.
9
Barriers to small hydropower development The main barriers to the development of small hydro projects in Mozambique include the lack of framework to support independent power producers. Reducing the uncertainty of the project revenue streams and increasing the availability of project finance would help to promote economically sustainable projects. The following measures are suggested by the International
Renewable Energy Agency to improve project bank-ability: - Electricidade de Mozambique could take a small
equity stake in small hydropower projects to reinforce the credibility of its long-term power purchase agreement;
- The Ministry could work with the donor group to develop a partial risk-guarantee fund with financial institutions in Mozambique to promote lending to small hydro projects;
- A system of feed-in tariffs could be developed to provide long-term power purchase agreements, access to the grid and attractive return on investment;
- Consultations could be held with stakeholders to design a simpler process for environmental impact assessment for small run-of-river hydro plants.
14
In overall perspective the local situation in Mozambique seems quite favourable to the development of small hydropower, although it has proven to be difficult to attract private sector funding. References
1. Central Intelligence Agency (2012). The World Factbook. Available from www.cia.gov/library/publications/the-world-factbook/. 2. Clean Energy Information Portal: Reegle (2011). Country Energy Profile: Mozambique. 2011. Available from www.reegle.info. 3. Chambal, Hélder (2010). Energy Security in Mozambique, Series on Trade and Energy Security : Policy Report 3. Manitoba. Available from www.iisd.org/tkn/pdf/energy_security_mozambique.pdf. 4. Hankins, Mark (2009). A Renewable Energy Plan for Mozambique. Nairobi. Available from www.internationalrivers.org/files/attached-files/clean_energy_for_mz_30_9_09.pdf. 5. Chambers, Helen (2010). Trade Knowledge Network, Series on Trade and Energy Security - Policy Report 3, Energy Security in Mozambique. Manitoba. 6. Electricidade de Mozambique (2010). Statistical Summary 2010. Maputo. 7. Barnett, Andrew and Smail Khennas (2000) Best practices for sustainable development of micro hydro power in developing countries. Warwickshire. Available from www.microhydropower.net/download/bestpractsynthe.pdf. 8. Practical Action (2005). Report on the scoping study for micro hydro investments in Mozambique. Warwickshire. 9. KPMG (2008). Policy for Renewable Energy and Master Plan for Off-Grid Energy Phase II. KPMG.

40
10. Mutubuki-Makuyana, Chandirekera Sarah (2010). Financial and Ownership Models for Micro-hydro Schemes in Southern Africa. Harare. 11. German Agency for Technical Cooperation (2009). GTZ-AMES M, Rehabilitation of Maize Mills for Energy Services in Chua Village: Jimy. Eschborn. 12. German Agency for Technical Cooperation (2009). GTZ-AMES M, Rehabilitation of Maize Mills for Energy Services in Chua Village: Nquarai. Eschborn. 13. Villa, Juan Pablo (2012). Draft plan for Chimoio’s Excellence Center Hydropower Division. Oldenburg. Available from https://energypedia.info/wiki/EN_Draft_plan_for_Chimoio%E2%80%99s_Excellence_Center_Hydropower_Division_Juan_Pablo_Villa. 14. Wooders, Peter and Kitson, Lucy (2012). Country Case Study Renewables Readiness Assessment: Mozambique Preliminary findings. Abu Dhabi. 15. Agricultural Research Council (n.d.). Limpopo Basin – Draft. Pretoria. Available from www.arc.agric.za/limpopo/pdf/basin_profile_part1a.pdf 16. Klunne, Wim Jonker (2013). African hydropower database: Hydro stations in Mozambique. Presentation at Council for Scientific and Industrial Research. Durban. 13 June. 17. Gesellschaft für Technische Zusammenarbeit- Access to Modern Energy Services Mozambique (2009). Rehabilitation of Maize Mills for Energy Services in Chua Village: Lino. Eschborn.

41
1.1.8 Réunion Lara Esser and Laxmi Aggarwal, International Center on Small Hydro Power Key facts
Population 833,0001
Area 2,512 km2
Climate Tropical and humid. Warm and humid season (November to- April), drier season (May to October)
Topography Island with coast and mountain peaks in the interior.
Rain Pattern
The Austral summer is in January and February, which is also the season for tropical cyclones. The country is the record holder for the highest rainfall during 12-, 24-, 48- and 72-hours.
2
Electricity sector overview Réunion island is an overseas department and administrative region of France. Réunion has the goal to reach 100 per cent of renewable electricity production by 2030.
3 Electricity is provided by Électricité de France
(EDF). The total electricity production in 2008 was 2,546 GWh, from a mix of thermal and renewable sources, with coal being the dominating energy source (figure 1).
Interestingly, the electricity production in 1982 relied solely on hydropower.
4 Data in 2009 showed that
projects that generate electricity increased to 2,618 GWh, of which 67.5 per cent is from fossil fuels (petroleum and coal) and 32.5 per cent from renewable energy.
5 The breakdown of the various energy sources is
unavailable, hence this report projected the data from 2008 instead (figure 1). The average growth of electricity production in Réunion had decreased from 5.3 per cent per year between 2000 and 2005 to 3.6 per cent per year from 2006 to 2009 as a result of a demand management program authorized in 2000 and an increased use of costly fossil fuel.
5
Figure 1 Electricity generation in Réunion Source: Drouineau et al.
4
Note: Data from 2008, as data projections for 2009 do
not provide sufficient detailed breakdown of the contribution of various energy sources.
Réunion has invested in a diverse range of renewable energy sources but the most developed source is hydropower as it was one of the first renewable sources used on the island.
5
Small hydropower sector overview and potential
Figure 2 Small hydropower capacities in Réunion Source: Grenelle de l’Environnement à la Réunion, Réussir l’Innovation
6, Forum for Energy and
Development7
Hydropower is produced at Rivière de l’Est (78 MW), Takamaka I (17 MW) and II (26 MW), Bras de la Plaine (5 MW) and Langevin (4 MW) power stations as well as Bras des Lianes (2 MW).
4 7 Though the large- and small-
hydropower potential has been tapped, there still are a number of potential sites, where micro hydropower stations can be installed.
7
A technical report from 2008 indicated that there were four run-of-river type stations with a total installed capacity of 10.5 MW (62.65 GWh) and three stations with a total capacity of 106.5 MW (550,000 GWh).
8
There is no pumped storage technology on the island. Taking into consideration environmental issues, there are several further categories for the realization of hydropower potential, such as irrigation infrastructure. Small hydropower potential in Réunion (Megawatts)
Category of potential Potential capacity
Difficult to realize 59.10 Under strict conditions 50.53 Normal 11.47
Total 121.10
Source: Comité de bassin de la Réunion8 Note: Irrigation sites are not considered to be affected by environmental issues.
Renewable energy policy In 2000, the Regional Council of Réunion implemented the Plan Régional des Énergies Renouvelables et de l'Utilisation Rationnelle de l'Énergie (PRERURE) that played as a precursor for the Grenelle de l’Environnement à la Réunion – Réussir l’Innovation (GERRI) project which has the objective to integrate environmental innovation, mobility, energy and its uses, urban planning, construction and tourism into society by 2030.
56.90%
21.71%
10.21%
9.06%
1.19%
0.52%
0.41%
0% 10% 20% 30% 40% 50% 60%
Coal
Hydropower
Sugarcane, bagasse
Fuel oils
Wind
Municipal waste
Solar
uknown
11 MW
0 2 4 6 8 10 12
SHP potential
SHP installed
capacity

42
The Overseas Territories Orientation Law, in place since December 2000, is the platform pushing for the decentralization of the French overseas departments and the implementation of PRERURE. It is important to take into consideration the support provided by the European Union (EU). This includes direct support in the form of research funding via tenders and indirect support by the means of helping the regional authorities to enable the application of EU policy in overseas departments.
5
A goal of self-sufficiency by 2030 under the GERRI project is proposed in light of the estimated population stabilization at one million people by 2030.
5 The
renewable energy sources available on the island are wind, solar, geothermal, wave, tidal, hydro and energy from biomass, landfill gas, gas stations, wastewater treatment and biogas. Act No. 2005-781 of 13 July 2005 lays down the guidelines of the programme for energy policy and renewable energy in Article 29.
6
In addition, incentive mechanisms are also in place to encourage the development of renewable sources, including tax exemption, direct subsidies and feed-in-tariffs (FITs) controlled by the EDF.
5 Private plants
however, have a tax credit rate that varies between 25 per cent and 50 per cent based on the technology of the project. Barriers to small hydropower development The main disadvantage to small hydropower development is the cost of technologies which increases due to the island’s insularity seen through the cost of transportation and taxes. As a result, higher capital costs hinder contractors’ willingness to undergo financial risk and investment in Réunion.
5 Based on the country’s
geographical characteristics, contractors are also faced with the risk of climatic variation and destruction coupled with volcanic activity which increases the risk factor for investors. Environmental impact assessments are stringent and often a difficult barrier to small hydropower development due to the classification of Réunion as a World Heritage Site, under the United Nations Educational, Scientific and Cultural Organization (UNESCO). This has a further domino effect on the price of land per square metre that over the last 10 years has experienced a significant increase amplifying initial investment expenditure.
5
Coordination between departments and authorities, both local and overseas, are ineffectual prolonging the implementation process for project owners coupled
with a lack of local technical support creates another disincentive for potential investors. The final major barrier to small hydropower development is the lack of information and often contradictory sources with different and misleading data further slowing down the process of development. Currently, the Réunion Regional Energy Agency (ARER) is in the process of compiling renewable energy technology information providing a one-stop data shop for potential investors. In the near future this could decrease the initial research stage of most projects and encourage contractors to establish projects in Réunion.
5
Reference 1. Réunion, National Institute of Statistics and Economic Studies (2011). Bilan démographique 2009. Résultats no. 40. Dijon. Available from www.insee.fr/fr/insee_regions/reunion/themes/resultats/resultats40/resultats40.pdf. 2. Australian Government, Bureau of Meteorology (2013). Frequently Asked Questions: What is the highest rainfall associated with a tropical cyclone? Available from www.bom.gov.au/wa/cyclone/about/faq/faq_ext_2.sht
ml. 3. Agence Régionale Energie Réunion (2009). Ile de la Reunion Plan Economique de Transition et de Relance via des Energies 100 per cent Locales a l’ile de la Reunion, Agence Regionale de l'Energie Reunion. Tech. Rep. 2009. 4. Drouineau, Mathilde, Nadia Maizi and Vincent Mazauricz (2010). TIMES model for the Reunion Island: addressing reliability of electricity supply. Presentation at the International Energy Workshop. Stockholm. 21-23 June. 5. Praene, Jean Philippe and others (2011). Renewable energy: Progressing towards a net zero energy islands, the case of Reunion Island. Renewable and Sustainable Energy Reviews, pp. 1-17. 6. Batenbaum, Jean-Charles (2009). Le Grenelle de l’environnement de la Réunion : le projet GERRI, 24 October. Available from www.actualites-news-environnement.com/21786-grenelle-environnement-la-reunion-projet-GERRI.html. 7. Forum for Energy and Development and Thomas Lynge Jensen (2000). Renewable Energy on Small Islands. Second Edition. Available from www.gdrc.org/oceans/Small-Islands-II.pdf. 8. Comité de bassin de la Réunion (2008). Note d’évaluation du potentiel hydroélectrique du bassin Réunion. Saint-Denis. Available from www.comitedebassin-reunion.fr/IMG/Files/File/valorisation_sdage/DA7/pdf/DA7.pdf.

43
1.1.9 Rwanda Lara Esser and Laxmi Aggarwal, International Center on Small Hydro Power Key facts
Population 11,689,6961
Area 26,338 km2
Climate Temperate; mild in mountains
Topography Mostly grassy uplands and hills; relief is mountainous with altitude declining from west to east.
Rain Pattern
Two rainy seasons (February to April, November to January).
1
Eastern and south-eastern regions are more affected by prolonged droughts while the northern and western regions experience abundant rainfall that at times cause erosion, flooding and landslides. The spatial variability has been attributed to the complex topography and the existence of large water bodies within the Great Lakes Region.
2
Electricity sector overview The energy policy in Rwanda focuses mainly on the electrification of the country, which has increased significantly from 6 per cent in 2005 to 12 per cent in 2010 through the electrification roll-out programme. The Ministry of Infrastructure (MINIFRA) has bundled the activities of several donors and pushed the promotion of renewable energies.
4
The Government of Rwanda has set out clear targets of 1,000 MW production and 50 per cent of connections by 2017.
5
In the framework of the National Energy Policy, hydropower plays an important role in the electrification of the country as it is the main renewable energy source for electricity generation (figure 1). This includes micro hydropower and isolated mini-grids, which should be encouraged by a simplified legal and regulatory framework and governmental investments.
4
Figure 1 Electricity generation in Rwanda Source: Rwanda Environmental Management Authority
3
Rwanda Electricity Corporation (RECO), formerly known as ELECTROGAZ, the government-owned utility, , will in the short to medium term, still be the dominant player in the electricity market which is regulated by the independent Rwanda Utilities Regulator Authority (RURA). However, independent power producers (IPPs) are also encouraged in the generation sector. Self-contained off-grid schemes are encouraged: these can be owned and operated by RECO or by private developers. The National Energy Policy foresees three types of licensing issued by RURA:
Single buyer licence: RECO is to be licensed as the single buyer of electricity. It will enter into agreements with private developers of generation projects for the purchase of electricity;
IPP licences: All generation projects or concessions involving private investors are to be licenced by RURA.
Off-grid licences: Concessions are granted by RURA to private companies to generate, supply and distribute electricity within an area of the country not covered by RECO. The tariff and other supply provisions are to be regulated by RURA.
Within the electrification roll-out programme, the Rwandan Government and various donors provide funding to a number of small hydropower projects. Different donors are funding micro hydropower under different schemes among them is the United Nations Industrial Development Organization (UNIDO), the World Bank and the African Development Bank (AfDB). A part from this, the Energising Development Private Sector Participation (EnDev PSP) programme, involves private investor schemes. The programme finances 50 per cent of the total costs, while private developers cover the remaining 50 per cent. The programme motivates banks to offer lending for micro hydropower investments. Imported capital goods such as micro hydropower equipment are exempt from the value added tax (VAT) payment. Requests for small hydropower permissions are given by the regulatory authority RURA.
4
Small hydropower sector overview and potential In 2009, hydropower contributed 20 MW to 55 MW installed capacity at four small hydropower stations and a number of independent micro-hydropower stations (table 1).
4 In October 2011, three more micro-hydro
plants were inaugurated, with a total capacity of 3.2 MW. They are located in Keya, in Rubavu District and Cyimbili and Nkora in Rutsiro District and feed into the national grid to increase the power output by five per cent. The three plants were co-funded by the Governments of Rwanda and Belgium, at the cost of
40.03%
34.89%
14.64%
10.44%
0% 10% 20% 30% 40% 50%
Thermal
Gas methane
Hydropower
Hydropower imported

44
more than Rwandan Franc (RWF) at 9 billion (about €11 million).
5 Besides the micro hydropower inaugurated
plants, Belgium also supports the construction of Rukarara II power plant in Nyamagabe with a capacity of 2 MW.
Figure 2 Small hydropower capacities for Rwanda Source: German Agency for Technical Cooperation - Poverty-Oriented Basic Energy Services (HERA) - European Union Energy Initiative
4, Rwanda, Ministry of
Infrastructure5
Note: Data is based on mixed results from various sources. In 2009, there were 15 micro hydropower plants under construction and another 21 planned by the Government, bilateral donors and private investors, totalling to an additional capacity of 13 MW (table 2).
4
The information collected was however contradictory. It was also reported that as of 2010, 333 hydro sites in the country with a combined capacity of 96 MW were identified, of which the technical small hydropower potential was estimated at only 10 MW. In general, the potential for micro hydropower is considered to be good due to the country’s geographical conditions and high population density.
4
Table 1 Installed small hydropower capacity in Rwanda
Category Name Installed capacity (MW)
Available capacity (MW)
Ownership
On-grid hydropower Gihira 1.80 1.80 Public, Rehab Gisenyi 1.20 0.60 Public, Rehab Rukarara 9.00 9.00 Public Rugezi 2.20 2.00 Public, commissioned July 2011 Nkora, Keya, Cymbili 3.20 2.00 Public, commissioned July 2011 Murunda (REPRO) 0.10 0.10 Private (PSP hydro (GTZ-EnDev)) Off-grid micro hydropower Nyamyotsi I 0.10 0.10 Public (UNIDO) Mutobo 0.20 0.20 Public (UNIDO) Agatobwe 0.20 0.20 Public Nyamyotsi II 0.10 0.10 Public (UNIDO) Rushaki 0.04 0.04 Private
Source: Muyange6 Note: Data valid as of 2012.This table omits the contributions made by Ruzizi hydropower projects shared by Burundi, Democratic Republic of Congo and Rwanda as they are above the 10 MW small hydropower definitions.
Table 2 Small hydropower plants under construction in Rwanda
Name Installed capacity (MW)
Developer/producer Ownership
Mukungwa II 2.500 Government of Rwanda Public
Nyirabuhombohombo 0.500 Government of Rwanda Public
Gashashi 0.200 Government of Rwanda Public
Nyabahanga 0.200 Government of Rwanda Public
Janja 0.400 Government of Rwanda Public
Nshili 0.400 Government of Rwanda Public
Rukararav II 2.000 Government of Rwanda Public
Rubagabaga 0.314 Calimax PPP
Musarara 0.438 Sogem Rwanda PPP
Giciye 4.000 Rwanda Mountain Tea PPP
Mazimeru 0.500 ENNY Private
Ruhwa 0.200 Government of Rwanda Public
Gatubwe 0.200 UNIDO Public
Source: Rwanda Ministry of Infrastructure in German Agency for Technical Cooperation- Poverty-Oriented Basic Energy Services (HERA)- European Union Energy Initiative4, Muyange6
Note: UNIDO – United Nations Industrial Development Organisation. List may not be comprehensive.
38.2 MW
23.2 MW
0 10 20 30 40 50
SHP potential
SHP installed
capacity
45
Different donor agencies have assisted Rwanda in its efforts to build a local small hydropower industry, following different approaches. UNIDO followed the route of village level management at the four small hydropower systems they are supporting. Experience gained in implementation led to revert to management models in which the systems are operated through private businesses.
4 The Dutch/German-funded EnDev
programme followed a pure private sector approach from the outset. Under this programme, five business consortia have been contracted to implement small hydropower schemes. Typical participants are local businessmen, NGOs, social institutions (hospitals), and local and foreign investors. The EnDev programme provides 30-50 per cent investment subsidy, technical assistance, business support, etc., while the developer is responsible for financial closure (15 per cent equity and loans), construction, permits, etc.
7 Experience to date,
however, indicates a very strong preference of private investors to supply at least a portion of the electricity generated to the national electricity grid (and hence to existing customers, which is contrary to the objectives of the donors) as the interconnection gave great comfort to the banks, who appreciated a guaranteed sale of electricity produced.
4
A 2011 report on the pico-hydropower situation in Rwanda by the Global Village Energy Partnership International (GVEP International) and Entec analysed the potential commercial market for off-grid hydropower plants in Rwanda, with individual generation capacities of 50 kW or less. They suggest the market can be developed through specific interventions by the Government, development partners or the private sector, such as training of local developers or financial investments. At least seven project developers from the private sector operate in the country and have realized around 30 pico-hydropower plants in recent years.
8
Renewable energy policy Given its history, Rwanda has only recently been able to draft and enhance its environmental protection instruments. Thus the Electricity Law was enacted in July 2011 with the aim to liberalize and regulate the sector, to attract private investment while encouraging a more competitive market.
9 A Draft Energy Policy is also in
place, highlighting the need to maximize use of indigenous energy, improve access and transparency and most importantly to promote the use of renewable energy technology and conducive instruments such as feed-in tariffs (FIT).
9
The Government of Rwanda is currently in the process of developing a solar energy policy and a Solar Map,
furthermore, renewable energy feed-in-tariffs (REFITs) are already available for small hydropower and are to be extended towards solar generation. Legislation on small hydropower The Government of Rwanda issued a REFIT in February 2012 for small and mini-hydropower. The REFIT guarantees access to the grid for renewable energy generators and obliges the national utility Energy, Water and Sanitation Authority (EWSA) to purchase the renewable energy generated. It applies to hydropower plants from 50 kW to 10 MW. REFITS are valid up to three years.
4
Moreover, the National Energy Strategy strongly states the specific objective to increase micro-hydro, medium-hydro and cross-border hydropower projects to about 333 MW.
10
Barriers to small hydropower development One of the major barriers to the development of small hydropower, despite the motivation and instruments provided by the Government of Rwanda, is the country’s history which provides no incentive for foreign investment. Rwanda has a vast potential for producing clean energy using small hydropower, however, efforts are often limited by weak technical capabilities and private sector actors. In addition, the lack of financial institutions and the low income of the rural population further hinder the process of small hydropower development in Rwanda.
10
References 1. Central Intelligence Agency (2012). The World Factbook. Available from www.cia.gov/library/publications/the-world-factbook/. 2. Rwanda Environmental Management Authority (2009). Chapter IX: Climate change and natural disasters in Rwanda State of Environment and Outlook Report.
Kigali. Available from www.rema.gov.rw/soe/chap9.php. 3. Rwanda Environmental Management Authority (2009). Chap VIII: Energy resources in Rwanda State of Environment and Outlook Report. Kigali. Available from www.rema.gov.rw/soe/chap8.php. 4. Gaul Mirco, Fritz Kölling and Miriam Schröder (2010). Policy and regulatory framework conditions for small hydro power in Sub-Saharan Africa: Discussion paper. Eschborn. Available from www.giz.de/Themen/en/dokumente/gtz2010-en-HERA-EUEI-PDF-framework-conditions-hydropower.pdf. 5. Rwanda, Ministry of Infrastructure (2011). 4th Event News: 3 more Micro-Hydropower plants to generate 3.2

46
MW. EWSA, 27 October. Available from http://www.ewsa.rw/. 6. Muyange, Yves (n.d.). Hydropower in Rwanda: Ongoing Initiatives and New Investment Opportunities. Presentation. Available from www.ewsa.rw/Docs/Hydropower_Solar_Breakout_session.pdf. 7. Raats, Marcel (2009). Business models for (MHP) village grids: Two Energising Development Case Studies. Available from http://siteresources.worldbank.org/EXTAFRREGTOPENERGY/Resources/717305-1264695610003/6743444-1268073457801/2.3.Village_Grid.pdf. 8. Meier Thomas and Gerard Fischer (2011). Assessment of the Pico and Micro-Hydropower Market in Rwanda. Nairobi. Available from www.gvepinternational.org/sites/default/files/pico-hydro_market_in_rwanda.pdf. 9. Isumbingabo, Emma Françoise (2012). Rwanda’s National Energy Policy and Strategy. Presentation at the Energy Investor Forum. Kigali, 29 February. 10. United Nations Industrial Development Organization (n.d.). Rural Energy Development in Rwanda, Poverty Reduction through Productive Activities, trade Capacity Building and energy and the environment. Available from www.unido.org/fileadmin/media/documents/pdf/Energy_Environment/rre_projects_rwanda.pdf.

47
1.1.10 South Sudan Ater Amogpai, University of Juba, College of Engineering and Architecture, South Sudan; Kai Whiting, International Center on Small Hydro Power Key facts
Population 10,625,1761
Area 644,329 km2
Climate Equatorial climate, with high temperature, high rainfall and very high humidity
Topography Plains in the north and centre to southern highlands. The White Nile is a major geo-graphic feature of the country supporting agriculture and extensive wild animal populations. The centre of the country contains a large swampy area of more than 100,000 km
2 fed by the waters of
the White Nile.
Rain pattern
Rainfall is the heaviest in the upland areas of the south but diminishes in the north.
2
Electricity sector overview Only one per cent of the population has access to power, though intermittently during a 24-hour period. Only seven per cent of the urban areas in South Sudan are electrified and virtually no rural areas have electricity.
3
This is because the formal energy sector is limited to only the South Sudanese Electricity Cooperation which operates eight diesel generators with a capacity of 1.5 MW each.
With the help of foreign aid such as United States Agency for International Development (USAID), South Sudan has built independent grid systems in cities such as Yei, Kepoeta, Malakal, and Maridi. However, a large portion of the energy is from independently operated diesel generators belonging to businesses and private homes.
4
The country is planning to build about half a dozen hydropower and thermal power plants to help end the near permanent blackouts across the country and to attract investments in manufacturing industries.
9 China
is thought to be providing the capital for significant investment in the energy sector to support both the oil and hydropower sector.
5
In 2012, the installed capacity of electric power was about 26.8 MW in South Sudan. Some estimates, however, put this figure at 62 MW of installed capacity - around 3 MW per million people, indicative of a severe lag compared to other Eastern African states.
6 This
electric power is divided amongst six South Sudanese
towns: Juba, the capital (12 MW), Malakal (4.8 MW), Wau (4 MW), Bor (2 MW), Yambio (2 MW) and Rumbek (2 MW). However, this amount of power needs to be increased to at least 230 MW in order to minimally satisfy the current demand. Juba at the moment needs at least 80 MW (according to power engineers at Juba Power Station) whereas the remaining five towns need at least 150 MW, at 30 MW each. Most of the diesel generators in use are made and brought from Finland. However, these generators frequently stop operating due to technical problems and fuel shortages. The total electric power required by South Sudan is estimated to be 450 MW. In the coming decades, this amount of electric power is expected to increase along with a booming population and establishment of new industries.
Figure 1 Electricity generation in South Sudan Note: Based on installed capacity. Small hydropower sector overview and potential South Sudan holds one of the richest agricultural areas in Africa. The White Nile valley has fertile soils and abundant water supplies, which could be developed for small hydropower.
2 Around 28 per cent of the Nile
water flows through South Sudan to Sudan and onward to Egypt but the meteorological and hydrological data collection network for this area and elsewhere were destroyed during the conflict and is currently non-existent.
3
The potential of hydropower plants capacity is estimated to be 5,583 MW in South Sudan. The small hydropower potential is yet unknown. Below is a list of hydropower plants studied in some of the South Sudanese states with a total potential capacity of approximately 2,225.5 MW (see table). It is estimated that the Fula rapids could yield 60 MW of electric capacity. A rapid only refers to the high-current part of a river. Meanwhile, there are several 700 MW to 800 MW large dam projects envisioned for the White Nile.
6
100%
0% 20% 40% 60% 80% 100% 120%
Thermal
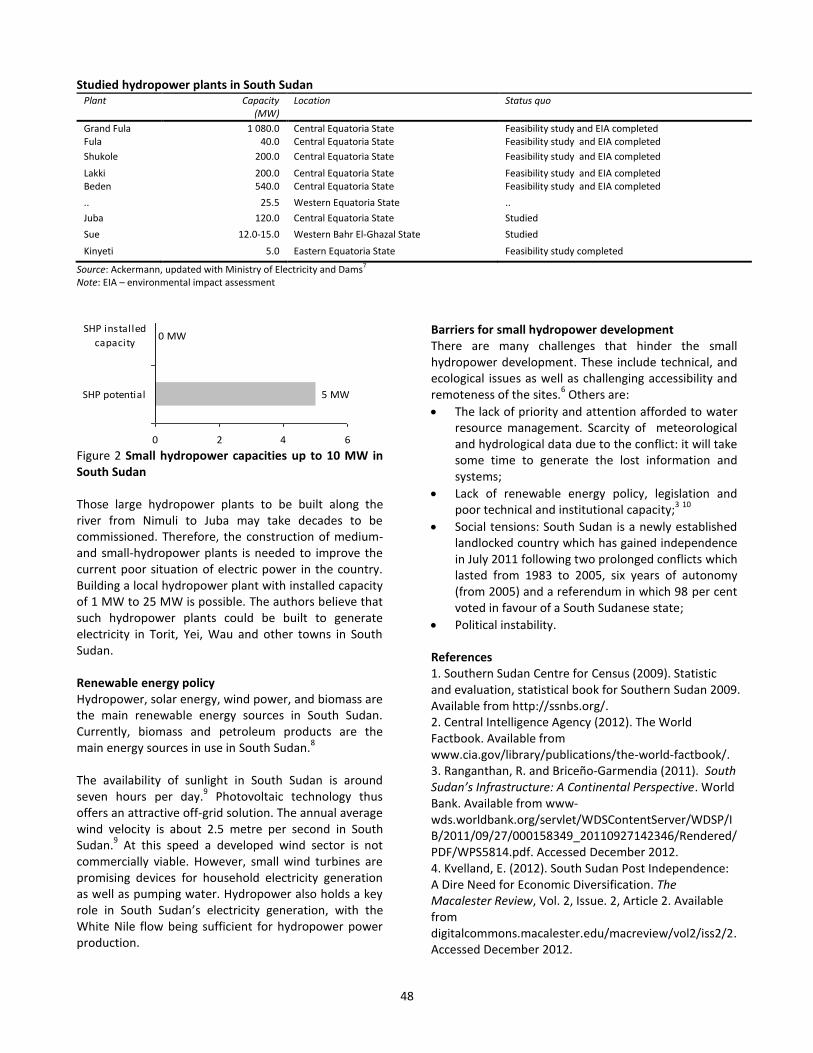
48
Studied hydropower plants in South Sudan Plant Capacity
(MW) Location Status quo
Grand Fula 1 080.0 Central Equatoria State Feasibility study and EIA completed Fula 40.0 Central Equatoria State Feasibility study and EIA completed
Shukole 200.0 Central Equatoria State Feasibility study and EIA completed
Lakki 200.0 Central Equatoria State Feasibility study and EIA completed Beden 540.0 Central Equatoria State Feasibility study and EIA completed
.. 25.5 Western Equatoria State ..
Juba 120.0 Central Equatoria State Studied
Sue 12.0-15.0 Western Bahr El-Ghazal State Studied
Kinyeti 5.0 Eastern Equatoria State Feasibility study completed
Source: Ackermann, updated with Ministry of Electricity and Dams7
Note: EIA – environmental impact assessment
Figure 2 Small hydropower capacities up to 10 MW in South Sudan Those large hydropower plants to be built along the river from Nimuli to Juba may take decades to be commissioned. Therefore, the construction of medium- and small-hydropower plants is needed to improve the current poor situation of electric power in the country. Building a local hydropower plant with installed capacity of 1 MW to 25 MW is possible. The authors believe that such hydropower plants could be built to generate electricity in Torit, Yei, Wau and other towns in South Sudan. Renewable energy policy Hydropower, solar energy, wind power, and biomass are the main renewable energy sources in South Sudan. Currently, biomass and petroleum products are the main energy sources in use in South Sudan.
8
The availability of sunlight in South Sudan is around seven hours per day.
9 Photovoltaic technology thus
offers an attractive off-grid solution. The annual average wind velocity is about 2.5 metre per second in South Sudan.
9 At this speed a developed wind sector is not
commercially viable. However, small wind turbines are promising devices for household electricity generation as well as pumping water. Hydropower also holds a key role in South Sudan’s electricity generation, with the White Nile flow being sufficient for hydropower power production.
Barriers for small hydropower development There are many challenges that hinder the small hydropower development. These include technical, and ecological issues as well as challenging accessibility and remoteness of the sites.
6 Others are:
The lack of priority and attention afforded to water resource management. Scarcity of meteorological and hydrological data due to the conflict: it will take some time to generate the lost information and systems;
Lack of renewable energy policy, legislation and poor technical and institutional capacity;
3 10
Social tensions: South Sudan is a newly established landlocked country which has gained independence in July 2011 following two prolonged conflicts which lasted from 1983 to 2005, six years of autonomy (from 2005) and a referendum in which 98 per cent voted in favour of a South Sudanese state;
Political instability. References 1. Southern Sudan Centre for Census (2009). Statistic and evaluation, statistical book for Southern Sudan 2009. Available from http://ssnbs.org/. 2. Central Intelligence Agency (2012). The World Factbook. Available from www.cia.gov/library/publications/the-world-factbook/. 3. Ranganthan, R. and Briceño-Garmendia (2011). South Sudan’s Infrastructure: A Continental Perspective. World Bank. Available from www-wds.worldbank.org/servlet/WDSContentServer/WDSP/IB/2011/09/27/000158349_20110927142346/Rendered/PDF/WPS5814.pdf. Accessed December 2012. 4. Kvelland, E. (2012). South Sudan Post Independence: A Dire Need for Economic Diversification. The Macalester Review, Vol. 2, Issue. 2, Article 2. Available from digitalcommons.macalester.edu/macreview/vol2/iss2/2. Accessed December 2012.
5 MW
0 MW
0 2 4 6
SHP potential
SHP installed
capacity

49
5. Al Jazeera (2012). China offers South Sudan $8bn for projects. Reuters, 29 April. Available from www.aljazeera.com/news/africa/2012/04/20124297232096442.html. Accessed October 2012. 6. Kammen, D. (2011). New energy in South Sudan, 7 December. World Bank. Available from blogs.worldbank.org/climatechange/node/793. Accessed December 2012. 7. Loku Moyu, L., Ministry of Electricity and Dams (2012). Power Development and Utilities Prospects and Constraints. Paper presented at CWI South Sudan Investment Summit, March 2012. Available from http://cwisummits.com/uploads/SSISMar2012/Session%204/Ministry%20of%20Electricity%20and%20Dams.pdf. 8. Amogpai, A. (2011). LED lighting combined with solar panels in developing countries. Doctoral Dissertation. Aalto University publication series. Finland. 9. Ackermann, T., Soder, L. (2000). Wind energy technology and current status: Review. Renewable and Sustainable Energy Reviews, 4 (2000) pp. 315-374. Available from http://raceadmv3.nuca.ie.ufrj.br/buscarace/Docs/tacker
mann2.pdf. 10. Apogpai, A. (2012). Power supply solutions in South Sudan. University of Juba College of Engineering and Architecture.
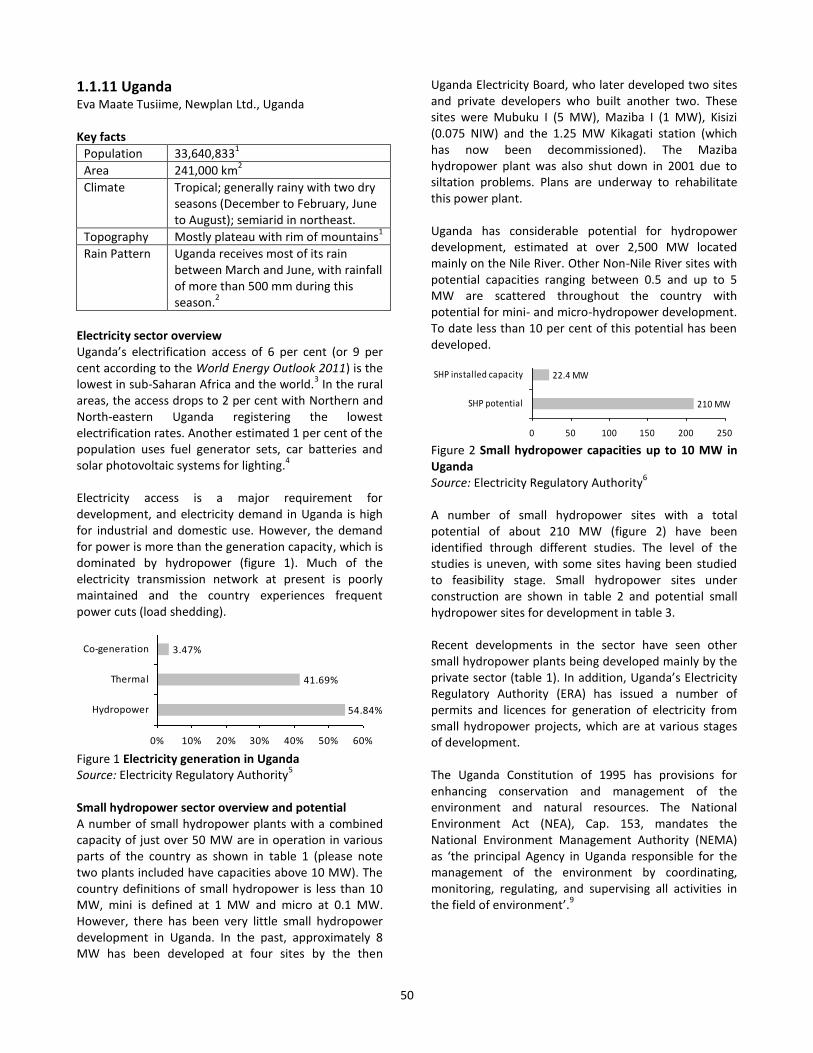
50
1.1.11 Uganda Eva Maate Tusiime, Newplan Ltd., Uganda Key facts
Population 33,640,8331
Area 241,000 km2
Climate Tropical; generally rainy with two dry seasons (December to February, June to August); semiarid in northeast.
Topography Mostly plateau with rim of mountains1
Rain Pattern Uganda receives most of its rain between March and June, with rainfall of more than 500 mm during this season.
2
Electricity sector overview Uganda’s electrification access of 6 per cent (or 9 per cent according to the World Energy Outlook 2011) is the lowest in sub-Saharan Africa and the world.
3 In the rural
areas, the access drops to 2 per cent with Northern and North-eastern Uganda registering the lowest electrification rates. Another estimated 1 per cent of the population uses fuel generator sets, car batteries and solar photovoltaic systems for lighting.
4
Electricity access is a major requirement for development, and electricity demand in Uganda is high for industrial and domestic use. However, the demand for power is more than the generation capacity, which is dominated by hydropower (figure 1). Much of the electricity transmission network at present is poorly maintained and the country experiences frequent power cuts (load shedding).
Figure 1 Electricity generation in Uganda Source: Electricity Regulatory Authority
5
Small hydropower sector overview and potential A number of small hydropower plants with a combined capacity of just over 50 MW are in operation in various parts of the country as shown in table 1 (please note two plants included have capacities above 10 MW). The country definitions of small hydropower is less than 10 MW, mini is defined at 1 MW and micro at 0.1 MW. However, there has been very little small hydropower development in Uganda. In the past, approximately 8 MW has been developed at four sites by the then
Uganda Electricity Board, who later developed two sites and private developers who built another two. These sites were Mubuku I (5 MW), Maziba I (1 MW), Kisizi (0.075 NIW) and the 1.25 MW Kikagati station (which has now been decommissioned). The Maziba hydropower plant was also shut down in 2001 due to siltation problems. Plans are underway to rehabilitate this power plant.
Uganda has considerable potential for hydropower development, estimated at over 2,500 MW located mainly on the Nile River. Other Non-Nile River sites with potential capacities ranging between 0.5 and up to 5 MW are scattered throughout the country with potential for mini- and micro-hydropower development. To date less than 10 per cent of this potential has been developed.
Figure 2 Small hydropower capacities up to 10 MW in Uganda Source: Electricity Regulatory Authority
6
A number of small hydropower sites with a total potential of about 210 MW (figure 2) have been identified through different studies. The level of the studies is uneven, with some sites having been studied to feasibility stage. Small hydropower sites under construction are shown in table 2 and potential small hydropower sites for development in table 3.
Recent developments in the sector have seen other small hydropower plants being developed mainly by the private sector (table 1). In addition, Uganda’s Electricity Regulatory Authority (ERA) has issued a number of permits and licences for generation of electricity from small hydropower projects, which are at various stages of development. The Uganda Constitution of 1995 has provisions for enhancing conservation and management of the environment and natural resources. The National Environment Act (NEA), Cap. 153, mandates the National Environment Management Authority (NEMA) as ‘the principal Agency in Uganda responsible for the management of the environment by coordinating, monitoring, regulating, and supervising all activities in the field of environment’.
9
54.84%
41.69%
3.47%
0% 10% 20% 30% 40% 50% 60%
Hydropower
Thermal
Co-generation
210 MW
22.4 MW
0 50 100 150 200 250
SHP potential
SHP installed capacity

51
Table 1 Installed small hydropower capacity in Uganda
Site District Installed capacity (MW)
Status/ ownership
Mubuku I Kasese 5.40 Kilembe Mined Ltd. Mubuku II/Bugoye Hydropower Project Kasese 13.00 Tronder Power Ltd. Mubuku III Kasese 9.90 Kasese Cobalt Company Ltd. Mpanga PowerStation Kamwenge 18.00 Eco Power Ltd. Ishasha Hydropower station Kanungu 6.60 Imperial Group of Companies Kuluva Moyo 0.12 Kuluva Hospital Kagando Kasese 0.06 Kagando Hospital Kisiizi Rukungiri 0.06 Kisiizi Hospital
Source: Electricity Regulatory Authority, Uganda7 Note: Listed plants are all operating.
Table 2 Small hydropower plants under construction in Uganda
Site District Installed capacity (MW)
Ownership
Nyagak Nebbi 3.5 WenereCo Buseruka Hoima 9.0 HydroMax Ltd.
Source: Electricity Regulatory Authority, Uganda7
Table 3 Potential small hydropower sites in Uganda
Site District Estimated capacity (MW)
Nyamabuye Kisoro 2.20 Mvepi Arua 2.40 Sogahi Kabarole 2.00 Ela Arua 1.50 Ririma Kapchorwa 1.50 Haisesero Kabale 1.00 Nyahuka Bundibugyo 0.65 Sezibwa Mukono 0.50 Rwigo Bundibugyo 0.48 Nyarwodo Nebbi 0.40 Agoi Arua 0.35 Kitumba Kabale 0.20 Tokwe Bundibugyo 0.40 Amua Moyo 0.12 Ngiti Bundibugyo 0.15 Leya Moyo 0.12 Nyakibale Rukungiri 0.10 Miria Adua Arua 0.10 Manafwa Mbale 0.15
Source: Tumwesigye8
Within the field of hydropower development, NEMA is mandated to award environmental clearances, following the review and approval of Environmental Audits, Environmental Impact Assessment (EIA) statements and Resettlement Action Plans (RAP). The clearance allows NEMA to ensure that the project and its mitigation plans comply with Ugandan standards for environmental and social impact. Where the project is on a protected river or wetland, NEMA will require the developer to also apply for permission to operate on the river/wetland involved. The National Water Policy of 1999 states that the development of water for energy production shall be
subjected to an EIA in accordance with the procedures established by NEMA.
10
According to the Water Act Cap 152, authorization has to be given to use water, construct or operate any works. The extraction permit is issued by the Directorate of Water Development.
11
The Land Act, Cap. 227, makes provision for the ownership and management of land, and provides for the compulsory acquisition of land for public purposes. It states that construction of dams and hydropower plants are public works and any person authorized to execute public works may enter into mutual agreement with the owner or occupier of the land in accordance with the Act. A RAP is normally prepared and undertaken by the developer. Compensation and resettlement activities are expected to be fulfilled by the developer.
12
Renewable energy policy The Ugandan Government’s Policy Vision for Renewable Energy is to make modern renewable energy a substantial part of the national energy consumption. The overall policy goal is to increase the use of modern renewable energy, increasing from the current 4 per cent to 61 per cent of the total energy consumption by the year 2017.
13
This policy set out the Government’s vision, strategic goals, principles, objectives and targets for promoting and implementing renewable energy sources like hydropower, biomass, peat, solar, geothermal and wind in Uganda. The National Energy Policy of 2002 was also set up with the objectives of, among others:
Increasing access to modern, affordable and reliable energy services;
Improving energy governance and administration;
Managing energy related environmental impacts.

52
Legislation on small hydropower The Government offers investors incentives in the form of value added tax (VAT) exemption on hydropower and related road projects. The challenge with this is that although the developers enjoy the exemption, their suppliers are not. The suppliers therefore find it difficult to recover the VAT they paid to supply materials to the developers and are usually unwilling to work on such projects yet the Government stipulates that local suppliers and contractors should be involved as much as possible. Suppliers tend to increase their prices in order to recover the VAT which affects the developers who have to absorb the higher costs.
14
Therefore, the application of these incentives is still vague. It is not uncommon for the developers to continue paying VAT on hydropower projects. The process of claiming the VAT may sometimes be frustrating to the developers. Barriers to small hydropower development Although considerable potential for hydropower development exists in Uganda, very few developments have been carried out in the last 10 years. The existing barriers can be broadly categorized into design, technical, technological, socio-environmental, and financial:
Design challenges: Small hydropower sites are sometimes located on rivers around agricultural areas. Thus the sediment load in the rivers may increase, thereby necessitating the use of de-silting basins and flushing trenches as part of the design. This increases the cost of the project.
Technology: The technology to bore through waterway structures like tunnels is not readily available in Uganda. Therefore, in planning the waterway structures, this has to be taken into account. The lack of appropriate technology may result in having a longer waterway than planned since tunnels may not be an easy option to pursue.
Technical capacity gaps: With all the potential that has been identified through various studies, until 2011, there was no university in Uganda offering a course on the development and design of hydropower schemes of any size. The specialization to undertake feasibility studies, designing and costing of hydropower projects has been mainly undertaken by foreign consultants.
Socio-environmental barriers: Many sites for hydropower development are located in populated areas. The inhabitants are usually the owners of the land required for the project. Therefore, developing a hydropower plant in such areas will necessitate displacing and relocating population to other areas. It must be noted that in Uganda, the process of land
acquisition is slow and expensive, since land is individually owned. Even when the affected persons may have been compensated, the process of registering the land in the names of the developer may end up being very expensive and time consuming.
Financial barriers: Several studies had been carried out concerning the lack of participation from the private sector in the development of hydropower projects. They concluded that among other factors, the cost of borrowing in Uganda is the highest in the world. Moreover, the development banks in the country are limited by their net worth. Although some commercial banks have ventured into lending to developers of such projects, they generally prefer to lend only short term (five years at most).
14
Other challenges: The need for guarantees from the Government against the transmission body’s failure to meet its payment obligations, the need for a political risk guarantee from the World Bank, long lead times for projects, and investors often fail to raise the equity required by the lenders. These factors make it unfavourable for potential developers to engage in hydropower generation in Uganda.
14
References 1. Akello, Christine Echookit (2007). Environmental Regulation in Uganda: Successes and Challenges. Law, Environment and Development Journal, p.20. Available from www.lead-journal.org/content/07020.pdf. 2. United States Geological Survey, U.S. Department of the Interior-U.S. Geological Survey (2012). A Climate Trend Analysis of Uganda in Famine Early Warning Systems Network: Informing Climate Change Adaptation Series. Available from
http://pubs.usgs.gov/fs/2012/3062/FS2012-3062.pdf. 3. International Energy Agency (2011). World Energy Outlook 2011. 9 November 2011. Paris. 4. Energy Programme Uganda (n.d.) Rural Electrification. Available from www.energyprogramme.or.ug/why-
power-villages-rural-electrification/. 5. Republic of Uganda, Electricity Regulatory Authority (2011). Electricity Sector Performance Report. Available from http://era.or.ug/publications/annualpublications71e9/. Accessed 25
January 2013.
6. Van der Plas, Robert J. and A. Kyezira (2009). Uganda’s Small Hydro Energy Market. Berlin. Available from www.giz.de/Themen/de/dokumente/gtz2009-en-targetmarketanalysis-hydro-uganda.pdf. 7. Republic of Uganda, Electricity Regulatory Authority (2011). Sector Update Newsletter. Issue 5, March. Available from http://era.or.ug/publication/view/era-

53
newsletter-issue-5/. 8. Tumwesigye, Robert and others (2011). Key issues in Uganda’s Energy Sector. London. Available from http://pubs.iied.org/pdfs/16030IIED.pdf. 9. National Environment Act. Available from www.ssauganda.org/uploads/National%20Environment%20Act(1995).pdf. Accessed July 2013. 10. National Water Policy 1999. Available from www.ruwas.co.ug/reports/National%20Water%20Policy.pdf. 11. Republic of Uganda (n.d.) Chapter 152: Water Act 1997. Available from www.ulii.org/ug/legislation/consolidated-act/152 12. Republic of Uganda, Office of the Prime Minister (n.d.). Chapter 227: The Land Act. Available from www.opm.go.ug/assets/media/resources/225/LAND%20ACT.pdf 13. Republic of Uganda (2007). The Renewable Energy Policy for Uganda. Available from www.rea.or.ug/userfiles/RENEWABLE%20ENERGY%20P
OLIC9-11-07.pdf. Accessed February 2012.
14. Republic of Uganda, Electricity Regulatory Authority (2008). Constraints to Investment in Uganda’s Electricity Generation Industry. Kampala . Available from http://era.or.ug/publication/view/constraints-to-investment-in-ugandas-electricity-generation-industry/. 15. Republic of Uganda, Ministry of Energy and Mineral Development (n.d.). Sector Performance Report 2008/09-2010/11. Kampala. Available from http://www.energyandminerals.go.ug/uploads/reports/JSR_REPORT.pdf. 16. Republic of Uganda, Electricity Regulatory Authority (2009). Development and Investment Opportunities in Renewable Energy Resources in Uganda. Kampala. Available from http://era.or.ug/publication/view/development-and-investment-opportunities-in-renewable-energy-resources-in-uganda/. 17. Republic of Uganda, Electricity Regulatory Authority (2011). Sector Update Newsletter. Issue 6, December. Available from http://era.or.ug/publication/view/era-newsletter-issue-6/. 17. Republic of Uganda, Electricity Regulatory Authority (2007). Small Hydropower Development in Uganda. Available from www.era.or.ug/Pdf/ERA%20Small%20hydro%20power%20book.pdf. Accessed March 2012. 18. Small Hydro Atlas: Uganda (n.d.). Available from www.small-hydro.com/index.cfm?Fuseaction=countries.country&Country_ID=78.

54
1.1.12 United Republic of Tanzania Emmanuel G. Michael, United Nations Industrial Development Organization, United Republic of Tanzania Key facts
Population 46,912,7681
Area 945,749 km2
Climate Tropical (hot and humid) along the coast with a rainy season March to May. Temperate in highlands with short rains (Vuli) November to December and long rains (Masika) February to May.
Topography Plains along coast; central plateau; highlands in north, south
Rain Pattern
The mean annual rainfall varies from 500-2,500 mm and above. The average duration of the dry season is 5-6 months. Rainfall patterns have recently become much more unpredictable with some areas/zones receiving extremely minimum and maximum rainfall per year.
2
Electricity sector overview The electricity sector in Tanzania is dominated by the state-owned Tanzania Electric Supply Company Limited (TANESCO) that was established in 1964. It was set up in a vertically integrated structure, carrying out generation, transmission, distribution and supply. TANESCO operates the grid network and isolated supply systems in Kagera, Kigoma, Rukwa, Ruvuma, Mtwara and Lindi. Due to slow development in the sector and the general global trend in the electricity supply industry, the Government lifted the monopoly held by the public utility in 1992 through the National Energy Policy to allow involvement of the private sector in the electricity industry. This major policy reform enabled independent power producers to operate in the generation segment. Furthermore, interconnections with Zambia and Uganda enable imports of relatively small amounts of electricity. For many years, the power sector in Tanzania was dominated by hydropower, only when the country encountered a severe drought in 2004, it had employed additional thermal plants (figure 1). Up until the last decade, rural electrification had been solely a Government responsibility with support development partners such as the United Nations Industrial Development Organization (UNIDO). Hence, most of the small hydropower plants were installed by donors, missionaries and the Government through TANESCO.
Figure 1 Electricity generation in Tanzania Source: Tradingeconomics
3
Note: Data from 2009. In 2010, Tanzania’s total installed electricity generation capacity was 1,219 MW, of which hydropower comprised 561 MW and thermal 658 MW. The contribution of non-hydro renewable energy for power generation is less than five per cent. At the moment, the electrification rate stands at 14 per cent countrywide and two per cent for rural areas. Efforts are being made to increase access in rural areas. The Rural Energy Agency has been established to oversee the implementation of rural electrification projects, using the Rural Energy Fund as provided in the Rural Energy Act. Small hydropower sector overview and potential The history of small hydropower in Tanzania traces back to the colonial era, where most of the operational small hydropower plants were installed with the help of church missionaries. Forty-five sites with a total installed capacity of 25 MW have been developed so far, of which only 17.6 MW are currently in operation (figure 2). Most of the schemes have capacities lower than 5 MW, as shown in figure 3. TANESCO owns 15 per cent of the small hydropower plants and private investors own 85 per cent. In terms of installed capacity, TANESCO owns 69 per cent. The database of the Rural Energy Agency shows that 13 projects with a total capacity of 28.8 MW are in various stages of development.
5
Figure 2 Small hydropower capacities in Tanzania
60.2%
36.3%
2.7%
0% 10% 20% 30% 40% 50% 60% 70%
Hydropower
Natural gas
Coal
310 MW
25 MW
0 100 200 300 400
SHP potential
SHP installed capacity

55
Figure 3 Installed small hydropower capacities in Tanzania Source: Tanzania Electric Supply Company Limited
5
Tanzania has substantial potential of small hydropower. Areas with high potential include the Southern and Western highlands; the best geographical areas for developing small-scale hydropower are those with steep
rivers flowing all year round. Geographically speaking, most of the hydropower potential of Tanzania is located in the rift valley escarpments in the West, South West and North East Tanzania. Central Tanzania is relatively flat and dry and has no hydropower potential.
8 Studies
show that 12 out of 21 administrative regions of mainland Tanzania are blessed with mini-hydropower resources but only 3 regions (Mbeya, Iringa, and Kilimanjaro) have managed to develop them.
5
The total potential for small hydropower generation (capacities <10 MW) is estimated at 315 MW, of which only 25 MW have been developed. Studies, that have included economic analyses, show a number of sites that could produce electricity at competitive cost to supply power to the national grid and through mini-grids to villages in the community.
Table 1 Installed small hydropower capacity in Tanzania
Site name District/Region Year installed Installed capacity (kW)
Developer/Owner
Nyumba ya Mungu Same/Kilimanjaro - 8 000.0 TANESCO Tosamaganga Iringa 1951 1 220.0 TANESCO Kikuletwa Moshi/Kilimanjaro - 1 160.0 TANESCO Kitai Songea/Ruvuma 1976 45.0 Prisons Dept/ Government Nyagao Lindi 1974 15.8 RC Mission Isoko Tukuyu/Mbeya - 7.3 Mission (not specified) Uwemba Njombe/Iringa 1971 800.0 Benedict Fathers Bulongwa Njombe/Iringa - 180.0 Mission (not specified) Kaengesa Sumbawanga/Rukwa 1967 44.0 RC Mission Rungwe Tukuyu/Mbeya 1964 21.2 Moravian Mission Nyangao Nyangao/Lindi - 38.8 Mission (not specified) Peramiho Songea Rural/Ruvuma 1962 34.6 Benedict Fathers Isoko Tukuyu/Mbeya 1973 15.5 Moravian Mission Ndanda Lindi - 14.4 Mission (not specified) Ngaresero Arusha 1982 15.0 M.H Leach Sakare Soni/Tanga 1948 6.3 Benedict Fathers Mbarari Mbarari/Mbeya 1972 700.0 NAFCO/Government Ndolage Bukoba/Kagera 1961 55.0 RC Mission Ikonda Makete/Iringa 1975 40.0 RC Mission Mbalizi Mbalizi/Mbeya 1958 340.0 TANESCO Lugarawa Iringa 1979 140.0 RC Mission Mavanga Iringa 2002 150.0 RC mission/Mavanga Village community Matembwe Njombe/Iringa 1986 150.0 RC mission/ CEFA/ Matembwe Village Community Ndolela Songea Rural/ Ruvuma - 100.0 Tea Estate Chipole Mbinga/Songea - 400.0 RC Mission Mngeta Ifakara/Morogoro - 600.0 Government parastatal Uvinza Mine Uvinza/Kigoma - 600.0 Private Kabanga Kasulu/Kigoma - 100.0 Mission Maguu Mbinga/Ruvuma - 100.0 Mission Lupa Ifakara/Morogoro - 200.0 Mission
Source: Michael7, National Environmental Management Council7
Notes: This list is in comprehensive. RC – Roman Catholic
2%
14%17%
60%
7%
0%
10%
20%
30%
40%
50%
60%
70%
10 kW 11-100 kW 101-500 kW 0.501-5 MW > 5 MW

56
Figure 4 Map of potential small renewable power sites in Tanzania Source: Michael
6
In the on-going small-hydro inventory studies which are being carried out by TANESCO, and financed by the Ministry of Energy and Minerals (MEM), a total of 131 small hydro sites countrywide with a total capacity of 250 MW have been identified. The study comprised both desk studies and fieldwork. Reconnaissance studies of new potential sites and confirmation of existing information have been completed for Rukwa, Kagera and Ruvuma regions. Further studies in collaboration with the Rural Energy Agency have been carried out in Iringa, Mbeya, Morogoro and Kigoma regions. Another study that focused on the mini hydropower potentials was the Rural Electrification Master Plan study that was commissioned by MEM and implemented by TANESCO. The objectives of the Rural Electrification Master Plan study was to examine the technical, economic, social, and environmental aspects of a lowest-cost solution of supplying electricity to un-electrified rural areas, defining appropriate programmes
and priority projects for expansion of the electricity networks, as well as development of renewable energy supply systems for the country over 15-20 years. In addition to other sources of electricity, five small hydro sites from the small hydropower database were appraised during this study. All projects in Tanzania need to demonstrate that they take care of the environmental issues in their plans. Under these regulations it is mandatory to undertake full Environmental Impact Assessment (EIA) for all projects with capacities above 1 MW. For projects with capacities below 1 MW, it is necessary to take into consideration of the environmental issues in their plans by undertaking simplistic Environmental Impact Studies (EIS). The National Environmental Management Council is responsible for approving the EIA/EIS conducted. Below is a list of pre-feasibility studies conducted in 2009/2010 by the Rural Energy Agency.

57
Table 2 Potential small hydropower sites in Tanzania
S/N Site Load Centres District/ Region
Head (m)
Discharge (m3/sec)
Capacity (kW)
1 Luwika Mbamba Bay Mbinga 359.5 1.500 5 800.0 2 Sunda Falls Tunduru Ruvuma 13.5 26.000 3 000.0 3 Mtambo
Mpanda Rukwa 17.0 13.500 2 000.0
4 Malindindo Malindindo Mbinga 38.0 0.500 1 58.4 5 Lingatunda Madaba Songea Rural 160.0 2.500 3 400.0 6 Macheke Ludewa Ludewa 23.0 1.500 287.0 7 Isigula Ludewa Ludewa 200.0 1.200 2 000.0 8 Imalinyi Imalinyi village Njombe 13.0 2.500 270.0
9 Maruruma Maruruma Mufindi 20.0 2.000 333.5 10 Luganga Luganga Iringa Rural 77.0 2.000 1 300.0 11 Songwe Idunda Rungwe -Mbeya 75.0 1.500 720.0 12 Kiboigizi Karagwe District Kagera 90.0 3.800 3 200.0 13 Kenge Bukoba Kagera 10.0 24.000 2 400.0 14 Luamfi Namanyere Rukwa 40.0 9.000 1 200.0 15 Kawa Kasanga and Ngorotwa Sumbawanga 65.0 0.300 130.0 16 Mkuti Kigoma Rural Kigoma 23.0 3.300 650.0 17 Ngongi Ngongi Ruvuma 270.7 1.090 3 100.0 18 Mngaka Paradiso Mbinga -Ruvuma 15.0 7.640 900.0 19 Mngaka Lipumba Mbinga- Ruvuma 25.0 4.424 870.0 20 Lumeme Mbinga Ruvuma 301.2 1.310 4 200.0 21 Kiwira Ibililo Rungwe - Mbeya 20.0 10.000 1 350.0 22 Kitewaka Ludewa township, Ludewa 50.0 9.884 4 200.0 23 Mtigalala falls Kitonga Kilolo - Iringa 70.0 10.000 5 000.0
Source: Rural Energy Agency4
Renewable energy policy There is no existing policy for renewable energy in Tanzania. The Government, through its Ministry of Energy and Minerals, is in the process of developing a related policy for renewable energy at large, and small hydropower will be part of it. In its agenda of making renewable energy industry an integral part of its rural energy and power sector development strategies, the Government has issued the following policies: (i) Rural electrification policy statement which indicates that all lower cost technical options should be considered, including renewable energy; (ii) Rural Energy Act (2005) which established the Rural Energy Agency and Fund (REA/F), with the main task to promote access to modern energy services and allocate performance-based subsidies for rural energy including renewable energy systems; (iii) Energy and Water Utility Regulatory Authority Act (2001) which provides the regulator with the responsibility of tariff setting affecting also the independent renewable energy power producers. To ensure adequate supply, the Electricity Act (2008) created procedures for providing electricity from different sources. The Energy and Water Utility Regulatory Authority (EWURA) has designed a model for Standardized Small Power Purchase Agreement/Tariff (SSPPA/T) for private producers with project capacities
lower than 10 MW. SSPPA will be annually reviewed to reflect operating costs. Barriers to small hydropower development The key barriers hindering the development of small hydropower in Tanzania, as in most African countries, can be summarized as follows:
Lack of infrastructure in the design and manufacture of turbines, installation and operation.
Lack of access to appropriate technologies for pico-, micro-, mini- and small-hydropower. Lack of indigenous technology and low level of technology to harness the existing hydropower potential. Networking, best practices sharing and information dissemination through forums and conferences, are necessary.
Lack of local capacity (local skills and know-how as well as the lack of self-initiatives) in developing small hydropower projects. There is a need for technical assistance in the planning, development and implementation of small hydropower projects.
Insufficient information about potential sites (hydrological data).
Inadequate small hydropower awareness, incentives and motivation.
Inadequate private sector participation in small hydropower development.
Lack of joint ventures (public and private sector partnership).

58
Lack of investment capital to develop the existing hydropower potentials. Records show that most of the developed capacity in the African region was realized through grants or soft loans from foreign development institutions or countries. Very few sites have been developed through internal resources of the related countries.
High competition for investment capital worldwide. References 1. Central Intelligence Agency (2012). The World Factbook. Available from www.cia.gov/library/publications/the-world-factbook/fields/2119.html. 2. Tanzania, Vice President’s Office: Division of Environment (2007). United Republic of Tanzania National Adaptation Programme of Action. Dodoma. 3. Trading economics (2012). Electricity data from 2009. Available from www.tradingeconomics.com/tanzania/electricity-production-kwh-wb-data.html. Accessed December 2012. 4. Tanzania, Rural Energy Agency (n.d.). Annual Report 2009/2010. 5. Tanzania, Electricity Supply Company (2007). Power System Master Plan 2007-2031. 6. Michael, E.G. (2008). Institutional Design and Practices for Sustainable Decentralised Energy Systems Development for Rural Electrification, the Case of Isolated Mini-Hydro Power Systems. Njombe Diocese, Tanzania. 7. National Environmental Management Council (2005). 8. Gwang’ombe, Florence and Kato Kabaka (2007). Challenges in Small Hydropower Development in Tanzania, Rural Electrification Perspective. Presentation at International Conference on Small Hydropower. Sri Lanka. 22-24 October.
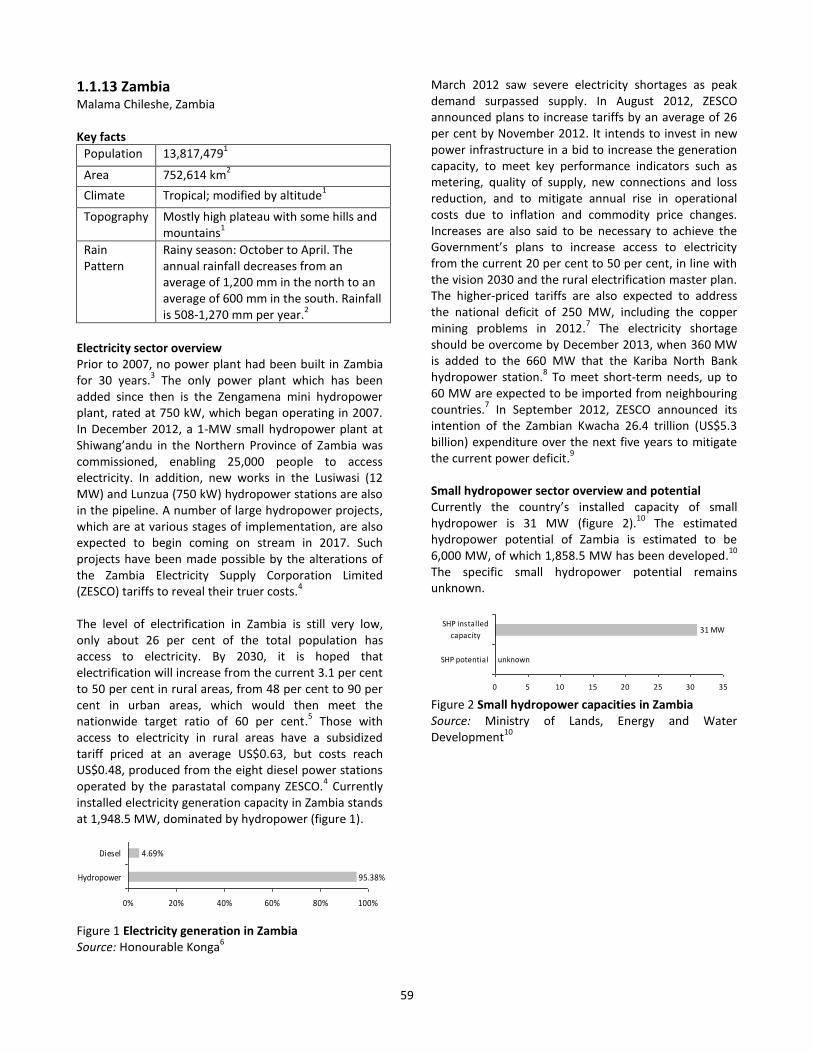
59
1.1.13 Zambia Malama Chileshe, Zambia Key facts
Population 13,817,4791
Area 752,614 km2
Climate Tropical; modified by altitude1
Topography Mostly high plateau with some hills and mountains
1
Rain Pattern
Rainy season: October to April. The annual rainfall decreases from an average of 1,200 mm in the north to an average of 600 mm in the south. Rainfall is 508-1,270 mm per year.
2
Electricity sector overview Prior to 2007, no power plant had been built in Zambia for 30 years.
3 The only power plant which has been
added since then is the Zengamena mini hydropower plant, rated at 750 kW, which began operating in 2007. In December 2012, a 1-MW small hydropower plant at Shiwang’andu in the Northern Province of Zambia was commissioned, enabling 25,000 people to access electricity. In addition, new works in the Lusiwasi (12 MW) and Lunzua (750 kW) hydropower stations are also in the pipeline. A number of large hydropower projects, which are at various stages of implementation, are also expected to begin coming on stream in 2017. Such projects have been made possible by the alterations of the Zambia Electricity Supply Corporation Limited (ZESCO) tariffs to reveal their truer costs.
4
The level of electrification in Zambia is still very low, only about 26 per cent of the total population has access to electricity. By 2030, it is hoped that electrification will increase from the current 3.1 per cent to 50 per cent in rural areas, from 48 per cent to 90 per cent in urban areas, which would then meet the nationwide target ratio of 60 per cent.
5 Those with
access to electricity in rural areas have a subsidized tariff priced at an average US$0.63, but costs reach US$0.48, produced from the eight diesel power stations operated by the parastatal company ZESCO.
4 Currently
installed electricity generation capacity in Zambia stands at 1,948.5 MW, dominated by hydropower (figure 1).
Figure 1 Electricity generation in Zambia Source: Honourable Konga
6
March 2012 saw severe electricity shortages as peak demand surpassed supply. In August 2012, ZESCO announced plans to increase tariffs by an average of 26 per cent by November 2012. It intends to invest in new power infrastructure in a bid to increase the generation capacity, to meet key performance indicators such as metering, quality of supply, new connections and loss reduction, and to mitigate annual rise in operational costs due to inflation and commodity price changes. Increases are also said to be necessary to achieve the Government’s plans to increase access to electricity from the current 20 per cent to 50 per cent, in line with the vision 2030 and the rural electrification master plan. The higher-priced tariffs are also expected to address the national deficit of 250 MW, including the copper mining problems in 2012.
7 The electricity shortage
should be overcome by December 2013, when 360 MW is added to the 660 MW that the Kariba North Bank hydropower station.
8 To meet short-term needs, up to
60 MW are expected to be imported from neighbouring countries.
7 In September 2012, ZESCO announced its
intention of the Zambian Kwacha 26.4 trillion (US$5.3 billion) expenditure over the next five years to mitigate the current power deficit.
9
Small hydropower sector overview and potential Currently the country’s installed capacity of small hydropower is 31 MW (figure 2).
10 The estimated
hydropower potential of Zambia is estimated to be 6,000 MW, of which 1,858.5 MW has been developed.
10
The specific small hydropower potential remains unknown.
Figure 2 Small hydropower capacities in Zambia Source: Ministry of Lands, Energy and Water Development
10
95.38%
4.69%
0% 20% 40% 60% 80% 100%
Hydropower
Diesel
31 MW
unknown
0 5 10 15 20 25 30 35
SHP potential
SHP installed
capacity

60
Figure 3 Shiwangandu hydropower station in Zambia Source: Chileshe
11
The Zengamena power station is a privately-owned project with a capacity of 0.75 MW. As of 2010, the company had about 250 customers. There are plans to extend the capacity by another 0.750 MW. Being an off-grid power plant, the challenges faced by the company include complaints from customers for charging a higher tariff than those by the state utility ZESCO.
6
Figure 4 Zengamena hydropower station in Zambia Source: Chileshe
12
The Zambian Rural Electrification Authority has carried out studies and designs for the following sites, with potentials ranging up to 3 MW: Chilinga (Nyimba District), Mumbotuta (Milenge District), Chikata (Kabompo District, Mujila (Mwinilunga District and Chavuma (Chavuma District). The development of these sites is key in the electrification of remote areas where grid extension is prohibitively expensive. Some private companies have also expressed to the Government interest to develop other sites in various parts of the country. However, these expressions of interest have not yet resulted in any developments.
Renewable energy policy Under the Sixth National Development Report (2011-2015) the strategies employed to increase the prevalence of renewable energy are as follows:
13
To promote the development and use of solar technology systems;
To introduce an appropriate cost-effective renewable energy feed-in tariff;
To promote the production of electricity from geothermal energy;
To promote the use of biogas for cooking, lighting and electricity generation.
Legislation on small hydropower The Government of Zambia has put in place a National Energy Policy of 2008 that encompasses a range of energy options, including hydropower. Among the policy measures relevant to small hydropower development adopted in the National Energy Policy are the following:
Encourage the development of identified potential hydro sites;
Move towards cost reflective tariffs;
Adopting an open access transmission regime;
Application of smart subsidy mechanisms.10
The Government, with its appropriate institutions, is already working towards achieving some of the policy measures. Since the Energy Policy was adopted, it has supported the increment of electricity tariffs towards economic levels to encourage investment in the sector. The Government has also been working on adopting an open-access to the transmission network which is principally owned by ZESCO and Copperbelt Energy Corporation. As a first step towards this objective, a Grid Code, which is a technical document providing guidelines on how electricity industry players should interact, has been finalized and is awaiting adoption. In addition, the Government through the Energy Regulation Board has also authorized higher tariffs for Zengamena mini-hydro than those for the state utility ZESCO, given that the former is connected to an isolated mini-grid. However, the implementation of the policy measure on smart subsidies has not taken off due to the lack of financial resources. The Rural Electrification Authority did however make a small contribution towards the construction of Zengamena mini-hydropower station. Barriers to small hydropower development The development of small hydropower plants has been hampered by some of the following challenges:
Low Electricity Tariffs: For a long time, electricity tariffs in Zambia were low due to heavy subsidies. The Government has decided to promote a gradual migration towards cost-reflective tariffs. However,
61
the challenge remains as to whether or not some of the communities where off-grid projects are developed can afford to pay the cost-reflective tariff.
Accessibility: A number of potential small hydro-power sites are located in areas where the road network is bad.
Lack of connectivity to the national grid: Most of the sites are located far from the national grid. This poses a challenge as the generated electricity must be consumed by the surrounding communities, who may not have the capacity to absorb all the power.
References 1. Central Intelligence Agency (2012). The World Factbook. Available from www.cia.gov/library/publications/the-world-factbook/. 2. Aregheore, Eroarome Martin (2009). Country Pasture/Forage Resource Profiles – Zambia. Samoa. Available from www.fao.org/ag/AGP/AGPC/doc/Counprof/PDF%20files/Zambia.pdf. 3. Energy Regulation Board (2006). Zambia Nation-Wide Power Blackout of June 4, 2006-Report. Lusaka. Available from www.erb.org.zm/viewpage.php?page=ndtls&nid=25. 4. Zambia Electricity Supply Corporation Limited (2012). Revision of Electricity Tariffs. Available from www.zesco.co.zm/CAAndBD/PressStatement/2012/August/Tarrifs10082012.pdf. Accessed December 2012. 5. Zambia, Ministry of Lands, Energy and Water Development (2010). Power Systems Development Master Plan. Lusaka. 6. Konga, Honorable Kenneth, former Minister of Energy and Water Development (2011). Investment in Mining and Energy. Presentation at the Zambia International Mining and Energy Conference. Lusaka, July. 7. Mfula, Chris (2012). Zambia plans talks with miners to cut power usage, 17 March. Available from af.reuters.com/article/investingNews/idAFJOE82G03920120317?sp=true. 8. Chitundu, Cyprien and Kalonde Nyati (2012). Zesco to spend K3.6 trillion on assets. Zambia Daily Mail, 6 September. 9. Nyati, K. (2012). Zesco to spend K3.6 trillion on assets, infrastructure. Zambia Daily Mail, 6 September2012. Available from www.daily-mail.co.zm/?p=13264 Accessed December 2012. 10. Zambia, Ministry of Lands, Energy and Water Development (2008). National Energy Policy. Lusaka. 13. United Nations Development Programme Zambia and Government of the Republic of Zambia (2011). Country Programme Action Plan (CPAP) 2011–2015. Available from www.undp.org/content/dam/zambia/docs/legalframew
ork/Zambia_UNDP%20Country%20Programme%20Action%20Plan%202011-2015.pdf.

62
1.1.14 Zimbabwe Wim Jonker Klunne, Council for Scientific and Industrial Research, South Africa Key facts
Population 12,619,6001
Area 390,759 km2
Climate Tropical; moderated by altitude1
Topography Mostly high plateau with higher central
plateau (high savannah); mountains in
east2
Rain Pattern
Rainy season: November to March.1
Rainfall decreases from east to west. The eastern mountains receive more than 1,000 mm annually, while Harare has 810 mm and Bulawayo 610 mm. The south and southwest receive little rainfall.
3
Electricity sector overview
Figure 1 Electricity generation in Zimbabwe Source: Tradingeconomics
4, Clean Energy Portal –
Reegle1
Note: Data from 2009. In rural Zimbabwe, 80-90 per cent of people are heavily dependent on wood fuel. Rural populations light their homes with kerosene and carry out essential food processing tasks such as milling grain, using diesel-powered systems. Access to electricity is estimated nationally at nearly 40 per cent, but access to electricity in the rural areas of the country is about 19 per cent, due to very high costs of extending the national electricity grids. Electricity consumption was 998 kWh per capita in 2006.
1
In accordance to the government policy to embark on reforms of the electricity sector, a new Electricity Act was enacted in 2002, bringing about the restructuring and unbundling of the Zimbabwe Electricity Supply Authority (ZESA) from a vertically integrated utility into separate successor companies focusing on generation, transmission and distribution, and service companies. The new Act also provided for the setting up of an autonomous regulatory body that would encourage new investment in the electricity sector through appropriate
regulatory, fiscal and environmental frameworks, harmonized with those of the South African Development Countries (SADC) and through strategic partnerships. In 2005, the Zimbabwe Electricity Regulatory Commission was established in accordance with section 5 of the Electricity Act. However, in line with regional trends in the regulation of the energy sector a policy for the establishment of an all-encompassing energy sector regulator that seeks to harmonize regulation in the energy sector is being adopted. In this regard, the Ministry was in the process in 2012 of enacting the Energy Amendment Bill which seeks to synchronize the Petroleum Act, the Electricity Act and other renewable energy Acts that will provide for, among other things, the setting up of an energy regulator to harmonize regulation in the energy sector as a whole.
5
Small hydropower sector overview and potential The total hydropower potential on Zambezi River for Zimbabwe and Zambia is 7,200 MW. There is a potential to generate 120 MW from small and mini-hydropower resources (20 MW from existing dams, 60 MW from proposed dams and 43 MW from run-of-river sites).
6
Figure 2 Small hydropower capacities in Zimbabwe Source: Mbohwa
7, Shakya
8
The total installed small hydropower capacity in Zimbabwe is unknown, however, there is information on a few projects (see figure 2). A plant of 750 kW at Rusito, in the Chimanimani area, is connected to the national grid and has a Power Purchase Agreement (PPA) with the national utility ZESA. Other plants are installed at Kwenda (80 kW), Sithole-Chikate (30 kW), Svinurai (10 kW), Mutsikira (10 kW), Rusitu (700 kW), Nyafaru (40 kW), Aberfoyle (30 kW) and Claremont (250 kW).
7 8
Recently the Masvingo Rural District Council has approved a US$13 million, 5-MW small hydropower project at Lake Mutirikwi. The application was made by the Great Zimbabwe Hydro-Power Company, jointly owned by a Zimbabwean company, ZOL, and its South African partner, NuPlanet. The plant is one of two currently being developed in Zimbabwe. It will be situated on the 52 year-old, 63 metre crested Mtirikwi Dam near Masvingo and will consist of one 5-MW
40.8%
31.7%
27.5%
0% 10% 20% 30% 40% 50%
Import
Hydropower
Thermal
1.92 MW
120 MW
0 50 100 150
SHP potential
SHP installed
capacity
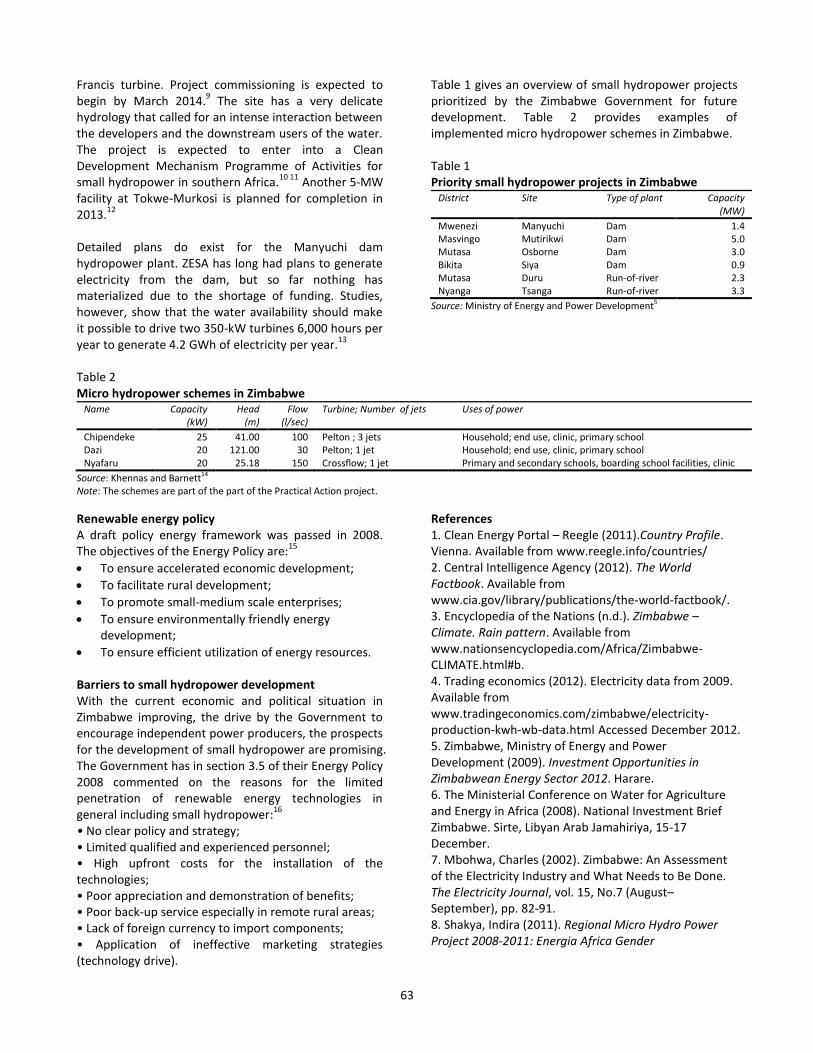
63
Francis turbine. Project commissioning is expected to begin by March 2014.
9 The site has a very delicate
hydrology that called for an intense interaction between the developers and the downstream users of the water. The project is expected to enter into a Clean Development Mechanism Programme of Activities for small hydropower in southern Africa.
10 11 Another 5-MW
facility at Tokwe-Murkosi is planned for completion in 2013.
12
Detailed plans do exist for the Manyuchi dam hydropower plant. ZESA has long had plans to generate electricity from the dam, but so far nothing has materialized due to the shortage of funding. Studies, however, show that the water availability should make it possible to drive two 350-kW turbines 6,000 hours per year to generate 4.2 GWh of electricity per year.
13
Table 1 gives an overview of small hydropower projects prioritized by the Zimbabwe Government for future development. Table 2 provides examples of implemented micro hydropower schemes in Zimbabwe. Table 1 Priority small hydropower projects in Zimbabwe
District Site Type of plant Capacity (MW)
Mwenezi Manyuchi Dam 1.4 Masvingo Mutirikwi Dam 5.0 Mutasa Osborne Dam 3.0 Bikita Siya Dam 0.9 Mutasa Duru Run-of-river 2.3 Nyanga Tsanga Run-of-river 3.3
Source: Ministry of Energy and Power Development5
Table 2 Micro hydropower schemes in Zimbabwe
Name Capacity (kW)
Head (m)
Flow (l/sec)
Turbine; Number of jets Uses of power
Chipendeke 25 41.00 100 Pelton ; 3 jets Household; end use, clinic, primary school Dazi 20 121.00 30 Pelton; 1 jet Household; end use, clinic, primary school Nyafaru 20 25.18 150 Crossflow; 1 jet Primary and secondary schools, boarding school facilities, clinic
Source: Khennas and Barnett14
Note: The schemes are part of the part of the Practical Action project.
Renewable energy policy A draft policy energy framework was passed in 2008. The objectives of the Energy Policy are:
15
To ensure accelerated economic development;
To facilitate rural development;
To promote small-medium scale enterprises;
To ensure environmentally friendly energy development;
To ensure efficient utilization of energy resources. Barriers to small hydropower development With the current economic and political situation in Zimbabwe improving, the drive by the Government to encourage independent power producers, the prospects for the development of small hydropower are promising. The Government has in section 3.5 of their Energy Policy 2008 commented on the reasons for the limited penetration of renewable energy technologies in general including small hydropower:
16
• No clear policy and strategy; • Limited qualified and experienced personnel; • High upfront costs for the installation of the technologies; • Poor appreciation and demonstration of benefits; • Poor back-up service especially in remote rural areas; • Lack of foreign currency to import components; • Application of ineffective marketing strategies (technology drive).
References 1. Clean Energy Portal – Reegle (2011).Country Profile. Vienna. Available from www.reegle.info/countries/ 2. Central Intelligence Agency (2012). The World Factbook. Available from www.cia.gov/library/publications/the-world-factbook/. 3. Encyclopedia of the Nations (n.d.). Zimbabwe – Climate. Rain pattern. Available from www.nationsencyclopedia.com/Africa/Zimbabwe-CLIMATE.html#b. 4. Trading economics (2012). Electricity data from 2009. Available from www.tradingeconomics.com/zimbabwe/electricity-production-kwh-wb-data.html Accessed December 2012. 5. Zimbabwe, Ministry of Energy and Power Development (2009). Investment Opportunities in Zimbabwean Energy Sector 2012. Harare. 6. The Ministerial Conference on Water for Agriculture and Energy in Africa (2008). National Investment Brief Zimbabwe. Sirte, Libyan Arab Jamahiriya, 15-17 December. 7. Mbohwa, Charles (2002). Zimbabwe: An Assessment of the Electricity Industry and What Needs to Be Done. The Electricity Journal, vol. 15, No.7 (August–September), pp. 82-91. 8. Shakya, Indira (2011). Regional Micro Hydro Power Project 2008-2011: Energia Africa Gender
64
Mainstreaming in Energy Projects Online Coaching. Final Report. Zimbabwe. 9. All Africa (2012). Zimbabwe: Masvingo Approves U.S. $13 Million Mini-Hydro Power Station. The Herald, 6 February. Available from
http://allafrica.com/stories/201202060143.html. 10. Svd Wat (2012). Developing small scale hydro in Southern Africa: a road map and case studies. 11. NuPlanet (2011). Project: Great Zimbabwe Hydro. 12. ESI-Africa (2012). New hydroelectric plant for Zimbabwe. 20 February. Available from www.esi-africa.com/. 13. United Nations Framework Convention on Climate Change (2000). Assessment of the E7 Group (including EDF) Proposal for a Mini-hydroelectric Power Station in Zimbabwe, 2012. 14. S Khennas, A Barnett (2000). Best practices for sustainable development of micro hydro power in developing countries. 15. Renewable Energy and Energy Efficiency Partnership (2012). Policy DB Details: Zimbabwe (2010). Vienna. Available from www.reeep.org/index.php?id=9353&special=viewitem&cid=62. 16. Government of Zimbabwe (2008). Final Draft Energy Policy March 2008.
United Nations Industrial Development Organization (UNIDO)Wagramer Straße 2, 1220 ViennaAustria
International Center on Small Hydro Power (ICSHP)136 Nanshan Road, 310002 Hangzhou, Zhejiang Province, China
www.smallhydroworld.org