Embed Size (px)
Citation preview
World Small HydropoWer development report 2013
www.smallhydroworld.org
NORTHERN AMERICA
Published in 2013 by United Nations Industrial Development Organization (UNIDO) and International Center on Small Hydro Power (ICSHP).
2013 © UNIDO and ICSHP
All rights reserved
This report was jointly produced by United Nations Industrial Development Organization (UNIDO) and International Center on Small Hydro Power (ICSHP) to provide information about small hydropower. The document has been produced without formal United Nations editing. The designations employed and the presentations of the material in this document do not imply the expression of any opinion whatsoever on the part of the Secretariat of UNIDO and ICSHP concerning the legal status of any country, territory, city or area or of its authorities, or concerning the delimitation of its frontiers or boundaries, or its economic system or degree of development. Designations such as “developed”, “industrialized” and “developing” are intended for statistical convenience and do not necessarily express a judgement about the stage reached by a particular country or area in the development process: Mention of firm names or commercial products does not constitute an endorsement by UNIDO or its partners. The opinions, statistical data and estimates contained in the articles are the responsibility of the author(s) and should not necessarily be considered as reflecting the views or bearing the endorsement of UNIDO and its partners.
While every care has been taken to ensure that the content is useful and accurate, UNIDO and ICSHP and any contributing third parties shall have no legal liability or responsibility for the content or the accuracy of the information so provided, or for any loss or damage caused arising directly or indirectly in connection with reliance on the use of such information.
Copyright: Material in this publication may be freely quoted or reprinted, but acknowledgement is requested, together with a copy of the publication containing the quotation or reprint.
Recommended citation: Liu, H., Masera, D. and Esser, L., eds. (2013). World Small Hydropower Development Report 2013. United Nations Industrial Development Organization; International Center on Small Hydro Power. Available from www.smallhydroworld.org.
Disclaimer
206
2 Americas 2.4 Northern America Lara Esser, International Center on Small Hydro Power Introduction to the region North America comprises five countries and territories: Bermuda, Canada, Greenland, Saint Pierre and Miquelon and the United States of America (USA). Canada, Greenland and the USA contain exceptionally large areas with varying climate. Greenland has an exceedingly large ice-covered area (1,755,637 km
2),
whereas the Canadian territory has mild temperate to subarctic and arctic areas. The climate in the USA is mostly temperate. A tropical climate is present in Hawaii and Florida, arctic in Alaska, semi-arid in the Great Plains west of the Mississippi River, and arid in the Great Basin in the southwest. The USA and Canada
trade electricity between each other. Canadian provinces export, on average, 40 TWh of electricity to the northern states of USA every year. Most of that electricity is hydropower. The current power strategy of these northern states i.e. New England, New York, Midwestern states and Pacific Northwest is to purchase electricity rather than to build new plants. Canada also benefits from this inter-State energy trade, since north-south trade distances between provinces and states are shorter than if electricity was to be transmitted from east to west and vice versa within Canada. During periods of peak demand, Canada also imports electricity from the USA.
1
Table 1 Overview of countries in Northern America
Country Total population
(million)
Rural population
(%)
Electrification access
(%)
Electrical capacity
(MW)
Electricity generation
(GWh/year)
Hydropower capacity
(MW)
Hydropower generation
(GWh/year)
Canadabcd 33.70 19 100 130 543 588 016 75 077 348 100 Greenlandad 0.05 16 -- 140 468 69 281 USAde 311.50 18 100 1 040 000 4 120 000 78 200 257 000
Total 345.25 - - 1 170 683 4 708 484 153 346 605 381
Sources: a. Greenland Development Inc.2 b. Natural Resources Canada3 c. Statistics Canada4 d. International Journal on Hydropower and Dams5 e. U.S. Energy Information Administration6 Notes: Greenland has no main grid.
Small hydropower definition In Canada, units of a capacity that are up to 30 MW are considered small hydropower plants; in the USA the threshold of small hydropower is 50 MW. Greenland does not have a definition yet (table 2).
Table 2 Classification of small hydropower in Northern America (Megawatts)
Country Small hydropower
Canada up to 50 Greenland .. United States up to 30
Regional overview Canada, the USA and Greenland all use small hydropower, though Greenland has only recently started using hydropower (1993). In 2012, the country has only one small hydropower plant at Tasiilaq (with an installed capacity of 1.2 MW).
2
The US Department of Energy (DOE) has two programmes that support hydropower which include small hydropower. The Wind and Water Power
Program by the DOE focuses on increasing generating capacity and efficiency at existing hydropower facilities as well as adding hydropower generating capacity to existing non-powered dams.
i The
programme also focuses on adding new low-impact hydropower, increasing advanced pumped-storage hydropower capacity and reducing potential environmental impacts of conventional hydropower production.
7 The Wind and Water Program funds the
Electric Power Research Institute (EPRI) to develop market-ready and fish-friendly hydropower turbines.
7
The DOE also supports the National Hydropower Asset Assessment Program (NHAAP), which is an integrated water-infrastructure information platform for sustainable hydroelectricity generation and management. The NHAAP includes a cross-referenced geospatial database that can be maintained, updated and integrated with other generation resource assessments on a regular basis to support water-energy research and policy planning. The database can be used to study regional patterns in generation variability, their causes, plus opportunities for upgrading hydropower facilities to stabilize and increase generation in the United States.
8 9
207
Information on the total installed capacity for small hydropower plants of up to 10 MW is not available for the United States (table 3). The Federal Government of Canada has been supporting its small-scale hydro technologies through Natural Resources Canada (NRCan). In 2010, there were about 3,400 MW of small hydropower plants (up to 50 MW), including of 1,049 MW of plants with up to 10 MW. Table 3 Small hydropower in Northern America (Megawatts)
Country Potential capacity
Installed capacity
Canada (up to 10 MW) .. 1 049.0
Canada (up to 50 MW) 15 000 3 400.0 Greenland (up to 10 MW) at least 8.7 8.7 USA (up to 10 MW) estimate 8 041 6785.0
Total (up to 10 MW) 9 098.7 7 842.7
Sources: Natural Resources Canada3, Greenland Development Inc2, International Journal on Hydropower and Dams5, adapted from National Hydropower Asset Assessment Program8 Note: Canada’s small hydropower potential is gross and does not include potential gained from refurbishment.
There is a large untapped small hydropower potential in the region, particularly in Canada and the USA. Information on small hydropower potential, especially up to 10 MW, was not officially available for the USA as different hydropower classifications were used. The total small hydropower potential in Canada is estimated at 15,000 MW (for plants up to 50 MW); however, under the current available technologies and socio-economic conditions, only about 15 per cent is likely to be developed. The installed small hydropower capacity is expected to double from 3,400 to 7,700 MW by the year 2050. Furthermore, there is additional room for refurbishment of small and medium hydropower plants, which could add additional 1,000 MW. Growth areas can be found in areas around existing water-control dams across the country and in the North, where off-grid locations and First Nation communities depend on expensive diesel based electricity generation.
ii
In Greenland, the potential for small hydropower is unknown. There is no main grid due to the large distances and many small and dispersed settlements. Small hydropower would be an adequate technology for isolated operations in Greenland, in conjunction with other energy sources.
5 However, more
micro-scale hydropower plants are expected to be commissioned in the future. As most of the larger, more traditional hydropower resources have already been developed in the USA, a clean energy rationale for development of small and low-head hydropower resources exist.
10 A recent study
identified a 15,140 MW potential capacity in the range
of 1-50 MW in the Northwest region of the USA alone, i.e. Idaho, Oregon and Washington state. However, research on small hydropower potential on existing water infrastructure has identified 397 non-powered dams, each of which has a potential capacity between 1 and 10 MW, with a total of 1,306 MW.
8 Another
resource assessment identified 65 sites with a total potential capacity of about 170 MW among existing non-powered dams that are owned by the U.S. Bureau of Reclamation.
11 These assessments probably overlap
in parts. Notes i. Non-powered dams are dams that do not produce electricity. ii. First Nation is a term that came into common usage in the 1970s to replace the word ‘Indian’ in Canada. Although the term First Nation is widely used, no legal definition of it exists. References 1. Stéphane Bordeleau (2011). How it works - Where Canada's surplus energy goes, CBC News, 30 March 2011. Available from www.cbc.ca/news/canada/story/2011/03/17/f-power-
2020-provincial-energy-export.html. 2. Greenland Development Inc. (2011). Hydropower in Greenland.. Available from www.aluminium.gl/en/hydropower-aluminium/hydropower-potentials-project/hydroelectric-power-potenti
als-greenland/hydropow. 3. Huang J.X. (2012). Natural Resources Canada. Survey by International Center on Small Hydro Power, November 2012. 4. Statistics Canada (2010). CANSIM Database annual data for 2010. Available from www5.statcan.gc.ca/cansim/a33?RT=TABLE&themeID=1744&spMode=tables&lang=eng. 5. International Journal on Hydropower and Dams (2011). World Atlas and Industry Guide 2011. Surrey: Aqua-Media International 6. U.S. Energy Information Administration (2012). Electricity generating capacity. Available from
www.eia.gov/electricity/capacity/. 7. U.S. Department of Energy (2011). Wind and Water Program Factsheet. Washington D.C. 8. National Hydropower Asset Assessment Program (2011). List of U.S. Hydropower Potential from Existing Non-powered Dams (greater than 1MW) of Financial Year 2011. Available from http://nhaap.ornl.gov/. 9. Oak Ridge National Laboratory (2012). An Assessment of Energy Potential at Non-Powered Dams in the United States Report. . Oak Ridge, Tennessee: U.S. Department of Energy Wind and Water Power Program 10. Campbell, J. (2010). Small Hydro and Low-Head Hydro Power Technologies and Prospects, March. Washington D.C.: Congressional Research Service,

208
United States Government. Available from http://nepinstitute.org/get/CRS_Reports/CRS_Energy/Renewable_Fuels/Small_hydro_and_Low-head_hydro
_power.pdf. 11. U.S Department of the Interior, Bureau of Reclamation, Power Resources Office. 2012. DSIRE Quantitative RPS data. Available from
www.dsireusa.org/rpsdata/index.cfm.
209
2.4.1 Canada Jinxing Huang, Canmet Energy, Natural Resources Canada; Kearon Bennett, International Energy Agency Hydropower Implementing Agreement Key facts
Population 34,300,0831
Area 10,000,000 km2 approximately – about
7.5% is water
Climate From relatively mild-temperate in south, to subarctic and arctic in north. In winter, temperatures can fall below freezing point throughout most of Canada
1
Topography Mostly plains; mountains in the west and lowlands in the southeast
1
Rain pattern Average annual rainfall is 865 mm. Western and south-eastern Canada has higher than average rainfall levels. The prairie provinces (Alberta, Saskatchewan and Manitoba) are drier, with 250-500 mm of annual precipitation.
2
Electricity sector overview Canada’s electricity mix includes hydropower, natural gas, oil, coal, nuclear power, biomass and wind power (table 1 and 2). Renewable energy sources account for 17 per cent of the country’s energy supply.
3
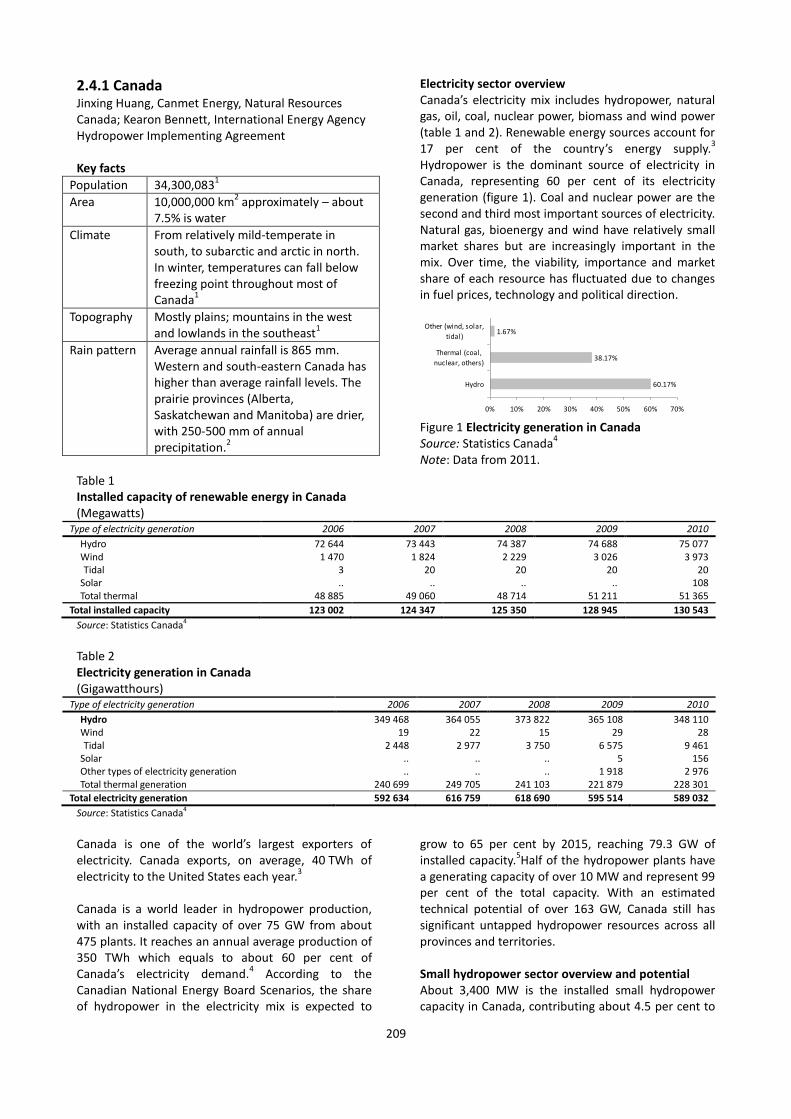
Hydropower is the dominant source of electricity in Canada, representing 60 per cent of its electricity generation (figure 1). Coal and nuclear power are the second and third most important sources of electricity. Natural gas, bioenergy and wind have relatively small market shares but are increasingly important in the mix. Over time, the viability, importance and market share of each resource has fluctuated due to changes in fuel prices, technology and political direction.
Figure 1 Electricity generation in Canada Source: Statistics Canada
4
Note: Data from 2011.
Table 1 Installed capacity of renewable energy in Canada (Megawatts)
Type of electricity generation 2006 2007 2008 2009 2010
Hydro 72 644 73 443 74 387 74 688 75 077 Wind 1 470 1 824 2 229 3 026 3 973 Tidal 3 20 20 20 20
Solar .. .. .. .. 108 Total thermal 48 885 49 060 48 714 51 211 51 365
Total installed capacity 123 002 124 347 125 350 128 945 130 543
Source: Statistics Canada4
Table 2 Electricity generation in Canada (Gigawatthours)
Type of electricity generation 2006 2007 2008 2009 2010
Hydro 349 468 364 055 373 822 365 108 348 110 Wind 19 22 15 29 28 Tidal 2 448 2 977 3 750 6 575 9 461
Solar .. .. .. 5 156 Other types of electricity generation .. .. .. 1 918 2 976 Total thermal generation 240 699 249 705 241 103 221 879 228 301
Total electricity generation 592 634 616 759 618 690 595 514 589 032
Source: Statistics Canada4
Canada is one of the world’s largest exporters of electricity. Canada exports, on average, 40 TWh of electricity to the United States each year.
3
Canada is a world leader in hydropower production, with an installed capacity of over 75 GW from about 475 plants. It reaches an annual average production of 350 TWh which equals to about 60 per cent of Canada’s electricity demand.
4 According to the
Canadian National Energy Board Scenarios, the share of hydropower in the electricity mix is expected to
grow to 65 per cent by 2015, reaching 79.3 GW of installed capacity.
5Half of the hydropower plants have
a generating capacity of over 10 MW and represent 99 per cent of the total capacity. With an estimated technical potential of over 163 GW, Canada still has significant untapped hydropower resources across all provinces and territories. Small hydropower sector overview and potential About 3,400 MW is the installed small hydropower capacity in Canada, contributing about 4.5 per cent to
60.17%
38.17%
1.67%
0% 10% 20% 30% 40% 50% 60% 70%
Hydro
Thermal (coal,
nuclear, others)
Other (wind, solar,
tidal)
210
the total Canadian installed hydropower capacity (table 3).The small hydropower sub-sector contributes with CAD$ 150 million (approx. US$145 million dollars) to the Canadian economy annually through local and overseas projects. Annual investments in new small hydropower generation capacity represent an estimated CAD$200 million (approx. US$193.33
million dollars). The typical investment costs range from CAD$3000 to CAD$5000 per installed kW, with an overall cost of energy of CAD$0.07 to CAD$0.10 per kWh. However, capital costs for low-head projects or projects in remote areas are usually much higher and can exceed CAD$6000 per kW.
6
Table 3 Installed small hydropower capacity in Canada (Megawatts) Province/ territory
AB BC MB NB NL NS NT NU ON PE QC SK YT Total
Capacity 424 568 23 43 803 469 67 .. 498 .. 345 7 127 3 372
Source: Statistics Canada7 Notes: AB – Alberta, BC - British Colombia, MB – Manitoba, NB – New Brunswick, NL – Newfoundland and Labrador, NS – Northwest Territories, NU – Nunavut, ON – Ontario, PE – Prince Edward Island, QC – Quebec, SK – Saskatchewan, YT – Yukon. Data from 2009.
Most small hydropower facilities provide decentralized power and are connected to local grids. These sites can respond quickly to demand fluctuations and are a reliable source of electricity for rural and remote communities. Small hydropower production also plays an important role in providing clean electricity to remote communities thus replacing costly and air-polluting diesel generation.
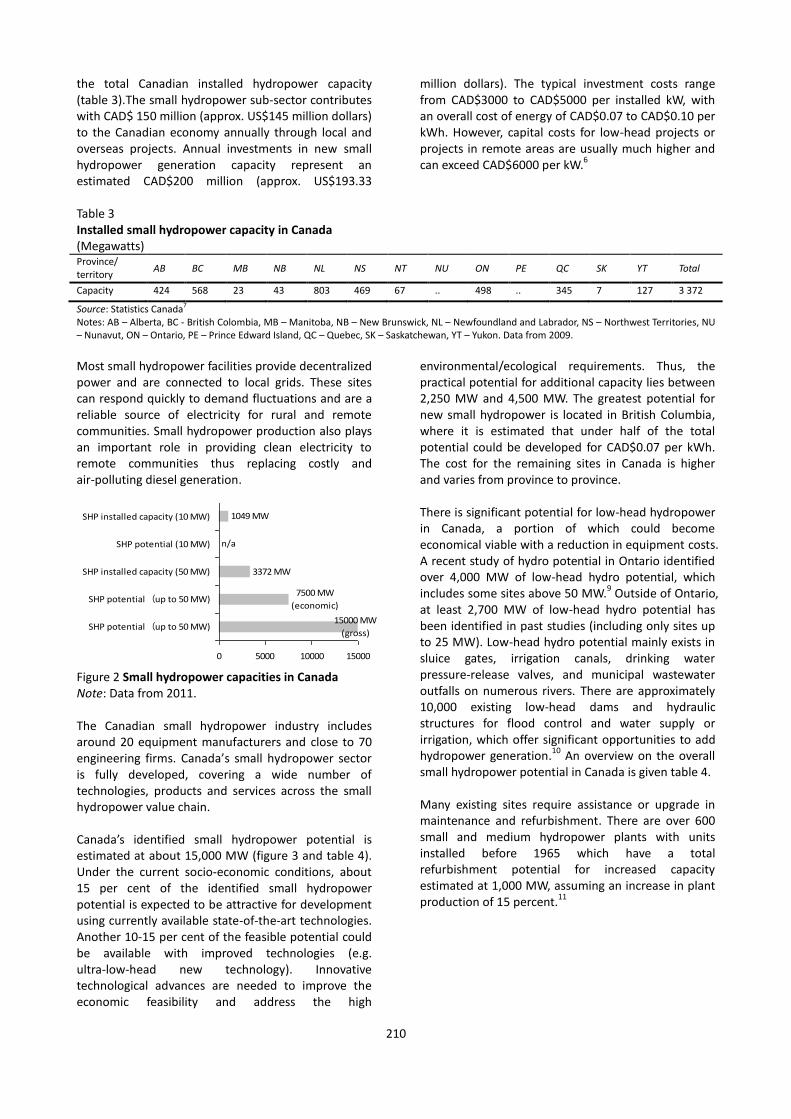
Figure 2 Small hydropower capacities in Canada Note: Data from 2011. The Canadian small hydropower industry includes around 20 equipment manufacturers and close to 70 engineering firms. Canada’s small hydropower sector is fully developed, covering a wide number of technologies, products and services across the small hydropower value chain. Canada’s identified small hydropower potential is estimated at about 15,000 MW (figure 3 and table 4). Under the current socio-economic conditions, about 15 per cent of the identified small hydropower potential is expected to be attractive for development using currently available state-of-the-art technologies. Another 10-15 per cent of the feasible potential could be available with improved technologies (e.g. ultra-low-head new technology). Innovative technological advances are needed to improve the economic feasibility and address the high
environmental/ecological requirements. Thus, the practical potential for additional capacity lies between 2,250 MW and 4,500 MW. The greatest potential for new small hydropower is located in British Columbia, where it is estimated that under half of the total potential could be developed for CAD$0.07 per kWh. The cost for the remaining sites in Canada is higher and varies from province to province. There is significant potential for low-head hydropower in Canada, a portion of which could become economical viable with a reduction in equipment costs. A recent study of hydro potential in Ontario identified over 4,000 MW of low-head hydro potential, which includes some sites above 50 MW.
9 Outside of Ontario,
at least 2,700 MW of low-head hydro potential has been identified in past studies (including only sites up to 25 MW). Low-head hydro potential mainly exists in sluice gates, irrigation canals, drinking water pressure-release valves, and municipal wastewater outfalls on numerous rivers. There are approximately 10,000 existing low-head dams and hydraulic structures for flood control and water supply or irrigation, which offer significant opportunities to add hydropower generation.
10 An overview on the overall
small hydropower potential in Canada is given table 4. Many existing sites require assistance or upgrade in maintenance and refurbishment. There are over 600 small and medium hydropower plants with units installed before 1965 which have a total refurbishment potential for increased capacity estimated at 1,000 MW, assuming an increase in plant production of 15 percent.
11
1049 MW
n/a
3372 MW
7500 MW
(economic)
15000 MW
(gross)
0 5000 10000 15000
SHP potential(up to 50 MW)
SHP potential(up to 50 MW)
SHP installed capacity (50 MW)
SHP potential (10 MW)
SHP installed capacity (10 MW)
211
Table 4 Small hydropower potential under 50 MW in Canada (Megawatts) Province/ territory
AB BC MB NB NF NS NT NU ON PE QC SK YT Total
Potential capacity
200 3 529 309 614 1 200 164 106 129 3 699 3 4 387 575 57 14 972
Source: Canadian Hydropower Association 8 Notes: AB – Alberta, BC - British Colombia, MB – Manitoba, NB – New Brunswick, NL – Newfoundland and Labrador, NS – Northwest Territories, NU – Nunavut, ON – Ontario, PE – Prince Edward Island, QC – Quebec, SK – Saskatchewan, YT – Yukon.
The estimated deployment of small hydropower in Canada by 2050 is given in table 5 according to Natural Resources Canada (NRCan), based on aggregated information from communication with various public and private utilities and companies across Canada. The installed capacity is expected to reach 7,700 MW in 2050, mostly due to developments carried out by independent power producers (IPP), provincial or municipal utilities, and remote communities. Table 5 Estimated small hydropower deployment in Canada by 2050
Year Installed capacity (<50MW)
Now 3 372
2015 4 792
2025 6 492
2050 7 742
Additional MW
2005 to 2015 180 MW/year 1 620
2015 to 2025 170 MW/year 1 700
2025 to 2050 50 MW/year 1 250
Renewable energy policy In Canada, incentives to develop clean, renewable or green power typically take one or more of the following forms: tax incentives, requests for proposal, standard offer programmes, net-metering and/or feed-in tariffs. The application and availability of these programs varies from province to province, and the schemes are subject to frequent amendments and adjustments. Federal incentives and tax measures The purchase of clean energy generation equipment, such as solar, wind and small hydro, qualifies for an accelerated capital cost allowance (Class 43.2). This allows a developer to write off 50 per cent of the cost of equipment per year (on a declining balance basis) against the tax liability. Requests for proposal A request for proposal (RFP) usually involves a specific acquisition target in terms of energy or power, a fixed term, minimum and maximum plant size restrictions
and defined commercial operation dates. The proponent is expected to bid energy according to a fixed delivery schedule and defined tariff rates which may or may not include escalation. Standard offer programmes The standard offer programmes for renewable generation involve the purchase of energy using a guaranteed minimum price over a long-term contract. The price is often modified by technology and/or the size of the generator. Unlike the RFP, the standard offer price is available to all qualified proponents and may be modified by a defined escalation rate over its term. Typically, standard or standing offer programmes are aimed at small projects of less than 10 MW. Net-metering Net-metering allows small renewable generators to send electricity excess for their own use into the grid. This significantly reduces the costs associated with wind and solar applications as there is no battery or other storage device required. Small hydro with limited reservoir capacity could also benefit from net-metering. Net-metering is available in Saskatchewan, Manitoba, Ontario, Quebec, New Brunswick, Nova Scotia and Prince Edward Island. Feed-in tariff (FIT) programmes These programmes provide guaranteed grid access and stable prices under long-term contracts (up to 40 years for hydro, for example) for electricity generated from renewable sources. Ontario's FIT Programme is North America's first comprehensive guaranteed pricing structure for renewable electricity production and is offered for projects under 50 MW. Other support The Canadian federal government through NRCan has been supporting small-scale hydro technologies. The support of NRCan by the Canadian industry to develop and commercialize advanced small and low-head hydro and water current technologies with industry by: • Engaging in demonstration and deployment; • Fostering the commercialization of new technology; • Developing infrastructure to support innovation
212
such as standards and codes; • Supporting the development of resource assessment data and tools; • Supporting federal policy and programmes. NRCan has actively cooperated with provinces, utilities, private industry, academic institutions and other organizations on key projects to reduce equipment and construction costs and increase turbine and site efficiencies as well as to support technology demonstrations at national and international level. This facilitates the realization of the additional capacities available within Canada, while at the same time helps the industry to strengthen its expertise in both products and services within Canada and abroad. Barriers to small hydropower development The above-mentioned incentives across Canada have helped to strengthen interest in small hydropower development. There has also been a positive policy shift to improve relations with First Nations
i and to
include them as active hydropower project partners. However, developers encounter long lead times required for approvals. Also, projects can be arbitrarily derailed by opposition during public participation processes. The most common concerns about small hydropower projects are the impact of civil works construction on stream flow, aesthetics and prevention of fish movement towards their natural habitat. In recent years, provincial governments have begun to address some of these issues and barriers using a more streamlined and sustainable watershed management approach. The federal government has recently joined this approach. Note i. First Nation is a term that came into common usage in the 1970s to replace the word ‘Indian’ in Canada. Although the term First Nation is widely used, no legal definition of it exists.
References 1. Central Intelligence Agency (2012). The World Factbook. Available from www.cia.gov/library/publications/the-world-factbook. 2. Climatemps 2012 (2012). Canada. Available from www.canada.climatemps.com/. Accessed November 2012. 3. Canadian Hydropower Association (2006). Hydropower and Dams World Atlas Submission 2006. Ottawa: Canadian Hydropower Association. 4. Canada, Statistics Canada. CANSIM Database. Ottawa: Statistics Canada. Available from www5.statcan.gc.ca/cansim/a33?RT=TABLE&themeID=1744&spMode=tables&lang=eng. Accessed December 2012. 5. Canada, National Energy Board (2007). Canada's Energy Future – Reference case and Scenarios to 2030.
Ottawa: National Energy Board. Available from www.neb-one.gc.ca/clf-nsi/rnrgynfmtn/nrgyrprt/nrgyftr/2007/nrgyftr2007-eng.pdf. 6. Canada, Natural Resources Canada (2008). Low Head Hydro Market Assessment Volume 1 - Main Report, March. Ontario: Hydraulic Energy Group. Available from http://canmetenergy.nrcan.gc.ca/sites/canmetenergy.nrcan.gc.ca/files/files/pubs/LowHeadMarketAssessRptVol5E1MainReport.pdf 7. Canada, Statistics Canada catalogue 57-206-XIB. Ottawa, Canada: Statistics Canada. Available from http://publications.gc.ca/Collection/Statcan/index-e.html. 8. Canadian Hydropower Association (2006). Study of Hydropower Potential in Canada. Ottawa: EEM Inc. 9. Hatch Acres (2005). Evaluation and Assessment of Ontario’s Waterpower Potential. Oakville, Canada: Hatch Acres 10. Tung, Tony T.P., J. Huang, C. Handler, and G. Ranjitkar (2007). Better Turbines for Small Hydro, Hydro Review, March. 11. Canada, Statistics Canada (2004). Electric Power Generating Stations, Catalogue 57-202-XIB. Ottawa: Statistics Canada. Available from http://publications.gc.ca/Collection/Statcan/index-e.html.
213
2.4.2 United States of America Lara Esser, International Center on Small Hydro Power Key facts
Population 313,847,4651
Area 9,826,675 km²
Climate Mostly temperate, but tropical in Hawaii and Florida, arctic in Alaska, semi-arid in the great plains west of the Mississippi River, and arid in the Great Basin of the southwest; low winter temperatures in the northwest
1
Topography Vast central plain, mountains in west, hills and low mountains in east. Rugged mountains and broad river valleys in Alaska. Rugged, volcanic topography in Hawaii (Highest point: Mount McKinley, 6,194 m)
1
Rain pattern Variable, depending on location and elevation
Electricity sector overview In 2011, the installed power generating capacity in the United States of America (USA) was 1,138 GW, and its net electricity generation surpassed 4,100 TWh.
2
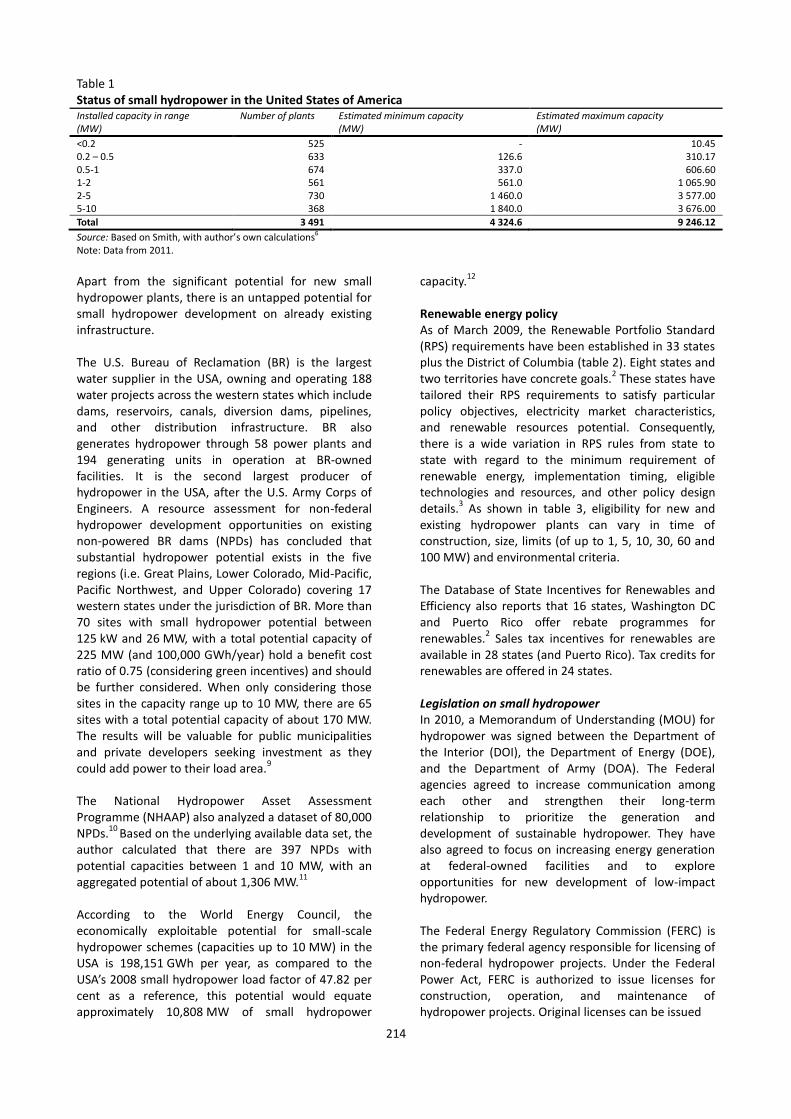
Fossil fuels and nuclear power account for 87 per cent of electricity generation in the USA (figure 1). According to the International Energy Agency (IEA), in 2009 the USA was the world’s largest producer of nuclear power (830 TWh), and of electricity from natural gas (950 TWh).
3 It was also the world’s second
largest electricity producer from coal (1,893 TWh), and it accounts for the second largest hydropower capacity at 100 GW.
2
Figure 1 Electricity generation in United States Source: DSIRE
2
Note: Data from 2011. An interim assessment of technically feasible hydropower potential by the U.S. Department of Energy (DOE) identified 372 GW undeveloped hydropower resources, divided between upgrades, retrofits, new projects, and pumped storage. The DOE Water Power Programme has set a goal of increasing U.S. hydropower capacity by 100 GW before 2050.
5
Small hydropower sector overview and potential
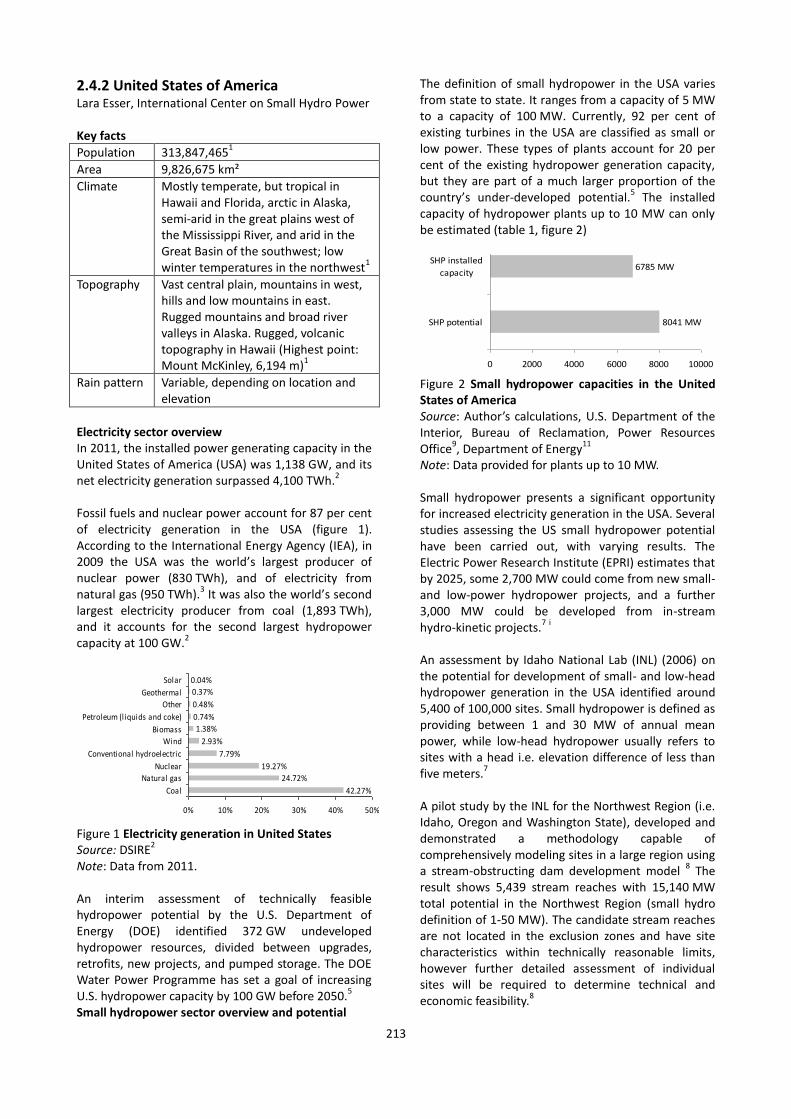
The definition of small hydropower in the USA varies from state to state. It ranges from a capacity of 5 MW to a capacity of 100 MW. Currently, 92 per cent of existing turbines in the USA are classified as small or low power. These types of plants account for 20 per cent of the existing hydropower generation capacity, but they are part of a much larger proportion of the country’s under-developed potential.
5 The installed
capacity of hydropower plants up to 10 MW can only be estimated (table 1, figure 2)
Figure 2 Small hydropower capacities in the United States of America Source: Author’s calculations, U.S. Department of the Interior, Bureau of Reclamation, Power Resources Office
9, Department of Energy
11
Note: Data provided for plants up to 10 MW. Small hydropower presents a significant opportunity for increased electricity generation in the USA. Several studies assessing the US small hydropower potential have been carried out, with varying results. The Electric Power Research Institute (EPRI) estimates that by 2025, some 2,700 MW could come from new small- and low-power hydropower projects, and a further 3,000 MW could be developed from in-stream hydro-kinetic projects.
7 i
An assessment by Idaho National Lab (INL) (2006) on the potential for development of small- and low-head hydropower generation in the USA identified around 5,400 of 100,000 sites. Small hydropower is defined as providing between 1 and 30 MW of annual mean power, while low-head hydropower usually refers to sites with a head i.e. elevation difference of less than five meters.
7
A pilot study by the INL for the Northwest Region (i.e. Idaho, Oregon and Washington State), developed and demonstrated a methodology capable of comprehensively modeling sites in a large region using a stream-obstructing dam development model
8 The
result shows 5,439 stream reaches with 15,140 MW total potential in the Northwest Region (small hydro definition of 1-50 MW). The candidate stream reaches are not located in the exclusion zones and have site characteristics within technically reasonable limits, however further detailed assessment of individual sites will be required to determine technical and economic feasibility.
8
19.27%
7.79%
2.93%
1.38%
0.74%
0.48%
0.37%
0.04%
42.27%
24.72%
0% 10% 20% 30% 40% 50%
Coal
Natural gas
Nuclear
Conventional hydroelectric
Wind
Biomass
Petroleum (liquids and coke)
Other
Geothermal
Solar
8041 MW
6785 MW
0 2000 4000 6000 8000 10000
SHP potential
SHP installed
capacity
214
Table 1 Status of small hydropower in the United States of America Installed capacity in range (MW)
Number of plants Estimated minimum capacity (MW)
Estimated maximum capacity (MW)
<0.2 525 - 10.45 0.2 – 0.5 633 126.6 310.17 0.5-1 674 337.0 606.60 1-2 561 561.0 1 065.90 2-5 730 1 460.0 3 577.00 5-10 368 1 840.0 3 676.00
Total 3 491 4 324.6 9 246.12
Source: Based on Smith, with author’s own calculations6
Note: Data from 2011.
Apart from the significant potential for new small hydropower plants, there is an untapped potential for small hydropower development on already existing infrastructure. The U.S. Bureau of Reclamation (BR) is the largest water supplier in the USA, owning and operating 188 water projects across the western states which include dams, reservoirs, canals, diversion dams, pipelines, and other distribution infrastructure. BR also generates hydropower through 58 power plants and 194 generating units in operation at BR-owned facilities. It is the second largest producer of hydropower in the USA, after the U.S. Army Corps of Engineers. A resource assessment for non-federal hydropower development opportunities on existing non-powered BR dams (NPDs) has concluded that substantial hydropower potential exists in the five regions (i.e. Great Plains, Lower Colorado, Mid-Pacific, Pacific Northwest, and Upper Colorado) covering 17 western states under the jurisdiction of BR. More than 70 sites with small hydropower potential between 125 kW and 26 MW, with a total potential capacity of 225 MW (and 100,000 GWh/year) hold a benefit cost ratio of 0.75 (considering green incentives) and should be further considered. When only considering those sites in the capacity range up to 10 MW, there are 65 sites with a total potential capacity of about 170 MW. The results will be valuable for public municipalities and private developers seeking investment as they could add power to their load area.
9
The National Hydropower Asset Assessment Programme (NHAAP) also analyzed a dataset of 80,000 NPDs.
10 Based on the underlying available data set, the
author calculated that there are 397 NPDs with potential capacities between 1 and 10 MW, with an aggregated potential of about 1,306 MW.
11
According to the World Energy Council, the economically exploitable potential for small-scale hydropower schemes (capacities up to 10 MW) in the USA is 198,151 GWh per year, as compared to the USA’s 2008 small hydropower load factor of 47.82 per cent as a reference, this potential would equate approximately 10,808 MW of small hydropower
capacity.12
Renewable energy policy As of March 2009, the Renewable Portfolio Standard (RPS) requirements have been established in 33 states plus the District of Columbia (table 2). Eight states and two territories have concrete goals.
2 These states have
tailored their RPS requirements to satisfy particular policy objectives, electricity market characteristics, and renewable resources potential. Consequently, there is a wide variation in RPS rules from state to state with regard to the minimum requirement of renewable energy, implementation timing, eligible technologies and resources, and other policy design details.
3 As shown in table 3, eligibility for new and
existing hydropower plants can vary in time of construction, size, limits (of up to 1, 5, 10, 30, 60 and 100 MW) and environmental criteria. The Database of State Incentives for Renewables and Efficiency also reports that 16 states, Washington DC and Puerto Rico offer rebate programmes for renewables.
2 Sales tax incentives for renewables are
available in 28 states (and Puerto Rico). Tax credits for renewables are offered in 24 states. Legislation on small hydropower In 2010, a Memorandum of Understanding (MOU) for hydropower was signed between the Department of the Interior (DOI), the Department of Energy (DOE), and the Department of Army (DOA). The Federal agencies agreed to increase communication among each other and strengthen their long-term relationship to prioritize the generation and development of sustainable hydropower. They have also agreed to focus on increasing energy generation at federal-owned facilities and to explore opportunities for new development of low-impact hydropower. The Federal Energy Regulatory Commission (FERC) is the primary federal agency responsible for licensing of non-federal hydropower projects. Under the Federal Power Act, FERC is authorized to issue licenses for construction, operation, and maintenance of hydropower projects. Original licenses can be issued
215
for a term of up to 50 years. The licensee is given the authority of eminent domain to obtain lands or other
rights needed to construct, operate, and maintain the hydropower project.
7 13
Licenses must be renewed. Table 2 Eligibility criteria for hydropower under the Renewable Portfolio Standard in the United States of America State Hydropower Renewable Portfolio Standard
Arizona New hydropower (2006 and thereafter) is limited to 10 MW or less and may not require new dams. Incremental additional production at existing facilities (pre-1997) and hydro that balances intermittent renewables is also eligible.
California In general, an eligible facility may not cause an adverse impact on instream beneficial uses or cause a change in the volume or timing of streamflow (exception for Fish Protection Act (FPA) license conditions). Eligible hydro includes:Small hydropower: Existing facilities (before 1 January 2006) of 30 MW or less under contract to a retail seller or municipal utility as of 1 January 2006 . New facilities (after 1 January 2006) of 30 MW or less, limit increased to 40 MW for a facility that is "part of a water supply or conveyance system". Conduit hydropower: Must use an existing pipe, ditch, flume, etc. Limits and existing or new distinctions are basically the same as for small hydropower above but do not contain existing contract requirements and additional details exist for conduit hydro in conjunction with a larger hydro facility. Incremental output/efficiency upgrades: Allowed without any capacity limit for facilities owned by a retail seller or municipal utility, in existence as of 1 January 2007, and improvements are made on or after 1 January 2008.
Colorado Existing (as of 1 January 2005) must be 30 MW or less. New hydro must be 10 MW or less. Connecticut Only new (1 July 2003) run-of-river hydro of 5 MW or less. Must also be low-Impact hydropower. Delaware 30 MW or less; must meet Delaware Department of Natural Resources and Environmental Control (DNREC) standards
including Low-Impact Hydro standards. Washington D.C. No pumped-storage hydropower. Hawaii Hydropower is defined as ‘falling water’ without any clarification. All hydropower would presumably be eligible. Illinois No new dams; otherwise no specific size or other restrictions. Iowa Only ‘small’ facilities, but no explicit capacity limit. No hydropower is currently included in utilities designated capacities. Kansas Existing hydropower (as of 27 May 2009); new hydropower with a nameplate capacity of 10 MW or less. Maine Must be 100 MW or less and must meet all state’s and federal’s fish passage requirements. Maryland Less than 30 MW and there is a dam in operation as of 2004, otherwise no new dams may be built. Massachusetts New power facilities must meet environmental standards and be 25 MW or less. No new dams are eligible, but new
production or incremental additions at existing dams is eligible. Pumped storage facilities are not eligible. Existing hydro facilities (12/31/1997) must meet environmental standards and be 5 MW or less. Pumped storage facilities are not eligible.
Michigan Existing traditional; new run-of-river would appear to be eligible but no new dams. No size restrictions on otherwise eligible facilities.
Minnesota Must be 100 MW or less. Montana Currently no new dams or diversions and hydropower must be 10 MW or less, except a facility up to 15 MW installed at an
existing resevoir or irrigation system that did not have hydropower generation as of 16 April 2009 is eligible. Nevada Must be 30 MW or less. For any water impoundment, the dam must have been in existence as of 1 January 2003 and the
water in a reservoir must be used exclusively for irrigation. No new impoundments or diversions are permitted. New Hampshire New renewable energy incremental production at existing facilities only; no explicit size limits but the implication would be
that no new dams or impoundments are permitted. The existing small hydropower: includes only facilities placed in service prior to 1 January 2006 and facilities having met state water quality standards applicable to hydropower projects. Facilities may either be: (1) 5 MW or less and incorporate upstream and downstream diadromous fish passages approved by the Federal Energy Regulatory Commission (FERC), or (2) 1 MW or less, connected to the distribution system in New Hampshire, and meet applicable FERC fish passage restoration requirements.
New Jersey Must be 30 MW or less; no apparent restrictions on new dams, but must meet Department of Environmental Protection (DEP) environmental standards and minimize any impacts to the environment and to the local communities. Facilities must be located in a place where retail competition is permitted.
New Mexico No detailed definition, but hydropower must be placed in service after 1 July 2007. New York The main requirements are:
- No new dams or impoundments but upgrades eligible. - Any run-of-river up to 30 MW that meets low-impact criteria is eligible.
Existing small hydropower: No apparent limitations on existing hydropower resources. However, in order to be eligible for financial support through the Maintenance Resources Program, a facility must be 5 MW or less, run-of-river type.
North Carolina Must be 10 MW or less; new or existing facilities are eligible (primary RPS). Ohio Significant environmental restrictions, but no size limits or limits on new dams or vintage. Oregon For pre-1995 facilities, eligibility includes post-1994 efficiency upgrades and low-impact hydro up to 50 MW per utility per
year for utility-owned facilities. For non-utility owned, post-1994 facilities, up to 40 MW of low-impact hydro located in Oregon that is licensed by FERC or exempt from FERC licensing requirements is eligible. For post-1994 facilities, it includes only efficiency upgrades that meet certain geographic and environmental requirements.
Pennsylvania Generally hydropower facilities must be low-impact and must meet other environmental requirements, but no apparent requirements on size or limitations have been given. Supplementing this is a separate statute listing certain other low-impact hydropower facilities that qualify as Tier I. One portion of this lists a maximum capacity of 21 MW and a pre-1984 FERC license requirement.
Rhode Island 30 MW or less; no new impoundments. Texas No restrictions. Double credit only for facilities certified after 1 September 2005. Washington Facility efficiency improvements after 31 March1999 and no new diversions or impoundments. Wisconsin All hydropower facilities of less than 60 MW are eligible.
Source: U.S. Department of Energy, Database for State Incentives for Renewables and Efficiency 2
216
There are very few hydropower projects that are not subject to FERC licensing requirements. These include projects on navigable waterways; projects on federal land; projects using surplus water or water power from a federal dam; and projects that will affect interstate commerce (being connected to a regional transmission grid).
7
Two types of license exemptions exist for small hydropower projects and water transportation conduits. First, the 5 MW Exemption is issued with an indefinite validity. The project must be located at the site of an existing dam or use a natural water feature. It must propose increased capacity. The exemptee must own all land and facilities other than federal land to be eligible.
13 Second, conduit exemption is also
issued with an indefinite validity; it must use the potential of a conduit (e.g. irrigation canal, aqueduct, water supply or effluent stream) constructed primarily for non-hydropower purpose. The exemptee must own the proposed powerhouse and the land upon which the powerhouse will be located. A conduit exemption may not use federal land.
13
The Public Utility Regulatory Policies Act (PURPA) of 1978 requires States to implement utility conservation programmes and create incentive rates for eligible small power producers and cogeneration facilities. A small power production facility is defined as a power generating plant of 80 MW or less, whose primary energy source is renewable (hydro, wind or solar), biomass, waste, or geothermal resources. A small power production facility which meets PURPA’s ownership, operating and efficiency standards is called a ‘qualifying facility’ (QF). States set the prices and mandatory purchase requirements under which utilities (under their jurisdiction) must buy from such facilities. Small hydropower facilities qualifying for QF status are eligible for such incentive rates.
14
Barriers to small hydropower development In 2009, the Small Hydro Council was established with the purpose of addressing barriers to the development of small projects with a particular focus on traditional hydro resources such as conventional hydro, development at non-powered dams, irrigation power, and conduit power. The Council coordinates activities on proposed initiatives for small hydro with the committees of the National Hydropower Association (NHA) and with the Ocean, Tidal and New Technologies Council. According to the Small Hydro Council Initial Report (2010), the investment of time and money necessary to obtain a license for a small hydropower facility has become a significant burden, which has had an impact on the speed at which potential small hydropower is
being developed.15
Coordination between regulating agencies needs to become smoother and less duplicative, and other barriers to development need to be addressed, without compromising appropriate environmental protection. Potential barriers to small hydropower development identified by NHA included the following:
5
1. Complex regulatory processes. Project permitting/licensing/exemptions by the FERC are costly and time-consuming. Regulatory costs can exceed equipment costs. 2. Lack of integration and communication among agencies leads to redundancies. The consultation process takes too long – the studies needed to build new projects may take years. 3. Lack of standards. There are many standards and guidelines either available or in development for other renewables, especially wind and solar technologies. However, small hydropower has largely been ignored or the existing regulations and guidelines are not applicable. For standards development, it was recommended that the International Electrotechnical Commission (IEC) and European organizations be examined and possibly used as a model. 4. Some regulations hinder or block development. FERC did an analysis of the costs and resources associated with licensing, and found that Section 401 Water Quality Certification (under the Clean Water Act) was a major cost driver for projects. The Integrated Licensing Process (ILP) may not be useful for developing new projects. 5. Grid connection difficulties exist. 6. Limited incentives for development. The DOE application process is too complex for small hydropower projects, and the short window to submit paperwork can present difficulties. Financial companies do not fully understand hydropower attributes and lifetimes. Installed costs are only a part of the levelized cost of energy; financing, operations and maintenance, and other factors need to be considered. For example, the soft costs of small hydro project engineering, environmental analysis and permitting are much the same as for larger projects, driving the cost per kW/capacity for small projects significantly above the cost per kW/capacity of larger projects. In addition, financial institutions charge soft costs of project analysis and approval that are about the same regardless of the size of a project. These additional costs make the financing hurdle for small hydropower more difficult to overcome.
13
Furthermore, financial incentives are neither available for adding power to existing non-powered dams involving certain low-impact situations or exemptions issued by FERC, nor available for rehabilitation of existing power projects unless the current incremental hydro criteria are met. 7. Absence of designs specific to small hydropower.
217
Industry would benefit from new designs/materials for drop-in turbines. Other research and development issues include a need for new technology that addresses the engineering and economics of small hydropower.
1
Such new technologies could minimize environmental impacts and could potentially lead to greater ease in obtaining regulatory approvals. Note i. Hydrokinetic technologies use the power of moving water, such as ocean waves or currents in canals, rivers, and tidal channels, to produce electricity. References 1. U.S. Central Intelligence Agency (2012). The World Factbook. Available from www.cia.gov/library/publications/the-world-factbook. 2. U.S. Department of Energy, Database for State Incentives for Renewables and Efficiency (2012). Quantitative Renewable Portfolio Standard data for 2012. Available from www.dsireusa.org. 3. International Energy Agency (2011). Key World Energy Statistics 2011. Paris. Available from: www.iea.org/publications/freepublications/publicatio
n/key_world_energy_stats.pdf. 4. Boden, T.A., G. Marland, and R.J. Andres (2011). Global, Regional, and National Fossil-Fuel CO2 Emissions. Carbon Dioxide Information Analysis Center, Oak Ridge National Laboratory, U.S. Department of Energy, Oak Ridge, Tennessee, U.S.A. Available from
http://cdiac.ornl.gov/trends/emis/tre_usa.html. 5. Oak Ridge National Laboratory, National Hydropower Association and Hydropower Research Foundation (2010). Summary Report of the 2010 Technology Summit Meeting on Small Hydropower. Washington D.C., USA. 6. Smith, B.T (2011). U.S. Hydropower: Fleet and Resource Assessments. Paper presented at the National Hydropower Association Annual Conference. Washington, D.C, April. 7. Campbell, J. (2010). Small Hydro and Low-Head Hydro Power Technologies and Prospects, March. Washington D.C.: Congressional Research Service, United States Government. Available from http://nepinstitute.org/get/CRS_Reports/CRS_Energy/Renewable_Fuels/Small_hydro_and_Low-head_hydro
_power.pdf. 8. Hall, D. G., Verdin, K.L. & Lee, R.D (2012). Assessment of Natural Stream Sites for Hydroelectric Dams in the Pacific Northwest Region. Prepared for the U.S. Department of Energy.. Idaho: Idaho National Laboratory. Available from www.inl.gov/technicalpublications/Documents/5394134.pdf. 9. United States Department of the Interior, Bureau of
Reclamation, Power Resources Office (2011). Hydropower Resource Assessment at Existing Reclamation Facilities. Washington D.C.: United States Department of the Interior Available from www.usbr.gov/ 10. Oak Ridge National Laboratory (2012). An Assessment of Energy Potential at Non-Powered Dams in the United States Report. Prepared for the U.S. Department of Energy Wind and Water Power Program. Oak Ridge, Tennessee, United States. Available from http://nhaap.ornl.gov/system/files/NHAAP_NPD_FY11
_Final_Report.pdf. 11. U.S Department of Energy (2011). An Assessment of Energy Potential at Non-Powered Dams in the United States. Oak Ridge: National Hydropower Asset Assessment Program (NHAAP). Available from http://nhaap.ornl.gov/content/non-powered-dam-potential 12. World Energy Council (2010). Survey of Energy Resources 2010. London: World Energy Council. Available from www.worldenergy.org/publications/3040.asp. 13. Federal Energy Regulatory Commission (n.d.). Guide to Developing Small/Low-Impact Hydropower Projects. Washington D.C.: FERC. Available from www.ferc.gov/industries/hydropower/gen-info/licensing/small-low-impact/small-hydro.pdf Accessed July 201214. Federal Energy Regulatory Commission (2012). What is a Qualifying Facility?, February. Washington D.C.: FERC. Available from www.ferc.gov/industries/electric/gen-info/qual-fac/what-is.asp. 15. National Hydropower Association (2010). Small Hydro Council Initial Report. Washington D.C. Available
from www.hydro.org.

United Nations Industrial Development Organization (UNIDO)Wagramer Straße 2, 1220 ViennaAustria
International Center on Small Hydro Power (ICSHP)136 Nanshan Road, 310002 Hangzhou, Zhejiang Province, China
www.smallhydroworld.org